
Submitted:
11 October 2023
Posted:
12 October 2023
You are already at the latest version
Abstract
Astrocytes are morphological intricate cells and actively modulate the function of the brain. Through the numerous fine processes, astrocytes contact with neurons, blood vessels and other glia cells. Emerging evidence have shown that astrocytes exhibit brain-regional diversity in the morphology, transcriptome, calcium signaling and functions. However, little is known about the brain regional heterogeneity of astrocyte-astrocyte structural interaction. So far, the visualization and characterization of the morphological features for the adjacent astrocytes with high resolution has been difficult, and as a result, it is still well accepted that astrocytes in the adult brain share non-overlapped territory. In contrast, by using an approach that combines sparse viral labeling with dual-fluorescent dyes, which allows for efficient and specific labeling of adjacent astrocytes, thus enabling a comprehensive visualization of their fine processes and the degree of their territorial overlap. Our study in the hypothalamic regions revealed a marked spatial overlap among adjacent astrocytes. Additionally, we revealed the heterogeneity of astrocyte-neuron ratio across brain regions, and conducted an assessment of the photostability and labeling efficiency of fluorescent dyes used for labeling adjacent astrocytes. Our study here provides new insights for studying the morphological heterogeneity of astrocytes across the central nervous system.
Keywords:
astrocyte-astrocyte interaction
; morphology
; territory
; iontophoresis
1. Introduction
Astrocytes are abundant type of glia in the central nervous system (CNS). Astrocytes have high complex morphology with the majority of cell volume consisted by numerous fine processes, through which astrocytes contact with neurons, blood cells and other type of glia cells. It is well acknowledged that astrocytes are actively involved in various physiological processes of the nervous system, including synapse formation and maintenance, metabolic support of neurons, and regulation of blood flow [1,2]. Undoubtedly, the diverse functions of astrocytes in the central nervous system are built upon their intricate morphological features.
The structural and functional interactions of astrocytes and neurons, especially with synapses, have been well investigated [3]. On the contrary, astrocyte-astrocyte interactions are less understood. By using fluorescent dye iontophoresis technique, Bushong et al showed that adjacent astrocytes in the hippocampus CA1 region possess independent spatial domains with minimal overlap between their branches [4]. From then on, the concept that astrocytes in the adult brain have non-overlapping territory is widely accepted [5,6,7,8,9], which is further strengthened by studies on human and drosophila brain [10,11]. However, it is noteworthy that astrocytes in the ferret visual cortex share half of their territory with other ones [12] and the processes interdigitation of adjacent astrocytes was also reported in the colliculus in a study using Brainbow transgenic mice line [13].
It is widely accepted that astrocytes exhibit brain regional heterogeneity in terms of morphology, transcriptome, and function [14,15,16,17,18,19]. However, the brain regional heterogeneity of astrocyte-astrocyte interaction is still awaited to be elucidated. It has been an urgent need for developing new methods to visualize and characterize the structural interaction between the adjacent astrocytes with high resolution and efficiency. Previously reported methods labeling astrocytes with fluorescent dyes (iontophoresis or dye filling) [4,12,20] mostly rely on identification of astrocyte cell bodies under bright field microscopy, which are time- and labor-consuming, and may be challenging in brain regions with high cell density or neural filaments. And the drawbacks of using genetically labeled astrocytes with fluorescent proteins, such as Cre-dependent MORF (mononucleotide repeat frameshift) [21], MADM (mosaic analysis with double markers) [22], include long time cycles, high costs, limited resolution, and low efficiency to label the adjacent astrocytes with different fluorescent proteins.
To this end, to explore the structural interactions between the adjacent astrocytes in broad brain regions, we developed a method that involves the iontophoresis with dual-fluorescent dyes under the guidance of fluorescent protein. This method exhibits high resolution in displaying the fine structure of astrocytes with high efficiency. More importantly, we found that the fine processes of astrocytes in VMH (ventromedial hypothalamus) invaded into the territory of the neighboring ones, forming a high degree of overlapped territory which is usually unseen in the cortex or hippocampus.
2. Materials and Methods
Ethics statement
All experiments with mice were approved by the Animal Research Committee at the West China Hospital of Sichuan University (protocol 20230220023).
Animals
Six-week-old C57BL/6 mice were purchased from Gempharmatech Co., Ltd (Nanjing, Jiangsu, China), and housed in a temperature- and humidity-controlled room with a 12-h light–dark cycle and provided with ad libitum access to water and food. Only male mice were included in the experiment. Pregnant mice were purchased from Dossy Biotechnology (Chengdu, Sichuan, China), and their newborn pups underwent surgery on the first day after birth (P0). Subsequently, the newborn mice were kept with the maternal mice until 3-4 weeks of age. All experiments involving mice in this study was approved by the Animal Research Committee at the West China Hospital of Sichuan University.
AAVs microinjections
AAV5-GfaABC1D-EBFP, AAV5-GfaABC1D-EGFP and AAV5-GfaABC1D-mCherry were purchased from Shanghai Taitool Bioscience Co., Ltd. To sparsely label astrocytes in different brain regions, newborn mice (P0) were cryo-anesthetized before injection as previously reported [23]. Viral injections were performed by using a stereotaxic apparatus (RWD, China) to guide the placement of a Hamilton syringe fixed with beveled glass pipettes (Sutter Instrument, B100-58-10) into the cortex and hypothalamus. The coordinate for cortex was 1.5 mm anterior to the posterior fontanelle, 1.2 mm lateral to the midline, and 0.6 mm below the surface of the skin; and the coordinate for hypothalamus was 1.5 mm anterior to the posterior fontanelle, 0.2 mm lateral to the midline, and -3.4 to -3.7 mm below the surface of the skin. To test the labeling efficiency of each fluorescent protein, a total of 1.0 µL of AAV5-GfaABC1D-EBFP (2.0 × 10¹² gc/mL), AAV5-GfaABC1D-mCherry (2.0 × 10¹² gc/mL), or AAV5-GfaABC1D-EGFP (2.0 × 10¹² gc/mL), was slowly injected into both sides of the hemisphere, respectively. For combined injection of EBFP and EGFP, a total of 0.5 µL of AAV5-GfaABC1D-EBFP (2.0 × 10¹¹ gc/mL) and AAV5-GfaABC1D-EGFP (2.0 × 10¹¹ gc/mL) were mixed (1:1 in volume) and injected into the cortex of one hemisphere and hypothalamus of the other hemisphere of brain. Glass pipette was left in place for at least 5 min. After injection, pups were allowed to completely recover on a warming blanket and then returned to the home cage. As for six-week-old mice, 1.0 µL of AAV5-GfaABC1D-EBFP (2.0 × 10¹² gc/mL) was injected into hippocampus CA1sr (anterior-posterior: –2.10 mm, mediolateral: ±1.45 mm, and dorsal-ventral: –1.47 mm) and 0.8 µL of virus was injected into VMH (anterior-posterior: –1.50 mm, mediolateral: ±0.50 mm, and dorsal-ventral: –5.60 mm), respectively. Throughout the surgical procedure, the mice were maintained in a stable anesthetized state with 1.2%-1.5% isoflurane and were allowed to recover on a warming blanket after the surgery.
Immunohistochemistry (IHC)
Six-week-old male mice were deeply anesthetized with isoflurane and then were perfused transcardially with cold phosphate-buffered saline (PBS), followed by 10% neutral formalin. Subsequently, the brains were carefully removed and immersed in 10% formalin at 4°C overnight. The following day, they were dehydrated in a 30% sucrose solution for 3-4 days. Coronal sections (20 mm) were collected using a cryostat microtome (Leica #cm1860) at -20°C, washed three times in PBS for 10 min, and incubated with 10% normal goat serum (containing 0.5% Triton X-100) for 1 h at 37°C. Next, brain sections were incubated with primary antibodies in 5% normal goat serum within 0.05% Triton X-100 overnight at 4°C. The following primary antibodies were used: mouse anti-NeuN (1:500, Millipore #MAB377), mouse anti-Kv2.1 (1:100, NeuroMab #75-014), rabbit anti-S100β (1:500, Proteintech #15146-1-AP). The following Alexa conjugated secondary antibodies were used: goat anti-mouse 555 (1:500, Abcam #ab150114) goat anti-mouse 488 (1:1,000, Abcam #ab150113), goat anti-rabbit 488 (1:1,000, Abcam #ab150077). After nucleus labeling with DAPI, the coverslips were mounted on slides using anti-fade solution.
Iontophoresis with fluorescent dyes and 3D reconstruction
The protocols of iontophoresis with fluorescent dyes have been described previously [4,24], with slight adjustment. Mice injected with AAV5-GfaABC1D-EBFP before were perfused transcardially with PBS (35-37°C), followed by 10% neutral formalin (35-37°C). Dissected brains were post-fixed in PBS diluted 5% neutral formalin overnight at 4°C. In the following day, 100 mm brain sections containing the target brain region were prepared by using a vibrating microtome (Leica VT 1200s). Sections were kept in PBS and visualized by using the Nikon A1R+ confocal microscope through an infrared camera (DAGE MTI IR1000) and a 40× water immersed lens. EBFP-positive astrocytes were identified, and a pair of cells with adjacent cell bodies in the same focal plane were selected. Subsequently, 1.5% Lucifer yellow dilithium salt (Lucifer yellow, Merk, #67769-47-5) and 2 mM Alexa Fluor 568 Hydrazide (Alexa 568, Invitrogen, #A10441) were separately iontoporesed [25] into the adjacent astrocytes by using a pipette (Sutter Instrument, BF100-58-10) with extremely fine tip and a self-made electrical circuit. Thereafter, selections were mounted on glass slides by using the anti-fade mounting medium (VECTOR H-1000) and stored at 4°C. High resolution images of astrocytes were obtained by using the confocal microscopy (Nikon A1R+) that equipped with a 60× oil immersed lens. The Z-step size was 0.25 μm and the Z-intensity correction function was used. Three-dimensional reconstructions were processed offline by using the Surface function of Imaris 10.0.0 (Bitplane, South Windsor, CT), as reported previously [26]. The overlapped territory was calculated automatically when the territories of Lucifer yellow- and Alexa 568-positive astrocytes were reconstructed. The percentage of overlapped territory was calculated as: VOverlap / (VLucifer + VAlexa568) × 100%, where V represented volume of astrocytic territory.
Photostability of fluorescent dyes
As for measuring the photostability of different fluorescent dyes, astrocytes in the formalin-fixed brain slices from WT mice that contained hippocampal CA1sr were selected randomly. And 1.5% Lucifer yellow, 2 mM Alexa Fluor 488 (Invitrogen, #A10436), 2 mM Alexa 568 and 5 mM Sulforhodamine 101 (SR101, Sigma-Aldrich, 60311-02-6) were iontophoresed into different cells, respectively. Thereafter, time-lapse imaging (0.1 Hz) was conducted using a confocal microscope (Nikon A1R+) with a 40× water-immersion objective lens (numerical aperture, NA 0.8) for 5 min. Finally, brain slices were mounted on the glass slide by using the anti-fade mounting medium. And the high-resolution confocal microscopy was performed by using a 60× oil immersed lens after 3 days.
Statistical analyses
Statistical analyses were conducted using GraphPad Prism (version 8.0, San Diego, CA, United States). All data are presented as the mean ± SEM. The Kolmogorov–Smirnov normality test was used to test normal distribution. Data fitting a parametric distribution were tested for significance using analysis of unpaired Student two-tailed t tests; data fitting a nonparametric distribution were tested for significance using two-tailed Mann–Whitney. Data with more than two groups were tested for significance using one-way ANOVA test followed by post-hoc Tukey’s test (parametric data) or Kruskal-Wallis test followed by Dunn’s multiple comparison test (nonparametric data). Significance was defined as P < 0.05.
3. Results
3.1. Brain regional heterogeneity of astrocyte-neuron ratio
Sparse labeling astrocytes by using iontophoresis with fluorescent dyes provides high resolution morphological details. However, this method is relatively laborious and time consuming. Previous study investigating single and adjacent astrocytic morphology using this method mainly focused on hippocampus and cortex, two brain regions are relatively large and are abundant with astrocytes. To explore the heterogeneity in astrocyte-astrocyte interactions across the cortical and the subcortical brain regions, like hypothalamus, we first evaluated the astrocyte-neuron ratio in stratum radiatus layer of hippocampal CA1 (CA1sr), somatosensory cortex, thalamus, striatum and ventromedial hypothalamus (VMH).
We quantified the total cell count in each field of view from brain slices, in which astrocytes and neurons were labeled with S100β and NeuN using IHC, respectively (Figure 1A). To note that S100β is a pan-astrocytic marker that labels most astrocytes in the cortical and subcortical regions [1,27,28,29]. We then calculated the proportion of astrocytes and neurons within each brain region. We found that in the CA1sr, astrocytes counted for 58.0% and neurons counted for 14.5% of the total cells (indicated by DAPI). Whereas in other brain regions such as the cortex, thalamus, striatum, and VMH, neurons were the predominant cell type (49.4-67.3%) and astrocytes only accounted for 11.1%-16.2% (Figure 1B). We then compared the ratio of neurons to astrocytes in each brain region, and the data showed that neuron-astrocyte ratio in CA1sr was the lowest when compared to other regions (Figure 1C). Additionally, there were variations in the total cell density among different brain regions. The cell density in the VMH was significantly higher than that in the cortex, thalamus, striatum, and CA1sr (Figure 1D). Therefore, both the overall cell density and the neuron-astrocyte ratio exhibit regional heterogeneity.
Sparse labeling of astrocytes often requires the identifying the cell bodies of astrocytes based on their small size under bright-field microscopy. To characterize the size of cell bodies in different brain regions, we used AAV5-GfaABC1D-EBFP virus to label astrocytes in the hippocampal CA1sr and VMH, and used Kv2.1 (a neuron-specific marker that is discrete and highly restricted to large clusters on the soma and proximal dendrites [30,31]) to label neuronal cell membranes. We observed that both in the CA1sr and VMH, neuronal cell bodies were significantly larger than astrocytic cell bodies (Figure 1E,F). Considering the high cell density in the hypothalamus, it may be challenging to identify astrocytes under bright-field microscopy.
3.2. Sparse labelling the adjacent astrocytes by AAVs expressing fluorescent proteins
Labeling astrocytes by over-expressing fluorescent proteins is a widely used approach, and adeno-associated virus (AAV) is a commonly used transfection tool with high efficiency even in non-proliferated cells [32,33,34,35]. The enhanced blue fluorescent protein (EBFP), enhanced green fluorescent protein (EGFP) or mCherry was expressed in the cortex of mice by using AAV5 and astrocyte-specific promoter GfaABC1D, respectively. Spares labelling was achieved by injecting of AAVs in the cortex of newborn (P0) mice, as described previously [36]. Three weeks later, the fluorescent images of virus-labeled astrocytes were obtained by using confocal microscopy (Figure 2A). EGFP and mCherry were more widely expressed than EBFP in the cortex of mice, and sparely labelled astrocytes were detected (Figure 2B). Among the three fluorescent proteins, EGFP provided the best representation of the complete cellular morphology and fine processes of astrocytes. EBFP exhibited weak fluorescence and a low signal-to-noise ratio, making it difficult to visualize the fine processes of astrocytes. On the other hand, mCherry tended to form aggregates and did not effectively display the intricate branching patterns (Figure 2B).
Subsequently, we attempted to achieve sparse labeling by co-injecting two low-concentration fluorescent viruses, EGFP and EBFP, into the cortex and hypothalamus of P0 mice with hope to label adjacent astrocytes with two different colors. After three weeks, scattered EBFP- and EGFP-positive astrocytes were observed in the cortex, hypothalamus, and subcortical regions (Figure 2C). Most cells showed simultaneous expression of EBFP and EGFP, while only a small number of astrocytes expressed only one of the two fluorescent proteins. Additionally, only a few pairs of adjacent astrocytes were detected, expressing EBFP and EGFP separately and in proximity. In a field of view measuring 6.4 × 104 µm2, only 1-2 pairs of astrocytes were successfully labeled with both colors and located close enough to each other were found (Figure 2D). The labelling efficiency failed to improve when we increased the viral tilter, volume, or changed the ordination of injections (data not shown). This indicates that the efficiency of labeling adjacent astrocytes using this method is low, especially in smaller brain regions such as the hypothalamus.
3.3. Photostability and labeling efficiency of four types of fluorescent dyes
To overcome the low efficiency of labeling the adjacent astrocytes with AAVs, we tried iontophoresis with fluorescent dyes, which also should have better resolution for morphological assessment. We started this by evaluating the photon-stability, brightness, and the degree of leakage for the mostly used fluorescent dyes. Light-fixed brain slices containing the hippocampus were iontophoresed with lucifer yellow, Alexa488, Alexa568 (hydrazide) or SR101 through a pipette with fine tip. Immediately after the iontophoresis, time-lapse imaging (10s interval and last for 5 min) were performed by using the confocal microscope that equipped with a 40× water immersed lens. Thereafter, brain slices were mounted on the glass slides by using the anti-fade mounting medium. And the high-resolution confocal microscopy was performed by using a 60× oil lens after 3 days (Figure 3A). The acute decay of fluorescent dyes was detected by analyzing the fluorescent intensity of labeled astrocytes. The fluorescence intensity of Lucifer yellow, Alexa 488, and Alexa 568 exhibited a curve-shaped decay (exponential attenuation), while SR101 showed a nearly linear decay trend (Figure 3B,C,F). Additionally, the fluorescence intensity of Alexa 488 exhibited a high degree of variability between cells, and many cells showed only 20% of the initial fluorescence intensity in certain regions of interest (ROI) after a continuous 5-minute imaging. In that Alexa488 was a photostable fluorescent dye [37,38], our data indicated that Alexa 488 was easy to leak from the labeled cells.
The ability of dyes for effective visualization of the fine processes of astrocytes is also crucial. Therefore, we captured images of the iontophoresed cells under a 60x oil immersed lens to test the fluorescence intensity of astrocytic processes at different levels after 3 days storage (Figure 3D). Using the approximate center of the astrocytic soma as the origin, we drew concentric circles with radii of 10, 20, and 30 µm. Four ROIs, that located in the first circle and edge of soma (away from the main branches), between the first and second circles, between the second and third circles or near the third circle, were selected for each astrocyte. We measured the fluorescence intensity of the branches in these four ROIs for the four fluorescent dyes (Figure 3E). Compared to Alexa 488, Lucifer yellow demonstrated better labeling efficiency within the range of 10-30 µm from the soma. As for Alexa 568 and SR101, the fluorescence intensity of Alexa 568 was significantly higher than that of cells labeled with SR101 in all ROIs. Several astrocytes labeled with SR101 even exhibited complete fluorescence quenching, making imaging highly difficult (Figure 3G). These data indicate that Lucifer yellow and Alexa568 are more suitable than Alexa488 or SR101 for labeling astrocytes.
3.4. Astrocytes showed overlapped territory in VMH
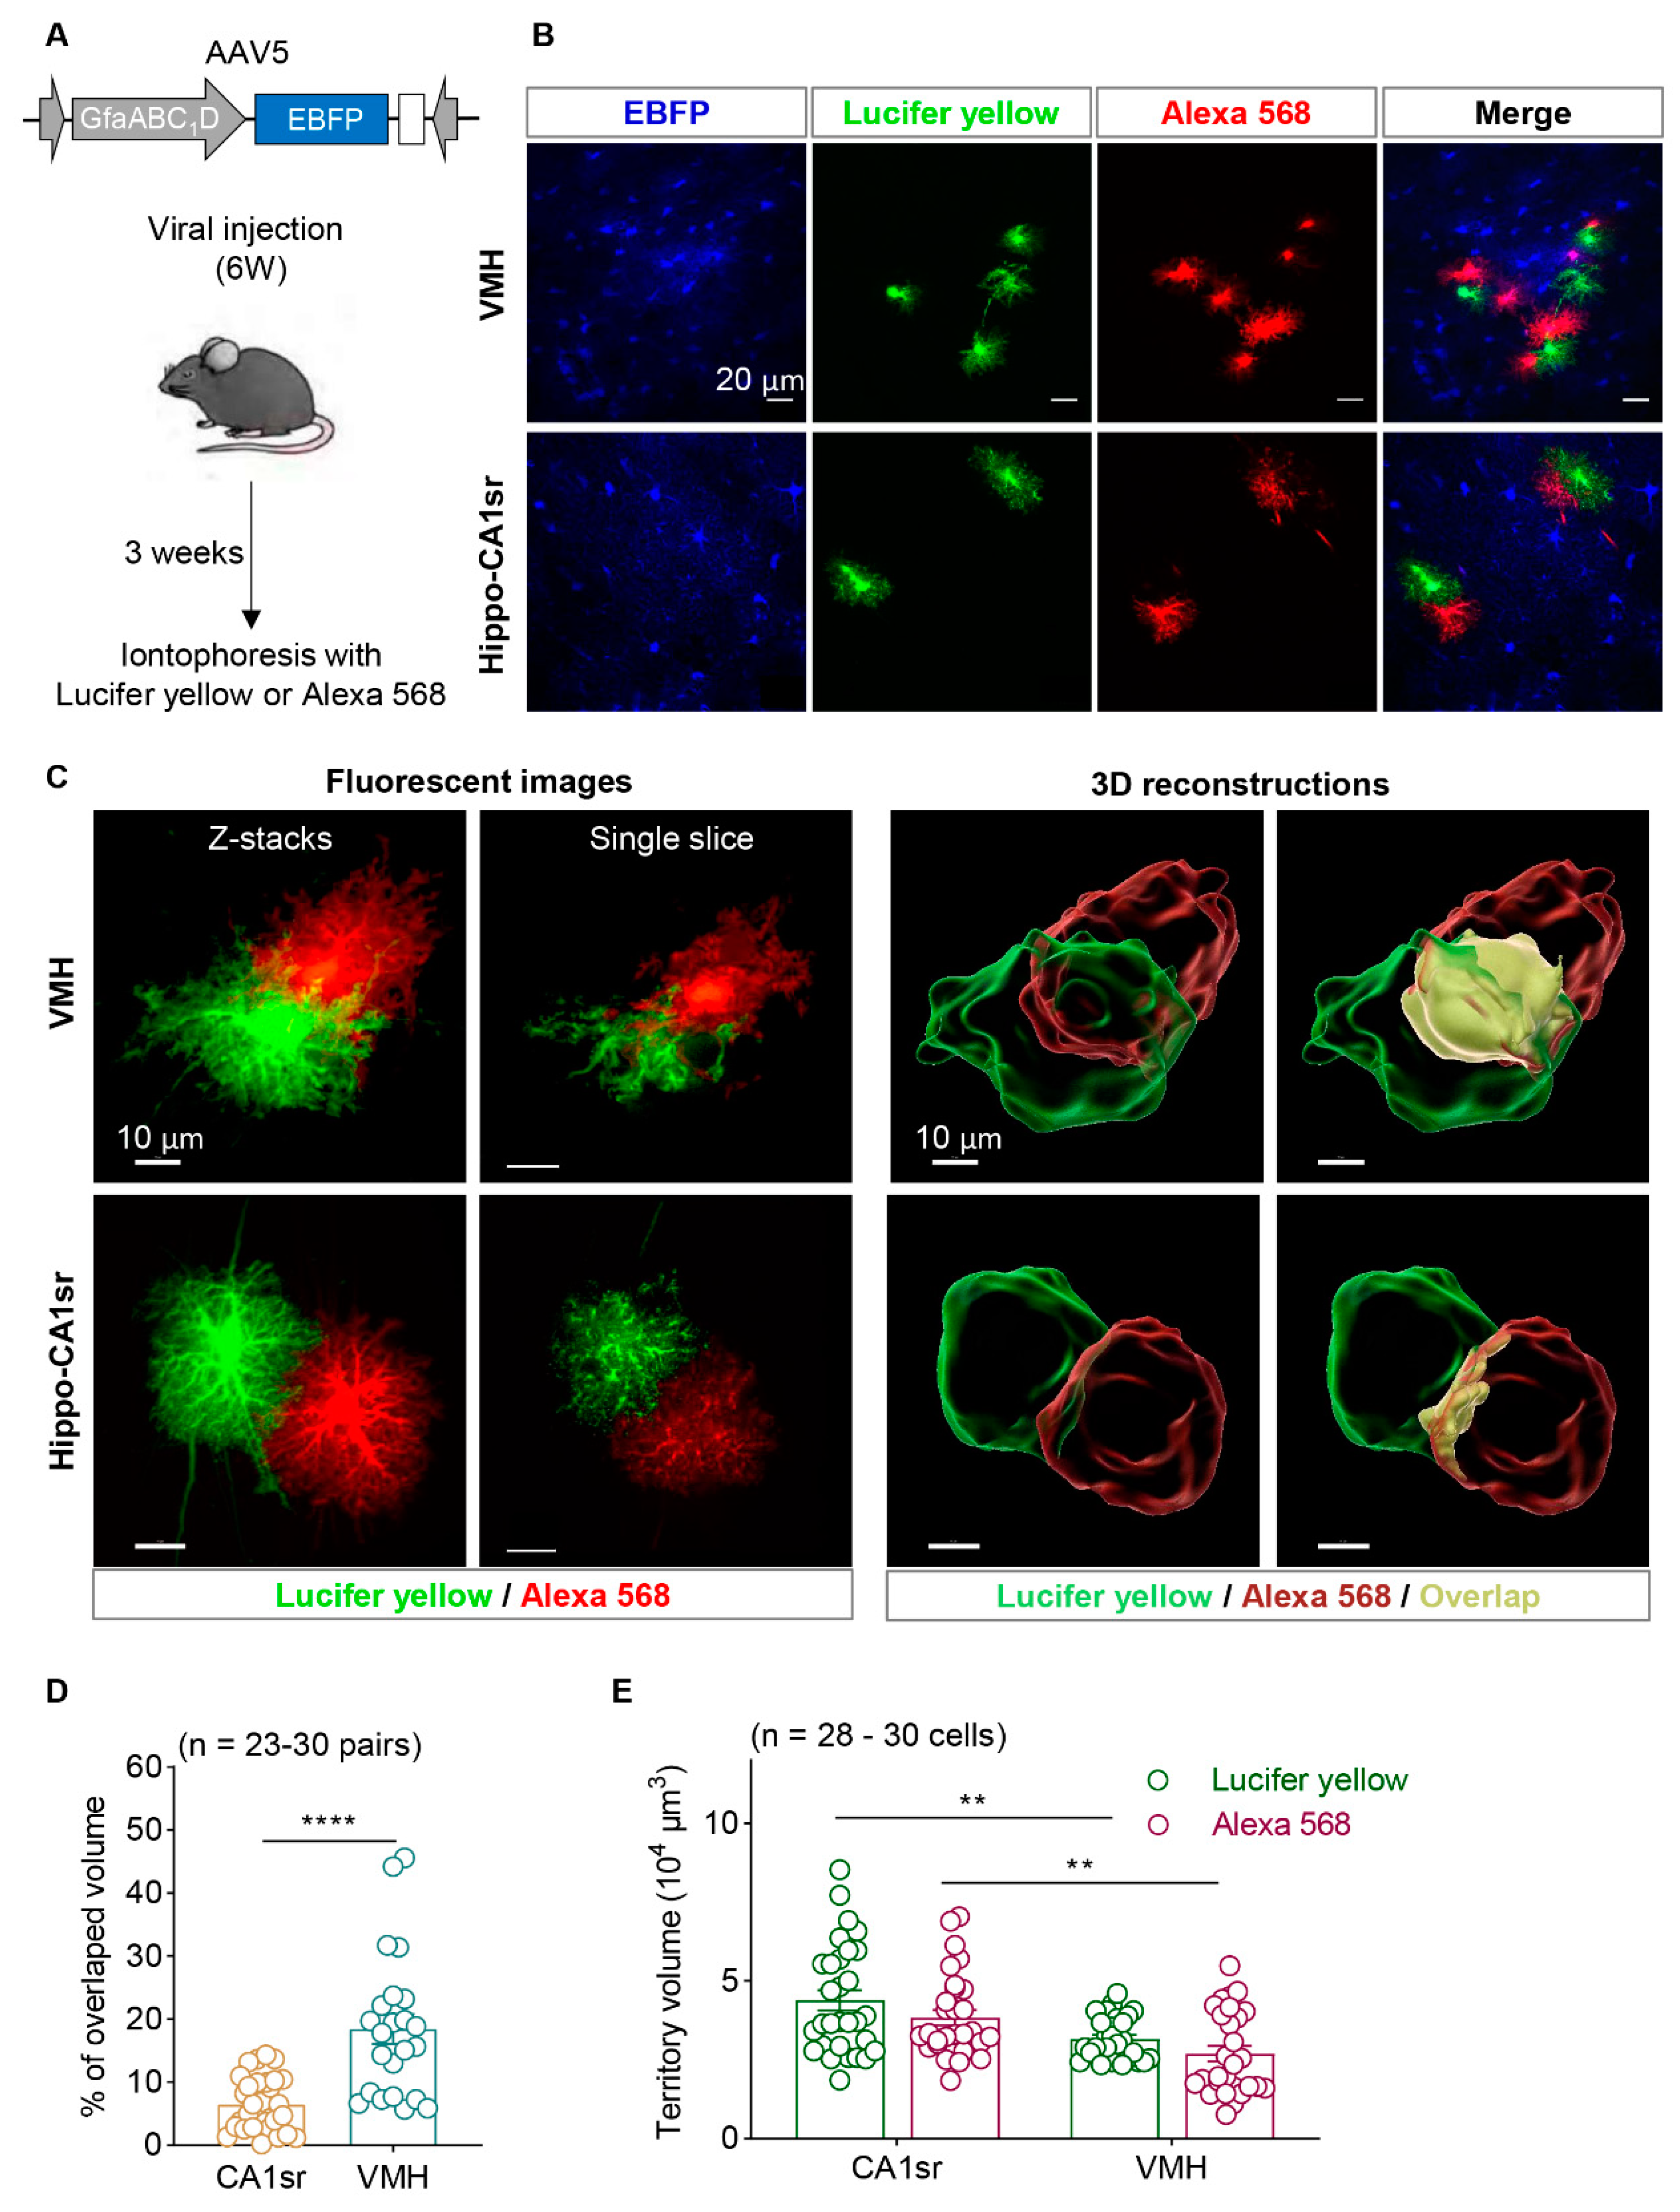
Notably, the VMH exhibits high cell density and a small proportion of astrocytes (Figure 1). To label the adjacent astrocytes more effectively, AAV5-GfaABC1D-EBFP was injected into the VMH of six-week-old mice. Three weeks later, mice were sacrificed and fixed with formalin and their brain slices were obtained. The astrocyte soma was easily recognized under bright-field microscope with the guidance of EBFP. The adjacent astrocyte pairs were selected if the distance between their somata was less than 40 µm. Thereafter, Lucifer yellow and Alexa568 was iontophoresed into each astrocyte, respectively. Astrocytes in the hippocampal CA1sr were also labelled as the control (Figure 4A,B). High-resolution confocal microscopic images showed that a clear boundary existed between the adjacent astrocytes in hippocampal CA1sr; on the contrary, the Lucifer yellow- and Alexa568-positve fine processes of astrocytes invaded into the territory of each other in VMH. And in some cases, the fine processes of Lucifer yellow positive fine processes of astrocytes even extended near the soma of Alexa568 positive neighboring astrocyte (Figure 4C). To quantify the degree of overlapped territory of astrocytes in the two brain regions, the territories of labeled astrocytes were three-dimensional reconstructed by using the Imaris software. We found the overlapped territory of astrocytes was only about 6.5% in hippocampal CA1sr, which was consistent with the previous study. However, the overlapped territory of astrocytes in VMH was about 18.5%, which was remarkably larger than those in hippocampal CA1sr (Figure 4D). Furthermore, we evaluated the total territory volume of individual astrocyte in the CA1sr and VMH. We found that astrocytes in CA1sr generally had larger territory volume compared to those in the VMH, but there was no significant difference in the territory volume represented by the two fluorescent dyes (Figure 4E). Together, our data show that dual-fluorescent-dye-iontophoresis with the guidance of fluorescent proteins introduced by AAV is an effective method to label adjacent astrocytes in the brain, especially in the high-cell-density brain regions. Importantly, we identified that adjacent astrocytes in the hypothalamus exhibit a much larger overlapped territories than that in hippocampus.
4. Discussion
In the current study, we developed a new method which involves dual-fluorescent-dye-iontophoresis with the guidance of fluorescent proteins introduced by AAV for studying the morphological features of adjacent astrocytes. Using this new method, we discovered that mature astrocytes in mice may have highly overlapped territories. Importantly, this method can be applied to study astrocytes in other species. The similar size of cell bodies of astrocytes and neurons under the bright filed microscopy in thalamus and hypothalamus as well as the low astrocyte-neuron ratio making the classical iontophoresis method highly difficult to be performed in these regions. Alternatively, microinjection of fluorescent proteins expressing AAVs into the brain of newborn mice showed a very low efficiency to label adjacent astrocytes. To solve this, we tested and found Lucifer yellow and Alexa 568 (hybridize) as the best fluorescent dye pairs with high photostability and were excellent for illustrating the fine processes of astrocytes. Last, we labeled the adjacent astrocytes in VMH and hippocampal CA1sr by using iontophoresis with Lucifer yellow and Alexa 568 with the guidance of EBFP and showed that adjacent astrocytes in VMH but not in hippocampal CA1sr have overlapped territories, suggesting astrocyte-astrocyte interaction also exhibits brain regional heterogeneity.
López-Hidalgo M et al [12] employed fluorescent dye filling with the guidance of SR101 to investigate astrocyte-astrocyte interaction in the cortex of ferrets. This method allows for the observation of astrocyte morphology in vivo. However, one limitation is the inability to image deep brain regions such as the thalamus and hypothalamus. Moreover, a leakage of fluorescent dye from the filled cells and light scattering in the non-transparent brain reduced the signal-to-noise ratio of images. This method can also be applied on acute brain slice [20]. However, conducting this experiment on brain slices in situ may subject them to factors like hypoxia, pH changes, and osmotic pressure, leading to morphological alterations in astrocytes that differ from in vivo conditions. In contrast, our method is based on fixed brain slices, which can largely preserve the cellular morphology observed in live mice.
Mosaic analysis with double markers (MADM) was introduced by Zong in 2005[22]. MADM is a genetic engineering method that utilizes gene recombination and selective labeling to study the function and interactions of specific genes in cell populations. By employing the Cre-LoxP system and targeted insertion of gene cassettes, MADM enables the complementary expression of two fluorescent marker genes in specific cell types, thereby creating a double-labeled cell population. This approach divides cells into four subgroups with distinct marker combinations, allowing researchers to precisely locate and analyze cells. However, MADM has several limitations. It requires the targeted insertion of gene cassettes into specific genomic loci, which necessitates the presence of suitable insertion sites in the target gene. Besides, MADM relies on the stability of gene cassettes to ensure proper complementation of the double markers. Some gene cassettes may exhibit high variability and instability, rendering the MADM system unreliable. Furthermore, the complexity of experimental design, as well as the high costs in terms of time and animal resources, also restrict the application of MADM in labeling neighboring astrocytes.
Abdeladim et al [39] introduced a technique called chromatic multiphoton serial (ChroMS) microscopy, which combines multiphoton imaging and multicolor fluorescent labeling. In their study, ChroMS was utilized to investigate the morphology and connections of astrocytes in the mouse cerebral cortex. They achieved multicolor labeling of neighboring astrocytes and confirmed the non-overlapping tiling pattern of astrocytes in the hippocampus, consistent with previous reports. Clavreul [40] combined ChroMS with the MAGIC Markers (MM) combinatorial labeling strategy to achieve multiclonal lineage tracing in the mouse cerebral cortex and revealed the plasticity of cortical astrocytes during development. This series of methods enables a comprehensive demonstration of the intricate astrocyte distribution ecology in shallow brain regions, revealing the plasticity during astrocyte development. However, its equipment requirements, substantial data volume, and complex experimental design may limit its broader application, and its effectiveness in deep brain regions has not been validated.
A variety of fluorescent dyes have been utilized for sparse labeling of astrocytes, including Lucifer yellow, Alexa 568, and Alexa 488. In our study, we demonstrated that Lucifer yellow and Alexa 568 exhibited superior performance compared to Alexa 488 and SR 101. We speculated that the strong polarity of Lucifer yellow and Alexa 568 make them difficult to leak from the inotophoresed astrocytes. Even though the fluorescent intensity of EBFP was relatively lower than that of EGFP and mCherry, making it challenging to visualize the fine processes of astrocytes, it still provided sufficient brightness to visualize the cell bodies. Consequently, with the aid of EBFP, astrocytes can be easily identified from other cells, even in brain regions with high cell density.
Neighboring astrocytes in the VMH exhibit high level territory overlap. It remains possible that this feature may exist in other hypothalamic regions. The physiological implication of this interesting feature remains unknown. We speculate that the high-level territory overlap may suggest a high-level of astrocyte-astrocyte commutations, including Ca2+ signaling and possibly energy substrates shuttling between adjacent astrocytes. The molecular mechanism underlying the formation of this territory overlap also requires further study. Analysis on astrocyte intrinsic transcriptional profiles, brain region specific neuron-to-astrocyte signaling may be necessary. Lastly and importantly, understanding how these astrocyte-astrocyte interactions are altered in disease conditions, such as neurodegenerative diseases or psychiatric disorders, could provide valuable insights into the underlying mechanisms and potentially identify therapeutic targets.
Author Contributions
Conceptualization, Ruotian Jiang; Data curation, Qingran Li, Bin Zhou, Ping Liao and Ruotian Jiang; Formal analysis, Qingran Li, Bin Zhou, Mengchan Su and Ruotian Jiang; Funding acquisition, Ruotian Jiang; Investigation, Qingran Li, Bin Zhou, Mengchan Su, Ping Liao, Fan Lei, Xin Li and Ruotian Jiang; Methodology, Qingran Li, Bin Zhou, Xia Zhang and Ruotian Jiang; Project administration, Ruotian Jiang; Resources, Daqing Liao, Xia Zhang and Ruotian Jiang; Software, Ruotian Jiang; Supervision, Ruotian Jiang; Validation, Qingran Li, Bin Zhou and Ruotian Jiang; Visualization, Qingran Li, Bin Zhou and Ruotian Jiang; Writing – original draft, Qingran Li, Bin Zhou and Ruotian Jiang; Writing – review & editing, Qingran Li, Bin Zhou and Ruotian Jiang.
Funding
This work was funded by the National Nature Science Foundation of China grants (82271249, 32071003), 1.3.5 Project for Disciplines of Excellence of West China Hospital, Sichuan University (ZYJC21034), Science & Technology Department of Sichuan Province grant (2022NSFSC1367).
Institutional Review Board Statement
The animal study protocol was approved by the Animal Research Committee at the West China Hospital of Sichuan University (protocol 20230220023).
Informed Consent Statement
Not applicable.
Data Availability Statement
All data of this study are available from the corresponding author for reasonable request.
Conflicts of Interest
The authors declare no conflict of interest.
References
- Verkhratsky A, Nedergaard M. Physiology of Astroglia. Physiol Rev. 2018 Jan 1;98(1):239-389. [CrossRef] [PubMed] [PubMed Central]
- He C, Duan S. Novel Insight into Glial Biology and Diseases. Neurosci Bull. 2023 Mar;39(3):365-367. [CrossRef] [PubMed] [PubMed Central]
- Farhy-Tselnicker I, Allen NJ. Astrocytes, neurons, synapses: a tripartite view on cortical circuit development. Neural Dev. 2018 May 1;13(1):7. [CrossRef] [PubMed] [PubMed Central]
- Bushong EA, Martone ME, Jones YZ, Ellisman MH. Protoplasmic astrocytes in CA1 stratum radiatum occupy separate anatomical domains. J Neurosci. 2002 Jan 1;22(1):183-92. [CrossRef] [PubMed] [PubMed Central]
- Zhou B, Zuo YX, Jiang RT. Astrocyte morphology: Diversity, plasticity, and role in neurological diseases. CNS Neurosci Ther. 2019 Jun;25(6):665-673. [CrossRef] [PubMed] [PubMed Central]
- Bushong EA, Martone ME, Ellisman MH. Maturation of astrocyte morphology and the establishment of astrocyte domains during postnatal hippocampal development. Int J Dev Neurosci. 2004 Apr;22(2):73-86. [CrossRef] [PubMed]
- Freeman MR. Specification and morphogenesis of astrocytes. Science. 2010 Nov 5;330(6005):774-8. [CrossRef] [PubMed] [PubMed Central]
- Torres-Ceja B, Olsen ML. A closer look at astrocyte morphology: Development, heterogeneity, and plasticity at astrocyte leaflets. Curr Opin Neurobiol. 2022 Jun; 74:102550. [CrossRef] [PubMed] [PubMed Central]
- Baldwin KT, Tan CX, Strader ST, Jiang C, Savage JT, Elorza-Vidal X, Contreras X, Rülicke T, Hippenmeyer S, Estévez R, Ji RR, Eroglu C. HepaCAM controls astrocyte self-organization and coupling. Neuron. 2021 Aug 4;109(15):2427-2442.e10. [CrossRef] [PubMed] [PubMed Central]
- Oberheim NA, Wang X, Goldman S, Nedergaard M. Astrocytic complexity distinguishes the human brain. Trends Neurosci. 2006 Oct;29(10):547-53. [CrossRef] [PubMed]
- Stork T, Sheehan A, Tasdemir-Yilmaz OE, Freeman MR. Neuron-glia interactions through the Heartless FGF receptor signaling pathway mediate morphogenesis of Drosophila astrocytes. Neuron. 2014 Jul 16;83(2):388-403. [CrossRef] [PubMed] [PubMed Central]
- López-Hidalgo M, Hoover WB, Schummers J. Spatial organization of astrocytes in ferret visual cortex. J Comp Neurol. 2016 Dec 1;524(17):3561-3576. [CrossRef] [PubMed] [PubMed Central]
- Livet J, Weissman TA, Kang H, Draft RW, Lu J, Bennis RA, Sanes JR, Lichtman JW. Transgenic strategies for combinatorial expression of fluorescent proteins in the nervous system. Nature. 2007 Nov 1;450(7166):56-62. [CrossRef] [PubMed]
- Endo F, Kasai A, Soto JS, Yu X, Qu Z, Hashimoto H, Gradinaru V, Kawaguchi R, Khakh BS. Molecular basis of astrocyte diversity and morphology across the CNS in health and disease. Science. 2022 Nov 4;378(6619):eadc9020. [CrossRef] [PubMed] [PubMed Central]
- Karpf J, Unichenko P, Chalmers N, Beyer F, Wittmann MT, Schneider J, Fidan E, Reis A, Beckervordersandforth J, Brandner S, Liebner S, Falk S, Sagner A, Henneberger C, Beckervordersandforth R. Dentate gyrus astrocytes exhibit layer-specific molecular, morphological and physiological features. Nat Neurosci. 2022 Dec;25(12):1626-1638. [CrossRef] [PubMed]
- Cahoy JD, Emery B, Kaushal A, Foo LC, Zamanian JL, Christopherson KS, Xing Y, Lubischer JL, Krieg PA, Krupenko SA, Thompson WJ, Barres BA. A transcriptome database for astrocytes, neurons, and oligodendrocytes: a new resource for understanding brain development and function. J Neurosci. 2008 Jan 2;28(1):264-78. [CrossRef] [PubMed] [PubMed Central]
- Welle A, Kasakow CV, Jungmann AM, Gobbo D, Stopper L, Nordström K, Salhab A, Gasparoni G, Scheller A, Kirchhoff F, Walter J. Epigenetic control of region-specific transcriptional programs in mouse cerebellar and cortical astrocytes. Glia. 2021 Sep;69(9):2160-2177. [CrossRef] [PubMed]
- Lanjakornsiripan D, Pior BJ, Kawaguchi D, Furutachi S, Tahara T, Katsuyama Y, Suzuki Y, Fukazawa Y, Gotoh Y. Layer-specific morphological and molecular differences in neocortical astrocytes and their dependence on neuronal layers. Nat Commun. 2018 Apr 24;9(1):1623. [CrossRef] [PubMed] [PubMed Central]
- Matyash V, Kettenmann H. Heterogeneity in astrocyte morphology and physiology. Brain Res Rev. 2010 May;63(1-2):2-10. [CrossRef] [PubMed]
- Reeves AM, Shigetomi E, Khakh BS. Bulk loading of calcium indicator dyes to study astrocyte physiology: key limitations and improvements using morphological maps. J Neurosci. 2011 Jun 22;31(25):9353-8. [CrossRef] [PubMed] [PubMed Central]
- Veldman MB, Park CS, Eyermann CM, Zhang JY, Zuniga-Sanchez E, Hirano AA, Daigle TL, Foster NN, Zhu M, Langfelder P, Lopez IA, Brecha NC, Zipursky SL, Zeng H, Dong HW, Yang XW. Brainwide Genetic Sparse Cell Labeling to Illuminate the Morphology of Neurons and Glia with Cre-Dependent MORF Mice. Neuron. 2020 Oct 14;108(1):111-127.e6. [CrossRef] [PubMed] [PubMed Central]
- Zong H, Espinosa JS, Su HH, Muzumdar MD, Luo L. Mosaic analysis with double markers in mice. Cell. 2005 May 6;121(3):479-92. [CrossRef] [PubMed]
- Kim JY, Grunke SD, Levites Y, Golde TE, Jankowsky JL. Intracerebroventricular viral injection of the neonatal mouse brain for persistent and widespread neuronal transduction. J Vis Exp. 2014 Sep 15;(91):51863. [CrossRef] [PubMed] [PubMed Central]
- Moye SL, Diaz-Castro B, Gangwani MR, Khakh BS. Visualizing Astrocyte Morphology Using Lucifer Yellow Iontophoresis. J Vis Exp. 2019 Sep 14;(151). [CrossRef] [PubMed]
- Webster VL, Mahajan RP. Transient hyperaemic response to assess vascular reactivity of skin; effect of locally iontophoresed sodium nitroprusside. Br J Anaesth. 2002 Aug;89(2):265-70. [CrossRef] [PubMed]
- Octeau JC, Chai H, Jiang R, Bonanno SL, Martin KC, Khakh BS. An Optical Neuron-Astrocyte Proximity Assay at Synaptic Distance Scales. Neuron. 2018 Apr 4;98(1):49-66.e9. [CrossRef] [PubMed] [PubMed Central]
- Huang H, He W, Tang T, Qiu M. Immunological Markers for Central Nervous System Glia. Neurosci Bull. 2023 Mar;39(3):379-392. [CrossRef] [PubMed] [PubMed Central]
- Ogata K, Kosaka T. Structural and quantitative analysis of astrocytes in the mouse hippocampus. Neuroscience. 2002;113(1):221-33. [CrossRef] [PubMed]
- Savchenko VL, McKanna JA, Nikonenko IR, Skibo GG. Microglia and astrocytes in the adult rat brain: comparative immunocytochemical analysis demonstrates the efficacy of lipocortin 1 immunoreactivity. Neuroscience. 2000;96(1):195-203. [CrossRef] [PubMed]
- Trimmer JS. Immunological identification and characterization of a delayed rectifier K+ channel polypeptide in rat brain. Proc Natl Acad Sci U S A. 1991 Dec 1;88(23):10764-8. [CrossRef] [PubMed] [PubMed Central]
- Hwang P M, Fotuhi M, Bredt D S, et al. Contrasting immunohistochemical localizations in rat brain of two novel K+ channels of the Shab subfamily. Journal of Neuroscience, 1993, 13(4): 1569-1576. [CrossRef]
- Schulze W, Hayata-Takano A, Kamo T, Nakazawa T, Nagayasu K, Kasai A, Seiriki K, Shintani N, Ago Y, Farfan C, Hashimoto R, Baba A, Hashimoto H. Simultaneous neuron- and astrocyte-specific fluorescent marking. Biochem Biophys Res Commun. 2015 Mar 27;459(1):81-6. [CrossRef] [PubMed]
- Chan KY, Jang MJ, Yoo BB, Greenbaum A, Ravi N, Wu WL, Sánchez-Guardado L, Lois C, Mazmanian SK, Deverman BE, Gradinaru V. Engineered AAVs for efficient noninvasive gene delivery to the central and peripheral nervous systems. Nat Neurosci. 2017 Aug;20(8):1172-1179. [CrossRef] [PubMed] [PubMed Central]
- Challis RC, Ravindra Kumar S, Chan KY, Challis C, Beadle K, Jang MJ, Kim HM, Rajendran PS, Tompkins JD, Shivkumar K, Deverman BE, Gradinaru V. Systemic AAV vectors for widespread and targeted gene delivery in rodents. Nat Protoc. 2019 Feb;14(2):379-414. https://doi.org/10.1038/s41596-018-0097-3. Erratum in: Nat Protoc. 2019 Aug;14(8):2597. [PubMed]
- Smith CA, Chauhan BC. In vivo imaging of adeno-associated viral vector labelled retinal ganglion cells. Sci Rep. 2018 Jan 24;8(1):1490. [CrossRef] [PubMed] [PubMed Central]
- Zhou B, Chen L, Liao P, Huang L, Chen Z, Liao D, Yang L, Wang J, Yu G, Wang L, Zhang J, Zuo Y, Liu J, Jiang R. Astroglial dysfunctions drive aberrant synaptogenesis and social behavioral deficits in mice with neonatal exposure to lengthy general anesthesia. PLoS Biol. 2019 Aug 21;17(8):e3000086. [CrossRef] [PubMed] [PubMed Central]
- Panchuk-Voloshina N, Haugland RP, Bishop-Stewart J, Bhalgat MK, Millard PJ, Mao F, Leung WY, Haugland RP. Alexa dyes, a series of new fluorescent dyes that yield exceptionally bright, photostable conjugates. J Histochem Cytochem. 1999 Sep;47(9):1179-88. [CrossRef] [PubMed]
- Rai S, Bhardwaj U, Misra A, Singh S, Gupta R. Comparison between photostability of Alexa Fluor 448 and Alexa Fluor 647 with conventional dyes FITC and APC by flow cytometry. Int J Lab Hematol. 2018 Jun;40(3):e52-e54. [CrossRef] [PubMed]
- Abdeladim L, Matho KS, Clavreul S, Mahou P, Sintes JM, Solinas X, Arganda-Carreras I, Turney SG, Lichtman JW, Chessel A, Bemelmans AP, Loulier K, Supatto W, Livet J, Beaurepaire E. Multicolor multiscale brain imaging with chromatic multiphoton serial microscopy. Nat Commun. 2019 Apr 10;10(1):1662. https://doi.org/10.1038/s41467-019-09552-9. Erratum in: Nat Commun. 2019 May 9;10(1):2160. [PubMed] [PubMed Central]
- Clavreul S, Abdeladim L, Hernández-Garzón E, Niculescu D, Durand J, Ieng SH, Barry R, Bonvento G, Beaurepaire E, Livet J, Loulier K. Cortical astrocytes develop in a plastic manner at both clonal and cellular levels. Nat Commun. 2019 Oct 25;10(1):4884. [CrossRef] [PubMed] [PubMed Central]
Figure 1.
Brain reginal heterogeneity of astrocyte-neuron ratio. (A) Representative immunofluorescence images of astrocytes (S100β, green) and neuron (NeuN, red) in hippocampal CA1sr, cortex, striatum, thalamus and VMH. Scale bars, 20 µm. (B) Quantification of the proportion of astrocyte and neuron within each brain regions (n = 5-9 slices). (C) Quantification of relative ratio of neuron to astrocyte (n = 5-7 slices; One-way ANOVA followed by Tukey's multiple comparisons test). (D) Quantification of total cell counts per 45,000 µm2 (n = 10-12 slices; One-way ANOVA followed by Tukey's multiple comparisons test). (E) Representative images of astrocytes labeled by AAV5-GfaABC1D-EBFP and neurons labeled by Kv2.1 in hippocampal CA1sr and VMH. The measuring method of soma diameter is shown on the right. The yellow dashed line represents an estimated cell body diameter. Scale bars, 20 µm. (F) Quantification of astrocyte and neuron soma diameter in hippocampal CA1sr and VMH (n = 36-168 cells; unpaired t test). ** P < 0.01, *** P < 0.001, **** P < 0.0001. Data are shown as mean ± SEM. VMH, ventromedial nucleus of the hypothalamus; Hippo-CA1sr, hippocampus CA1 stratum radiatus; S100β, S100 calcium-binding protein beta; NeuN, neuron nucleus; AAV, adeno-associated virus; EBFP, enhanced blue fluorescent protein; Kv2.1, voltage-gated potassium channel subfamily KQT member 2.1.
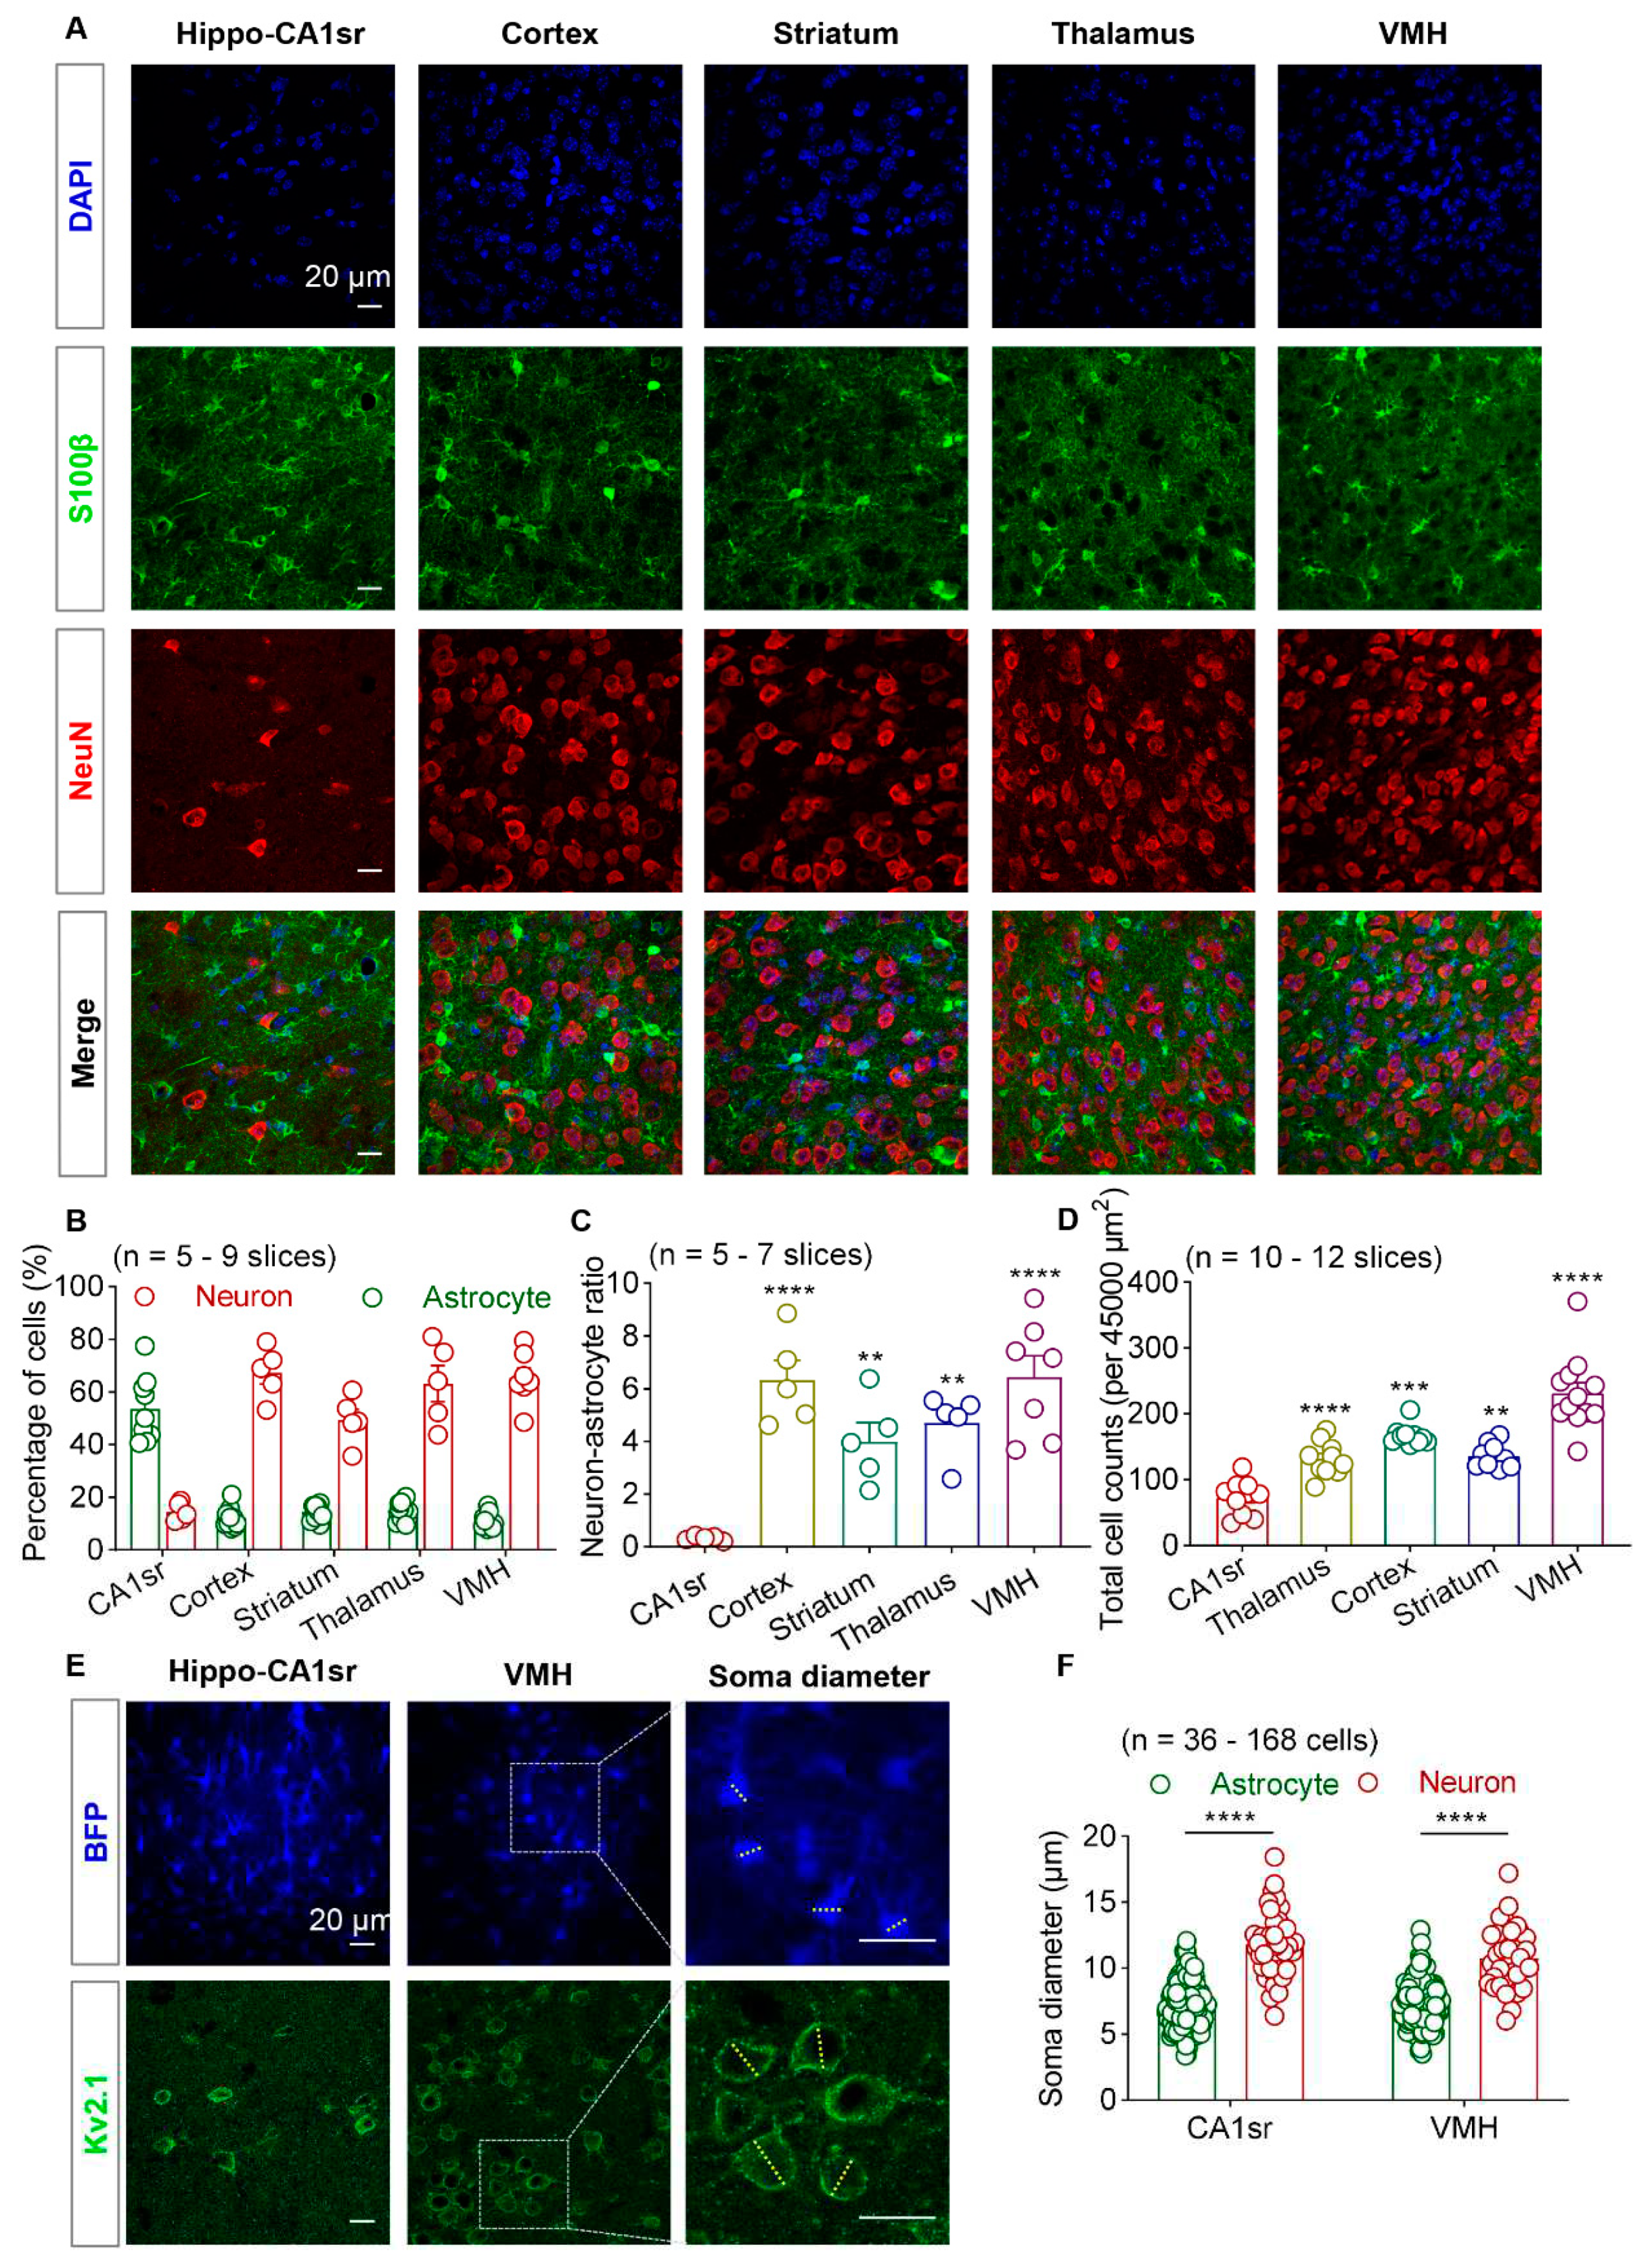
Figure 2.
Sparse labelling the adjacent astrocytes by AAVs expressing fluorescent proteins. (A) Diagram illustrates the vector construction, AAV injection in neonate mice, and protocol for brain slice imaging. (B) Representative confocal images of the cortex, single astrocyte, and astrocytic fine processes from EBFP, EGFP and mCherry injected mice. (C and D) Montage (C) and zoom-in images (D) of EBFP/EGFP expressing brain. The yellow arrow represents EBFP and EGFP positive adjacent astrocyte pairs. Scale bars were showed on the pictures.
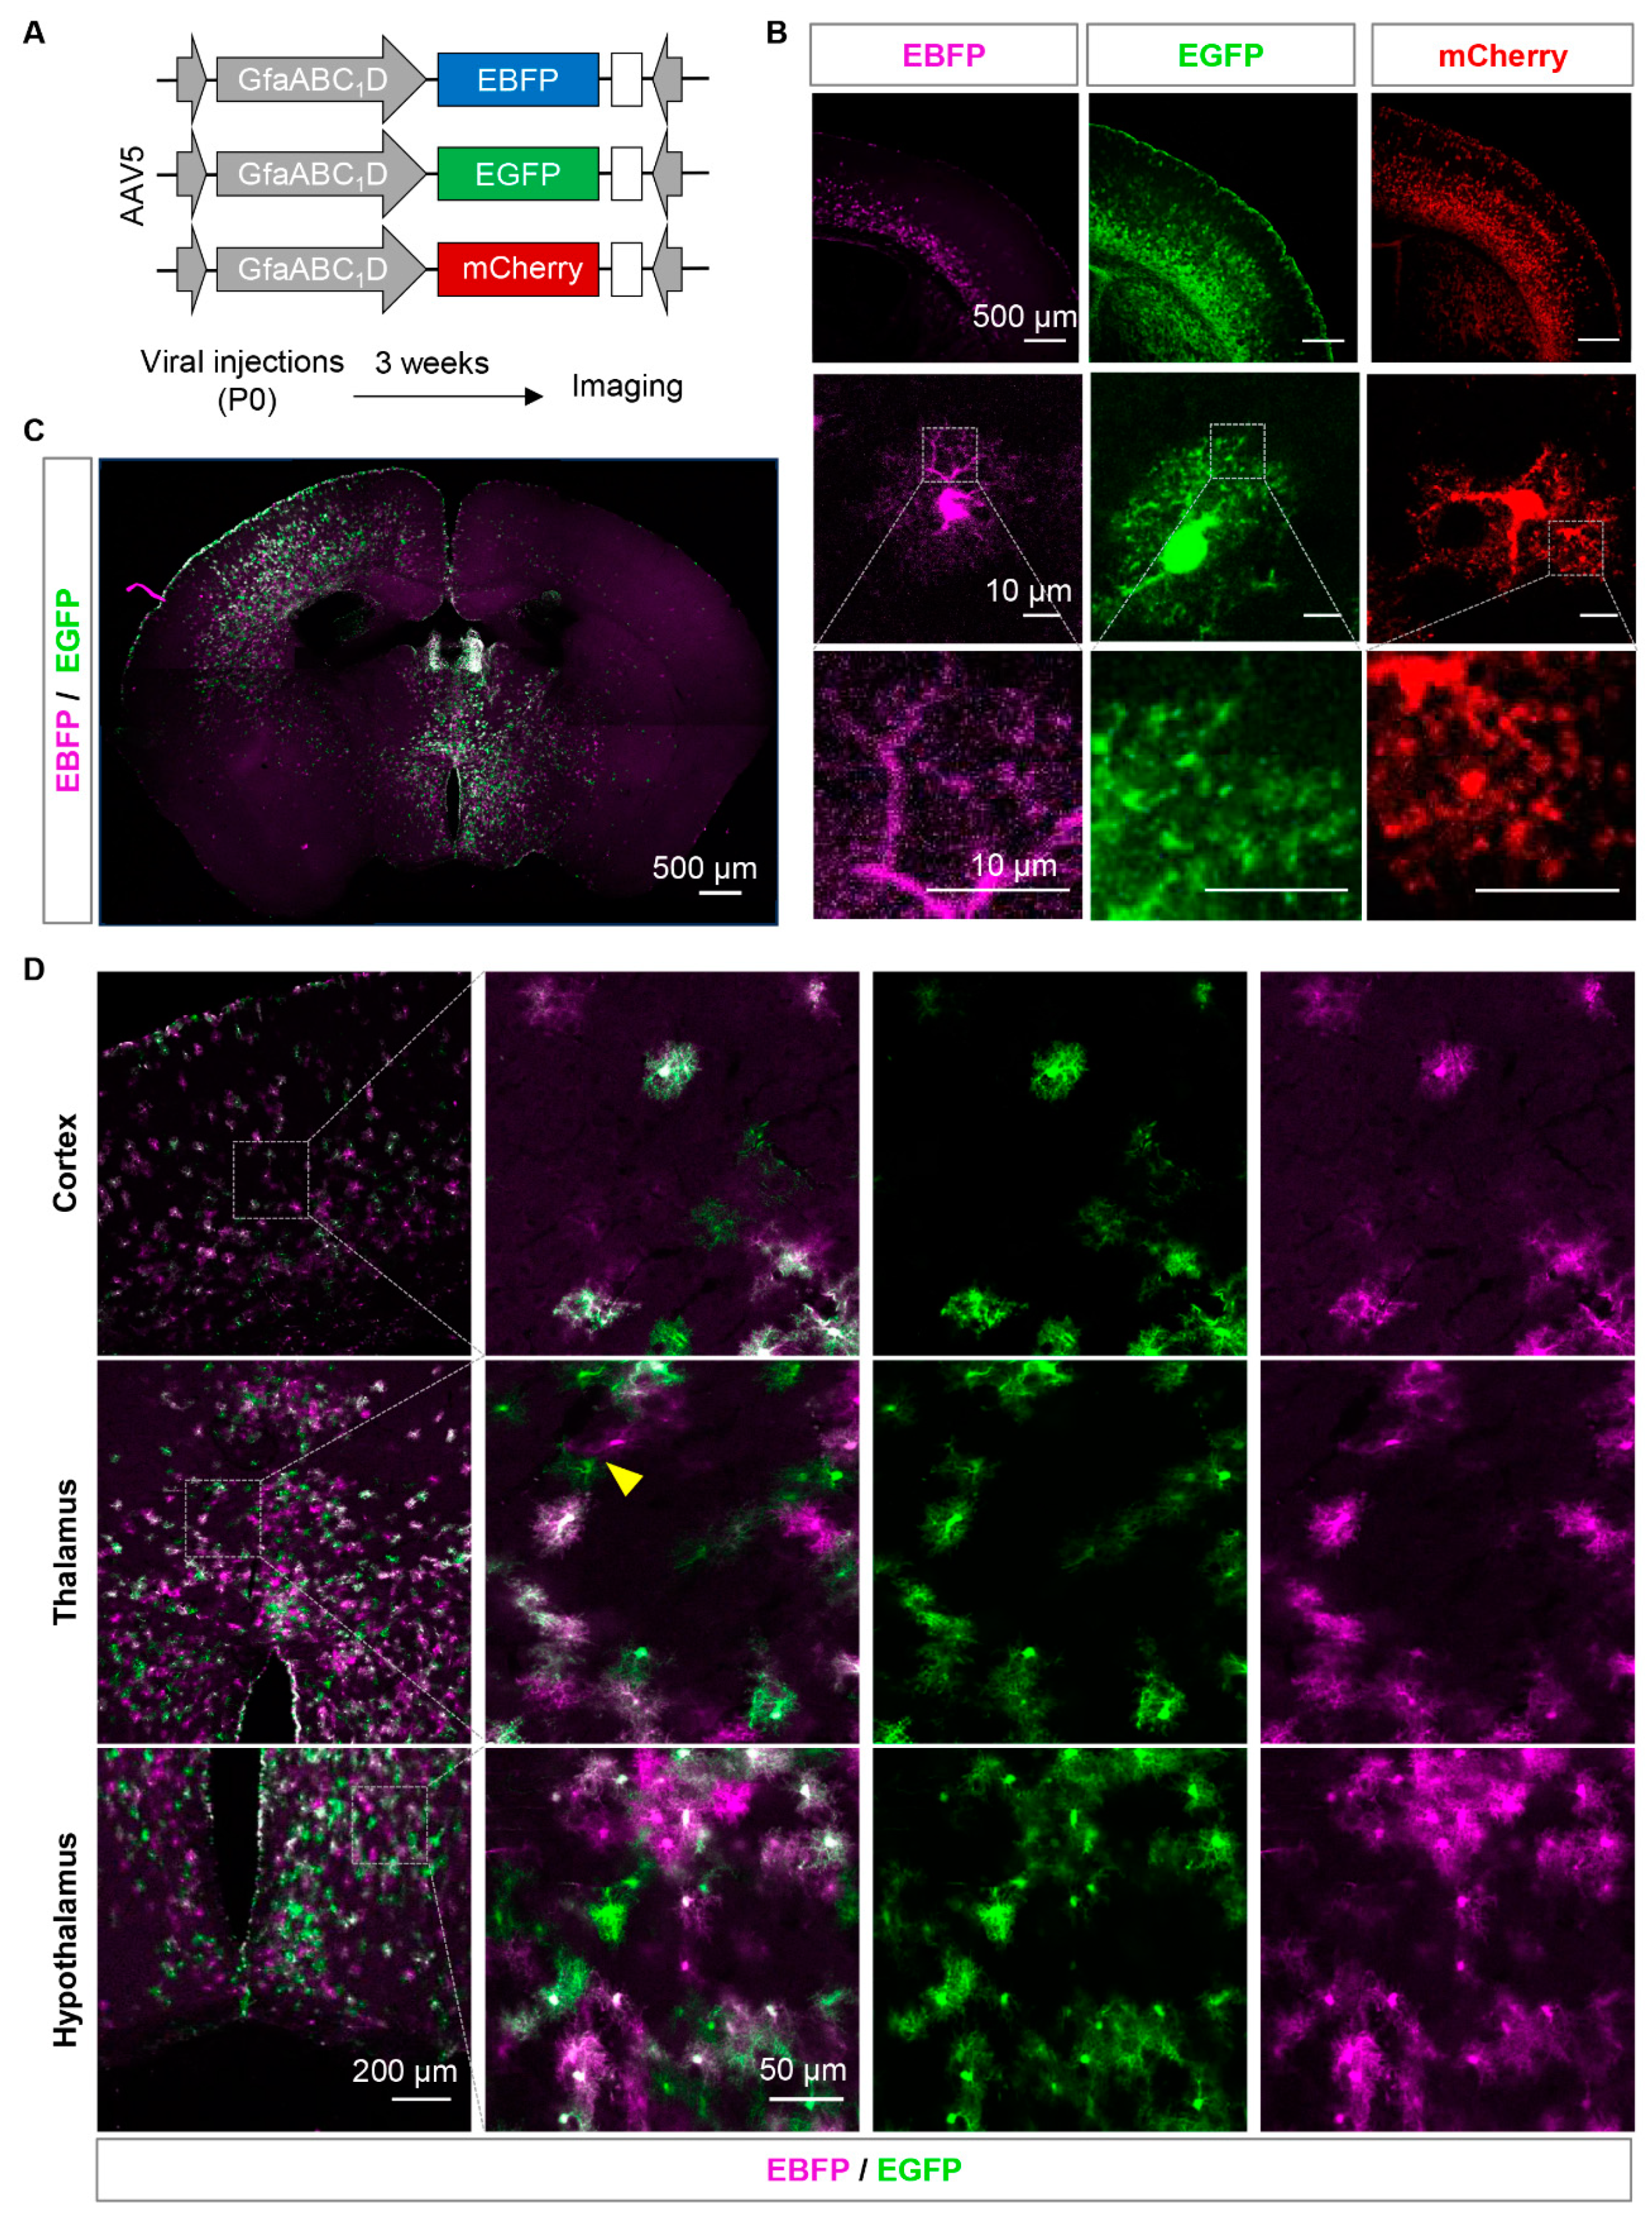
Figure 3.
Photostability and labeling efficiency of four types of fluorescent dyes. (A) Schematic diagram of iontophoresis with fluorescent dyes under bright-field and imaging protocol. The area enclosed by the red dashed line indicates the pipette. (B) Representative images of astrocyte filled by 2 mM Alexa 488, 1.5% Lucifer Yellow, 5 mM SR101 and 2mM Alexa 568 at the beginning and 5 minutes after time-lapsing imaging, separately. Scale bars, 10 µm. (C) Normalized fluorescence intensity decay over time of the 4 fluorescent dyes (n = 30-34 ROIs). (D) Fluorescent images of astrocytes labeled by 4 fluorescent dyes after 3 days storage at 4°C. Scale bars, 10 µm. (E) Diagram illustrates the location of ROIs selected for fluorescence intensity measurement in astrocyte. (F) Quantification of normalized fluorescence intensity of astrocytic processes labeled by Lucifer yellow, Alexa 488, SR101 and Alexa 568 at 5 minutes (n = 81-90 ROIs from 6 cells; Kruskal-Wallis test followed by Dunn's multiple comparisons test). (G) Quantification of fluorescence intensity of astrocytic processes labeled with Lucifer yellow and Alexa 488 (Left, n = 48 ROIs from 6 cells; two-way ANOVA followed by Sidak's multiple comparisons test), as well as SR101 and Alexa 568 (Right, n = 32-48 ROIs from 4-6 cells; two-way ANOVA followed by Sidak's multiple comparisons test) after 3 days storage at 4 °C. ***P < 0.001, ****P < 0.0001. Data are shown as mean ± SEM. ROI, region of interest.
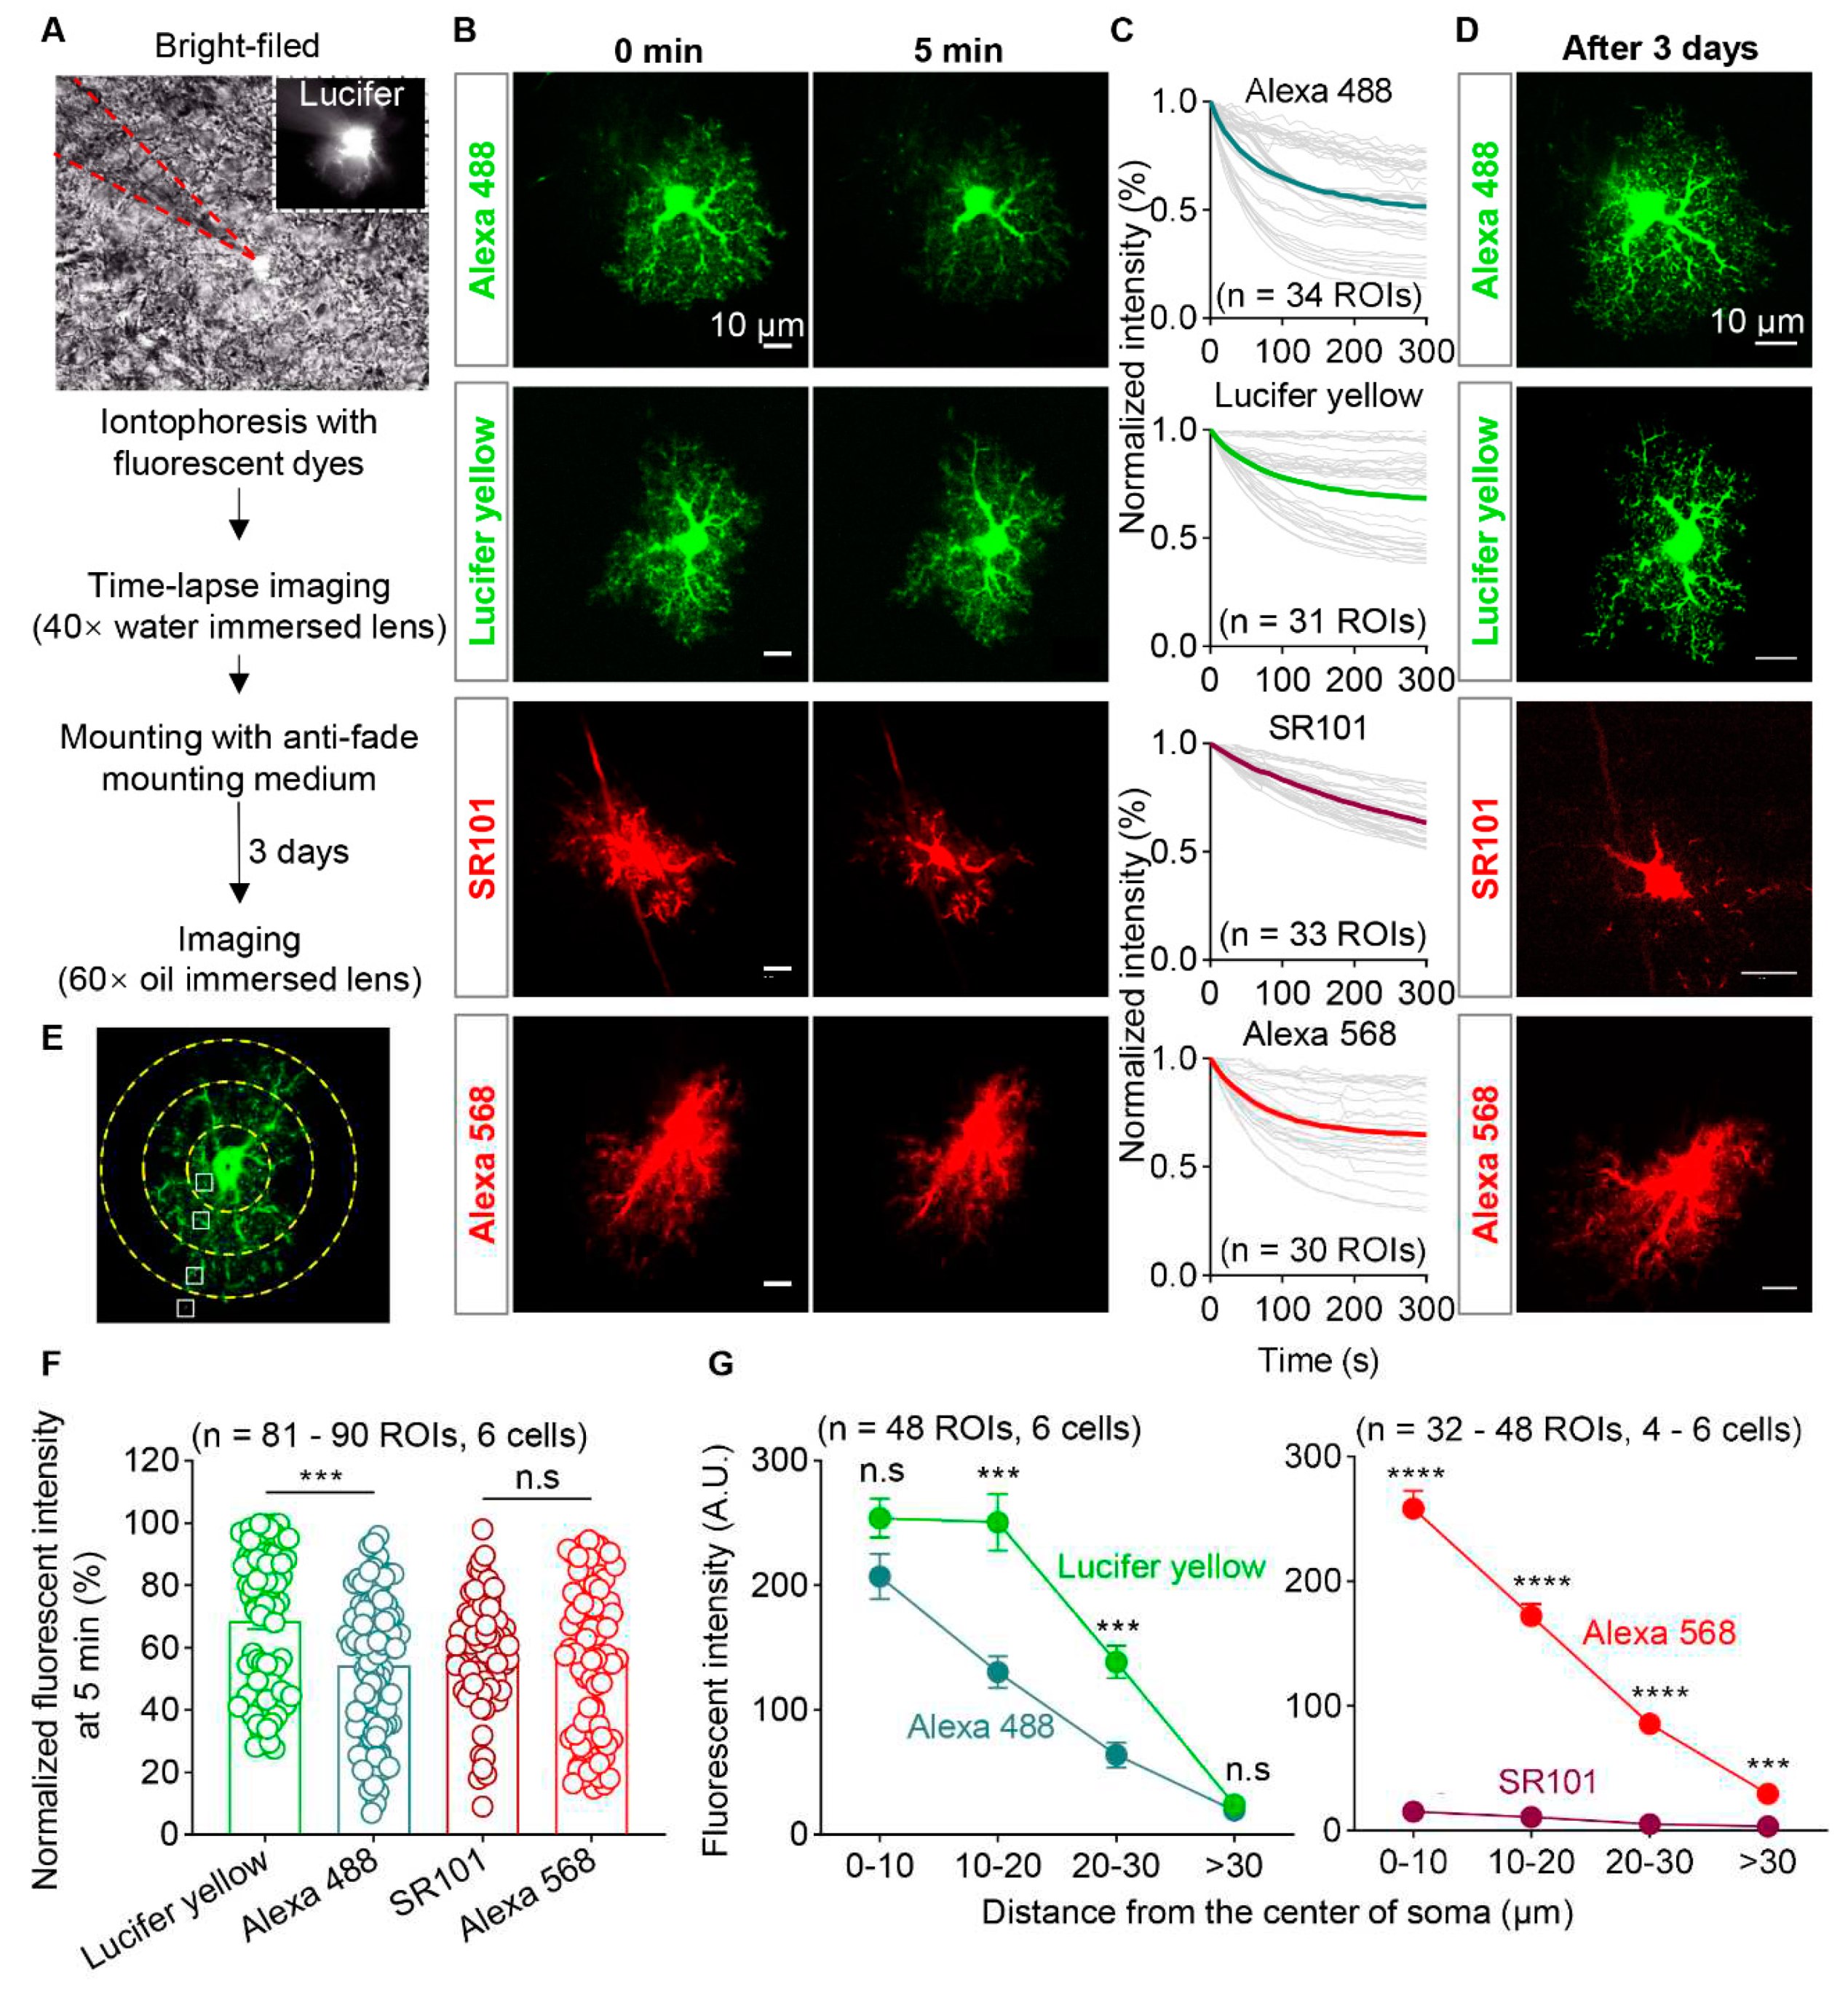
Figure 4.
Astrocytes showed overlapped territory in VMH. (A) Diagram illustrates AAV injection in 6-week-old mice and iontophoresis protocol. (B) Representative images of astrocytes labeled by EBFP, Lucifer yellow and Alexa 568 in VMH and hippocampal CA1sr. Scale bars, 20 µm. (C) Confocal fluorescent images and 3D reconstructions of adjacent astrocytes in VMH and hippocampal CA1sr. Scale bars, 10 µm. (D) Quantitative percentage of overlapped volume between the adjacent astrocytes in VMH and hippocampal CA1sr (n = 23-30 pairs; unpaired t test). (E) Quantification of astrocytic territory volume labeled by Lucifer yellow and Alexa 568 in VMH and hippocampal CA1sr (n = 28-30 cells; two-way ANOVA followed by Sidak's multiple comparisons test). **P < 0.01, ****P < 0.0001. Data are shown as mean ± SEM.
Disclaimer/Publisher’s Note: The statements, opinions and data contained in all publications are solely those of the individual author(s) and contributor(s) and not of MDPI and/or the editor(s). MDPI and/or the editor(s) disclaim responsibility for any injury to people or property resulting from any ideas, methods, instructions or products referred to in the content. |
© 2023 by the authors. Licensee MDPI, Basel, Switzerland. This article is an open access article distributed under the terms and conditions of the Creative Commons Attribution (CC BY) license (http://creativecommons.org/licenses/by/4.0/).
Copyright: This open access article is published under a Creative Commons CC BY 4.0 license, which permit the free download, distribution, and reuse, provided that the author and preprint are cited in any reuse.


