1. Introduction
During the last Quaternary glaciation, sea levels remained below current levels from the Riss-Würm interglacial period (c. 120000 BP) until the Flandrian transgression (c. 6000 BP), when the minimum record reached around −120 m [
1] to −130 m [
2] approximately 18000 years ago [
3,
4]. These changes, which determined large variations in the coastline throughout this period, were not linear, nor did they occur at the same pace, nor did they develop within a single trend of continuous rise or fall [
5,
6].
Understanding the relationship between changes in the coastline and settlement strategies is crucial in the study of prehistoric societies, particularly those who relied on marine resources. The coastline was not a fixed and stable boundary, and as sea levels fluctuated throughout the last glaciation, it created new areas of land for human settlement, which could have been prime locations for exploiting marine resources. Therefore, by analyzing how changes in the coastline affected the spatial distribution of settlements and the strategies employed by these societies to exploit marine resources, we can gain a better understanding of prehistoric human behavior and how it evolved over time.
Several studies have been conducted on the relationship between changes in sea levels and human settlements [
7,
8,
9,
10,
11] particularly focused on the narrow marine straits that occurred during the last glaciation period and their relation to human migrations. For example, articles have been published on the Bering Strait and human access to America [
12,
13], as well as articles on hominid migration models [
14].
A comprehensive understanding of the coastlines of the past is hindered by various obstacles. Firstly, the quality of the input data often presents a problem, as the bathymetry frequently has a very poor cell extension compared to the surface area that is above water. Secondly, it is difficult to determine the evolution of the coastline in the past, as it is not solely determined by the current bathymetry, but also by other factors such as lithology, and above all, the presence or absence of sediment sources that may accelerate or slow down the processes of accretion and erosion to which the coast is subjected. While attempts have been made to consider these factors at a local level, it is common to use bathymetry as a source of information on the extent of paleo-coastlines.
There is often an assumption that the last glacial period had an extremely low sea level position. While this is true, it is important to note that the last glacial period had a very low or extremely low sea level position for a period of time that spans roughly from 40,000 to 15,000 years ago, with its lowest point around 18,000 years ago [
15]. The rest of the glacial period, which covers a much longer period of about 100,000 years, shows continuous changes in sea level that cannot be simplified by referring to a single mean sea level position [
16].
The study of prehistoric human behavior and their relationship with marine resources has gained increasing interest in recent years. While early studies primarily focused on the use of coastal environments [
17], there has been a growing recognition that marine resources may have played a more significant role in the subsistence strategies of prehistoric societies than previously thought [
18,
19,
20,
21] However, a better understanding of the relationship between sea level changes and prehistoric settlement patterns is required to fully grasp the exploitation of marine resources [
22]. By using paleo-coastlines and georeferenced radiocarbon dating, this study aims to provide a more detailed and accurate picture of prehistoric societies and their strategies for exploiting marine resources, ultimately contributing to a more complete understanding of human behavior and adaptation to environmental changes.
The objective of this scientific article is to demonstrate the benefits of utilizing precise and accurate sources of information, such as the level and spatial position of paleo-coastlines and georeferenced radiocarbon dating of archaeological sites, in the study of Prehistory and its relationship with the exploitation of marine resources. By presenting a detailed analysis of the use of these sources of information, we aim to show how they can enhance the accuracy and scientific rigor of research in this field. Ultimately, this article seeks to contribute to the advancement of our understanding of the history and exploitation of marine resources by early human societies.
2. Materials and Methods
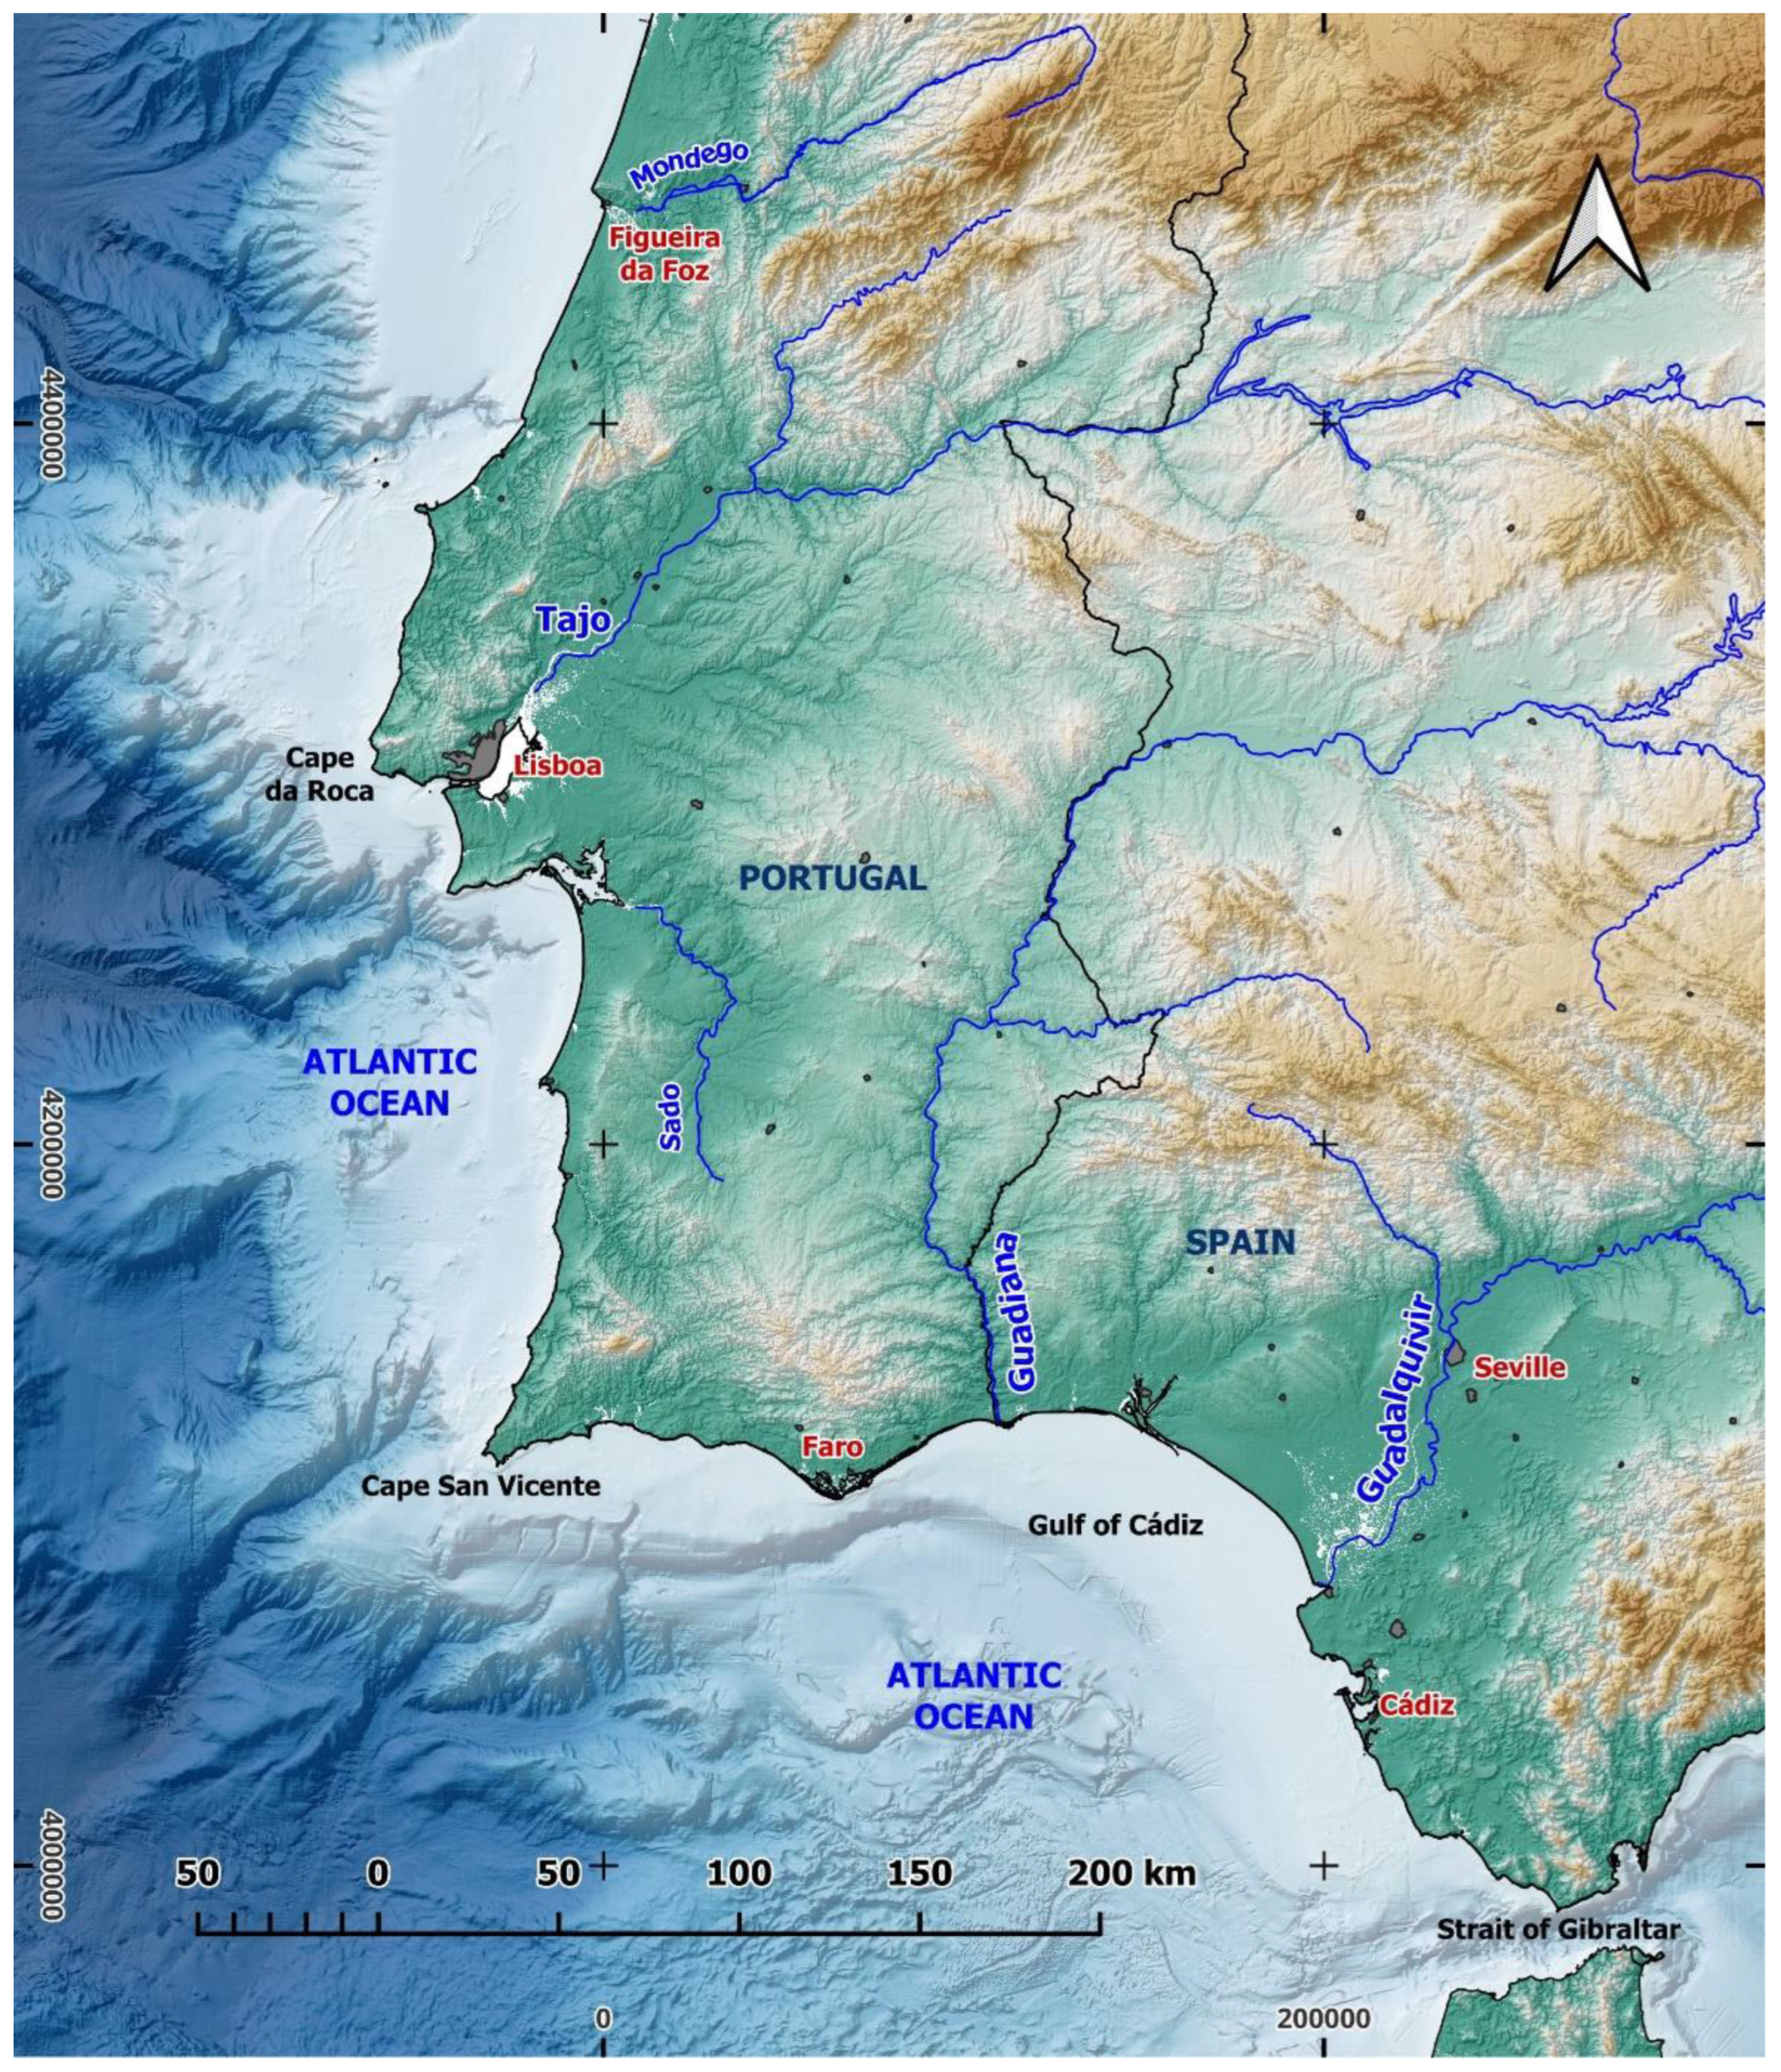
The study area extends along the Iberian Peninsula’s coastal region from Figueira da Foz to Gibraltar Strait, encompassing diverse coastal landscapes (
Figure 1). This area features coastal cliffs, expansive sandy beaches, and several estuaries and river deltas. It includes major cities such as Lisbon, Sevilla, Faro, and Cádiz. Notably, there are shallow submerged areas, particularly evident in the paleo-estuaries of the Guadalquivir, Tagus and Sado rivers, and along various coastal segments. In this area, recent changes in mean sea level have revealed a remarkable variety of situations, attributed to the complex tectonics [
23,
24].
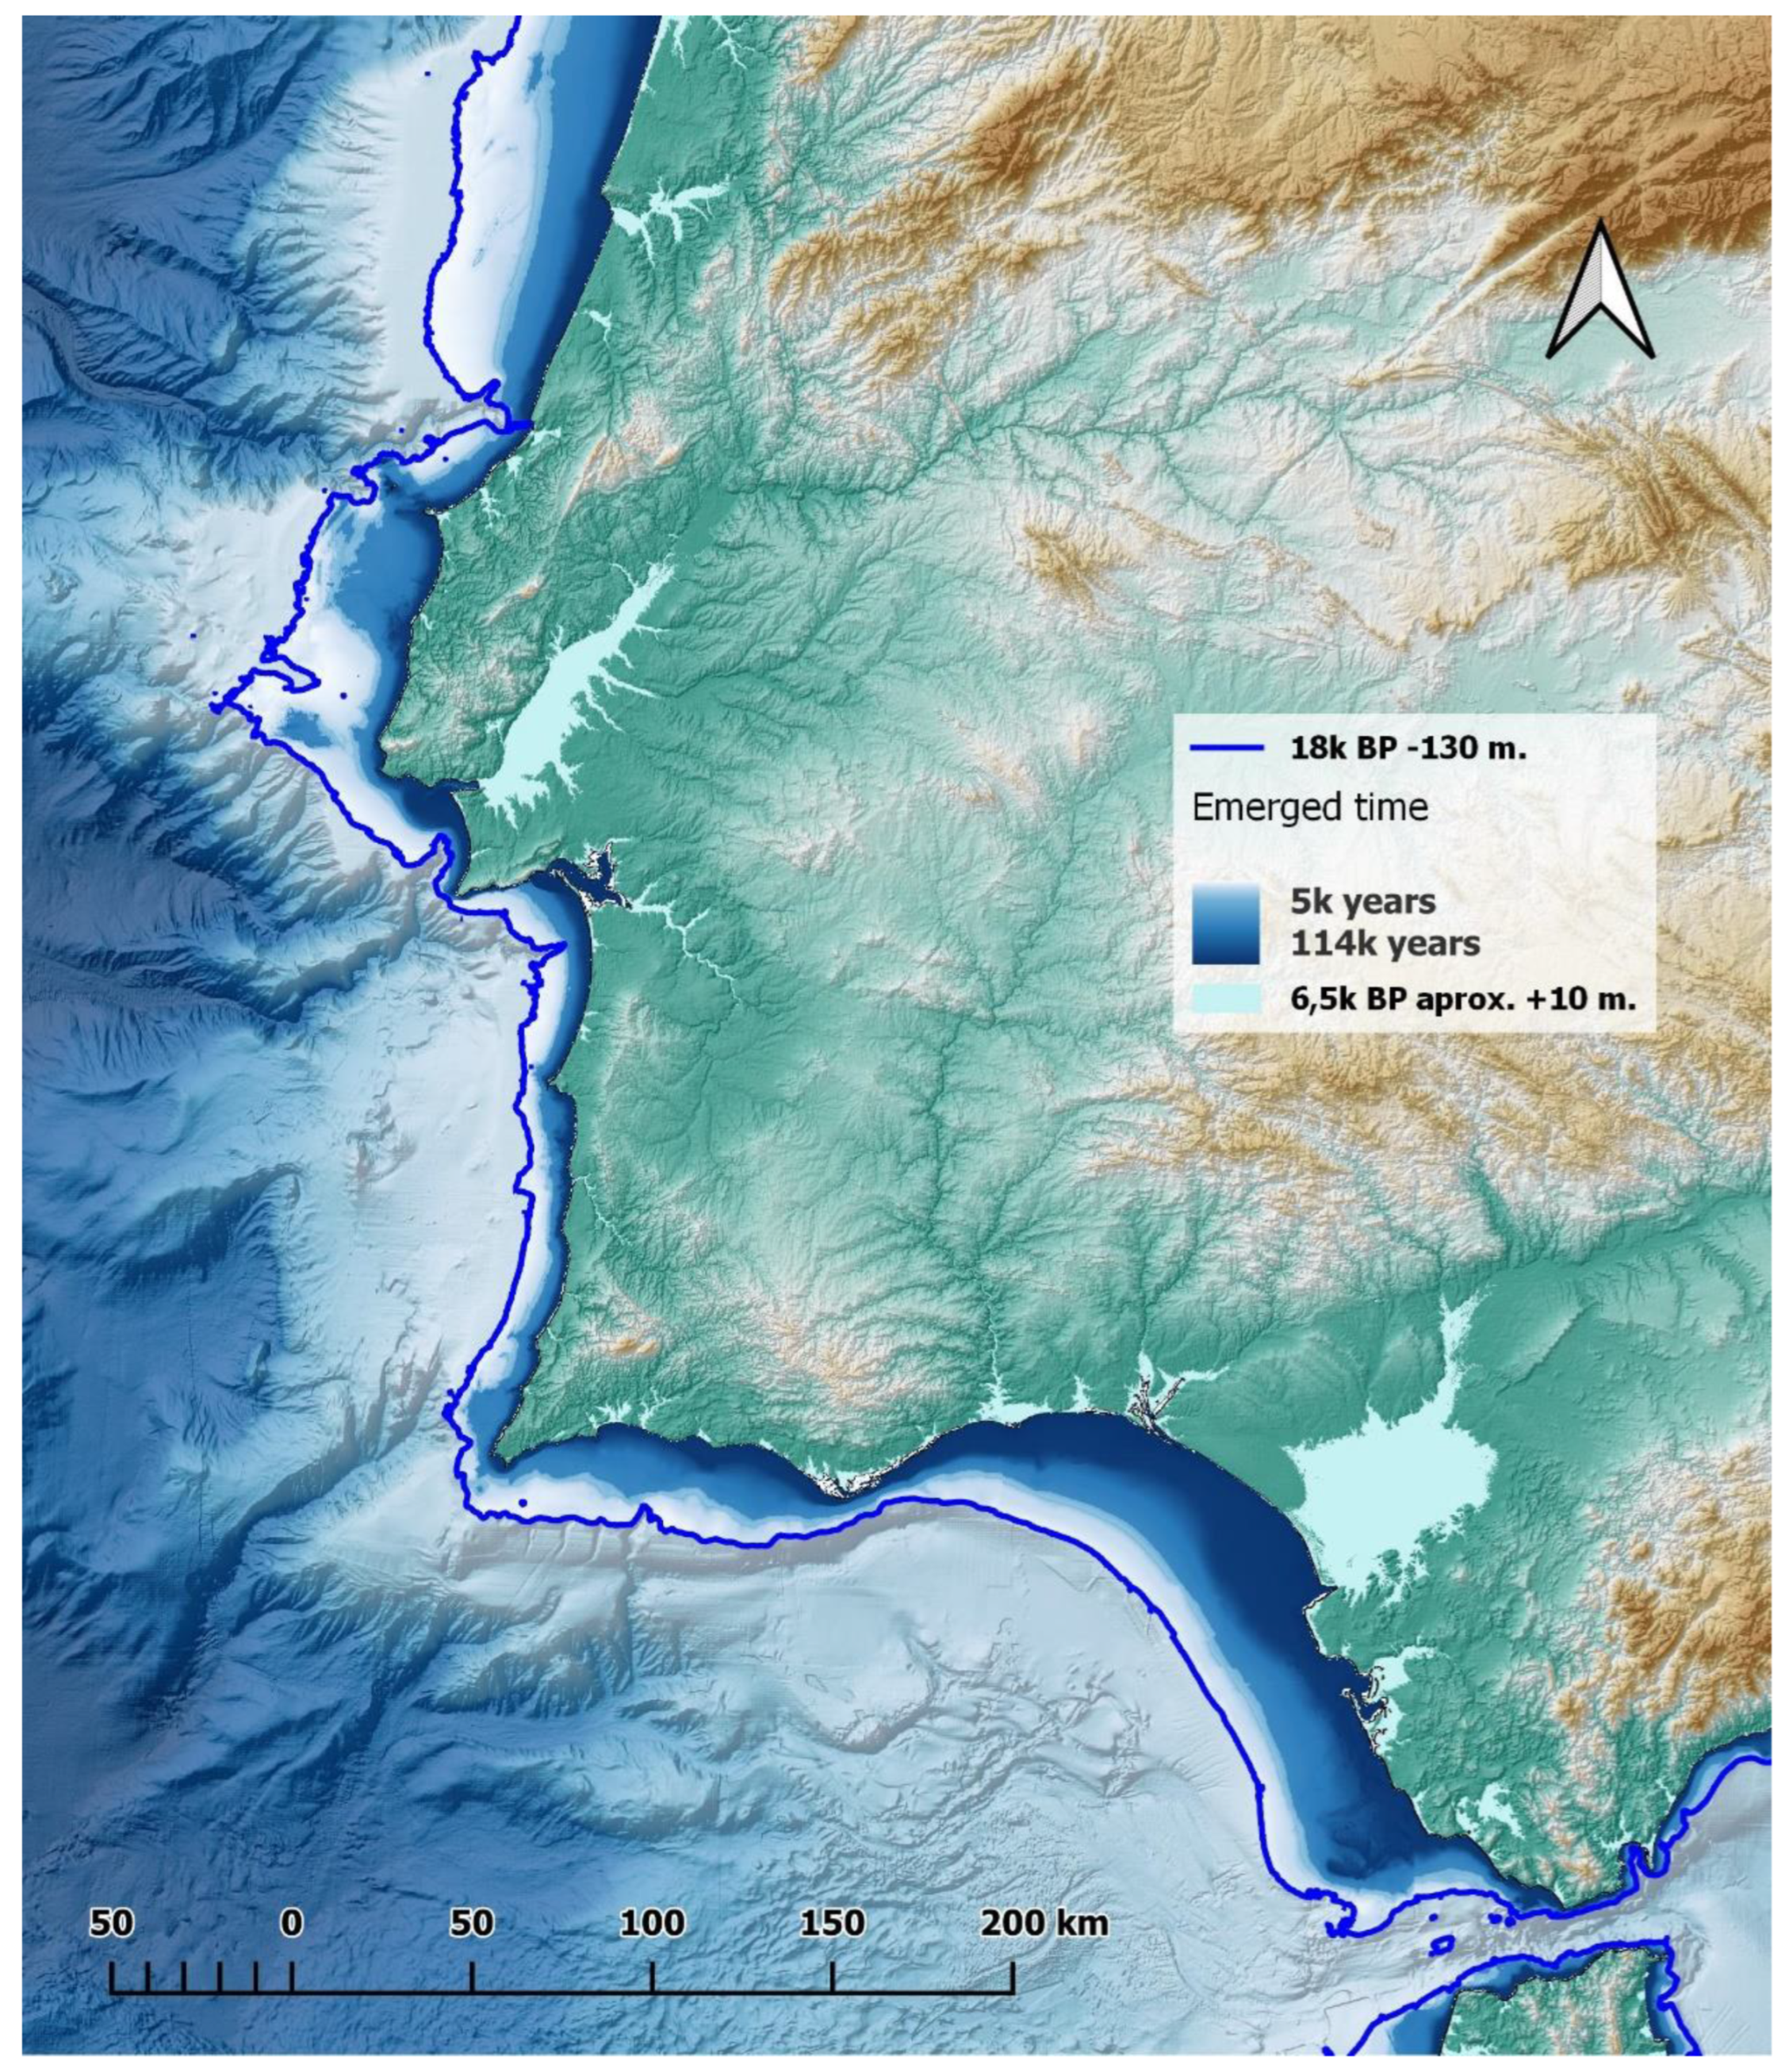
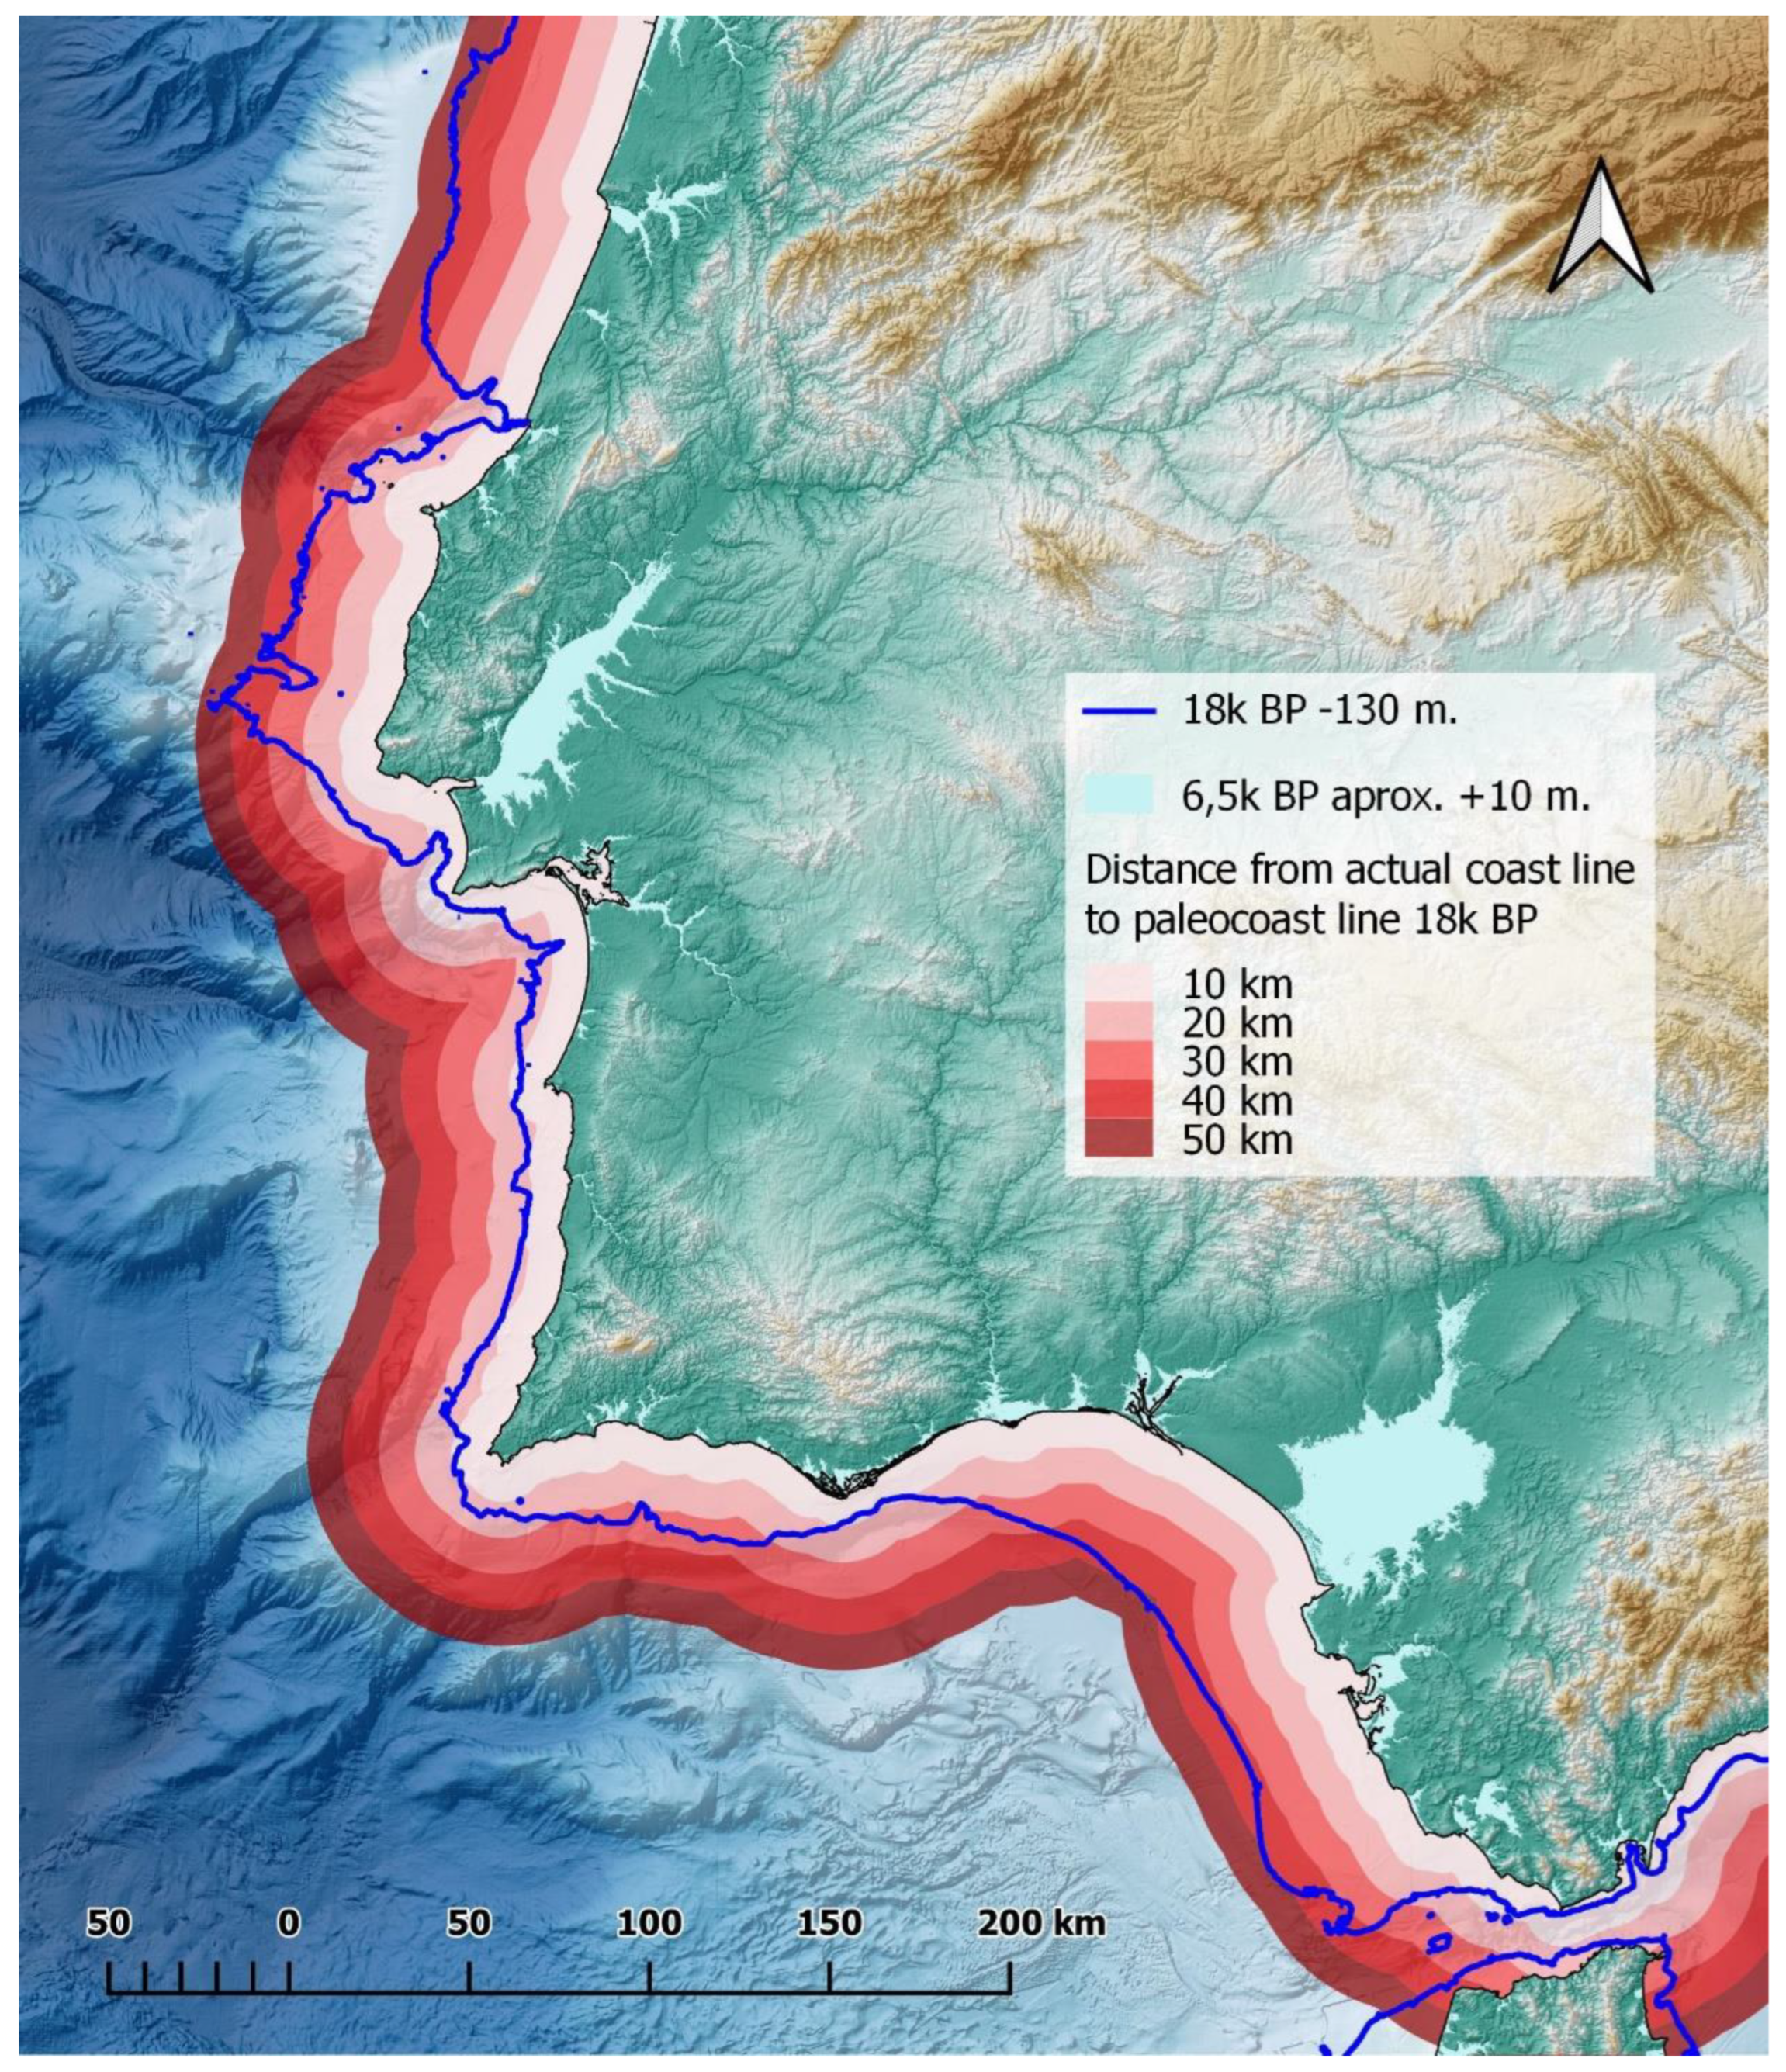
The −130 m bathymetric contour is situated within the continental shelf and delineates large areas of potentially emergent land, which in some parts of the southwestern region extend up to a maximum distance of 42 km from the paleo-coast of c. 18000 BP with respect to the current coast (
Figure 2). However, this broad strip of land has not remained emergent throughout the 114,000-year time span analyzed. Additionally, sea level fluctuations during this period have not been uniform, with a downward trend from c. 120,000 BP to c. 18,000 BP and an upward trend from c. 18,000 BP to c. 6,000–5,500 BP. Thus, the actual time that each part of the emergent land has been exposed is not homogeneous. The oldest and most recent dates of this chronological range (c. 120,000 BP and c. 6,000 BP, respectively) corresponded to sea level contours similar to the present one.
The former date corresponds to the last interglacial maximum, while the latter date approximately coincides with the recovery of the current coastal level after the Flandrian transgression, which peaked around 6,500 BP in the southwestern Iberian Peninsula [
25,
26], following 114,000 years of fluctuations [
27,
28,
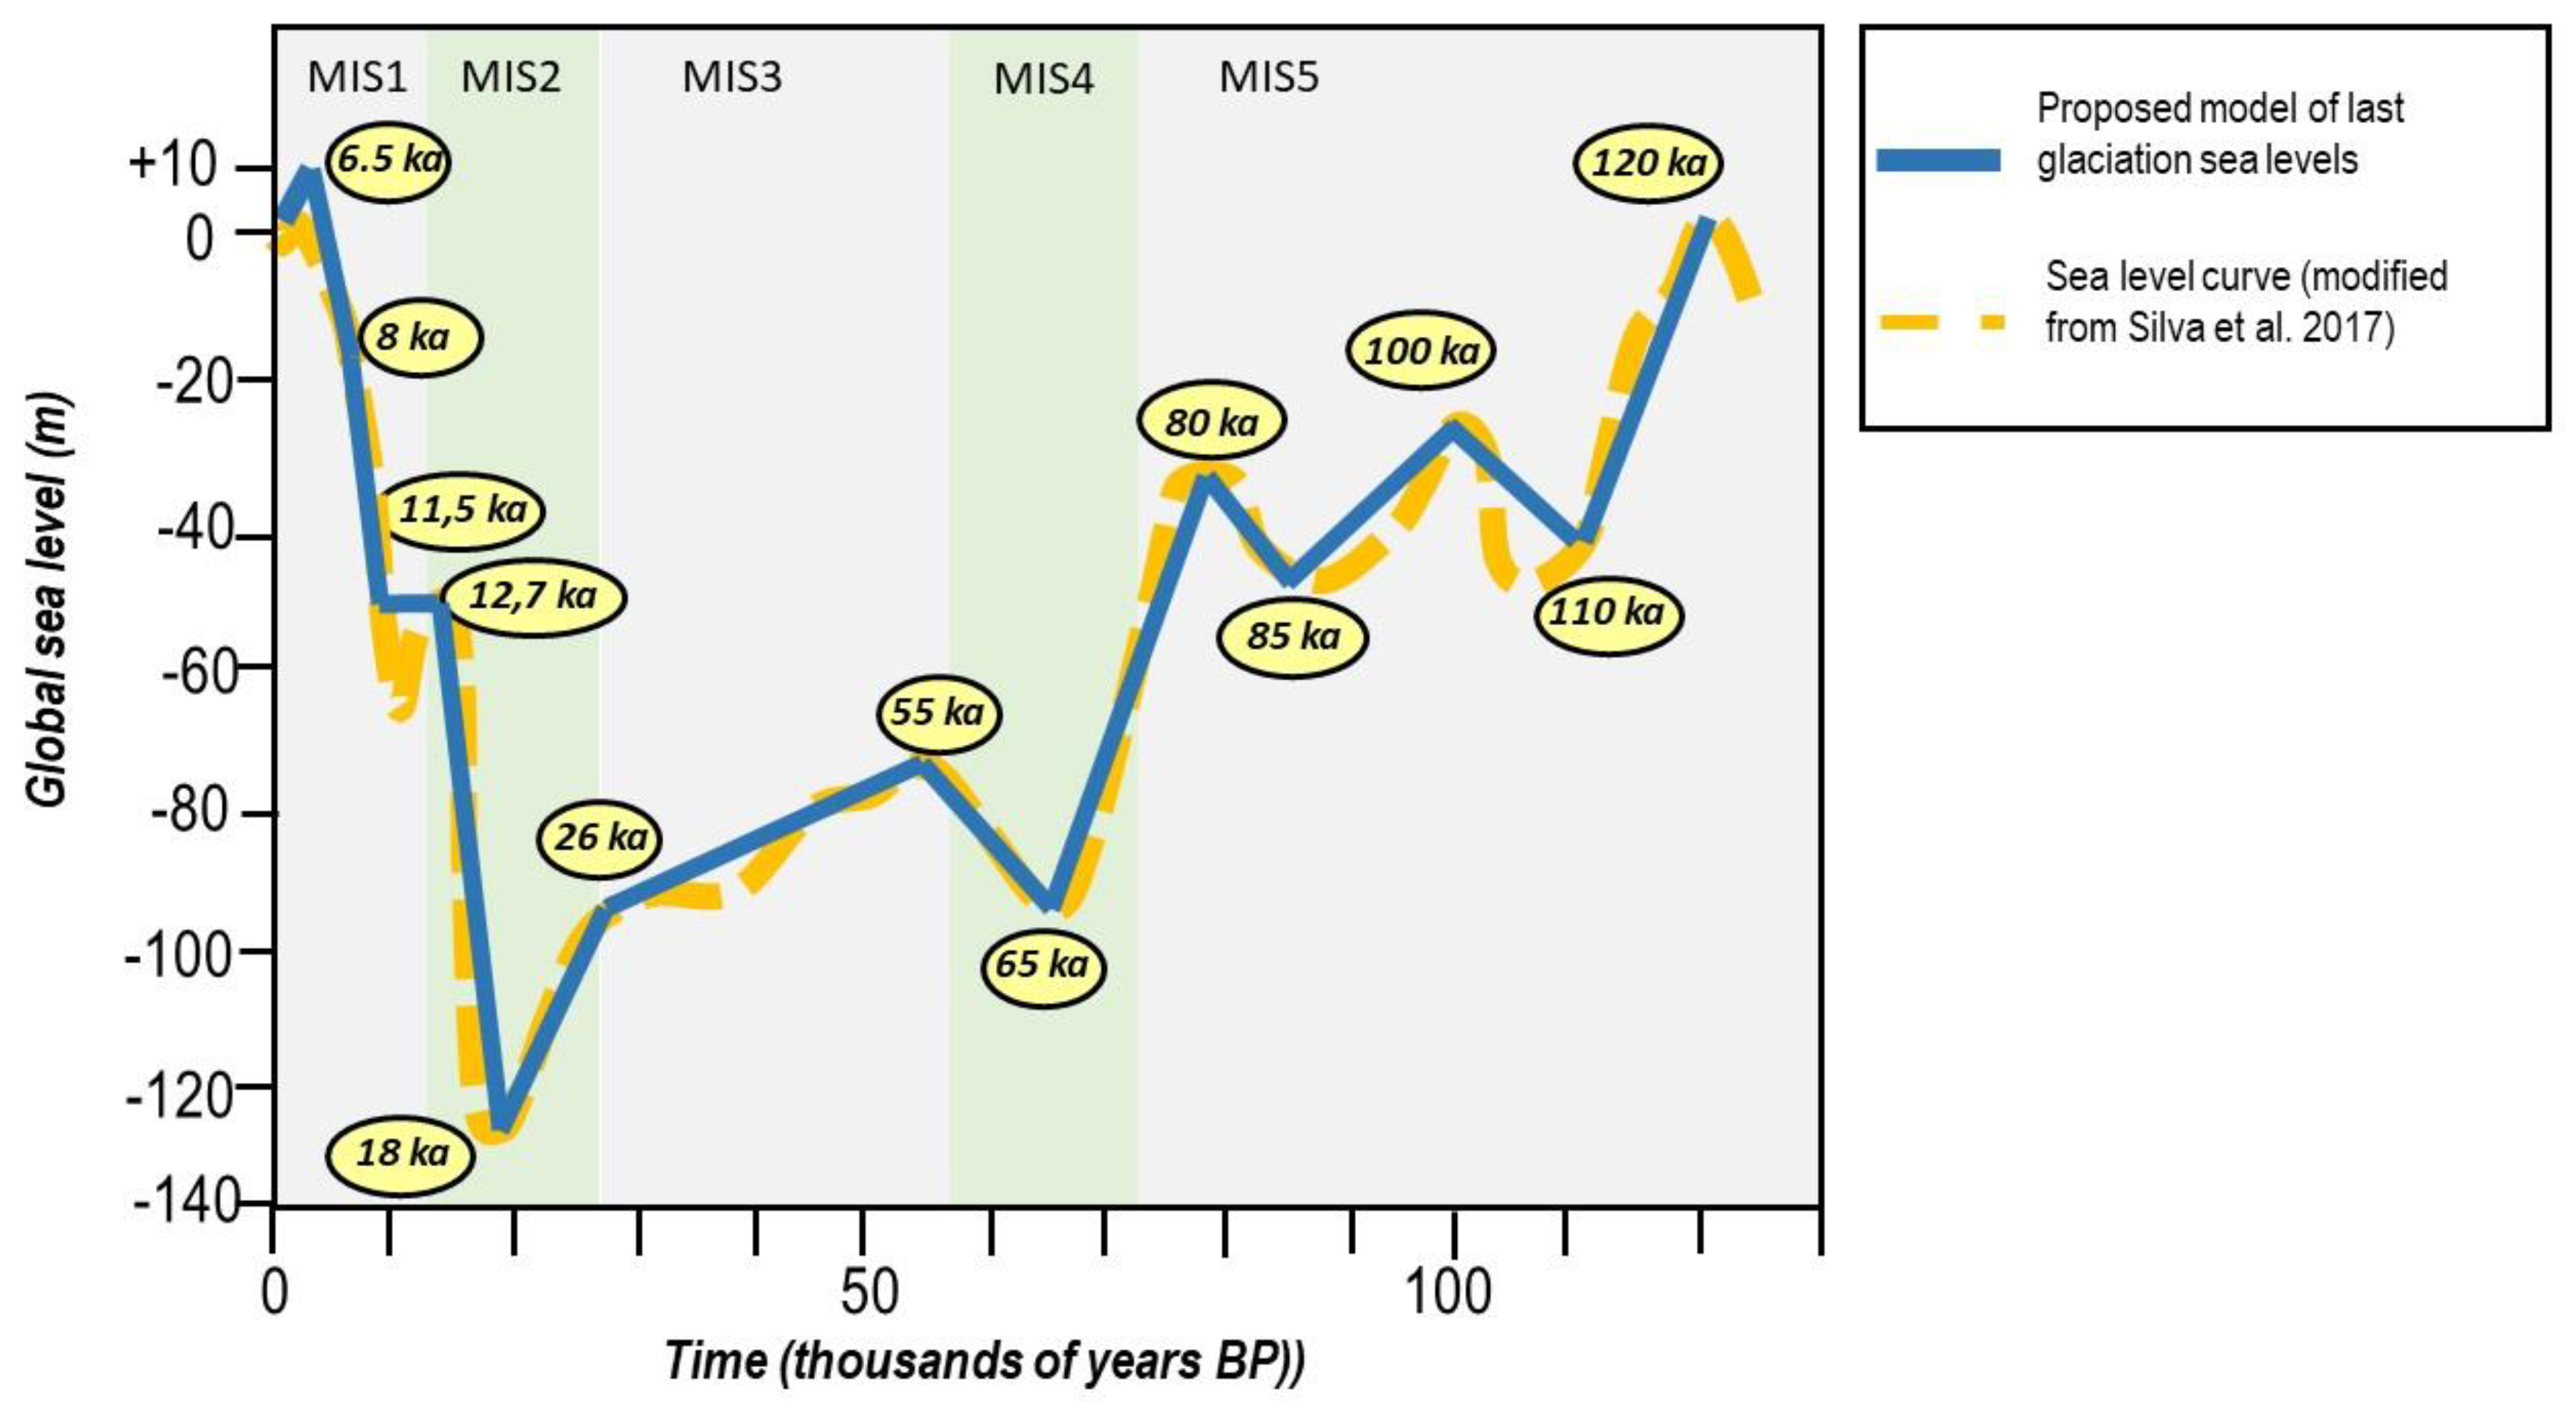
29]. We have proposed a series of sub-periods on the curve that would represent the ups and downs that occurred during the time span of analysis, with the aim of modeling in a simpler way, without reaching the absolute simplification of a single rise and fall, allowing us to calculate, through a less complex algorithm, the different annual rates of sea level loss or gain and their corresponding rise or fall rate (
Table 1;
Figure 3).
Table 1.
Annual rate in mm of sea level rise or fall in each proposed sub-period.
Table 1.
Annual rate in mm of sea level rise or fall in each proposed sub-period.
| Data BP |
Bathymetric elevation (m) |
Annual rate (mm/year) |
| 120000 |
0 |
0 |
| 110000 |
−45 |
−4.5 |
| 100000 |
−25 |
2 |
| 85000 |
−45 |
−1.33 |
| 80000 |
−30 |
3 |
| 65000 |
−95 |
−4.33 |
| 55000 |
−75 |
2 |
| 26000 |
−90 |
−0.517 |
| 18000 |
−130 |
−5 |
| 12700 |
−55 |
14.15 |
| 11500 |
−55 |
0 |
| 8000 |
−25 |
8.571 |
| 6000 |
0 |
12.5 |
Figure 3.
Sea level changes curve during the last glaciation and proposed sub-period model [
27] (
Figure 4).
Figure 3.
Sea level changes curve during the last glaciation and proposed sub-period model [
27] (
Figure 4).
During the study period, which encompasses parts of the Middle Paleolithic, the entire Upper Paleolithic and Neolithic period, and the beginning of the Chalcolithic period, spanning from 120,000 BP to 6,000 BP, the population of the southwestern Iberian Peninsula exhibited diverse patterns of settlement and subsistence. These patterns signify a variety of resource exploitation and territorial establishment strategies that encompass a wide range of possibilities. They range from occupations in caves and rock shelters during the Paleolithic phases [
30,
31,
32] to the emergence of large settlements towards the end of the Neolithic and Chalcolithic periods [
33,
34]. Additionally, smaller settlements were dedicated to the exploitation of terrestrial and marine resources, with a particular emphasis on Mesolithic shell middens located mainly in the paleo-estuaries of the region’s major rivers [
35,
36,
37].
The delimitation of the −130 bathymetric contour in the Andalusian and central-southern Portuguese Atlantic Ocean results in an area of unequal shape that does not parallel the current coastline. In the southernmost area of the study, a wide continental shelf is identified, extending more than 42 km from the current coastline in the Spanish provinces of Cadiz and Huelva [
27]. The Guadalquivir and especially the Guadiana rivers contribute significant sedimentary inputs in this region. South of the Portuguese province of Algarve, the width of the shelf decreases due to the proximity of Sierra Morena, a faulted flexure of the ancient Hercynian mountain range. This situation is also observed north of Cape St. Vincent in the western sectors of Algarve and Alentejo. In the mouth of the Tagus River, which currently functions as a wide estuary with essentially marine waters, the depths are considerably shallow. To the north of Lisbon, the shelf widens again, penetrating the sea gently, although it is cut in two by the Cascais Canyon y and the Lisboa-Setúbal Canyon.
2.1. Methods
The methodology consists of three steps. In the first step, an algorithm which simplify the sea level changes during the last glaciation period is applied. This method allows the determination of a paleo-coastline corresponding to any given date. In the second step, the goal is to identify properly dated coastal sites that correspond to the study period, in order to determine whether their occupation strategy may have been motivated by the exploitation of marine resources. A third step of the methodology involves calculating walking times between each identified site and the corresponding paleo-coastline for the given date.
An algorithm has been designed based on a curve that records the rises and falls that occurred during the period mentioned above [
28], which allows for the calculation of the time that currently submerged land remained emerged, which surfaced during these 114000 years [
27]. The algorithm also enables the determination of which paleo-coastline level corresponds to a specific date of interest.
2.1.1. Step 1. Determination of the position of the coastline at specific points in time
In the first step, 13 sub-periods were defined to simulate the main sea level changes identified in the literature. For each defined sub-period, an equation was applied to determine the time each 100 × 100 m grid cell of the marine digital elevation model had been emerged within that sub-period.
The formula is as follows in eq. 1:
where
tc is the emerged time of a cell in a given sub-period,
bc is the bathymetric elevation of the cell,
bi is the bathymetric elevation of the sea level at the start of the sub-period, and
ta is the annual rate of sea level rise or fall in that sub-period (expressed in meters) (
Table 1).
The total emerged time is obtained by summing all the values calculated for each cell in each sub-period (
Figure 4). Only one period has been identified in which sea levels were above their current position, around 6900–6000 BP, known as the Flandrian transgression. Although there is considerable scientific debate in the literature about the existence of this phenomenon globally, as it does not appear in all records of the planet, there is ample evidence that it did occur in the study area [
26,
38,
39,
40,
41].
Figure 4.
Map of the emerged land-time between the current coastline and the elevation of −130 m during the period from c. 120,000 BP to c. 6,000 BP.
Figure 4.
Map of the emerged land-time between the current coastline and the elevation of −130 m during the period from c. 120,000 BP to c. 6,000 BP.
Based on the previously described sea level curve, an algorithm was formulated to calculate the bathymetry and emerged time of the currently submerged surface, within the period of approximately 120,000 BP to 6,000 BP. Equation 2 was applied for each queried date to determine the position of the coastline at that time.
The equation is expressed in eq. 2:
where
pc is the position of the coastline at the queried date,
pa is the final position of the immediately preceding period,
ta is the annual rate of sea level rise or fall, expressed in millimeters (
Table 1) in the sub-period in which the queried date falls,
fa is the final date of the immediately preceding sub-period, and
fc is the queried date.
This algorithm allows for a precise determination of the position of the coastline at specific points in time during the study period.
2.1.2. Step 2. Relationship between each archaeological site and its paleo-coastline
To select the sample of radiocarbon dates to be studied, a SQL database query to the SIAC radiocarbon dating database was made, applying certain filtering criteria, both spatial and alphanumeric. To effectively link different past sea level elevations with human settlement and their economic strategies for exploiting marine resources, the radiocarbon dating database of prehistoric archaeological sites in the Iberian Peninsula [
42,
43] was utilized, which is integrated within the Shared Archaeological Information System (SIAC) project (
http://arqgeogis.us.es/siac). This repository contains more than 12,700 records from over 2,142 different sites, which are georeferenced and categorized by a basic functional typology. The criteria used to filter and obtain the radiocarbon dates that were part of the case study were as follows:
Chronological: The study began with dates whose calibration provided dates between 120,000–6,000 BP, which is the chronological range of the sea-level change curve used for this research (
Figure 3). The lower margin was slightly expanded to include a reading after the Flandrian maximum, up to 4,000 BP, in order to contrast with that moment.
Spatial: All the dates from the SW Iberian Peninsula that were within an area of 20 km inland from the current coastline were selected, including the coastline defined at the time of the Flandrian maximum transgression (c. 6,500 BP).
Typological: The dates resulting from the application of the spatial criterion were filtered to select only those that explicitly mention a functional typology of habitat or settlement. We excluded those of a funerary nature because we consider that their location in space, although in most cases linked to the corresponding habitat, can be found anywhere without any special or determining role in the economic strategy of territory exploitation.
Quality: In regards to this criterion, all dates with a deviation estimate greater than 100 years were eliminated.
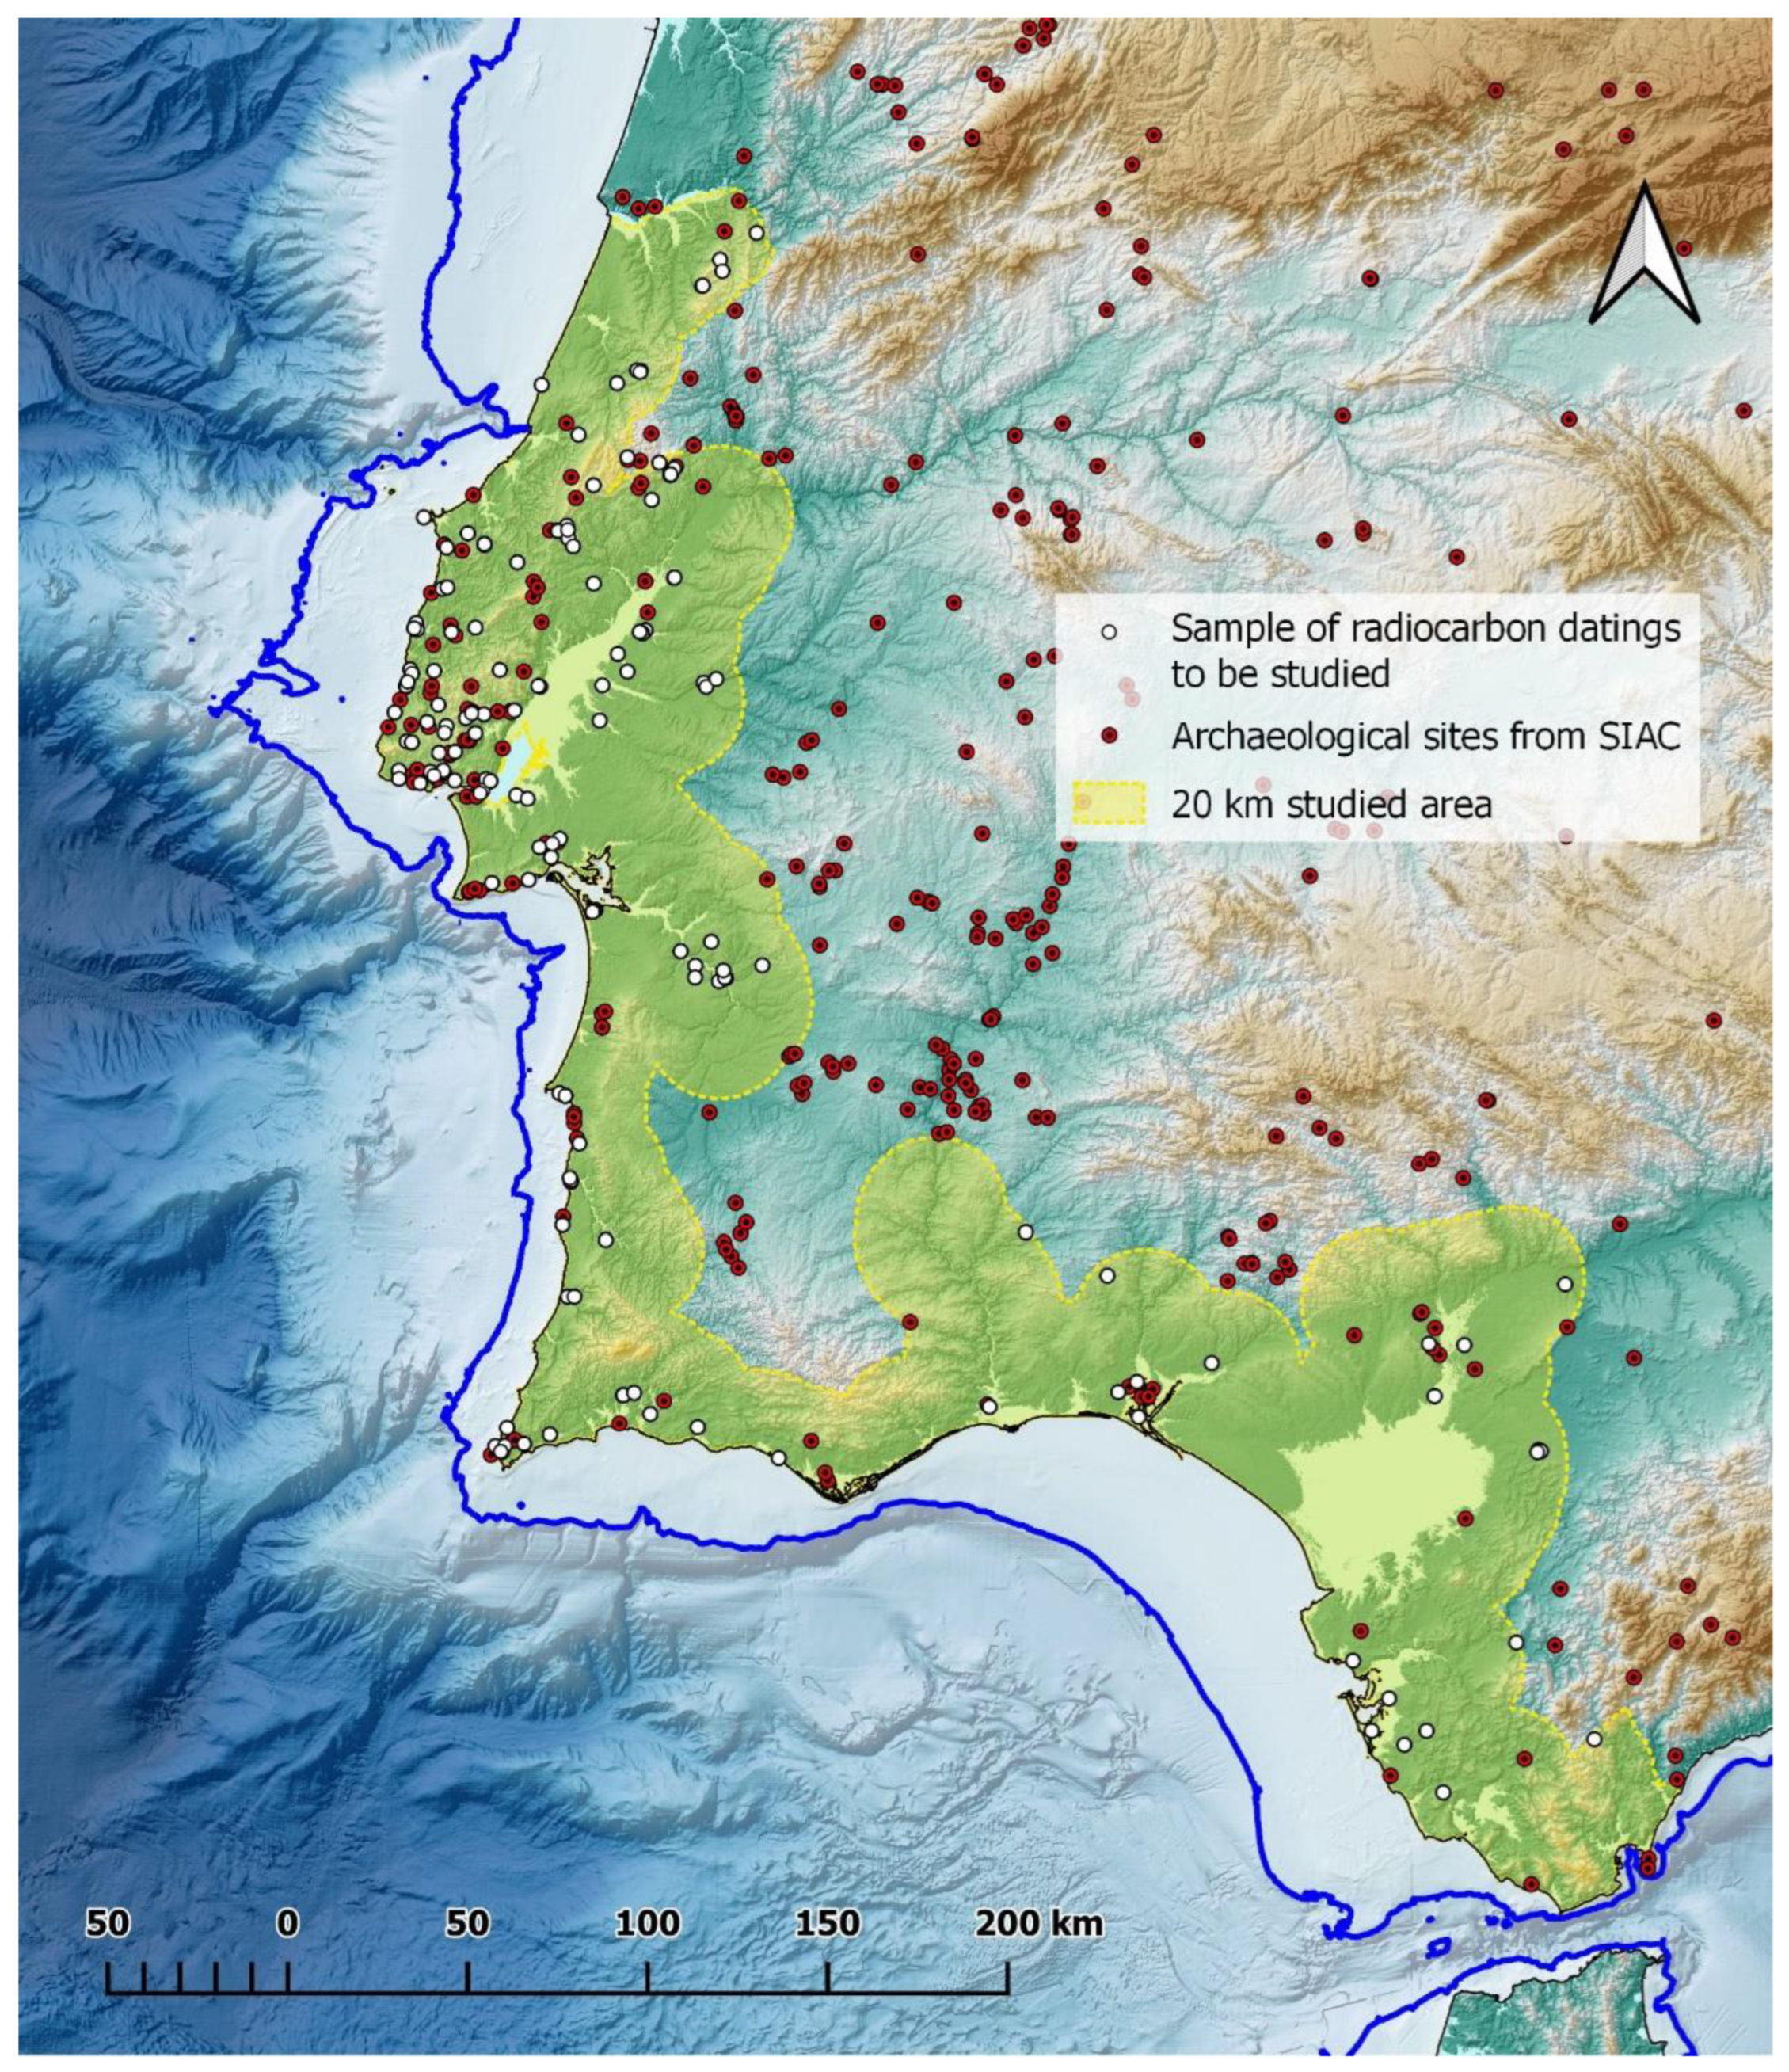
The final result of the application of the four described criteria was a sample of 1016 dates corresponding to 151 different sites, which were used to carry out the analysis of this study (
Figure 5).
The emerged land and its corresponding paleo-coastline were identified, and a considerable number of georeferenced radiocarbon dates from different sites were collected to represent the prehistoric reality of the Southwest Iberian Peninsula. Furthermore, at the end of this second step, each of the 1016 archaeological sites was accurately related to the paleo-coastline of the corresponding period.
Figure 5.
Location of the study’s radiocarbon dates in relation to available documentation for the SW region.
Figure 5.
Location of the study’s radiocarbon dates in relation to available documentation for the SW region.
2.1.3. Step 3. Distance of each site from its paleo-coastline during its determined life span
The next step was to determine the real distance of each site from the coastline during its determined life span based on the available radiocarbon dates, and to investigate whether the occupation strategy was motivated by the exploitation of marine resources or not, along with the temporal accessibility of those resources.
The time it would take for a human being to travel a certain distance has been a topic of interest in numerous studies, which have proposed different models and calculation methods [
44,
45,
46,
47,
48,
49], and have analyzed the different models to determine their validity and accuracy [
50].
Several studies have attempted to offer a concrete proposal from an archaeological perspective regarding the time it would take a human being to travel the distance separating them from the resources they intend to access [
51,
52,
53,
54]. There is also a wide diversity of proposals and methods for calculating distances and costs. In this study, the criteria established by the MIDE (Method of Excursion Information) developed by Paris Roche [
55] for the FEDME (Spanish Federation of Mountain and Climbing Sports) was applied. This anisotropic method is based on rules that determine the distance/time relationship for traveling a horizontal distance as 4 km/h, to which 1 hour is added for every 400 m of uphill elevation or 600 m of downhill elevation.
The archaeological sites under study were represented in five different time intervals, based on the aforementioned criteria, which correspond to a classification of greater or lesser proximity and accessibility to the sea, and therefore to marine resources.
It was considered that a time of 3 hours or less to travel the distance between the site and its paleo-coast indicates the possibility of the exploitation of marine resources as part of the economic strategy, as it would allow for going to the site, performing the activity, and returning in a single day. Times greater than 4 hours would invalidate that strategy, while times between 3 and 4 hours could be considered suitable for accessing those marine resources exceptionally within the general economic strategy of the site.
To calculate the distance between each site and its corresponding paleo-coastline, the filtered radiocarbon dates from each site were cross-referenced with the tables stored in SIAC. The tables contain the different paleo-coastlines assigned to a specific date on an annual scale, based on the previously applied criteria. Each calibrated radiocarbon date is associated with the corresponding paleo-coastline by taking the mean between the maximum and minimum values of the 2-sigma calibration.
Within the SIAC database, two algorithms were programmed to find the closest point on the paleo-coastline that corresponds to each site based on its calibrated radiocarbon date and the distance between the site and the calculated point. The distance of each site, recorded at each calibrated radiocarbon date, was measured in meters and subsequently converted into walking time. This conversion allowed to categorize the sites based on their accessibility to marine resources, and to determine whether their economic strategy may have been influenced by the exploitation of these resources.
Upon identifying the distances from each site to its corresponding paleo-coast, an assessment was conducted to determine which coastal sites (such as shell middens) were situated at distances exceeding a 4-hour walking time, which were subsequently identified as “anomalous behaviors” within the developed model.
To analyze the temporal distribution of radiocarbon dates recorded in SIAC and as part of this research, an examination was conducted to identify potential biases or temporal imbalances in the dataset that could lead to misinterpretations. To address this, Summed Calibrated Radiocarbon Date Probability Distributions (SCDPD) were constructed. Notably, traditional calibration software such as Calpal and OxCal were avoided due to their inability to account for the influence of repeated dating within the same archaeological context. Instead, the SCDPD employed the methodology outlined by [
56,
57], which relies on an algorithm that selects the most probable radiocarbon date in cases of date overlap, ensuring that each coinciding time span is counted only once for each archaeological site. Additionally, the study distinguished five distinct areas based on two primary criteria: the extent of sea-level regression to 18,000 BP (the maximum glacial period) and the coastal morphology, with the objective of ensuring that each sector exhibited as similar characteristics as possible. Special consideration was given to the paleo-estuary areas of the Tagus and Sado rivers due to their unique characteristics and the typology and chronology of documented settlements.
3. Results
Results illustrate the accessibility time to the coastline based on the studied deposits in the coastal environment. Areas with deposits exhibiting anomalous behavior concerning their expected location relative to the distance from the current coast or their paleo-coast are highlighted.
A predominance of deposits situated less than 3 hours from their paleo-coast is observed, with a particularly high abundance of deposits located less than an hour away from their paleo-coast. However, some deposits are situated more than four hours away.
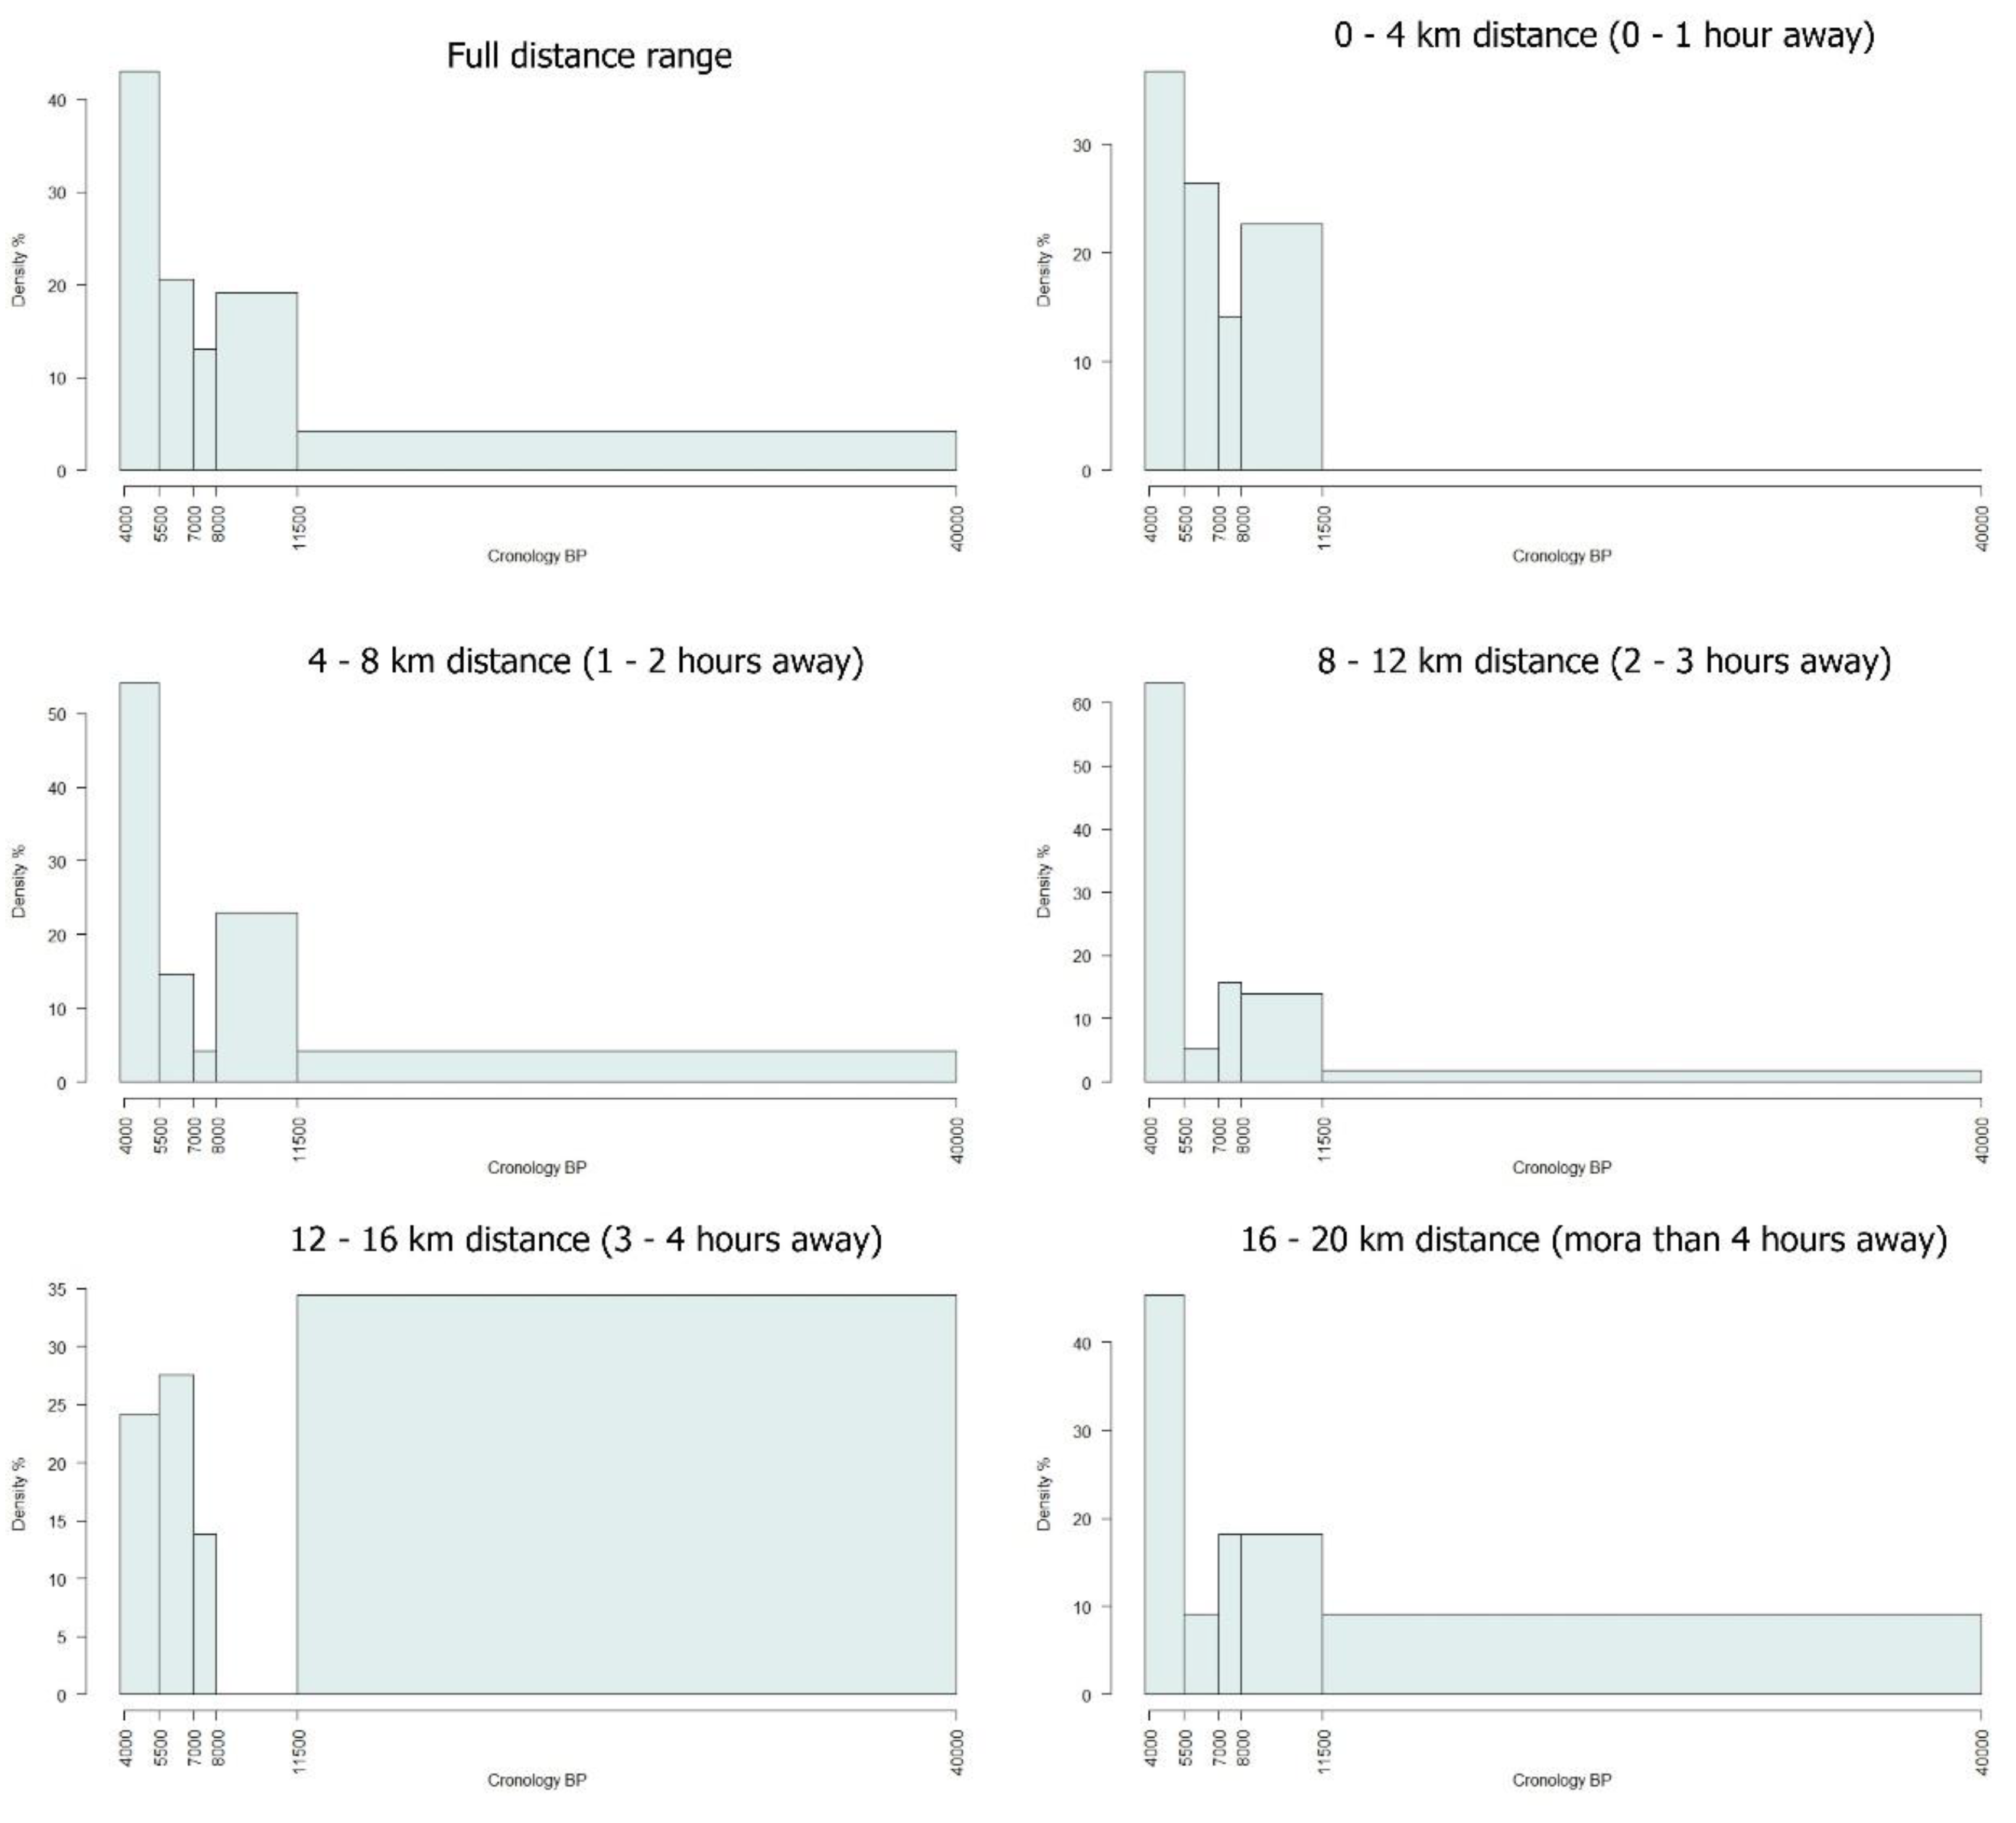
When observing the histograms representing the density of sites in relation to their distance from the coastline during their respective existence periods (
Figure 6), it is evident that in the period exceeding 11,500 years BP, which corresponds to the pure Paleolithic, most sites are situated between 12 and 16 km from the coastline, with none located within less than 6 km. In the preceding period, from 11,500 to 8,000 BP, corresponding to the Mesolithic era, the majority of sites are positioned at a distance of 2 to 4 km from the coast, with those situated within less than 2 km being much less frequent (around 20%). Similar results are observed for the period of 8,000–7,000 BP, representing the early Neolithic prior to the Flandrian Transgression. In more recent periods such as 7,000–5,500 BP and 5,500–4,000 BP, which encompass the remaining Neolithic during the Flandrian Transgression, including the beginning of the rise, its peak, and subsequent decline, as well as the Chalcolithic period, the most frequent sites are found at distances less than 2 km from their respective paleo-coasts.
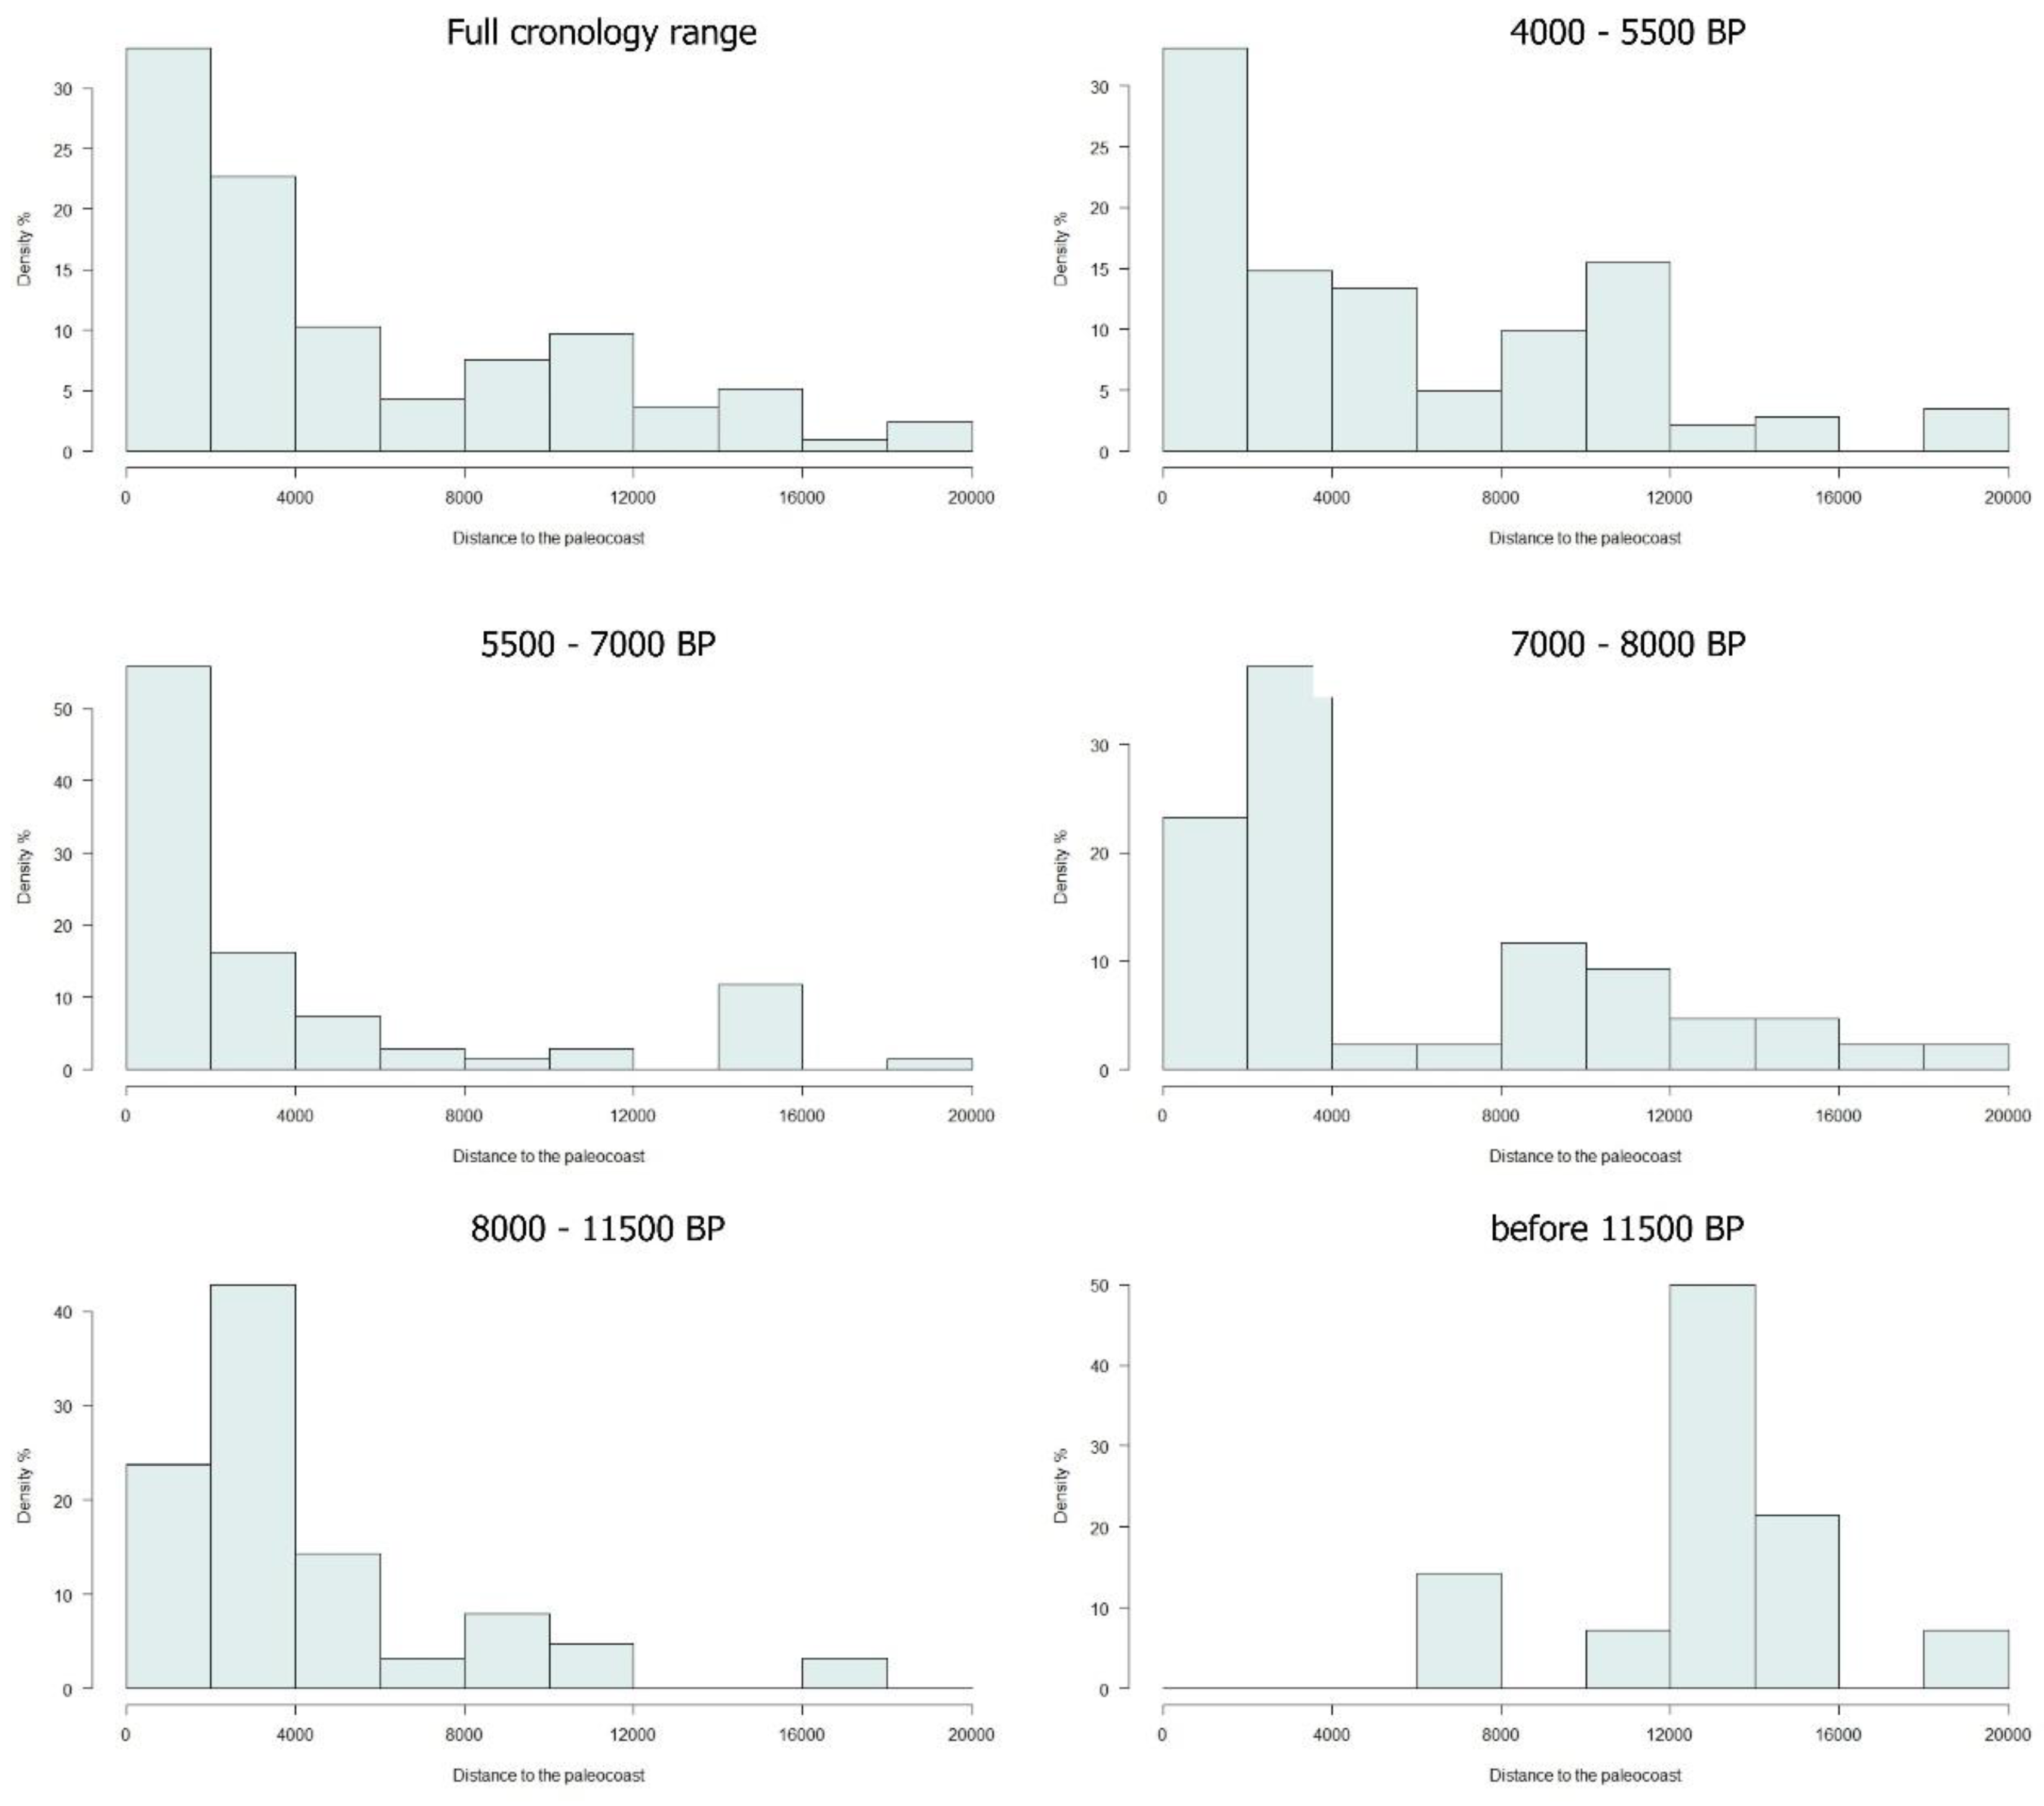
When examining the histograms representing site density in relation to their chronology (
Figure 7), a noteworthy pattern emerges. During the three periods of study predating 5,000 BP (more than 11,500 BP, 11,500–8,000 BP, and 8,000–7,000 BP), a consistent site density is observed for distances exceeding 12 km from the paleo-coastline. However, as shorter distances are considered, older archaeological sites tend to diminish in number, almost disappearing entirely within distances less than 4 km. This pattern underscores the potential submergence of older sites due to rising sea levels and indicates a correlation between site age and proximity to the ancient coastline.
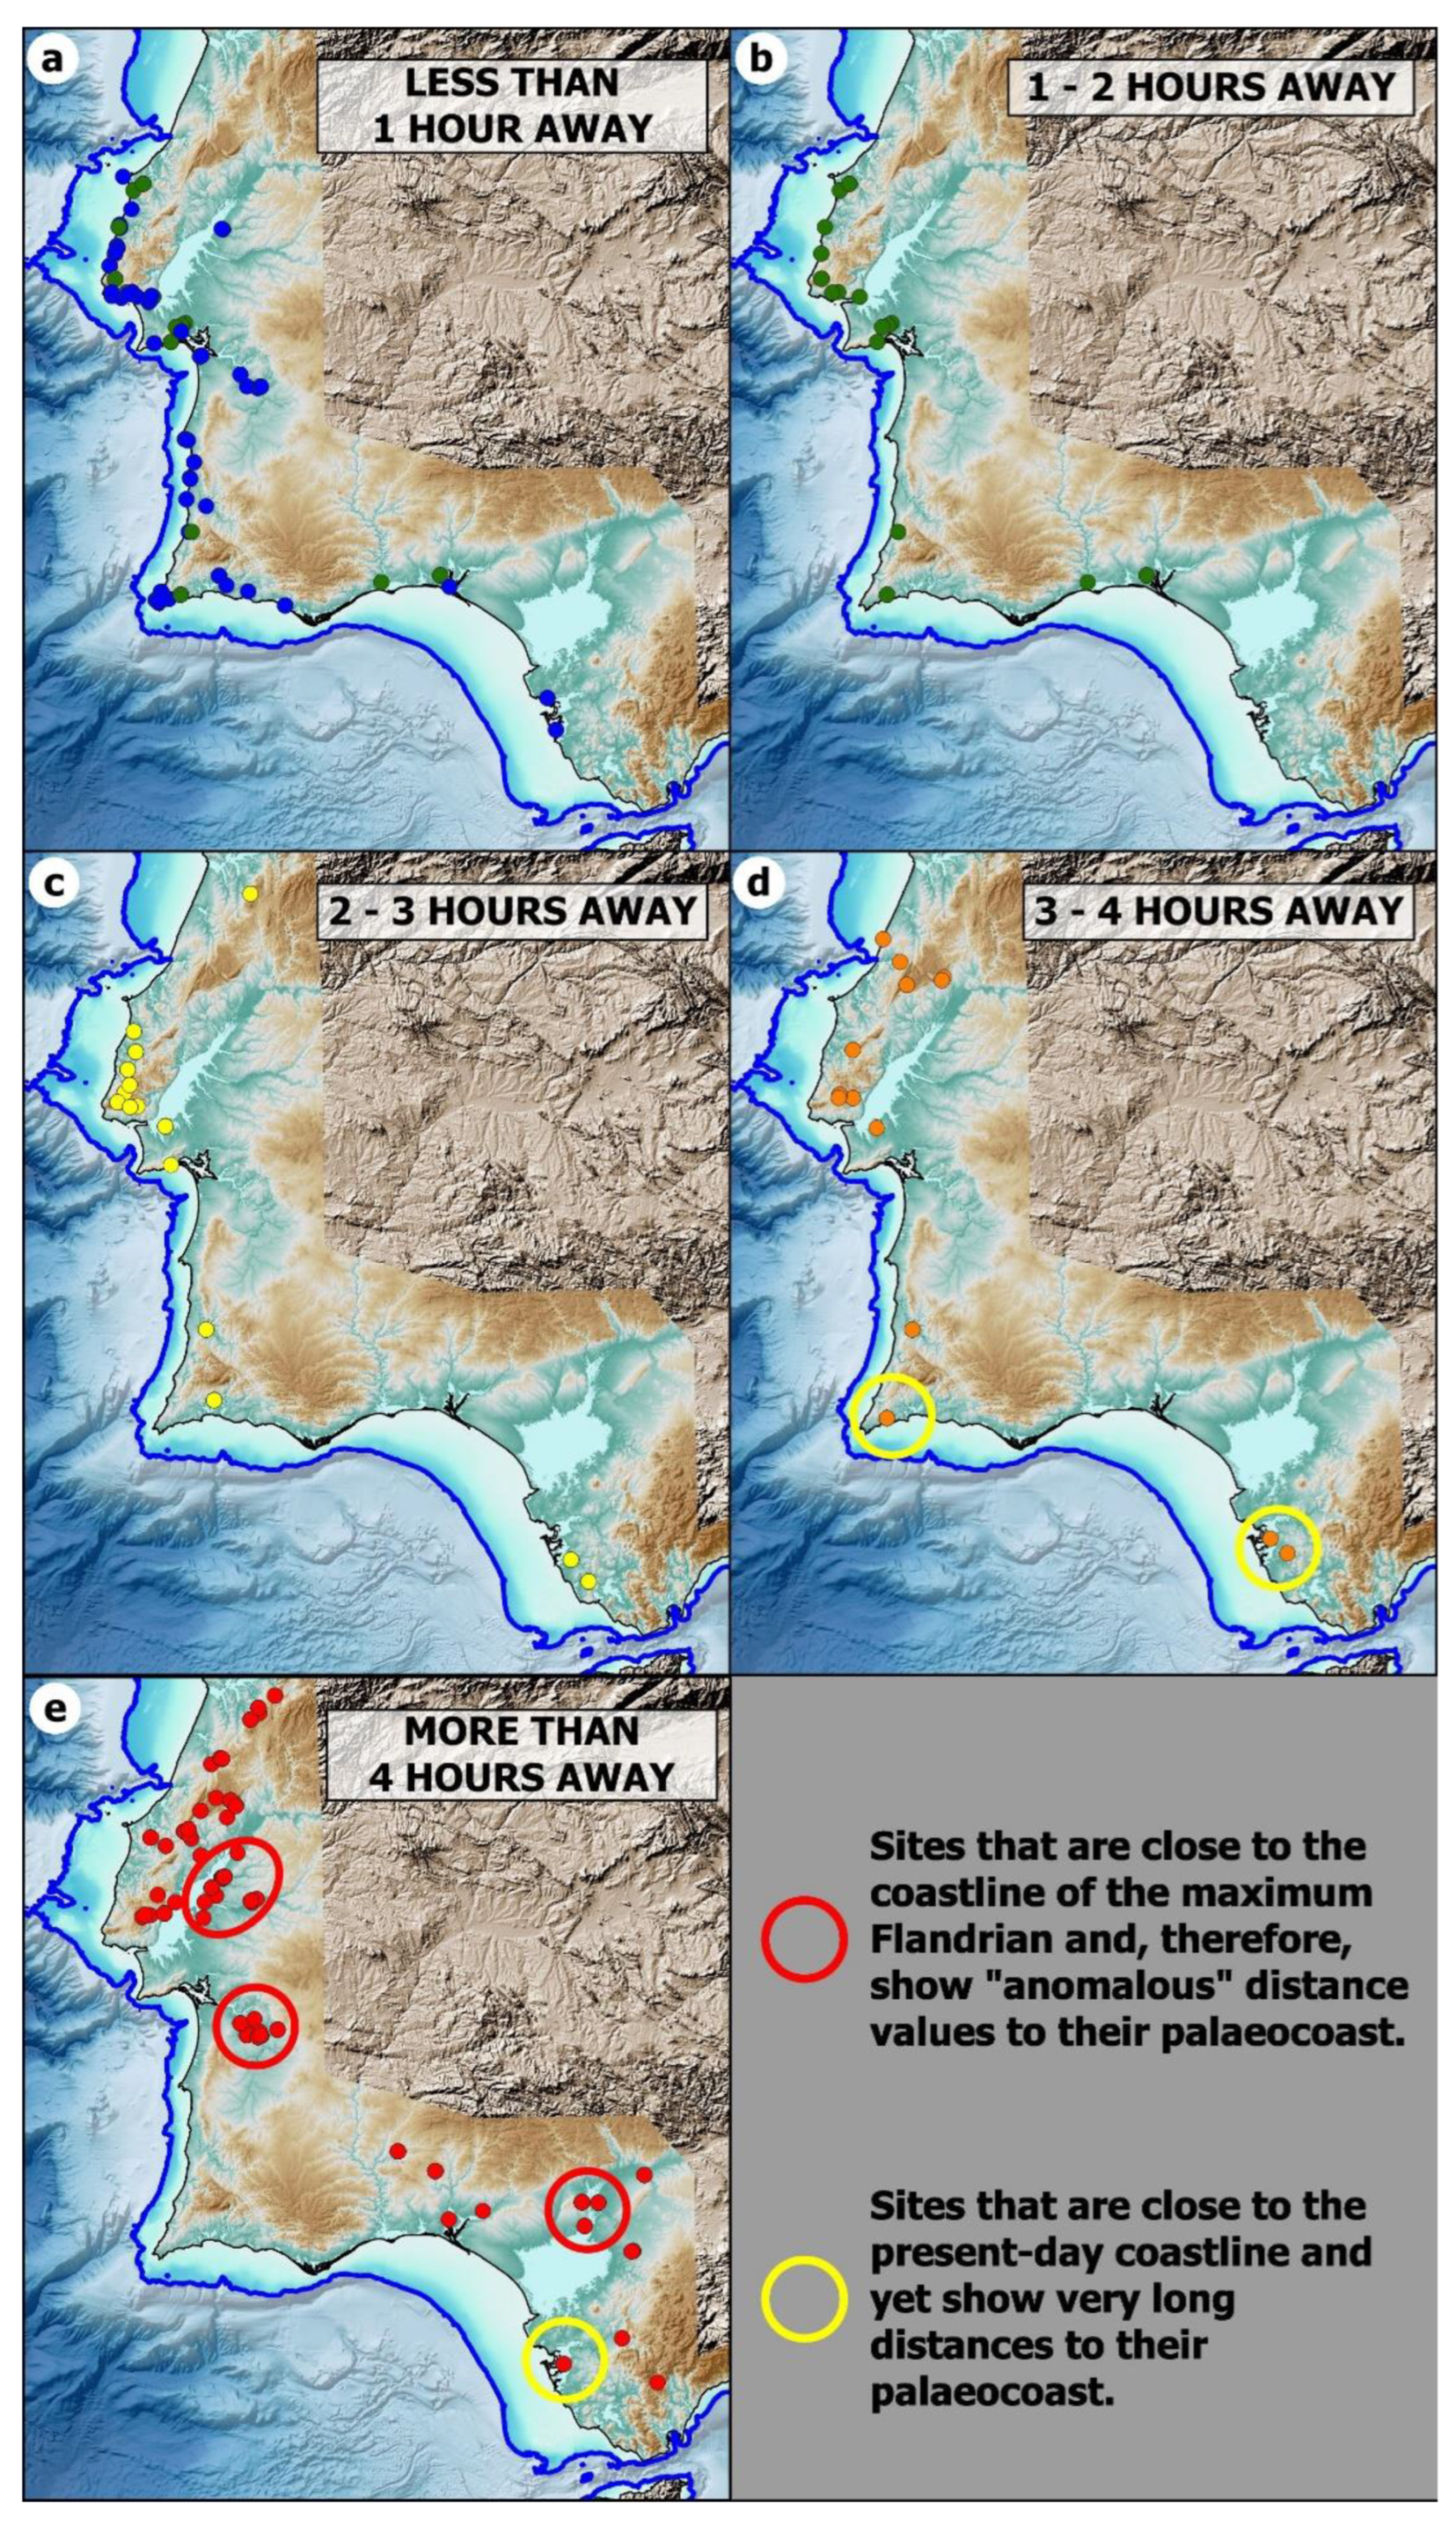
The Tajo-Muge and Sado shell middens can be seen in the maps of deposits that are less than 1 hour away (
Figure 8a) and those more than 4 hours away (
Figure 8e). The same phenomenon is observed in the pale-oestuary of the Guadalquivir (
Figure 8e), where a series of deposits, including Valencina, are more than 4 hours away from their paleo-coast. In the maps of 3 to 4 hours and more than 4 hours, Vale Boi in Portugal and El Retamar at the mouth of the Guadalete (
Figure 8d and
Figure 8e) are marked. Both deposits are practically on the current coast and yet have a very distant distance to their paleo-coast.
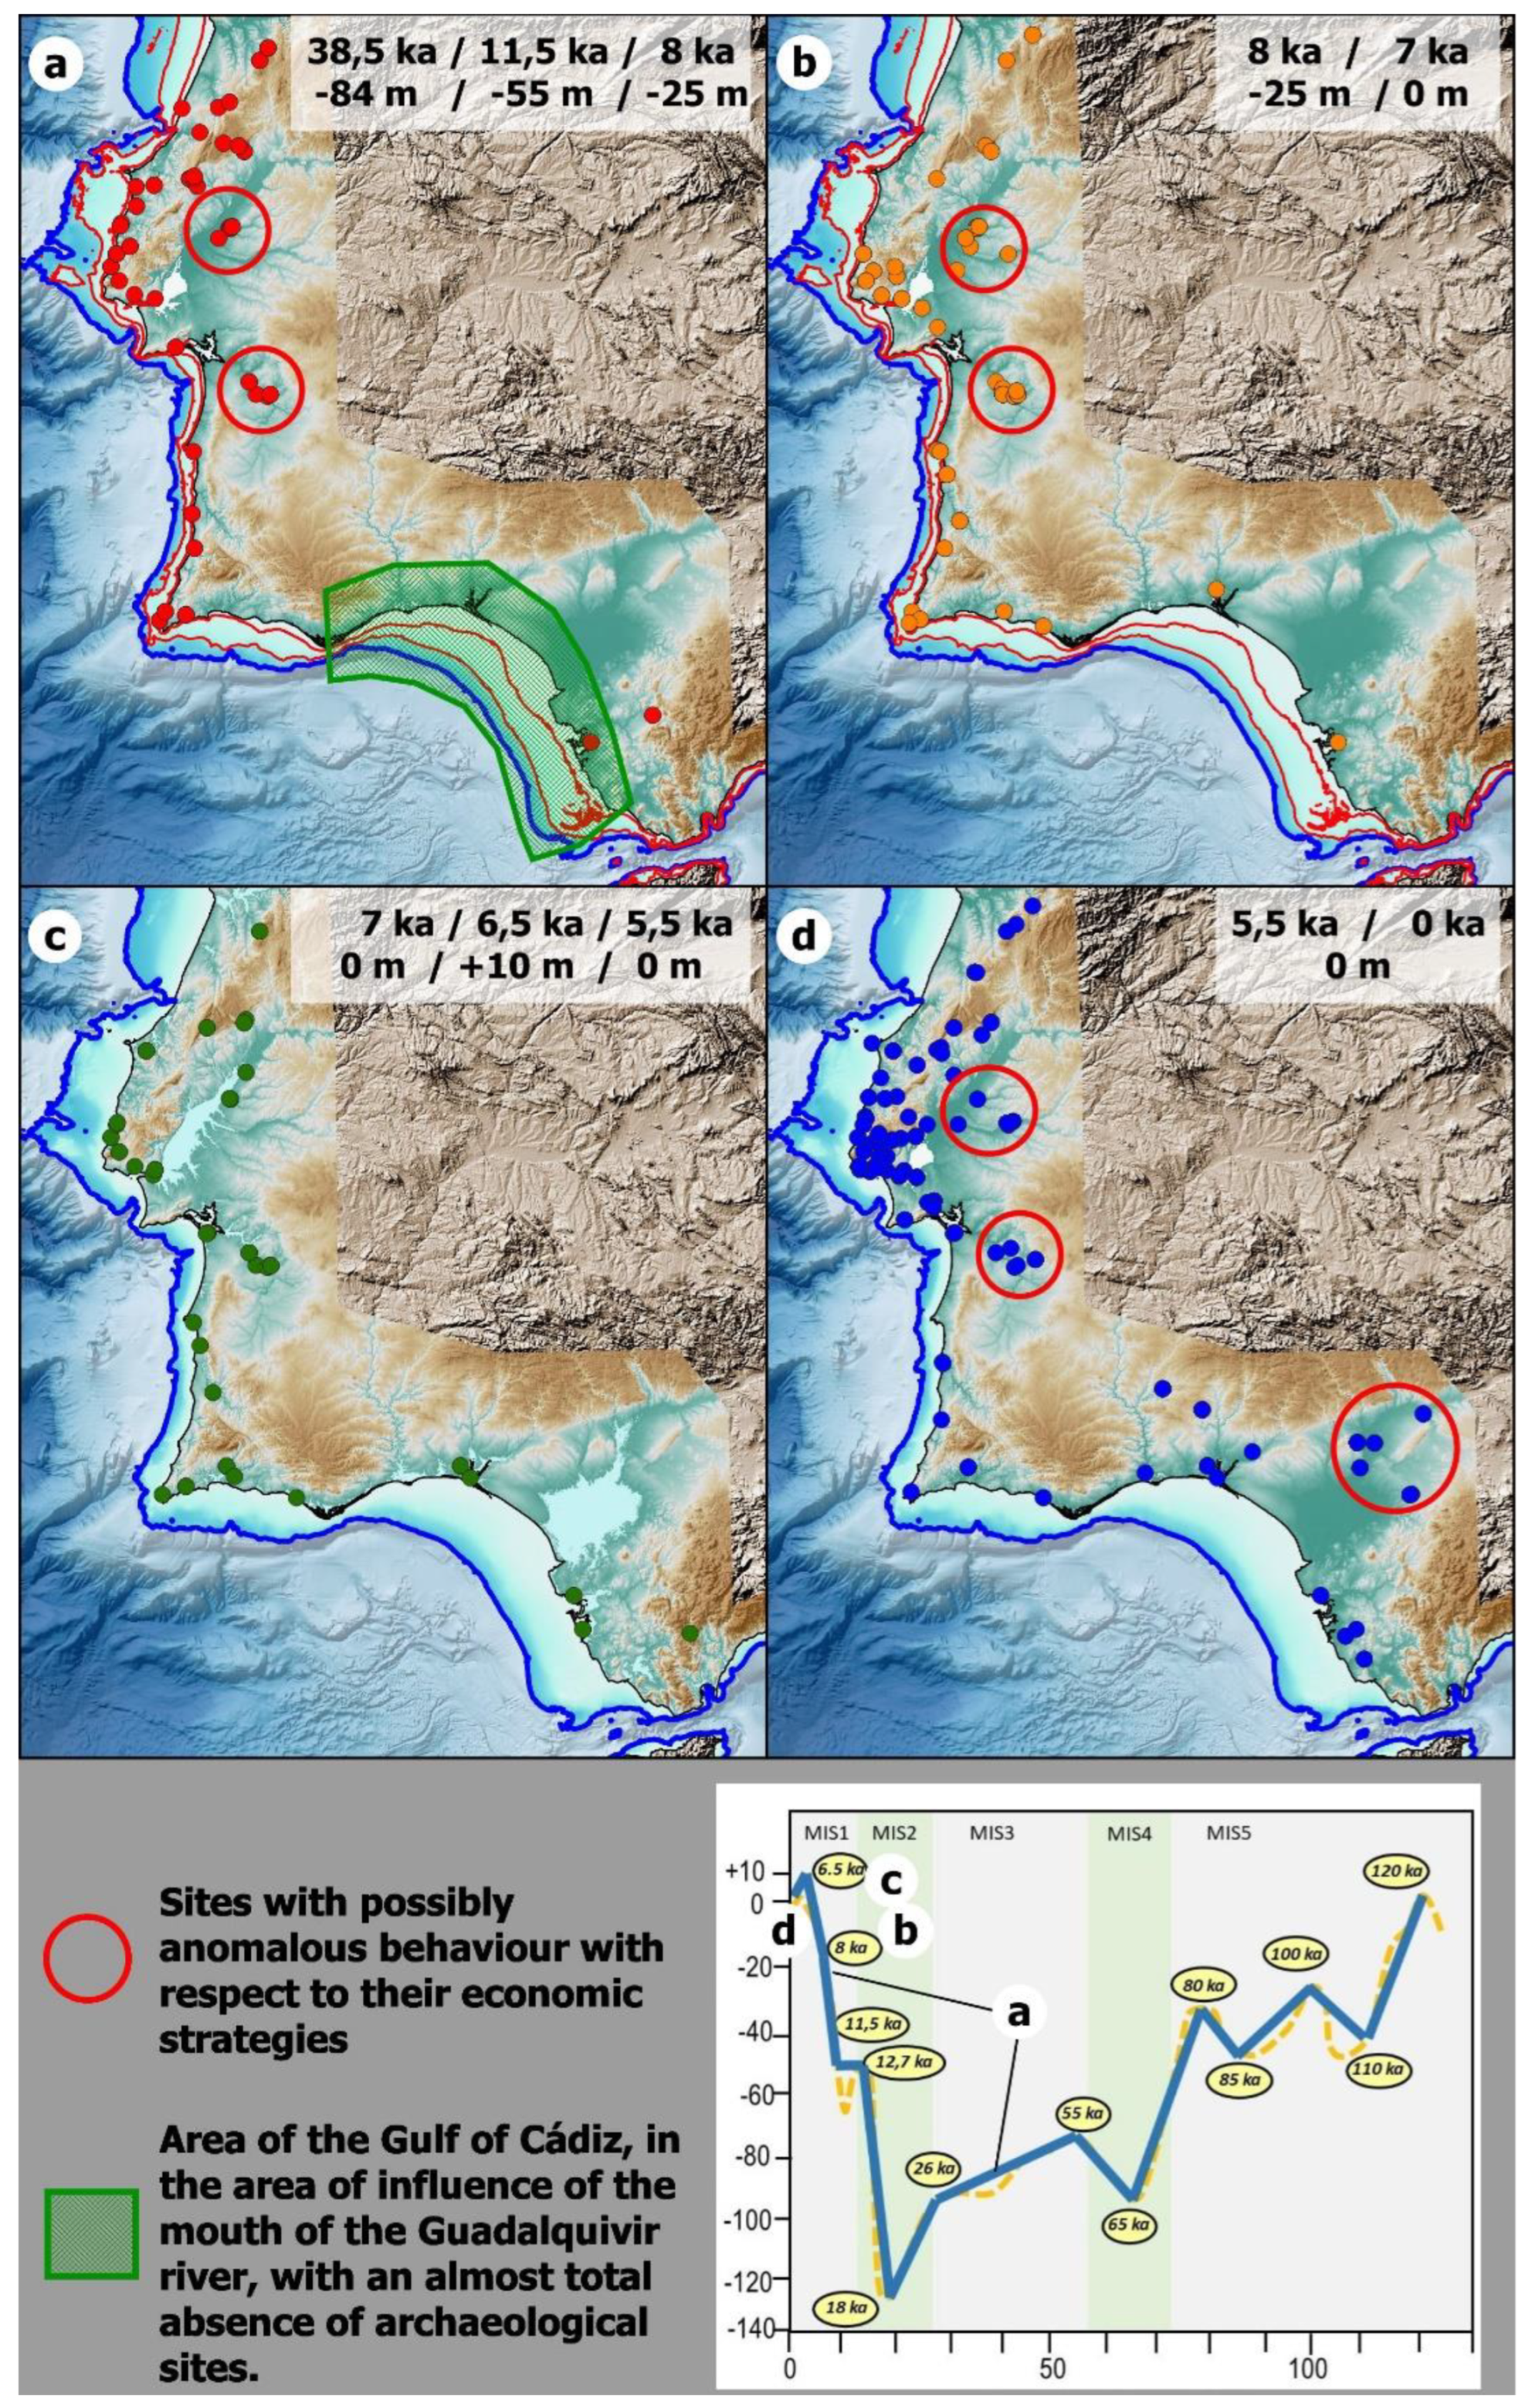
Figure 9 displays the behavior of the deposits in relation to their distance from their paleo-coast, taking into account the different chronologies recorded within them. Four chronological periods are shown, corresponding to significant changes documented in the sea level rise and fall curve (
Figure 3). It is observed that, in general, deposits belonging to older periods tend to be situated closer to the current coastline, although several hours away from their paleo-coast.
The distribution of deposits corresponding to the period of an apparently higher sea level identified in the Flandrian maximum presents a more irregular spatial distribution, although the majority of the deposits are located less than two hours away from the Flandrian coastline.
The areas marked with a red circle in
Figure 9 repeat those indicated in
Figure 6, except for the El Retamar and Vale Boi deposits. These include the Tajo-Muge and Sado shell middens and the deposits surrounding the Guadalquivir mouth during the Flandrian maximum.
In general, the Summed Calibrated Radiocarbon Date Probability Distribution (SCDPD) for the entire study area in the southwestern Iberian Peninsula reveals two prominent peaks around 8000–7000 BP and 5000–4000 BP. Moving to specific regions, the northern area of Cabo Raso (
Figure 10a) exhibits a relatively consistent occupation pattern over time, with a notable increase during the Chalcolithic period, as previously observed when analyzing radiocarbon date distributions across the entire southwestern Peninsula. Moreover, this region boasts the highest concentration of cave settlements in the entire southwestern area. Conversely, the paleo-estuary areas of the Tagus and Sado rivers (
Figure 10b) demonstrate a distribution pattern akin to the broader southwestern trend, characterized by a robust Mesolithic presence, a Neolithic hiatus, and significant growth during the Chalcolithic period. Along the Vicentine coast (
Figure 10c), the proximity to various paleo-coastlines throughout the study period is evident. Notably, in the coastal stretch between Sagres and Faro, radiocarbon dates prior to the Mesolithic are notably scarce, with some exceptions found in Vale Boi. Beyond 8000 BP, the distribution reflects a sustained population presence, marked by the aforementioned Chalcolithic surge, and a temporal gap around 6500 BP. Lastly, in the Gulf of Cadiz area, spanning from Faro to Tarifa (
Figure 10e), there is minimal evidence of occupation until a notable proliferation of settlements during the Chalcolithic period.
4. Discussion
The analysis of site distribution in relation to their proximity to ancient coastlines reveals significant patterns that bear implications for understanding prehistoric settlement strategies in the Southwest of the Iberian Peninsula. Notably, in periods predating 6,500 BP, sea levels were considerably lower than they are today. Consequently, a substantial portion of archaeological sites from these earlier periods likely resided in areas that are now submerged beneath the sea. As we trace further back in time, the probability increases that a substantial number of these archaeological sites have been lost to the depths due to their original locations in presently submerged areas.
This observation leads to the inference that the settlement strategy during the Paleolithic era may not have been markedly distinct from that of subsequent periods in the Southwest of the Iberian Peninsula. Moreover, it is likely that it shares similarities with other regions where the coastline was much closer to these archaeological sites due to the rugged terrain. The shifting sea levels and their impact on the distribution and preservation of archaeological sites underscore the dynamic relationship between ancient human populations and their utilization of maritime resources in response to changing coastal configurations. These findings contribute valuable insights into the adaptability of prehistoric communities to fluctuating environmental conditions and offer a broader perspective on their resilience in the face of changing landscapes over time.
The observed pattern in site density, taking into account the sea level’s historical position, offers valuable insights into the distribution of archaeological sites in the region. The consistent site density at distances greater than 12 km from the ancient coastline during the three earlier study periods highlights the presence of well-preserved archaeological sites in these areas. In contrast, the marked decline in older sites within distances less than 4 km suggests their submergence due to rising sea levels over time. This spatial distribution underscores the influence of changing sea levels on the preservation and accessibility of ancient settlements. It implies that as sea levels rose, older coastal sites may have been inundated, contributing to their reduced visibility and, in some cases, complete disappearance. This finding underscores the need to consider sea-level fluctuations when studying the distribution and preservation of archaeological sites along ancient coastlines.
In
Figure 9a, and
Figure 9b, the paleo-coasts were at very low elevations, and therefore far from the current coastline. To determine if the exploitation of marine resources was among their economic strategies, it is necessary to more precisely define the type of archaeological record documented in these sites.
Figure 9c displays an appropriate behavior of these sites in relation to the exploitation of marine resources, as they are located near the paleo-estuaries that developed during the Flandrian transgression. In
Figure 9d, the coastline must have been too far away to maintain these strategies of exploiting marine resources. It would be necessary to consider that these inland entries of the sea were not ephemeral and lasted longer than the Flandrian transgression supposed, or the strategies of exploiting the immediate physical environment ceased to play a primary role in the location of the settlement. The near-total absence of sites from the chronologies where the paleo-coast was located far from the current coast (
Figure 9a) suggests that the sites that based their strategy on the exploitation of marine resources are currently submerged and that they were actually close to their corresponding paleo-coast at the time.
The most probable interpretation for the sites identified with anomalous behaviors is related to their spatial location. The anomalies are situated around two areas: the depressions of the Tagus and Sado rivers, and the Doñana region. Both spaces are currently characterized by estuarine waters in depressed areas, where significant infilling has occurred during the Holocene, seemingly related [
58] to the low stretches of fluvial systems where intense erosive processes have taken place, partially caused by changes in land use for agricultural purposes.
Thus, Doñana region, the Tagus Depression, and the Sado Depression could be identified as an apparent weakness in the initially proposed method, as the bathymetric DEM does not allow for the determination of the paleo-topography of these territories due to the intense depositional processes recognized in these areas.
The SCDPD (Summed Calibrated Radiocarbon Date Probability Distribution) for the entire study area in the southwestern Iberian Peninsula shows two higher peaks at around 8000–7000 BP and 5000–4000 BP, corresponding to the strong Mesolithic and Chalcolithic periods. The minimum in occupation around 6500 BP, coinciding with the Neolithic period, can likely be explained by limitations in research. Further investigation is needed to better understand the factors contributing to this phenomenon, and to explore whether other factors, such as changes in the economic strategies or social dynamics of the time, could have played a role in the observed patterns.
A distinct pattern emerges in the northern Cabo Raso area (
Figure 10a), characterized by continuous and relatively homogeneous occupation throughout various time periods, with a notable surge during the Chalcolithic period. This trend aligns with the broader distribution analysis across the southwestern Iberian Peninsula, where this region stands out as having the highest concentration of cave settlements.
Similarly, the area encompassing the paleo-estuaries of the Tajo and Sado rivers (
Figure 10b) exhibits a distribution pattern closely mirroring the overall trends in the southwestern region. There is a pronounced presence during the Mesolithic period, a notable gap during the Neolithic, and a substantial expansion during the Chalcolithic era. The surprising absence of Neolithic evidence in an area previously densely populated during the Mesolithic prompts questions about the transition to Neolithic practices in a region seemingly suitable for such developments. The Vicentine coast (
Figure 10c) appears to have a lack of interest in this area during the Neolithic and Chalcolithic periods or a bias in research focus during these periods.
The southern coast of the Algarve, from Sagres to Faro (
Figure 10d), confirms that the oldest settlements are submerged under the sea. There are no chronologies earlier than the Mesolithic period in this area, except for some in Vale Boi. From 8000 BP onwards, the distribution shows continuity of settlement with an increase in the Chalcolithic period and a gap around 6500 BP.
In the Gulf of Cadiz area, from Faro to Tarifa (
Figure 10e), there is virtually no occupation until the explosion of settlements in the Chalcolithic period. This fact may be evidence of two issues: on one hand, the lack of research during certain periods, which produces a significant bias in available chronologies; and on the other hand, the fact that settlements with strategies related to the exploitation of marine resources must currently be submerged. This coastal strip experienced the most pronounced marine regression, and the distances to the different paleo-coasts in the past are greater compared to the current coastline, especially in the Paleolithic and even in the Mesolithic periods.
Another notable aspect of this area is the almost complete absence of Neolithic chronologies. The transition from the Early to Middle Neolithic, with the consequent change in settlement strategies, intensified open-air settlement, which, contrary to expectations, does not leave a visible archaeological record. Sedimentary phenomena related to sea level changes during the Flandrian transgression in the Lower Guadalquivir area [
57,
59] may be having some influence on this phenomenon.
It is important to highlight the methodological and data limitations of this study. On one hand, taking into account the possible effects of erosion and deposition, it is likely that in some areas, the current bathymetry may not be an accurate indicator of past paleocoasts. However, it is worth noting that in the study area, there are sectors that exhibit clear erosive dynamics, such as the Asperillo cliff [
60]. Despite this, evidence of Neanderthals older than 106,000 years has been identified in this area, suggesting that it could be a more stable sector than what the current dynamics suggest. Additionally, there are prograding areas such as Doñana, which is filled with sediments, and the estuary and delta of the Guadiana. However, considering the magnitude of changes in such an extensive continental shelf as the one studied, this issue can be overlooked except in specific areas. On the other hand, the sea level curve involves a series of simplifications, which could be improved by employing a more detailed sea level curve than the one used in this work. Despite these limitations, it should be noted that the current data availability supports the approach taken in this study.
5. Conclusions
As an archaeological study model, the analysis of the relationship between changes in the coastline and settlement and marine resource exploitation strategies allows us to understand the evolution of human behavior in prehistory. To achieve this, accurate and rigorous information on the position and evolution of paleo-coasts and archaeological sites in relation to them is essential.
The application of the methodology presented in this study has allowed for a more accurate analysis of the relationship between changes in the coastline and the exploitation of marine resources by prehistoric societies in the southwestern Iberian Peninsula during the last glacial period. The use of a precise algorithm for the determination of paleo-coastlines, combined with georeferenced radiocarbon dating of archaeological sites, has provided a more reliable and rigorous approach to the study of prehistoric human behavior.
However, it should be noted that the method applied may have limitations, such as the imprecision of the input bathymetric data when interpreting ancient coastlines. The interpretation of the results obtained has allowed us to identify inconsistencies in the model, which are likely related to the lack of information on intense erosion and deposition processes in the modeling. To improve the accuracy of the method, higher quality bathymetry data, a more precise sea level curve, MDE of the geological past that takes into account erosion and deposition processes, or a greater number of precisely dated sites are needed. Nevertheless, based on the available information, the approach presented in this study appears to provide a more suitable interpretation of coastal settlements during the last glacial period in the southwestern Iberian Peninsula.
The results obtained indicate that the exploitation of marine resources as an economic strategy was conditioned by the accessibility of the sites to the coast and, therefore, adapted to the variations in the coastline. It has also been demonstrated that the mathematical models used in this study are useful for determining the accessibility of the sites to marine resources and, thus, for understanding the evolution of settlement and marine resource exploitation strategies in prehistory.
In conclusion, this study highlights the importance of using rigorous and accurate methodologies for the study of the relationship between the coastline and settlement and marine resource exploitation strategies in prehistory. Furthermore, it opens up new perspectives for future research in this field, such as applying these methodologies to other periods and geographic regions, and exploring new avenues for analyzing and evaluating the accessibility of sites to marine resources. It is worth noting that this methodology may present limitations, such as the lack of precision of the input data when interpreting ancient coastlines, likely related to the absence of information on intense erosion and deposition processes in the modeling. Nonetheless, interpreting the results obtained has allowed identifying incongruities of the model, which can be addressed by improving the quality of bathymetric data, a more precise sea-level curve, paleo-geographical models that consider erosion and deposition processes, or more accurate dating of archaeological sites.
Author Contributions
Conceptualization, J.C. M.-G.; methodology, J.C. M.-G. and P. F.-J.; software, J.C. M.-G.; validation, J.C. M.-G. and P. F.-J.; formal analysis, J.C. M.-G. and P. F.-J.; investigation, J.C. M.-G. and P. F.-J.; resources, J.C. M.-G.; data curation, J.C. M.-G. and P. F.-J.; writing—original draft preparation, J.C. M.-G.; writing—review and editing, J.C. M.-G. and P. F.-J.; visualization, J.C. M.-G. and P. F.-J.; supervision, J.C. M.-G. and P. F.J. All authors have read and agreed to the published version of the manuscript.
Funding
This research received no external funding.
Data Availability Statement
Not applicable.
Acknowledgments
Not applicable.
Conflicts of Interest
The authors declare no conflict of interest.
References
- Weschenfelder, J.; Corrêa, I.C.S.; Aliotta, S.; Baitelli, R. Paleochannels related to late Quaternary sea-level changes in Southern Brazil. Brazilian Journal of Oceanography 2010, 58, 35–44. [Google Scholar] [CrossRef]
- Macieira, R.M.; Simon, T.; Pimentel, C.R.; Joyeux, J.C. Isolation and speciation of tidepool fishes as a consequence of Quaternary sea-level fluctuations. Environmental Biology of Fishes 2015, 98, 385–393. [Google Scholar] [CrossRef]
- Yokoyama, Y.; Lambeck, K.; De Deckker, P.; Johnston, P.; Fifield, L.K. Timing of the Last Glacial Maximum from observed sea-level minima. Nature 2000, 406, 713–716. [Google Scholar] [CrossRef] [PubMed]
- Yokoyama, Y.; Esat, T.M.; Thompson, W.G.; Thomas, A.L.; Webster, J.M.; Miyairi, Y.; Fallon, S. Rapid glaciation and a two-step sea level plunge into the Last Glacial Maximum. Nature 2018, 559, 603–607. [Google Scholar] [CrossRef] [PubMed]
- Siddall, M.; Rohling, E.J.; Almogi-Labin, A.; Hemleben, C.; Meischner, D.; Schmelzer, I.; Smeed, D.A. Sea-level fluctuations during the last glacial cycle. Nature 2003, 423, 853–858. [Google Scholar] [CrossRef]
- Lambeck, K.; Chappell, J. Sea level change through the last glacial cycle. Science 2001, 292, 679–686. https://www.science.org/doi/10.1126/science.1059549. [CrossRef]
- Gregory, D.J.; Bennike, O.; Jensen, J.B.; Rasmussen, P.; Al-Hamdani, Z. Development of Predictive Geoarchaeological Models to Locate and Assess the Preservation Potential of Submerged Prehistoric Sites Using Remote Sensing, Palaeoenvironmental Analysis, and GIS. Heritage 2021, 4, 4678–4699. [Google Scholar] [CrossRef]
- Turney, C.S.; Brown, H. Catastrophic early Holocene sea level rise, human migration and the Neolithic transition in Europe. Quaternary Science Reviews 2007, 26, 2036–2041. [Google Scholar] [CrossRef]
- Josenhans, H.; Fedje, D.; Pienitz, R.; Southon, J. Early humans and rapidly changing holocene sea levels in the queen Charlotte islands-Hecate strait, british Columbia, Canada. Science 1997, 277, 71–74. https://www.science.org/doi/10.1126/science.277.5322.71. [CrossRef]
- Chappell, J. Late Pleistocene coasts and human migrations in the Austral region. In A community of culture: the people and prehistory of the Pacific; Spriggs, M., Yen, D.E., Ambrose, W., Jones, R., Thorne, A., Andrews, A., Eds.; The Australian National University: Canberra, Australia, 1993; pp. 43–48. http://www.jstor.org/stable/30135988.
- Hill, J.; Avdis, A.; Bailey, G.; Lambeck, K. Sea-level change, palaeotidal modelling and hominin dispersals: The case of the southern red sea. Quaternary Science Reviews 2022, 293, 107719. [Google Scholar] [CrossRef]
- Fladmark, K.R. Routes: Alternate migration corridors for early man in North America. American Antiquity 1979, 44, 55–69. [Google Scholar] [CrossRef]
- Erlandson, J.M.; Braje, T.J. From Asia to the Americas by boat? Paleogeography, paleoecology, and stemmed points of the northwest Pacific. Quaternary International 2011, 239, 28–37. [Google Scholar] [CrossRef]
- Borreggine, M.; Powell, E.; Pico, T.; Mitrovica, J.X.; Meadow, R.; Tryon, C. Not a bathtub: A consideration of sea-level physics for archaeological models of human migration. Journal of Archaeological Science 2022, 137, 105507. [Google Scholar] [CrossRef]
- Clark, P.U.; Mix, A.C. Ice sheets and sea level of the Last Glacial Maximum. Quaternary Science Reviews 2002, 21, 1–7. [Google Scholar] [CrossRef]
- Lambeck, K.; Chappell, J. Sea level change through the last glacial cycle. Science 2001, 292, 679–686. https://www.science.org/doi/10.1126/science.1059549. [CrossRef]
- Hayden, B.; Chisholm, B.; Schwarcz, H.P. Fishing and foraging. Marine resources in the Upper Paleolithic of France. In The Pleistocene Old World. Regional Perspectives; Soffer, O., Ed.; Springer: New York, USA, 1987; pp. 279–291. [Google Scholar] [CrossRef]
- Bailey, G. World prehistory from the margins: the role of coastlines in human evolution. Journal of Interdisciplinary Studies in History and Archaeology 2004, 1, 39–50. [Google Scholar]
- Marean, C.W. The origins and significance of coastal resource use in Africa and Western Eurasia. Journal of Human Evolution 2014, 77, 17–40. [Google Scholar] [CrossRef]
- Álvarez-Fernández, E. Humans and marine resource interaction reappraised: Archaeofauna remains during the late Pleistocene and Holocene in Cantabrian Spain. Journal of Anthropological Archaeology 2011, 30, 327–343. [Google Scholar] [CrossRef]
- Adán, G.E.; Álvarez-Lao, D.; Turrero, P.; Arbizu, M.; García-Vázquez, E. Fish as diet resource in North Spain during the Upper Paleolithic. Journal of Archaeological Science 2009, 36, 895–899. [Google Scholar] [CrossRef]
- Bailey, G.; Milner, N. Coastal hunter-gatherers and social evolution: marginal or central? Before Farming 2002, 2002, 1–22. [Google Scholar] [CrossRef]
- Fraile Jurado, P.; Álvarez Francoso, J.I.; Ojeda Zújar, J. Cartografía de la probabilidad de inundación del litoral andaluz a finales del siglo XXI ante la subida del nivel del mar. Cuadernos Geográficos 2018, 57, 6–26. [Google Scholar] [CrossRef]
- Ojeda-Zújar, J.; Fraile-Jurado, P.; Álvarez-Francoso, J. Sea level rise inundation risk assessment in residential cadastral parcels along the Mediterranean Andalusian coast. Cuadernos de Investigación Geográfica 2021, 47, 243–263. [Google Scholar] [CrossRef]
- Vanney, J.R.; Ménanteau, L. Géographie du golfe ibéro-marocain; Casa de Velázquez: Madrid, Spain, 2004. [Google Scholar]
- Barragán Mallofret, D. La transgresión flandriense en la vega de Sevilla. El paleoestuario del río Guadalquivir. PhD Tesis, Sevilla University, Sevilla, 2016. [Google Scholar]
- Fraile-Jurado, P.; Mejías-García, J.C. Método para el cálculo, análisis y representación espacial de la variable “tiempo sumergido bajo el nivel del mar durante la última glaciación” en la plataforma continental del Golfo de Cádiz (España y Portugal). Revista de Geografía Norte Grande 2022, 81, 183–205. [Google Scholar] [CrossRef]
- Silva, P.G.; Bardají, T.; Roquero, E.; Baena-Preysler, J.; Cearreta, A.; Rodríguez-Pascua, M.A.; Goy, J.L. El Periodo Cuaternario: La Historia Geológica de la Prehistoria. Cuaternario y Geomorfología 2017, 31, 113–154. [Google Scholar] [CrossRef]
- Zazo, C. Explorando las costas de un pasado reciente: los cambios del nivel del mar; Real Academia de Ciencias Exactas, Físicas y Naturales: Madrid, Spain, 2015. [Google Scholar]
- Straus, L.G. Southwestern Europe at the last glacial maximum. Current Anthropology 1991, 32, 189–199. https://www.jstor.org/stable/2743649. [CrossRef]
- Straus, L.G. El Paleolítico Superior de la península ibérica. Trabajos de Prehistoria 2018, 75, 9–51. [Google Scholar] [CrossRef]
- Raposo, L. Ambientes, territorios y subsistencia en el Paleolítico Medio de Portugal. Complutum 1995, 6, 57–78. [Google Scholar]
- Nocete Calvo, F. Tercer Milenio Antes de Nuestra Era: Relaciones y Contradicciones Centro-Periferia en el Valle del Guadalquivir. Bellaterra: Barcelona, Spain, 2001. [Google Scholar]
- Valera, A.C. Landscapes of complexity in South Portugal during the 4th and 3rd millennium BC. In Megaliths–Societies–LandscapesEarly Monumentality and Social Differentiation in Neolithic Europe; Johannes Müller, Martin Hinz, Maria Wunderlich, Eds.; Verlag Dr. Rudolf Habelt GmbH: Kiel, Germany, 2019; pp. 1039–1054. [Google Scholar]
- Carvalho, A.F. O Mesolítico final em Portugal. In El Mesolítico geométrico en la Península Ibérica; María del Pilar Utrilla Miranda, Lourdes Montes Ramírez, Eds.; Universidad de Zaragoza: Zaragoza, Spain, 2009; pp. 33–68. [Google Scholar]
- Bicho, N.; Haws, J. At the land’s end: marine resources and the importance of fluctuations in the coastline in the prehistoric hunter–gatherer economy of Portugal. Quaternary Science Reviews 2008, 27, 2166–2175. [Google Scholar] [CrossRef]
- Sánchez, M.C.; Espejo, F.J.J.; Vallejo, M.D.S.; Bao, J.F.G.; Carvalho, A.F.; Martinez-Ruiz, F.; Gamiz, M.R.; Flores, J.A.; Paytan, A.; Sáez, J.A.L.; Peña-Chocarro, L. The Mesolithic–Neolithic transition in southern Iberia. Quaternary Research 2012, 77, 221–234. [Google Scholar] [CrossRef]
- Arteaga, O.; Barragán Mallofret, D.; Ménanteau, L.; Morán, E.; Pareira, R.; Roos, A.M.; Schulz, H.D. Introducción a la Geoarqueología en la Ribeira de Bensafrim, estuario del río Moleão y Bahía de Lagos (Portugal). Informe de la campaña de 2010. Direcção Regional de Cultura do Algarve, Câmara Municipal de Lagos. unpublished.
- Barragán Mallofret, D.; Arteaga, O. Sondeos geoarqueológicos en la Rua da Barroca (Lagos, Portugal): Informe Final. Direcção Regional de Cultura do Algarve, Câmara Municipal de Lagos. unpublished.
- Arteaga, O.; Schulz, H.D.; Roos, A.M. Geoarqueología Dialéctica en la Bahía de Cádiz. RAMPAS 2008, 10, 21–116. [Google Scholar] [CrossRef]
- Arteaga, O.; Roos, A.M. Geoarchäologische Forschungen im Umkreis der Marismas am Río Guadalquivir (Niederandalusien). Madrider Mitteilungen 1995, 36, 199–218. [Google Scholar] [CrossRef]
- Alday, A.; Mejías-García, J.C. La cronología de la Prehistoria de la Península Ibérica y los Sistemas de Información Geográfica del registro arqueológico. CuPAUAM 2019, 45, 9–26. [Google Scholar] [CrossRef]
- Alday, A.; Mejías-García, J.C. Una base de datos de cronología C-14 para la Península Ibérica y las Islas Baleares y su gestión desde un Sistema de Información. In Métodos Cronométricos en Arqueología, Historia y Paleontología; Barceló, J.A., Morell, B., Eds.; Dextra Editorial: Barcelona, Spain, 2020; pp. 540–545. Available online: http://info.dextraeditorial.com/metodoscronometricos/.
- Naismith, W.W. Three days among the Cuchullins. The Scottish Mountaneering Club Journal 1892, 2, 56–62. [Google Scholar]
- Aitken, R. Wilderness areas in Scotland. PhD Tesis, Aberdeen University, Aberdeen, 1997. [Google Scholar]
- Ericson, J.E.; Goldstein, R. Work space: a new approach to the analysis of energy expenditure within site catchments. Antropology 1980, 10, 21–30. [Google Scholar]
- Langmuir, E. Mountaincraft and leadership: a handbook for mountaineers and hillwalking leaders in the British Isles. The Scottish Sport Council: Edimburgh, England, 1984. [Google Scholar]
- Tobler, W. Three Presentations on Geographical Analysis and Modeling: Non-Isotropic Geographic Modeling; Speculations on the Geometry of Geography; and Global Spatial Analysis (93-1). UC Santa Barbara: National Center for Geographic Information and Analysis 1993. Available online: https://escholarship.org/uc/item/05r820mz.
- Rees, W. Least cost in mountainous terrain. Computers and Geosciences 2003, 30, 203–209. [Google Scholar] [CrossRef]
- Márquez Pérez, J.; Vallejo Villalta, I.; Álvarez Francoso, J.I. Estimación del tiempo de demora en rutas pedestres: comparación de algoritmos. Geofocus: Revista Internacional de Ciencia y Tecnología de la Información Geográfica 2015, 15, 47–74. [Google Scholar]
- Vita-Finzi, C.; Higgs, E.; Sturdy, D.; Harriss, J.; Legge, A.; Tippett, H. Prehistoric Economy in the Mount Carmel Area of Palestine: Site Catchment Analysis. Proceedings of the Prehistoric Society 1970, 36, 1–37. [Google Scholar] [CrossRef]
- Alday, A. Los últimos cazadores-recolectores de la Iberia interior: La Alta-Media Cuenca del Ebro y la Meseta Norte. Munibe 2002, 54, 79–101. [Google Scholar]
- Uriarte González, A. Arqueología del Paisaje y Sistema de Información Geográfica: una aplicación en el estudio de las sociedades protohistóricas de la cuenca del Guadiana Menor (Andalucía Oriental). In Bronce Final y Edad del Hierro en la Península Ibérica; Blanco, A., Cancelo, C., Esparza, A., Eds.; Editorial Universidad de Salamanca: Salamanca, Spain, 2005; pp. 602–621. [Google Scholar]
- Gilio, B.L.; Skarbun, F.; Franco, N.V. Modelado de vías de movilidad entre sitios de cazadores-recolectores en la margen norte del río Santa Cruz (Patagonia, Argentina) durante el Holoceno tardío. Geografía y Sistemas de Información Geográfica 2016, 8, 51–73. Available online: https://docs.wixstatic.com/ugd/79758e_e676d1371d2e405b9b673306a6a35833.pdf (accessed on 1 November 2022).
- Paris Roche, F. Método de Información para Excursiones (MIDE); Federación Aragonesa de Montañismo (FAM): Zaragoza, Spain, 2002. Available online: www.montanasegura.com/MIDE/manuelMIDE.pdf (accessed on 15 January 2023).
- Alday, A.; Soto, A. Poblamiento prehistórico de la península ibérica: dinámica demográfica versus frecuencias del C14. Munibe 2018, 69, 75–91. [Google Scholar] [CrossRef]
- Mejías-García, J.C.; Alday Ruiz, A.; Rodríguez-Lejarza, A.; Fraile-Jurado, P. Las dataciones del Neolítico en Andalucía. Análisis geoestadístico de su distribución espacial. In Actas del VII Congreso Internacional sobre Neolítico en la Península Ibérica; García Rivero, D., Ed.; Editorial Universidad de Sevilla: Sevilla, Spain, 2023; pp. 103–119. [Google Scholar]
- Lario, J.; Zazo, C.; Goy, J.L.; Dabrio, C.J.; Borja, F.; Silva, P.G.; Yll, E. Changes in sedimentation trends in SW Iberia Holocene estuaries (Spain). Quaternary International 2002, 93, 171–176. [Google Scholar] [CrossRef]
- Martinez, A.; Kluiving, S.; Muñoz-Rojas, J.; Borja Barrera, C.; Fraile Jurado, P.; Roldán Muñoz, M.E.; Mejías-García, J.C. Energy regimes help tackle limitations with the prehistoric cultural-phases approach to learn about sustainable transitions: Archaeological evidence from northern Spain. J. Quaternary Sci. 2023, 38, 921–937. [Google Scholar] [CrossRef]
- de Carvalho, C.N.; Muniz, F.; Cáceres, L.M.; Rodríguez-Vidal, J.; Medialdea, A.; del Val, M.; Cunha, P.P.; García, J.M.; Giles-Guzmán, F.; Carrión, J.S.; Belaústegui, Z. Neanderthal footprints in the “Matalascañas trampled surface”(SW Spain): new OSL dating and Mousterian lithic industry. Quaternary Science Reviews 2023, 313, 108200. [Google Scholar] [CrossRef]
|
Disclaimer/Publisher’s Note: The statements, opinions and data contained in all publications are solely those of the individual author(s) and contributor(s) and not of MDPI and/or the editor(s). MDPI and/or the editor(s) disclaim responsibility for any injury to people or property resulting from any ideas, methods, instructions or products referred to in the content. |
© 2023 by the authors. Licensee MDPI, Basel, Switzerland. This article is an open access article distributed under the terms and conditions of the Creative Commons Attribution (CC BY) license (http://creativecommons.org/licenses/by/4.0/).
