Preprint
Article

Oxide Additive-Free α- → β-Si3N4 Phase Transformation at 1900 °C

Altmetrics

Downloads

147

Views

61

Comments

0

A peer-reviewed article of this preprint also exists.

Submitted:

11 October 2023

Posted:

12 October 2023

You are already at the latest version

Alerts
Abstract
Oxide additive-free α- ⇀ β-Si3N4 phase transformation of a high-purity commercial α-Si3N4 powder was investigated at 1600 to 1900 ℃ under nitrogen pressure of 980 kPa. The XRD analysis revealed that the α- ⇀ β-Si3N4 phase transformation proceeded mainly at 1900 ℃, and was completed by the extensive 1900 ℃-heat treatment for 20 h. This phase transformation temperature was 33 ℃ lower than the theoretical α-Si3N4 dissociation temperature and confirmed as completely different from that often discussed for the liquid phase sintering of α-Si3N4 powder by direct comparison with the phase transformation behavior of a reference powder, α-Si3N4 powder doped with 1 mol% Y2O3. The unique α- ⇀ β-Si3N4 phase transformation was further studied by a set of characterization techniques including elemental analysis, HAADF-STEM and STEM-EDS analyses. The results strongly suggested that the oxide additive-free α- ⇀ β-Si3N4 phase transformation was governed by the for-mation of metastable solid solution between α-Si3N4 and impurity oxygen of approximately 0.6 wt%, which promoted the dissociation below the theoretical α-Si3N4 dissociation temperature to afford thermodynamically favorable β-Si3N4. Along with the β-Si3N4 formation, the impurity oxygen was concentrated at the Si3N4 crystal grain boundaries and subsequently released from the sample via the grain boundary diffusion.
Keywords: 
Subject: Chemistry and Materials Science  -   Ceramics and Composites

1. Introduction

Because of their high thermal conductivity and excellent mechanical properties, silicon nitride (Si3N4) ceramics have been successfully applied as insulated substrates in the semiconductor power modules mounted on inverters assembled in Electric Vehicle (EV) and Hybrid Electric Vehicle (HEV) [1,2]. The material properties of Si3N4 ceramics are closely related to their microstructures, and a bi-modal structure composed of fine matrix Si3N4 grains and elongated large grains is ideal for harmonizing high fracture strength and toughness as well as high thermal conductivity [3–5]. For fabricating such high-performance β-Si3N4 ceramics, the rod-like β-Si3N4 seeding to starting α-Si3N4 powders is a practical way to construct the bi-modal structure composed of fine matrix grains and selectively grown elongated grains originating from the seed crystallites through the liquid phase sintering [6–8]. Regarding the method for preparing rod-like β-Si3N4 seed crystallites, Hirao et al. [9] reported the procedure with several steps as follows: (i) heat treatment of α-Si3N4, yttria (Y2O3) and silica (SiO2) mixed powders at 1850 °C under N2 gas pressure of 0.5 MPa to afford rod-like β-Si3N4 polycrystallites with Si-Y-O-N glassy phase, (ii) pulverizing the aggregates using a mortar and pestle, (iii) glass phase dissolution by acid treatment followed by neutralization treatment and cleaning, (iv) classifying the resulting isolated seed crystallites and (v) drying. On the other hand, recently, we proposed a facile method to produce rod-like β-Si3N4 seed crystallites by the oxide additive-free single-step heat treatment at 1900 ℃ of commercial α-Si3N4 powder [10–12]. Subsequently, the bi-modal structure controlling was successfully achieved for the liquid phase-sintered β-Si3N4-MgO (1 wt%)-Re2O3 (3 wt%) (R = Gd, Yb, Y, La) ceramics by the addition of 10 vol% rod-like β-Si3N4 seeds produced at our laboratory, and the resulting ceramics sintered at 1900 ℃ for 40 h exhibited improved thermal conductivity of higher than 110 Wm-1K-1 [13].
Generally, it is accepted that the α- ⇀ β-Si3N4 phase transformation proceeds through the dissolution-precipitation process in the oxynitride liquid phase formed in-situ at the heat treatment temperature [14,15] and besides the oxide additives [16–18], the initial contents of free silicon [19] and β-Si3N4 phase in the starting α-Si3N4 powder [20] have been reported as additional factors to accelerate the formation of β-Si3N4. On the other hand, the oxide additive-free α- ⇀ β-Si3N4 phase transformation has been reported for fully densified Si3N4 ceramics fabricated by high-pressure sintering of α-Si3N4 powder using techniques such as hot isostatic pressing (HIP) [21–24] and high-pressure and high-temperature (HPHT) sintering [25]. Hou et al. [25] reported that micron-size α-Si3N4 was transformed into submicron-sized polycrystallites β-Si3N4 under the HPHT condition at 5.5 GPa and temperatures ranging from 1600 to 1900 ℃, and the α- ⇀ β-Si3N4 phase transformation was found to complete at 1900 ℃ for 3 min. As a possible mechanism for the observed phase transformation, the nucleation-growth mechanism of liquid-solid phase transformation was suggested since the observed α- ⇀ β-Si3N4 phase transformation proceeded at around the melting point of Si3N4 under high pressure [25,26]. The high-resolution TEM observation of the sample fabricated by the HPHT sintering revealed full-phase transformation from α- to β-Si3N4, while the β-Si3N4 crystal grain boundaries were free from secondary crystalline or glassy phase, i.e., there was no evidence for the eutectic liquid-phase formation during the HPHT sintering [25,26].
In our previous study [12], the correlation between the α- ⇀ β-Si3N4 phase transformation behavior and the changes in the amount of oxygen and carbon impurities, and the α- ⇀ β-Si3N4 phase transformation kinetics at 1900 ℃ were investigated under nitrogen pressure of 980 kPa. Our analytical results revealed that the experimentally observed α- ⇀ β-Si3N4 phase transformation was suggested to be promoted by the formation of metastable solid solution between the impurity oxygen and α-Si3N4 followed by decomposition and release of oxygen-containing volatile species to afford β-Si3N4 [12].
In the present study, to investigate the unique phase transformation in more detail, the oxide additive-free α- ⇀ β-Si3N4 phase transformation at 1600 to 1900 ℃ is directly compared with the reference powder sample of α-Si3N4 doped with 1 mol% yttrium oxide (Y2O3) in which the α- ⇀ β-Si3N4 phase transformation can be promoted via the liquid phase [27]. Subsequently, the oxide additive-free Si3N4 powder samples with various β-phase content are prepared by varying the heat treatment duration time at 1900 ℃. The correlation between the α- ⇀ β-Si3N4 phase transformation behavior and changes in the oxygen-impurity content of the selected Si3N4 crystal grains of both α- and β-phase and those of their two-grain boundaries is investigated and discussed based on the results obtained by a set of characterization techniques including elemental analysis, X-ray diffraction (XRD), transmission electron microscopy (TEM), high-angle annular dark-field scanning TEM (HAADF-STEM), STEM-energy dispersive X-ray spectroscopy (EDS) and electron backscatter diffraction (EBSD) analyses.

2. Experimental procedures

2.1. Starting powders and heat treatment condition

Commercially available α-Si3N4 powder (grade SN-E10, Ube Industries, Ltd., Tokyo, Japan) was used as-received. The specific surface area (SSA), mean particle size (d50) and β-phase content are 11.0 m2g-1, 0.9 μm and 3.73 %, respectively. The total metal impurity, oxygen and carbon impurity contents are less than 50 ppm, 1.23 and 0.11 wt%, respectively. As a comparison study, to observe the α- ⇀ β-Si3N4 transformation through the liquid phase, Y2O3 powder (grade UU-type, purity, 99.9 %, SSA: 15.9 m2g-1, d50: 0.5 μm, Shin-Etsu Chemical, Co. Ltd., Fukui, Japan) [28] as used as an oxide additive: As-received α-Si3N4 powder (labeled as E10) was mixed with 1 mol% Y2O3 powder and ball milled in ethanol for 2 h and dried at 80 ℃ for 5 h under a flowing nitrogen (N2). The resulting mixed powder was labeled as E10 +1 mol% Y2O3.
A prescribed amount of the E10 and E10+1 mol% Y2O3 sample powders were placed in a boron nitride (BN) crucible and heat-treated in a graphite resistance-heated furnace (Model High Multi 5000, Fuji Dempa Kogyo, Co., Ltd., Osaka, Japan) at selected temperatures from 1600 to 1900 °C for 5 h under N2 gas pressure of 980 kPa. In addition, the effect of the 1900 °C heat-treatment duration time on the morphology and α- ⇀ β-Si3N4 phase transformation was studied for up to 20 h.

2.2. Characterizations

The evaluation of oxygen and carbon impurities and the β-phase content of the powder samples was conducted in the same manner as described in our previous report [12].
Morphologies of the powder samples were observed by using a scanning electron microscope (SEM, Model JSM-7900F, JEOL Ltd., Tokyo, Japan.
In this study, TEM/HAADF-STEM, STEM-EDS and EBSD analyses were intensively performed on the powder samples to investigate the α- ⇀ β-Si3N4 transformation behavior associated with the changes in the oxygen impurity contents within the Si3N4 crystal grains and those at their grain boundaries. TEM specimens were prepared by focused ion beam (FIB) techniques (Model FB-2100, JEOL Ltd., Tokyo, Japan): The powder sample was embedded within epoxy resin and maintained under vacuum for 5 min by using a rotary pomp. Then, the pressure was returned to atmospheric pressure and the mixed compound was cured at room temperature for 12 h. The cured compound composed of the powder sample and resin was mechanically pre-polished. The pre-polished surface of the cured compound was covered with tungsten (W) protective thin film, then the resulting compound was transferred to the FIB equipment for final thinning.
The TEM and HAADF-STEM observations were carried out by using an atomic resolution analytical electron microscope with a STEM Cs corrector incorporated as standard (Model JEM-ARM200F, JEOL Ltd., Tokyo, Japan) operating at an acceleration voltage of 200 kV, which allows to perform the HAADF-STEM observation at a high resolution of 78 pm.
EDS analysis was conducted in the STEM mode with a spectrometer (Model JED-2300T, JEOL Ltd., Tokyo, Japan) mounted on the atomic resolution analytical electron microscope. Selected area electron diffraction (SAED) analysis was performed to identify the unit cell structure whether α-Si3N4 or β-Si3N4 phase and the symmetries (crystal axis and face orientation) of the Si3N4 phase.
In this study, HAADF-STEM analysis for determining the atomic configuration in the vicinity of the Si3N4 grain boundary was performed under the operation conditions as previously discussed by Clarke and Thomas [29] and conducted by Kleebe et al. [30,31] and Kim et al. [32]: The crystal grain boundary has to be tilted in an edge-on position to the incident beam. Furthermore, the crystal grain boundary should be flat with a low density of interfacial steps, and the crystal grains on either side of the grain boundary should be aligned in an orientation suitable for structure imaging or at least for forming one set of lattice fringes.
In this study, the α-Si3N4 crystal grains in the heat-treated powder sample with an especially high β-phase content of 96.5 % were identified by the EBSD analysis (Model Aztec HKL Advanced Symmetry, Oxford Instruments Holdings 2013 Inc., Tokyo, Japan with application equipment: Model Map Sweeper, Oxford Instruments Holdings 2013 Inc., Tokyo, Japan). The EBSD measurements were carried out in low vacuum operating mode which eliminated the coverage of the surface since the gas ionized by the electrons was capable of neutralizing the surface charges. A High-resolution EBSD image on an approximately 6 × 4 μm2 area of the sample TEM specimen was obtained under the operation condition with a step size of 20 nm and an acceleration voltage of 20 kV.

3. Results and discussion

3.1.α-⇀β-. Si3N4 phase transformation behaviors

3.1.1. Morphological changes and β-phase content

As a reference, the morphologies of the starting α-Si3N4 and Y2O3 powders used in this study are shown in Figure 1.
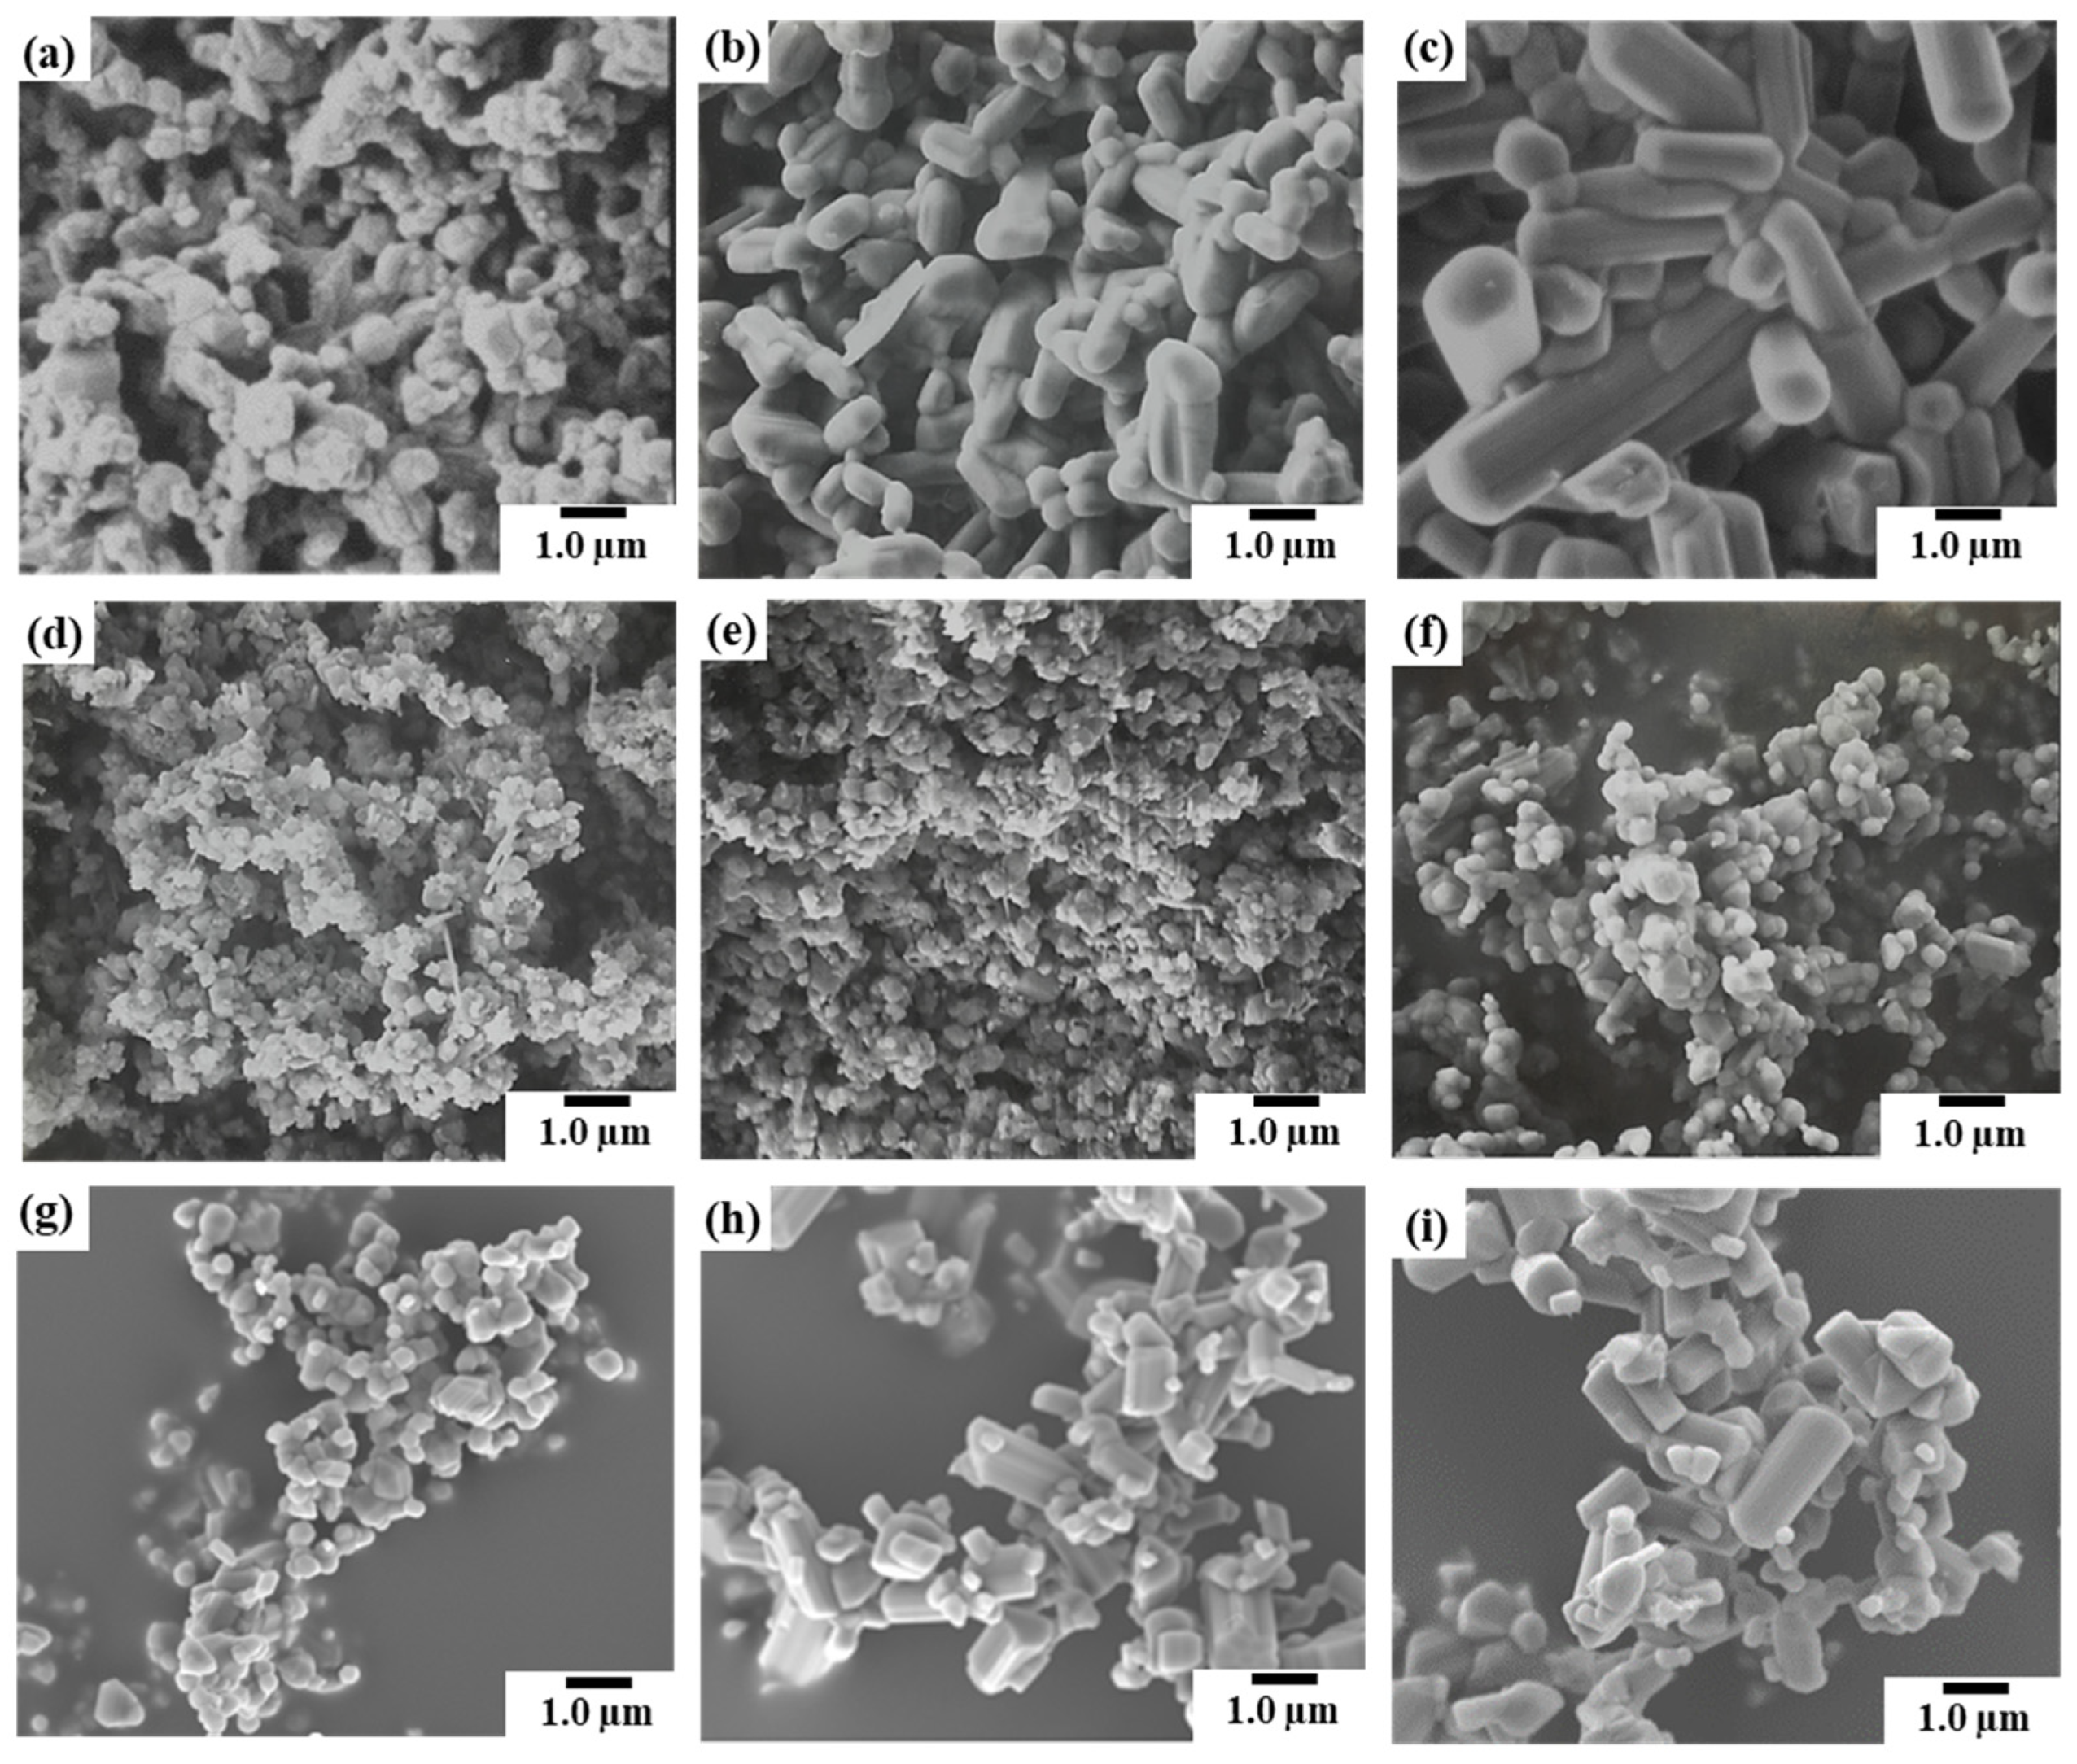
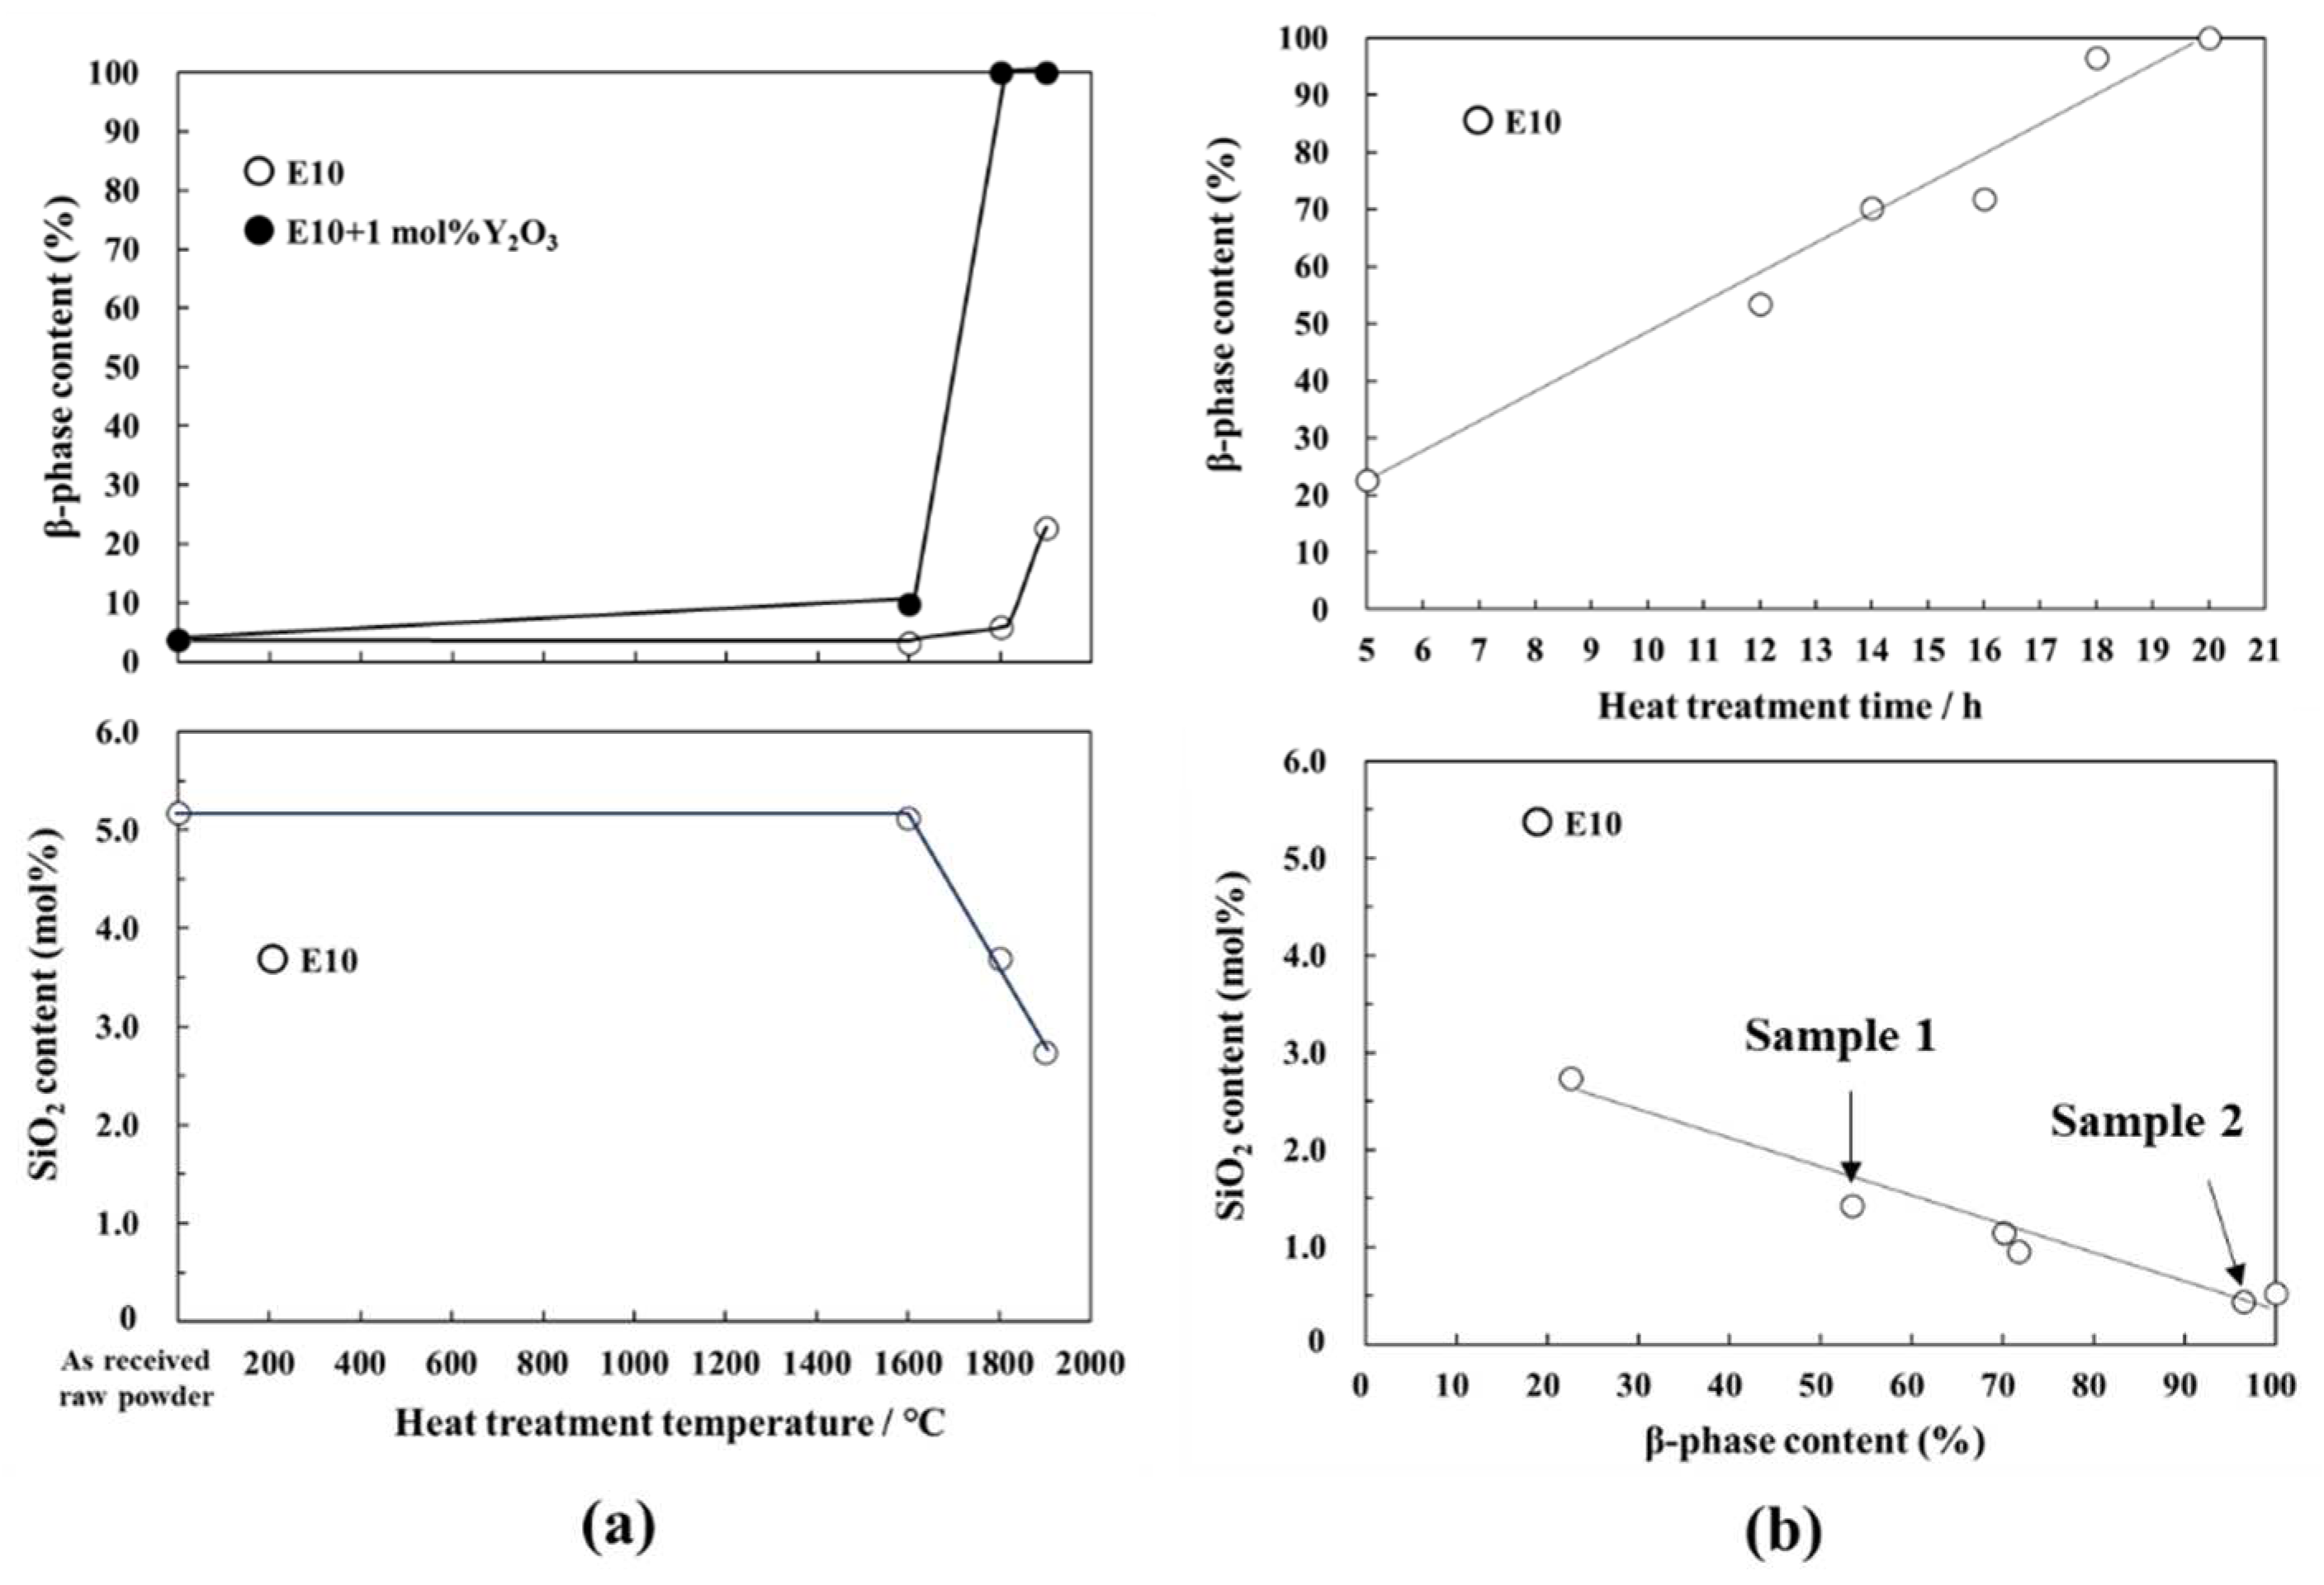
The morphology changes and the α- ⇀ β-Si3N4 phase transformation behaviors during the heat treatment up to 1900 ℃ of the E10 and E10+1 mol% Y2O3 powder samples are summarized and shown in Figure 2 and Figure 3a, respectively. The addition of 1 mol%-Y2O3 promoted Si3N4 elongated grain growth at 1700 to 1800 ℃ (Figure 2b,c) associated with the completion of α- ⇀ β-Si3N4 phase transformation at 1800 ℃ (Figure 3a), which are consistent with those previously observed during the liquid-phase sintering of Si3N4-Y2O3-SiO2 system [33]. On the other hand, even after the 1900 ℃ -heat treatment for 5 h, the E10 sample kept the equiaxed morphology (Figure 2f), and the β-Si3N4 phase content remained below 25 % (Figure 3a). As we reported previously [12], continuous grain growth proceeded during the extended 1900 °C-heat treatment for up to 20 h to afford hexagonal rod-like grains (Figure 2g–i). Moreover, β-Si3N4 phase content increased consistently with the 1900 °C-heat treatment time to reach 100 % at 20 h (Figure 3b).

3.1.2. Relation between chemical composition and β-phase content

The oxygen (O) and carbon (C) impurity contents of as-received and heat-treated α-Si3N4 powder samples are listed in Table S1. The contents of O impurity calculated as SiO2 (mol %) [12] are plotted as a function of heat treatment temperature and 1900 °C-heat treatment time in Figure 3a,b, respectively.
After the 5 h-heat treatment up to 1900 ℃, the SiO2 and C contents decreased from 5.17 to 2.74 mol% and 1.23 to 0.8 mol%, respectively (Figure 3a and Table S1). Accordingly, the observed increase in the β-Si3N4 phase content at 1600 to 1900 ℃ was suggested by the β-Si3N4 formation via carbothermal nitridation reaction between the impurity C and SiO2 generally recognized as a surface oxide layer formed by the impurity oxygen (Eq. (1)) [34]. As another possible route for the β-Si3N4 formation, silicon oxynitride (Si2N2O) formation and decomposition (Eq. (2) [35]) could be considered since Si2N2O was suggested as another possible phase at 1600 to 1800 ℃ according to the phase diagrams of the binary SiO2-Si3N4 system [36,37].
3SiO2 (s) + 6C (s)+ 2N2 (g) → β-Si3N4 (s) + 6CO (g)
3Si2N2O (s) → β-Si3N4 (s) + N2 (g) + 3SiO (g) (T > 1750 °C)
During the extended 1900 °C-heat treatment for up to 20 h, both the SiO2 and C contents decreased consistently with the heating time (Table S1), which revealed that the carbothermal nitridation (Eq. (1)) continuously proceeded, however, this contribution to the increase in the β-Si3N4 phase content was essentially small since the amounts of the SiO2 and C after the 1900 °C-heat treatment for 5 h were as low as 0.64 wt% (2.74 mol% as SiO2) and 0.07 % (0.8 mol%), respectively (Table S1). It should also be noted that the silicon oxynitride liquid phase formation was excluded at such low SiO2 contents [36,37].
The experimental results obtained in the present study clearly revealed that the dominant mechanism for the α- ⇀ β-Si3N4 phase transformation of the E10 sample at 1900 °C was intrinsically different from that generally discussed for the liquid phase sintering of Si3N4 ceramics [38]. In this study, we focused on the role of impurity oxygen in the α- ⇀ β-Si3N4 phase transformation, and the relation between the α- ⇀ β-Si3N4 transformation behavior and the change in the oxygen impurity content shown in Figure 3b was further studied.

3.2. Nanostructure characterization by HAADF-STEM and STEM-EDS analyses

3.2.1. Phase identification

The changes in the oxygen impurity contents within the Si3N4 crystal grains and their two-grain boundaries were intensively studied by the HAADF-STEM observation combined with STEM-EDS analysis. In this study, two powder samples with apparently different β-Si3N4 phase content of 53.5 and 96.5 % were selected and labeled as Sample 1 and Sample 2, respectively, as shown in Figure 3b.
First, HAADF-STEM analysis was performed on the selected Si3N4 crystal grains for the assignment of α- and β-phase and the identification of the three different kinds of two-grain boundaries, α/α-phase, α/β-phase and β/β-phase.
(a) Sample 1 with β-phase content of 53.5 %
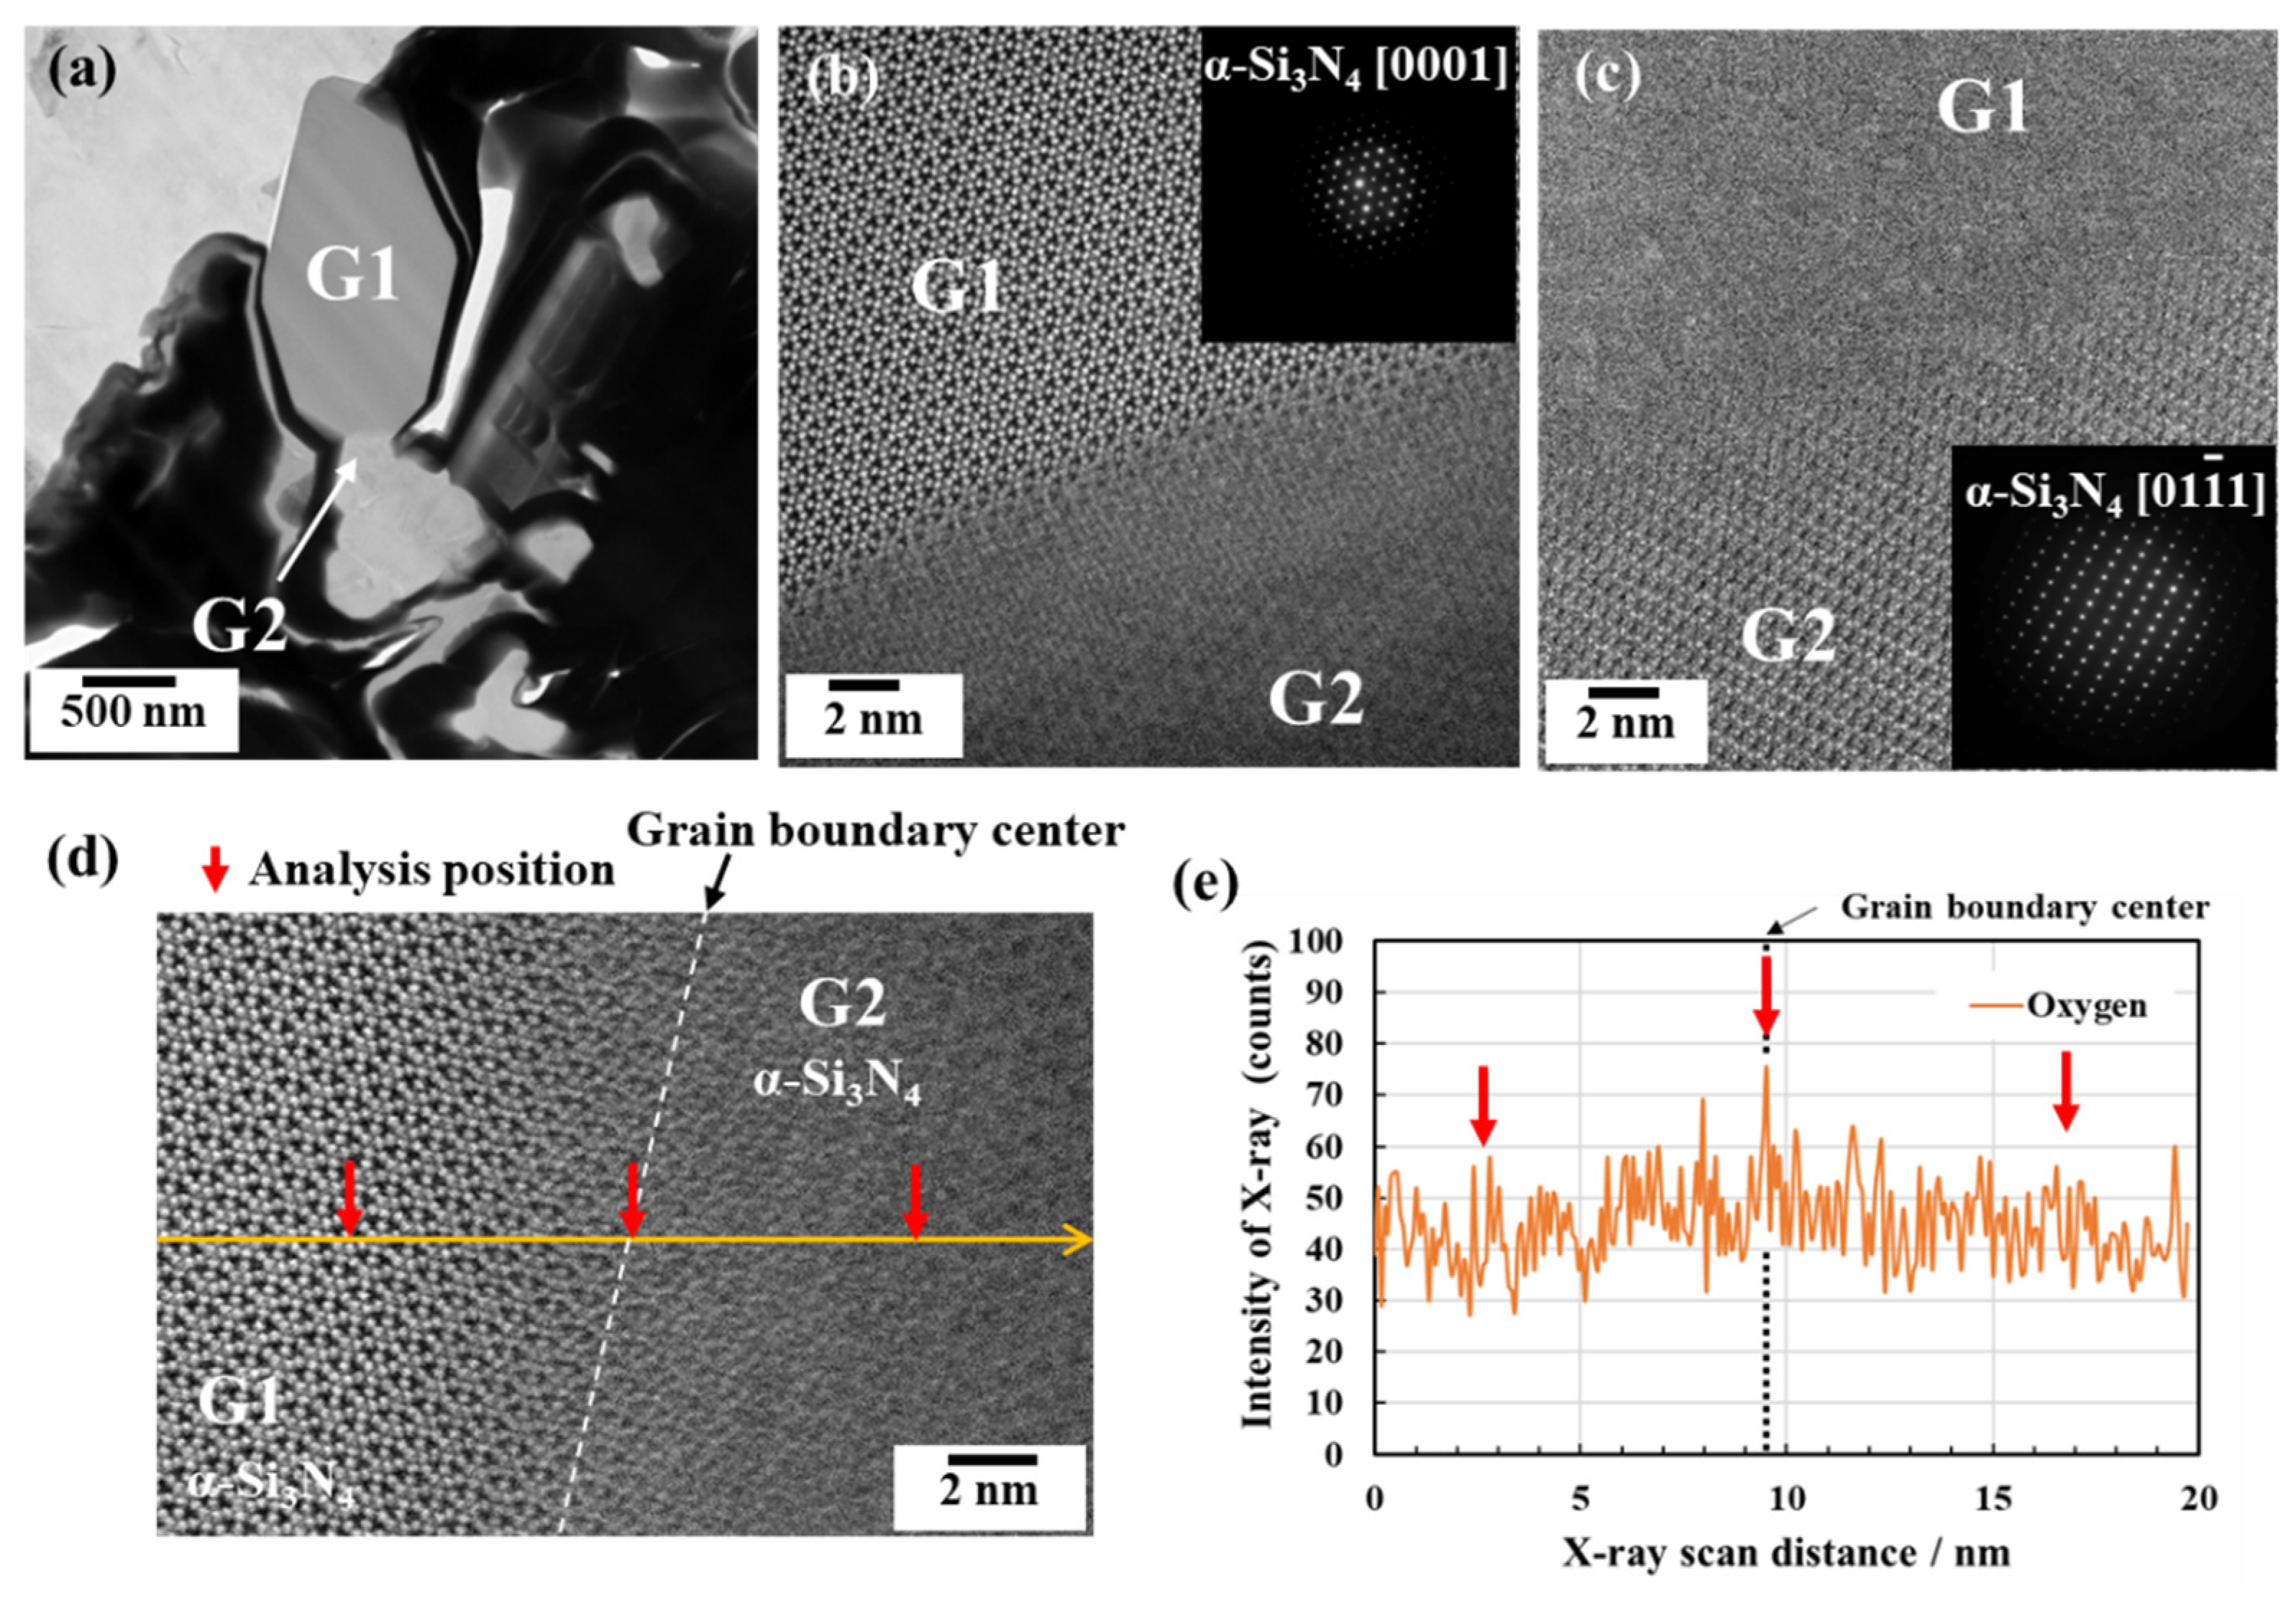
A typical TEM image of the Sample 1 is shown in Figure 4a. Within this image, two grains labeled G1 and G2 were selected.
The HAADF-STEM image of the G1 and the SAED pattern shown in Figure 4b corresponded to the plane orientation adjusted to the [0001] zone axis of α-Si3N4. Analogously, that of the G2 shown in Figure 4c corresponded to the plane orientation adjusted to the [01 1 ¯ 1] zone axis of α-Si3N4. Accordingly, the two-grain boundary between the G1 and G2 (GB1/2) was assigned as α/α-phase.
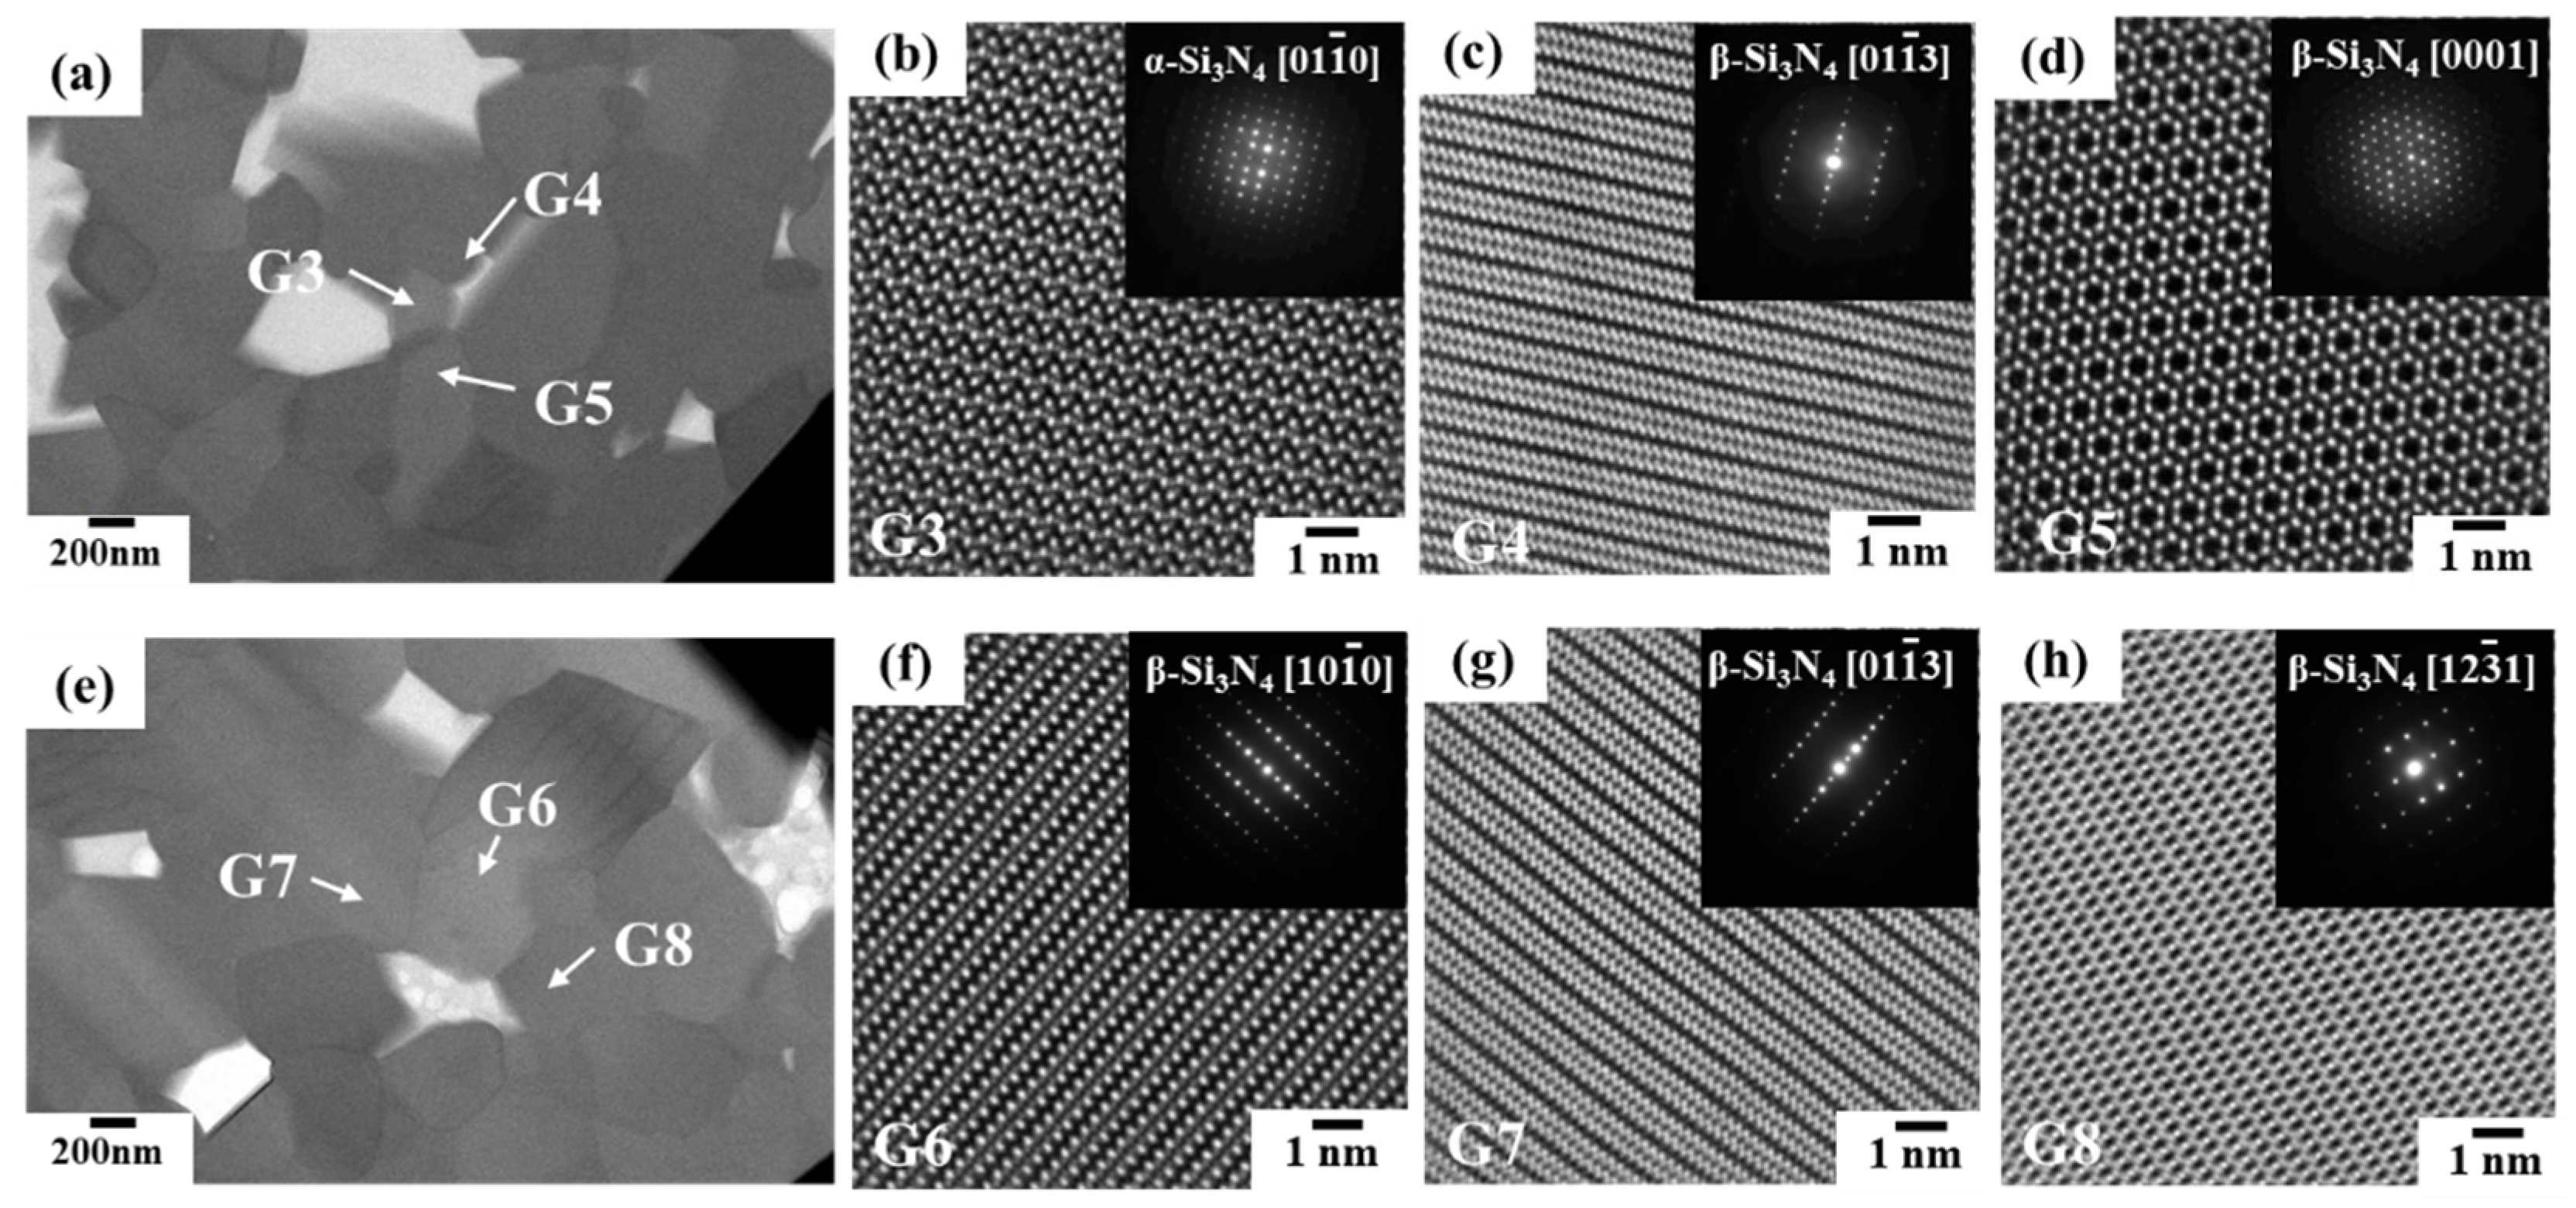
Further nanostructure characterization was performed on Sample 1 and the results are summarized and shown in Figure 5. Three grains labeled G3, G4 and G5 in the BF-STEM image shown in Figure 5a were selected. The HAADF-STEM image and the SAED pattern analyses resulted in assigning the G3 as α-Si3N4 (Figure 5b) and the G4 as β-Si3N4 (Figure 5c), while the G5 (Figure 5d) exhibited a typical HAADF-STEM image of the basal plane observed from the [0001] direction of β-Si3N4 [39], indicating the GB3/4 and GB3/5 as α/β-phase.
On the other hand, the selected grain labeled G6 in the BF-STEM image in Figure 5e exhibited a typical HAADF-STEM image of the prismatic plane observed from the [10 1 ¯ 0] direction of β-Si3N4 [40] (Figure 5f), and those labeled G7 and G8 in Figure 5e were also assigned as β-Si3N4 (Figure 5g,h), thus it was identified that both the GB6/7 and GB6/8 as β/β-phase.
(b) Sample 2 with β-phase content of 96.5 %
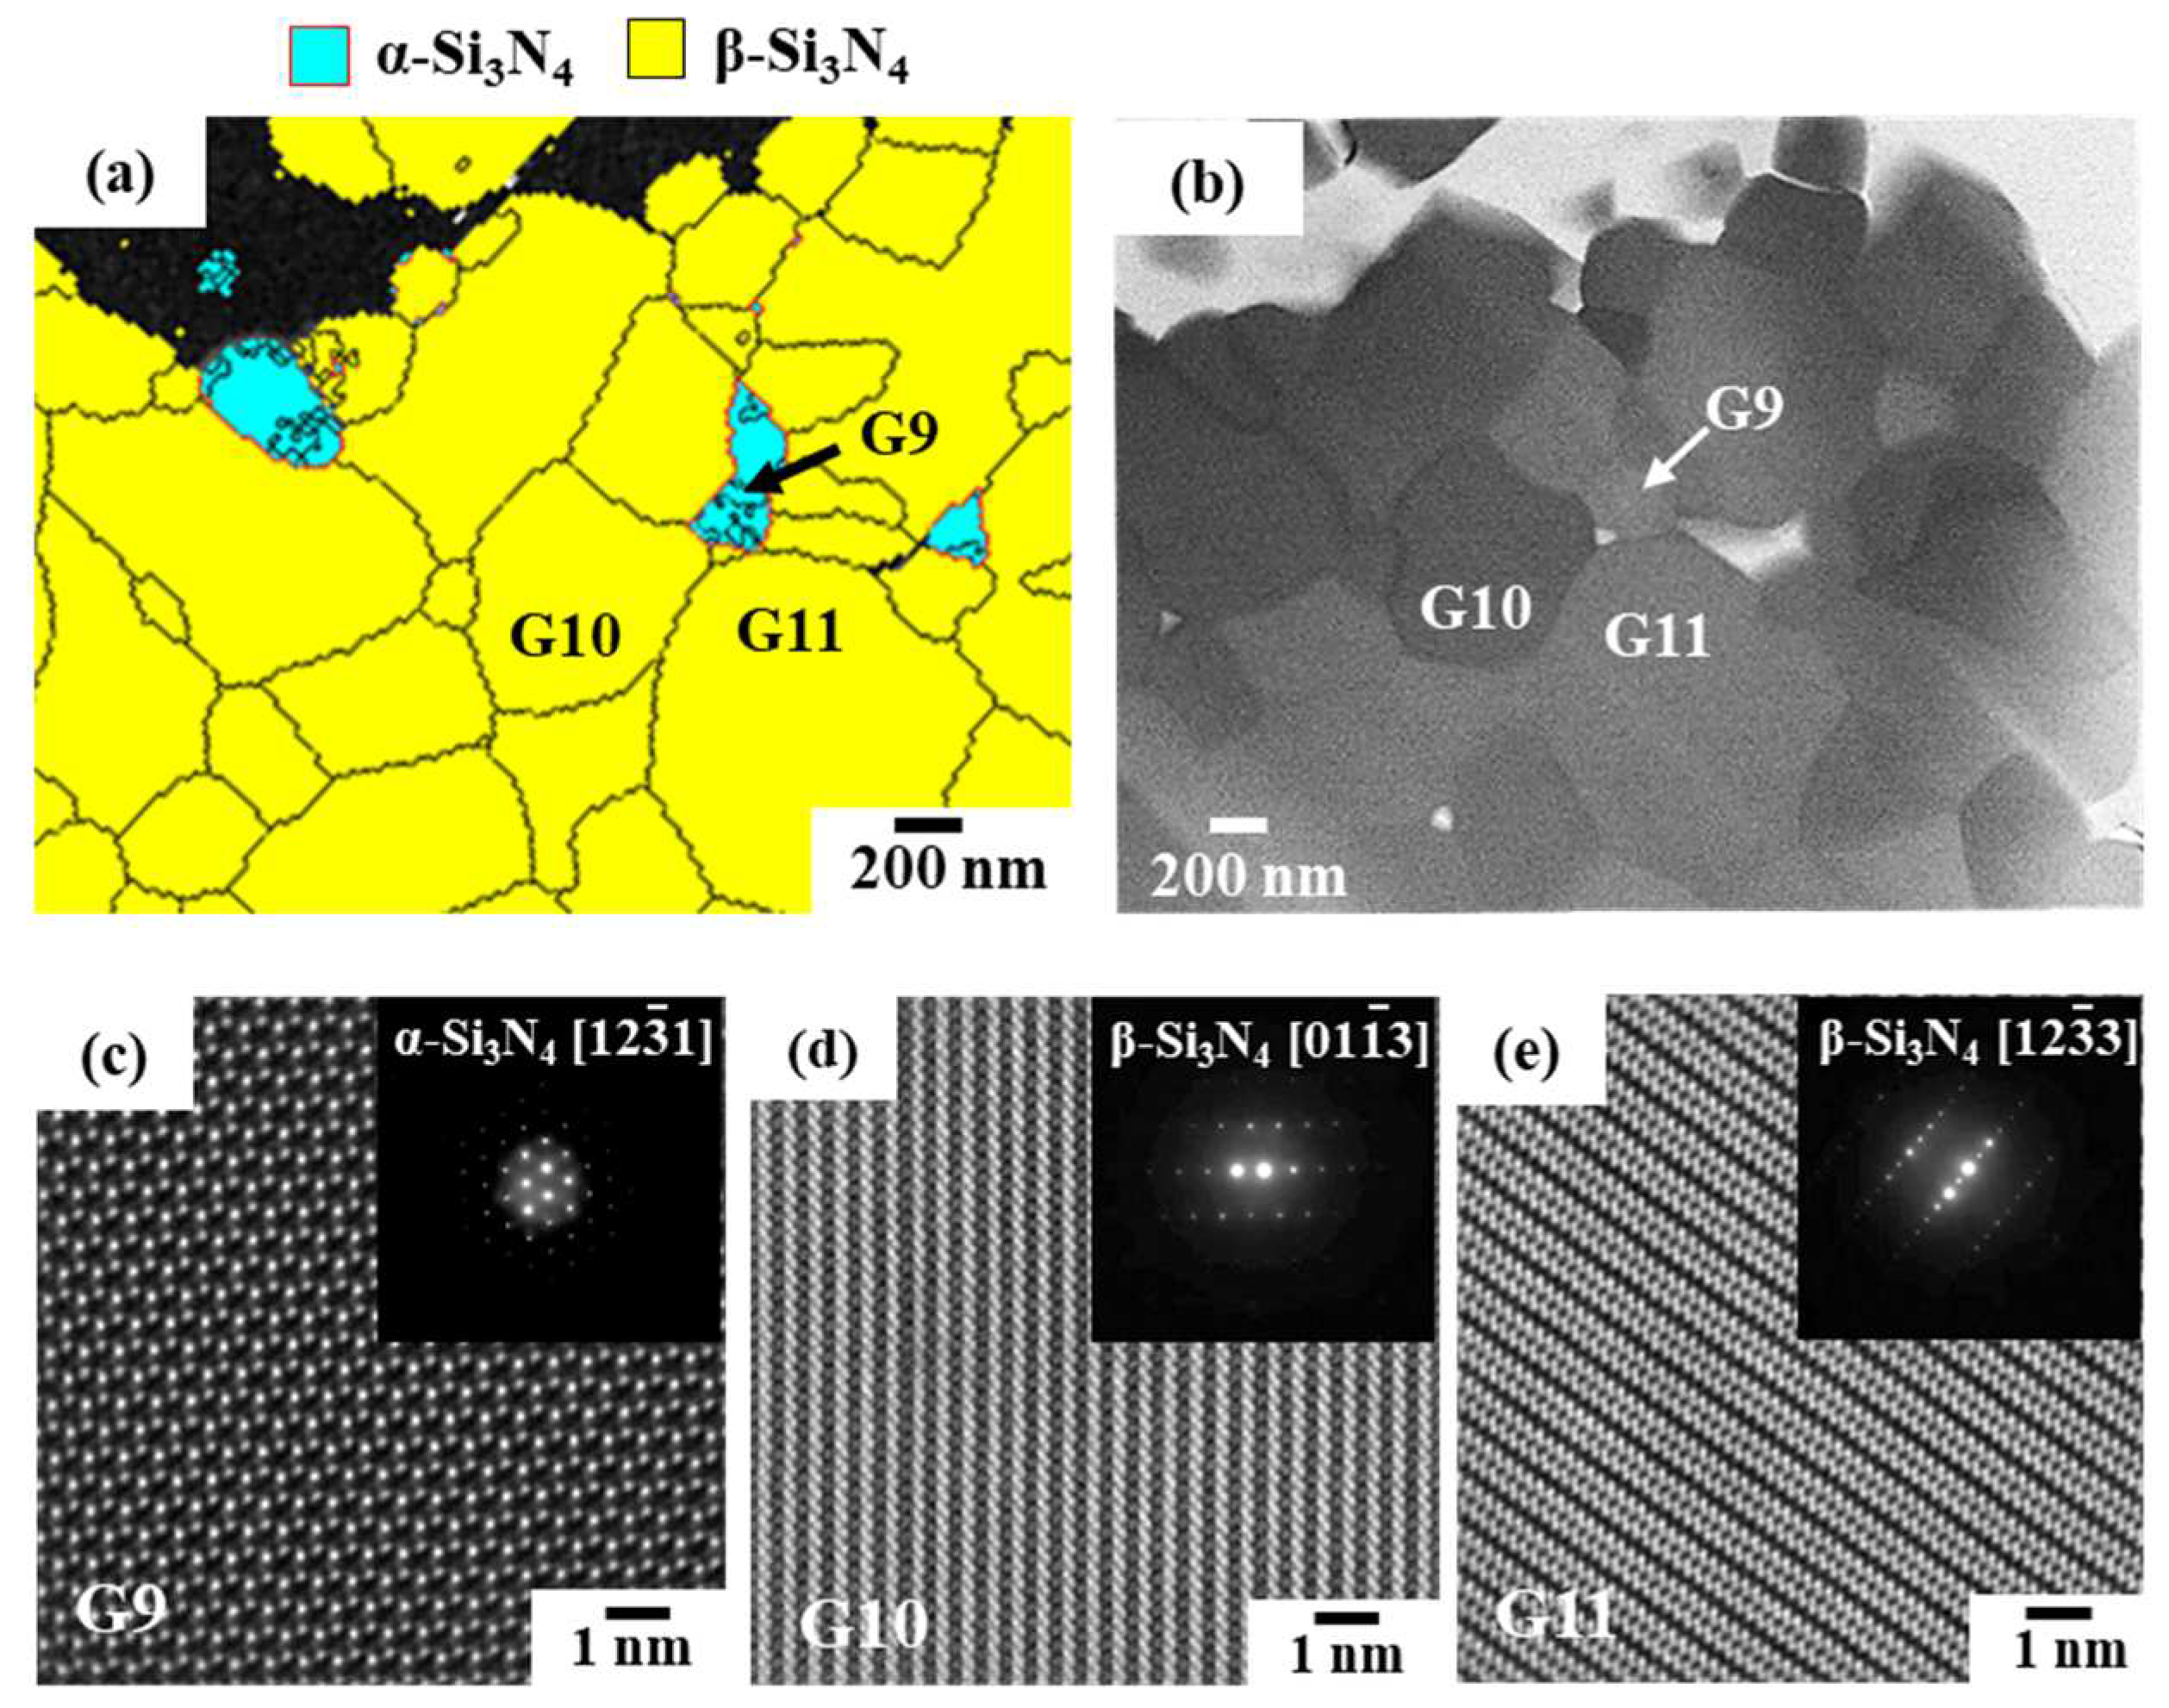
To find out α-Si3N4 crystal grains and the two-grain boundary of α/β-phase in Sample 2 with a high β-phase content of 96.5 %, the TEM-EBSD analysis was performed as shown in Figure 6a in which the yellow colored and blue colored grains were β-Si3N4 and α-Si3N4, respectively. Within the matrix composed of β-Si3N4 grains, the α-Si3N4 grains were located randomly, and their grain sizes were in the range of about 0.2 to 0.8 μm, while those of β-Si3N4 grains were approximately 0.15 to 1.00 μm.
Based on the results obtained by the EBSD combined with BF-STEM analyses (Figure 6a,b), three grains labeled G9, G10 and G11 were selected and confirmed as α-Si3N4, β-Si3N4 and β-Si3N4, respectively (Figure 6c–e). As a result, both the GB9/10 and GB9/11 were assigned as α/β-phase. Further analysis was performed for several two-grain boundaries in Sample 2, and as a typical result, the BF-STEM image, HAADF-STEM image, and SAED pattern of the selected grains labeled G12 and G13 were shown in Figure 7.

3.2.2. Oxygen impurity contents within Si3N4 crystal grains and at two-grain boundaries

Figure 4d,e show a HAADF-STEM image near the α/α-phase grain boundary between the G1 and G2 (GB1/2), and the result of STEM-EDS line scanning analysis to detect the changes in the O element near the grain boundary of the two grains, respectively. The HAADF-STEM image showed no obvious existence of glassy phases at the two-grain boundary, however, the detective count for O element was highest at the X-ray scan distance of 9.5 nm. Then, this position was fixed as the center of the two-grain boundary, and for measuring the oxygen impurity content, the STEM-EDS analysis was performed for the square area with 4.0 nm width and 8.0 nm length in each Si3N4 crystal grain, G1 and G2 as well as for the square area with 0.3 nm width and 2.0 nm length in the two-grain boundary, GB1/2 (Figure S1a). The center position of the former square sites was set at 7 nm from the center of the two-grain boundary as indicated by the red arrows in Figure 4d,e.
The spectra obtained by the STEM-EDS area analysis for the G1, G2 and GB1/2 are shown in Figure S2. The O element was detected as a minor peak in each spectrum, and the impurity O contents of the G1, G2 and GB1/2 were evaluated as 1.2, 1.0 and 1.0 wt%, respectively (Table S2).
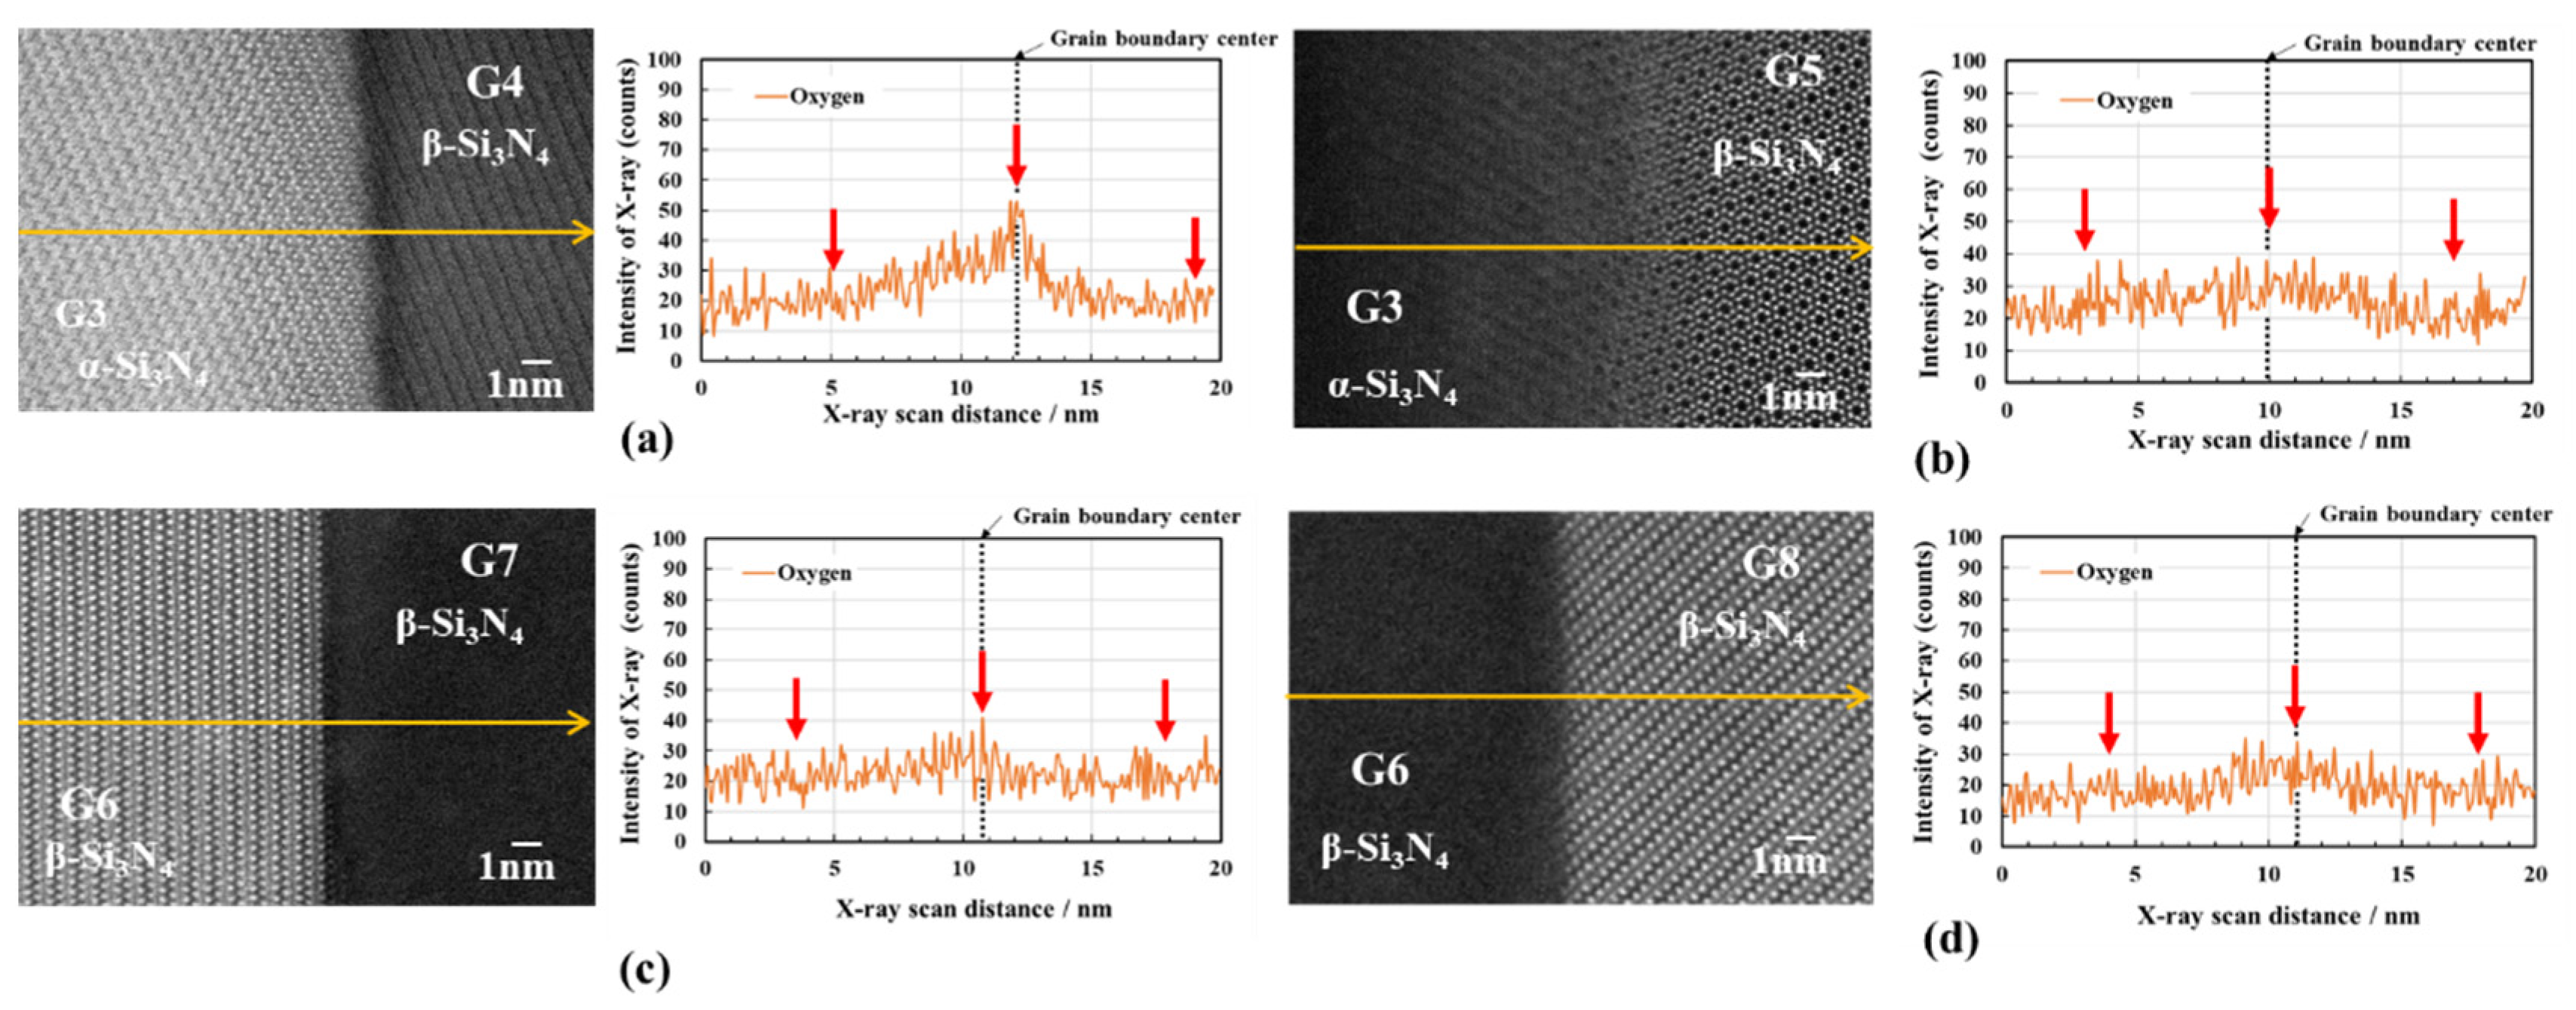
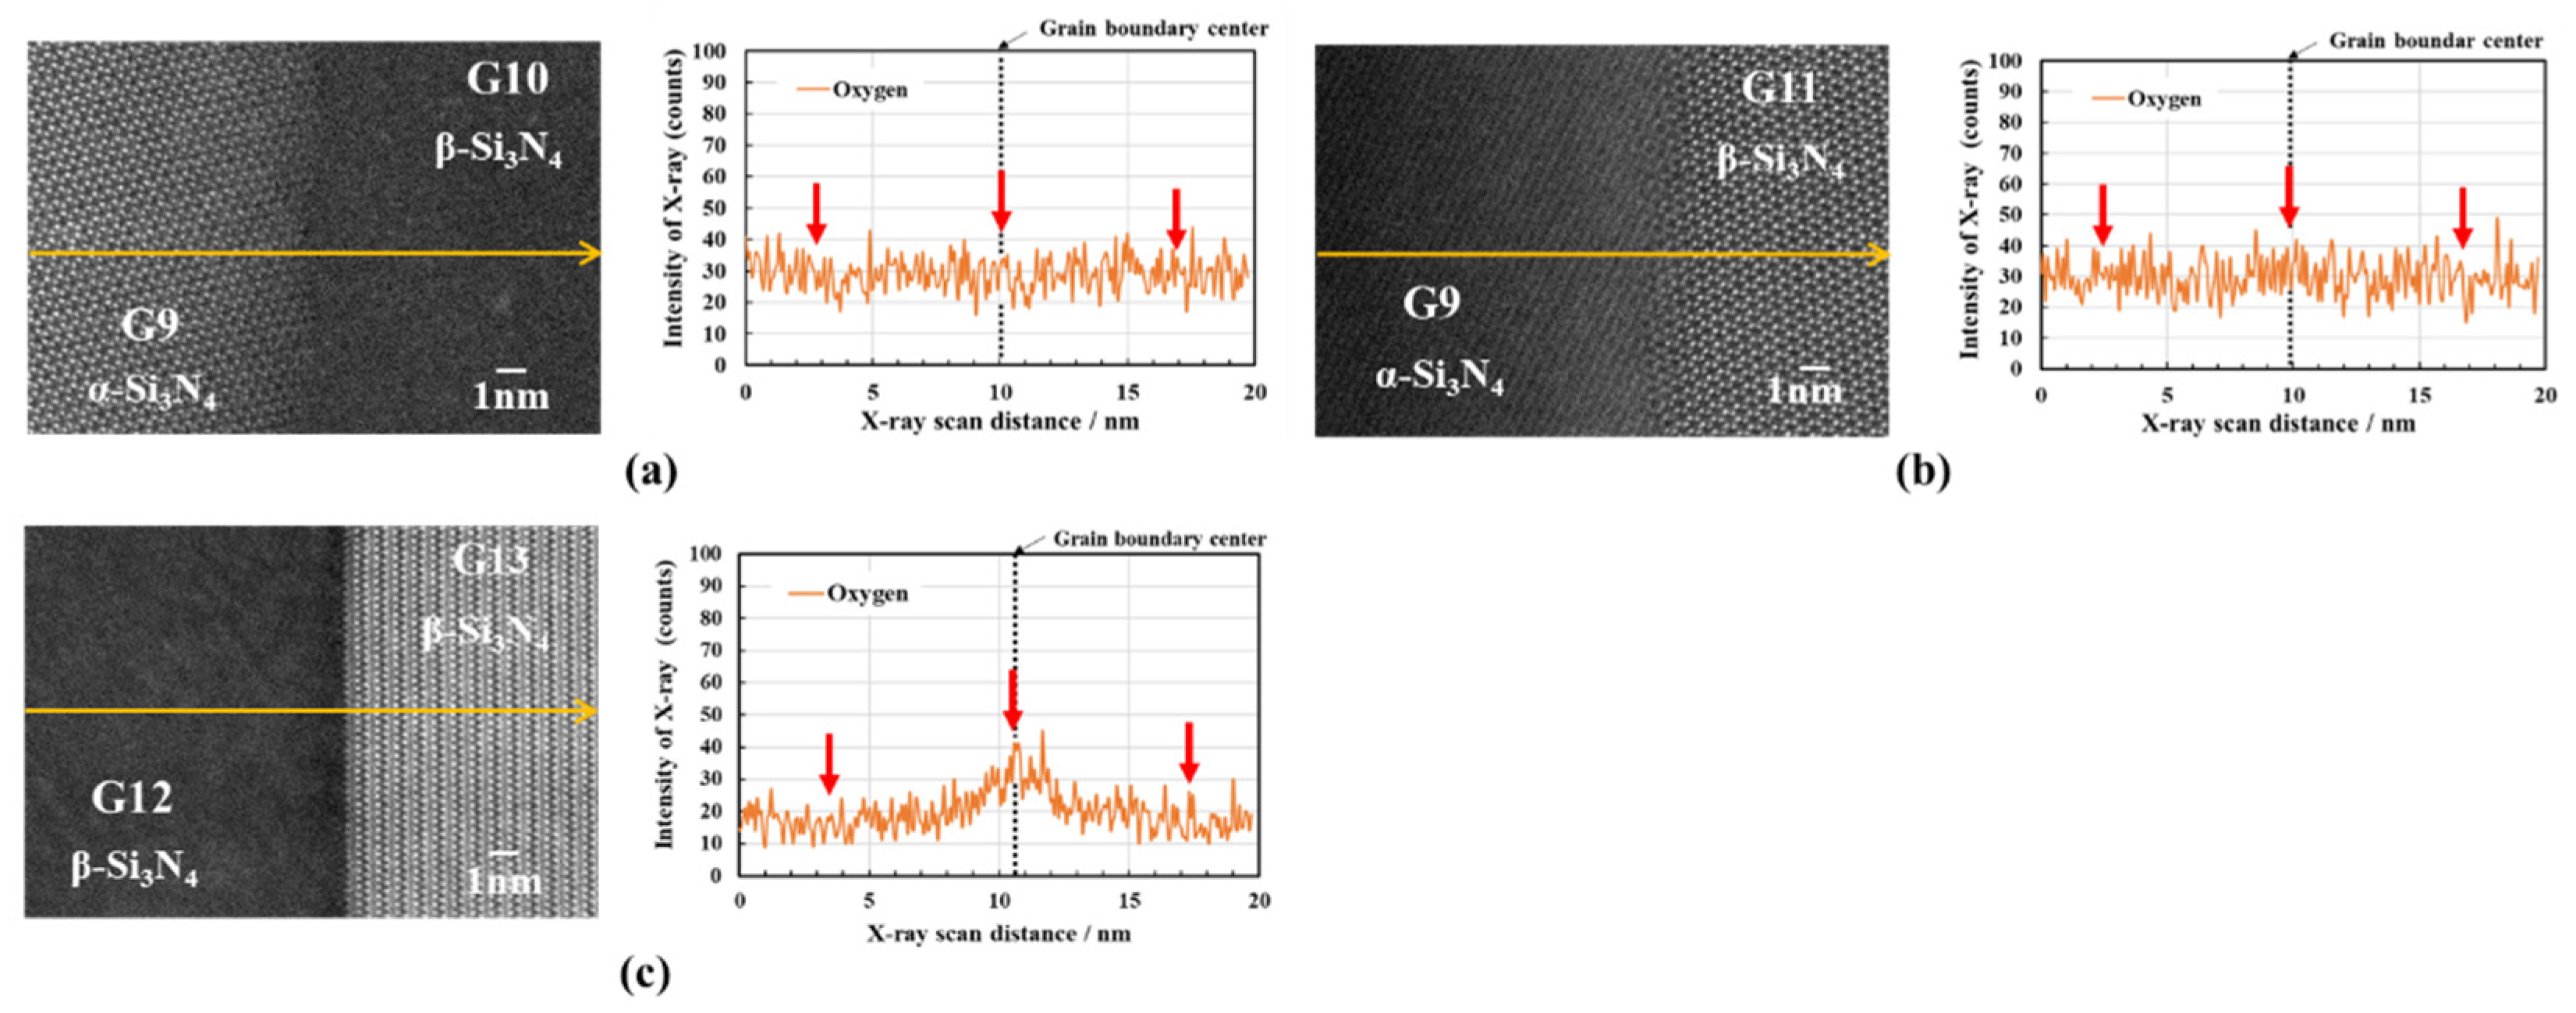
A set of the HAADF-STEM observation near the two-grain boundary accompanied by the STEM-EDS line scanning and area analysis for O element was performed on all the labeled grains G3 to G13 and their two-grain boundaries (Figure 8 and Figure 9 and Figure S1).
The HAADF-STEM image near the two-grain boundary GB3/4 shown in Figure 8a revealed the G3 and G4 grains in the edge-on condition. Here, when the grain boundary was under edge-on conditions, the incident direction of the electron beam was under off-Bragg conditions for each grain. On the other hand, it was difficult to obtain an edge-on condition for the grain boundary GB3/5, therefore, the observation was conducted by adjusting to the orientation of the G5 grain from the [0001] direction of β-Si3N4 crystal to obtain the clear image as shown in Figure 5d.
Analogously, the HAADF-STEM image analyses for the area nearby the GB6/7 (Figure 8c) and GB6/8 (Figure 8d) were conducted by adjusting to the orientation of the G6 grain [10 1 ¯ 0] direction of β-Si3N4 crystal to obtain clear images as shown in Figure 5f, and those for the area nearby the GB9/10 (Figure 9a) and GB9/11 (Figure 9b) were conducted by adjusting to the orientation of the grain G9 [12 3 ¯ 1] direction of β-Si3N4 crystal to obtain clear image as shown in Figure 6c. On the other hand, the HAADF-STEM image analysis for the area near the GB12/13 were conducted by adjusting to the orientation of the grain G13 [10 1 ¯ 0] direction of β-Si3N4 crystal to obtain a clear image as shown in Figure 9c.
All the HAADF-STEM images showed no obvious existence of glassy phases at the two-grain boundary. Then, the impurity O contents were evaluated in the same manner as shown in Figure S1. The impurity O contents are listed in Table S2 and compared with those for the G1, G2, and GB1/2 in Figure 10.
Due to the low impurity O contents (Table S1), It was indeed difficult to precisely evaluate the amount of impurity O by the present STEM-EDS area analysis. In this study, the relative difference in the amount of the impurity O was discussed for the samples. The results obtained for Sample 1 suggest that, regardless of the phase combination, impurity O content at the two-grain boundary is higher than those within the two Si3N4 crystal grains (Figure 10a). Sample 2 in which the β-phase content reaches 96.5% (Figure 10b) also shows a similar tendency, however, the impurity O contents measured for the Si3N4 crystal grains are varied: In Sample 1, the impurity O contents in the β-Si3N4 crystal grains are 0.4 to 0.9 wt% and found to be lower than those measured for the α-Si3N4 crystal grains (approximately 1.0 wt%). On the other hand, in Sample 2, in addition to the α-Si3N4 crystal grain G9 (1.5 wt%), particular β-Si3N4 crystal grains such as the G10 and G11 which form two-grain boundary with the α-Si3N4 crystal grain G9 exhibit relatively high impurity O content above 1.0 wt%, while other β-Si3N4 crystal grains such as G12 and G13 show much lower impurity O contents of 0.5 and 0.6 wt %, respectively.
The experimental results obtained in the present study suggest that the impurity oxygen was initially distributed uniformly both in the α-Si3N4 crystal grains and at the grain boundaries. Then, the 1900 °C -heat treatment promoted oxygen diffusion from Si3N4 crystal grains to their grain boundaries associated with the α- ⇀ β-phase transformation of the α-Si3N4 crystal grains.
Around the final stage of the α- ⇀ β-phase transformation reaching 96.5 % β-phase (Figure 10b), the impurity O seemed to be concentrated within the local area composed of α-Si3N4 crystal grain remained, the β-Si3N4 crystal grains surrounding the α-Si3N4 crystal grain and their two-grain boundaries. The α-Si3N4 crystal grain might act as an oxygen scavenger to increase the impurity O content within the local area since α-Si3N4 has been reported as an oxygen-stabilized phase in an approximate formula of Si11.5N15O0.5 [41,42]. However, the subsequent oxygen diffusion from the β-Si3N4 crystal grains to their grain boundaries proceeded, which reduced the resulting impurity O content in the β-Si3N4 crystal grains as low as 0.5 to 0.6 wt%. The impurity O concentrated at the grain boundaries was thought to be released from the sample via the grain boundary diffusion, and the resulting total impurity O content of the powder sample measured by the inert gas fusion method [12] was reduced to 0.12 wt% (Table S1).

3.3. Role of impurity oxygen in α- ⇀ β-Si3N4 phase transformation

It has been suggested that the formation of α-Si3N4 is attributed to kinetic reasons and metastable compared to β-Si3N4 [43,44]. As one possible pathway for the α- ⇀ β-Si3N4 phase transformation, Zakorzhevskii suggested that, at low impurity O content (0.5 to 0.7 wt%), the impurity O dissolves into the crystal lattice of α-Si3N4 to afford a metastable solid solution [45] which is the driving force of α- ⇀ β-Si3N4 phase transformation below the theoretical α-Si3N4 dissociation temperature [36]:
α-Si3N4 crystal → 3Si + 2N2 (dissociation) → β-Si3N4 crystallization
The impurity O content of the E10 sample powder after the 1900 °C -heat treatment for 5 h was as low as 0.64 wt% (2.74 mol% as SiO2), and thus silicon oxynitride liquid phase formation was excluded at such low SiO2 content [37,38], indeed the 1900 °C -heat treated powder samples exhibited clear Si3N4 crystal grain boundaries without secondary glassy phases (Figure 4, Figure 8 and Figure 9), and the final impurity O content after the 1900 °C-heat treatment for 20 h reduced to be 0.12 % (Table S1). Moreover, the α- ⇀ β-Si3N4 phase transformation experimentally observed in the present study proceeded mainly at 1900 °C under N2 pressure of 980 kPa, which was 33 °C lower than the theoretical α-Si3N4 dissociation temperature (1933 °C [46]). These results strongly suggest that the oxide additive-free α- ⇀ β-Si3N4 phase transformation observed in our present study is dominantly governed by the reaction Eq. (4) promoted by the metastable solid solution formation between the oxygen impurity (SiO2) and α-Si3N4 followed by dissociation to afford thermodynamically favorable β-Si3N4 accompanied by the release of oxygen.
α-Si3N4 crystal + xSiO2 → metastable solid solution →
[3Si + 2N2 + 1/2xO2] → β-Si3N4 crystal + 1/2xO2

4. Conclusions

In this study, high-purity commercial α-Si3N4 powder with an initial β-phase content of 3.7 %, total metal impurities below 50 ppm, and oxygen and carbon impurity contents of 1.23 and 0.11 wt%, respectively was used to investigate the oxide additive-free α- ⇀ β-Si3N4 phase transformation at 1600 to 1900 °C under nitrogen pressure of 980 kPa. The results can be summarized as follows:
(1)
The α- ⇀ β-Si3N4 phase transformation was found to proceed mainly at 1900 °C, and the extensive heat treatment for up to 20 h achieved full transformation to afford rod-like β-Si3N4 polycrystallites. This transformation temperature was found to be 33 °C lower than the theoretical α-Si3N4 dissociation temperature.
(2)
The impurity O contents of the powder samples after the 1900 °C -heat treatment for 5 h and 20 h were measured to be 0.64 and 0.12 wt %, respectively. At such lower oxygen contents, the silicon oxynitride liquid phase formation at 1900 °C was excluded according to the phase diagram reported for the binary Si3N4-SiO2 system.
(3)
The HAADF-STEM, as well as the STEM-EDS analyses performed on the 1900 °C heat-treated powder samples, also revealed no evidence for the formation of the secondary crystalline or glassy phases at the Si3N4 two-grain boundaries.
(4)
The HAADF-STEM/STEM-EDS analyses performed on the area near the two-grain boundary clarified that, at the β-phase content of 53. 5 %, regardless of the phase combination, the impurity oxygen content at the two-grain boundary was higher than those within the two Si3N4 crystal grains.
(5)
As a possible dominant mechanism, the oxide additive-free α- ⇀ β-Si3N4 phase transformation at 1900 °C was suggested to be governed by the formation of metastable solid solution between the α-Si3N4 and the impurity oxygen remained at approximately 0.6 wt%, which promoted the dissociation below the theoretical α-Si3N4 dissociation temperature to afford thermodynamically favorable β-Si3N4. Along with the β-Si3N4 formation, the impurity oxygen was concentrated at the Si3N4 crystal grain boundaries and subsequently released from the sample via the grain boundary diffusion.

Supplementary Materials

The following supporting information can be downloaded at the website of this paper posted on Preprints.org. Figure S1: Position of areas within the Si3N4 crystal grains and at the two-grain boundary selected for measuring the oxygen content by TEM-EDS analysis. (a) G1 and G2, (b) G3 and G4, (c) G3 and G5, (d) G6 and G7, (e) G6 and G8, (f) G9 and G10, (g) G9 and G11, and (d) G12 and G13.; Figure S2: The spectra obtained by the STEM-EDS area analysis for (a) grain G1, (b) grain G2, and (c) the two-grain boundary between G1 and G2 (GB1/2).; Table S1: Impurity oxygen and carbon contents and β-phase content evaluated for Si3N4 powder samples.; Table S2: Silicon, nitrogen and oxygen contents in Si3N4 crystal grains and their two-grain boundaries evaluated by STEM-EDS analysis.

Author Contributions

Conceptualization, H.I.; methodology, H.I. K.K. and T.K.; investigation, H.I. K.K. and T.K.; Formal analysis, S.H. and T.A.; writing—original draft preparation, H.I.; writing—review and editing, Y.I.; supervision, Y.I. All authors have read and agreed to the published version of the manuscript.

Funding

The authors did not receive support from any organization for this work.

Conflicts of Interest

The authors declare no conflict of interest.

References

  1. Yang, Y.; Gomba, L. D.; Rodriguez, R.; Mak, C.; Emadi, A. Automotive Power Module packing: Current Status and Future Trends. IEEE Access. 2020, 8, 160126-160144. [CrossRef]
  2. Mustain, H. Si3N4 SUBSTRATE FOR HYBRID / ELECTRIC VEHICLE DRIVE TRAIN INVERTER POWER MODULE Design-to-cost Si3N4 Ag-free AMB Metal Ceramic Substrate. Heraeus Electronics – Battery Show North America. September 2022, PowerPoint Presentation (thebatteryshow.com)https://www.thebatteryshow.com/content/dam/Informa/amg/novi/2022/docs/14_45%20-%20Mustain.pdf.
  3. Hirao, K.; Nagaoka, T.; Brito, M. E.; Kanzaki, S. Microstructure Control of Silicon Nitride by Seeding with Rodlike β-Silicon Nitride Particles. J. Am. Ceram. Soc.1994, 77, 1857-1862. [CrossRef]
  4. Imamura, H.; Hirao, K.; Brito, M. E.; Toriyama, M.; Kanzaki, S. Further Improvement in Mechanical Properties of Highly Anisotropic Silicon Nitride Ceramics. J. Am. Ceram. Soc. 2000, 83, 495-500. [CrossRef]
  5. Yokota, H.; Ibukiyama, M. Effect of the addition of β-Si3N4 nuclei on the thermal conductivity of β-Si3N4 ceramics. J. Eur. Ceram. Soc. 2003, 23, (8), 1183-1191, doi.org/10.1016/S0955-2219(02)00292-3.
  6. Liang, Z. H.; Zhang, H.; Gui, L.; Li, J.; Peng, G.; Jiang, G. Effects of whisker-like β-Si3N4 seeds on phase transformation and mechanical properties of α to β-Si3N4 composites using MgSiN2 as additives. Ceram Int. 2013, 39, 2743-2751. [CrossRef]
  7. Dai, J.; Li, J.; Chen, Y.; Yang, L.; Sun, G. Preparation of the rod-like β-Si3N4 particles favoring the self-reinforcing Si3N4 ceramics. Mater. Res. Bull. 2003, 38, 609-615. [CrossRef]
  8. Vućković, A.; Bošković, S.; Matović, B.; Vlajić, M.; Krstic, V. Effect of β- Si3N4 seeds on densification and fracture toughness of silicon nitride. Ceram. Int. 2006, 32, 303-307. [CrossRef]
  9. Hirao, K.; Tsuge, A.; Brito, M.E.; Toriyama, M.; Kanzaki, S. Preparation of Rod-like β-Si3N4 Single Crystal Particles. J. Ceram. Soc. Japan. 1993, 101, 1078-1080. [CrossRef]
  10. Imamura, H.; Kawata, T.; Sobue, M. Hitachi Metals Co. ltd., Methods for producing silicon nitride and silicon nitride sintered specimens and circuit boards using them. Japanese Patent 3775335. 2006, March, 3.  .
  11. Imamura, H.; Kawata, T.; Sobue, M. Hitachi Metals Co. ltd., Methods for producing silicon nitride and silicon nitride sintered specimens and circuit boards using them. Japanese Patent 4518020. 2010, May, 28.
  12. Imamura, H.; Kawata, T.; Honda, S.; Iwamoto, Y. A facile method to produce rodlike β-Si3N4 seed crystallites for bimodal structure controlling. J. Am. Ceram. Soc. 2023, 106, (3), 1694-170.
  13. Imamura, H.; Kawata, T.; Honda, S.; Iwamoto, Y. Thermal conductivity improvement in Si3N4 ceramics via grain purification. J. Am. Ceram. Soc. in press. [CrossRef]
  14. Sarin, V. K. On the α-to-β Phase Transformation in Silicon Nitride. Mater. Sci. Eng. 1998, A105, (106), 151-159. [CrossRef]
  15. Goto, Y.; Thomas, G. Phase Transformation and Microstructure Change of Si3N4 During Sintering. J. Mater. Sci. 1995, 30, 2194-2200. [CrossRef]
  16. Greskovich, C.; Prochazka, S. Observation on the α ⇀ β-Si3N4 transformation. J. Am. Ceram. Soc. 1977, 60, (9-19), 471-472. [CrossRef]
  17. Bowen, L. J.; Weston, R. J.; Carruthers, T. G.; Brook, R. J. Hot-pressing and α-β phase transformation ins silicon nitride. J. Mater. Sci. 1978, 13, 341-350. [CrossRef]
  18. Kim, J. R.; Kim, C. H. Effects of ZrO2 and Y2O3 dissolved zyttrite on the densification and the α/β phase transformation of Si3N4 in Si3N4-ZrO2 composite. J. Mater. Sci. 1990, 25, 493-498. [CrossRef]
  19. Park, J. Y.; Kim, J. R.; Kim, C. H. Effects of free silicon on the α to β phase transformation in silicon nitride. J. Am. Ceram. Soc. 1987, 70, (10), C240-C242. [CrossRef]
  20. Messier, D. R.; Riley, F. L.; Brook, R. J. The α/β Silicon Nitride Phase Transformation. J. Mater. Sci. 1978, 13, 1119-1205. [CrossRef]
  21. Homma, K.; Okada, H.; Fujikawa, T.; Tatuno, T. HIP sintering of silicon nitride without additives. Yogyo-Kyokai-Shi. 1987, 95, 299-234. [CrossRef]
  22. Tanaka, I.; Pezzotti, G.; Miyamoto, Y.; Okamoto, T. Fracture toughness of Si3N4 and its Si3N4 whisker composite without sintering aids. J. Mater. Sci. 1993, 28, 4217-4222. [CrossRef]
  23. Tanaka, I.; Pezzotti, G.; Okamoto, T.; Miyamoto, Y.; Koizumi, M. Hot isostatics press sintering and properties of silicon nitride without additives. J. Am. Ceram. Soc. 1989, 72, 1656-1660. [CrossRef]
  24. Lu, P.; Danforth, S. C.; Symons, W. T. Microstructure and grain-boundary characterization of HIP’ed high-purity silicon nitride. J. Mater. Sci. 1993, 28, 4217-4222. [CrossRef]
  25. Hou, Z.; Wang, H.; Yang, Y.; Song, X.; Chen, S.; Wan, B. S.; Zhao, X.; Shang, M.; Chen, B. High-pressure synthesis of high-performance β-Si3N4 bulk without additives, Ceram. Int. 2020, 46, 12449-12457. [CrossRef]
  26. Bradley, R. S.; Murnro, D. C.; Whitfield, M. The reactively and polymorphism of selected nitrides at high temperatures and high pressures. J. Inorg. Nucl. Chem. 1966, 1803-1812. [CrossRef]
  27. Pejryd, L. The Effect of Temperature and Yttria Content on the Properties of Hot Isostatically Pressed Si3N4. Mater. Sci. and Eng. 1988, A105/106, 169-174. [CrossRef]
  28. Shin-Etsu Chemical Co.,Ltd. [homepage on the internet]. Production Introduction of Rare-Earth Oxides. Available from https://www.rare-earth.jp/en/product.html.
  29. Clarke, D. R.; Thomas, G. Grain Boundary Phases in a Hot-Pressed MgO Fluxed Silicon Nitride. J. Am. Ceram. Soc. 1995, 60, (11-12), 491-494. [CrossRef]
  30. Kleebe, H. J.; Cinibulk, M. K.; Cannon, R. M.; Rühle, M. Statistical Analysis of the intergranular Film Thickness in Silicon Nitride Ceramics. J. Am. Ceram. Soc. 1993, 76, (8), 1969-1977. [CrossRef]
  31. Kleebe, H. J. Structure and Chemistry of interface in Si3N4 Ceramics Studied by TEM. J. Ceram. Soc. Japan. 1997, 105, (6), 453-475. [CrossRef]
  32. Kim, S. K.; Zhang, Z.; Kasiser, U. Local symmetry braking of a thin crystal structure of β-Si3N4 as revealed by spherical aberration corrected high-resolution transmission electron microscopy images. J. Electron. Micro. 2012, 61, (3), 145-157. [CrossRef]
  33. Babini, G. N.; Bellosi, A.; Vincenzini, P. Densification and α-β Transformation Mechanisms During Hot Presing of Si3N4-Y2O3-SiO2 Compositions. Mater. Chem. Phys. 1984, 11, 365-400. [CrossRef]
  34. Yang, J.F.; Shan, S.Y.; Janssen, R.; Schneider, G.; Ohji, T.; Kanzaki, S. Synthesis of fibrous β-Si3N4 structured porous ceramics using carbothermal nitridation of silica. Acta. Mater. 2005, 53, 2981-2990. [CrossRef]
  35. Zakorzhevskii, V. V. Effect of Oxygen Impurities and Synthesis Temperature on the Phase Composition of the Products of Self-Propagating High-Temperature Synthesis of Si3N4. Inorg. Mater. 2018, 54, 349-353. [CrossRef]
  36. Weiss, J.; Lukas, H. L; Lorenz, J.; Petzow, G.; Krieg, H. Calculation of heterogeneous phase equilibria in oxide-nitride systems:I.The quaternary system C-Si-N-O. Calphad: Comput Coupling Phase Digar Thermochem. 1981, 5, (2), 125-140. [CrossRef]
  37. Hillert, M.; Jonsson, S.; Sundman, B. Thermodynamic Calculation of the Si-N-O system, Z. Metallkd. 1992, 83, (9), 648-654. [CrossRef]
  38. Dai, J.; Li, J.; Chen, Y. The phase transformation behavior of Si3N4 with single Re2O3 (Re = Ce, Nd, Sm, Eu, Gd, Dy, Er, Yb) additive. Mater. Chem. Phys. 2003, 80, 356-359. [CrossRef]
  39. Hiraga, K.; Tsuno, K.; Shindo, D.; Hirabayashi, M.; Hayashi, S.; Hirai, T. Structure of α- and β-Si3N4 observed by 1MV electron microscopy. Philos. Mag. A. 1983, 47, (4), 483-489. [CrossRef]
  40. Ziegler, A.; Kisielowski, C.; Hoffmann, M. J.; Ritchie, R. O. Atomic Resolution Transmission Electron Microscopy of the intergranular Structure of a Y2O3-containing Silicon Nitride Ceramic. J. Am. Ceram. Soc. 2003, 86, (10), 1777-1785. [CrossRef]
  41. Riley, F. L. Silicon nitride and related materials. J. Am. Ceram. Soc. 2000, 83, 245-265. [CrossRef]
  42. Priest, H. H.; Burns, F. C.; Priest, G. L.; Skaar E. C. The Oxygen Content of Alpha Silicon Nitride. J. Am. Ceram. Soc. 1973, 56, (7), 395, doi.10.1111/j.1151-2196.1973.tb12700.x.
  43. Seiferit, H. J.; Peng, J. Q.; Lukas, H. L. Aldinger F. Phase equilibria and thermal analysis of Si-C-N ceramics, J. Alloy. Compd. 2001, 320, 251-261. [CrossRef]
  44. Xu, B.; Dong, J.; McMillan, P. F.; Shebanova, O.; Salamat, A. Equilibrium and metastable phase transitions in silicon nitride at high pressure: a first-principles and experimental study. Phys. Rev. B. 2011, 84, 014113. [CrossRef]
  45. Liang, J. J.; Topor, L.; Navrotsky, A.; Mitomo, M. Silicon Nitride: enthalpy of formation of α and β-poly-morphs and the effect of C and O impurities. J. Mater. Res. 1999, 14, 1959-1968. [CrossRef]
  46. Iwamoto, Y. PhD thesis: Microstructure Control of Si-based Non-Oxide Ceramics through Precursor Design, p. 86, Graduate School of Frontier Sciences, Department of Advanced Materials Science: The University of Tokyo. 2004. [CrossRef]
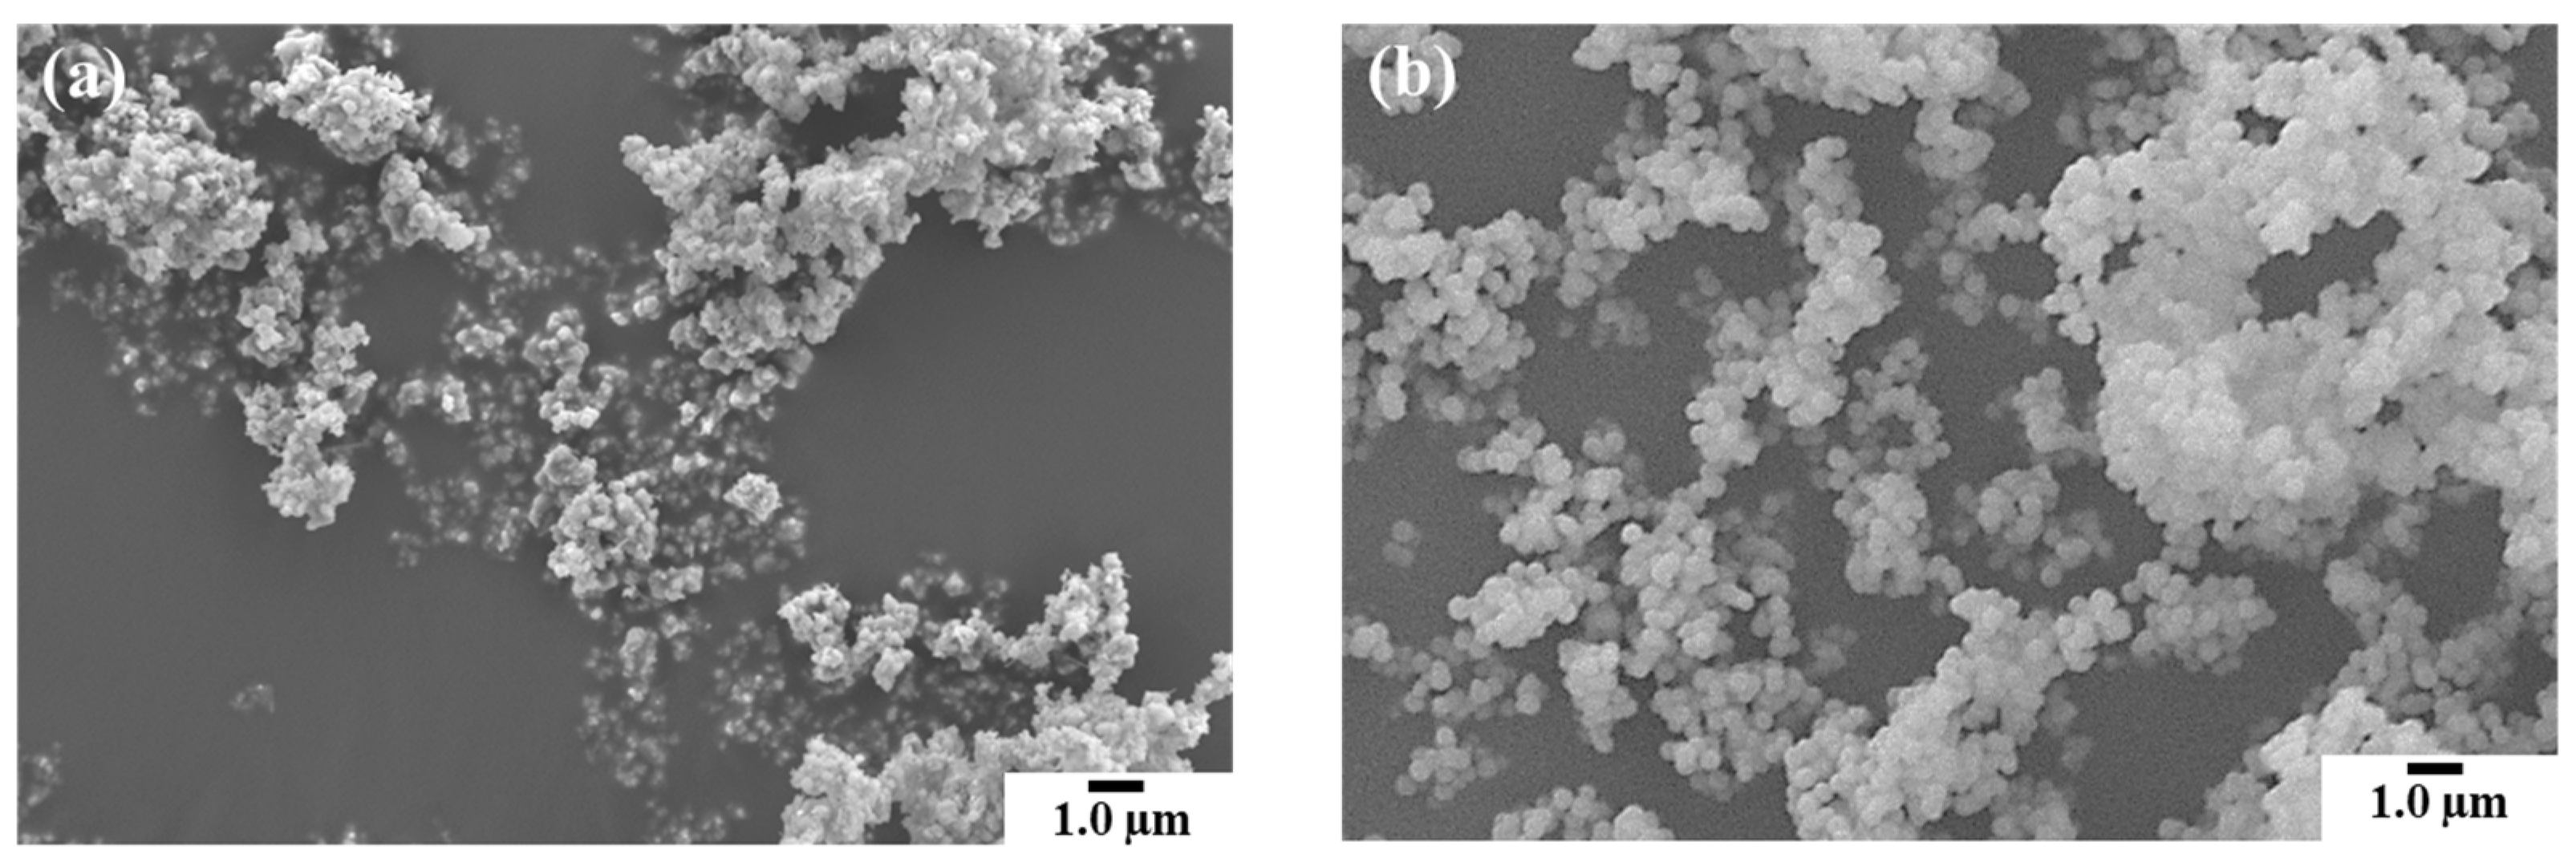
Figure 1. SEM images showing the morphology of as-received starting powders of (a) Si3N4 and (b) Y2O3.
Preprints 87594 g001
Figure 2. Morphologies of sample powders: (a-c) E10+1 mol% Y2O3 and (d-i) E10. Heat treatment condition: (a), (d) 1600 °C for 5 h, (b), (e) 1800 °C for 5 h, (c), (f) 1900 °C for 5 h, and 1900 °C for (g) 12 h, (h) 18 h and (i) 20 h.
Preprints 87594 g002
Figure 3. (a) Correlation between the heat treatment temperature for 5 h and β-phase content and SiO2 impurity content of E10 and E10+1 mol% Y2O3 power samples. (b) Correlation between the heat treatment time at 1900 ℃ and β-phase content and the relation between β-phase content and SiO2 impurity content of the E10 powder sample.
Preprints 87594 g003
Figure 4. Results of nanostructure characterization for Sample 1 with β-phase content of 53.5 %. (a) Low magnification TEM image (The dark contrast surrounding the Si3N4 grains corresponds to the protective compound (see experimental section, 2.2. Characterizations)) and HAADF-STEM image and SAED pattern of the Si3N4 crystal grain labeled G1 (b) and G2 (c) shown in (a). (d) HAADF-STEM image showing near the two-grain boundary of the G1 and G2, and (e) STEM-EDS line analysis for oxygen element performed on the orange line shown in (d).
Preprints 87594 g004
Figure 5. Results of phase identifications for the crystal grains in Sample 1 with β-phase content of 53.5 %. (a) and (e) Typical BF-STEM images showing Si3N4 polycrystallites. HAADF-STEM image and SAED pattern of the Si3N4 crystal grain labeled G3 (b), G4 (c) and G5 (d) shown in (a), and those of grain labeled G6 (f), G7 (g) and G8 (h) shown in (e).
Preprints 87594 g005
Figure 6. (a) TEM-EBSD analysis performed on Sample 2 with β-phase content of 96.5 %. Yellow- and blue-colored grains indicate β-Si3N4 and α-Si3N4, respectively. (b) BF-STEM observation for the area analyzed by the TEM-EBSD analysis. HAADF-STEM image and SAED pattern of the Si3N4 crystal grain labeled G9 (c), G10 (d) and G11 (e) shown in (b).
Preprints 87594 g006
Figure 7. Results of phase identifications for the crystal grains in Sample 2 with β-phase content of 96.5 %. (a) Typical BF-STEM images showing Si3N4 polycrystallites. HAADF-STEM image and SAED pattern of the Si3N4 crystal grain labeled G12 (b) and G13 (c).
Preprints 87594 g007
Figure 8. Results of HAADF-STEM image and STEM-EDS line analyses for oxygen element performed on the area near the two-grain boundary of the labeled grains of (a) G3 and G4, (b) G3 and G5, (c) G6 and G7 and (d) G6 and G8 in Sample 1. Red arrows indicate the center position of the area analyzed by the STEM-EDS analysis for measuring oxygen content shown in Figure S2.
Preprints 87594 g008
Figure 9. Results of HAADF-STEM image and STEM-EDS line analyses for oxygen element performed on the area near the two-grain boundary of the labeled grains of (a) G9 and G10, (b) G9 and G11 and (c) G12 and G13 in Sample 2. Red arrows indicate the center position of the area analyzed by the STEM-EDS analysis for measuring oxygen content shown in Figure S2.
Preprints 87594 g009
Figure 10. Oxygen contents in Si3N4 crystal grains and their two-grain boundaries evaluated for (a) Sample 1 with a β-phase content of 53.5 % and (b) Sample 2 with a β-phase content of 96.5 % by STEM-EDS analysis.
Preprints 87594 g010
Disclaimer/Publisher’s Note: The statements, opinions and data contained in all publications are solely those of the individual author(s) and contributor(s) and not of MDPI and/or the editor(s). MDPI and/or the editor(s) disclaim responsibility for any injury to people or property resulting from any ideas, methods, instructions or products referred to in the content.
Copyright: This open access article is published under a Creative Commons CC BY 4.0 license, which permit the free download, distribution, and reuse, provided that the author and preprint are cited in any reuse.
Prerpints.org logo

Preprints.org is a free preprint server supported by MDPI in Basel, Switzerland.

Subscribe

© 2024 MDPI (Basel, Switzerland) unless otherwise stated