1. Introduction
The advancement of high-throughput technologies has led to the availability of a massive amount of expression data (
Guzzi and Roy 2020). When adequately analyzed, it could lead to a significant breakthrough in the field of medicine. It is possible when we can infer genome-scale large GRNs with many thousand genes and visualize the network effectively. It may help a system biologist to understand the underlying molecular dynamics properly. One gene’s influence on another gene’s activity is significant (
de la Fuente 2010) but difficult to detect in a wet lab environment. As a result, computational techniques and approaches are crucial in inferring near-optimal network structures (
Teji et al. 2022,
Teji and Roy 2022), which may be confirmed by wet lab experiments. The analysis and interpretation of biological network relationships are becoming a key research focus in current computational biology, with implications for genomics medicine. Several challenges occur when dealing with large regulatory networks, including thousands of genes/protein interactions. As a result, the scientific community, computer engineers, statisticians, and biologists have joined forces to develop new techniques and algorithms to address these difficulties by creating open-source reconstruction and visualization tools (
Bayat 2002).
Several similar tools have been developed and used for the last few decades.
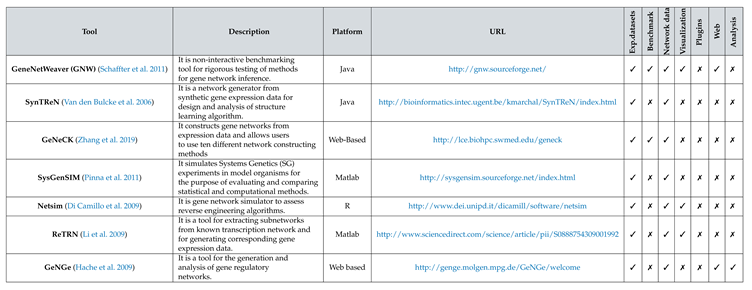
Table 1 lists a few of the presently available tools along with their available features and various information.
Most of the efforts to offer a web platform are limited to one or few inference methods (
Schaffter et al. 2011,
Hache et al. 2009). Some tools are built to provide benchmarking and synthetic data generation facilities (
Schaffter et al. 2011,
Zhang et al. 2019). Other than the inference of GRN, only some tools offer visualization of networks as an integral component (
Schaffter et al. 2011,
Di Camillo et al. 2009,
Li et al. 2009) of the tool. There is a lacking of a suitable platform for performing inference, visualization, network analysis, and benchmarking of GRN inference methods in an integrated fashion. As tool developers try to code the inference methods from scratch to fit their platform, it always has limitations in accommodating many methods quickly. A plethora of inference methods is available for free access. They are primarily developed using R script or Python and archived in public platforms like
Bioconductor (
Gentleman et al. 2004)
1. Such codes are bare scripts not understandable by the non-programmers. Moreover, they do not offer post-inference analysis on the same floor. Another interesting limitation of the available tools and methods is their scalability issue for inferring large-scale networks.
We developed a novel tool, NetRA, that offers an easy-to-use integrated web platform that uses original R scripts from Bioconductor and plugs into our proposed tool. Hence, state-of-the-art methods can be integrated with minimal effort into our tool with a similar input/output structure. Listed below are the critical contributions of our work.
A lightweight tool built upon NextJS, Python, R and Flask that provides the user to infer, visualize, and network analysis of large networks with ease.
Offered many complex network analysis facilities applicable to any network.
Server-side rendering is used for interactive visualization of large networks to reduce client burden.
A parallel inference engine has been integrated that can make any inference method handle large networks efficiently.
A benchmarking facility has been integrated to assess the prediction quality of inference methods on user-given networks. Our tool can also assess and compare any newly developed inference method with 11 candidate methods.
We evaluate the performance of eleven (11) candidate methods using our tool and compare their qualitative performance and the characteristics of the networks produced.
2. The Workflow of NetRA Tool
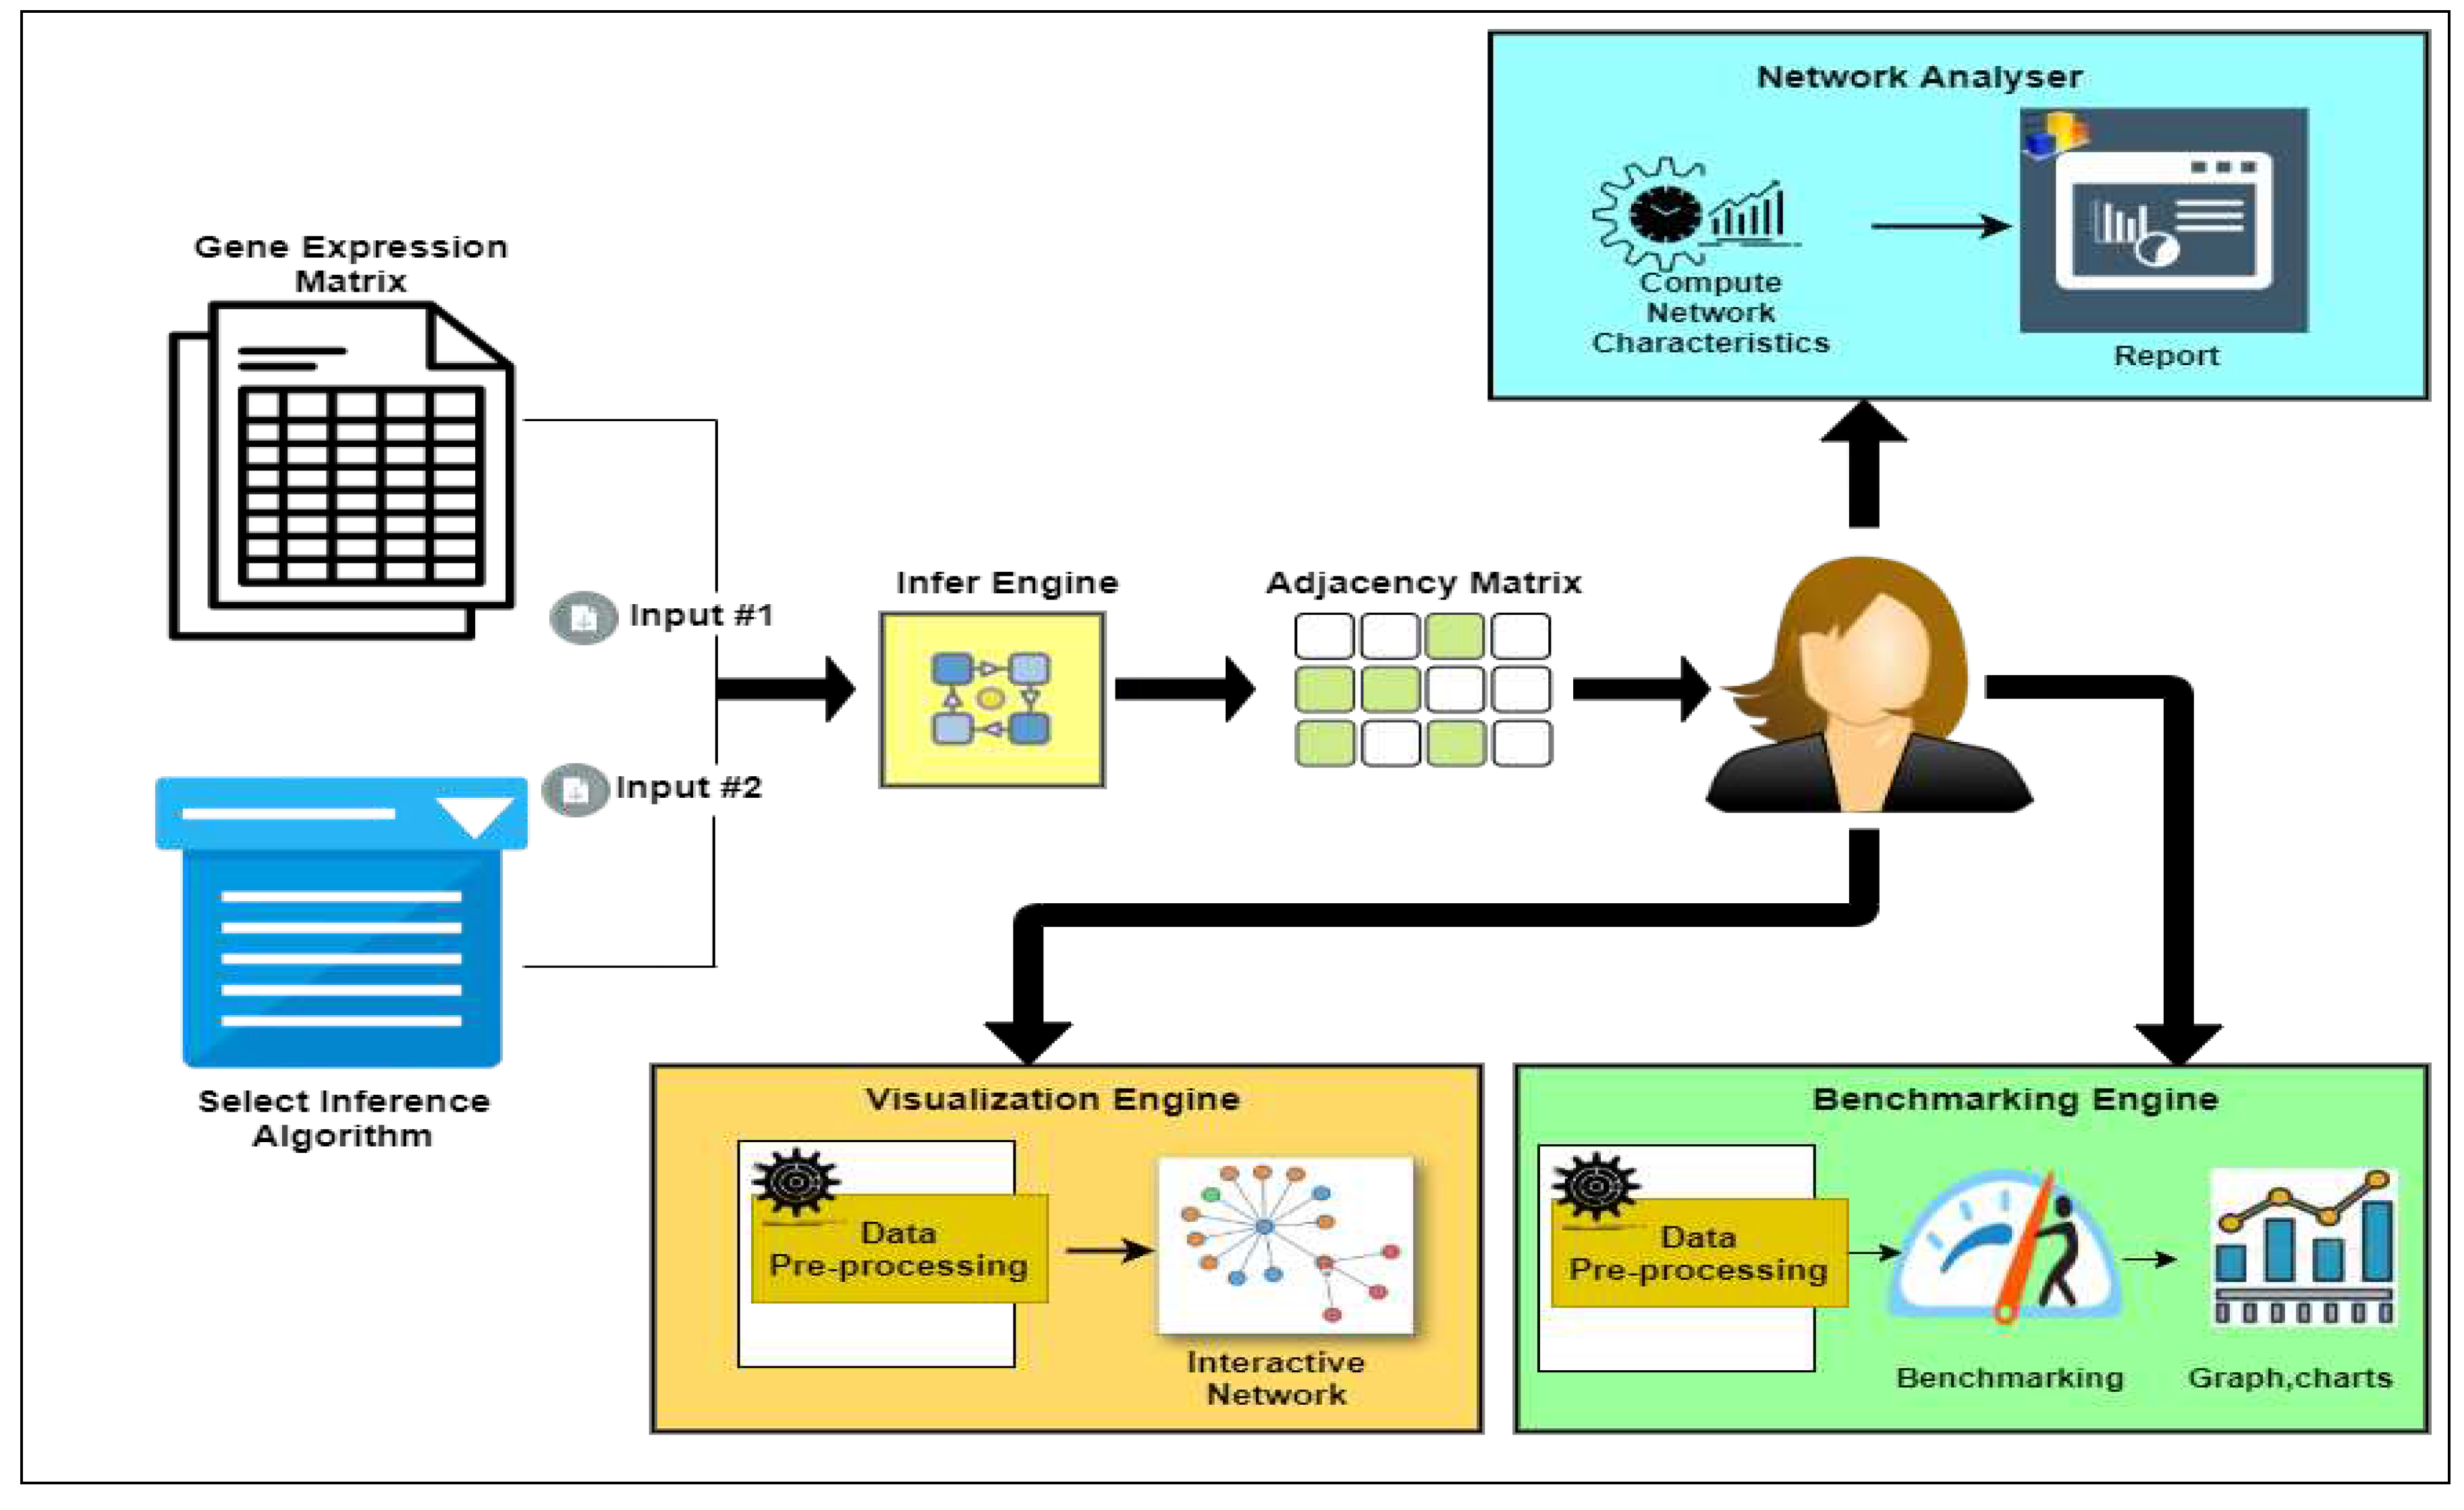
The NetRA tool is intended to provide four major independent functionalities, Inference, Visualization, Analysis, and Benchmarking. The user can independently use any of the functionalities. This feature makes the tool more generic and applicable for network analyses like Protein Interactions and Social Networks. The overall workflow of the tool is illustrated in
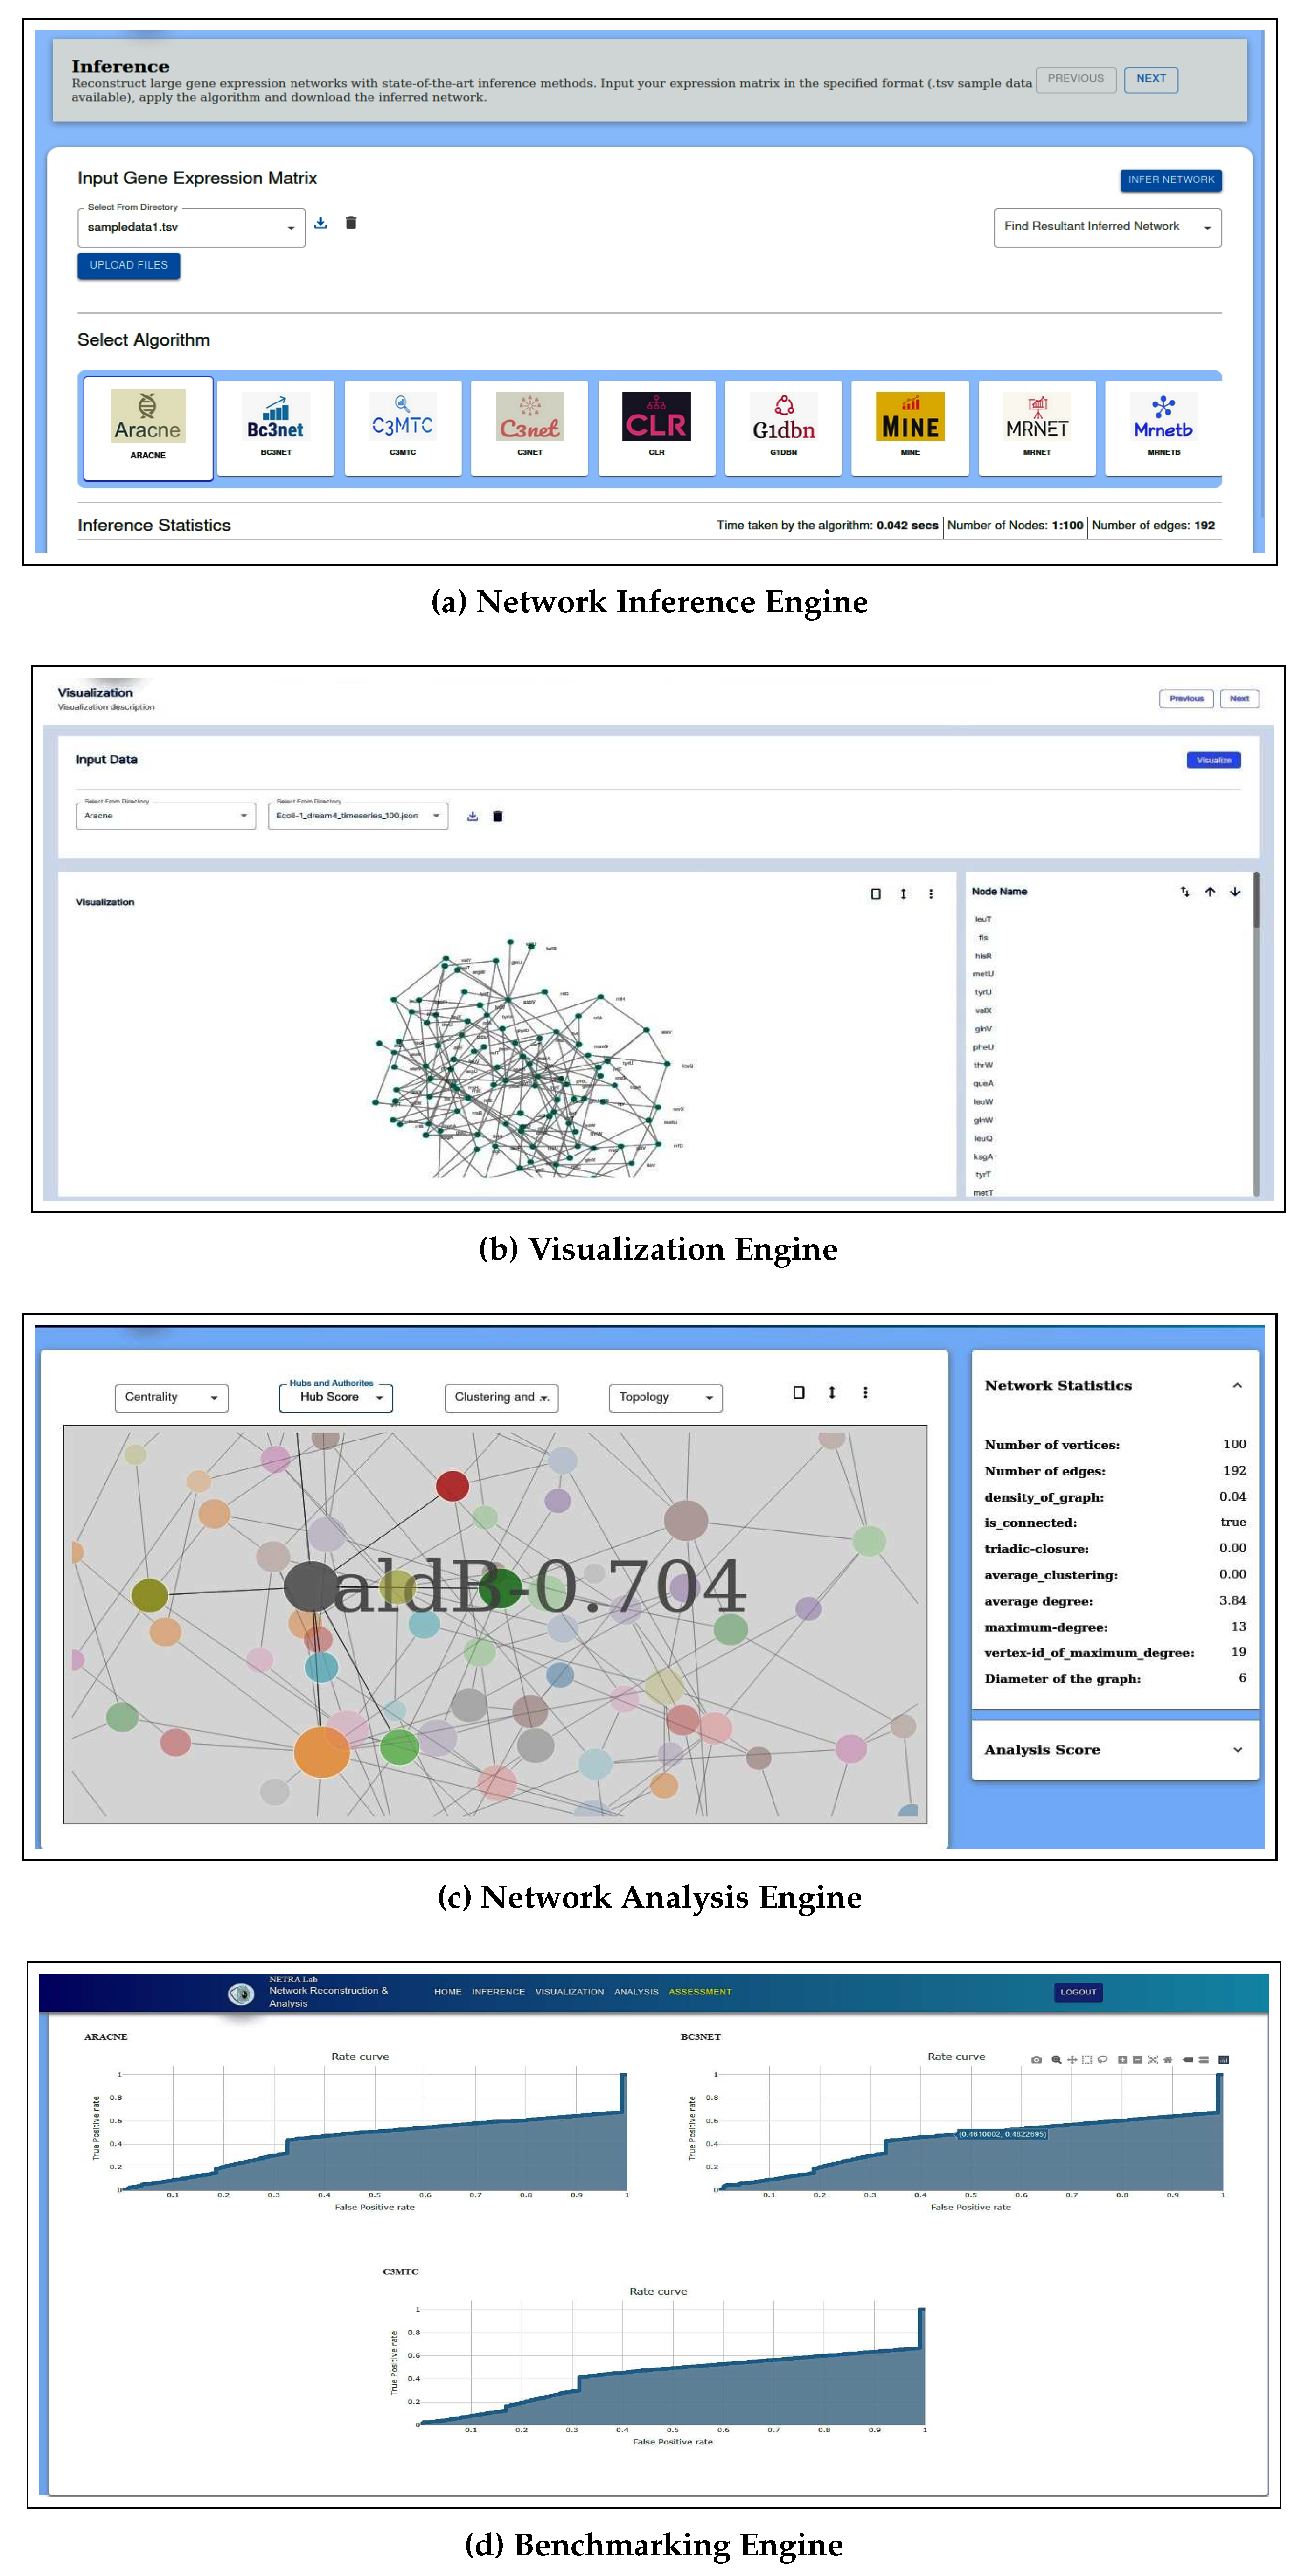
Figure 1. The tool is composed of four independent engines. The respective screenshots of the four engines can be seen in
Figure 6.
2.1. Inference Engine
A dedicated inference engine has been designed to offer a user-friendly web platform for inferring gene networks from expression profiles. Instead of re-coding of any inference method, which may lead to implementation bias, we use readily available R scripts from Bio-conductor. We integrated 11 (CLR, ARACNE, MRNET, BC3NET, C3MTC, C3NET, MINE, MRNETB, PPCOR, RELNET, SPCOR) (
Faith et al. 2007,
Margolin et al. 2006,
Meyer et al. 2007,
de Matos Simoes and Emmert-Streib 2012,
de Matos Simoes and Emmert-Streib 2011,
Altay and Emmert-Streib 2010,
Altay and Emmert-Streib 2010,
Meyer et al. 2010,
Kim 2015,
Kim 2015,
Butte 2002) state-of-the-art algorithms and their parallel extensions to infer an extensive network. Depending on the varied size of the input network to be inferred, the inference engine automatically switches between serial and parallel execution modes for efficient and low-latency computation.
2.1.1. Parallel Framework for Large -Scale Inference
State-of-the-art network inference techniques can only reconstruct networks of a few hundred nodes. Thus, it is necessary to make use of parallel computing paradigms in order to build massive networks. We integrate, recently published, a generic parallel framework (
Sebastian et al. 2022) that enables any existing approach to infer large networks in parallel, without re-engineering, and with high-quality output.
2.2. Visualization Engine
Any network in proper JSON format can be uploaded, or inferred data from the Inference engine can be used for interactive visualization. The robust D3.js framework provides an interactive visualization of the uploaded network. The visualizer offers the user to interact and inspect visually the various nodes and their immediately adjacent neighbors. We have used a technique for visualizing only hub nodes first and then on-demand clicking of its adjacent connected nodes, making the network rendering very light weighted for an extensive network dataset. We also offer a hub node list with a degree of each node from where the user may jump to the node of its interest.
2.3. Analysis Engine
We try to encompass most of the topological analysis measures in our tool. The degree distribution plot, network module detection, centrality analysis, and topological co-efficient are allowed in the analysis engine. This generic platform allows users to analyze any biological or social network. The input network data is restricted to an edge list with a tab-delimited format.
2.4. Assessment Engine
It is always challenging to assess the efficiency of any novel inference method with state-of-the-art contemporary methods. It involves extensive coding. We provide an integrated platform where users can assess the performance of their method with other methods available in the NetRA Tool. Users may assess the inferred network with the gold standard network for prediction accuracy.
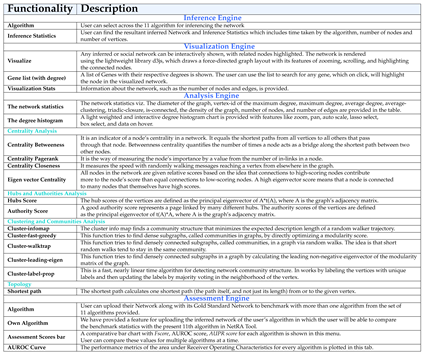
A detailed description of the above four engines and their functionalities in-built within the tool is listed in
Table 2 for quick reference. NetRA’s extended functionalities make it different from other presently available tools.
3. Inner Engineering of NetRA Tool
NetRA’s architecture is based on cutting-edge technologies such as
Next.js in the front end and
Flask at the back end. In addition, Python and R are used front and back-end scripting. The
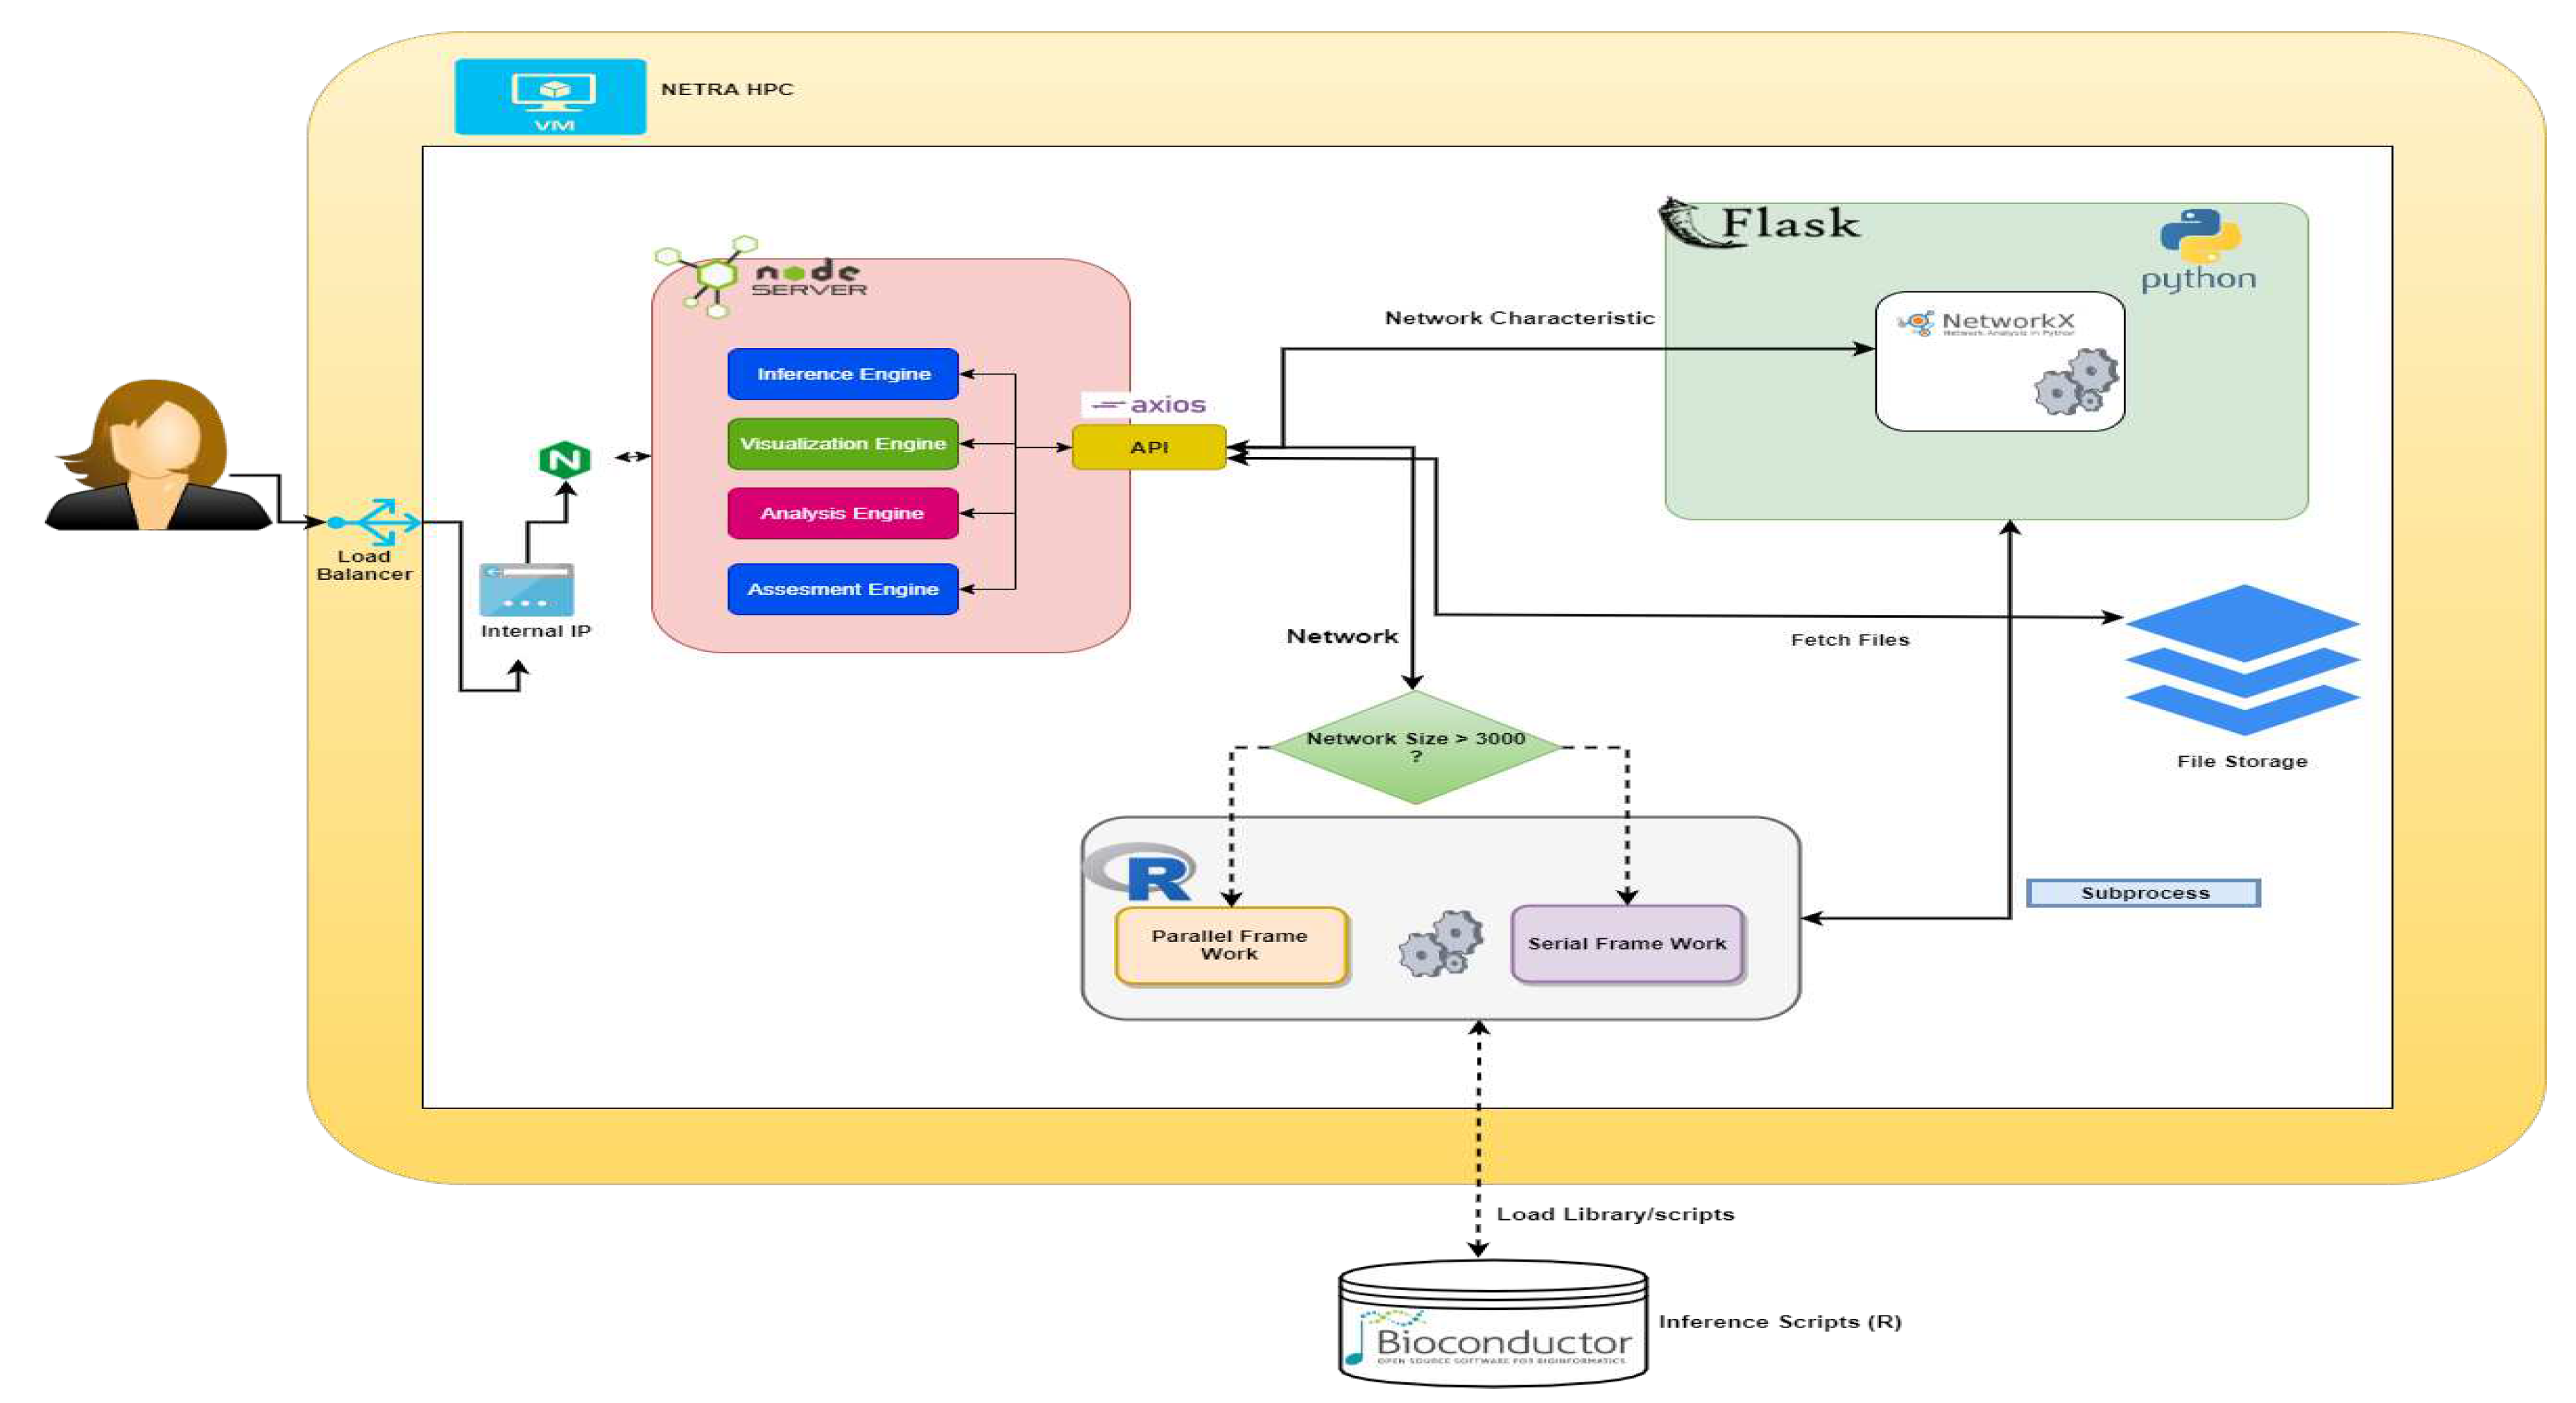
React-redux architecture is used for UI binding of the application. It is updated with API changes to ensure that the React components behave as expected. It implements performance optimization, allowing components to re-render only when needed. A middleware (thunk) is used for interacting with the API. A schematic diagram of the architecture and process flow of the tool is shown in
Figure 2. The Flask framework is used on the back end, which accepts requests from APIs and passes the data to R scripts for performing different tasks.
In order to infer a network from micro-array expression data matrix (input) using 11 candidate methods, original R scripts downloaded from
Bioconductor are used during inference. NeTRA tool is capable of handling large-scale networks. Original inference methods are all limited to only inferring a network of size 4000 nodes. We integrated a generic parallel platform (
Sebastian et al. 2021) that uses the original methods and runs in a multi-core environment. It smoothly transitions from serial to the parallel engine of network inference. The present version is restricted to offline access of the implementations from Bioconductor. In the future, online access will be available, where the user may use the methods directly from Bioconductor through the NetRA tool. Moreover, the parameter setting is also not provided for the optimized performance of the housed inference methods. The python script is used in various network analysis and visualization modules.
During visualization, the Flask server takes the inferred network as input and creates an event that calls the
d3js 2 for generating the force-directed graph. The
d3js creates an interactive network with a smooth transition and interaction from the inferred file and binds it to the
Document Object Model (DOM) element in the front-end (
Dutta and Roy 2022). It also calculates the degree of each node and dispatches it in the front end. Up to 1000 nodes, the visualizer can render the interactive graph directly. However, we adopted a bubble-busting concept to visualize large networks effectively. At first, high-degree nodes are visualized as isolated nodes. On clicking the nodes, it will expand to the sub-network of the clicked node. Subsequent clicking on each node will expand further.
For performing the calculation of the network properties, R based
igraph(
Csardi et al. 2006) package has been used, and plots are generated through R and
plotly3. igraph is a collection of network analysis tools emphasizing efficiency, portability, and ease of use. R igraph comprises numerous classes and pre-defined methods for the calculation of the properties and statistics of a network. The list of statistical scores generated by these methods is then fed to the front end for user interaction.
The assessment is performed using
validate4 available in minet(
Meyer et al. 2008) library that takes in the actual(gold-standard) network along with the predicted network as a parameter and calculates the
AUROC,
AUPR,
F-score of the network. The
AUROC,
AUPR, and
F-score values are written to an external CSV file, and the respective comparison bar graph is plotted in the front end using
d3js.
4. Qualitative Assessment of Inference Methods
To demonstrate the usability of the NetRA tool, we decide to report a performance assessment of 11 candidate methods using the DREAM Challenge
5 benchmark network. We use GNW platform (
Schaffter et al. 2011) to reverse engineer the expression data from the network dynamic. We use a network of 4000
Yeast genes with 210 expression values. We assess the outcome based on prediction correctness and network characteristics produced. Due to the present limits of the tool, we execute them with default parameters as in the original implementation.
4.1. Characteristics of Predicted Networks
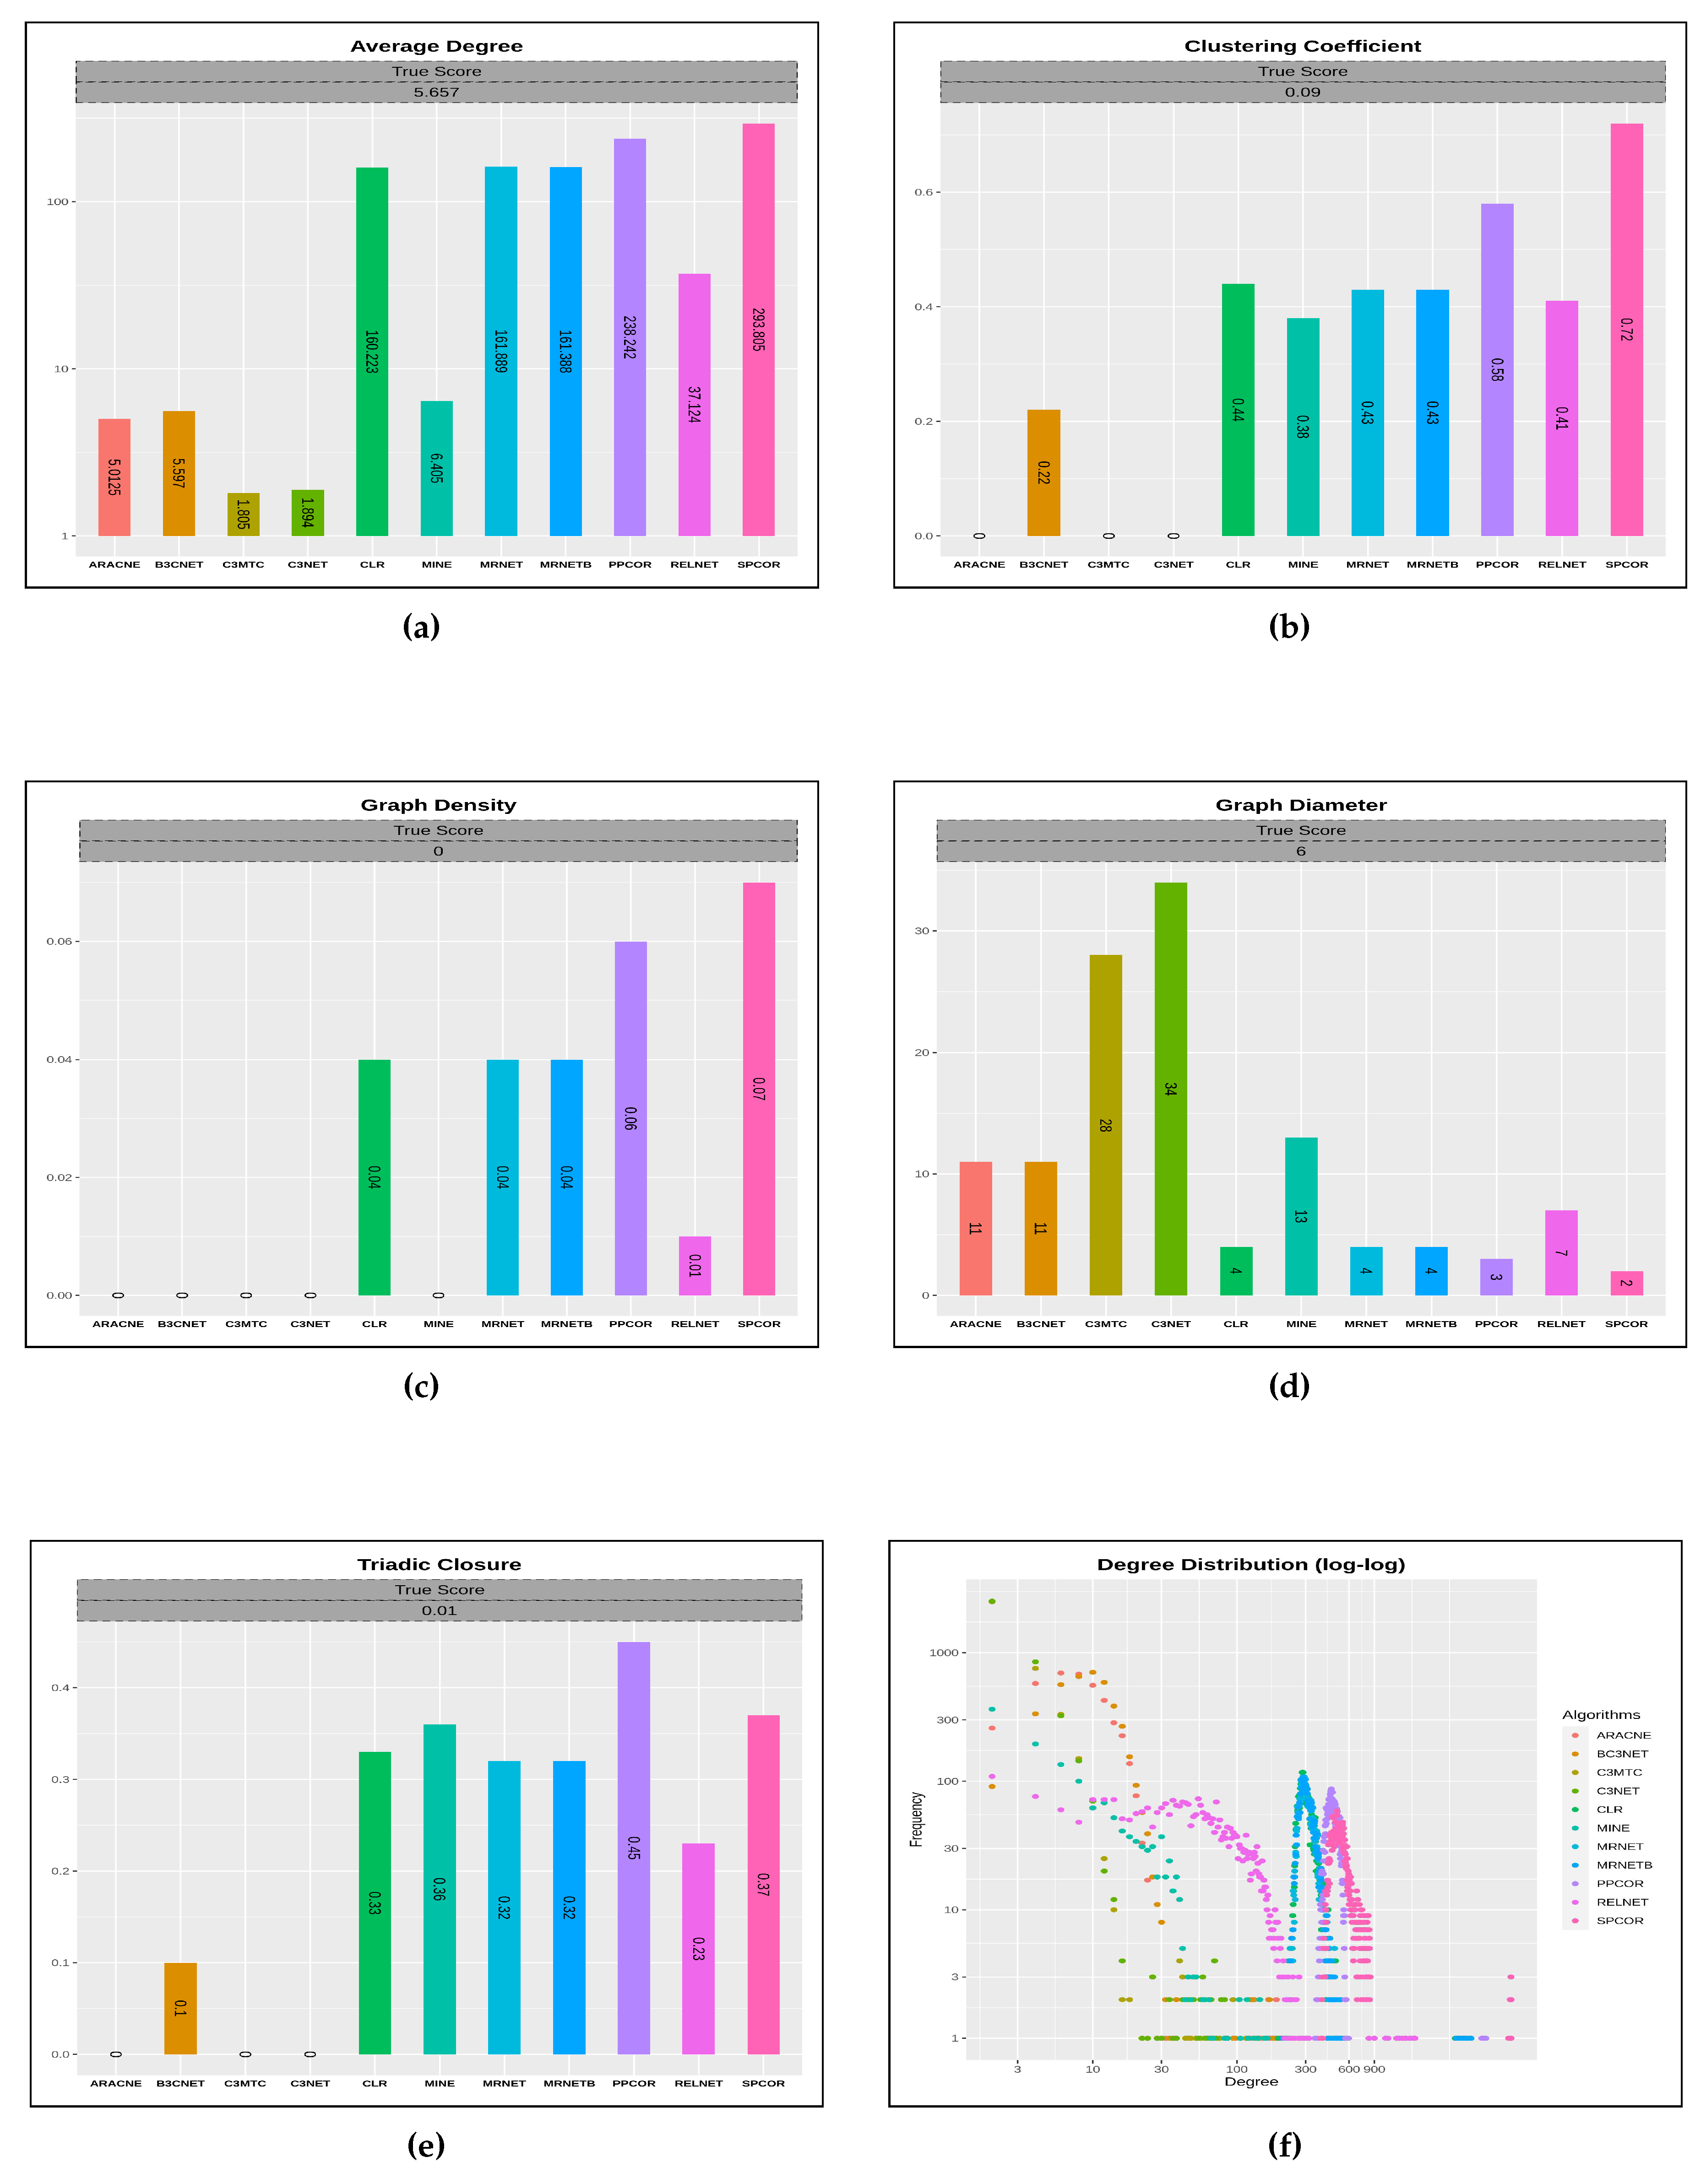
We compute various network characteristics of the predicted network inferred from the candidate inference algorithms compared to the actual score achieved from the gold network.
Figure 3 presents various sub-plots for each of these characteristics that span over 11 inferred network characteristics in the light of the actual network perspective. Such a discernment further paves the way to comprehend the topological network performance of the algorithms for a given network dataset.
We observe that the average degree characteristic does not reveal enough about the graph structure yet concerns the network’s connectedness, thereby suggesting near the average degree of all nodes in the graph. The inferred networks generated from the list of inference algorithms, including , , , , and , do gain a significant average degree score concerning the target gold network score. However, for the clustering coefficient characteristic, which is also a degree measure groups high-density connection among network nodes. Amongst all the inferred networks network reaches a mark of for the actual score of , whereas , , and remain at 0. For, graph density characteristic represents the graph affinity to accommodate new links in addition to the existing links in the network. In other words, it describes how dense the network is regarding link connectivity. Most of the derived inferred networks from all the inference algorithms mark a significant count close to the actual score for graph density property. Another network topological characteristic which is graph diameter that calculates the shortest path length between the most distanced nodes in a network. The inferred networks viz. , , , and reach closer graph diameter score in comparison to the actual score (06) of the gold network. Finally, the triadic closure property uses the existential mechanism of a network in alluding to the likelihood of missing links among the network nodes. From all the inferred networks, only the network reaches the true score value of .
We further analyze the inferred network structure by examining the spread of the node degrees with their corresponding frequency distribution. Therefore, a particular fraction of network nodes will have the exact degree count. From the degree distribution plot, a significant cluster of nodes counting from 2 to 90, inferred from algorithm, carry node degree range from . At the same time, the network inferred from the algorithm possesses the node frequency range from 5 to 100 counts that share a significant degree range from . However, the network derived from the algorithm majoritarily occupies a frequency distribution from 3 to 95, thereby splitting the degrees from . Another vital spread of the network node degrees derived from the algorithm captures a dense plot from 2 to 70 node counts from degree share. From the inferred networks discussed above, we observe that only a few nodes from these networks are well connected as each carries a very high degree which is beyond 900.
As an additional analysis, we further evaluate the network characteristics of the 11 inferred networks concerning the gold network, thereby measuring the strength of the linear relationships between the predicted and the true values. We use the Pearson correlation coefficient by vectorizing the predicted and gold network characteristics scores in two separate lists and measure their relationship within the normalized range from
to
. In
Figure 4, we observe that the magnitude of the coefficient produced from
,
, and
inferred networks are above
, which represents high correlation, whereas, for other inferred networks, it is
, which is still a significant mark of good association.
4.2. Comparative Analysis of Inference Quality
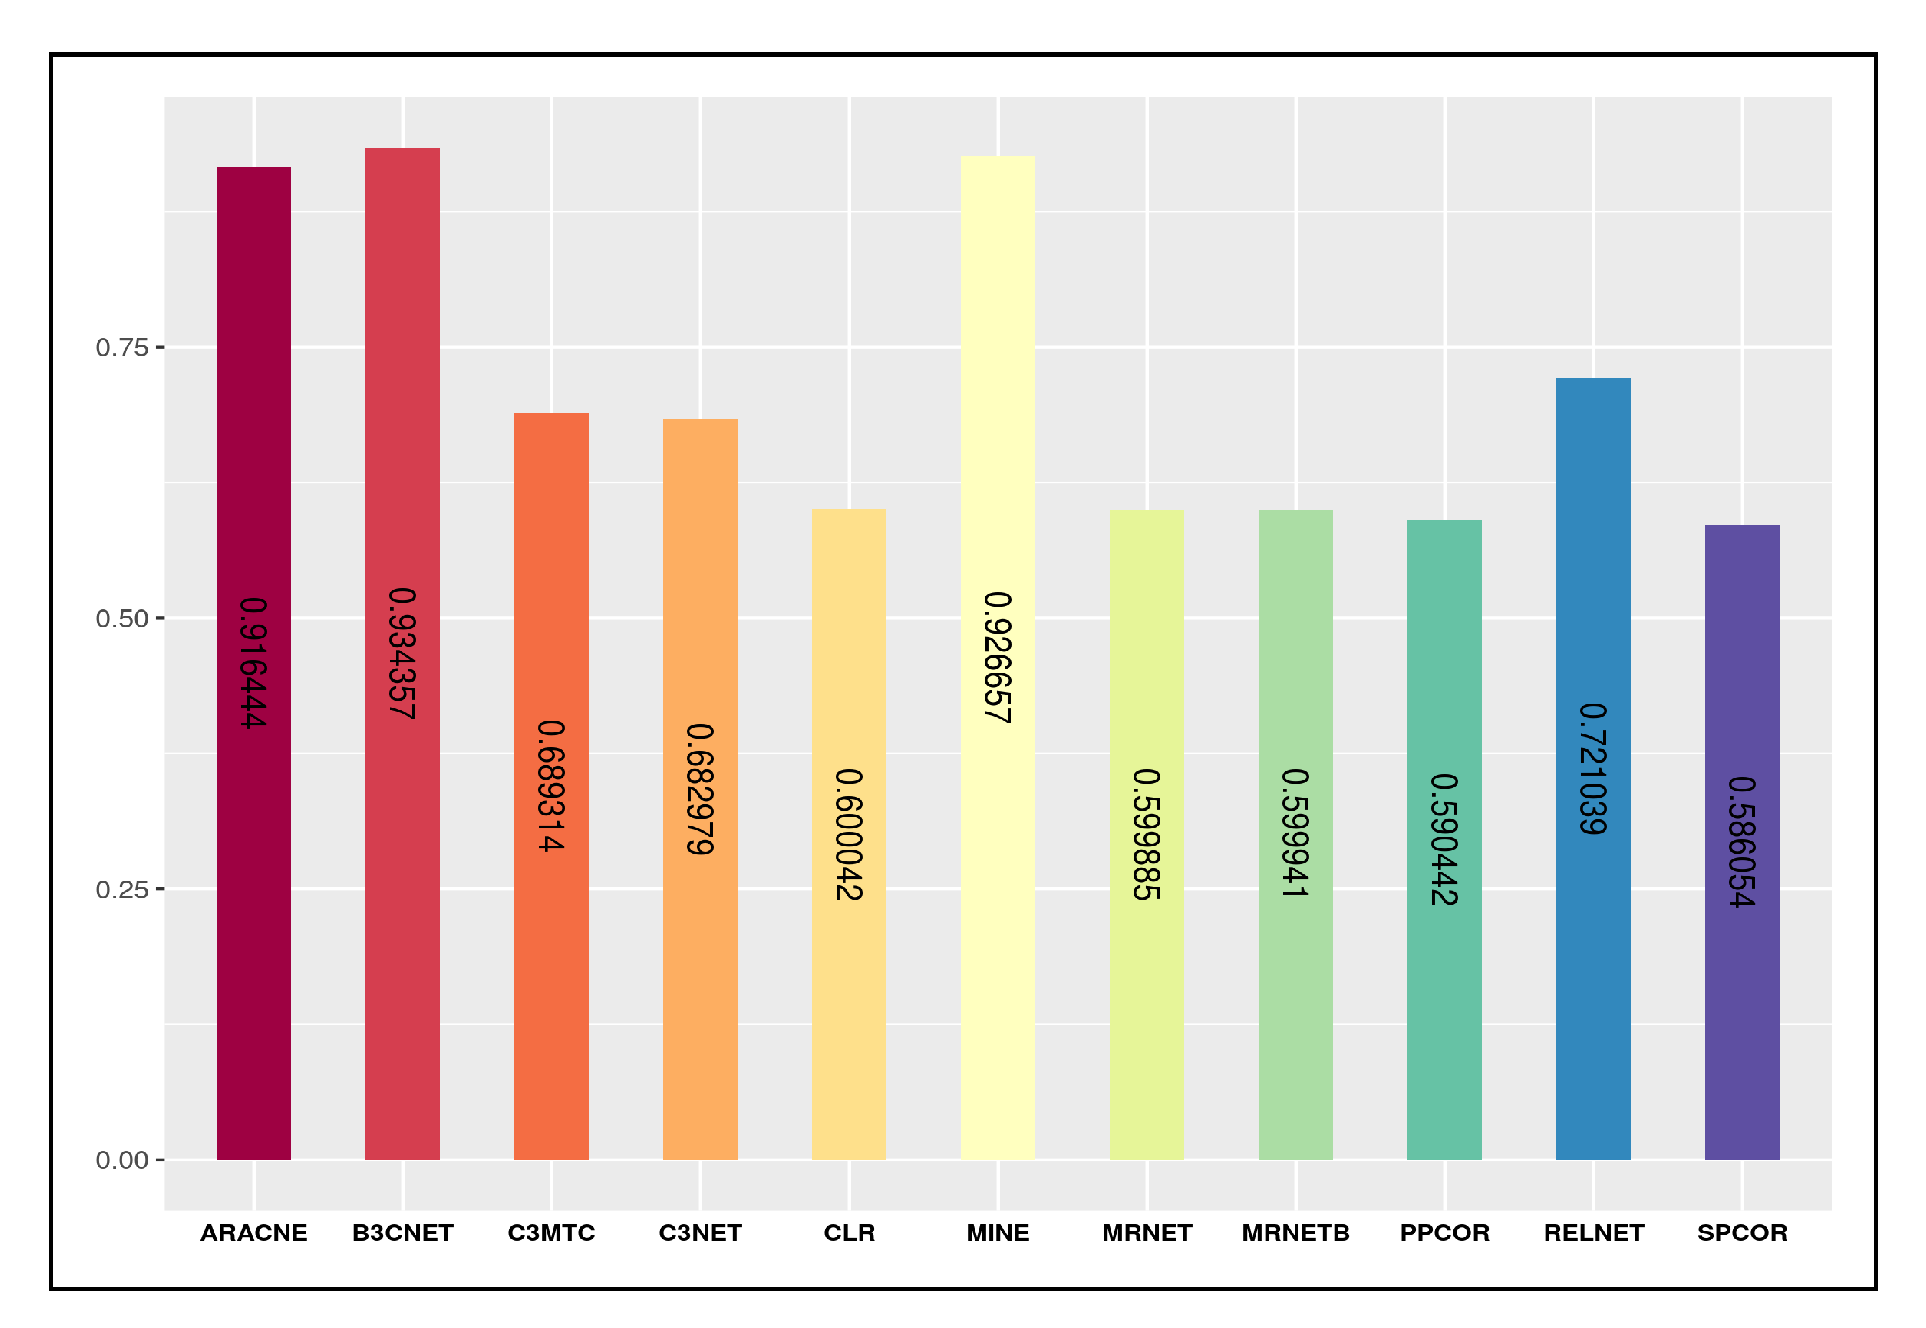
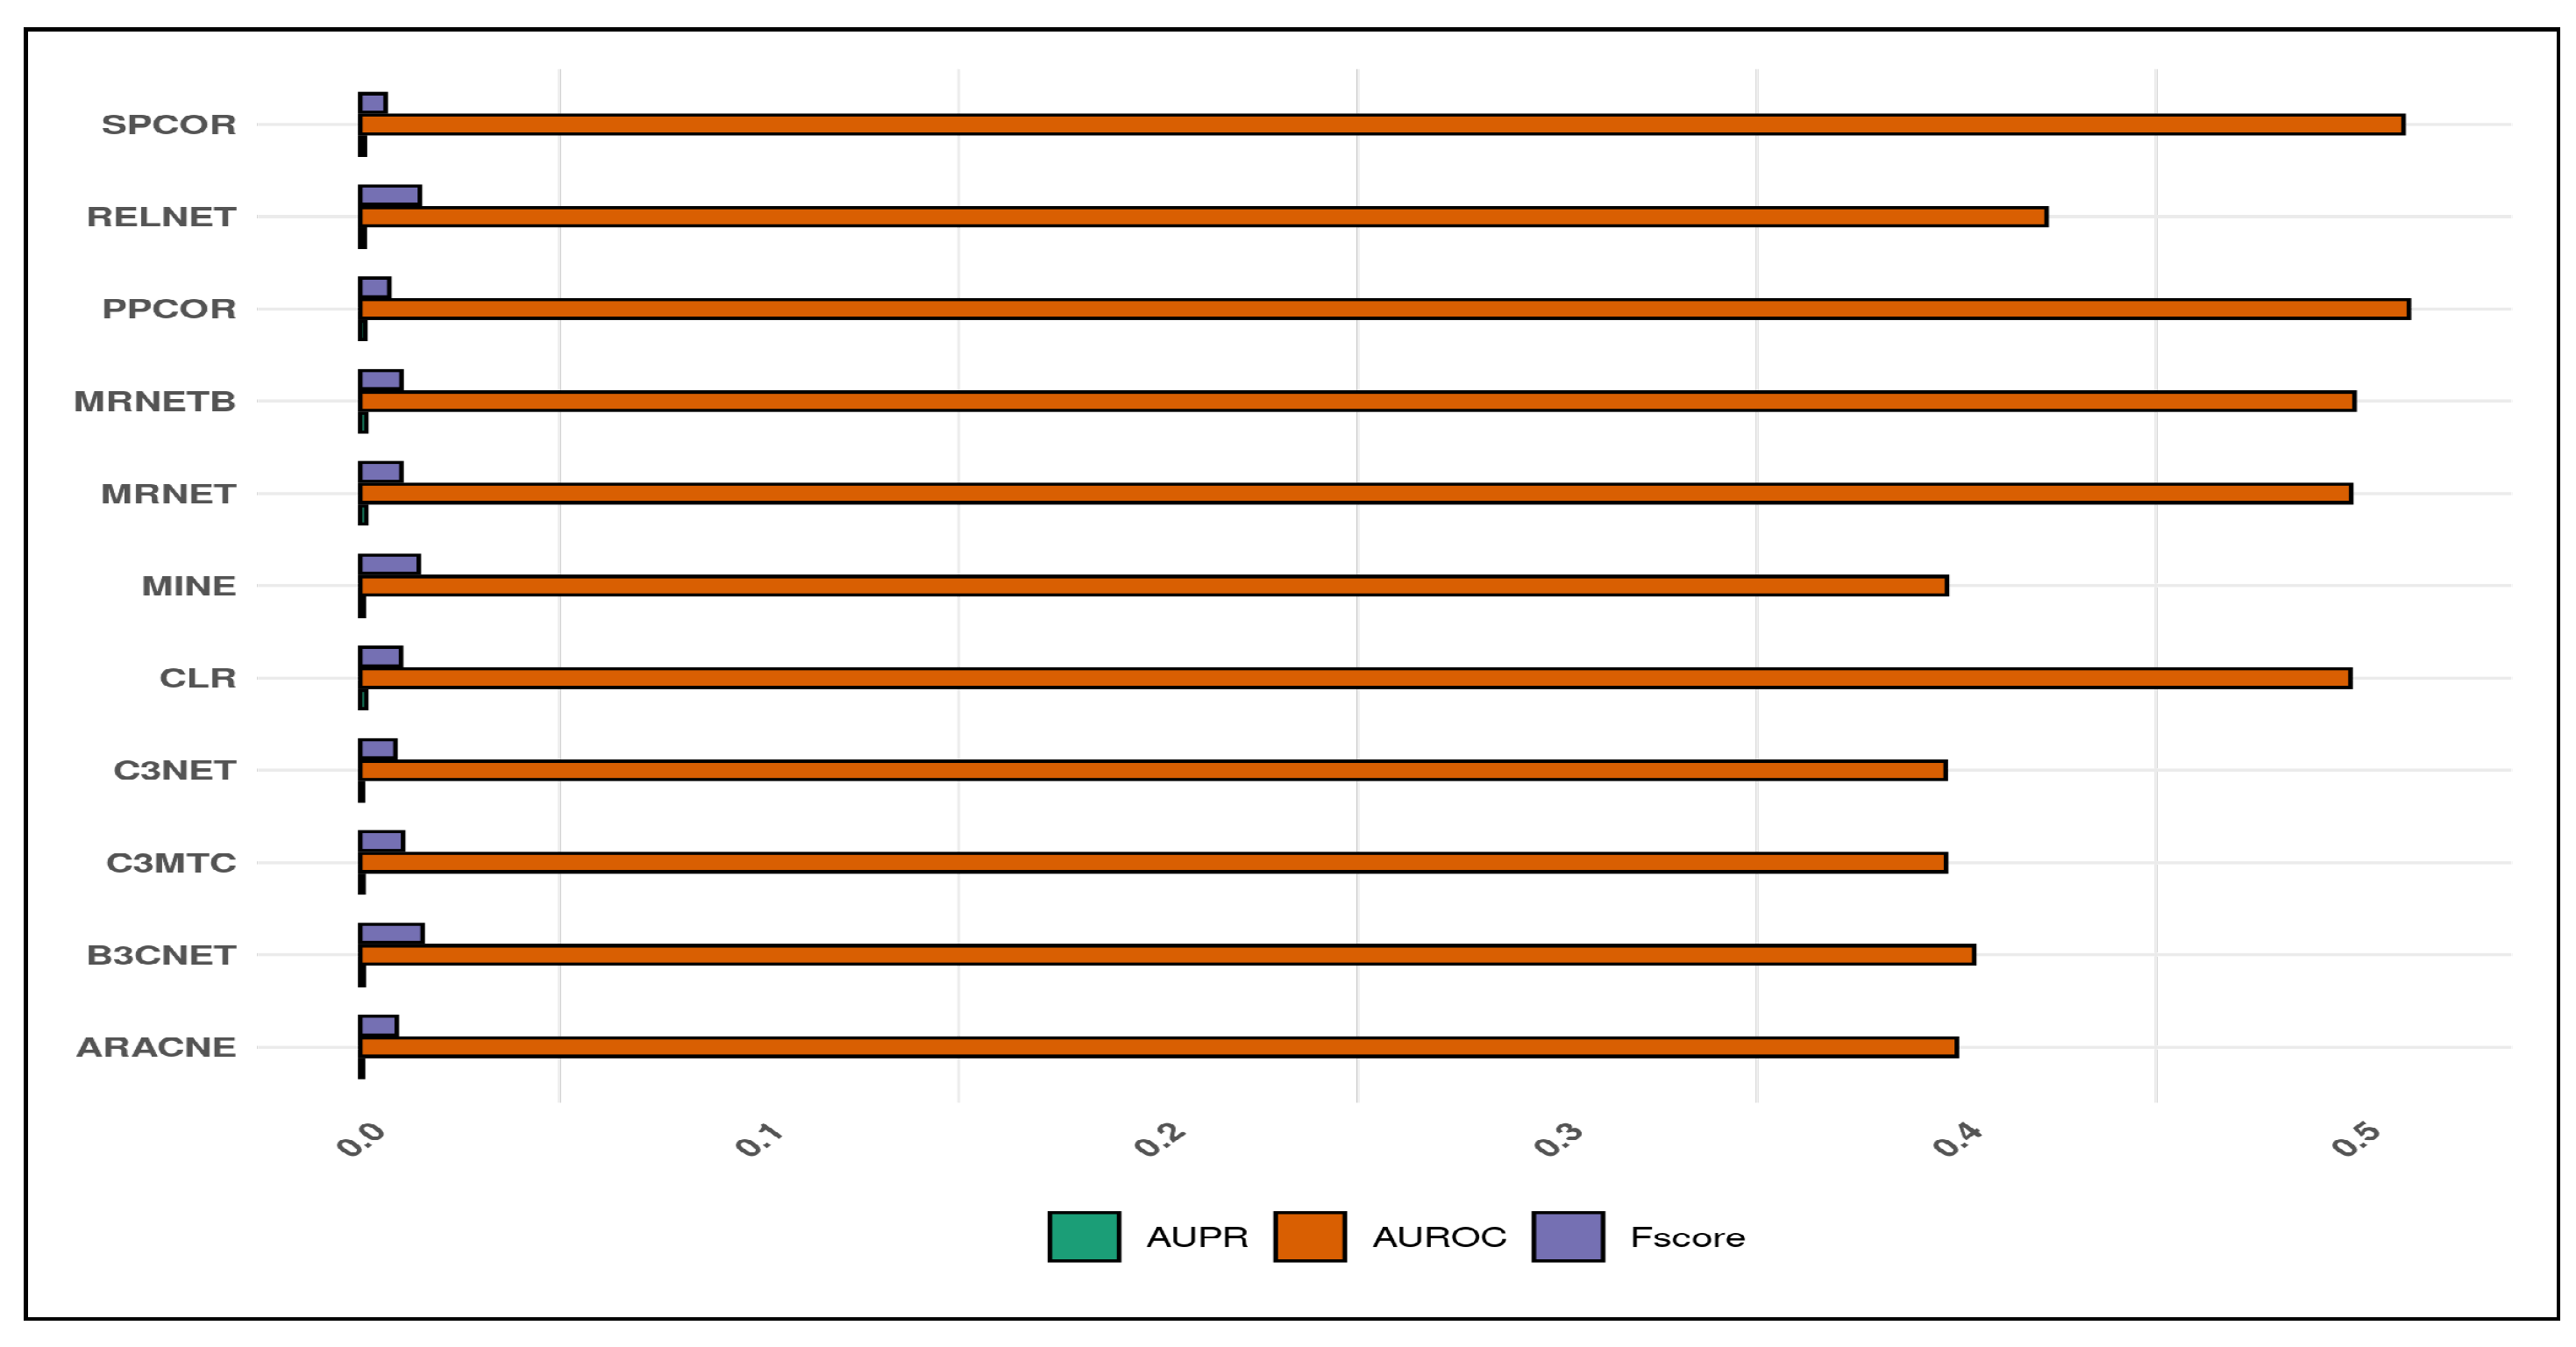
We use three assessment metrics viz.
area under the receiver operating characteristic (AUROC),
area under the precision-recall curve (AUPR), and
F-score for evaluating the inferred quality of the derived networks obtained from the respective candidate inference algorithms with the gold network.
Figure 5 presents the plot of the corresponding metrics with their respective score. We observe that the AUROC score for
,
,
,
, and
inferred networks obtain a range from
, hence representing the poor quality of the inferred networks. However, algorithms including
,
,
,
, and
describe a slightly improved quality of the inferred networks as they mark the AUROC score ranging from
. Unlike AUROC, the AUPR and F-score remain close to
for all the candidate algorithms.
Therefore, the final remarks from the correlation and metric quality plot suggest that , , and form a good correlation between the inferred and gold network characteristics. At the same time, these inferred network algorithms’ predictive quality remains mediocre compared to , , , , and , which is relatively higher for the AUROC score.
5. Conclusion
We created a revolutionary integrated platform for inference, visualization, analysis, and evaluation of large-scale networks. We used their original implementations to incorporate eleven (11) well-known algorithms into the present version. We utilized a method for the seamless display and transition of massive networks using an interactive bubble-burst approach. We offered several topological, centrality, and community detection in a graph together with the network statistics and interactive degree distribution that can analyze any other complex graphs. The benchmarking tool gives future inference method developers an excellent platform to compare and evaluate performance. Our platform was designed to be as lightweight as possible so that smartphone users can utilize it without concern for the limits of their small devices.
The execution pipeline will be expanded further to prioritize the genes that cause diseases, followed by searching and designing small therapeutic molecules.
Figure 6.
Screenshots of four engines of the NetRA tool.
Figure 6.
Screenshots of four engines of the NetRA tool.
Data Availability Statement
On request (sroy01@cus.ac.in
Acknowledgments
This work is supported by funds from the Department of Science & Technology (DST), Govt. of India(DST/ICPS/Data Science/Cluster).
References
- Pietro Hiram Guzzi and Swarup Roy. Biological Network Analysis: Trends, Approaches, Graph Theory, and Algorithms. Elsevier, 2020.
- Alberto de la Fuente. What are gene regulatory networks? In Handbook of research on computational methodologies in gene regulatory networks, pages 1–27. IGI Global, 2010.
- Binon Teji, Jayanta K Das, Swarup Roy, and Dinabandhu Bhandari. Predicting missing links in gene regulatory networks using network embeddings: A qualitative assessment of selective embedding techniques. In Intelligent Systems, pages 143–154. Springer, 2022.
- Binon Teji and Swarup Roy. Missing link identification from node embeddings using graph auto encoders and its variants. In 2022 OITS International Conference on Information Technology (OCIT), pages 1–6. IEEE, 2022.
- Ardeshir Bayat. Science, medicine, and the future-bioinformatics. BMJ-BRITISH MEDICAL JOURNAL, 324(7344):1018–1022, 2002.
- Thomas Schaffter, Daniel Marbach, and Dario Floreano. Genenetweaver: in silico benchmark generation and performance profiling of network inference methods. Bioinformatics, 27(16):2263–2270, 2011.
- Tim Van den Bulcke, Koenraad Van Leemput, Bart Naudts, Piet van Remortel, Hongwu Ma, Alain Verschoren, Bart De Moor, and Kathleen Marchal. Syntren: a generator of synthetic gene expression data for design and analysis of structure learning algorithms. BMC bioinformatics, 7(1):1–12, 2006.
- Minzhe Zhang, Qiwei Li, Donghyeon Yu, Bo Yao, Wei Guo, Yang Xie, and Guanghua Xiao. Geneck: a web server for gene network construction and visualization. BMC bioinformatics, 20(1):1–7, 2019.
- Andrea Pinna, Nicola Soranzo, Ina Hoeschele, and Alberto de la Fuente. Simulating systems genetics data with sysgensim. Bioinformatics, 27(17):2459–2462, 2011.
- Barbara Di Camillo, Gianna Toffolo, and Claudio Cobelli. A gene network simulator to assess reverse engineering algorithms. Annals of the New York Academy of Sciences, 1158(1):125–142, 2009.
- Yong Li, Yanming Zhu, Xi Bai, Hua Cai, Wei Ji, and Dianjing Guo. Retrn: A retriever of real transcriptional regulatory network and expression data for evaluating structure learning algorithm. Genomics, 94(5):349–354, 2009.
- Hendrik Hache, Christoph Wierling, Hans Lehrach, and Ralf Herwig. Genge: systematic generation of gene regulatory networks. Bioinformatics, 25(9):1205–1207, 2009.
- Robert C Gentleman, Vincent J Carey, Douglas M Bates, Ben Bolstad, Marcel Dettling, Sandrine Dudoit, Byron Ellis, Laurent Gautier, Yongchao Ge, Jeff Gentry, et al. Bioconductor: open software development for computational biology and bioinformatics. Genome biology, 5(10):1–16, 2004.
- Jeremiah J Faith, Boris Hayete, Joshua T Thaden, Ilaria Mogno, Jamey Wierzbowski, Guillaume Cottarel, Simon Kasif, James J Collins, and Timothy S Gardner. Large-scale mapping and validation of escherichia coli transcriptional regulation from a compendium of expression profiles. PLoS biology, 5(1):e8, 2007.
- Adam A Margolin, Ilya Nemenman, Katia Basso, Chris Wiggins, Gustavo Stolovitzky, Riccardo Dalla Favera, and Andrea Califano. Aracne: an algorithm for the reconstruction of gene regulatory networks in a mammalian cellular context. In BMC bioinformatics, volume 7, pages 1–15. BioMed Central, 2006.
- Patrick E Meyer, Kevin Kontos, Frederic Lafitte, and Gianluca Bontempi. Information-theoretic inference of large transcriptional regulatory networks. EURASIP journal on bioinformatics and systems biology, 2007:1–9, 2007.
- Ricardo de Matos Simoes and Frank Emmert-Streib. Bagging statistical network inference from large-scale gene expression data. PloS one, 7(3):e33624, 2012.
- Ricardo de Matos Simoes and Frank Emmert-Streib. Influence of statistical estimators of mutual information and data heterogeneity on the inference of gene regulatory networks. PLoS One, 6(12):e29279, 2011.
- Gökmen Altay and Frank Emmert-Streib. Inferring the conservative causal core of gene regulatory networks. BMC systems biology, 4(1):1–13, 2010.
- Patrick Meyer, Daniel Marbach, Sushmita Roy, and Manolis Kellis. Information-theoretic inference of gene networks using backward elimination. In BioComp, pages 700–705, 2010.
- Seongho Kim. ppcor: an r package for a fast calculation to semi-partial correlation coefficients. Communications for statistical applications and methods, 22(6):665, 2015.
- Atul J Butte. Mutual information relevance networks: functional genomic networks built from pair-wise entropy measurements. PhD thesis, Massachusetts Institute Of Technology, 2002.
- Softya Sebastian, Swarup Roy, and Jugal Kalita. A generic parallel framework for inferring large-scale gene regulatory networks from expression profiles: Application to alzheimer’s disease network. Briefings in Bioinformatics, 2022.
- Softya Sebastian, Swarup Roy, and Jugal Kalita. Parallel framework for inferring genome scale gene regulatory networks. bioRxiv, 2021.
- Sumit Dutta and Swarup Roy. Complex network visualisation using javascript: A review. Intelligent Systems, pages 45–53, 2022.
- Gabor Csardi, Tamas Nepusz, et al. The igraph software package for complex network research. InterJournal, complex systems, 1695(5):1–9, 2006.
- Patrick E Meyer, Frederic Lafitte, and Gianluca Bontempi. minet: Ar/bioconductor package for inferring large transcriptional networks using mutual information. BMC bioinformatics, 9(1):1–10, 2008.
|
Disclaimer/Publisher’s Note: The statements, opinions and data contained in all publications are solely those of the individual author(s) and contributor(s) and not of MDPI and/or the editor(s). MDPI and/or the editor(s) disclaim responsibility for any injury to people or property resulting from any ideas, methods, instructions or products referred to in the content. |
© 2023 by the authors. Licensee MDPI, Basel, Switzerland. This article is an open access article distributed under the terms and conditions of the Creative Commons Attribution (CC BY) license (http://creativecommons.org/licenses/by/4.0/).
