1. Introduction
The CoCrFeNi system belongs to single-phase concentrated solid solution alloys and served as a basis for the creation of the Cantor-CoCrFeNiMn alloy (the most studied face-centered cubic (fcc) alloy, due to its excellent low-temperature ductility, reaching a value of 71% at room temperature)). [
1,
2]. Interest in the study of CoCrFeNi-based alloys, is related to their structural features, namely the formation of high-temperature stable fcc single-phase or fcc + bcc two-phase solid solution depending on the additives Al, Si. Cu, etc., as well as excellent mechanical and corrosion properties [
3,
4,
5]. In addition, an effect similar to K-state transition [
7] has been found in the CoCrFeNi system [
6]. K-state is observed in alloys such as Ni-Cr, Fe-Co, Ni-, Fe-based FCC alloys [
8,
9,
10,
11] and has a marked effect on electrical conductivity, thermal conductivity, heat capacity, and thermal expansion. For example, the electrical resistivity of commercial Ni-Cr-Al-Fe precision resistance alloy increased by 11.5% after aging treatment [
12]. The K-state leading to anomalies and changes in the physical properties of 3d metal-based alloys is believed to be due to a special atom arrangement called short-range order (SRO) [
13,
14,
15]. There is another view point that high-temperature anomalies of physical properties in chromium-based alloys (Ni-Cr, Ni-Cr-Mo...) are caused by the formation of long-range ordered Ni
2Cr phase, which can appear after hundreds to thousands of hours of annealing at temperatures below 500-600 °C [
16,
17]. There is currently no strict physical theory of the K-state phenomenon and an explanation of the causes of anomalies in the physical properties of the CoCrFeNi system. Most of the conducted scientific studies point to the formation of SRO in single-phase face-centered cubic alloys [
18,
19].
CTE, density and thermal conductivity as temperature functions are important for the study of phase transformations, materials design, heat transfer, and thermal expansion of materials, i.e., they are fundamental parameters in the fields of materials science and condensed state physics. Despite numerous studies of the physical and chemical properties and structural state of the CoCrFeNi system [
20], the key thermophysical characteristics of CoCrFeNi alloys at high temperatures and their relationship with the structure have been insufficiently studied. Without knowledge of the behavior of density, CTE, and thermal conductivity with increasing temperature, it is not possible to create new functional and structural materials based on the CoCrFeNi system for high-temperature applications.
In this study, we systematically investigated the thermophysical properties of the as-cast and homogenized equiatomic CoCrFeNi alloy. The thermal diffusivity and thermal expansion as functions of temperature were measured by laser flash analysis and dilatometry, respectively. Subsequently, thermal conductivity, specific heat capacity and CTE were calculated and compared. To identify reversible and irreversible structural effects and changes in key physical parameters during the thermal evolution of the sample, we measured the temperature dependence of the thermal properties of the as-cast and homogenized equiatomic CoCrFeNi alloy in two heating series.
2. Experiments and Methods
2.1. Materials
The as-cast (A) equiatomic CoCrFeNi alloy was synthesized from pure cobalt, nickel, chromium and iron (>99.98%) by arc melting under helium atmosphere. The alloy was remelted four times on a water-cooled copper mold in a Centorr 5SA furnace to achieve a homogeneous chemical and structural state. The arc melting time and electric current at each stage of the synthesis are presented in
Table 1.
Samples before and after synthesis were weighed; the mass loss did not exceed 0.1 wt%. The homogenized sample (H) was heat treated in a resistance furnace under inert atmosphere, with an isotherm at 1473 K for 24 h; the heating rate of the dynamic segment during annealing of the samples from room temperature to 1473 K was 3 K/min, followed by quenching in water after 24 h of annealing. Further investigations of the as-cast and homogenized samples were performed using all the experimental devices presented in this work.
2.2. Experimental Methods and Conditions
The phase analysis and structural state of the A and H samples were investigated by X-ray phase analysis of the ingot surface. X-ray data were obtained using a Shimadzu XRD-7000 diffractometer. Imaging conditions: CuKα-radiation, graphite monochromator, external standard - silicon powder, angle range 2ϑ = 20÷80º, step - 0.04º, exposure at the point 3 sec. The microstructure of the samples was studied using an optical Olympus GX-51 and a Carl Zess EVO40 scanning electron microscope operated in the backscattered electron mode(BSE) with an INCAEnergy EDS X-ray Microanalysis analyzer (EDX).
Thermal diffusivity was determined by the laser flash method (LFA) on a Netzsch LFA 457 instrument in the temperature range T=300-1273K in vacuum at a residual pressure of 0.1 mPa. Square samples with a diameter of 10 mm and a thickness of 3 mm were used for the measurements. Both surfaces of the sample discs were sputter coated with colloidal graphite to increase the emissivity. Data were collected every 50 K from room temperature to 1173K during heating. After cooling to room temperature, the sample was measured again using the temperature program and mode as in the first measurement. The sample temperature was equilibrated with a constant value of ±1 °C from the measurement temperature before the laser pulse was started. The rate of linear temperature change in the intervals between the measurement points was 4 K/min. The measurement error was ±3%. The heat capacity at constant pressure was determined by the LFA and DSC methods, independently. In the LFA method, the heat capacity Cp of the sample was determined by a standard technique [
21] of comparison with a reference sample (NIST SRM 864 - Inconel 600 calibrated reference). Experiments to measure the heat capacity of the equiatomic alloy were performed on a NETZSCH DSC 214 Polyma calorimeter in aluminium Concavus
® crucibles with lids, in the temperature range 293 - 900 K. The heat capacity of CoCrFeNi was determined using the ratio method according to ASTM E 1269. The heat capacity measurements were carried out in dynamic mode during heating at a rate of 10 K/min in a nitrogen current (99.998% N, gas flow rate - 50 ml/min) in the temperature range 293-873 K and in isothermal modes of heating for 10 min before and after the dynamic segment, respectively. A sample of synthetic sapphire single crystal with mass 25.2 mg, height 0.25 mm, and diameter 6.0 mm was used as a standard. Thermal analysis was performed using the Netzsch Proteus software.
Thermal linear expansion ((
ΔL/L
o(T))) was measured using a DIL 402C dilatometer (NETZSCH) using a highly sensitive linear displacement sensor. The experiments were performed in a high-purity helium atmosphere under heating at a rate of 3 K/min. The temperature dependence of the density d(T) was determined by the following relation:
where
do is the density at room temperature (determined by geometric method), α(T) is the temperature dependence of the linear expansion coefficient (determined by dilatometric method as α= d/dT(
ΔL/L
o).
The density of the samples at room temperature was measured by hydrostatic weighing in distilled water as a reference liquid; the measurement error was less than 0.2%. The CTE was estimated from the linear thermal expansion data; the estimation error was 3%.
3. Results and Discussion
3.1. Structural Analysis
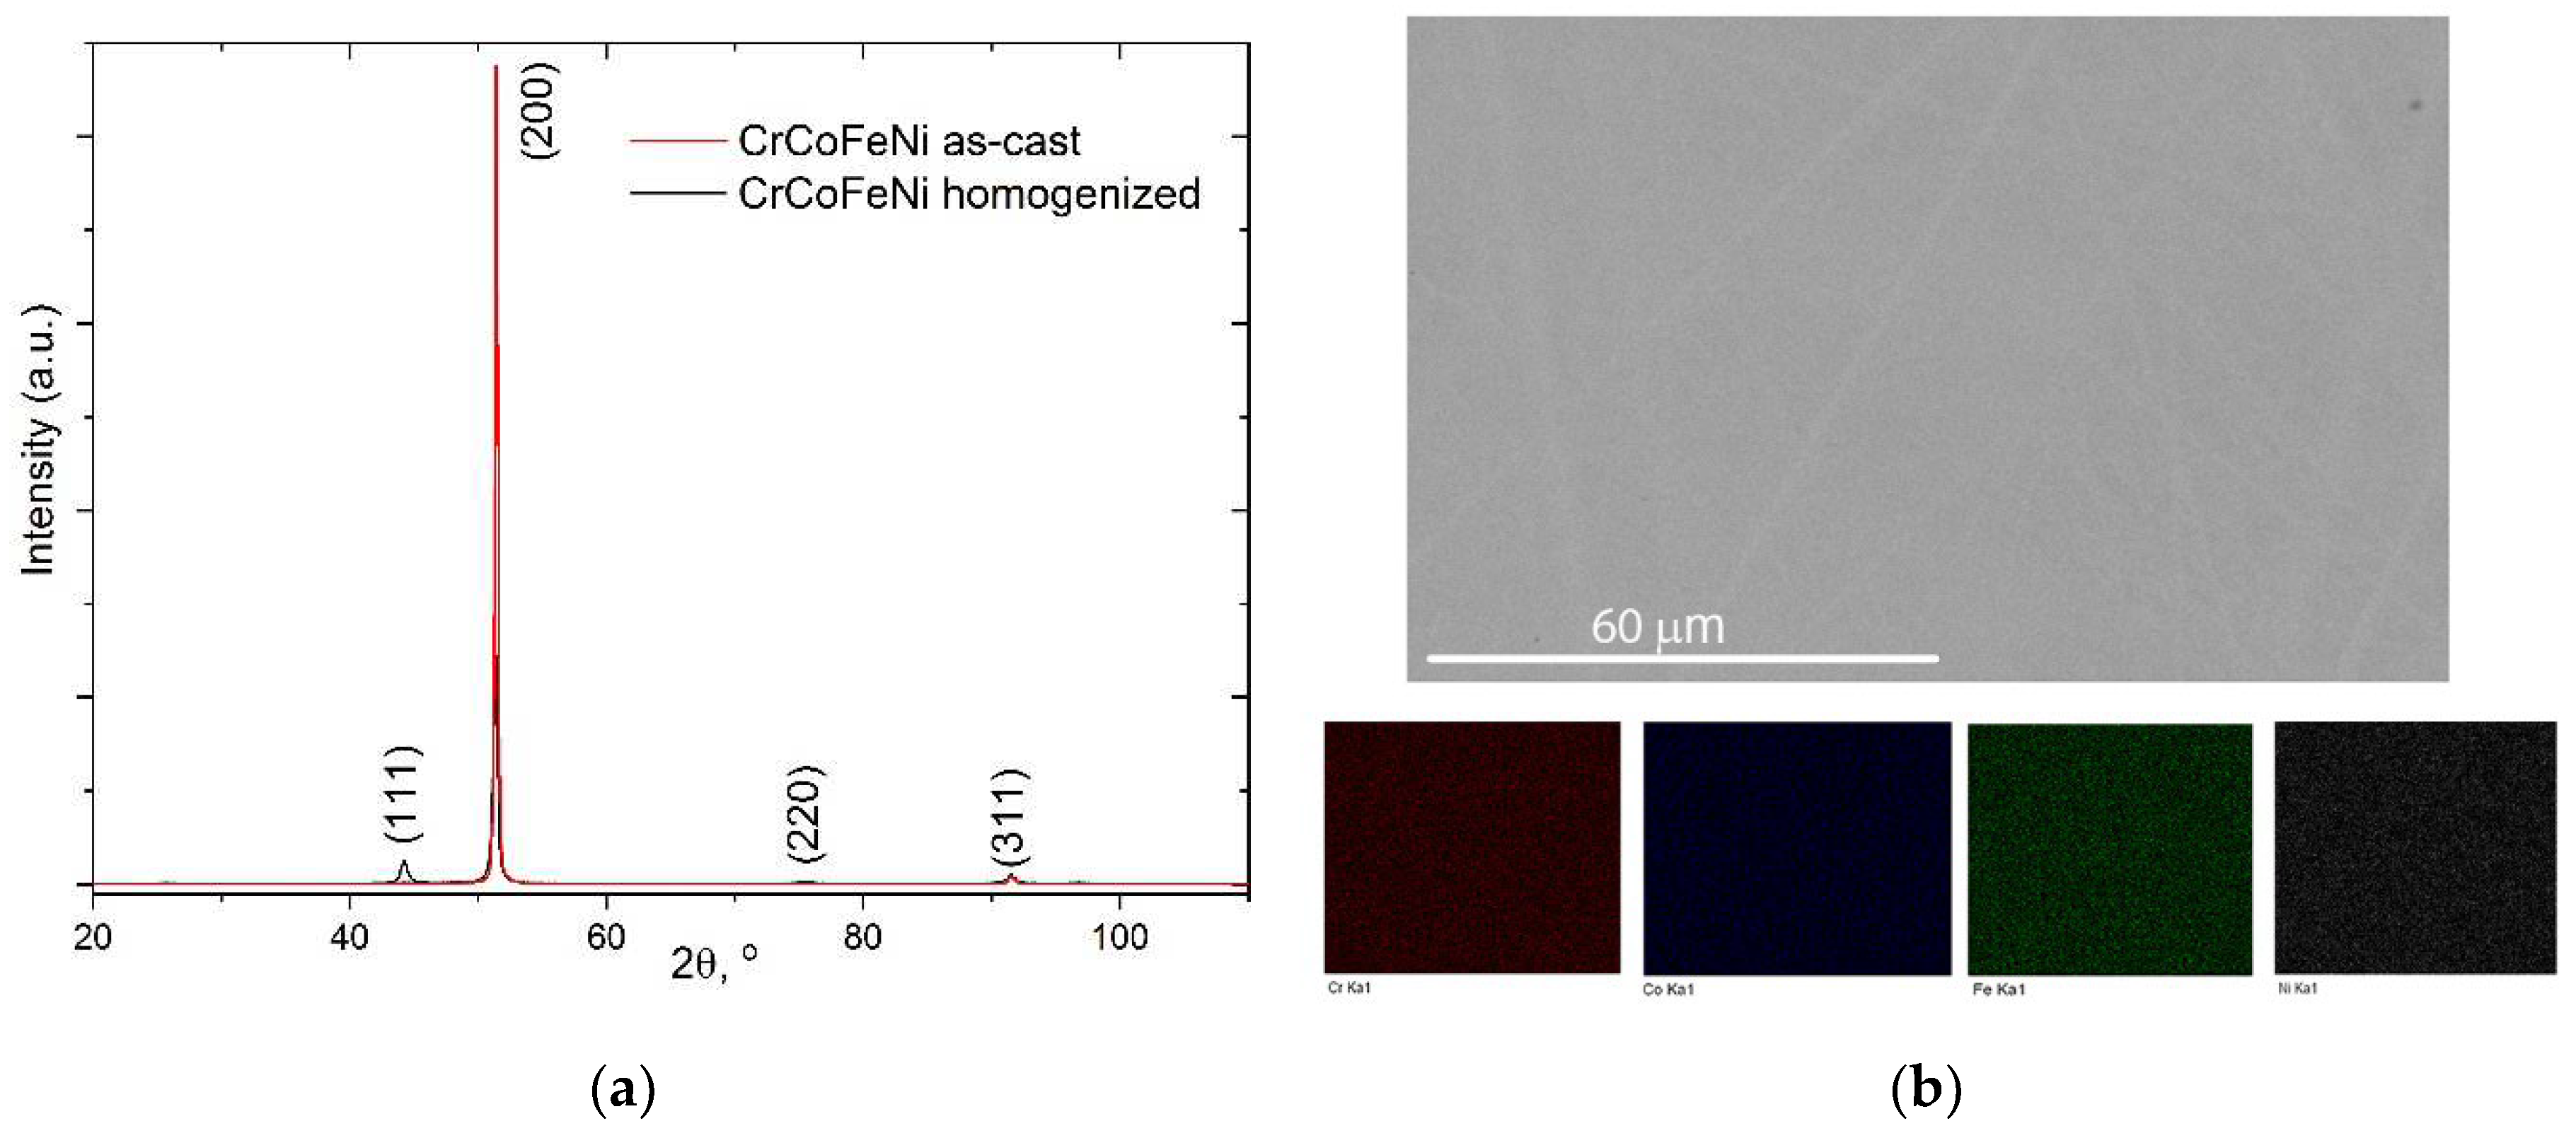
According to the XRD data, A and H samples represent only a solid solution of fcc, and the presence of other phases was not detected. The A and H samples show a trend toward the formation of a columnar structure with a predominant direction (200). X-ray diffraction patterns (
Figure 1a) show Bragg reflections of different intensities, indicating the presence of a strongly textured structure. According to the EDX data, sample A has a chemical composition close to the calculated composition. As an example,
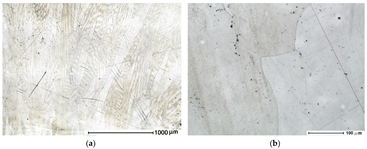
Figure 1b shows microphotographs of the sample A slip surface and element distribution maps. Optical images of samples A and H are shown in
Figure 2a,b. As shown in
Figure 2, the samples have a developed macrostructure in the form of columns and directional crystallization, which agrees well with the XRD data.
3.2. Density, Thermal Expansion and CTE
We have carried out detailed investigations of the temperature dependence of thermal expansion, CTE and density of A and H samples in the temperature range room temperature - 1173K.
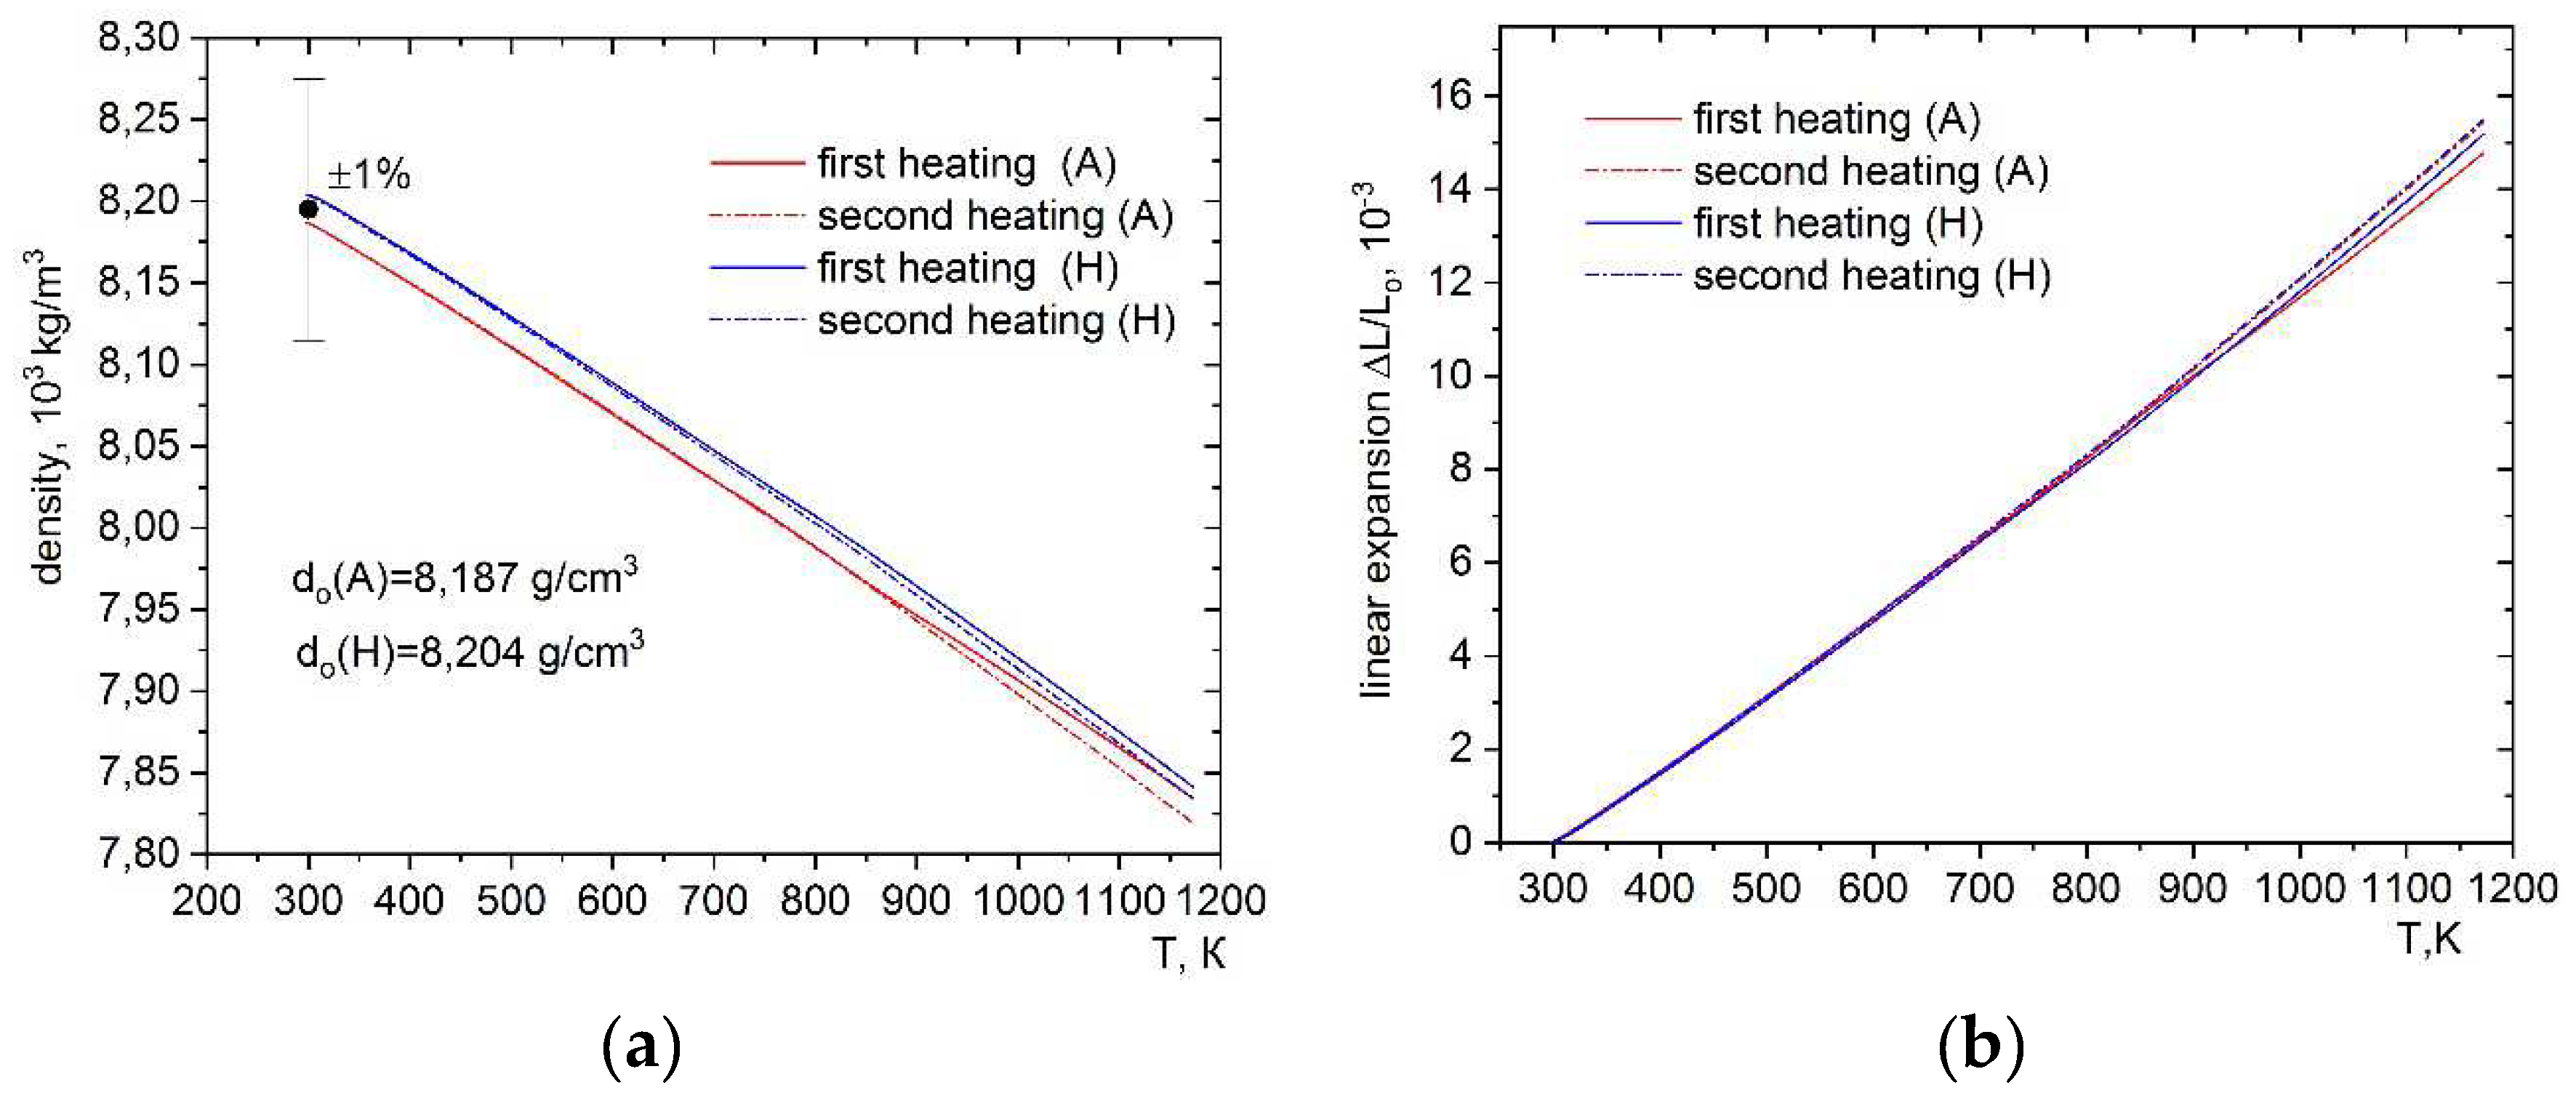
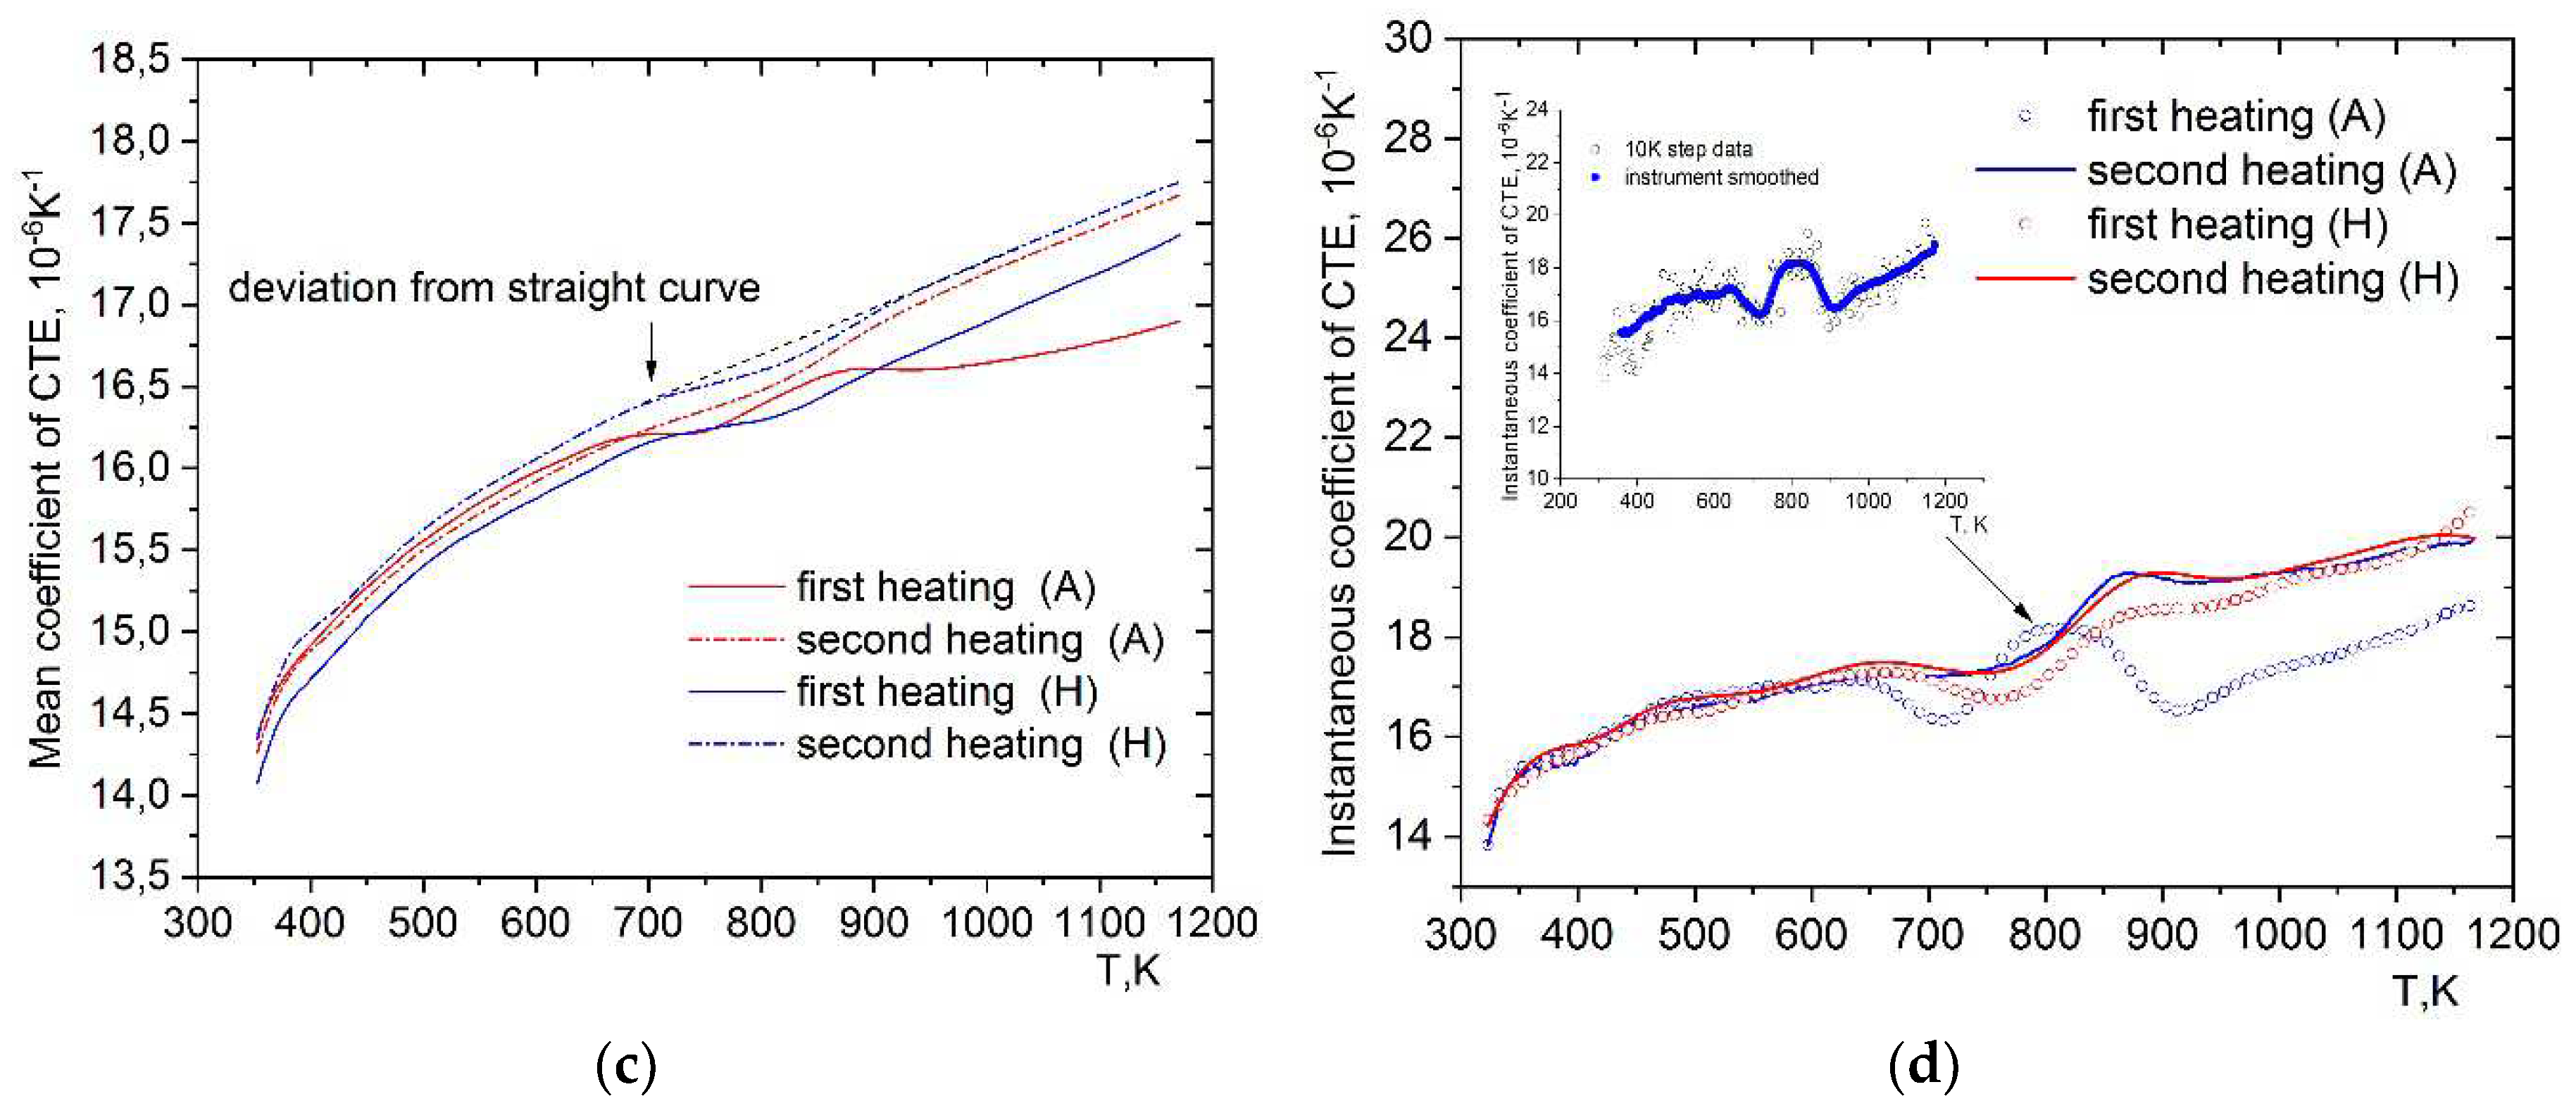
Figure 3a–d show the temperature dependences of density, linear expansion, the average CTE, and instantaneous CTE of A and H samples measured during heating. As can be seen from
Figure 3b,c the thermal expansion and CTE have a general tendency to increase. The average CTE gradually increases with temperature, and the values range from 14.5×10
-6 K
-1 at 300K to about 17.5×10
-6 K
-1 at 1173K. The dependence of the average CTE on temperature is essentially linear. However, as can be seen from
Figure 3c, a significant change in the slope of the curve is observed at about 673K. This change in thermal expansion behavior can be better observed by examining the instantaneous CTE data shown in
Figure 3d. For clarity, the data corresponding to the linear expansion derivative dL/L
o over temperature were smoothed using the Netzsch Proteus software package. As an example, for sample A, the procedure for smoothing the instantaneous CTE values is shown in the inset of
Figure 3d. The smoothed CTE values show the extremes of the CTE temperature curves. There are two valleys on the CTE curve of sample A with minima at 700 and 900K. The deviation from the straight run of the CTE curve for sample A starts at 650K and returns to the straight run after 1000K. On the second heating of sample A, no clear extrema are observed. There is a disappearance of the first and second minima, and in the temperature range 700-850K a rise in the CTE values were observed. For sample H, the temperature dependences of the CTE curves at the first and second heating cycles repeat the course of the CTE curve of sample A at the second heating.
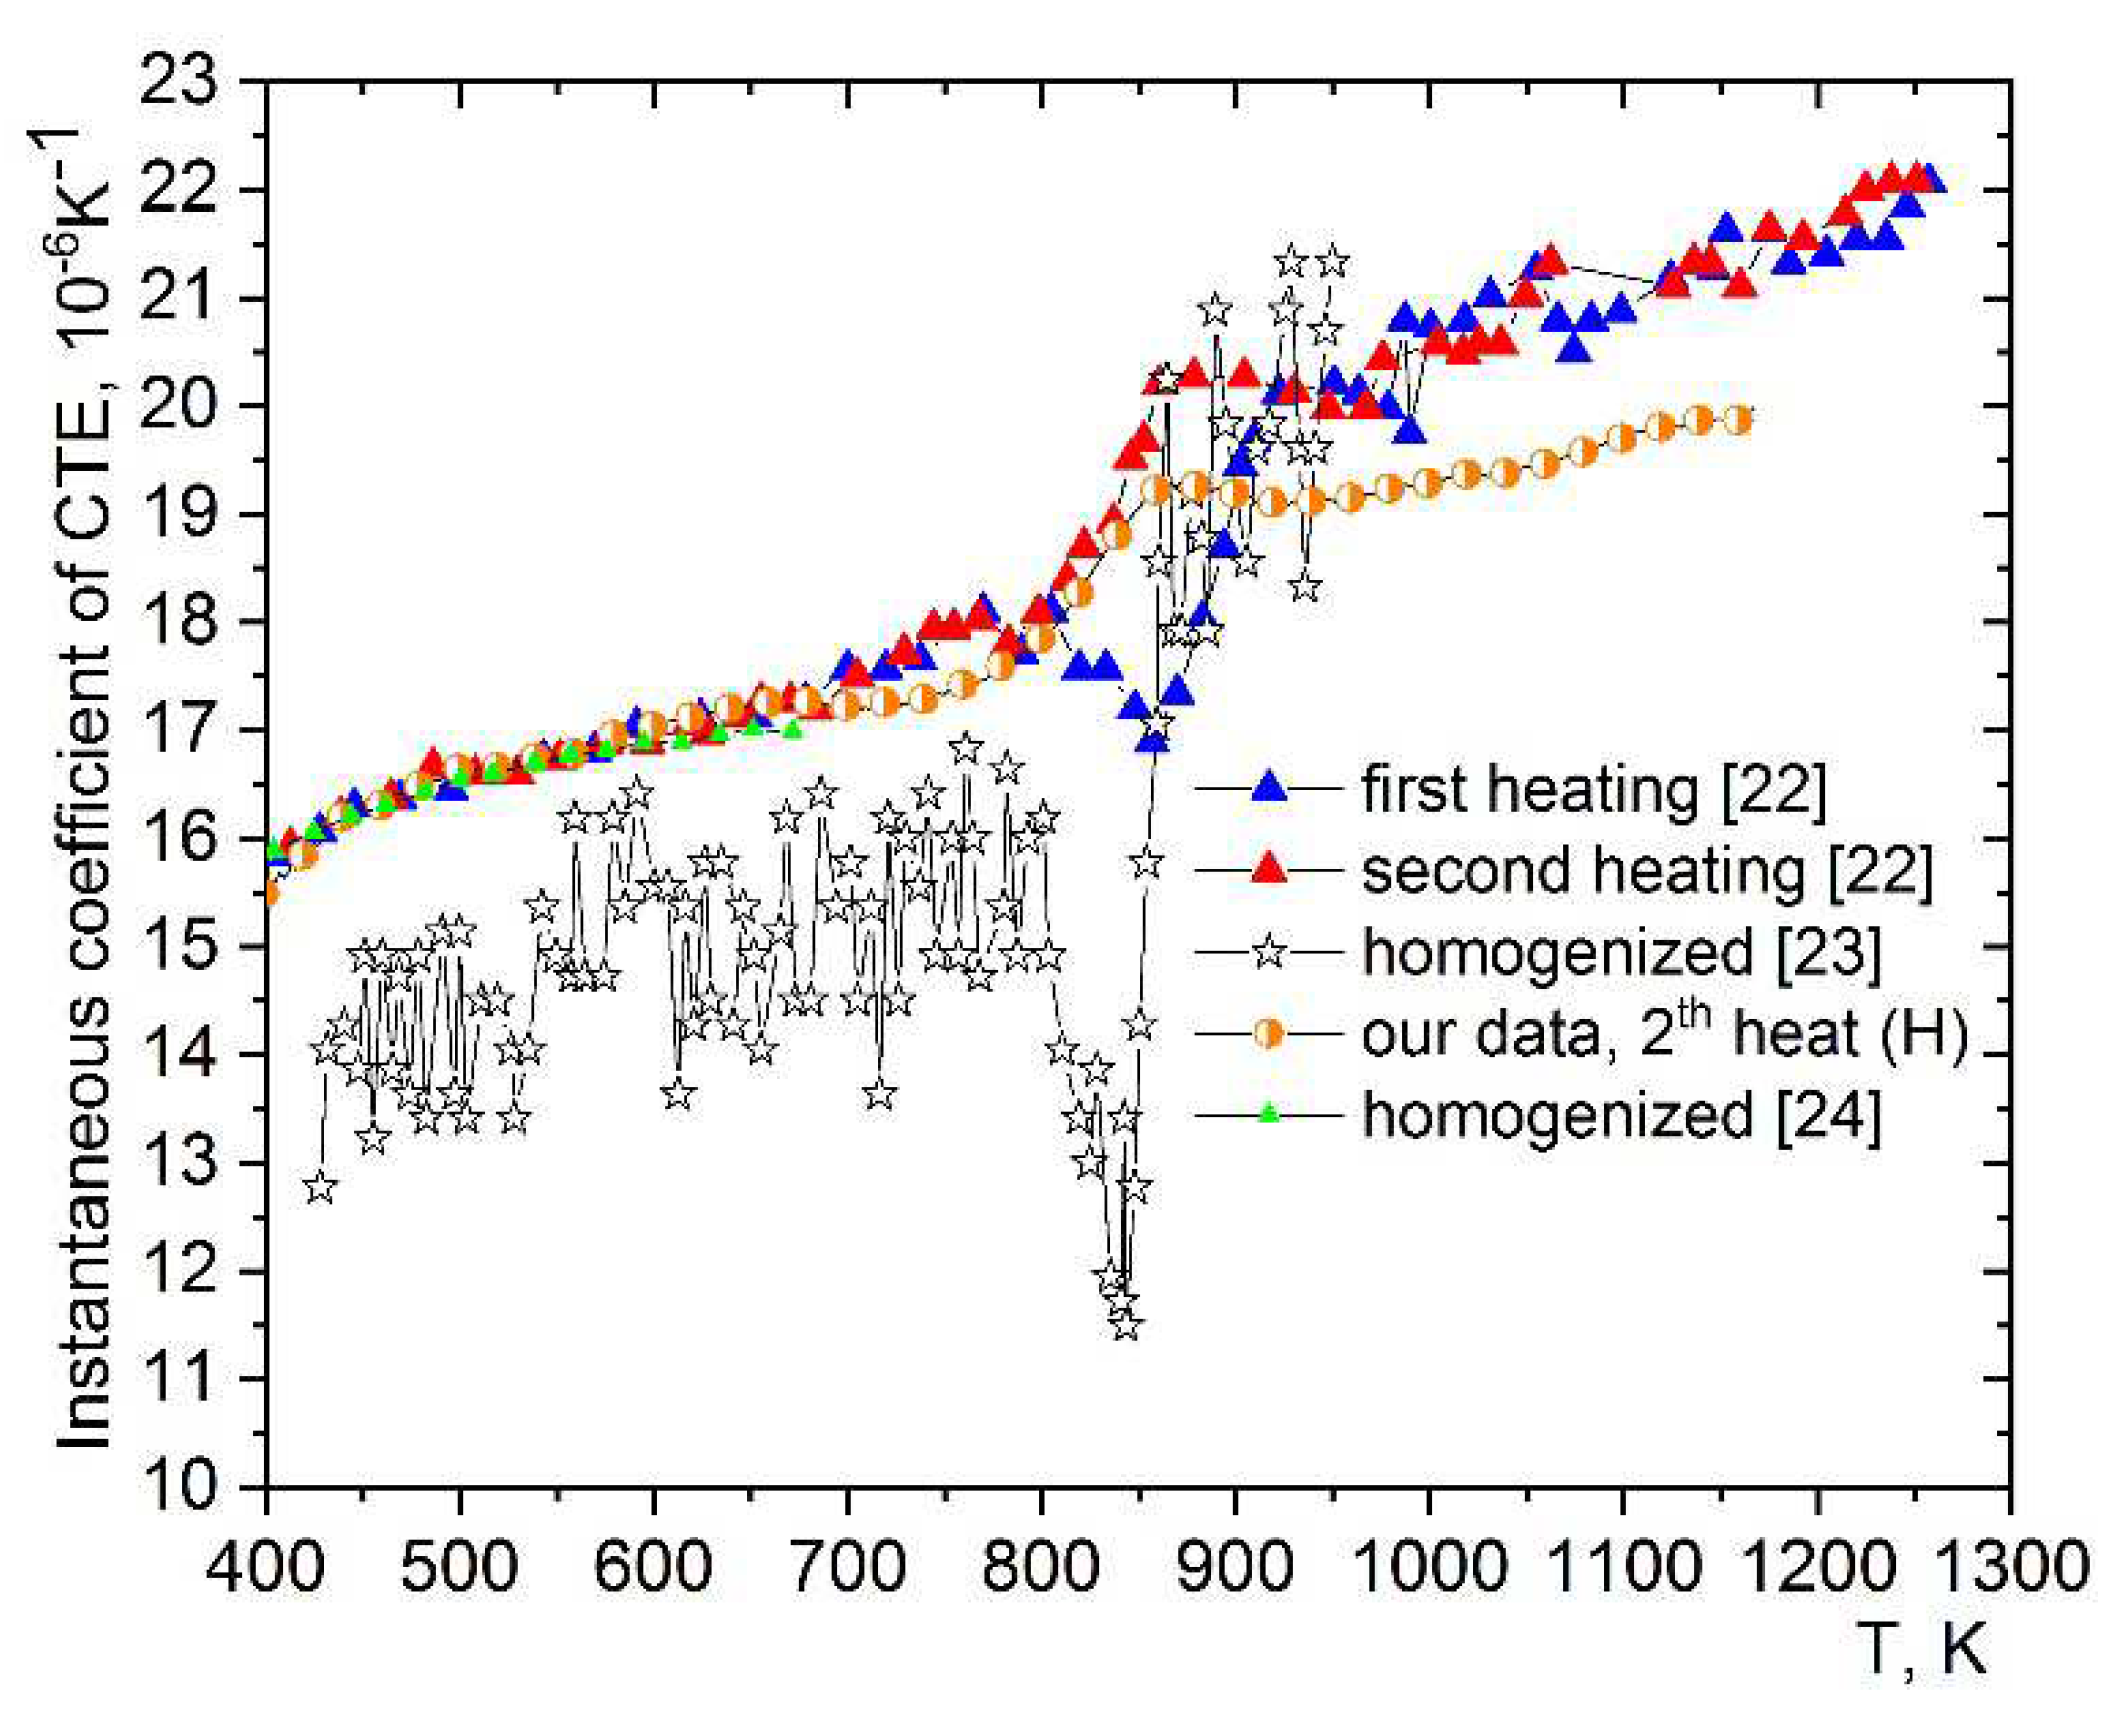
The CTE of the equiatomic CoCrFeNi alloy has been studied in detail in [
22,
23,
24]. A comparison of our data and the authors of [
22,
23,
24] is presented in
Figure 4. Chou et al. [
23] were among the first to find a minimum on the temperature curve of the CTE of homogenized equiatomic CoCrFeNi alloy. The authors assumed that the change in CTE was caused by the transition from ferromagnetic to paramagnetic, i.e., the Curie point. Later in [
25,
26] it was found that the equiatomic alloy CoCrFeNi up to room temperature is paramagnetic. Andreoli et al. [
22] found a similar anomaly in the CTE, heat capacity and electrical resistivity curves of an as-cast CoCrFeNi sample in the same temperature range and studied the change in the evolution of the anomaly on first and second heating. During the first heating of the sample, a depression in the CTE curve was observed (see
Figure 4). According to the authors [
22], the anomaly in the CTE curve of the equiatomic sample is due to annihilation of vacancies and defects from nonequilibrium solidification. The effects of relaxation and grain growth on the CTE curve are unlikely because there is no driving force for recrystallization after the synthesis of the samples. During the second heating, the depression disappears and there appears to be a rise in CTE in the same temperature range. The authors [
22] explain this transformation of CTE at the second heating by diffusive local ordering as a K-state effect. In [
24], no anomalous changes in CTE were found, and the absolute values of CTE coincided with our data up to a temperature of 650K. It is most obvious to assume, as in [
22], that upon initial heating, sample A experiences changes in the unstable textured structure in the same temperature region where CSRO is observed. This is because the sample initially possesses a texture with disordered elements throughout, due to rapid cooling in the furnace floor. After heat treatment of sample A, we expect a change in the texture (as we can see from the X-ray data), disappearance or significant reduction in the number of stresses, vacancies, defects, etc. caused by non-equilibrium solidification conditions. It can be argued that the observed anomalies on CTE at the first heating of the as-cast sample are determined by the synthesis conditions, namely, under what thermal conditions and at what rate the sample solidified. These conditions determine the initial structure of the sample and significantly affect the temperature course of the CTE curve at first heating. Thermally treated sample A shows a clear reversible effect on the CTE curve.
3.2. Specific Heat Capacity
At present, experimental studies of the temperature dependence of the specific heat capacity C
p(T) of equiatomic alloy have been carried out up to 1200K using the DSC method [
6,
22]. In [
22], studies of C
p(T) of the as-cast CoCrFeNi sample in the first and second heating regimes were conducted. The authors of [
6] measured C
p(T) of a homogenized sample pre-annealed at 1473 K for 24 h followed by quenching in water. Experimental results [
6,
22] show that the heat capacity values vary between 0.45 and 0.50 J·g
-1·K
-1 at room temperature. According to the authors [
6,
22], an endothermic reaction is observed in the temperature region accompanied by an S-shaped change in the C
p(T) curve. The authors [
6,
22], relate the transformation of the temperature curve of specific heat capacity with the chemical short-range order-disorder reaction.
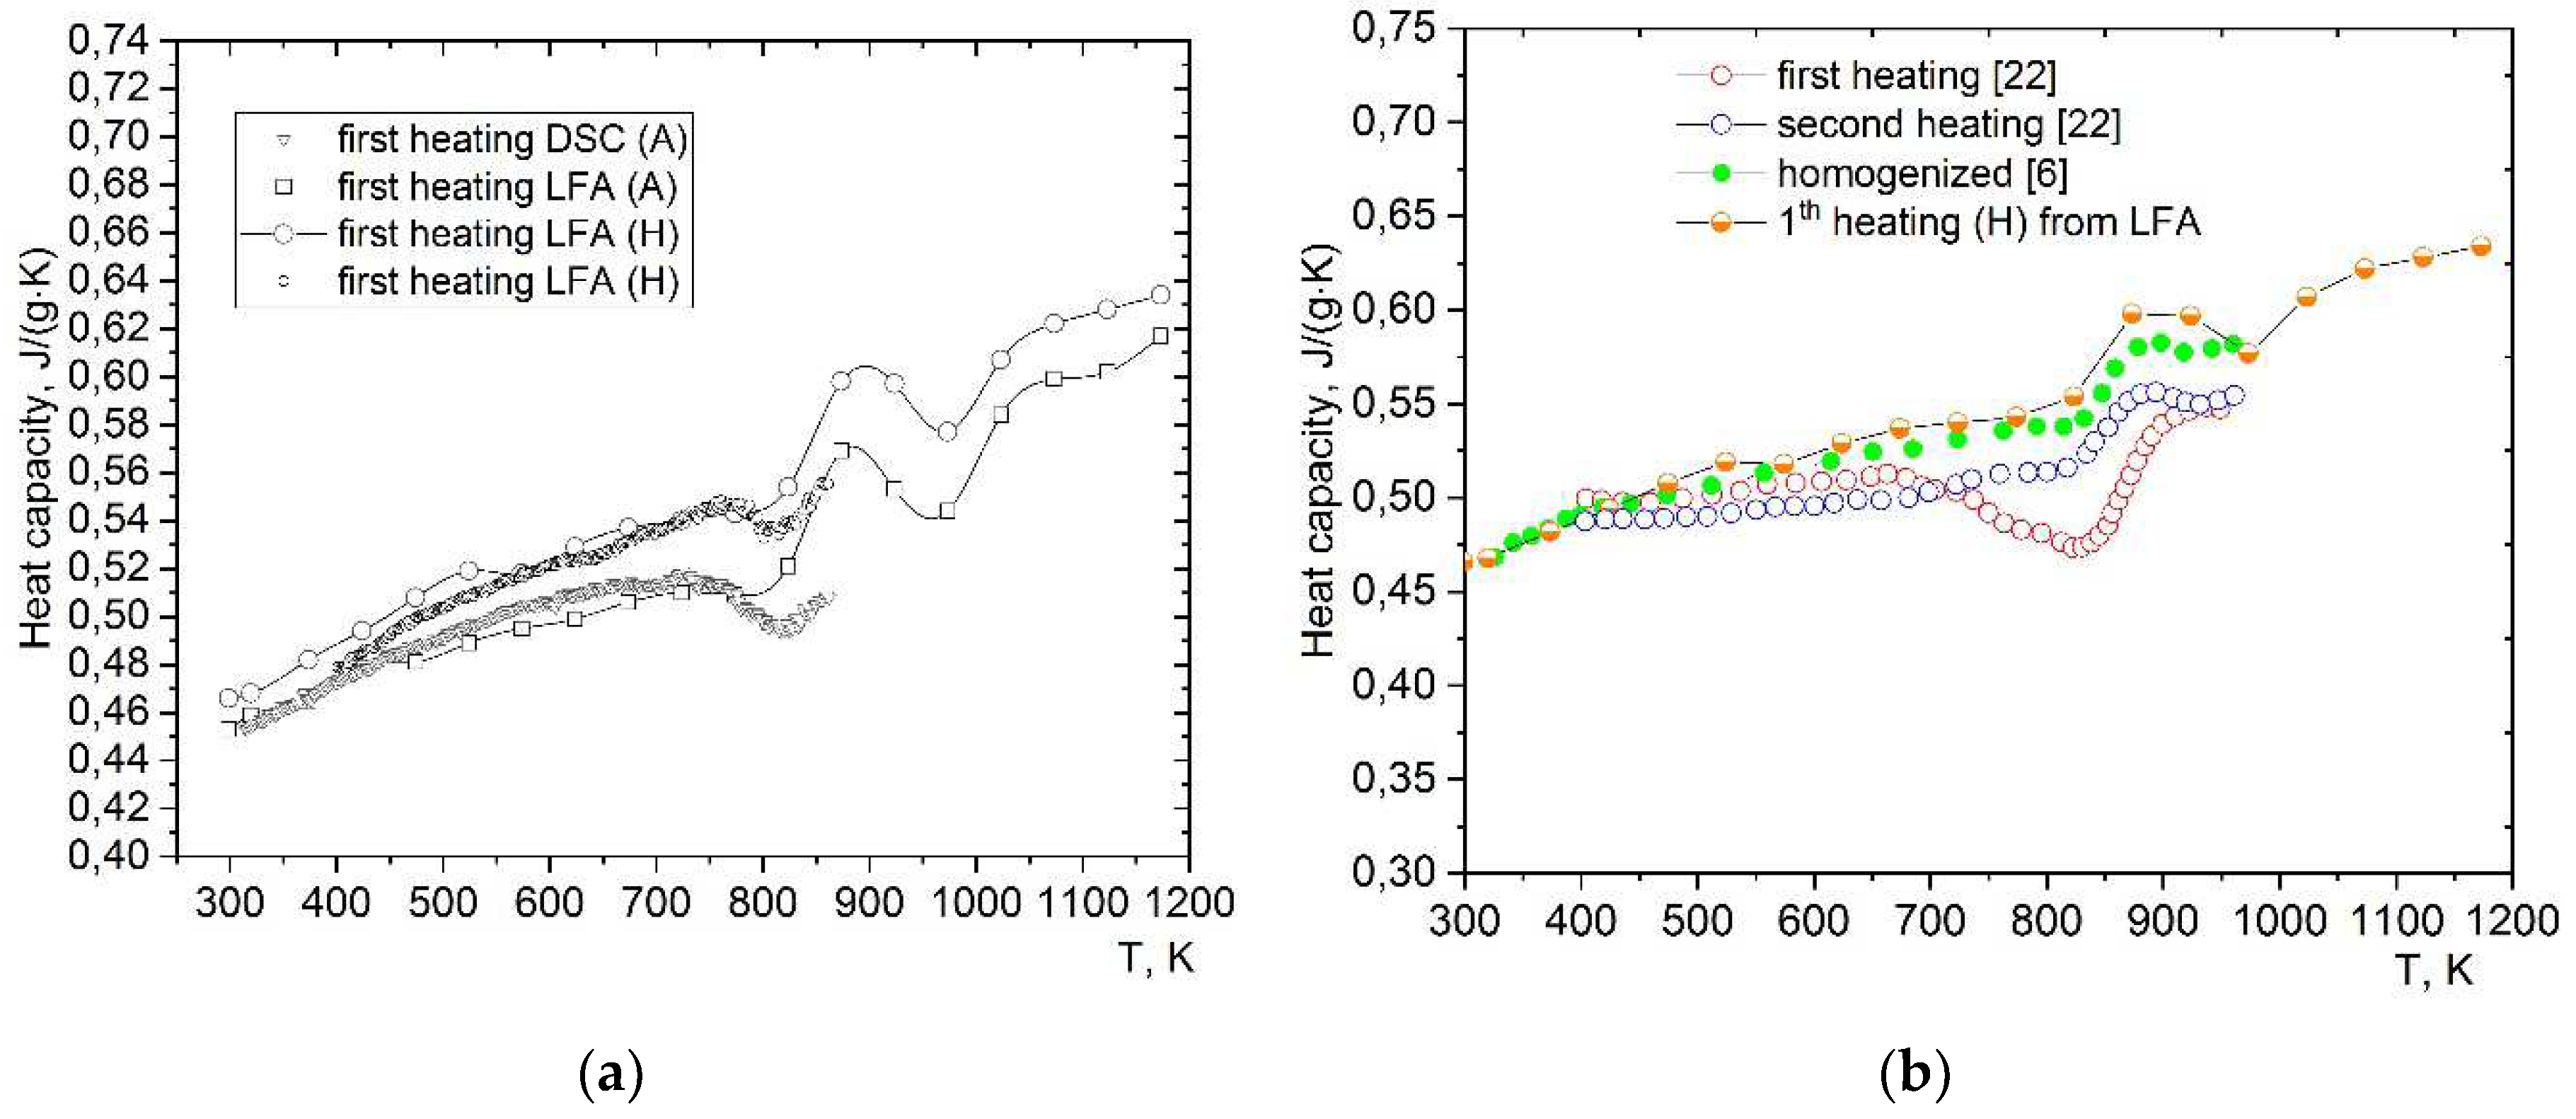
The temperature dependence of heat capacity C
p(T) of samples A and H, obtained by estimation from the comparison method (according to LFA data) and the DSC method, is shown in
Figure 5a. In
Figure 5b, comparison of C
p values of samples A and H with the data of other authors is shown. As can be seen from the
Figure 5a C
p(T) of the A and H samples show similar behavior in the temperature range from 800 to 1100K. At the same time, the values of the specific heat capacity of sample A over the entire temperature range lie lower on the temperature curve relative to C
p of sample H. We attribute the observed differences in specific heat capacity to the structural changes in A and H, as indicated in the discussion of the CTE data. As shown in
Figure 5a, an S-shaped change is observed in the C
p(T) curves. This type of anomaly indirectly indicates the absence of magnetic transformation in the temperature region 300-1000 K. It is known that nickel undergoes a magnetic transition from the ferro- to paramagnetic state (Curie temperature) at 573 K, which is signaled by a lambda-shaped peak on the C
p(T) curve. Simultaneously, the C
p(T) curve of the original sample calculated from the DSC measurements shows a distinct minimum in the range 750-850 K. According to [
22], the minimum on the curve of specific heat capacity appears only at the first heating of the as-cast sample (see
Figure 5b) and is a consequence of the irreversible reaction caused by the non-equilibrium solidification of the sample. Because the heat capacity measurements by the LFA method are carried out in the heating mode with a step of 50 K and with holding at each temperature for 20 min, in contrast to DSC, where heating is continuous, it is not possible to record the change in heat capacity during the rapid metastable reaction. The data of the heat capacity of alloys A and H obtained using the LFA and DSC methods show coincidence within 1-2 %. The values of the heat capacity of sample H obtained from the LFA data coincide well with the C
p data of the authors of [
6], as shown in
Figure 5b. The average values of specific heat capacity at room temperature of the tested samples are 0.45 J·g
-1·K
-1. Here it should be noted that the data of heat capacity obtained by the DSC method are limited by the upper temperature boundary of measurement equal to 873K, therefore in calculations of thermal conductivity, we use the data of C
p(T) obtained from the LFA method.
3.3. Thermal Diffusivity and Thermal Conductivity
The temperature dependence of the thermal diffusivity
a of the as-cast and homogenized Cr-Fe-Co-Ni sample in the temperature range T = 300 - 1200K have been obtained during the investigations. Note that the values of thermal diffusivity were studied in detail at high temperatures for the first time and no anomalies were observed in [
6,
23], where the thermal diffusivity of equiatomic alloy was studied.
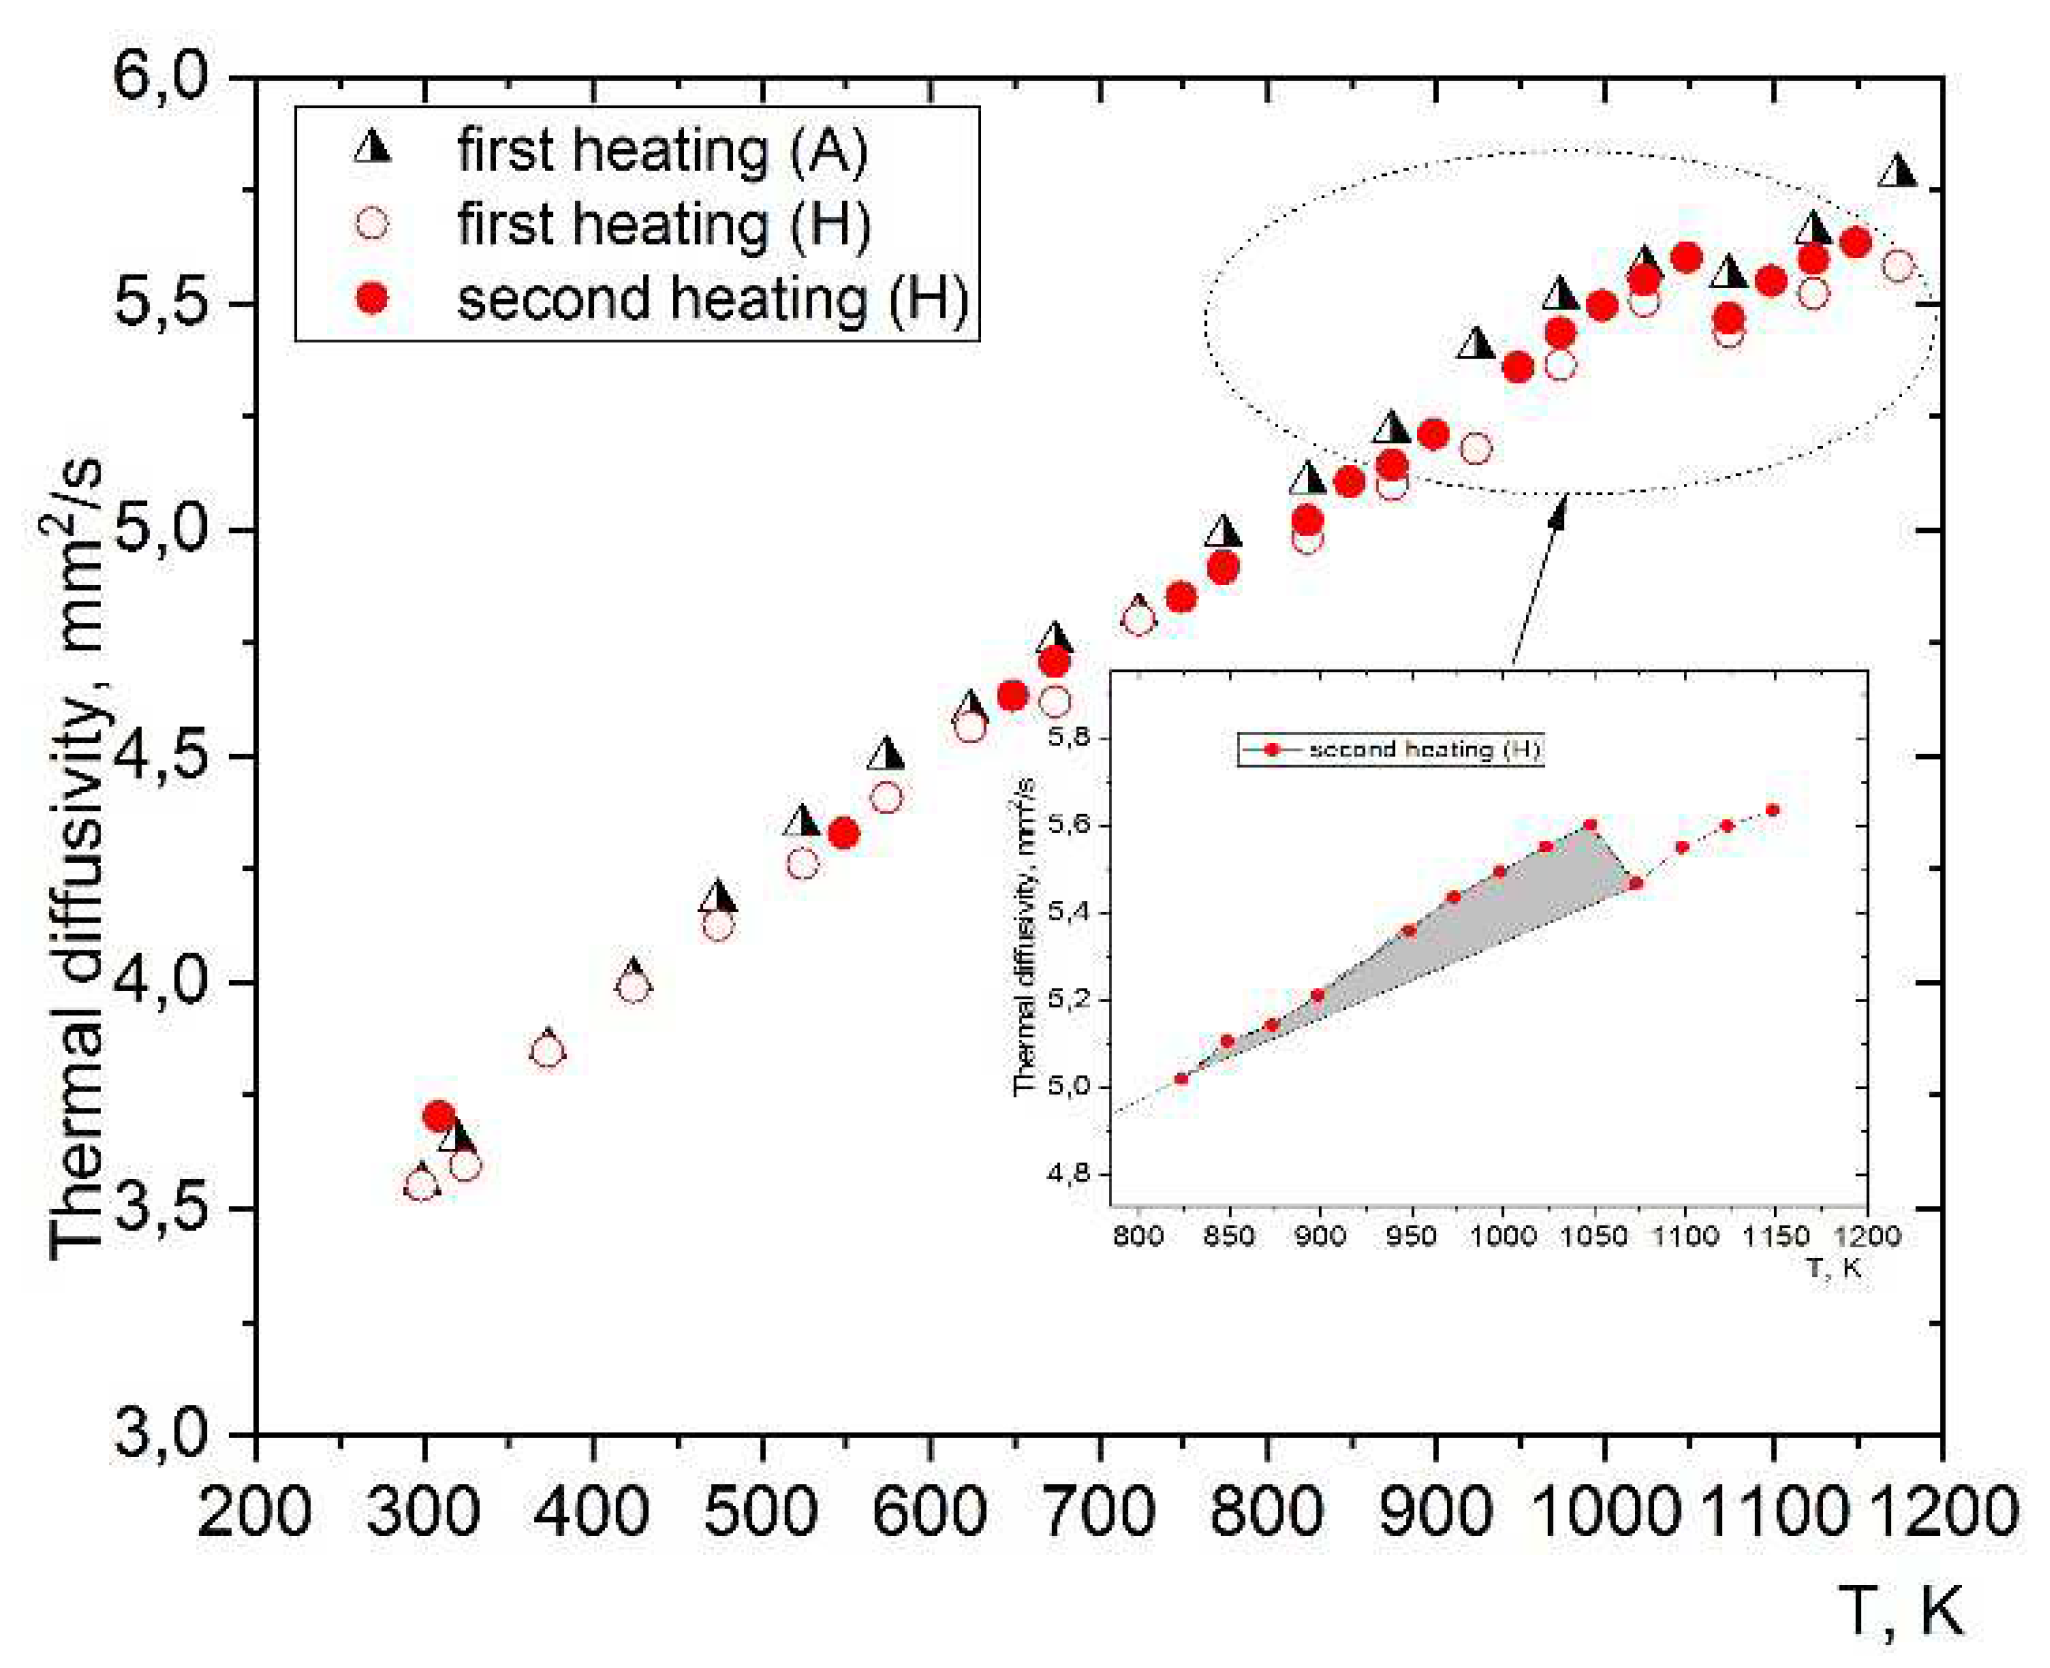
The results of the thermal diffusivity
a(T) of samples A and H are presented in
Figure 6. As can be seen from the graphs, similar behavior and course of the thermal diffusivity curve
a(T) of both samples is observed. The thermal diffusivity values have very low absolute values compared with pure nickel and are characterized by a positive temperature coefficient. Based on
Figure 6, the temperature dependence of the thermal diffusivity for both samples varies non-monotonically in the temperature range T = 850-1100 K.
Note that all the observed features on the curves
a(T) (
Figure 6) correlate with the temperature dependence of the thermal diffusivity of the industrial Ni-Cr alloys, Inconel 617, Inconel 600 and 800H [
27]. Differences are observed in the position and magnitude of the peak on the
a(T) curve. As noted by the authors [
27] in the binary alloy Ni-Cr the peak value is maximum and lies lower by 25-50K compared with other industrial alloys containing chromium and nickel. As studies have shown, the formation of Ni
2Cr phases, Ni
3Cr, and carbides signaling the presence of long-range order in alloy 617, which is close in chemical composition to CoCrFeNi, does not occur. Therefore, the presence of the peak and its shift in temperature in alloy 617 are attributed to a relatively fast and reversible near-order reaction. Because the peak in the thermal diffusivity of CoCrFeNi and industrial alloys is extended in temperature by 60-100 K, this indirectly indicates the dependence of the reaction on the heating rate. Consequently, it is necessary to consider the kinetics of the SRO reaction, which can be slowed down by the presence of Fe, Co, etc. atoms. As shown by calculations [
28] equimolar CoCrFeNi exhibits a pronounced ordering tendency toward the L12-(Fe,Co,Ni)
3Cr structure. Because of the specific ordering between the alloy components, equimolar CoCrFeNi behaves as a quasi-binary Me
75Cr
25 alloy with the L12 ordering type. In this ordering, only one sublattice is predominantly occupied by Cr atoms, whereas the other three fcc sublattices are chaotically alloyed with the remaining components. We suggest that the atomic cluster ordering regions in equimolar CoCrFeNi are mainly formed based on the L12-Ni
3Cr structure and do not decay instantaneously for several reasons. Perhaps atomic cluster ordering is simultaneously determined by the challenging magnetic state within the regions and the strong chemical interaction of the alloy components. In any case, a rigorous description of the anomaly manifested in the different physical properties of CoCrFeNi requires further nontrivial experiments and new theoretical investigations.
The measurement of the thermal conductivity coefficient in the high-temperature region is a difficult task because it is difficult to accurately account for the heat exchange between the sample and the environment. In this situation, instead of measurement, the thermal conductivity coefficient λ can be determined from measurements of thermal diffusivity
a and data on the heat capacity C
p and density
d of the material, using the following relationship:
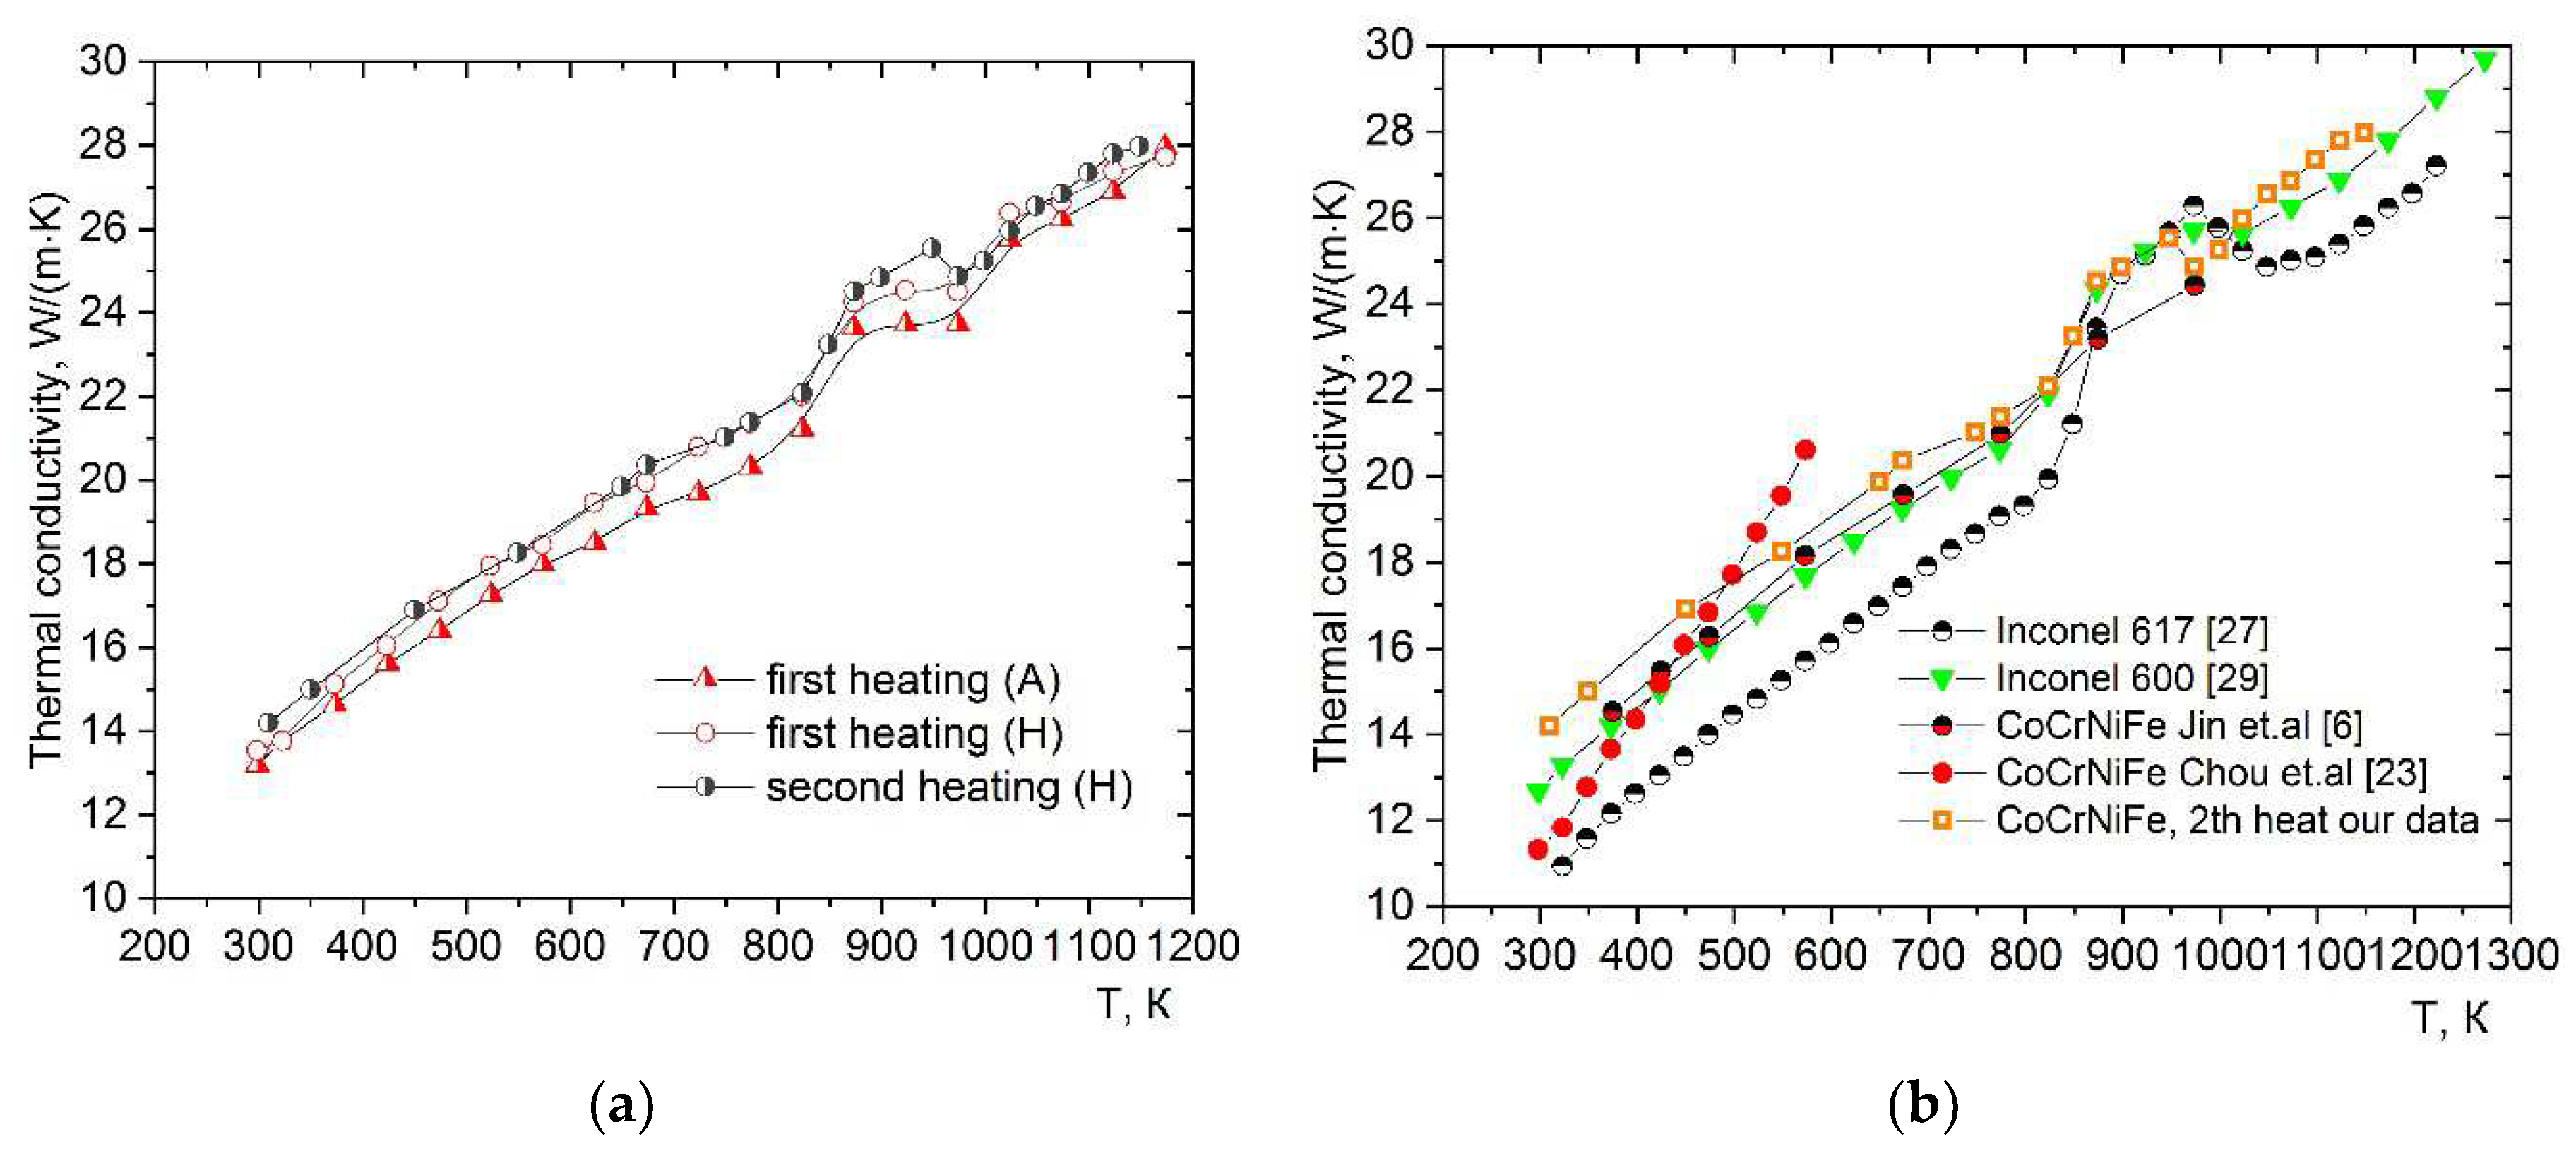
Figure 7a,b shows plots of the thermal conductivity versus temperature for A and H alloys in the temperature range 300-1173 K, calculated from Equation (2). The results of our experimental studies on the heat capacity C
p and density
d were used to calculate the thermal conductivity values. Similar to the thermal diffusivity of CoCrFeNi alloy, the thermal conductivity has an increasing non-monotonic dependence λ(T). The thermal conductivity data of alloys A and H are essentially identical. The thermal conductivity increases linearly with temperature up to about 800K. Between approximately 823 and 1023K, there is a broad peak in the thermal conductivity values is observed due to the combined effect of the individual transitions observed in thermal conductivity and specific heat capacity. At approximately 1073K, the thermal conductivity increases linearly again up to 1173K.
The thermal conductivity values for the homogeneous CoCrFeNi alloy are shown in
Figure 7b together with data for the commercial alloys Inconel 617, Inconel 600, and the previously studied CoCrFeNi alloy. Prominent peaks were observed for 617 and 600 alloys, while a small but discernible peak was observed for CoCrFeNi. In terms of thermal conductivity curve behavior and values, the CoCrFeNi under study is close to the commercial alloy Inconel 600.
4. Conclusions
The thermophysical properties such as diffusivity, density, coefficient of thermal expansion and specific heat capacity of cast and homogenized high-entropy CoCrFeNi alloy in the temperature range of 300-1200 K have been studied. On the basis of the measured thermophysical values, the thermal conductivity was calculated. Columnar grains were observed in the cast and annealed CoCrFeNi alloy due to non-uniform solidification under arc melting conditions. XRD results showed that the as-cast and homogenized high-entropy CoCrFeNi alloy had a single-phase face-centered cubic structure. The thermal conductivity and the thermal diffusivity of the equiatomic CoCrFeNi alloy are found for the first time to deviate from monotonic behavior in the temperature range from 773 to 1100 K. The observed features on the a(T) and λ(T) curves correlate with the temperature dependences of thermal diffusivity and thermal conductivity of the industrial Ni-Cr, Inconel 617, Inconel 600 and 800H alloys. The non-linear behavior of the transport properties is primarily the result of, order/disorder (SRO) phenomena for the homogenized sample, and for the as-cast sample, as well as non-equilibrium solidification under arc melting conditions.
Author Contributions
Conceptualization, V.A.B. and R.E.R.; methodology, T.V.K.; software, R.E.R.; validation, V.A.B., R.E.R., T.V.K. and I.S.S.; formal analysis, V.A.B., I.S.S., E.V.S. and T.V.A.; investigation, V.A.B., I.S.S., E.V.S. and D.A.K.; resources, E.V.S.; data curation, I.S.S.; writing—original draft preparation, V.A.B., R.E.R., T.V.K. and D.A.K.; writing—review and editing, V.A.B., R.E.R., T.V.K. and D.A.K.; visualization, I.S.S.; supervision, V.A.B.; project administration, V.A.B.; funding acquisition, V.A.B. and R.E.R. All authors have read and agreed to the published version of the manuscript.
Funding
This research was funded by Russian Science Foundation, grant number 23-22-00137.
Data Availability Statement
Not applicable.
Conflicts of Interest
The authors declare no conflict of interest.
References
- B. Cantor, I. Chang, P. Knight, A. Vincent, Microstructural development in equiatomic multicomponent alloy, Mater Sci Eng, A, 375 (2004), pp. 213-218.
- Hamed Shahmir, Mohammad Sajad Mehranpour, Seyed Amir Arsalan Shams, Terence G. Langdon, Twenty years of the CoCrFeNiMn high-entropy alloy: Achieving exceptional mechanical properties through microstructure engineering, Journal of Materials Research and Technology, 23 (2023), pp. 3362-3423,.
- Woei-Ren Wang, Wei-Lin Wang, Jien-Wei Yeh, Phases, microstructure and mechanical properties of AlxCoCrFeNi high-entropy alloys at elevated temperatures, Journal of Alloys and Compounds, 589 (2014), pp 143-152.
- Qiancheng Liu, Peng Zhao, Feng Zhao, Jie Zhu, Sudong Yang, Lin Chen, Qian Zhang, Bulk CrCoNiFe alloy with high conductivity and density of grain boundaries for oxygen evolution reaction and urea oxidation reaction, Journal of Colloid and Interface Science, 644 (2023) pp 1-9.
- Xin-Hui Gu, Hao-Jie Yan, Qin-Hao Zhang, Xian-Ze Meng, Lian-Kui Wu, Fa-He Cao, Microstructure characterization and corrosion behavior of Alx(CoCrFeNi)100−x (x = 0, 5, 10, 15, 20) high entropy alloys in 0.5 M H2SO4 solution, Journal of Alloys and Compounds, 944 (2023) 169247.
- K. Jin, S. Mu, K. An, W.D. Porter, G.D. Samolyuk, G.M. Stocks, H. Bei, Thermophysical properties of Ni-containing single-phase concentrated solid solution alloys, Mater. Des. 117 (2017) pp. 185–192.
- H. Thomas, Über Widerstandslegierungen, Zeitschrift Für Phys. 129 (1951) 219–232.
- A. Marucco, B. Nath, Effects of ordering on the properties of Ni-Cr alloys, J. Mater. Sci. 23 (1988) 2107–2114.
- I.G. Shmakov, O.I. Gorbatov, V.V. Serikov, N.M. Kleinerman, O.A. Golovnya, Y.N. Gornostyrev, Short-range order formation in Fe-Co alloys: NMR study and first principles calculations, J. Alloys Compd. 782 (2019) 1008–1014.
- A. Tamm, A. Aabloo, M. Klintenberg, M. Stocks, A. Caro, Atomic-scale properties of Ni-based FCC ternary, and quaternary alloys, Acta Mater. 99 (2015) 307–312.
- W. Bendick, H.H. Ettwig, W. Pepperhoff, Anomalies in specific heat and thermal expansion of FCC iron alloys, J. Phys. F Met. Phys. 8 (1978) 2525–2534.
- Y. Wang, D. Jiang, W. Yu, S. Huang, D. Wu, Y. Xu, X. Yang, Short-range ordering in a commercial Ni-Cr-Al-Fe precision resistance alloy, Mater. Des. 181 (2019) 1–9.
- R.J. Taunt, B. Ralph, Ordering and the K-effect in Ni2Cr, Phys. Status Solidi. 29 (1975) 431–442.
- F.X. Zhang, S. Zhao, K. Jin, H. Xue, G. Velisa, H. Bei, R. Huang, J.Y.P. Ko, D.C. Pagan, J.C. Neuefeind; et al. Local structure and short-range order in a NiCoCr solid solution alloy Phys. Rev. Lett., 118 (2017), p. 205501.
- X. Chen, Q. Wang, Z. Cheng, M. Zhu, H. Zhou, P. Jiang, L. Zhou, Q. Xue, F. Yuan, J. Zhu; et al. Direct observation of chemical short-range order in a medium-entropy alloy Nature, 592 (2021), pp. 712-716.
- A. Marucco Atomic ordering in the Ni–Cr–Fe system Mater. Sci. Eng., A189 (1994), pp. 267-276.
- E. Lang; et al. Effect of thermomechanical treatments on short-range ordering and secondary-phase precipitation in Ni–Cr-based alloys Mater. Sci. Eng., A114 (1989), pp. 147-157Y.
- Zhang, R., Zhao, S., Ding, J. et al. Short-range order and its impact on the CrCoNi medium-entropy alloy. Nature 581, 283–287 (2020).
- Tyler Joe Ziehl, David Morris, Peng Zhang, Detection and impact of short-range order in medium/high-entropy alloys, iScience, 26(3), 2023, 106209.
- Xu D, Wang M, Li T, Wei X, Lu Y. A critical review of the mechanical properties of CoCrNi-based medium-entropy alloys. Microstructures, 2 (2022) 2022001.
- Shinzato, K., Baba, T. A Laser Flash Apparatus for Thermal Diffusivity and Specific Heat Capacity Measurements. Journal of Thermal Analysis and Calorimetry 64, (2001) pp 413–422.
- Andreoli, Angelo F. and Mix, Torsten and Woodcock, Thomas George and Fasel, Nazir and Gasser, Jean-Georges and Nielsch, Kornelius and Kaban, Ivan, Anomalous Temperature-Dependent Behavior of Physical Properties of CrFeNi, CoCrNi, and CoCrFeNi Medium- and High-Entropy Alloys. Available at SSRN: https://ssrn.com/abstract=4212305. [CrossRef]
- Hsuan-Ping Chou, Yee-Shyi Chang, Swe-Kai Chen, Jien-Wei Yeh, Microstructure, thermophysical and electrical properties in AlxCoCrFeNi (0≤x≤2) high-entropy alloys, Materials Science and Engineering: B 163 (3), (2009) pp. 184-189.
- G. Laplanche, P. Gadaud, C. Bärsch, K. Demtröder, C. Reinhart, J. Schreuer, E.P. George,Elastic moduli and thermal expansion coefficients of medium-entropy subsystems of the CrMnFeCoNi high-entropy alloy, Journal of Alloys and Compounds, 746 (2018) pp. 244-255.
- M.S. Lucas, L. Mauger, J.A. Muñoz, Y. Xiao, A.O. Sheets, S.L. Semiatin, J. Horwath, Z. Turgut, Magnetic and vibrational properties of high-entropy alloys J. Appl. Phys., 109 (7) (2011), p. 07E307.
- Varun Chaudhary, Vishal Soni, Bharat Gwalani, R.V. Ramanujan, Rajarshi Banerjee, Influence of non-magnetic Cu on enhancing the low temperature magnetic properties and Curie temperature of FeCoNiCrCu(x) high entropy alloys, Scripta Materialia, 182 (2020) pp. 99-103.
- B.H. Rabin, W.D. Swank, R.N. Wright, Thermophysical properties of Alloy 617 from 25°C to 1000°C, Nuclear Engineering and Design, 262 (2013) pp. 72-80.
- B. Schönfeld, C. R. Sax, J. Zemp, M. Engelke, P. Boesecke, T. Kresse, T. Boll, T. Al-Kassab, O. E. Peil, and A. V. Ruban Local order in Cr-Fe-Co-Ni: Experiment and electronic structure calculations Phys. Rev. B 99, (2019) 01420.
- Blumm, Jürgen, Andreas Lindemann and B. Niedrig, Measurement of the thermophysical properties of an NPL thermal conductivity standard Inconel 600, High Temperatures-high Pressures (2003) pp. 621-626.
|
Disclaimer/Publisher’s Note: The statements, opinions and data contained in all publications are solely those of the individual author(s) and contributor(s) and not of MDPI and/or the editor(s). MDPI and/or the editor(s) disclaim responsibility for any injury to people or property resulting from any ideas, methods, instructions or products referred to in the content. |
© 2023 by the authors. Licensee MDPI, Basel, Switzerland. This article is an open access article distributed under the terms and conditions of the Creative Commons Attribution (CC BY) license (http://creativecommons.org/licenses/by/4.0/).
