1. Introduction
Biological polymers such as α-chitin, its derivative, and α-chitin-chitosan biocomposite have gained significant interest for their unique mechanical properties and potential applications in bioengineering, materials science, and environmental technology. Understanding these properties is essential for customizing specialized solutions across various industries. Chitin and chitosan, two critical biopolymers derived primarily from fungi and arthropods, have drawn significant interest in recent years due to their unique properties and potential applications. Among the diverse biopolymers, chitin and chitosan feature prominently owing to their inherent biodegradability, biocompatibility, non-toxic and environmental sustainability [
1,
2,
3].
As the second most abundant organic compound in nature, following cellulose, chitin is a critical structural component in fungi, insects, and crustaceans [
4,
5]. Chitin, a long-chain polymer of N-acetylglucosamine, is a crucial constituent of fungal cell walls, providing structural integrity and playing a significant role in their life processes [
6]. The fungi chitin confers the rigidity and toughness necessary for survival in diverse environments. This robustness is reflected in the mechanical properties, which display impressive strength and flexibility, making chitin a promising candidate for various structural and biomedical applications [
7,
8,
9]. Chitosan, a deacetylated derivative of chitin, is soluble in most common solvents. The deacetylation process imparts chitosan with reactive amino groups, improving its solubility in various mediums [
9,
10]. The solubility and enhanced biological reactivity broaden chitosan's utility in agriculture, water treatment, food packaging, wound healing, and drug delivery applications [
11,
12,
13]. The unique physicochemical and biological attributes of chitosan classify it as an appealing substance in materials engineering [
14].
In recent decades, increasing demand to transition to sustainable and environmentally responsible materials has raised the importance of chitin and chitosan in material science. These naturally abundant and biodegradable biopolymers offer an opportunity to develop new materials with a minimal ecological footprint. However, a comprehensive understanding of their mechanical properties, particularly under varying conditions and length scales, is crucial to optimizing their use and broadening their application range.
α-chitin, one of the crystalline forms of chitin, is particularly interesting due to its superior characteristics to other polymorphs. α-chitin has a more stable structure compared to the β-chitin. The degree of crystallinity and N-acetylation in α-chitin can vary depending on its biological source, providing a range of material qualities that can be optimized for specific applications [
15]. Investigating the mechanical properties of α-chitin and chitosan under uniaxial tensile loading is critical for real-world applications. MD simulations can provide insights into the mechanical response of these materials under such loading conditions, helping optimize their use in structural applications [
16,
17,
18,
19]. Understanding the mechanical properties of chitin and chitosan at the nanoscale under tensile loading can elucidate their suitability for various applications, especially in biomedicine and structural materials.
Furthermore, the source of chitin, marine- and fungi-derived, significantly influences its physicochemical properties [
20,
21]. Fungi, a renewable and terrestrial source, can reduce the environmental concerns associated with marine exploitation, and fungal chitin offers several advantages [
22]. Fungal chitin exhibits distinguished structural and molecular characteristics, and chitosan, derived from chitin's deacetylation, inherits many of these structural characteristics [
23]. Their distinctive structural properties may produce different mechanical properties than their marine counterpart. Chitin and chitosan form a biocomposite with exciting characteristics, combining both properties and potentially offering synergistic benefits. Most of the studies so far have primarily focused on their biological and chemical properties [
24,
25,
26,
27,
28]. Numerous studies have suggested that combining chitin with other materials can lead to biocomposites with improved properties, harnessing the best of each constituent material [
29].
Computational methods are versatile tools to determine the hierarchical scale-dependent properties of biocomposite materials and provide an affordable platform before experimental validation [
30,
31]. A recent computational study has employed MD simulations to investigate the binding interactions between chitosan oligomers and α-chitin crystals, providing valuable insights for enzymatic deacetylation and the development of composite materials [
18]. The study employed steered MD and umbrella sampling techniques, offering molecular-scale insights vital for the design of chitin-chitosan composite films. Complementary research has also explored the mechanical attributes of chitin's polymorphs, elucidating their role as fundamental load-bearing elements in biological systems [
32]. The paper extensively utilized reactive force field MD simulations to explore tensile and shear deformations in chitin polymorphs, offering critical insights into their potential biological and material applications. Lastly, MD simulations have enabled a comprehensive understanding of the solubility and structural behaviors of α- and β-chitin and chitosan in aqueous environments [
33]. This research emphasized the significant role of molecular configurations in affecting these biopolymers' solubility and structural integrity, explicitly highlighting the more excellent stability of α-chitin compared to β-chitin in aqueous solutions.
The current study investigates the mechanical properties of α-chitin and α-chitin-chitosan, conducting MD simulations. The supercells of these nanostructures have been considered to be uniaxial tensile loadings in the x and y directions in an aqueous environment. MD results revealed directional mechanical performance, and the findings provide valuable insights into the distinct mechanical properties of α-chitin and its chitosan biocomposite, making a substantial contribution to optimizing these materials for specialized applications.
2. Materials and Methods
MD simulations in this work were conducted employing the large-scale atomic/molecular massively parallel simulator (LAMMPS) [
34]. The preliminary configurations comprised 37695 and 80752 atoms with simulation box dimensions of 160×86×34 Ǻ and 160×86×74 Ǻ for α-chitin and α-chitin-chitosan immersed in ionized water. The CHARMM36 force field parameters were utilized to simulate nanostructures regarded for their precision in modeling biopolymers [
35,
36,
37]. To ensure the system's stability, an equilibration phase was executed, stabilizing the system at a temperature of 300 K. The molecular interactions are governed by the Lennard-Jones (LJ) potential combined with modifications for CHARMM force fields, which signifies that both van der Waals (LJ) and long-range Columbic interactions are considered. The cut-off distances for these interactions are explicitly set at 10 and 12 units, respectively. The Ewald sum for Columbic interactions is efficiently treated using the Particle-Particle Particle-Mesh (PPPM) algorithm, with an accuracy of 1×10
-6 [
38]. This method ensures accurate calculations of the long-range Columbic forces. Specific fine-tuning for force calculations in real and k-space is achieved, refining the accuracy and reliability of the results for chitin behavior under subsequent tensile loads. The energy minimization process was conducted using the conjugate gradient (CG) method. The specified convergence criteria, 1×10
-4 for energy and 1×10
-6 for force, paired with the defined iterations and evaluation frequency, confirm that the system reaches minimized-potential energy configuration. This step eliminates potential high-energy configurations and steric clashes, which might lead to fallacious interpretations if overlooked. Post-minimization, a notable reduction in the system's total energy was observed, confirming the procedure's efficacy. Once the system was fully relaxed, the mechanical properties of α-chitin and α-chitin-chitosan in ionized water were estimated by applying the uniaxial tension loading. Periodic boundary conditions (PBCs) were applied in all three directions, so the simulated systems represent nanosheets. Uniaxial tensile loading is applied in the x and y directions, and the size of the simulation box along the loading direction was increased by a constant engineering strain rate of 0.002. We used a time step of 0.005 fs, which is small enough to simulate the mechanical properties when conducting the MD simulations. The stress tensors were computed based on the Virial theorem [
39]. The atomistic models were visualized using the OVITO package [
40].
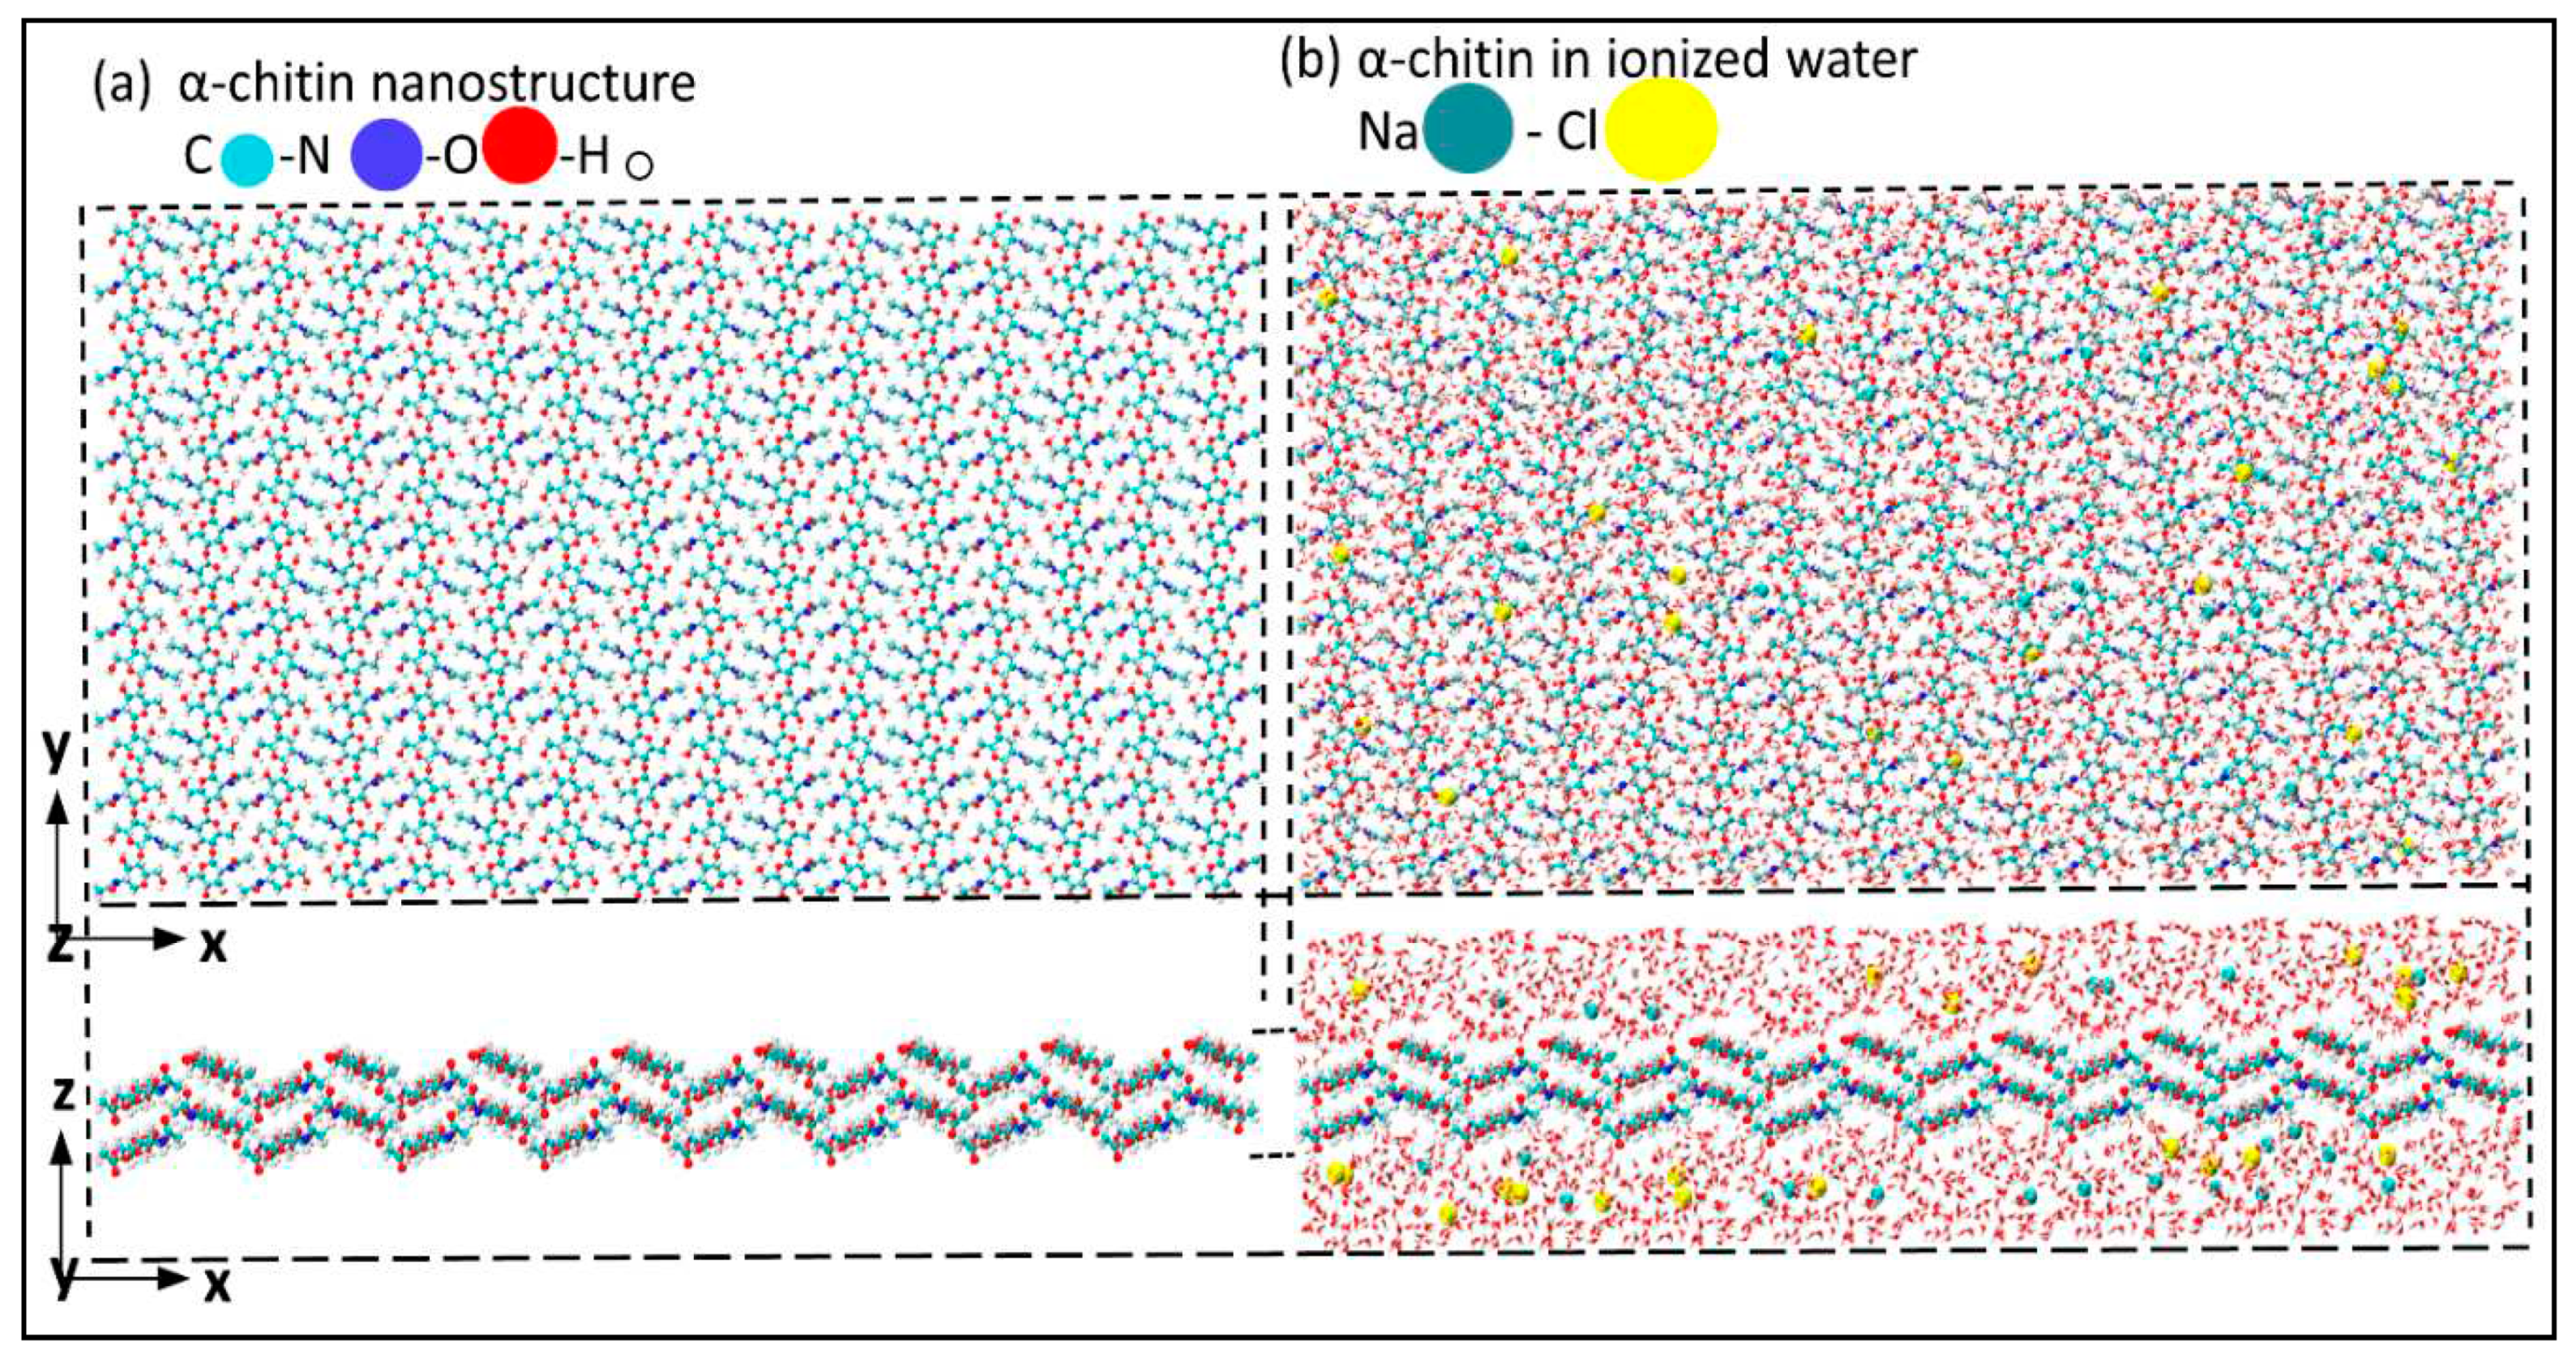
Figure 1a shows the atomic structure of the α-chitin nanostructure, and Figure1b illustrates α-chitin immersed in ionized water at room temperatures. The crystalline α-chitin [
41] with unit cell parameters of a = 4.750, b = 1.889, c = 1.033 nanometer with α = 90, β = 90, and γ = 90 are used to form a 8×8×2 supercell atomic structure along x-, y-, and z-axis, respectively.
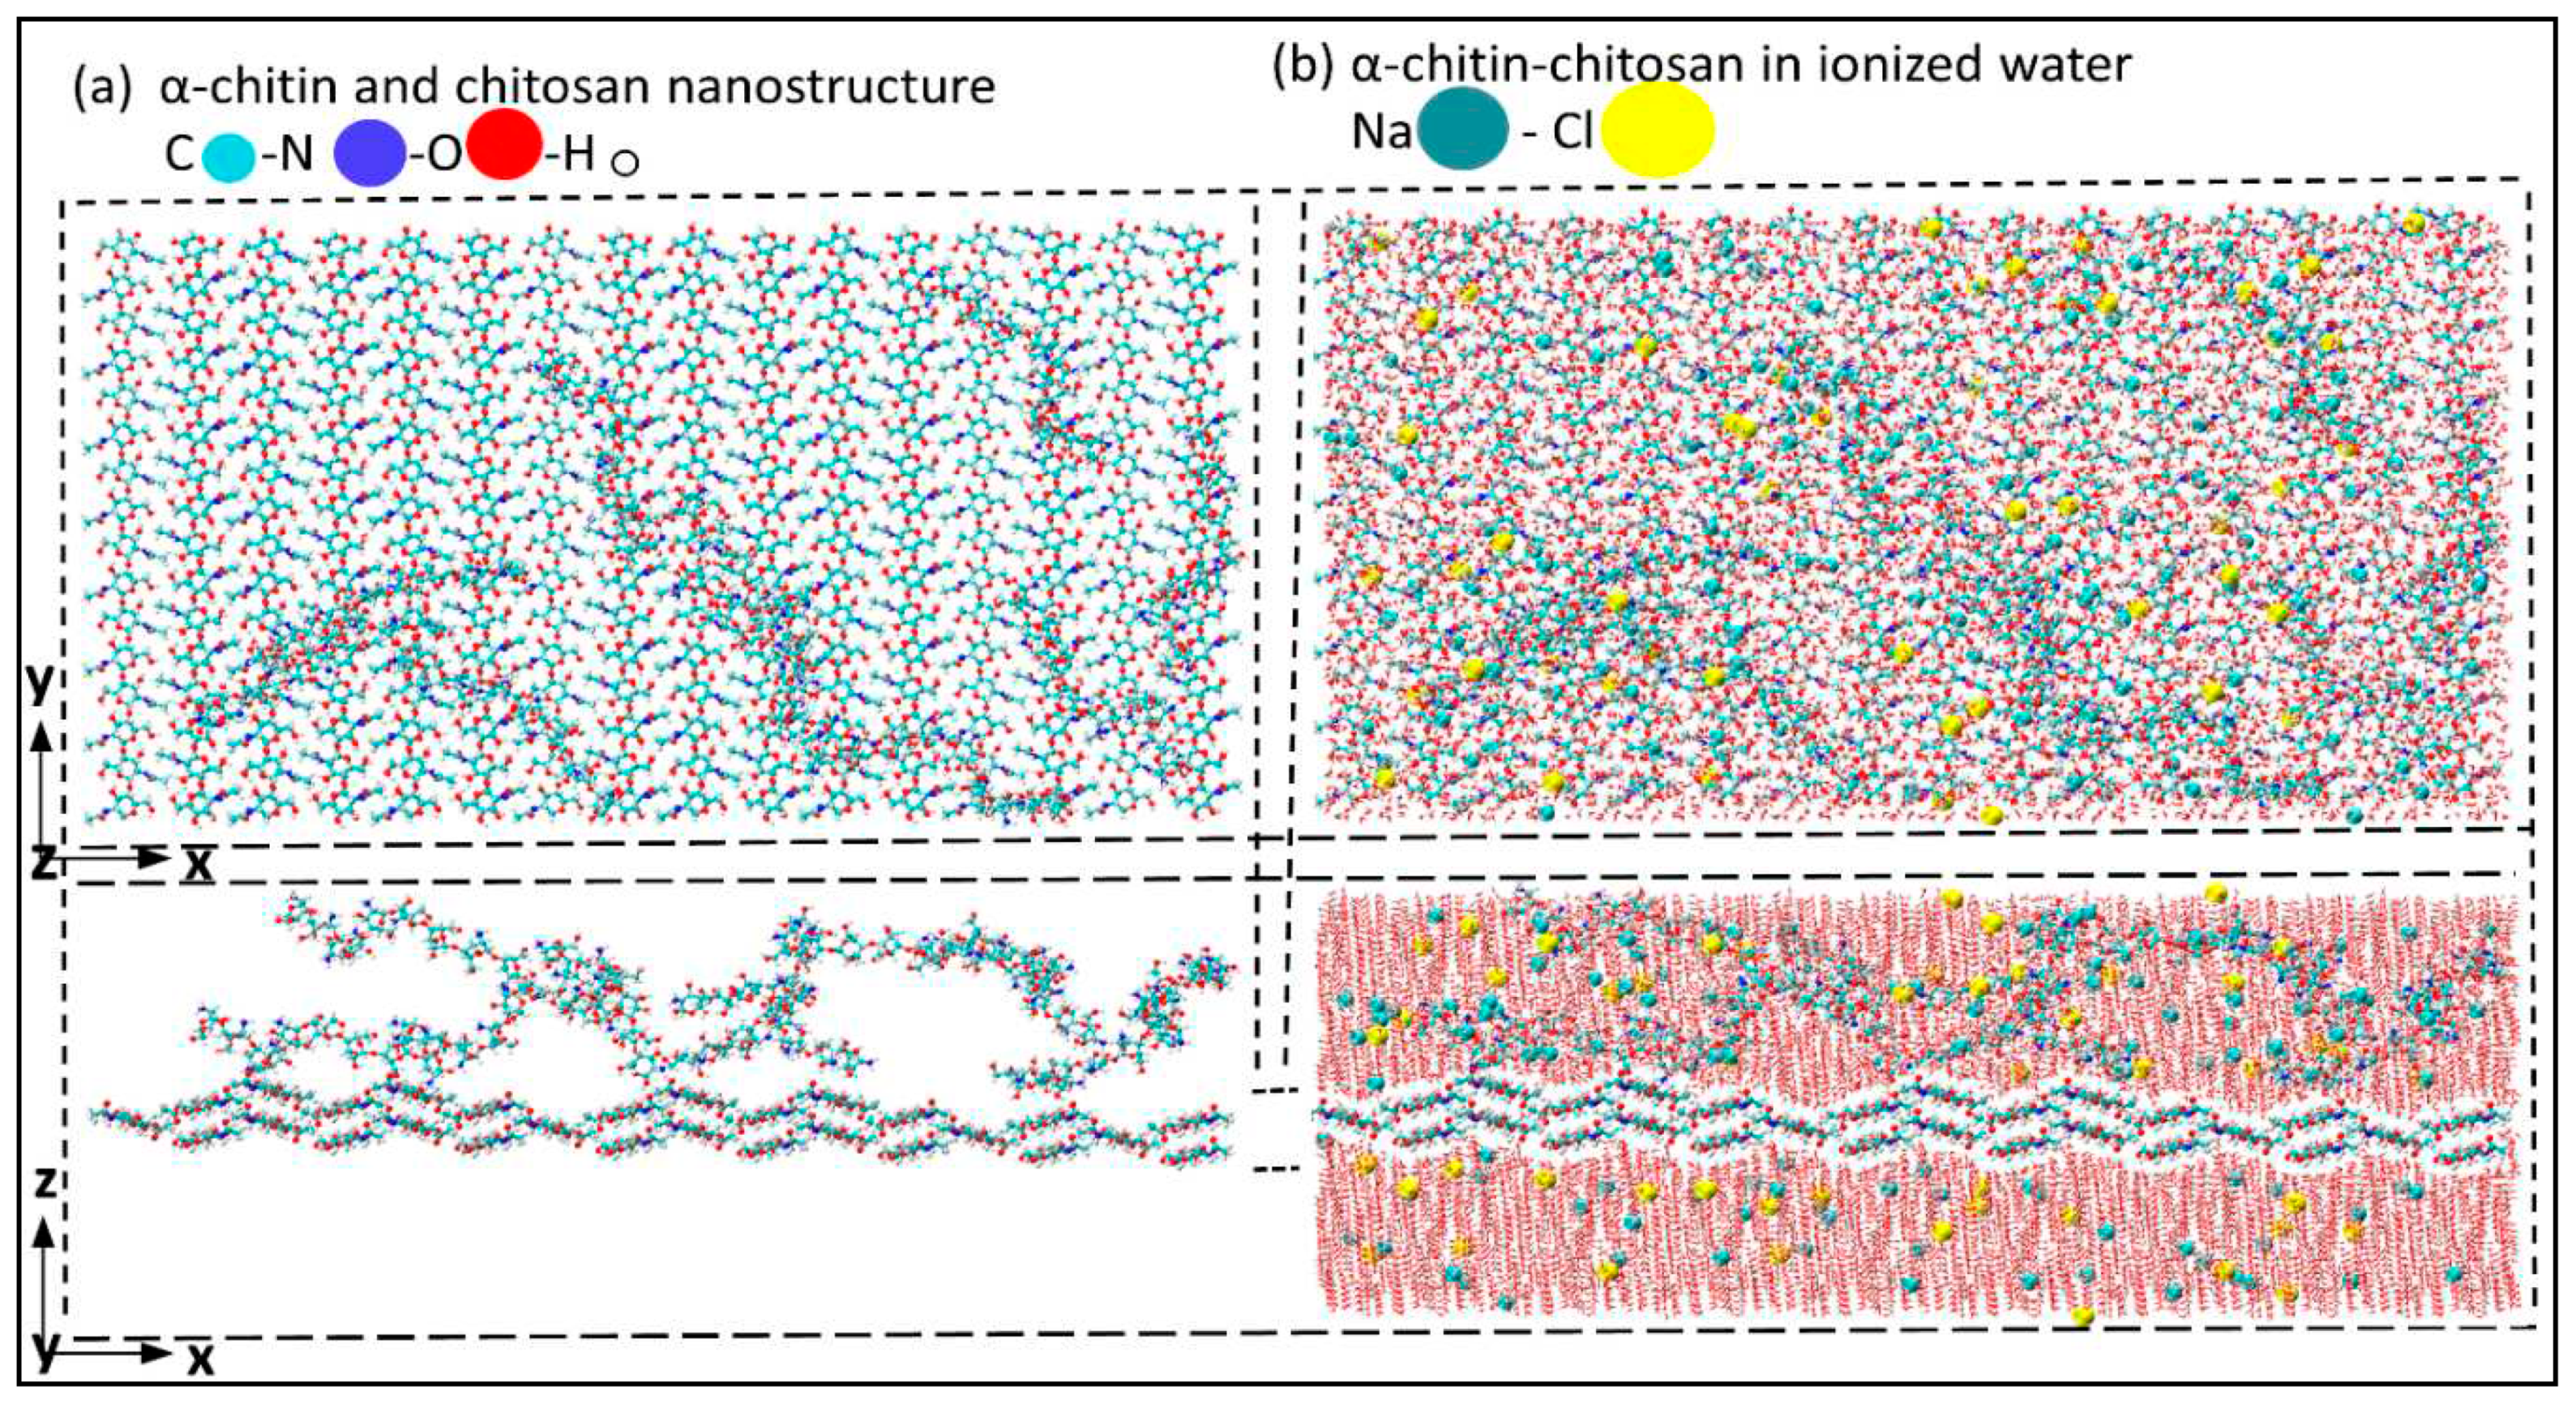
Figure 2a and b represent α-chitin-chitosan nanostructure adding randomly distributed chitosan in the x-y plane along the z-axis with and without ionized water, respectively. The mechanical performance of these nanostructures was investigated under uniaxial tensile loading in perpendicular (x-axis) and parallel directions (y-axis) to the crystalline chain in aqueous environment.
3. Results and Discussion
The mechanical responses of α-chitin and α-chitin-chitosan biocomposite under tensile loading conditions were studied in an aqueous environment. The supercells of these biomaterials were subjected to uniaxial tension.
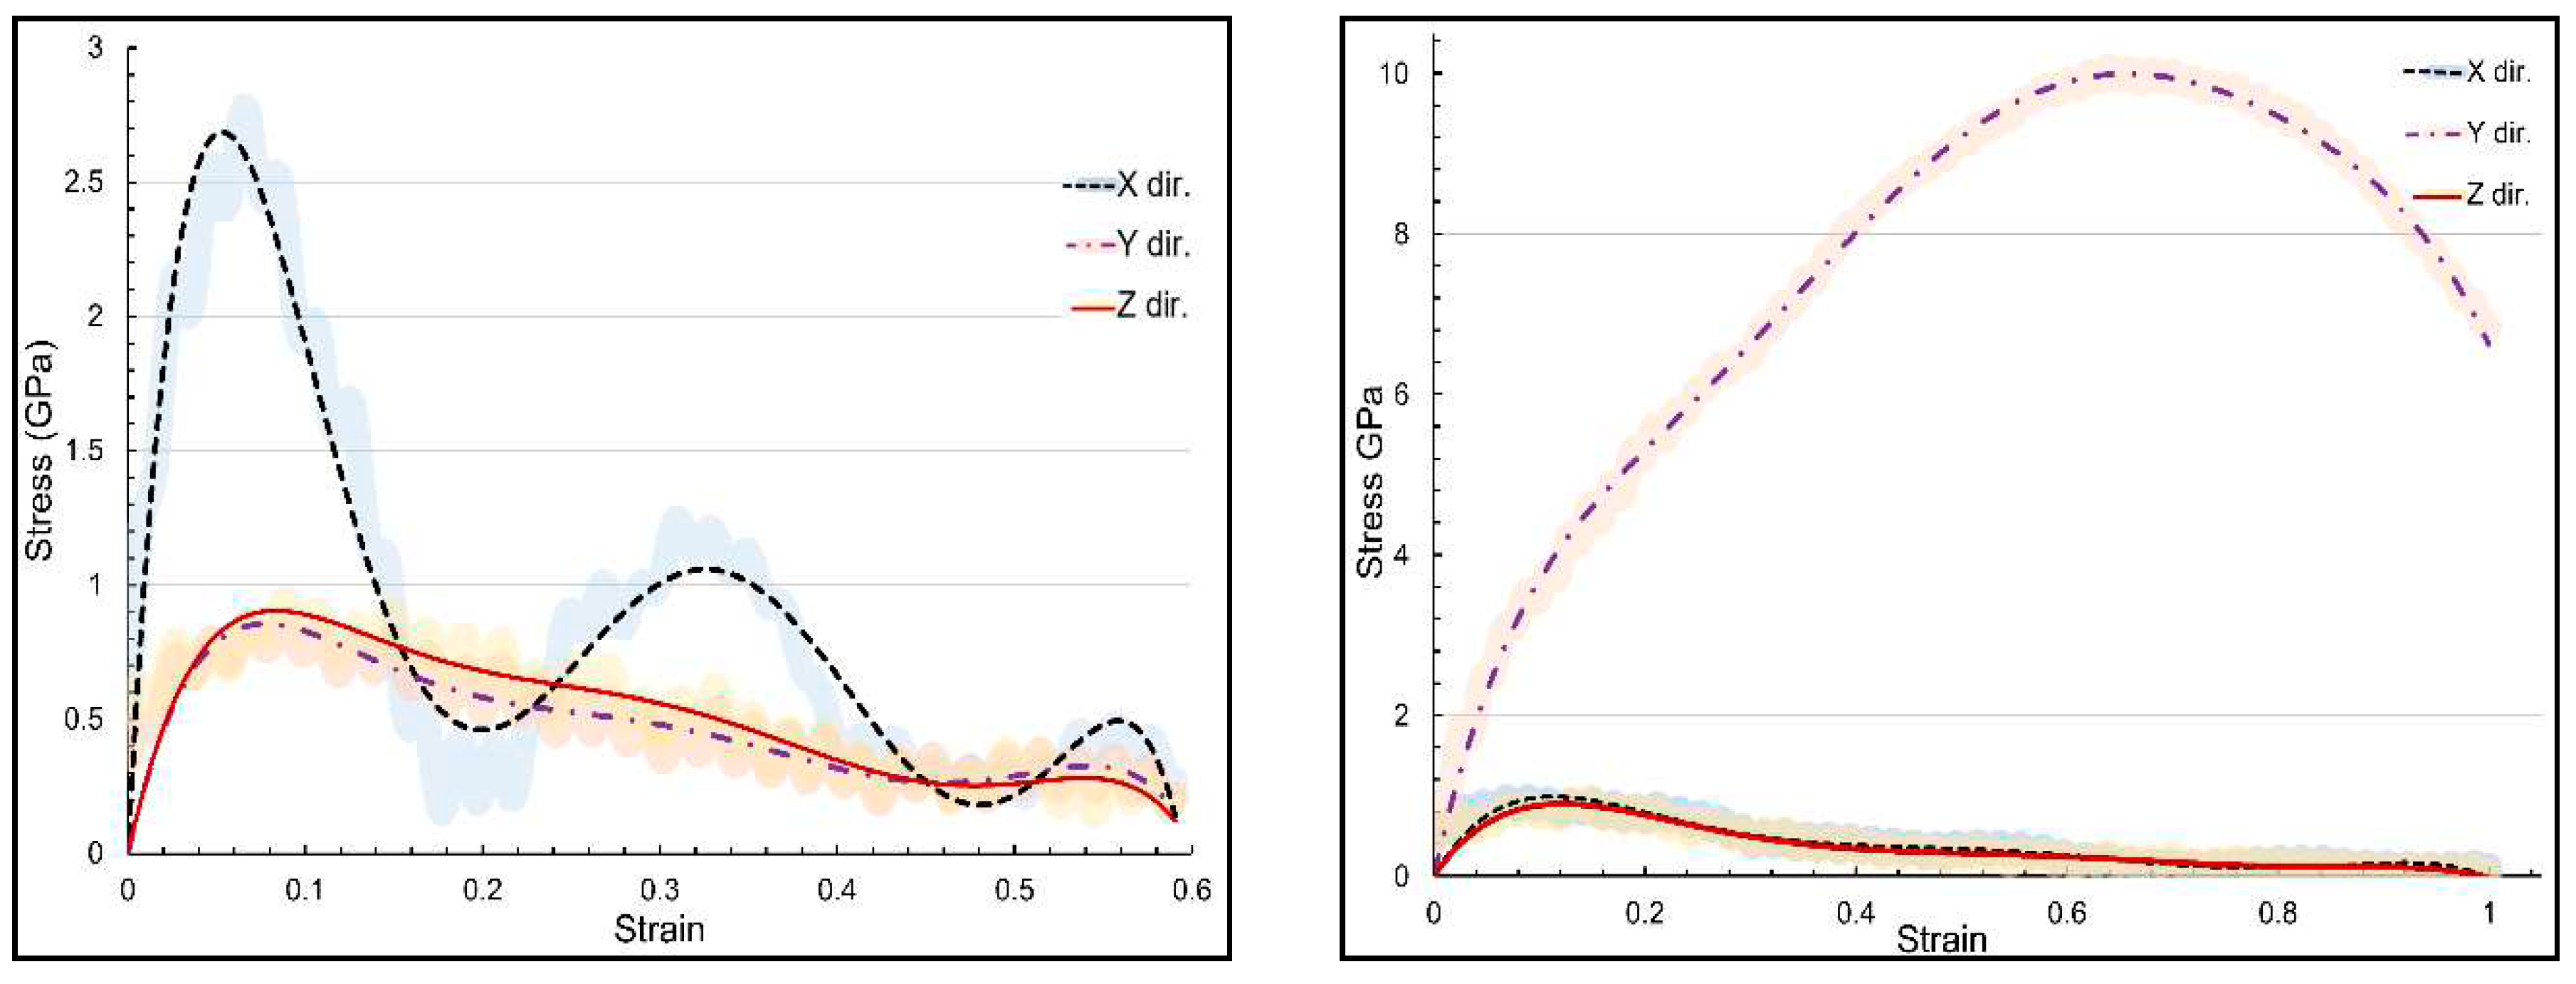
Figure 3 presents the stress-strain curvature for α-chitin under loading in three directions. In the crystalline chain direction (y-axis), α-chitin exhibits a remarkable UTS of 10.07 GPa at a strain rate of 0.636. In contrast, the UTS in the perpendicular direction (x-axis) is significantly lower, at 2.78 GPa with a strain rate of 0.066. The anisotropic nature of α-chitin is evident from the stress-strain curves. This anisotropy is likely due to the molecular orientation of the chitin nanofibrils and their interaction with the surrounding matrix. Understanding the anisotropic mechanical behavior of α-chitin is crucial for advancing both materials science and bioengineering, as this biopolymer holds significant implications in these fields.
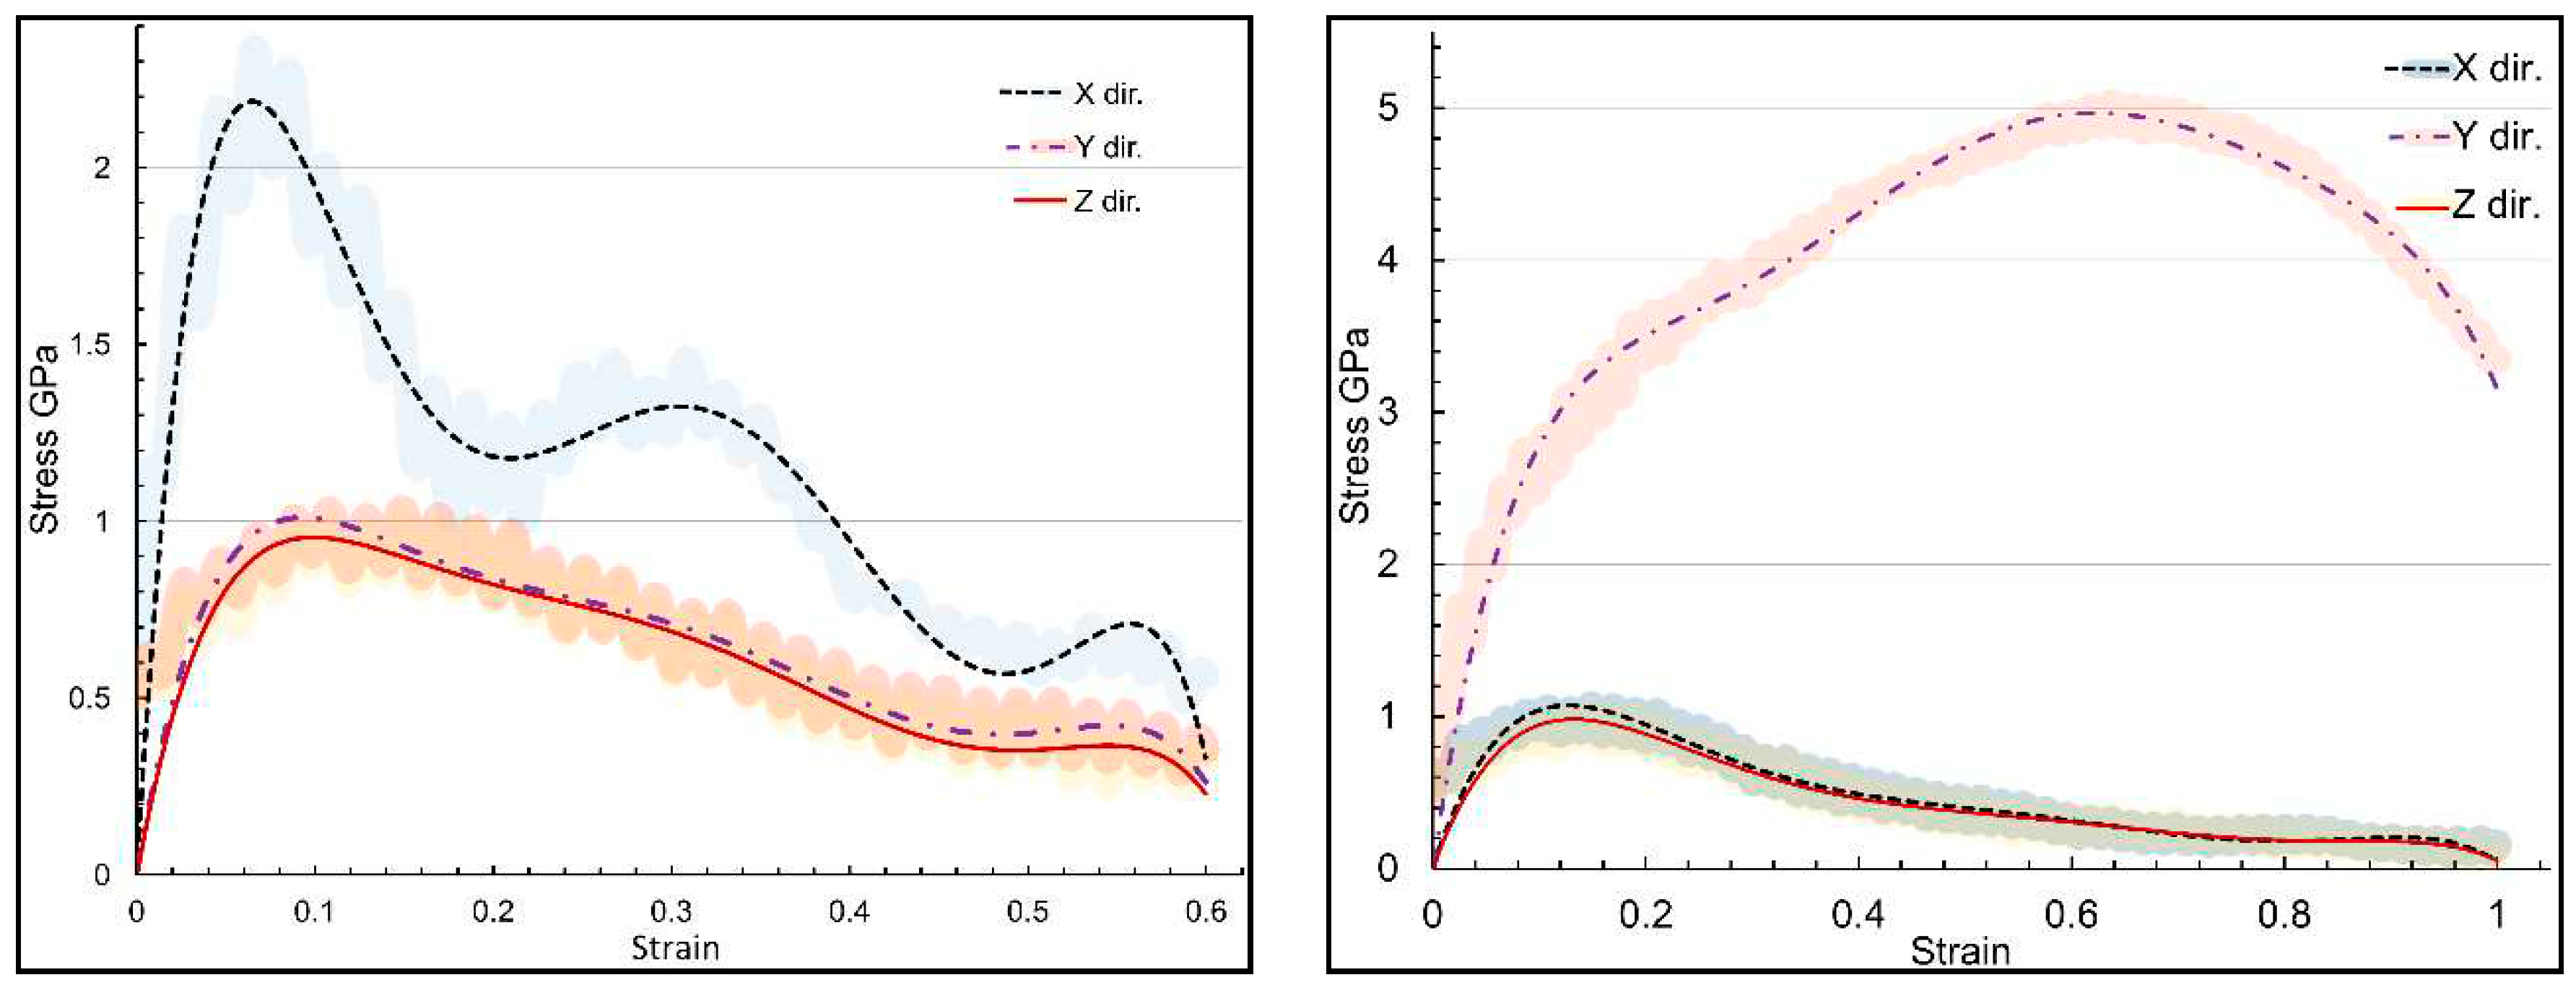
Figure 4 illustrates the stress-strain response for the α-chitin-chitosan biocomposite under uniaxial tensile loading in the same directions as for pure α-chitin. The biocomposite exhibits anisotropic mechanical properties similar to pure α-chitin but with notable differences. Understanding the mechanical behavior in the presence of chitosan affords opportunities for the optimization of these materials for specialized applications. For instance, the high tensile strength of α-chitin in the y-direction makes it a suitable candidate for load-bearing applications, and the remarkable flexibility of both in y-direction could be advantageous for biomedical applications like tissue scaffolding. The high flexibility could be particularly beneficial for applications requiring adaptability and resilience. α-chitin-chitosan biocomposite’s UTS in the x- and y-directions are 2.34 and 5.03 GPa, respectively. Notably, UTS in both x and y directions exhibited a remarkable reduction compared to the pure α-chitin, as shown in
Figure 3. The inclusion of chitosan compromise the mechanical integrity of the composite, due to its disordered molecular arrangement or its interaction with α-chitin [
18]. The molecular interactions between α-chitin and chitosan influence the mechanical properties of the biocomposite. The hydrogen bonding between the chitin nanofibrils and the surrounding matrix contributes to the material’s strength and stiffness. The presence of chitosan introduces additional hydrogen bonding and van der Waals interactions, which are responsible for the observed mechanical behavior. [
42,
43,
44]. Advanced spectroscopic techniques like Fourier-transform infrared spectroscopy (FTIR) and X-ray photoelectron spectroscopy (XPS) could provide further insights into these interactions.
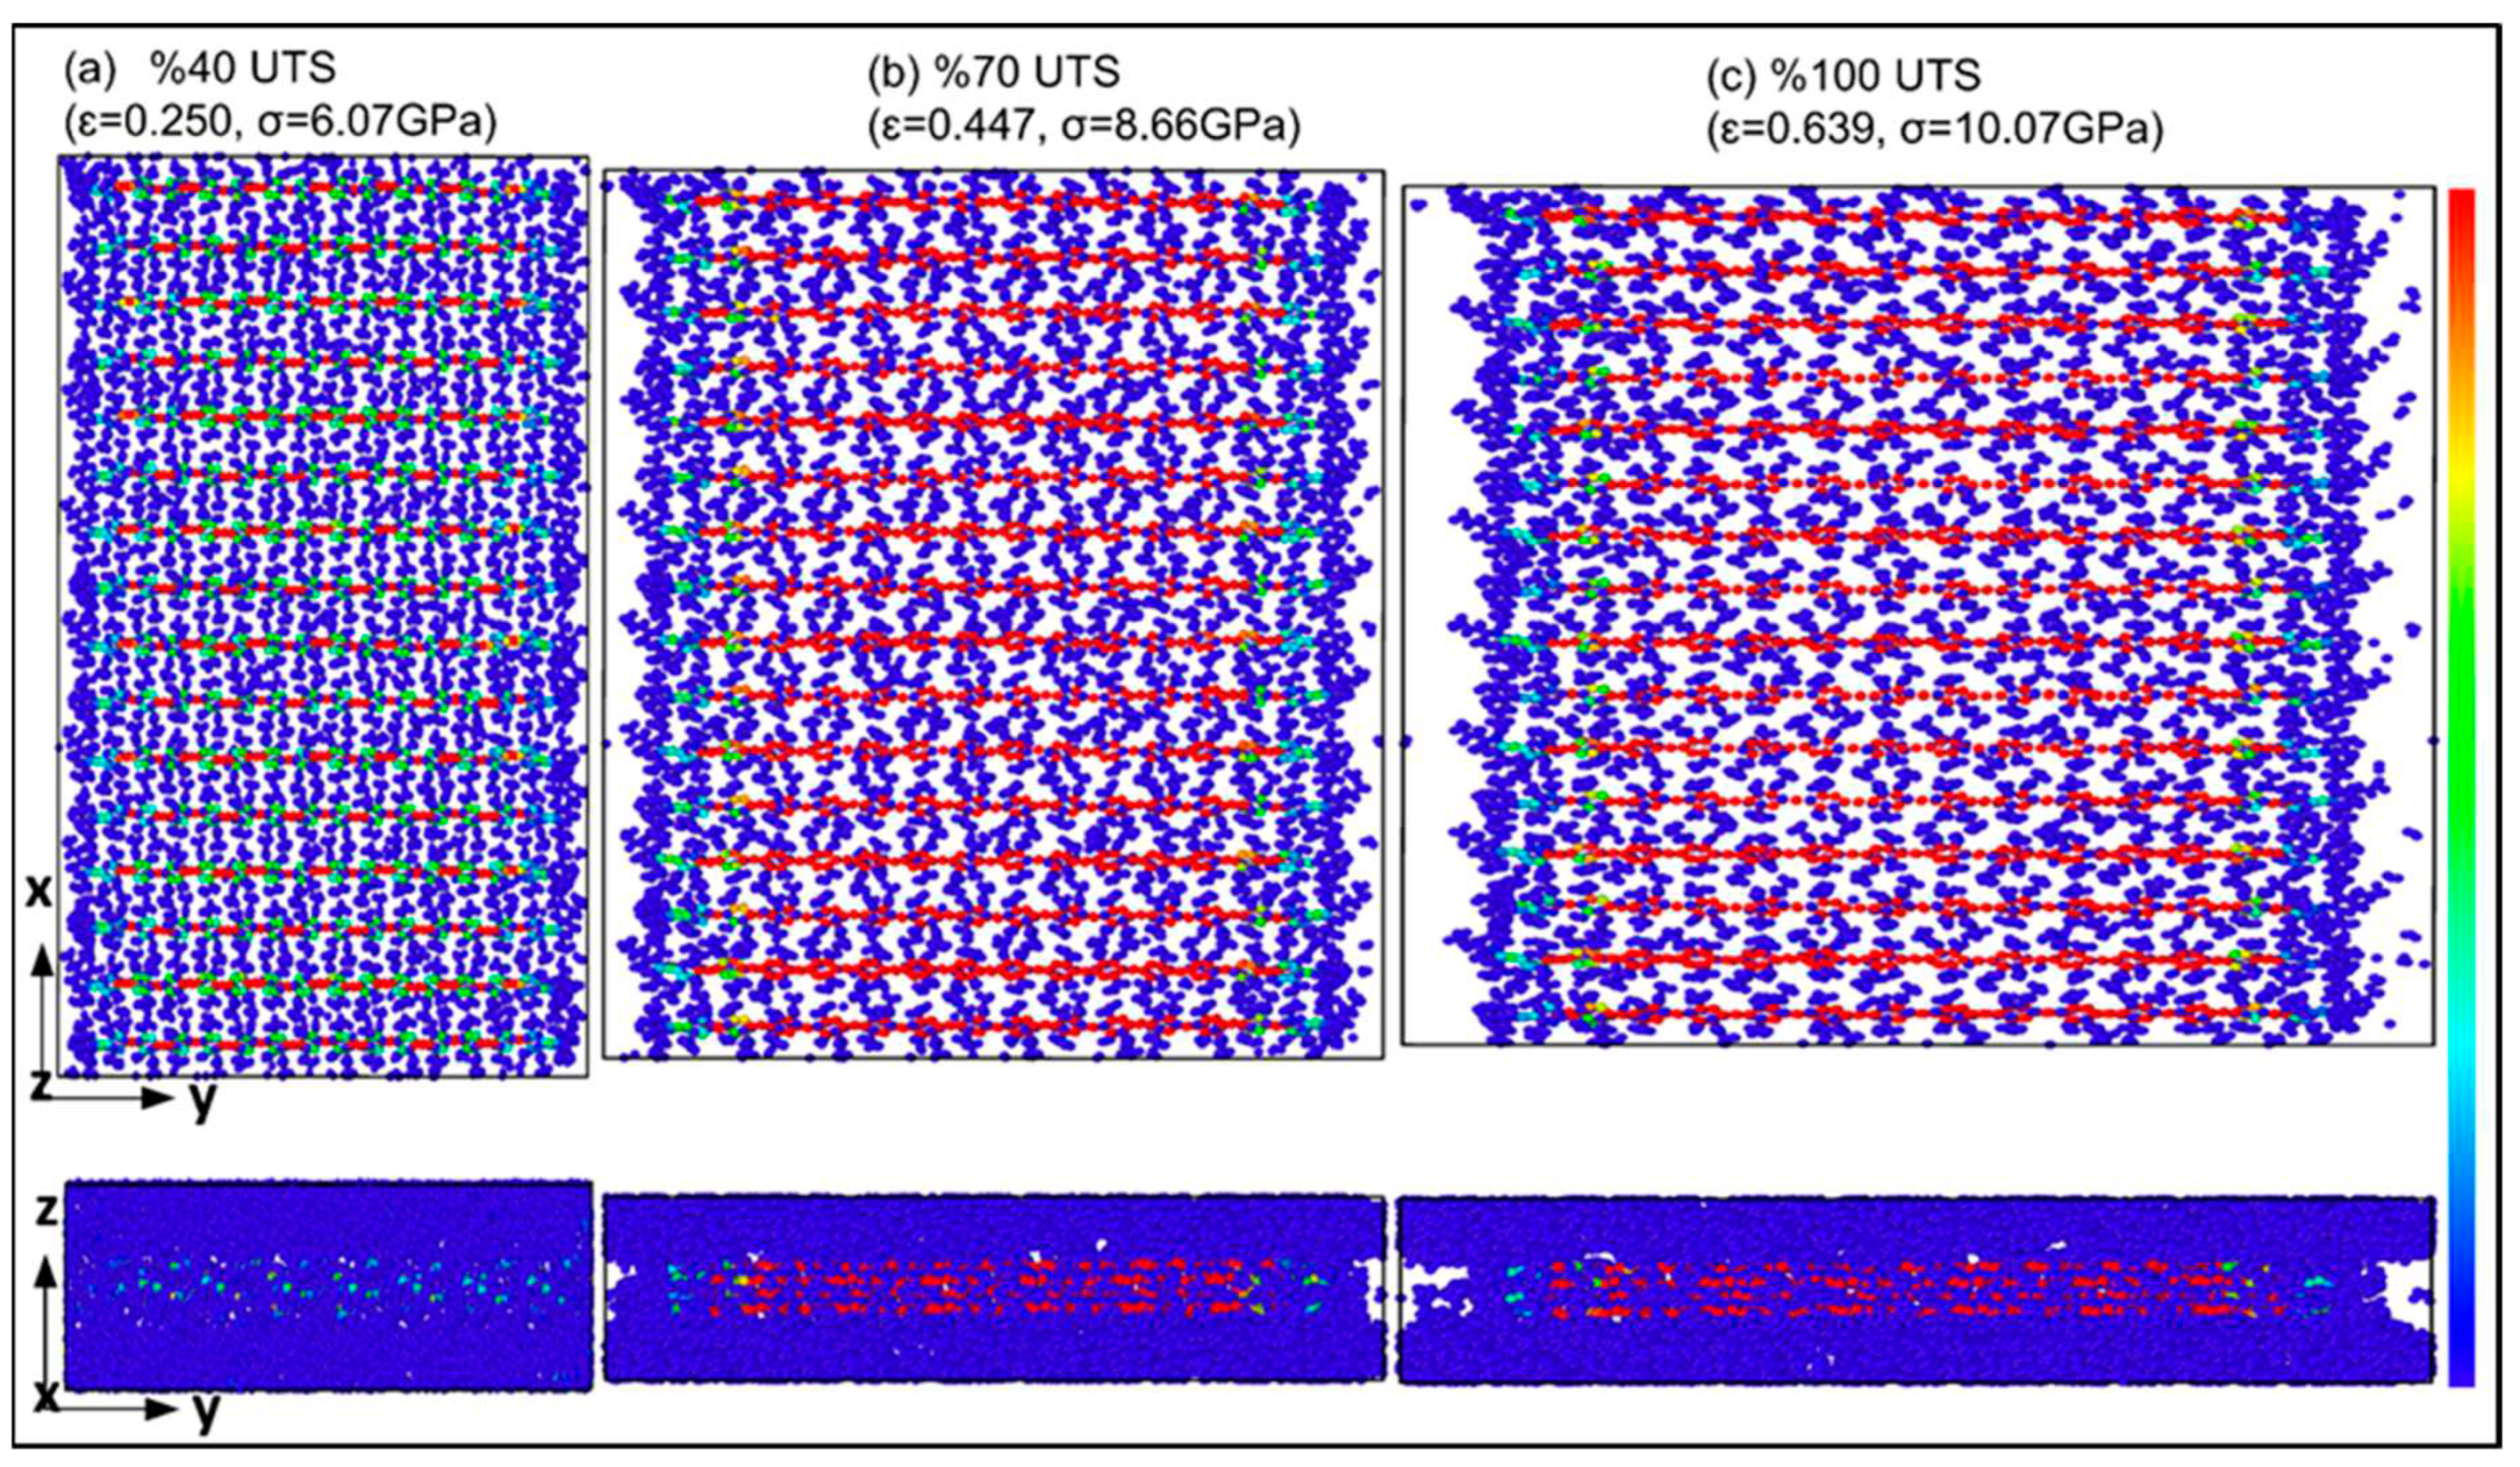
Figure 5 provides an in-depth look at the stress distribution of α-chitin in ionized water under tensile loading parallel to the crystalline chain direction (y-axis). It reveals the stress distribution varies significantly at different strain values, which is crucial for understanding the mechanical behavior and structural stability of α-chitin in aqueous environments to reach UTS value.
Figure 6 complements
Figure 5 by examining the stress distribution of α-chitin in ionized water under tensile loading perpendicular to the crystalline chain direction (x-axis). Similar to
Figure 5, the stress distribution varies at different strain values, offering valuable insights into the directional stress bearing performance in atomic range.
The stress distribution patterns in
Figure 5 and
Figure 6 suggest that the mechanical properties of α-chitin are not only dependent on the orientation of the crystalline chains but also significantly influenced by the aqueous environment. This could be attributed to the hydrogen bonding interactions between water molecules and chitin nanofibrils [
45,
46]. The presence of ionized water introduces additional complexity to the mechanical behavior of α-chitin. Ionized water could potentially alter the hydrogen bonding network, thereby affecting the mechanical properties specially in x-direction where the chitin nanofibrils bonded via hydrogen bonds [
47]. The findings highlight the complex interplay between the anisotropic mechanical behavior of α-chitin and the aqueous environment, offering valuable insights for the optimization of α-chitin-based materials in various applications. Understanding the stress distribution of α-chitin in ionized water is particularly important for biomedical applications where the material is often in contact with biological fluids. The anisotropic behavior and the influence of ionized water could be critical factors in designing α-chitin-based materials for applications like tissue engineering and drug delivery systems.
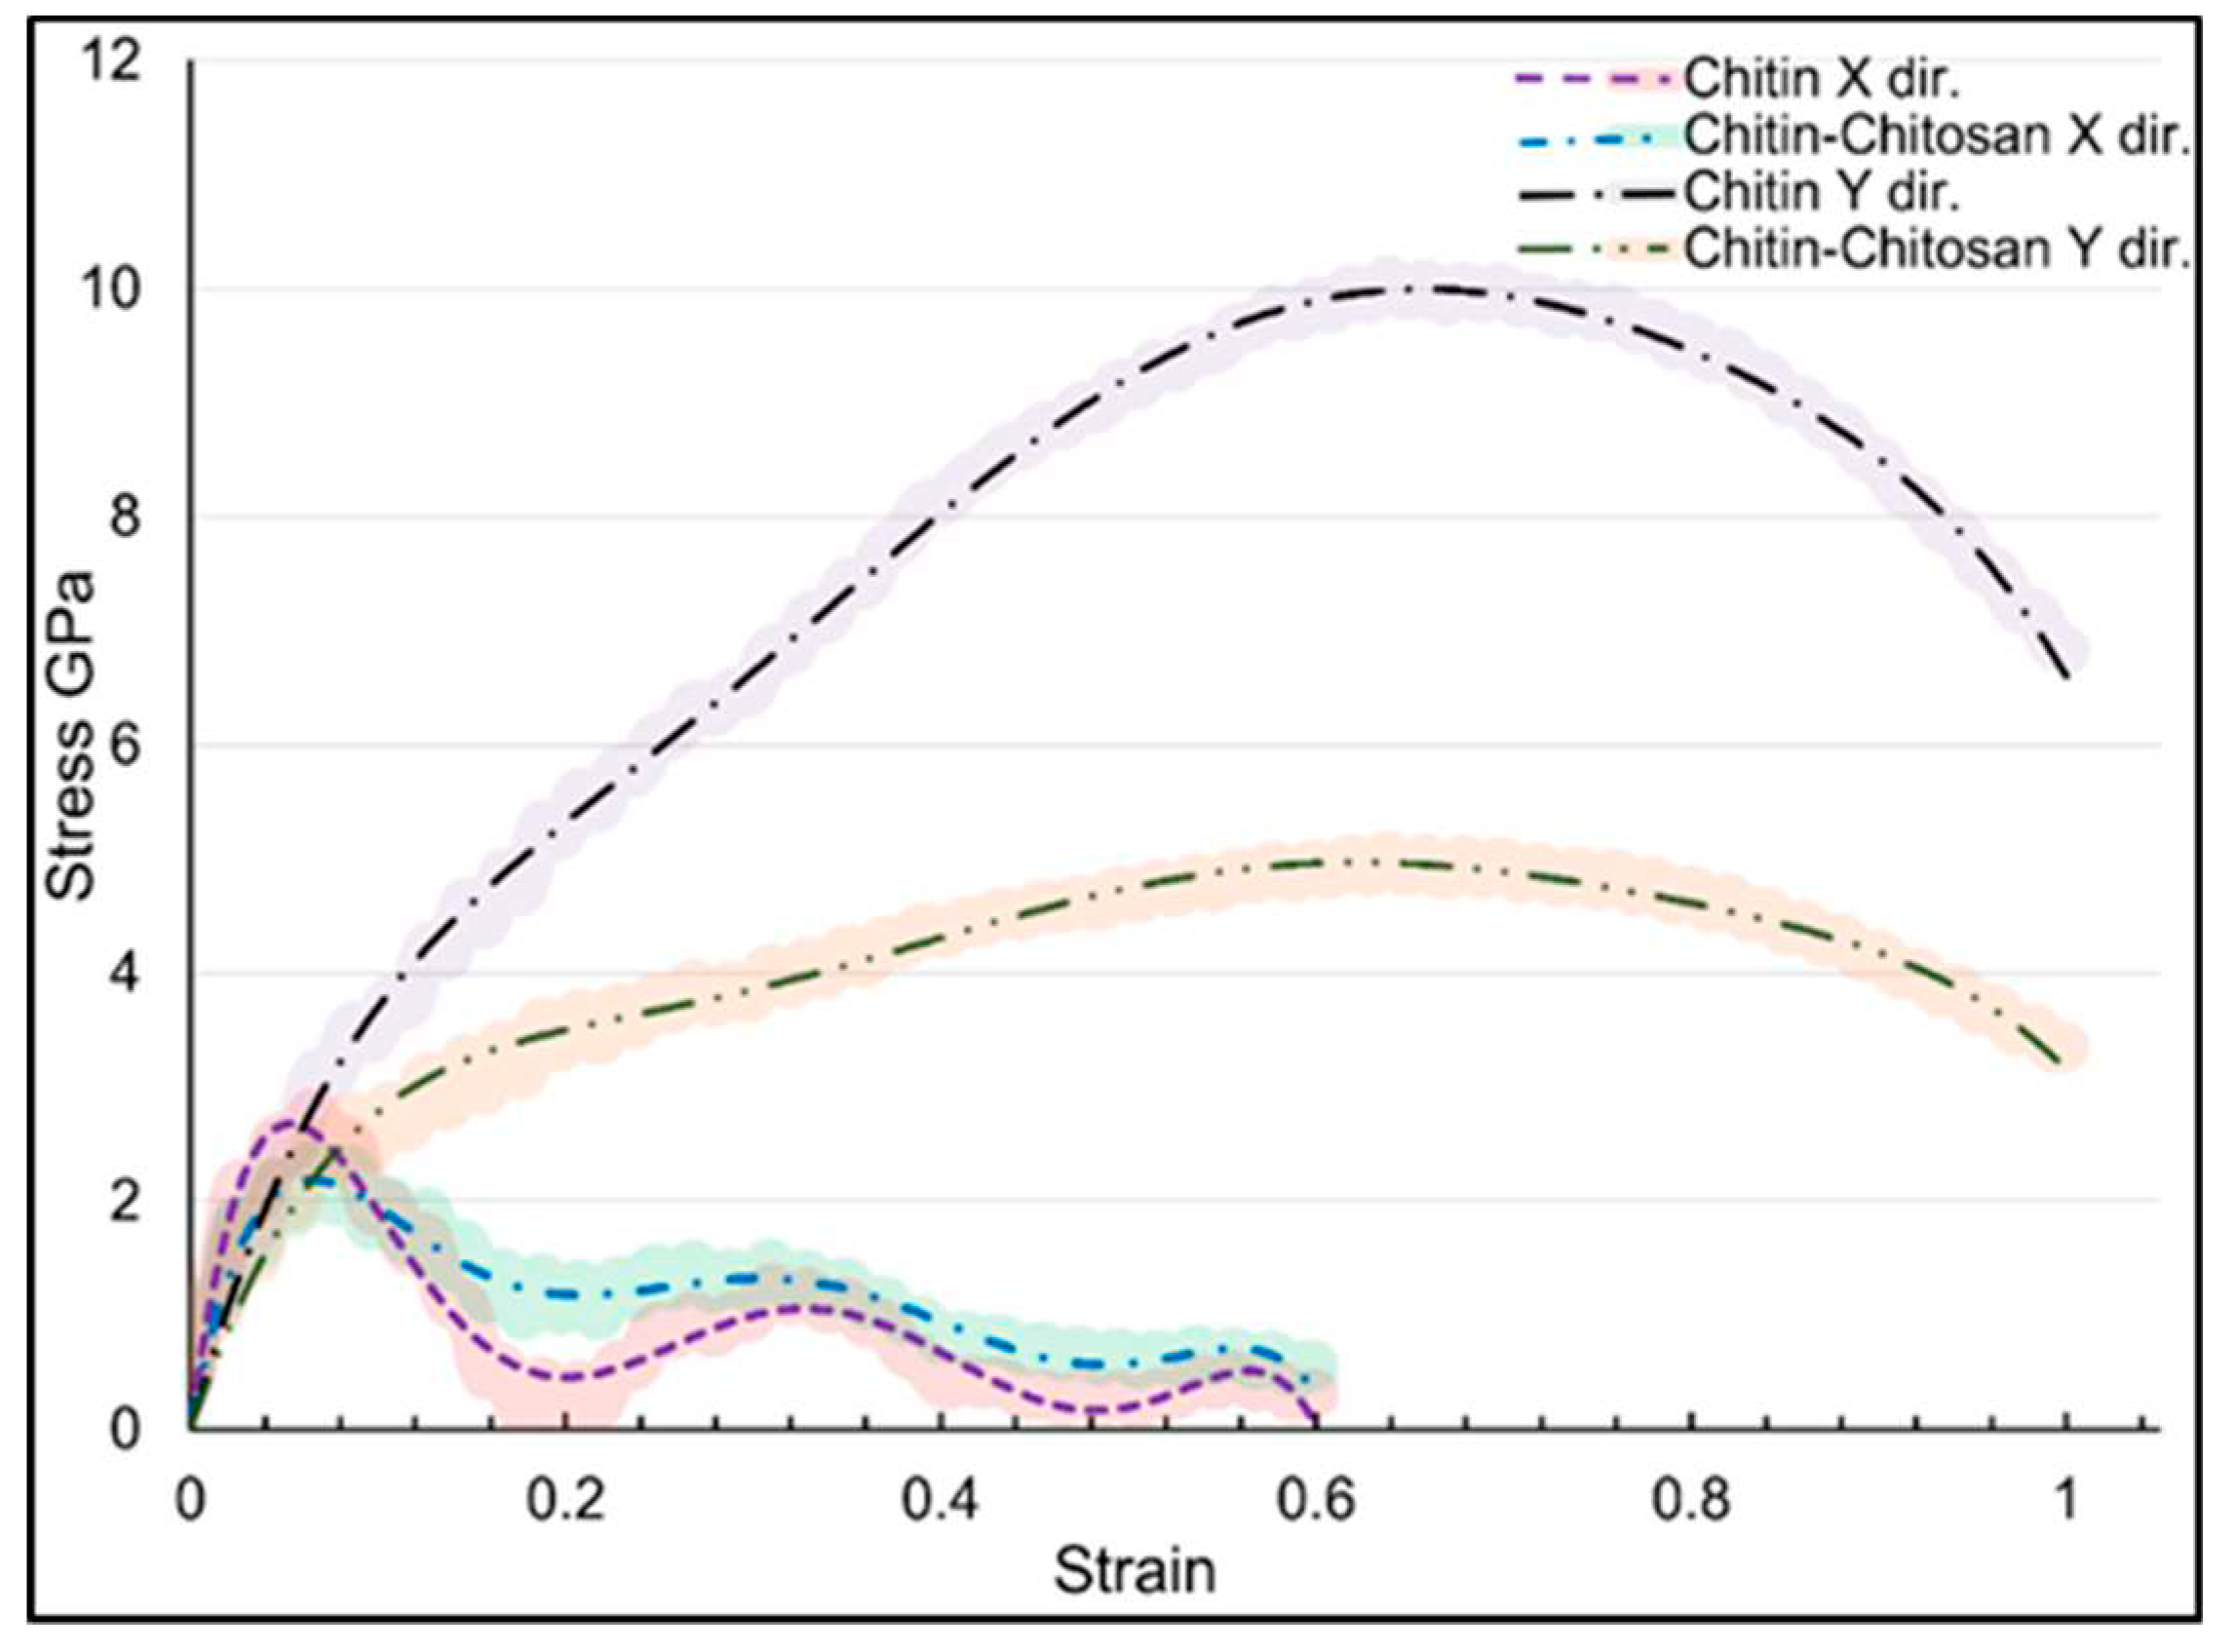
The stress-strain curves in
Figure 7 revealed distinct mechanical behaviors for α-chitin and its chitosan biocomposite. While α-chitin shows a steeper gradient in elastic region, indicating higher stiffness and UTS, the biocomposite curve is less steep, suggesting reduced stiffness but increased ductility. This is consistent with the inherent properties of chitosan, which is known to impart flexibility and toughness when combined with α-chitin [
48]. The biocomposite shows a more ductile behavior, which could be attributed to the plasticizing effect of chitosan. This is particularly important for applications requiring a balance between stiffness and flexibility as in biomedical implants. The overall mechanical properties are fundamentally governed by their molecular structure and interactions. In α-chitin, the high degree of crystallinity contributes to its high stiffness and strength in y direction. In contrast, the introduction of chitosan disrupts this crystalline structure to some extent, leading to a more ductile material. The distinct mechanical behaviors of α-chitin and its chitosan biocomposite open up a range of possibilities for material design and setting the stage for their optimized use in a broad spectrum of technological applications.
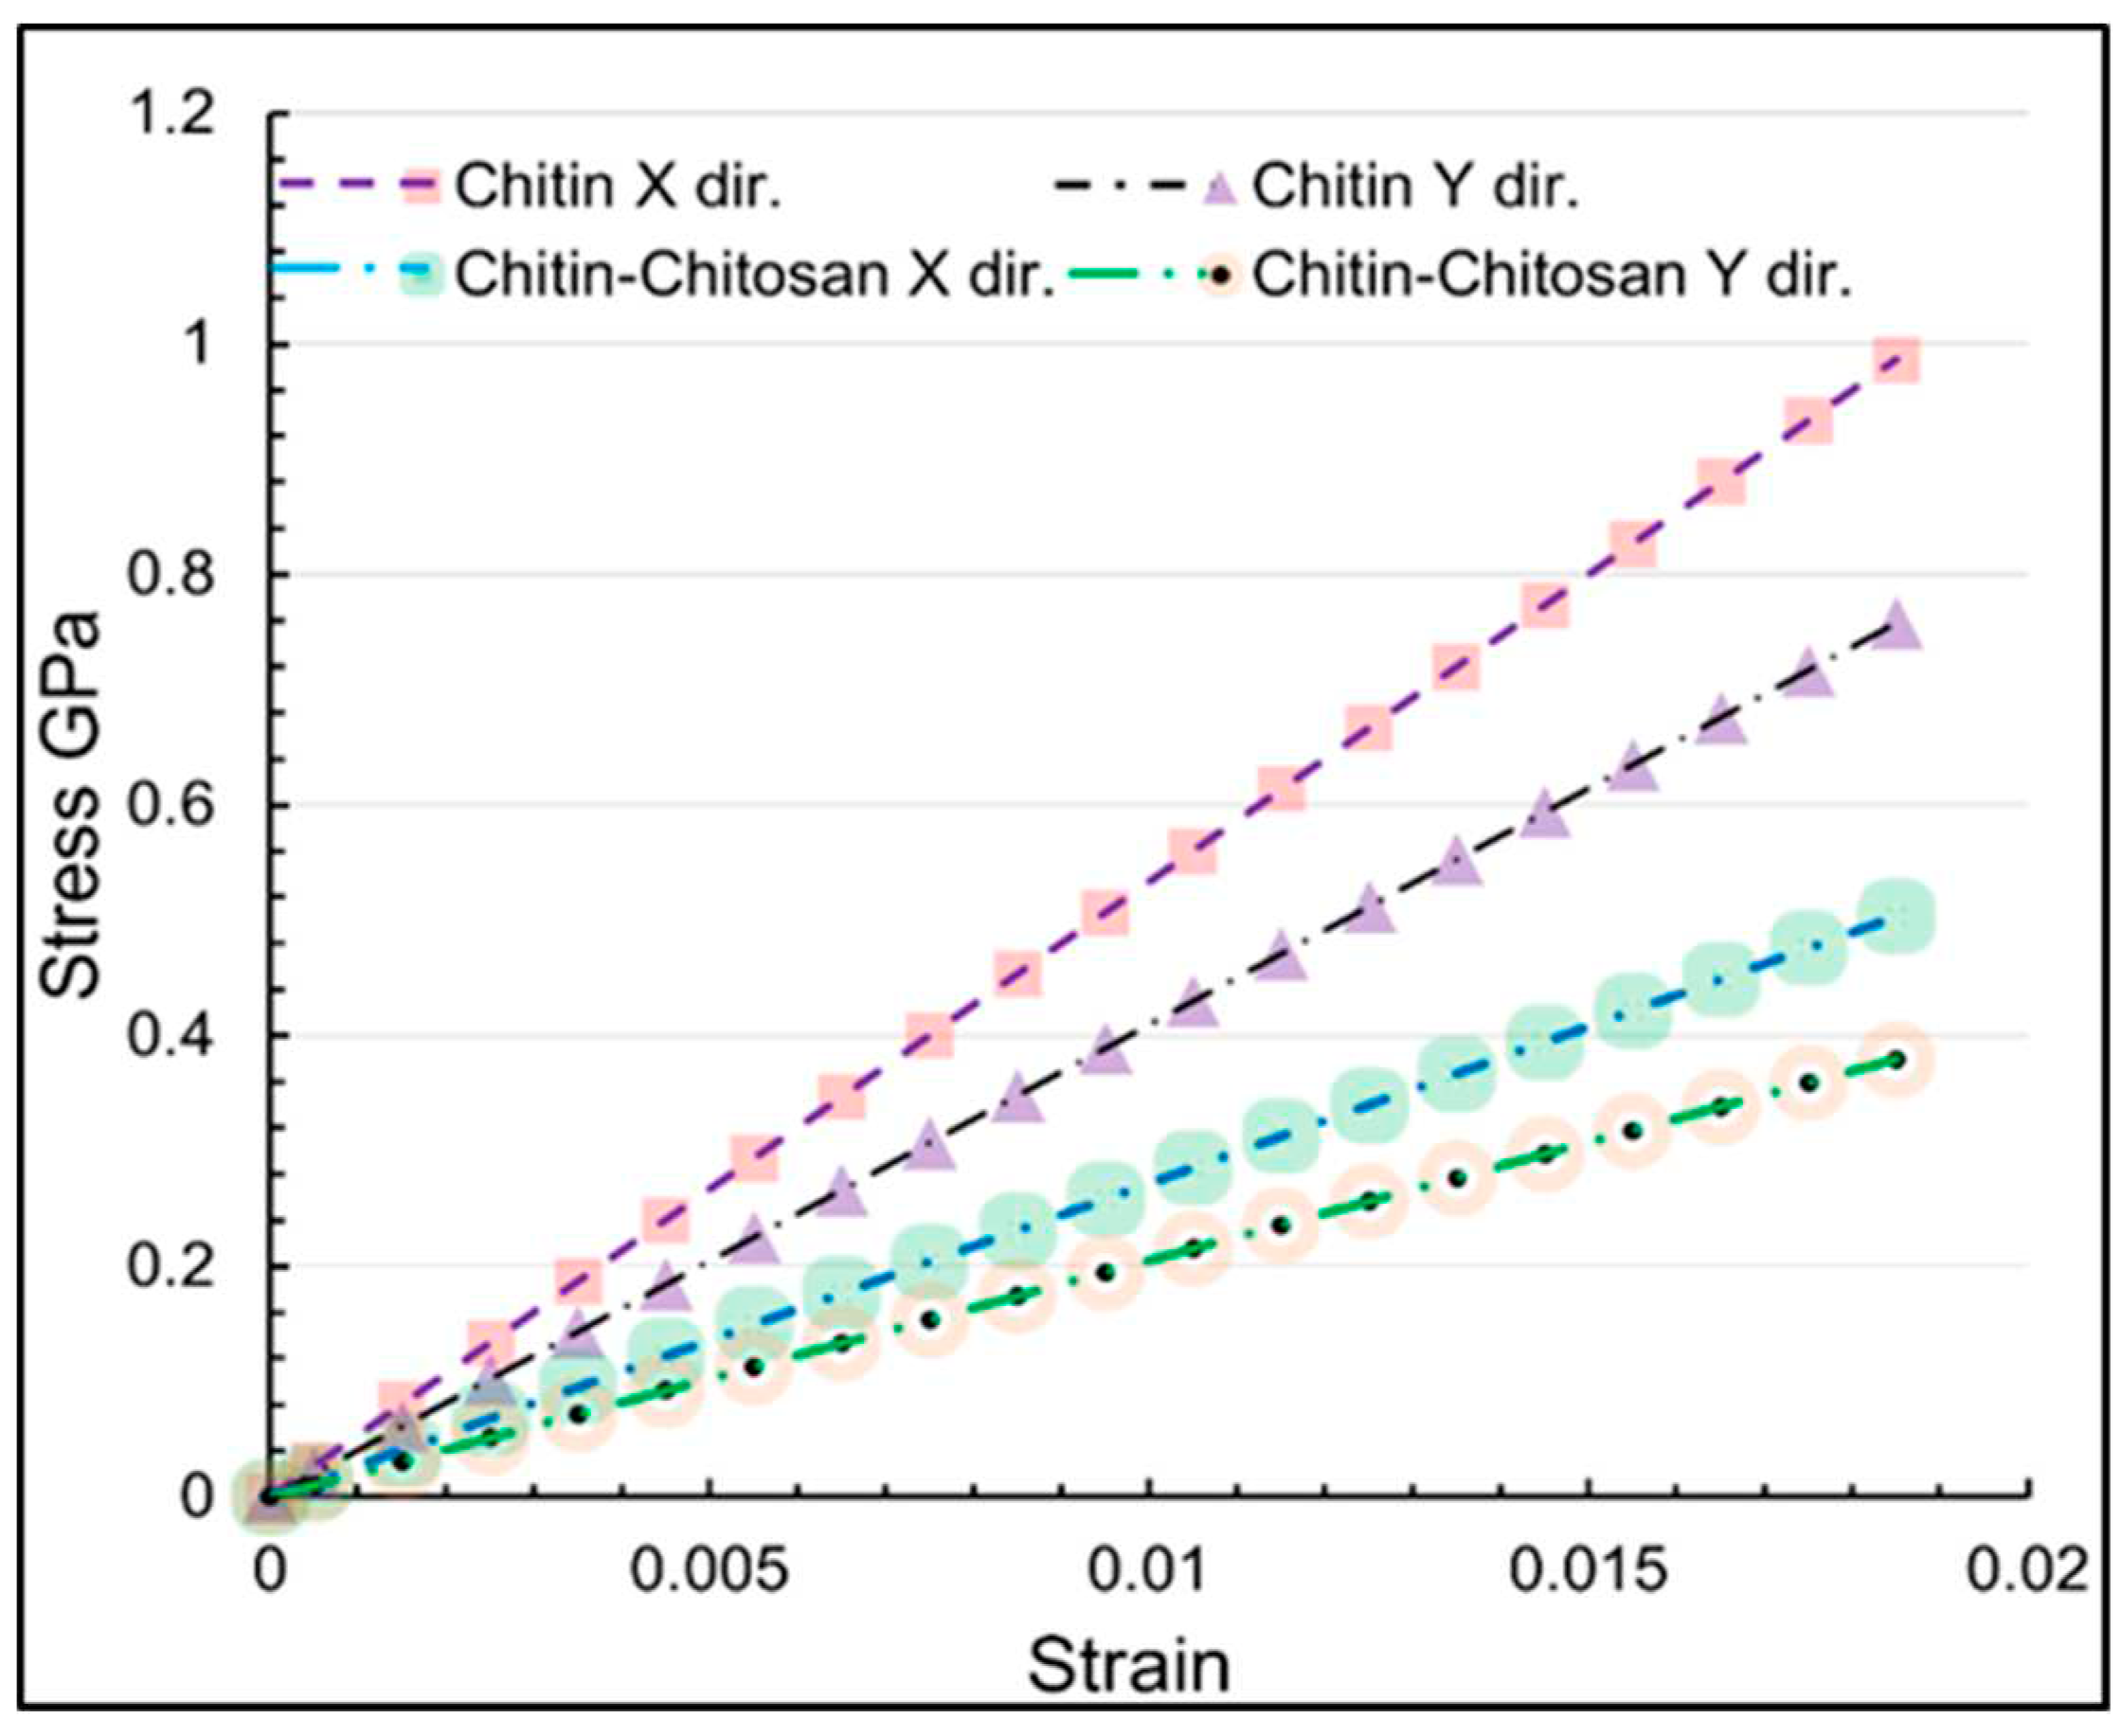
Figure 8 and
Table 1 collectively offer elastic region behaviour for α-chitin and its chitosan biocomposite and stress-strain response gradient at engineering strain rate of 0.02. These data are crucial for understanding the initial linear elastic behavior of the materials and offers a quantitative measure that can be directly compared with experimental results. The MD predictions not only validate the experimental findings [
49] but also offer a pathway for the rational design of these materials for specific applications. The elastic range data at a strain rate of 0.02 provides a critical quantitative measure that can be used for material selection in various engineering applications [
50].
The gradient values in elastic region offer an interesting perspective on the stiffness of these structures. For α-chitin, the gradient along the x-axis is noticeably higher value of 53.31 compared to the y-axis value of 40.95. This suggests that α-chitin exhibits greater stiffness when strained along the x-axis in the elastic region. On the other hand, the α-chitin-chitosan biocomposite shows lower gradient values for both axes, 27.19 and 20.50 for the x and y axes respectively, indicating a softer material characteristic in comparison to pure α-chitin. These gradient values effectively quantify the effect of chitosan on the mechanical properties and validate the complex stress-strain behaviors observed in previous figures. Based on the results, in addition to α-chitin anisotropic behavior, it also exhibits orthotropic characteristics [
51]. This specialized form of anisotropy is characterized by unique, mutually perpendicular principal material axes along which the mechanical properties are independent [
52]. This orthotropic nature is inherent to its hierarchical molecular arrangement and lends itself to the complex biological functions it performs. The identification of α-chitin as an orthotropic material confirms its anisotropic nature and provides a more detailed understanding of its mechanical behavior, thereby allowing for more precise computational modeling and material optimization. In order to evaluate the elastic properties of nanostructures, we employed Hooke’s law by applying the unidirectional straining. Hence, the strain stays zero perpendicular to the loading direction, i.e. ε
t = 0 (uniaxial strain condition). Hooke's Law for a plate with orthotropic elastic properties can be written as [
53]:
where ε
ii, σ
ii, ν
ij and E
i are the strain, stress, Poisson ratio and elastic modulus along the "i" direction, respectively. Considering ε
yy= 0, we obtain:
However, based on the symmetry of the stress and strain tensors, the following relation exist:
By substituting the Eq. (3) in Eq. (2), the Poisson ratio can compute as:
By computing E
x and E
y from Eq. (3) and substituting in Eqs. (1),
Finally, the elastic module can be calculated in both directions using Eqs. (5) and (6):
where σ
xx and σ
yy are the stresses in longitudinal and transverse directions, respectively. In
Figure 8 the stress-strain relations for the uniaxial tensile straining along the x and y directions for the both nanostructures are illustrated, which reveal completely linear relations corresponding to the linear elasticity. We therefore fitted lines to the stress-strain values for the strain values below 0.02 to report the elastic properties on the basis of abovementioned relations.
Table 2 provides a comprehensive summary of the mechanical properties of α-chitin and its chitosan biocomposite. The table includes key parameters such as the elastic modulus (E), Poisson's ratio (ν), strain at ultimate tensile strength points (ɛ
u), and stress at ultimate tensile strength points (UTS). The stress units are given in GPa. Note that the reported elastic module and the Poisson ratios in
Table 2, are size independent since we applied PBC boundary condition in all directions.
The elastic modulus (E) values indicate the stiffness of the materials. A higher E value for α-chitin suggests that it is stiffer compared to its chitosan biocomposite. This is consistent with the highly crystalline nature of α-chitin, which contributes to its rigidity. Poisson's ratio (ν) provides insights into the material's ability to deform in a direction perpendicular to the applied load. A lower ν value for the biocomposite suggests that it is less prone to lateral contraction when subjected to axial tension, making it more suitable for applications requiring dimensional stability. The strain (ɛu) and ultimate tensile stress at UTS points offer a measure of the material's ability to withstand mechanical failure. Higher values for α-chitin indicate its suitability for load-bearing applications.
The elastic modulus in the x and y directions reveals contrasting behaviors between pure α-chitin and the α-chitin-chitosan biocomposite. α-chitin shows higher values of elastic modulus in both directions, demonstrating greater stiffness compared to the α-chitin-chitosan biocomposite. This is consistent with the earlier observations from stress-strain curves and further substantiates the premise that chitosan incorporation alters the mechanical properties of α-chitin, particularly in reducing its stiffness. Similarly, Poisson's ratios vary between the two structures. For α-chitin, ν in the y direction is higher (0.193) than in the x direction (0.151), which might imply that the material experiences more contraction or expansion in the y direction when stressed. On the other hand, the α-chitin-chitosan biocomposite shows relatively balanced Poisson’s ratios (0.153 for x and 0.185 for y), indicating more isotropic behavior. Additionally, the ultimate tensile strength (UTS) points validate that α-chitin is mechanically stronger than its biocomposite, particularly evident in the y direction with UTS values of 10.07 GPa and 5.03 GPa for α-chitin and α-chitin-chitosan, respectively. In summary, the calculated mechanical properties via Hooke’s law offer a comprehensive outlook on the behaviors of α-chitin and α-chitin-chitosan under uniaxial loading conditions.
4. Conclusions
In this study, we have comprehensively investigated the mechanical properties of α-chitin and its chitosan biocomposite, focusing on their behavior under uniaxial strain, stress distribution in ionized water. The insights gained are pivotal for the rational design and optimization of these materials for specialized applications in bioengineering, materials science, and environmental technology.
MD simulations have confirmed the anisotropic nature of these materials. α-chitin exhibited higher stiffness and UTS compared to its chitosan biocomposite, particularly when strained along the crystalline chain direction. The biocomposite, however, showed increased ductility, making it a versatile material for various applications requiring both stiffness and flexibility.
The stress distribution patterns in ionized water revealed that the mechanical properties of α-chitin are significantly influenced by the aqueous environment. This is particularly important for biomedical applications where the material is often in contact with biological fluids. The anisotropic behavior and the influence of ionized water could be critical factors in designing α-chitin-based materials for applications like tissue engineering and drug delivery systems.
Table 2 provided a quantitative measure of key mechanical properties, including the elastic modulus (E), Poisson's ratio (ν), and strain and stress at ultimate tensile strength points (ɛ
u and UTS). The data suggests that α-chitin is more suitable for load-bearing applications due to its higher stiffness and strength, while the biocomposite is more apt for applications requiring dimensional stability and flexibility.
While this study provides a foundational understanding of the mechanical properties of α-chitin and its chitosan biocomposite, future work should focus on a more detailed molecular-level analysis.
In conclusion, this research constitutes a comprehensive guide for deciphering the mechanical properties of α-chitin and its chitosan biocomposite. The anisotropic nature, influence of ionized water, and nano-structural characteristics have been thoroughly investigated, providing valuable insights for material optimization. The data presented herein is not only pivotal for academic research but also has significant implications for industrial applications, particularly in the fields of bioengineering, environmental technology, and materials science.
Figure 1.
α-chitin nanostructure a) without ionized water; b) with ionized water in z direction.
Figure 1.
α-chitin nanostructure a) without ionized water; b) with ionized water in z direction.
Figure 2.
α-chitin-chitosan nanostructure a) without ionized water; b) with ionized water in z direction.
Figure 2.
α-chitin-chitosan nanostructure a) without ionized water; b) with ionized water in z direction.
Figure 3.
Three directional stress-strain curvature for α-chitin in three directions, (a) loading in x direction; (b) loading in y direction.
Figure 3.
Three directional stress-strain curvature for α-chitin in three directions, (a) loading in x direction; (b) loading in y direction.
Figure 4.
Three directional stress-strain curvature for α-chitin-chitosan biocomposite in three directions, (a) loading in x direction; (b) loading in y direction.
Figure 4.
Three directional stress-strain curvature for α-chitin-chitosan biocomposite in three directions, (a) loading in x direction; (b) loading in y direction.
Figure 5.
Stress distribution of α-chitin under uniaxial tensile loading in parallel to the crystalline chain direction (y-axis): a) 40% of UTS at strain rate of 0.250; b) 70% of UTS at strain rate of 0.447; c) 100% of UTS at strain rate of 0.639. .
Figure 5.
Stress distribution of α-chitin under uniaxial tensile loading in parallel to the crystalline chain direction (y-axis): a) 40% of UTS at strain rate of 0.250; b) 70% of UTS at strain rate of 0.447; c) 100% of UTS at strain rate of 0.639. .
Figure 6.
summerises the stress-strain curves in loading directions for both α-chitin and α-chitin-chitosan biocomposite to compare their directional response. For α-chitin along the y-axis, the maximum stress reached a significant 10.07 GPa at a strain rate of 0.636, and the material was able to sustain loading up to a significant strain rate of 0.999 with a resultant stress of 6.829 GPa. Conversely, in the x-direction, α-chitin exhibited a maximum stress of 2.78 GPa at a strain rate of 0.066. The stress value then dropped sharply to 0.20 GPa at a strain of 0.180 and underwent slight oscillations, peaking at 1.01 GPa at a strain of 0.353, and continued to fluctuate to a minimum stress value of 0.13 GPa at a strain of 0.608. In the case of the α-chitin-chitosan biocomposite, the maximum stress along the y-axis was reduced to 5.03 GPa at a strain rate of 0.639 and maintained integrity up to the same strain rate of 0.999 as in pure α-chitin with a stress value of 3.35 GPa. Along the x-axis, the biocomposite had a maximum stress of 2.34 GPa at a strain rate of 0.066 decreased and then showed fluctuations similar to pure α-chitin, peaking at 1.01 GPa at a strain of 0.361 and continuing to oscillate until a strain of 0.608 with a stress value of 0.45 GPa. These findings suggest that the incorporation of chitosan into α-chitin modifies the material's mechanical properties, particularly along the y-axis, while retaining similar characteristics of stress fluctuation along the x-axis. This has implications for the engineering and application of these materials in settings where directional mechanical properties are critical.
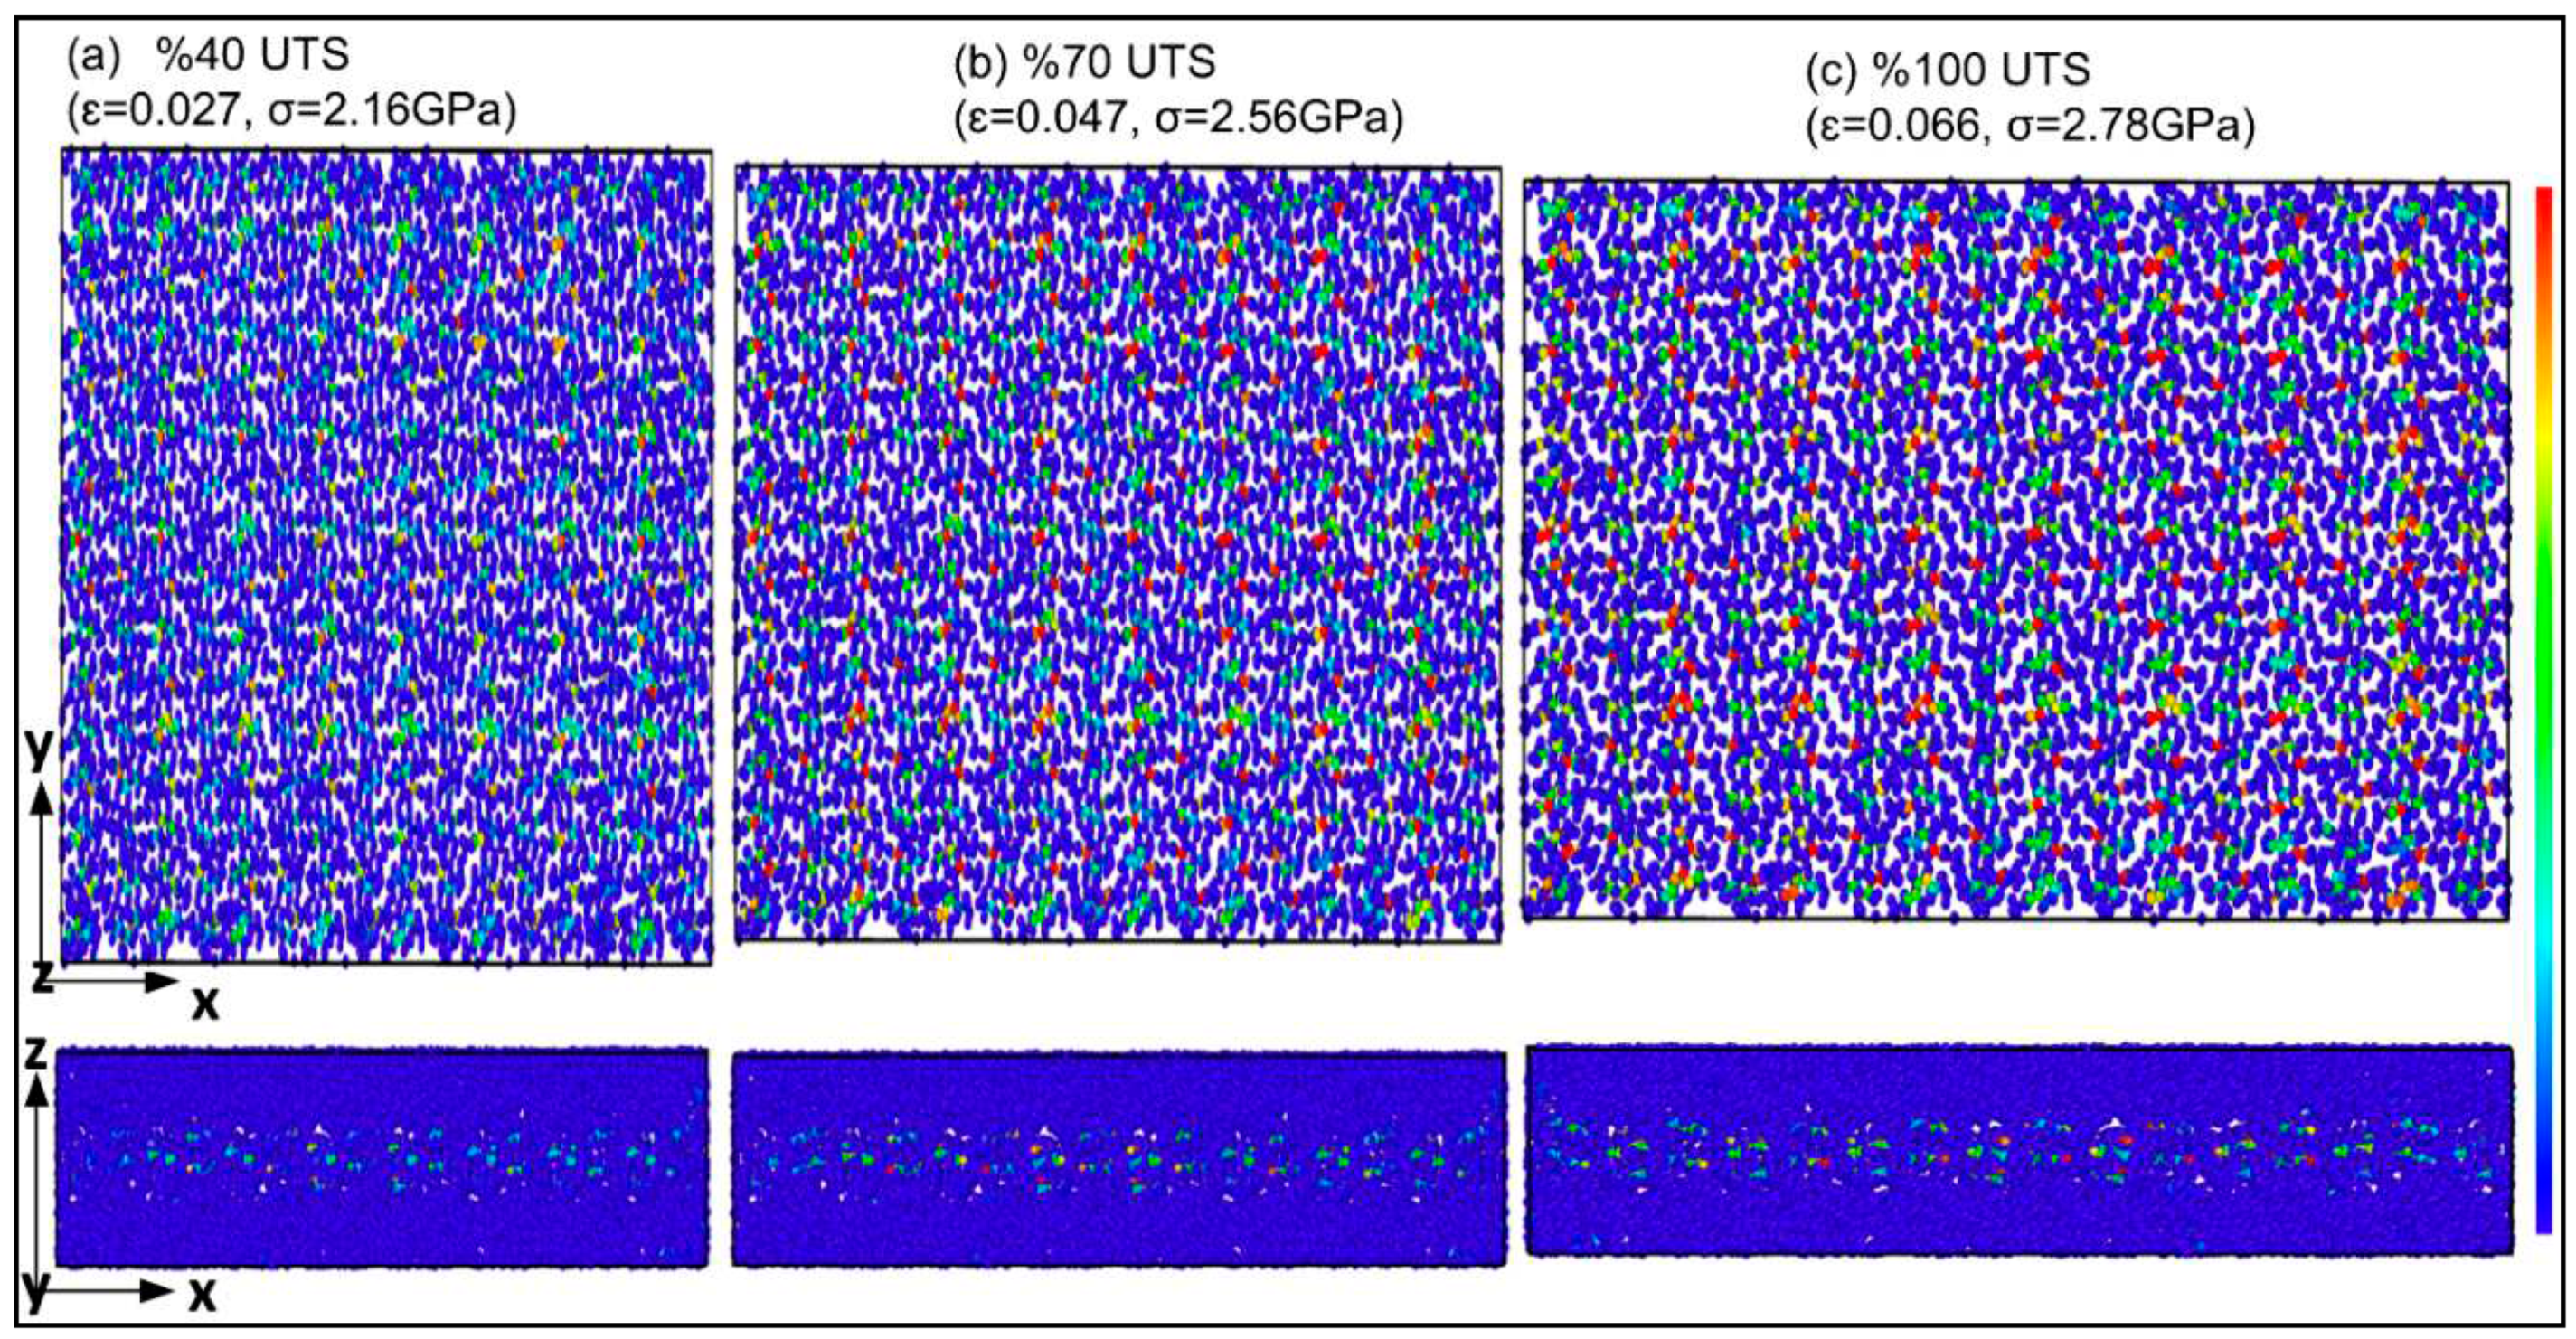
Figure 7.
Stress-strain curves for α-chitin and α-chitin-chitosan biocomposite under uniaxial loading.
Figure 7.
Stress-strain curves for α-chitin and α-chitin-chitosan biocomposite under uniaxial loading.
Figure 8.
MD predictions for the stress-strain responses α-chitin and α-chitin-chitosan biocomposite uniaxial strained along the x and y directions.
Figure 8.
MD predictions for the stress-strain responses α-chitin and α-chitin-chitosan biocomposite uniaxial strained along the x and y directions.
Table 1.
The elastic range stress-strain response gradient at strain rate of 0.02.
Table 1.
The elastic range stress-strain response gradient at strain rate of 0.02.
| Structure |
axis |
Gradient at 0.02 strain |
| α-chitin |
x |
53.31 |
| α-chitin |
y |
40.95 |
| α-chitin-chitosan |
x |
27.19 |
| α-chitin-chitosan |
y |
20.50 |
Table 2.
Mechanical properties of α-chitin and α-chitin-chitosan nanostructures, E, ν, ɛu and UTS indicate the elastic modulus, Poisson's ratio, strain and stress at ultimate tensile strength points, respectively. The stress units are in GPa.
Table 2.
Mechanical properties of α-chitin and α-chitin-chitosan nanostructures, E, ν, ɛu and UTS indicate the elastic modulus, Poisson's ratio, strain and stress at ultimate tensile strength points, respectively. The stress units are in GPa.
| Structure |
axis |
E |
ν |
ɛu
|
UTS |
| α-chitin |
x |
51.76 |
0.151 |
0.066 |
2.78 |
| α-chitin |
y |
39.76 |
0.193 |
0.639 |
10.07 |
| α-chitin-chitosan |
x |
31.66 |
0.153 |
0.066 |
2.34 |
| α-chitin-chitosan |
y |
26.00 |
0.185 |
0.639 |
5.03 |
