Submitted:
13 October 2023
Posted:
16 October 2023
You are already at the latest version
Abstract
Keywords:
Highlights:
- Summarizes 12,700 ISI-indexed articles about EEGLAB.
- Clustered Collaboration Network University into 6 segments.
- Presented the trend topics plot for keyword plus.
- Presented Co-Citation Network of authors for all and core sources.
- Have a big Supplementary Materials for further analysis and reproducible results.
1. Introduction
2. Materials and Methods
2.1. Data Gathering
2.2. Data Analysis
3. Results
3.1. Descriptive Statistics
3.2. Sources
3.3. Authors
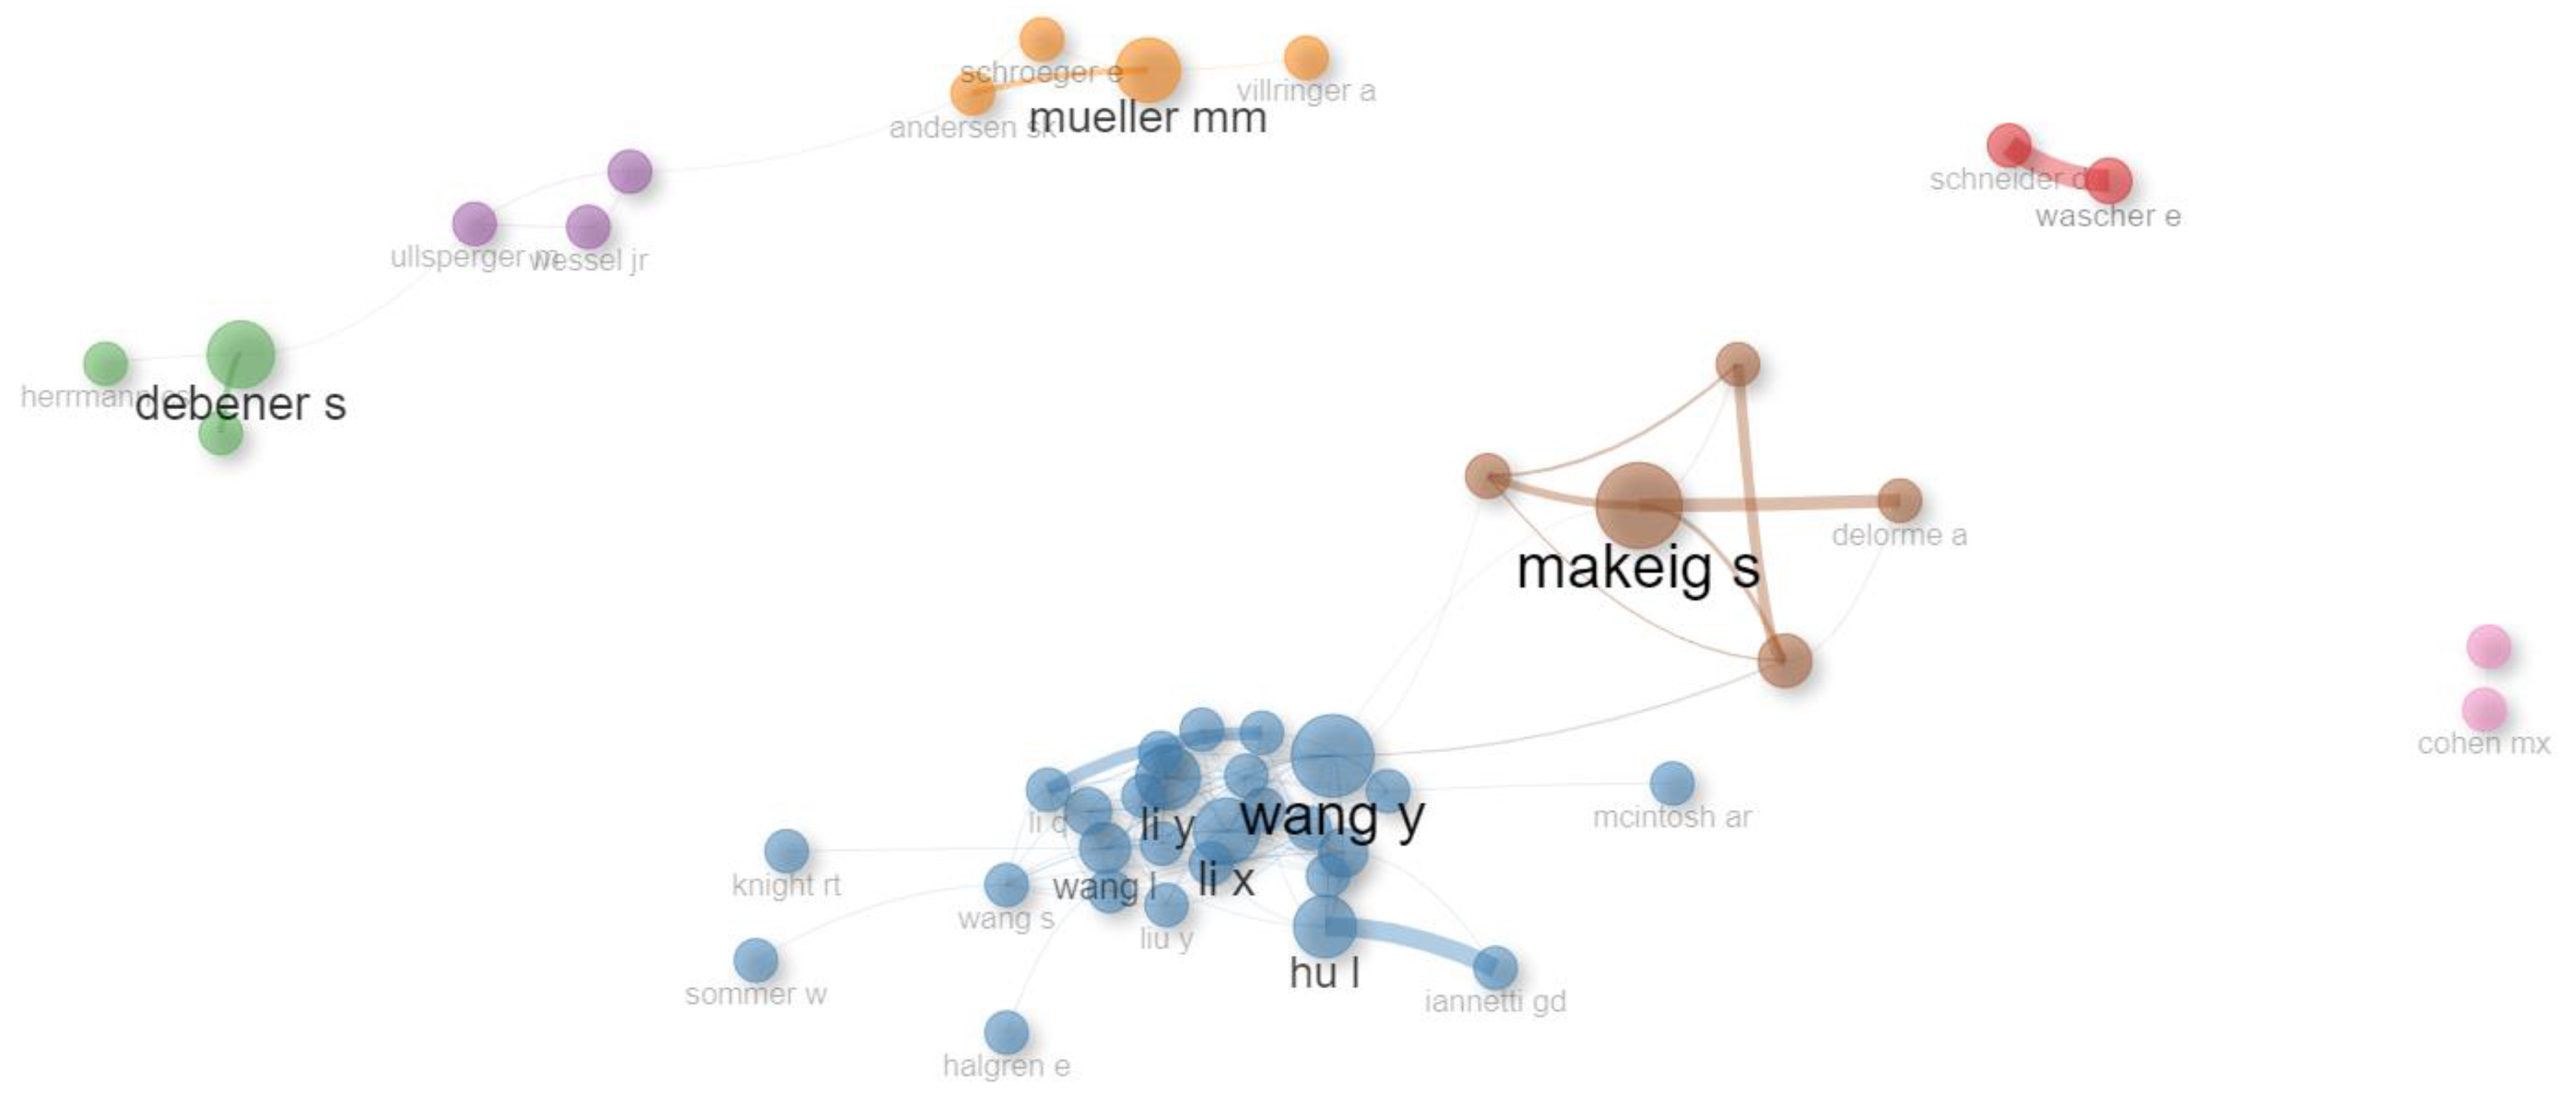
- Cluster 1: China, Japan, South Korea, Israel, India, Greece, Singapore, New Zealand, Malaysia, United Arab Emirates, Thailand, South Africa, Saudi Arabia, Pakistan, Bangladesh
- Cluster 2: USA, Germany, United Kingdom, Canada, Italy, France, Australia, Netherlands, Spain, Switzerland, Belgium, Finland, Denmark, Iran, Brazil, Norway, Hungary, Ireland, Poland, Austria, Portugal, Russia, Sweden, Turkey, Czech Republic, Lithuania, Mexico, Slovenia, Estonia, Serbia, Cuba, Luxembourg
- Cluster 3: Chile, Argentina, Colombia
3.4. Documents
4. Conclusions
Supplementary Materials
Funding
References
- Delorme, A.; Makeig, S. EEGLAB: An Open Source Toolbox for Analysis of Single-Trial EEG Dynamics Including Independent Component Analysis. J. Neurosci. Methods 2004, 134, 9–21. [Google Scholar] [CrossRef] [PubMed]
- Oostenveld, R.; Fries, P.; Maris, E.; Schoffelen, J.-M. FieldTrip: Open Source Software for Advanced Analysis of MEG, EEG, and Invasive Electrophysiological Data. Comput. Intell. Neurosci. 2011, 156869. [Google Scholar] [CrossRef] [PubMed]
- Lopez-Calderon, J.; Luck, S.J. ERPLAB: an open-source toolbox for the analysis of event-related potentials. Front. Hum. Neurosci. 2014, 8, 213. [Google Scholar] [CrossRef] [PubMed]
- Pion-Tonachini, L.; Kreutz-Delgado, K.; Makeig, S. ICLabel: An automated electroencephalographic independent component classifier, dataset, and website. NeuroImage 2019, 198, 181–197. [Google Scholar] [CrossRef]
- Delorme, A.; Mullen, T.; Kothe, C.; Acar, Z.A.; Bigdely-Shamlo, N.; Vankov, A.; Makeig, S. EEGLAB, SIFT, NFT, BCILAB, and ERICA: New Tools for Advanced EEG Processing. Comput. Intell. Neurosci. 2011, 2011, 1–12. [Google Scholar] [CrossRef] [PubMed]
- Palmer, J.A., K. Kreutz-Delgado, and S. Makeig, AMICA: An adaptive mixture of independent component analyzers with shared components. Swartz Center for Computatonal Neursoscience, University of California San Diego, Tech. Rep, 2012.
- Miyakoshi, M. , et al. Automated detection of cross-frequency coupling in the electrocorticogram for clinical inspection. in 2013 35th Annual International Conference of the Ieee Engineering in Medicine and Biology Society (Embc). 2013. IEEE.
- Pernet, C.R. , et al., LIMO EEG: a toolbox for hierarchical LInear MOdeling of ElectroEncephaloGraphic data. Computational intelligence and neuroscience, 2011. 2011: p. 1-11.
- Friston, K.J. , Statistical parametric mapping. Neuroscience databases: a practical guide, 2003: p. 237-250.
- Blankertz, B.; Acqualagna, L.; Dähne, S.; Haufe, S.; Schultze-Kraft, M.; Sturm, I.; Ušćumlic, M.; Wenzel, M.A.; Curio, G.; Müller, K.-R. The Berlin Brain-Computer Interface: Progress Beyond Communication and Control. Front. Neurosci. 2016, 10, 530. [Google Scholar] [CrossRef] [PubMed]
- Kothe, C.A.; Makeig, S. BCILAB: a platform for brain–computer interface development. J. Neural Eng. 2013, 10, 056014. [Google Scholar] [CrossRef] [PubMed]
- Muschelli, J.; Gherman, A.; Fortin, J.-P.; Avants, B.; Whitcher, B.; Clayden, J.D.; Caffo, B.S.; Crainiceanu, C.M. Neuroconductor: an R platform for medical imaging analysis. Biostatistics 2018, 20, 218–239. [Google Scholar] [CrossRef]
- Tran, X.A.; McDonald, N.; Dickinson, A.; Scheffler, A.; Frohlich, J.; Marin, A.; Liu, C.K.; Nosco, E.; Şentürk, D.; Dapretto, M.; et al. Functional connectivity during language processing in 3-month-old infants at familial risk for autism spectrum disorder. Eur. J. Neurosci. 2020, 53, 1621–1637. [Google Scholar] [CrossRef]
- Schirner, M.; Rothmeier, S.; Jirsa, V.K.; McIntosh, A.R.; Ritter, P. An automated pipeline for constructing personalized virtual brains from multimodal neuroimaging data. NeuroImage 2015, 117, 343–357. [Google Scholar] [CrossRef]
- An, S.; Fousek, J.; Kiss, Z.H.; Cortese, F.; van der Wijk, G.; McAusland, L.B.; Ramasubbu, R.; Jirsa, V.K.; Protzner, A.B. High-resolution virtual brain modeling personalizes deep brain stimulation for treatment-resistant depression: Spatiotemporal response characteristics following stimulation of neural fiber pathways. NeuroImage 2021, 249, 118848. [Google Scholar] [CrossRef] [PubMed]
- Broyd, S.J.; Demanuele, C.; Debener, S.; Helps, S.K.; James, C.J.; Sonuga-Barke, E.J. Default-mode brain dysfunction in mental disorders: A systematic review. Neurosci. Biobehav. Rev. 2009, 33, 279–296. [Google Scholar] [CrossRef] [PubMed]
- Craik, A.; He, Y.; Contreras-Vidal, J.L. Deep learning for electroencephalogram (EEG) classification tasks: a review. J. Neural Eng. 2019, 16, 031001. [Google Scholar] [CrossRef]
- Jenke, R.; Peer, A.; Buss, M. Feature Extraction and Selection for Emotion Recognition from EEG. IEEE Trans. Affect. Comput. 2014, 5, 327–339. [Google Scholar] [CrossRef]
- Sonuga-Barke, E.J.; Brandeis, D.; Cortese, S.; Daley, D.; Ferrin, M.; Holtmann, M.; Stevenson, J.; Danckaerts, M.; Döpfner, M.; Dittmann, R.W.; et al. Nonpharmacological Interventions for ADHD: Systematic Review and Meta-Analyses of Randomized Controlled Trials of Dietary and Psychological Treatments. Am. J. Psychiatry 2013, 170, 275–289. [Google Scholar] [CrossRef]
- Ismail, L.E.; Karwowski, W. Applications of EEG indices for the quantification of human cognitive performance: A systematic review and bibliometric analysis. PLOS ONE 2020, 15, e0242857. [Google Scholar] [CrossRef] [PubMed]
- Wijaya, A.; Setiawan, N.A.; Ahmad, A.H.; Zakaria, R.; Othman, Z. Electroencephalography and mild cognitive impairment research: A scoping review and bibliometric analysis (ScoRBA). AIMS Neurosci. 2023, 10, 154–171. [Google Scholar] [CrossRef]
- Chen, X.-X.; Ji, Z.-G.; Wang, Y.; Xu, J.; Wang, L.-Y.; Wang, H.-B. Bibliometric analysis of the effects of mental fatigue on athletic performance from 2001 to 2021. Front. Psychol. 2023, 13, 1019417. [Google Scholar] [CrossRef]
- Yao, S.; Zhu, J.; Li, S.; Zhang, R.; Zhao, J.; Yang, X.; Wang, Y. Bibliometric Analysis of Quantitative Electroencephalogram Research in Neuropsychiatric Disorders From 2000 to 2021. Front. Psychiatry 2022, 13, 830819. [Google Scholar] [CrossRef]
- Alsharif, A.; Salleh, N.Z.M.; Pilelienė, L.; Abbas, A.F.; Ali, J. Current Trends in the Application of EEG in Neuromarketing: A Bibliometric Analysis. Sci. Ann. Econ. Bus. 2022, 69, 393–415. [Google Scholar] [CrossRef]
- Alsharif, A.H.; Salleh, N.Z.M.; Baharun, R.; E, A.R.H. Neuromarketing research in the last five years: a bibliometric analysis. Cogent Bus. Manag. 2021, 8. [Google Scholar] [CrossRef]
- Liu, Y.; Zhao, R.; Xiong, X.; Ren, X. A Bibliometric Analysis of Consumer Neuroscience towards Sustainable Consumption. Behav. Sci. 2023, 13, 298. [Google Scholar] [CrossRef] [PubMed]
- Costa-Feito, A.; González-Fernández, A.M.; Rodríguez-Santos, C.; Cervantes-Blanco, M. Electroencephalography in consumer behaviour and marketing: a science mapping approach. Humanit. Soc. Sci. Commun. 2023, 10, 1–13. [Google Scholar] [CrossRef]
- Caneppele, N.R.; Serra, F.A.R.; Pinochet, L.H.C.; Ribeiro, I.M.R. Potential and challenges for using neuroscientific tools in strategic management studies. RAUSP Manag. J. 2022, 57, 235–263. [Google Scholar] [CrossRef]
- Tsiamalou, A.; Dardiotis, E.; Paterakis, K.; Fotakopoulos, G.; Liampas, I.; Sgantzos, M.; Siokas, V.; Brotis, A.G. EEG in Neurorehabilitation: A Bibliometric Analysis and Content Review. Neurol. Int. 2022, 14, 1046–1061. [Google Scholar] [CrossRef] [PubMed]
- Ghamari, H.; Golshany, N.; Rad, P.N.; Behzadi, F. Neuroarchitecture Assessment: An Overview and Bibliometric Analysis. Eur. J. Investig. Heal. Psychol. Educ. 2021, 11, 1362–1387. [Google Scholar] [CrossRef] [PubMed]
- Saedi, S.; Fini, A.A.F.; Khanzadi, M.; Wong, J.; Sheikhkhoshkar, M.; Banaei, M. Applications of electroencephalography in construction. Autom. Constr. 2021, 133, 103985. [Google Scholar] [CrossRef]
- Kontoghiorghes, L.; Colubi, A. New metrics and tests for subject prevalence in documents based on topic modeling. Int. J. Approx. Reason. 2023, 157, 49–69. [Google Scholar] [CrossRef]
- Winker, P. , Visualizing Topic Uncertainty in Topic Modelling. arXiv preprint arXiv:2302.06482, 2023. arXiv:2302.06482, 2023.
- Chen, X.; Tao, X.; Wang, F.L.; Xie, H. Global research on artificial intelligence-enhanced human electroencephalogram analysis. Neural Comput. Appl. 2021, 34, 11295–11333. [Google Scholar] [CrossRef]
- Aria, M.; Cuccurullo, C. bibliometrix: An R-tool for comprehensive science mapping analysis. J. Informetr. 2017, 11, 959–975. [Google Scholar] [CrossRef]
- Team, R.D.C. , R: A language and environment for statistical computing. (No Title), 2010.
- Bornmann, L. and H.D. Daniel, What do we know about the h index? Journal of the American Society for Information Science and technology, 2007. 58(9): p. 1381-1385.
- Egghe, L. Theory and practise of the g-index. Scientometrics 2006, 69, 131–152. [Google Scholar] [CrossRef]
- Bornmann, L.; Mutz, R.; Daniel, H. Are there better indices for evaluation purposes than the h index? A comparison of nine different variants of the h index using data from biomedicine. J. Am. Soc. Inf. Sci. Technol. 2008, 59, 830–837. [Google Scholar] [CrossRef]
- Pons, P.; Latapy, M. Computing Communities in Large Networks Using Random Walks. J. Graph Algorithms Appl. 2006, 10, 191–218. [Google Scholar] [CrossRef]
- Tadel, F.; Baillet, S.; Mosher, J.C.; Pantazis, D.; Leahy, R.M. Brainstorm: A User-Friendly Application for MEG/EEG Analysis. Comput. Intell. Neurosci. 2011, 2011, 1–13. [Google Scholar] [CrossRef]
- Gramfort, A.; Luessi, M.; Larson, E.; Engemann, D.A.; Strohmeier, D.; Brodbeck, C.; Goj, R.; Jas, M.; Brooks, T.; Parkkonen, L.; et al. MEG and EEG data analysis with MNE-Python. Front. Neurosci. 2013, 7, 267. [Google Scholar] [CrossRef]
- Delorme, A.; Sejnowski, T.; Makeig, S. Enhanced detection of artifacts in EEG data using higher-order statistics and independent component analysis. NeuroImage 2006, 34, 1443–1449. [Google Scholar] [CrossRef]
- Makeig, S.; Debener, S.; Onton, J.; Delorme, A. Mining event-related brain dynamics. Trends Cogn. Sci. 2004, 8, 204–210. [Google Scholar] [CrossRef]
- Anguera, J.A.; Boccanfuso, J.; Rintoul, J.L.; Al-Hashimi, O.; Faraji, F.; Janowich, J.; Kong, E.; Larraburo, Y.; Rolle, C.; Johnston, E.; et al. Video game training enhances cognitive control in older adults. Nature 2013, 501, 97–101. [Google Scholar] [CrossRef] [PubMed]
- Gramfort, A.; Luessi, M.; Larson, E.; Engemann, D.A.; Strohmeier, D.; Brodbeck, C.; Parkkonen, L.; Hämäläinen, M.S. MNE software for processing MEG and EEG data. NeuroImage 2014, 86, 446–460. [Google Scholar] [CrossRef] [PubMed]
- Lawhern, V.J.; Solon, A.J.; Waytowich, N.R.; Gordon, S.M.; Hung, C.P.; Lance, B.J. EEGNet: a compact convolutional neural network for EEG-based brain–computer interfaces. J. Neural Eng. 2018, 15, 056013. [Google Scholar] [CrossRef] [PubMed]
- Debener, S.; Ullsperger, M.; Siegel, M.; Fiehler, K.; von Cramon, D.Y.; Engel, A.K. Trial-by-Trial Coupling of Concurrent Electroencephalogram and Functional Magnetic Resonance Imaging Identifies the Dynamics of Performance Monitoring. J. Neurosci. 2005, 25, 11730–11737. [Google Scholar] [CrossRef] [PubMed]
- Mognon, A.; Jovicich, J.; Bruzzone, L.; Buiatti, M. ADJUST: An automatic EEG artifact detector based on the joint use of spatial and temporal features. Psychophysiology 2011, 48, 229–240. [Google Scholar] [CrossRef] [PubMed]
- Delorme, A.; Palmer, J.; Onton, J.; Oostenveld, R.; Makeig, S. Independent EEG Sources Are Dipolar. PLOS ONE 2012, 7, e30135. [Google Scholar] [CrossRef] [PubMed]
- Groppe, D.M.; Urbach, T.P.; Kutas, M. Mass univariate analysis of event-related brain potentials/fields I: A critical tutorial review. Psychophysiology 2011, 48, 1711–1725. [Google Scholar] [CrossRef] [PubMed]
- Onton, J.; Delorme, A.; Makeig, S. Frontal midline EEG dynamics during working memory. NeuroImage 2005, 27, 341–356. [Google Scholar] [CrossRef] [PubMed]
- Cavanagh, J.F.; Zambrano-Vazquez, L.; Allen, J.J.B. Theta lingua franca: A common mid-frontal substrate for action monitoring processes. Psychophysiology 2011, 49, 220–238. [Google Scholar] [CrossRef] [PubMed]
- Maris, E.; Oostenveld, R. Nonparametric statistical testing of EEG- and MEG-data. J. Neurosci. Methods 2007, 164, 177–190. [Google Scholar] [CrossRef] [PubMed]
- Polich, J. Updating P300: An integrative theory of P3a and P3b. Clin. Neurophysiol. 2007, 118, 2128–2148. [Google Scholar] [CrossRef]
- Oldfield, R.C. The assessment and analysis of handedness: The Edinburgh inventory. Neuropsychologia 1971, 9, 97–113. [Google Scholar] [CrossRef]
- Bell, A.J.; Sejnowski, T.J. An Information-Maximization Approach to Blind Separation and Blind Deconvolution. Neural Comput. 1995, 7, 1129–1159. [Google Scholar] [CrossRef]
- Jung, T.-P. , et al., Removing electroencephalographic artifacts by blind source separation. Psychophysiology, 2000. 37(2): p. 163-178.
- Pfurtscheller, G.; Lopes da Silva, F.H. Event-related EEG/MEG synchronization and desynchronization: basic principles. Clin. Neurophysiol. 1999, 110, 1842–1857. [Google Scholar] [CrossRef]
- Brainard, D.H. and S. Vision, The psychophysics toolbox. Spatial vision, 1997. 10(4): p. 433-436.
- Marx, W.; Bornmann, L.; Barth, A.; Leydesdorff, L. Detecting the historical roots of research fields by reference publication year spectroscopy (RPYS). J. Assoc. Inf. Sci. Technol. 2013, 65, 751–764. [Google Scholar] [CrossRef]
- Aria, M.; Misuraca, M.; Spano, M. Mapping the Evolution of Social Research and Data Science on 30 Years of Social Indicators Research. Soc. Indic. Res. 2020, 149, 803–831. [Google Scholar] [CrossRef]
- Aria, M.; Cuccurullo, C.; D’aniello, L.; Misuraca, M.; Spano, M. Thematic Analysis as a New Culturomic Tool: The Social Media Coverage on COVID-19 Pandemic in Italy. Sustainability 2022, 14, 3643. [Google Scholar] [CrossRef]
- Friston, K.J.; Holmes, A.P.; Worsley, K.J.; Poline, J.-P.; Frith, C.D.; Frackowiak, R.S.J. Statistical Parametric Maps in Functional Imaging: A General Linear Approach. Hum. Brain Mapp. 1994, 2, 189–210. [Google Scholar] [CrossRef]
- Day, P.; Twiddy, J.; Dubljević, V. Present and Emerging Ethical Issues with tDCS use: A Summary and Review. Neuroethics 2022, 16, 1–25. [Google Scholar] [CrossRef]
- Manippa, V. , et al., Cognitive and neuropathophysiological outcomes of gamma-tACS in dementia: a systematic review. Neuropsychology Review, 2023: p. 1-24.
- Hastie, T. , et al., The elements of statistical learning: data mining, inference, and prediction. Vol. 2. 2009: Springer.
- Scheffler, A.; Telesca, D.; Li, Q.; A Sugar, C.; Distefano, C.; Jeste, S.; Şentürk, D. Hybrid principal components analysis for region-referenced longitudinal functional EEG data. Biostatistics 2018, 21, 139–157. [Google Scholar] [CrossRef]
- Ramsay, J. and B. Silverman, Functional Data Analysis. 2 ed. 2005: Springer New York, NY.
- Schirrmeister, R.T.; Springenberg, J.T.; Fiederer, L.D.J.; Glasstetter, M.; Eggensperger, K.; Tangermann, M.; Hutter, F.; Burgard, W.; Ball, T. Deep learning with convolutional neural networks for EEG decoding and visualization. Hum. Brain Mapp. 2017, 38, 5391–5420. [Google Scholar] [CrossRef]
| Sources | Local Impact | Number Papers | Start Year | |||
|---|---|---|---|---|---|---|
| H Index | G Index | M Index | Total Citations | |||
| NEUROIMAGE | 87 | 135 | 4.57 | 31,446 | 780 | 2005 |
| JOURNAL OF NEUROSCIENCE | 73 | 123 | 3.84 | 18,584 | 310 | 2005 |
| FRONTIERS IN HUMAN NEUROSCIENCE | 53 | 90 | 3.53 | 12,074 | 526 | 2009 |
| PLOS ONE | 50 | 79 | 2.94 | 9,755 | 371 | 2007 |
| PSYCHOPHYSIOLOGY | 48 | 94 | 2.52 | 11,230 | 425 | 2005 |
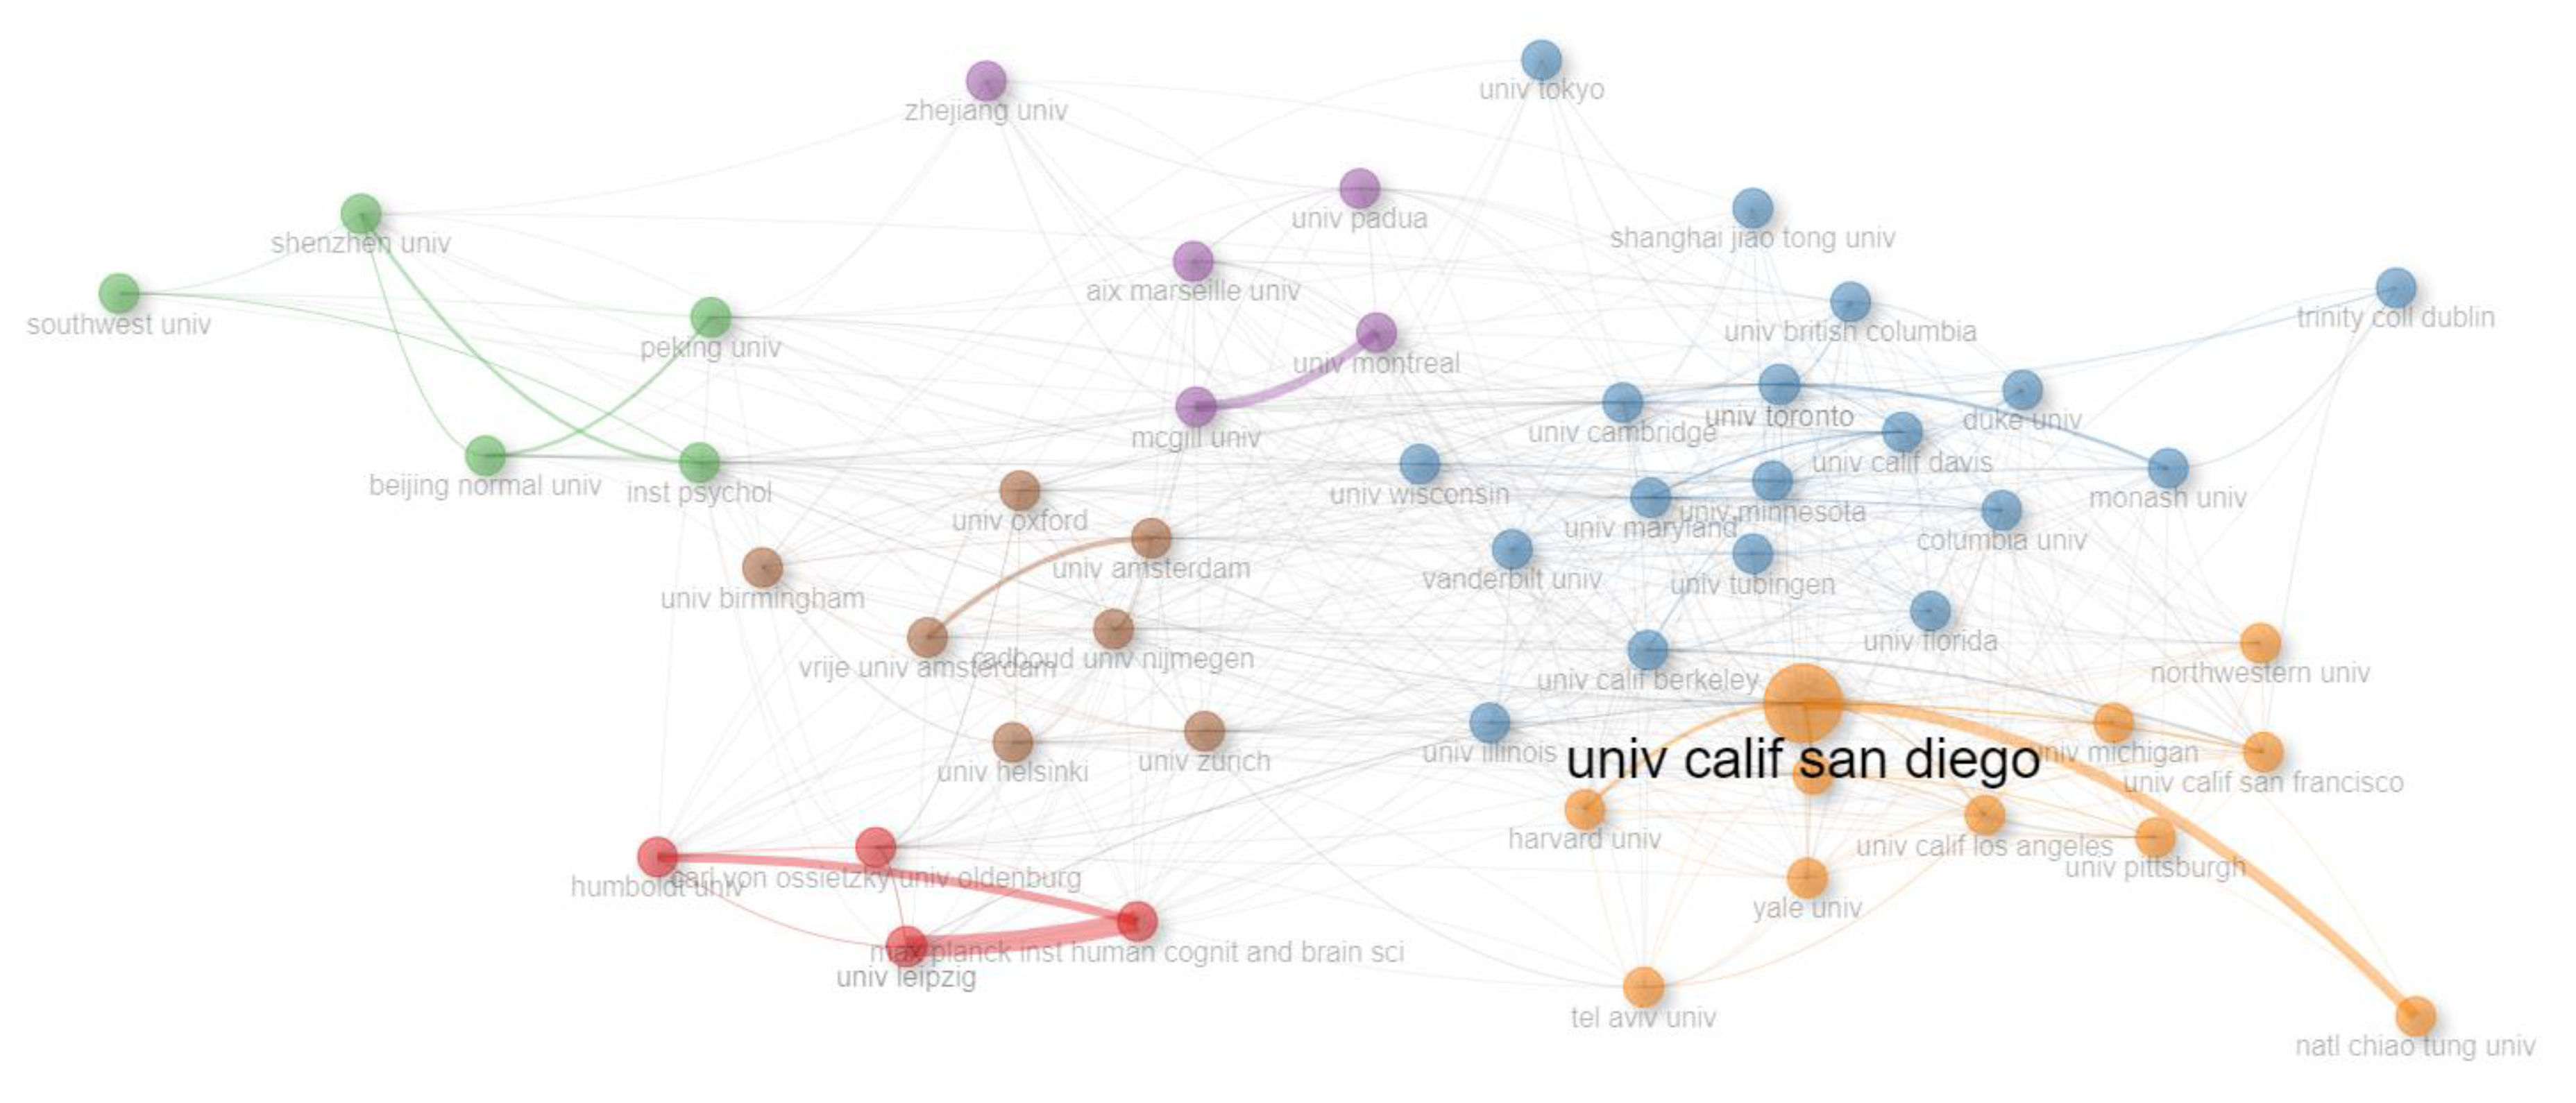
| Row | Cluster | Color | Universitas (Countries)* |
|---|---|---|---|
| 1 | 1 | Red | carl von ossietzky univ oldenburg (Germany), univ leipzig (Germany), humboldt univ (Germany), max planck inst human cognit and brain sci (Germany) |
| 2 | 2 | Blue | univ toronto (Canada), univ calif davis (USA), univ maryland (USA), univ cambridge (UK), univ wisconsin (USA), univ illinois (USA), univ tubingen (Germany), monash univ (Australia), univ minnesota (USA), univ british columbia (Canada), trinity coll dublin (Ireland), univ calif berkeley (USA), columbia univ (USA), univ florida (USA), shanghai jiao tong univ (China), vanderbilt univ (USA), univ tokyo (Japan), duke univ (USA) |
| 3 | 3 | Green | beijing normal univ (China), southwest univ (China), inst psychol (?), peking univ (China), shenzhen univ (China) |
| 4 | 4 | Purple | univ padua (Italy), mcgill univ (Canada), aix marseille univ (France), zhejiang univ (China), univ montreal (Canada) |
| 5 | 5 | Orange | univ calif san diego (USA), harvard med sch (USA), univ pittsburgh (USA), northwestern univ (USA), tel aviv univ (Israel), univ michigan (USA), univ calif los angeles (USA), univ calif san francisco (USA), natl chiao tung univ (Taiwan), yale univ (USA), harvard univ (USA) |
| 6 | 6 | Brown | univ zurich (Switzerland), univ helsinki (Finland), univ oxford (UK), radboud univ nijmegen (Netherlands), univ amsterdam(Netherlands), vrije univ amsterdam (Netherland), univ birmingham(UK) |
| *Abbreviation name of universities (Country name) | |||
| Row | Ref | Description | Total Citations | TC per Year | Normalized TC |
|---|---|---|---|---|---|
| 1 | [2] | FieldTrip app | 5,427 | 417.46 | 59.16 |
| 2 | [41] | Brainstorm app | 1,924 | 148.00 | 20.97 |
| 3 | [3] | ERPLAB app | 1,422 | 142.20 | 34.99 |
| 4 | [42] | MNE-Python | 1,099 | 99.91 | 25.83 |
| 5 | [43] | ICA – artifacts | 1,087 | 63.94 | 12.35 |
| 6 | [44] | Event-related potentials | 1,014 | 50.70 | 6.19 |
| 7 | [45] | Video game training | 934 | 84.91 | 21.95 |
| 8 | [46] | MNE Processing | 887 | 88.70 | 21.83 |
| 9 | [47] | EEGNet Model | 853 | 142.17 | 40.13 |
| 10 | [48] | Coupling , EEG-fMRI | 837 | 44.05 | 6.01 |
| Row | Ref | Description | Publication Year | Citations | ||
|---|---|---|---|---|---|---|
| Local | Global | Ratio | ||||
| 1 | [3] | ERPLAB app | 2014 | 1215 | 1422 | 85.4 |
| 2 | [49] | ADJUST app | 2011 | 529 | 812 | 65.1 |
| 3 | [43] | ICA – Artifacts Detection | 2007 | 524 | 1087 | 48.2 |
| 4 | [44] | ERP | 2004 | 487 | 1014 | 48.0 |
| 5 | [4] | ICLabel app | 2019 | 392 | 501 | 78.2 |
| 6 | [50] | ICA and BSS | 2012 | 311 | 536 | 58.0 |
| 7 | [51] | multiple comparison correction | 2011 | 296 | 716 | 41.3 |
| 8 | [48] | Coupling EEG/fMRI | 2005 | 233 | 837 | 27.8 |
| 9 | [52] | log spectral ICA | 2005 | 229 | 590 | 38.8 |
| 10 | [53] | ERP - Theta band | 2012 | 172 | 428 | 40.2 |
| Row | Ref | Description | Total Citations |
| 1 | [1] | EEGLAB | 12,700 |
| 2 | [2] | FieldTrip | 1,507 |
| 3 | [54] | Nonparametric statistical tests | 1,267 |
| 4 | [3] | ERPLAB | 1,215 |
| 5 | [55] | ERP – P300 (P3a , P3b) | 1,046 |
| 6 | [56] | Handedness analysis | 970 |
| 7 | [57] | blind separation and deconvolution | 914 |
| 8 | [58] | Artifacts - blind source separation | 837 |
| 9 | [59] | ERP/ MEG synchronization and desynchronization | 831 |
| 10 | [60] | Psychophysics Toolbox | 797 |
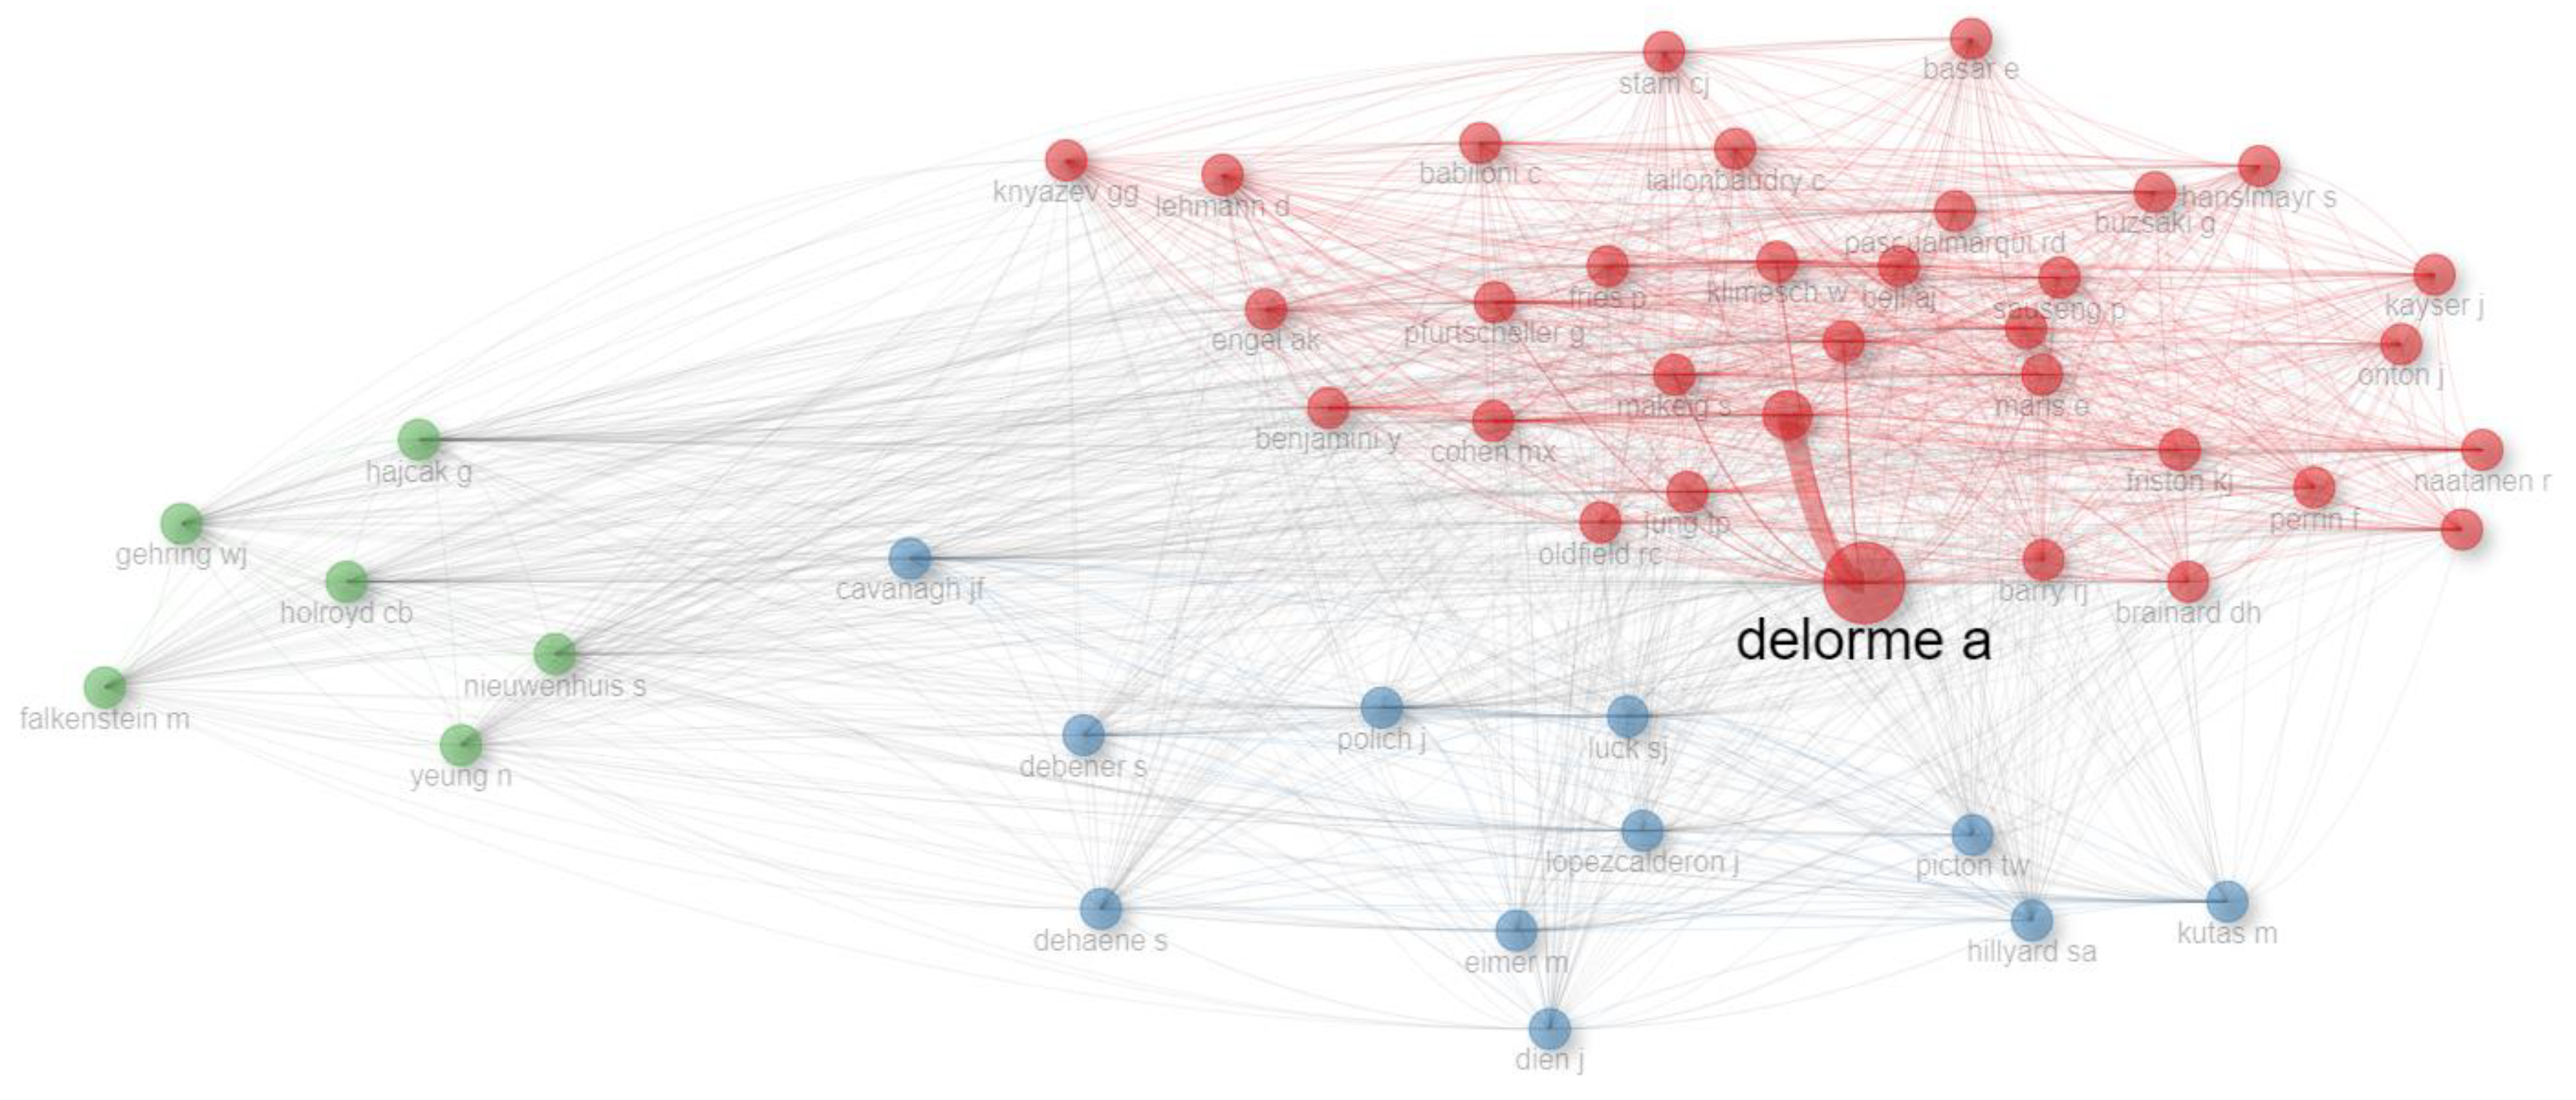
| Row | Clusters | Author Name (last Name, abbreviated First Name) |
|---|---|---|
| 1 | 1 | delorme a, anonymous, klimesch w, pfurtscheller g, makeig s, oostenveld r, cohen mx, naatanen r, jung tp, maris e, jensen o, pascualmarqui rd, friston kj, benjamini y, buzsaki g, sauseng p, oldfield rc, bell aj, babiloni c, winkler i , tallonbaudry c, brainard dh, fries p, hanslmayr s, stam cj, onton j, engel ak, perrin f, kayser j, basar e, barry rj, knyazev gg, lehmann d |
| 2 | 2 | luck sj, polich j, kutas m, lopezcalderon j, cavanagh jf, eimer m, debener s, picton tw, dien j, dehaene s, hillyard sa |
| 3 | 3 | hajcak g, holroyd cb, nieuwenhuis s, yeung n, falkenstein m, gehring wj |
Disclaimer/Publisher’s Note: The statements, opinions and data contained in all publications are solely those of the individual author(s) and contributor(s) and not of MDPI and/or the editor(s). MDPI and/or the editor(s) disclaim responsibility for any injury to people or property resulting from any ideas, methods, instructions or products referred to in the content. |
© 2023 by the authors. Licensee MDPI, Basel, Switzerland. This article is an open access article distributed under the terms and conditions of the Creative Commons Attribution (CC BY) license (http://creativecommons.org/licenses/by/4.0/).


