1. Introduction
Annually, because of various human activities, an enormous amount of carbon dioxide (CO
2) is released into the atmosphere. Deforestation contributes an additional 1.5 billion tonnes, while Fossil fuel accounts for around 6.5 billion tonnes of greenhouse gas emissions, it is worth stating that China, the United States, Russia, Japan, India, and Canada are obvious sources of carbon dioxide (CO
2) emissions [
10]. Activities such as the combustion of fossil fuels, and gas flaring are significant sources of carbon dioxide emissions in these nations. In the context of the United States, power plants are accountable for more than one-third of carbon dioxide (CO
2) emissions, so determining their significant role as major contributors to climate change. India is also becoming as a significant contributor of carbon dioxide (CO
2) emissions, with the energy sector responsible for over 50% of the nation's projected annual emissions of 2000 million tonnes [1}.
Numerous signs of climate change have experienced in recent years, including increased occurrences of unusually warm years, the thawing of regions formerly and rising sea levels, assumed to be constantly frozen, such as snow, ice, and permafrost. These changes are now largely linked to the increased amounts of greenhouse gases, particularly CO
2, which enhances the natural greenhouse effect, a phenomenon predicted by Arrhenius over a century ago [
2]. These gases, which are mostly caused by human activities such as the use of fossil fuels and deforestation, have raised awareness of the significant CO
2 emissions that are continually emitted into the atmosphere. furthermore, according to the Intergovernmental Panel on Climate Change (IPCC), excessive greenhouse gas emissions, notably CO
2, are the primary causes of current climate change and global warming [
7]. The effects of global warming may be seen in a variety of ways, including the loss of Arctic Sea ice, declining global glacier volume, and increasing sea levels. As a result, there has been a growing effort to reduce the environmental impact of CO
2 emissions, which includes both preventive measures such as promoting renewable energies and energy efficiency programmes, as well as corrective solution aimed at reducing emissions from existing industrial facilities and power plants.
Membrane separation for CO
2 separation is a relatively recent technique. It separates gases by varying their diffusivity, solubility, absorption, and adsorption capabilities on diverse materials. Membrane separation is the best option when a high purity product is not required since it is the most cost-effective of the several separation procedures [
11]. Membrane separation is presently being intensively explored in detail since it has various advantages over other separation methods in terms of basic technical aspects [
3,
4] Gas separation membranes are expected to play an important role in the CO
2 capture system due to their low weight, operational flexibility, compact design, low energy demand, and ability to minimise overall environmental impacts. Engineering communities have placed a high priority on developing new technologies that will assist us in achieving the goal of technological sustainability. Membrane contactors, as one possible example, have piqued the curiosity of researchers and engineers. Because of its unique characteristics, such as large interfacial area per unit volume, compact size, simplicity of scaling up and down, and independent control of gas and liquid flowrates, membrane contactors are a better alternative than previous approaches [
12].
The benefits of a membrane contactor in terms of providing a clear and stable phase interface, compact size, a large cross-sectional area, and straightforward linear scalability have piqued the interest of researchers in the field of CO
2 capture [
4,
8]. Ceramic membranes outlast polymeric membranes in terms of structural, thermal, physical, and chemical endurance, and they are often utilised in separation and purification operations [13,14} employed a commercial ceramic membrane grafted with FAS for CO
2 adsorption. Most ceramic membranes are made of alumina, zirconia, silica, and other metal oxides because they include hydroxyl (OH) groups on their surfaces, which provides them a hydrophilic property [
9].
2. Materials and Methods
The following equipment and tools were used in this experimental investigation, along with their respective manufacturers:
2.1. Equipment And Instruments
1. Magnetic Stirrer by Fisher Scientific
2. Quantachrome instruments' automatic gas sorption analyzer
Fisher Scientific Beakers 3.
4. Weighing Balance Sartorius
Clifton Electric Water Bath No. 5
pH metre Checker's
Graphite Seals from Gee Graphite (Figure 8a)
Oxford Instruments SEM Scanning Electron Microscope
Zeiss Instruments' Energy Dispersive X-Ray Detector
Scientific Céramiques Techniques et Industriels (SCT), France, manufactures an alumina support membrane.
11. Thermocouple RS
Weir 413D Rotatory Dryer
Digitron Barnstead Electrothermal Power Regulator Temperature Gauge
14 Hand Tools (Spanners and Screwdrivers)
15. Omega Pressure Gauge
Roxspur Flow Metre No. 16
3. Methods
3.1. Characterization of Hydrophillic Membranes
The functional groups in the synthesised silica membrane were examined using a 400-4000 cm-1 ATR Nicolet IS10 FT-IR spectrometer. The resultant membrane's form and elemental composition were examined using a Zeiss Model Evo LS10 scanning electron microscope (SEM) and an Oxford Instruments INCA System Energy Dispersive X-Ray analyser.
3.1.1. Method: Sem Analysis
SEM provides a variety of signals by sending a focused stream of high-energy electrons at the sample, providing information on the morphology, size, shape, crystalline structure, and thickness of the membrane materials. The generated pictures depict two-dimensional features with spatial variations. Interactions between electrons and samples yield a variety of signals, including secondary electrons, diffracted electrons, photons, and heat. Secondary electrons, which are important for emphasising sample morphology, are the major focus of SEM pictures. A signal detector, an electron source, a sample stage, electron lenses, and a display unit (PC) are the key components of a SEM system. Sample preparation include putting the sample on a prepared stub that has been coated with Agar Scientific's silver suspension. SEM pictures were acquired after drying for 24 hours
3.1.2. Method: Analysis of Ftir Spectroscopy
Fourier Transform Infrared (FTIR) spectrometers have proved useful in examining compound infrared spectra, assisting in the identification of various bonds within molecules and providing a greater knowledge of the functional groups inherent in each substance. Recognising one or two conspicuous absorbance traits, together with their related functional groups, becomes critical in identifying a molecule. Reference correlation charts, which highlight distinctive peak frequencies related to specific functional groups, can help in this identification procedure. The wavelength (symbolised as) is the distance between the waveform's peaks and is very important. The frequency (f) at which these peaks cross a location is defined by the velocity (c) of light through space, which has a value of 3.0 x 10⁸ m s-1 and is determined by.
Plank's constant (h), which has a value of 6.23 X 10⁻²⁴ J s, relates the energy E, of light to a frequency.
3.1.3. Contact Angle Measurements
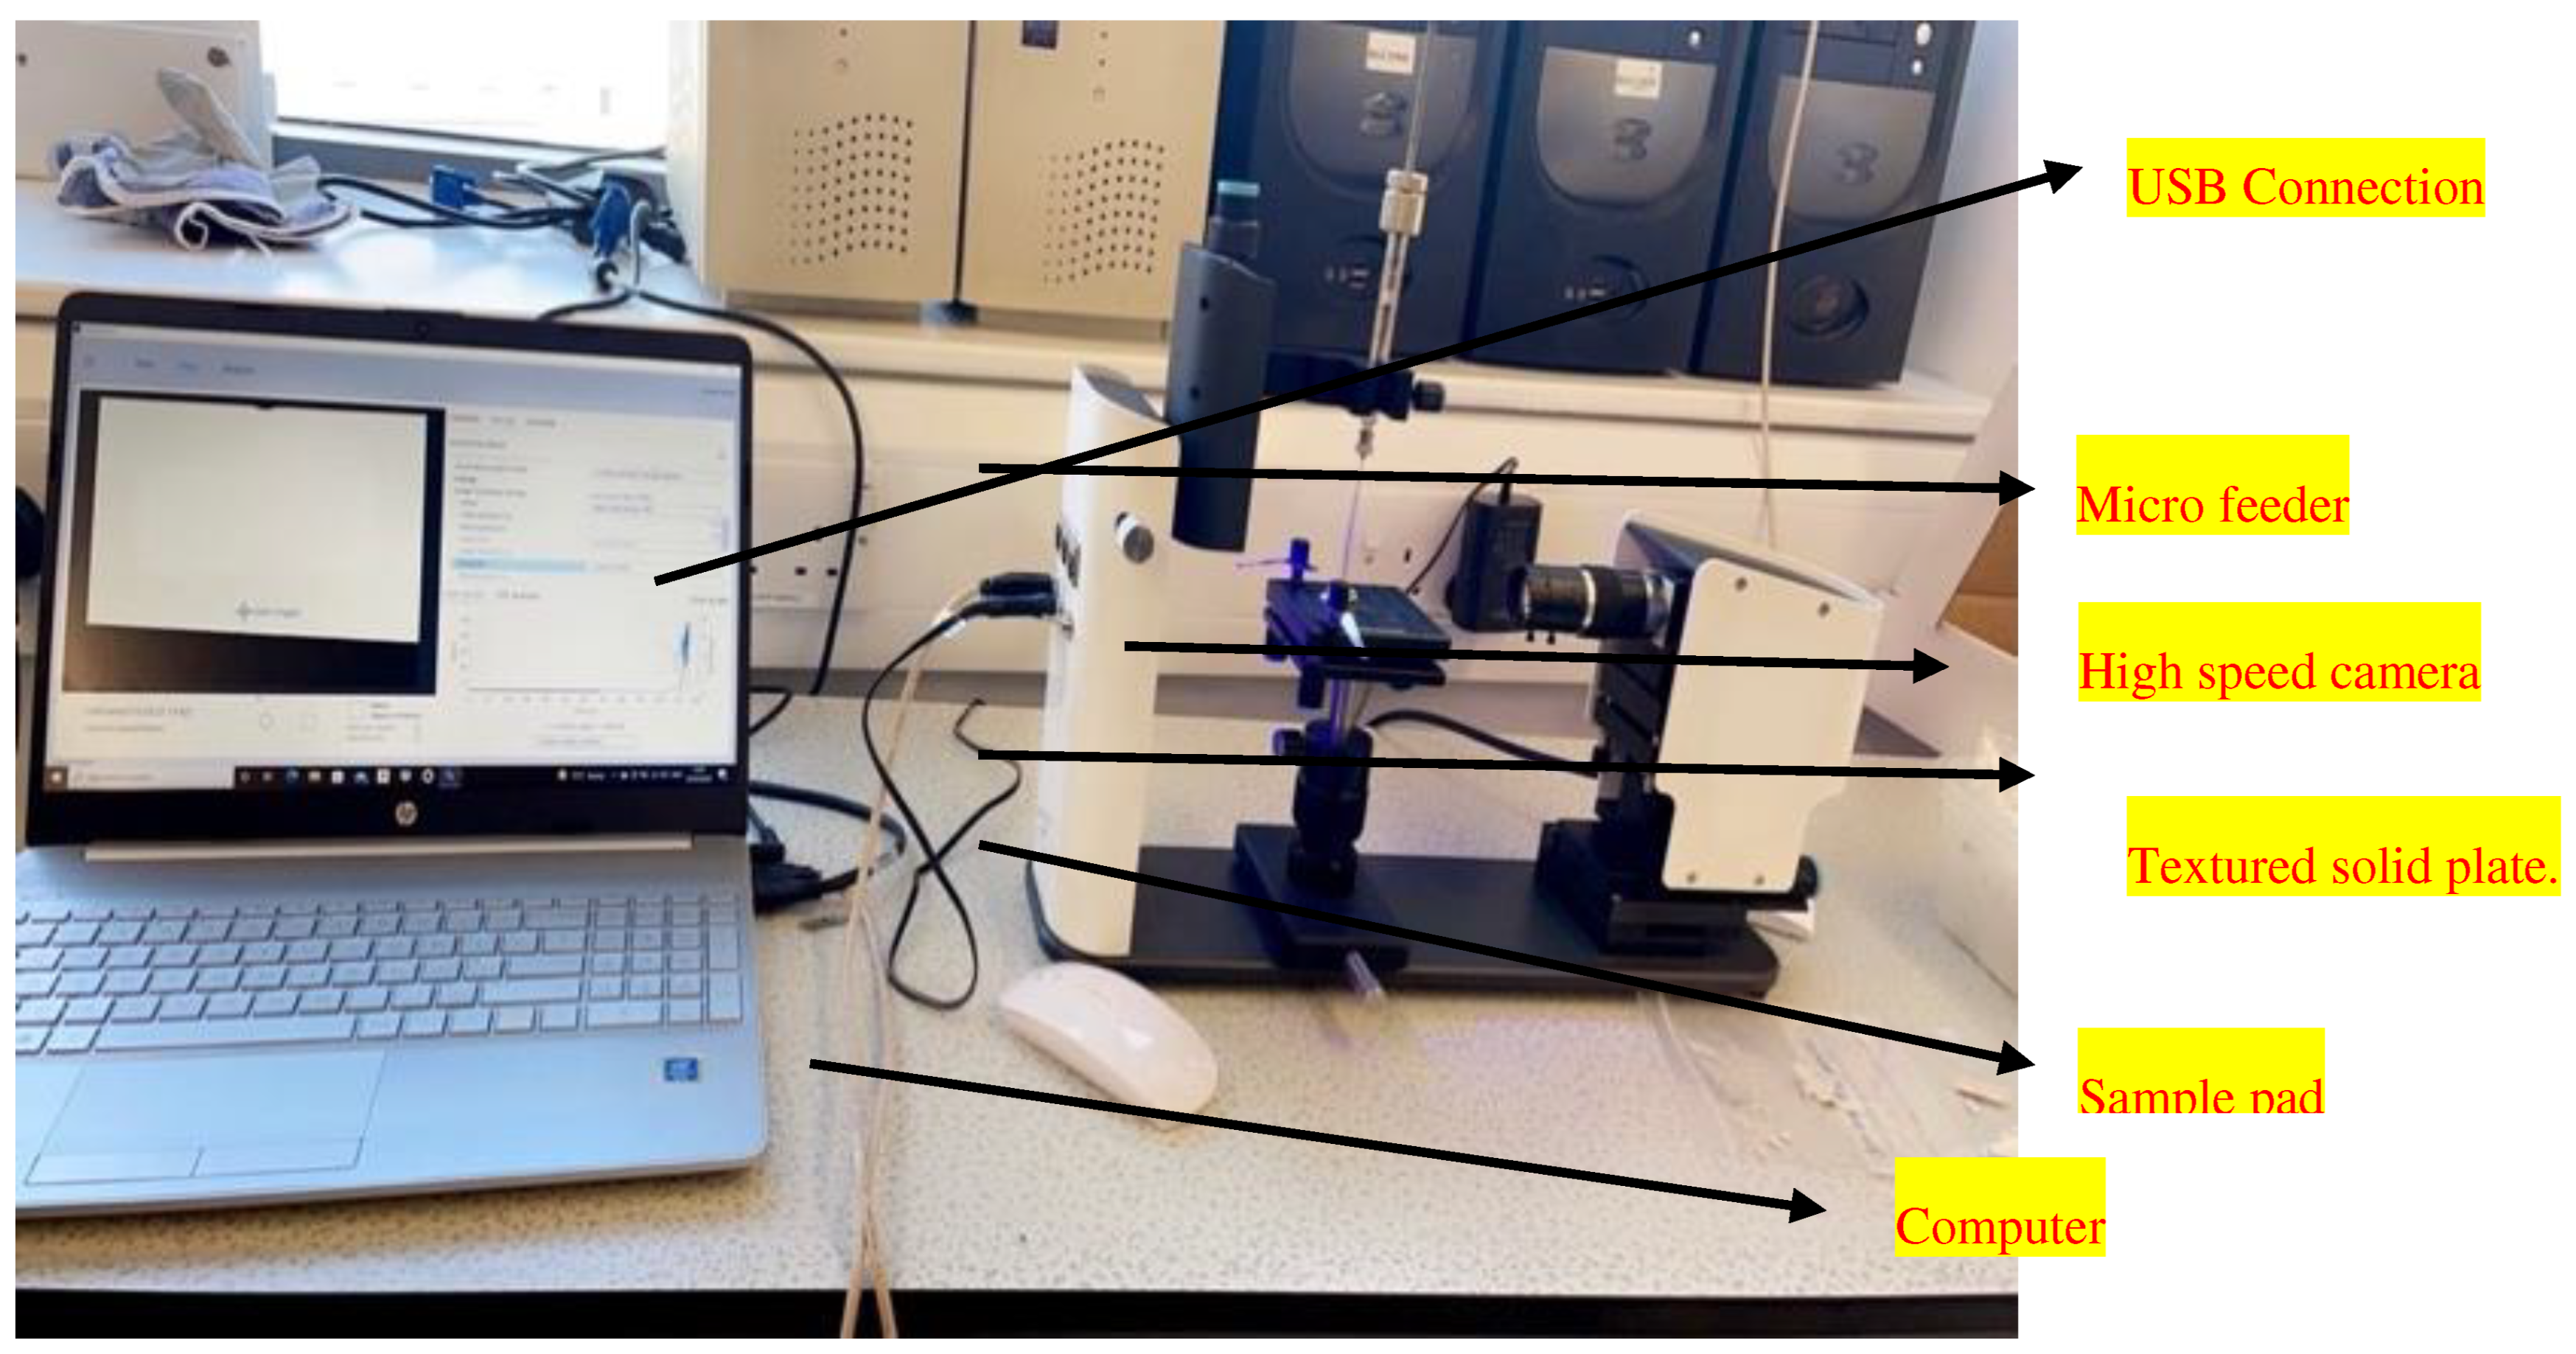
An Attention Theta Lite contact angle measuring device was used to deposit model liquids over the pelletized materials to conduct contact angle studies. The wettability of the materials was assessed using the sessile drop method. Static contact angles were determined using water as a model liquid. The model liquid droplet made first contact with the solid surface, and the average droplet volume of water served as the foundation for the measurements. The average droplet volume of water was roughly 5.5 for all ceramic membranes with pore sizes of 6000 nm as measured by the equipment.
The device was linked to a computer, and the software programme "One Attention" was used to observe and record the contact angles () created by individual droplets of the model liquid. Image recordings were taken at various intervals and frames per second (FPS) for each sample. The pictures were recorded over 10 seconds at 50% FPS for the 6000 nm ceramic membranes, and 10 seconds at 1.25% FPS for the hydrophilic ceramic membranes, respectively. In respect to the baseline value, the computer estimated the angles produced at the sites of contact where the model liquid droplet touched the solid surface on the right and left sides. The average angle values from both the right and left locations were computed by the programme. Averaging all the mean values obtained from the various testing periods yielded the final average contact angle. The suggested approach was utilised to compute the final contact angle after measuring each model liquid independently for the sample.
Figure 1.
showing a schematic diagram of contact angle measurement set up.
Figure 1.
showing a schematic diagram of contact angle measurement set up.
Figure 2.
showing a diagram of contact angle measurement set up.
Figure 2.
showing a diagram of contact angle measurement set up.
3.1.4. Methods: Gas Permeation Experiments
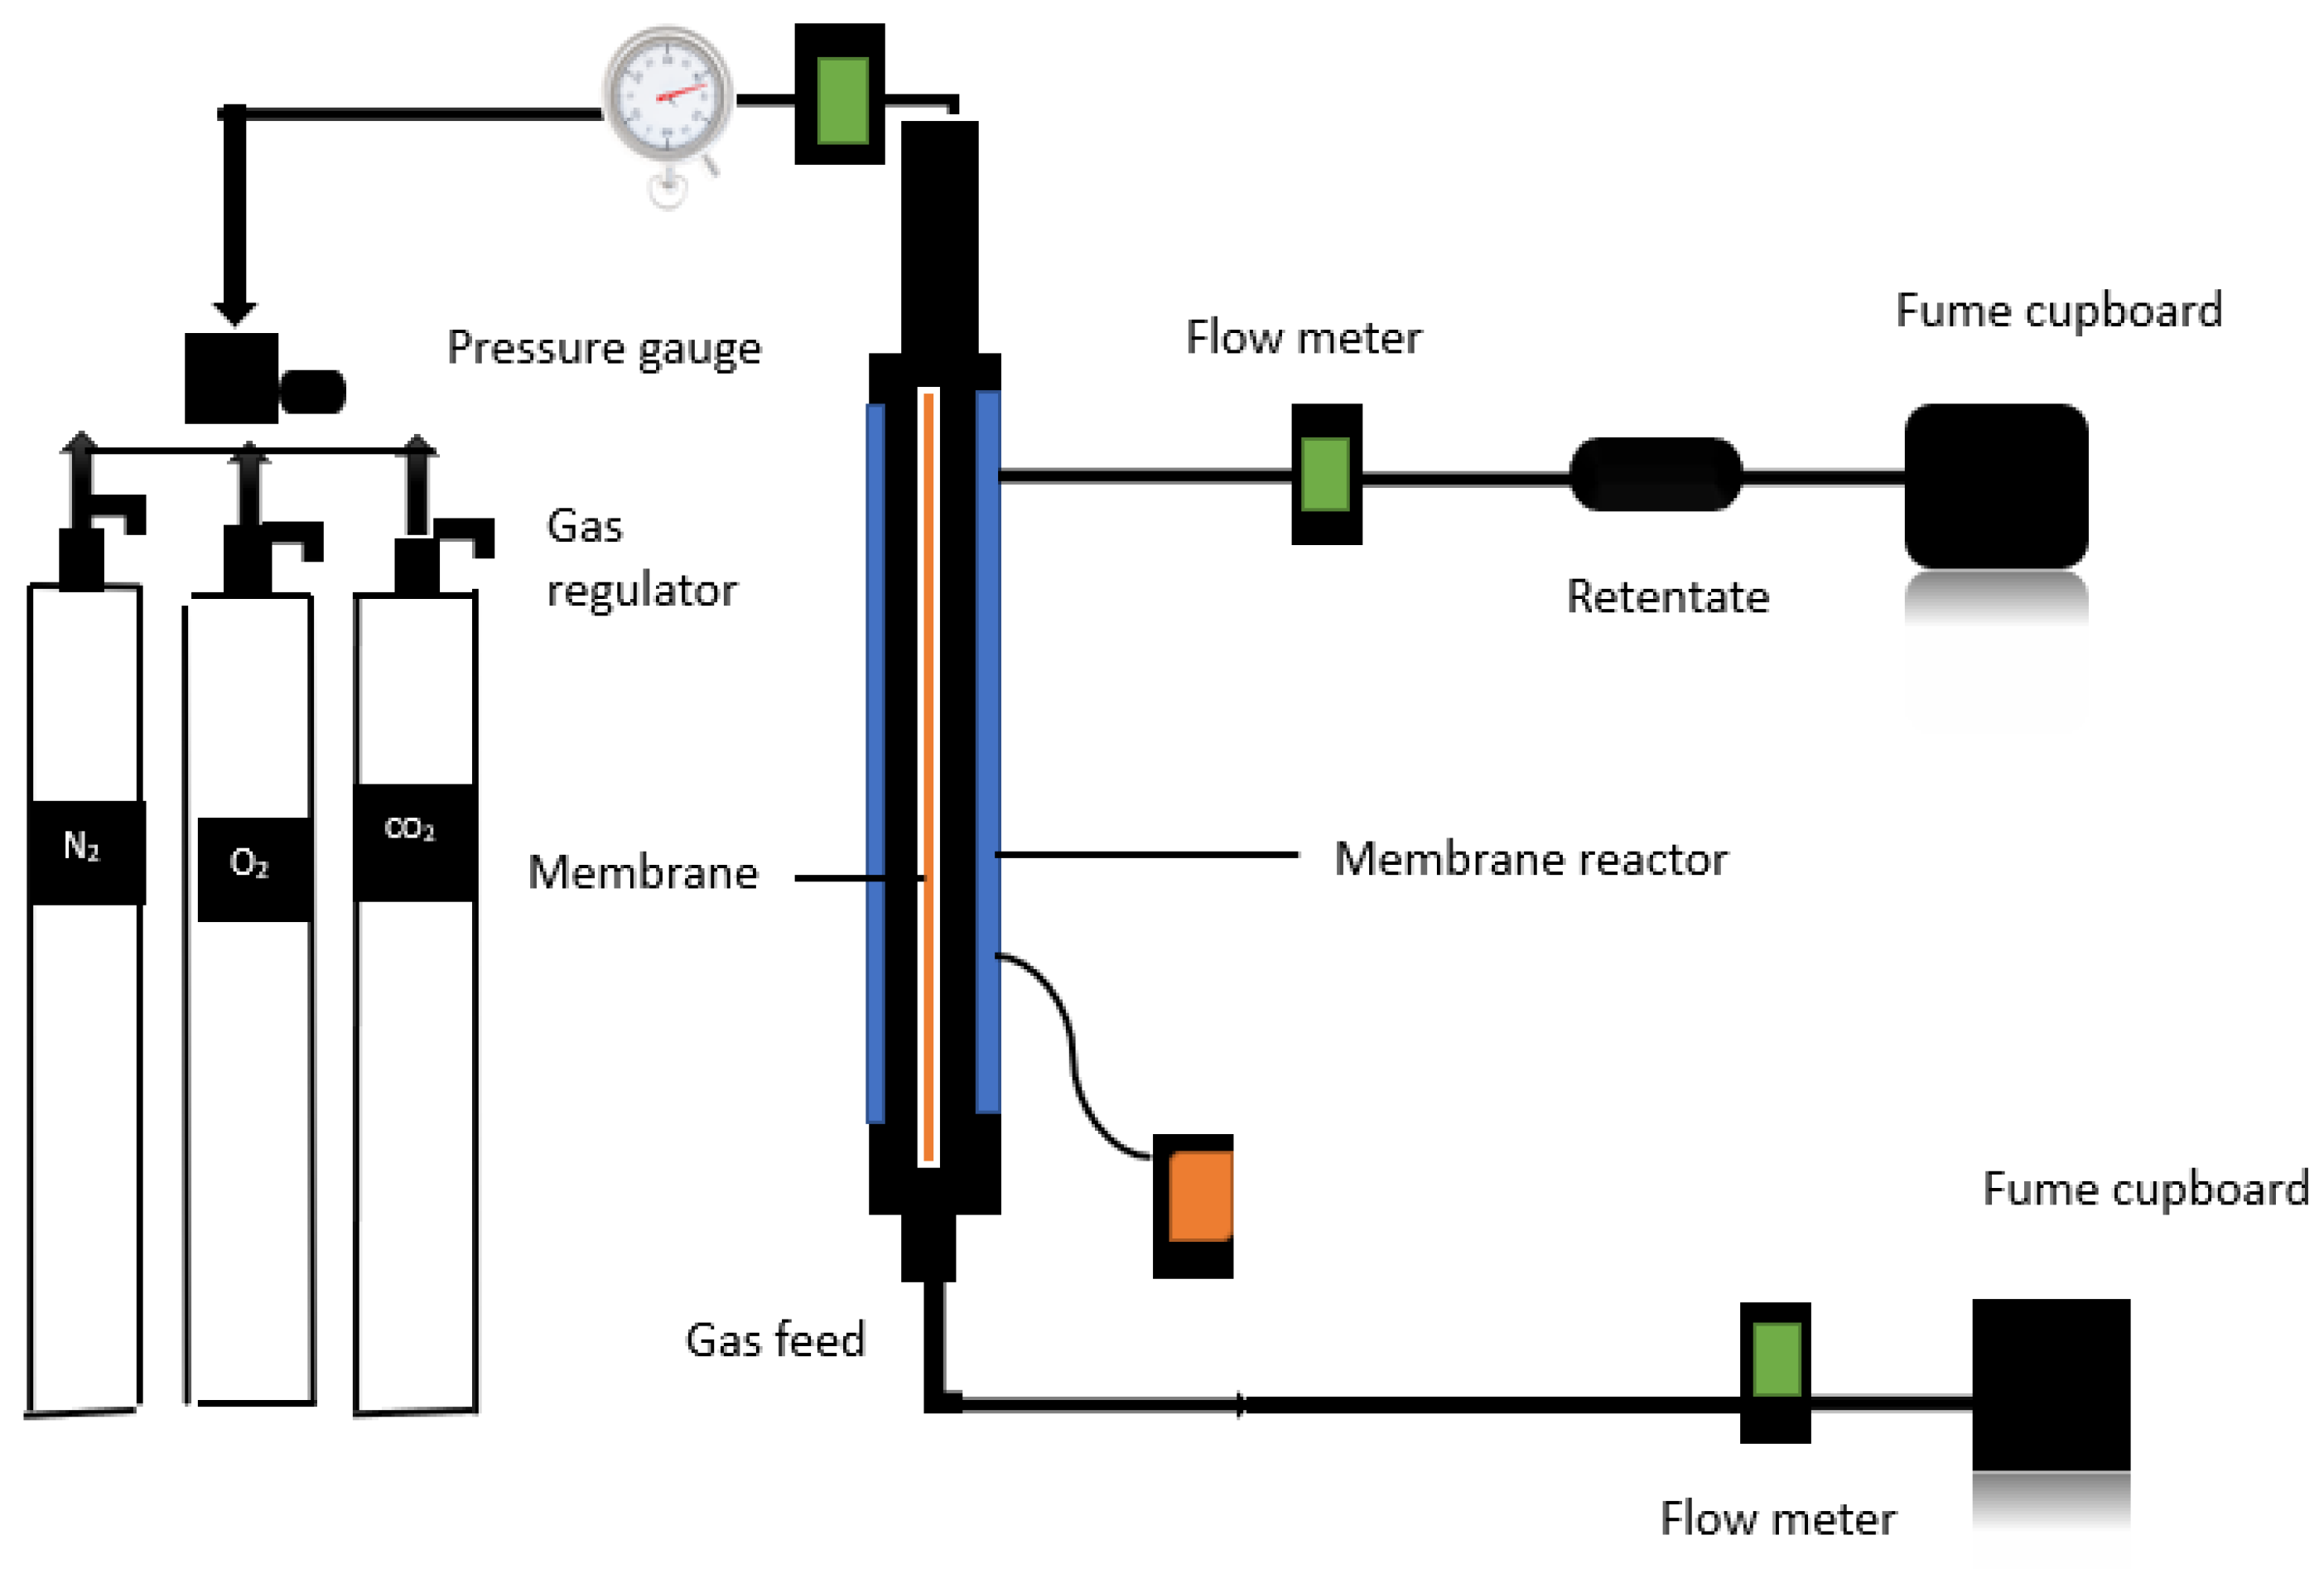
In the gas permeation testing procedure, a porous commercial ceramic membrane is placed in the middle of an annulus within a shell and tube configuration, and both ends are sealed with graphite to prevent gas leakage. A leak test is performed before to the start of each experiment to identify any potential leaks. This is performed by introducing the supply gas (natural gas) and monitoring the system for any pressure variations. After that, the setup is set to the desired temperature, allowing it to establish thermal equilibrium.
Following that, the gas regulator begins the release regulated of natural gas from the gas cylinder, allowing it to flow through the ceramic membrane via the pressure valve. The pressure valve is held in place by the core holder. The ceramic membrane allows gas to flow, allowing it to reach an exit line that connects to the output of a flow metre. The flow then continues from the flow meter's output to the core's input and, finally, to a fume closet (see
Figure 3).
After validating and adjusting the pressure gauge to the right pressure and temperature specifications, the system is permitted to function for a period. Three carrier gases—Carbon Dioxide (CO2), Nitrogen (N2), and Oxygen (O2)—are separately injected through the shell side of the membrane in this operation. The flow rate of gases penetrating the membrane is monitored to quantify their fluxes and the membrane's selectivity qualities. A flow metre is used to measure the flow rates of the penetrating gases, while thermocouples and pressure gauges are used to monitor pressure and temperature separately. The retentate side remains sealed during the experimental phase. These efforts try to capture CO2 straight from the atmosphere.
A 6000-nm-pore size nanostructured commercial hydrophilic ceramic membrane with an effective permeable length of 32.8 cm, an outer diameter of 2.62 cm, an inner diameter of 1.96cm, and a permeance membrane surface area of 107.1cm and commercial hydrophobic ceramic membrane with a pore size of 15 nm, an effective permeable length of 34.7 cm, an outer diameter of 1.01 cm, an inner diameter of 0.71 cm, and a permeable membrane surface area of 111.3 cm
2 was both used to carried out the experimental studies (see
Figure 4).
4. Results and Discussions
4.1. Characterization Of Hydrophilic Allumina Ceramic Membranes
4.1.1. Results of Sem Analysis
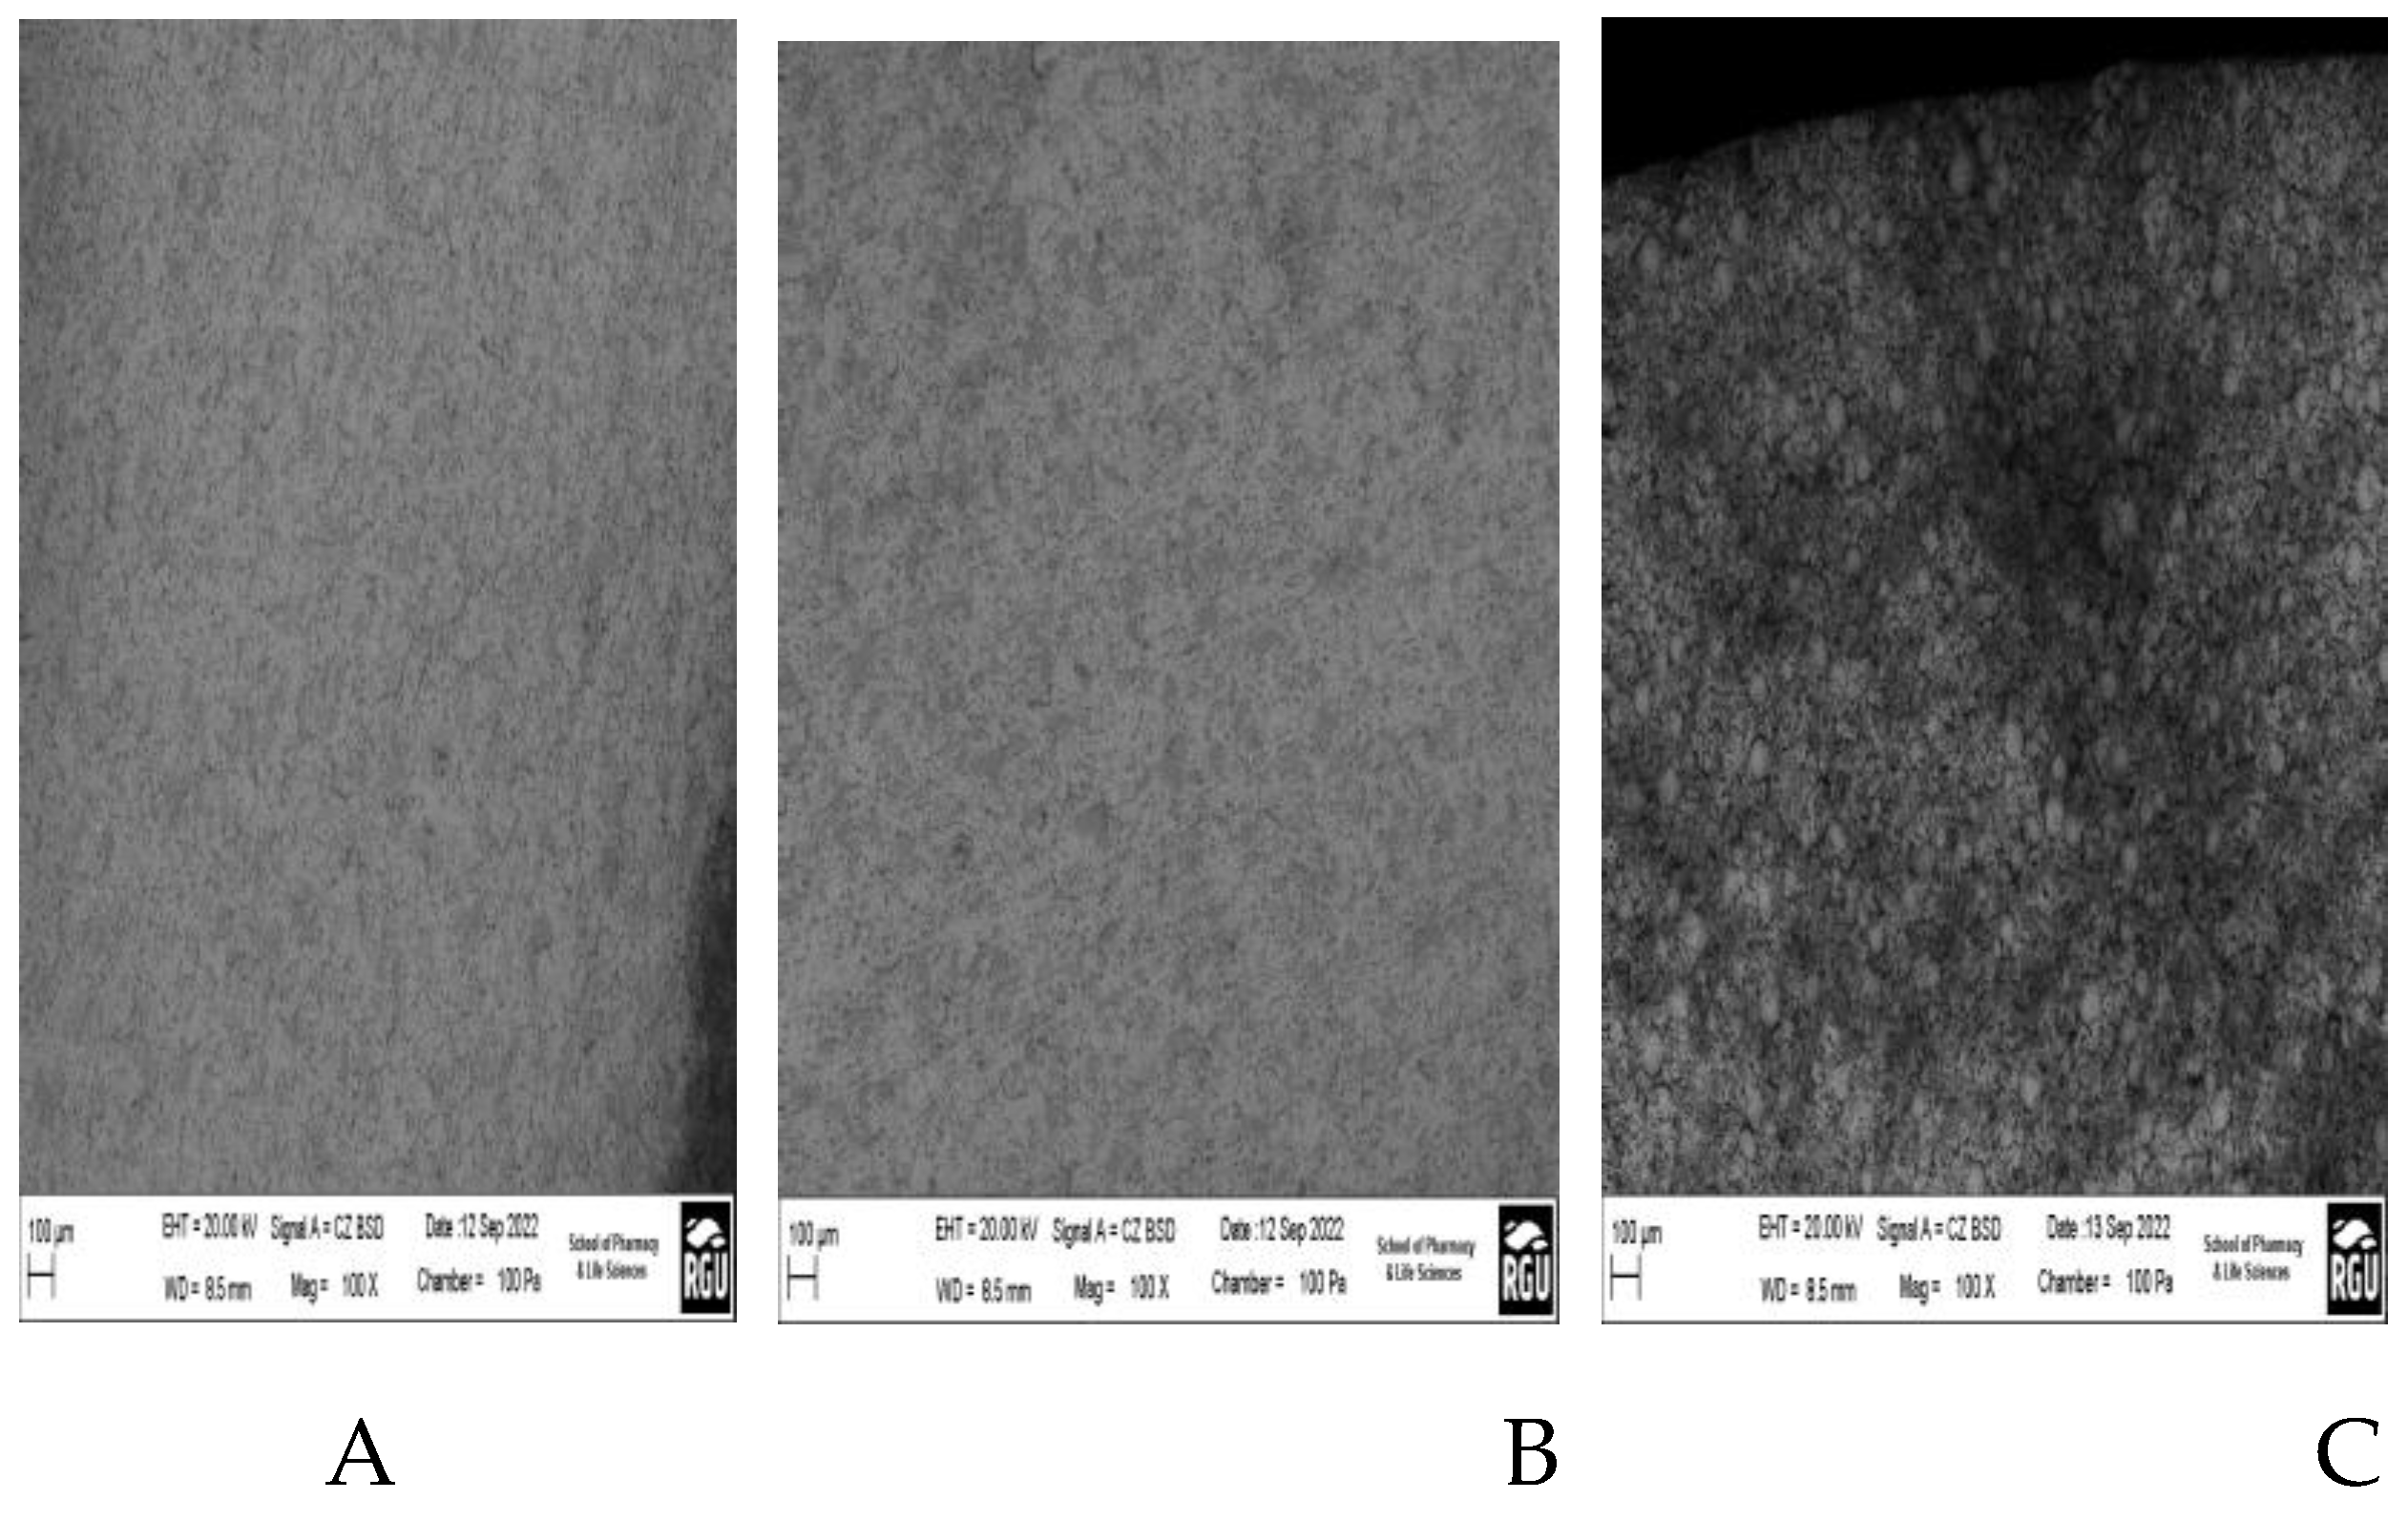
Scanning Electron Microscopy (SEM) analysis, which is known for producing high-resolution pictures, is useful in examining material surfaces for fractures. SEM is a useful method for characterising particles in addition to surface inspection. SEM's high magnification and higher resolution are critical for assessing the count, size, and morphology of microscopic particles.
Figure 5A–C show SEM micrographs of the surface properties at various magnification levels, encompassing the outside, inner, and cross-sectional views of the ceramic membrane, respectively. Particles are distributed uniformly throughout the entire of the ceramic membrane. The ceramic membrane's surface has a smooth texture with no cracks. The surface clearly exposes an organised collection of microscopic pores, as one would anticipate from a porous membrane. The sample's continuous solid structure is highlighted by its coherent pattern of small holes.
4.1.2. Edax Analysis Results
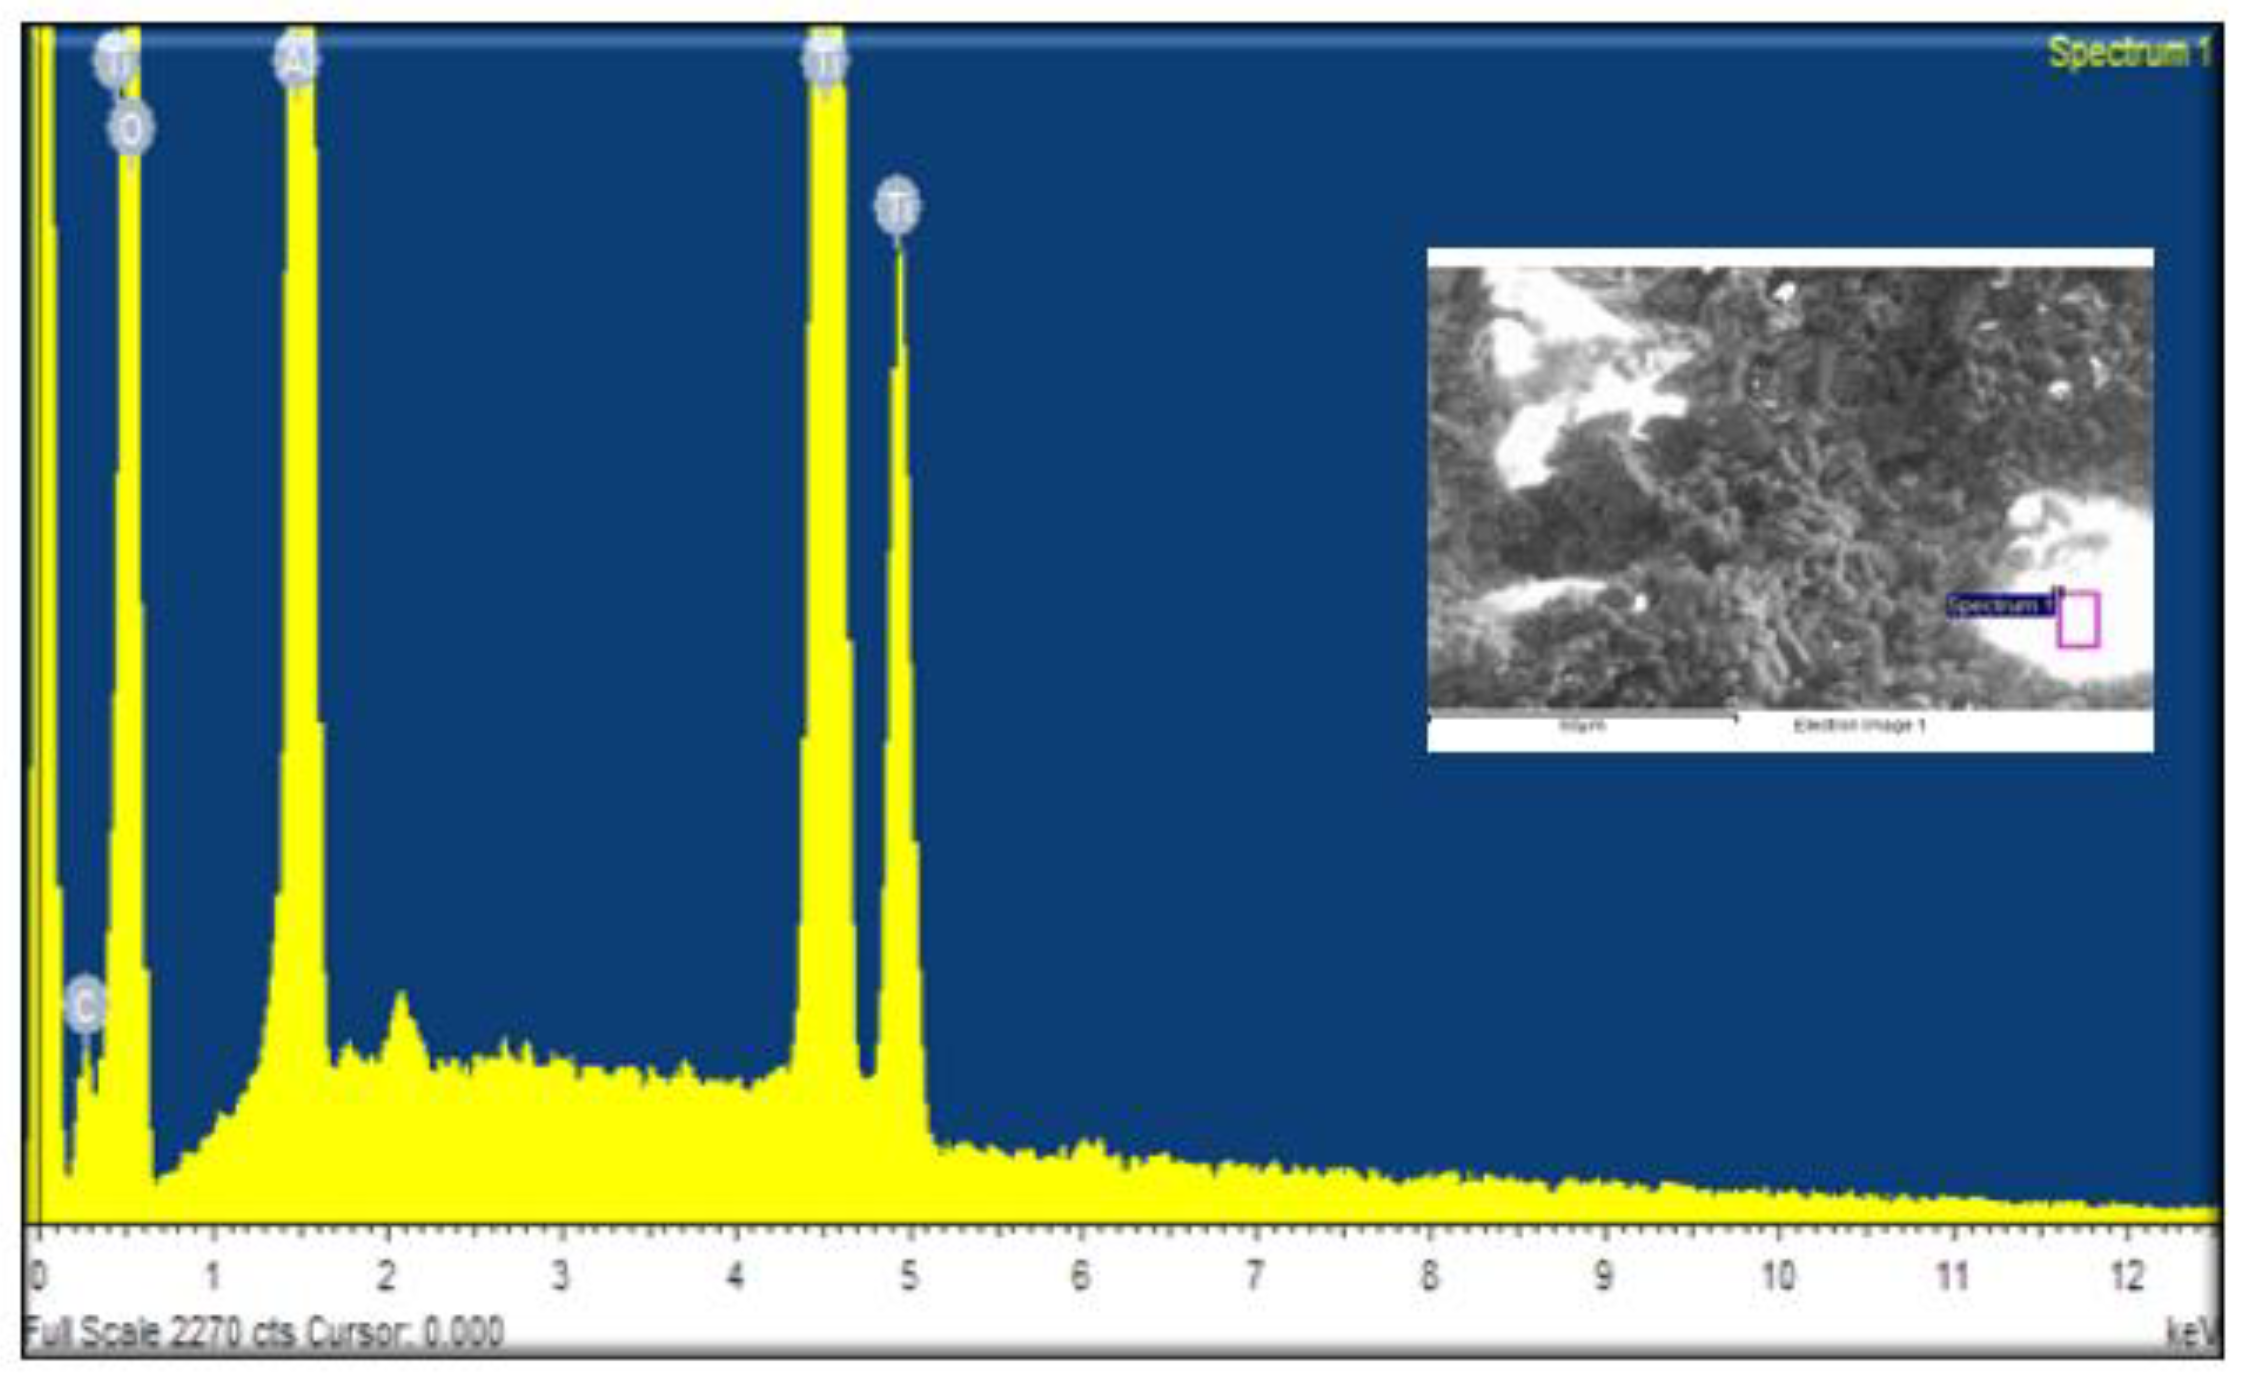
The elemental compositions of the alumina support and the silica membrane were determined using Energy Dispersive X-ray Analysis (EDAX).
Figure 6 depicts the outcomes graphically, while
Table 1 provides a full summary of the data.
Spectrum processing:
Processing option: All elements analysed.
Number of iterations = 5
Standard:
C CaCO3
O SiO2
Al Al2O3
Ti Ti
Table 3.
Elemental composition of ceramic membrane.
Table 3.
Elemental composition of ceramic membrane.
| Element |
Weight% |
Atomic% |
| C K |
4.50 |
7.26 |
| O K |
51.60 |
62.54 |
| Al K |
21.49 |
15.45 |
| Ti K |
36.44 |
14.75 |
4.1.3. Ftir Spectrum Analysis
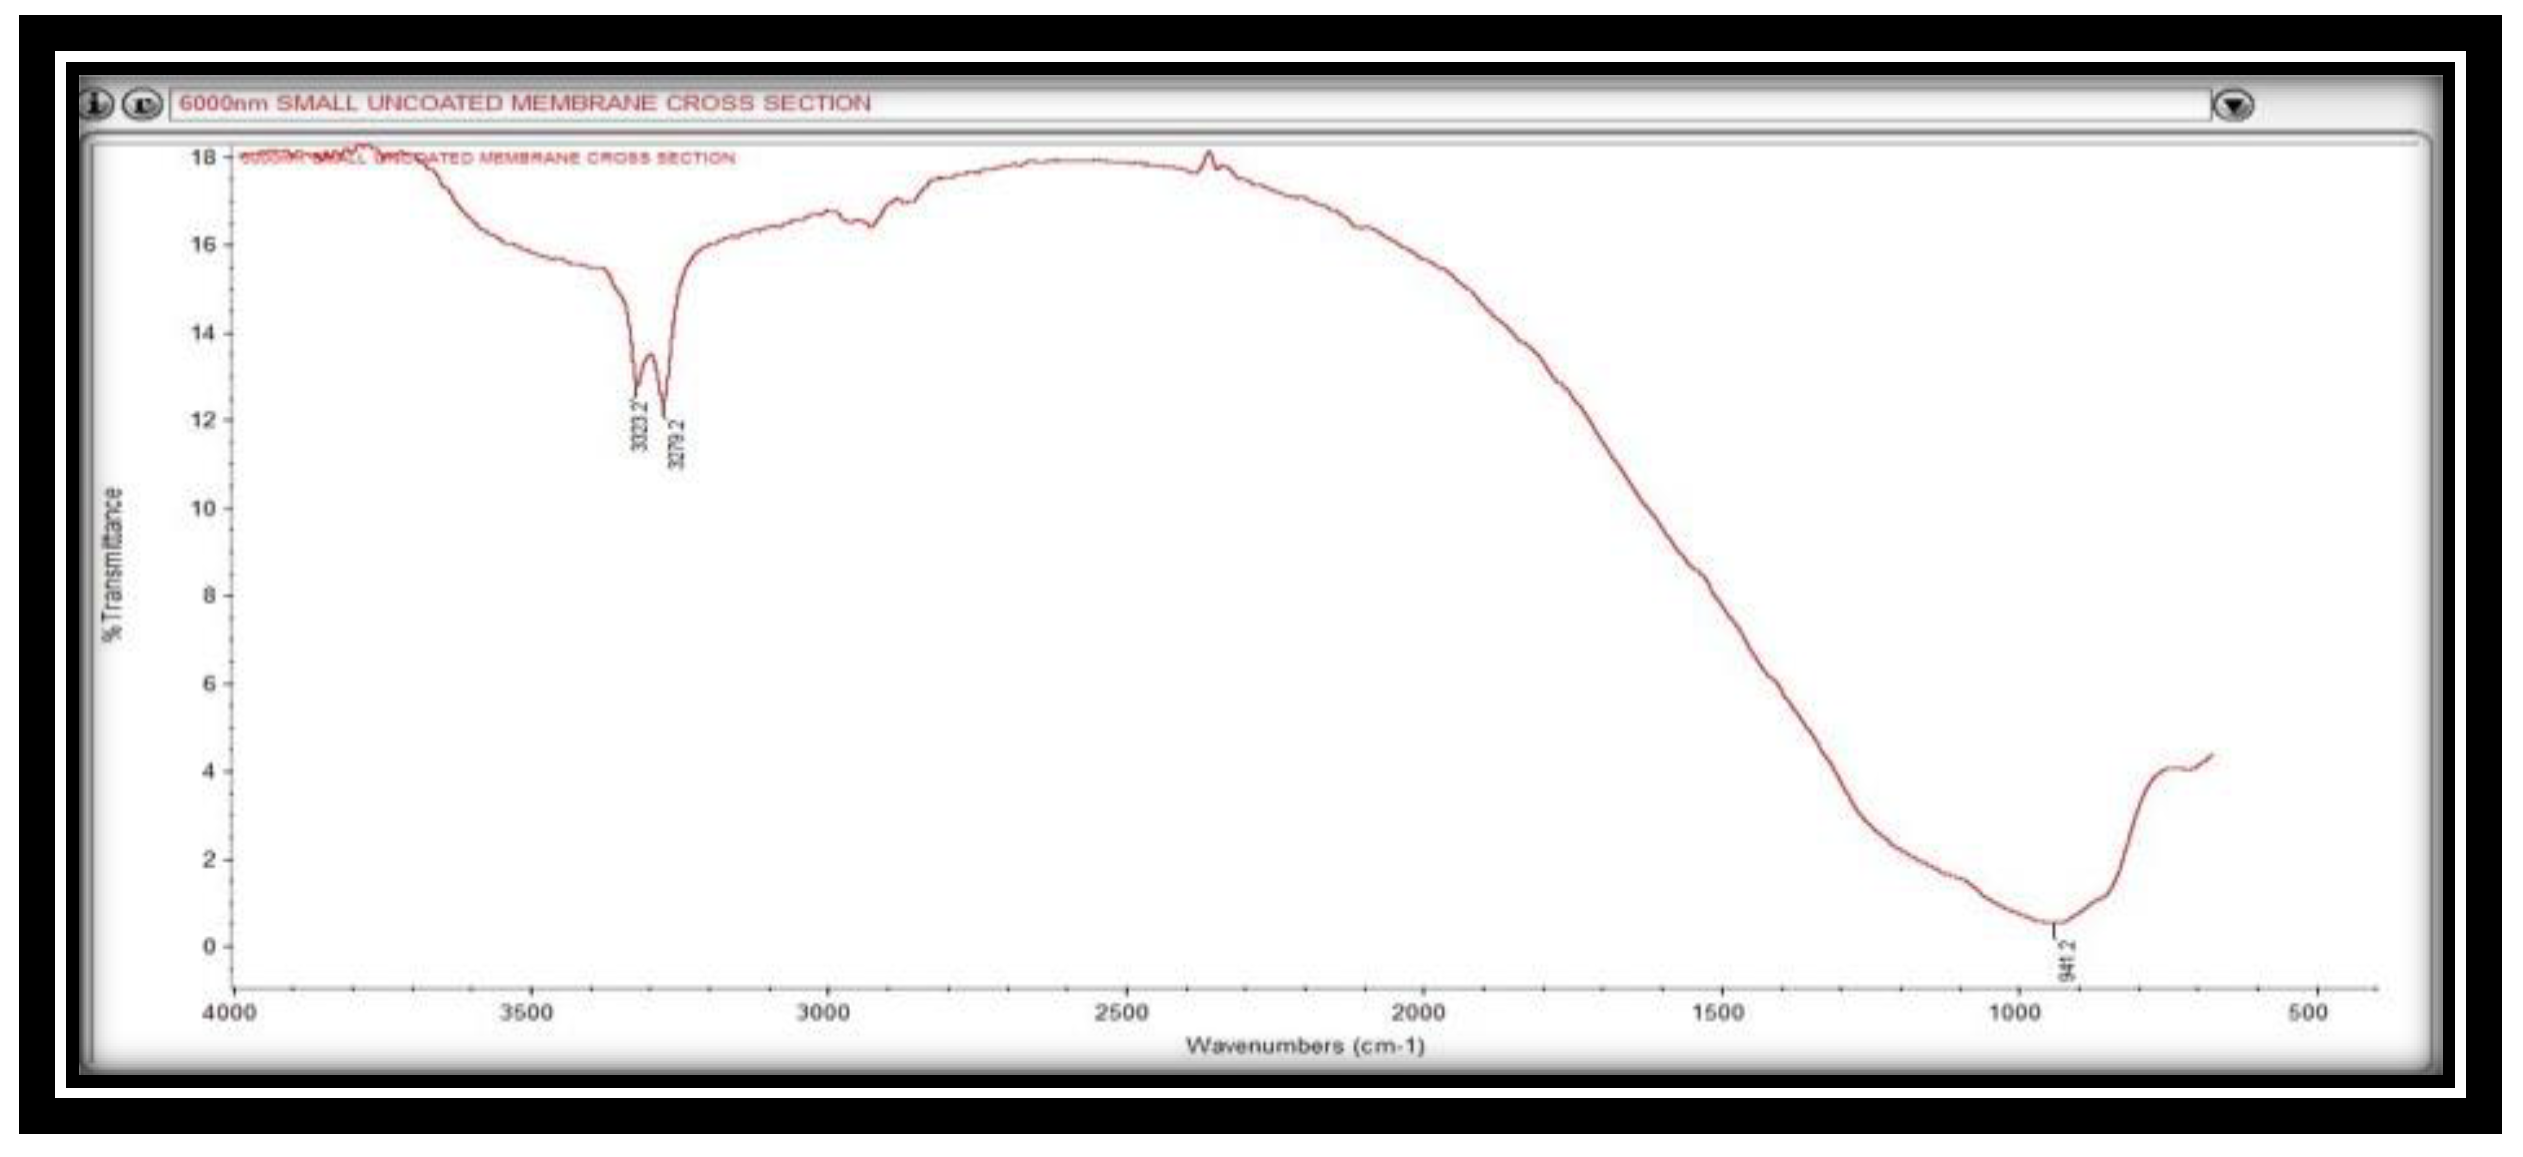
Figure 7 depicts the FTIR spectrum of the alumina support. Three separate bands have been found within this spectrum. The bands at 3323.2 and 3279.2 cm
-1 confirms the presence of C=O functional groups, whereas the band at 941.2 cm
-1 indicates the presence of CH functional groups. These functional groups might be derived from the aluminium oxide concentration of the support material.
4.2. Effect of Wettability and Surface Free Energy on Ceramic Membranes for Direct Air Carbon Capture
The impact of wettability and surface free energy is thoroughly investigated. The sessile drop technique, which involves a direct measurement of the tangent angle at the point of three-phase equilibrium at the interface, stands out among the extensively used approaches for determining contact angles. By monitoring the drop profile, the contact angle is established, allowing an evaluation of wetting qualities for solid surfaces.Surface properties are especially important in the selection of suitable pre-treatment procedures and operating settings for various membrane-based separation processes. As a result, determining a membrane's hydrophilicity or hydrophobicity is an important part of surface characterization. The wetting properties of a membrane material's surface have received a great deal of study from both fundamental surface science and practical application perspectives. These properties have a significant impact on the membrane's qualities and performance during separation procedures.
The words "hydrophilicity" and "hydrophobicity" are often used to characterise the tendency of water molecules to spread across the surface of a substrate. An uneven secondary force governs the interaction of water molecules with a surface following drop impact, resulting in adhesion. The contact angle is a measurement of this interaction that corresponds with the surface energy of materials. If a surface's contact angle with water is less than 90 degrees, it indicates a proclivity to become wet or develop a thin hydration layer (water-attracting).
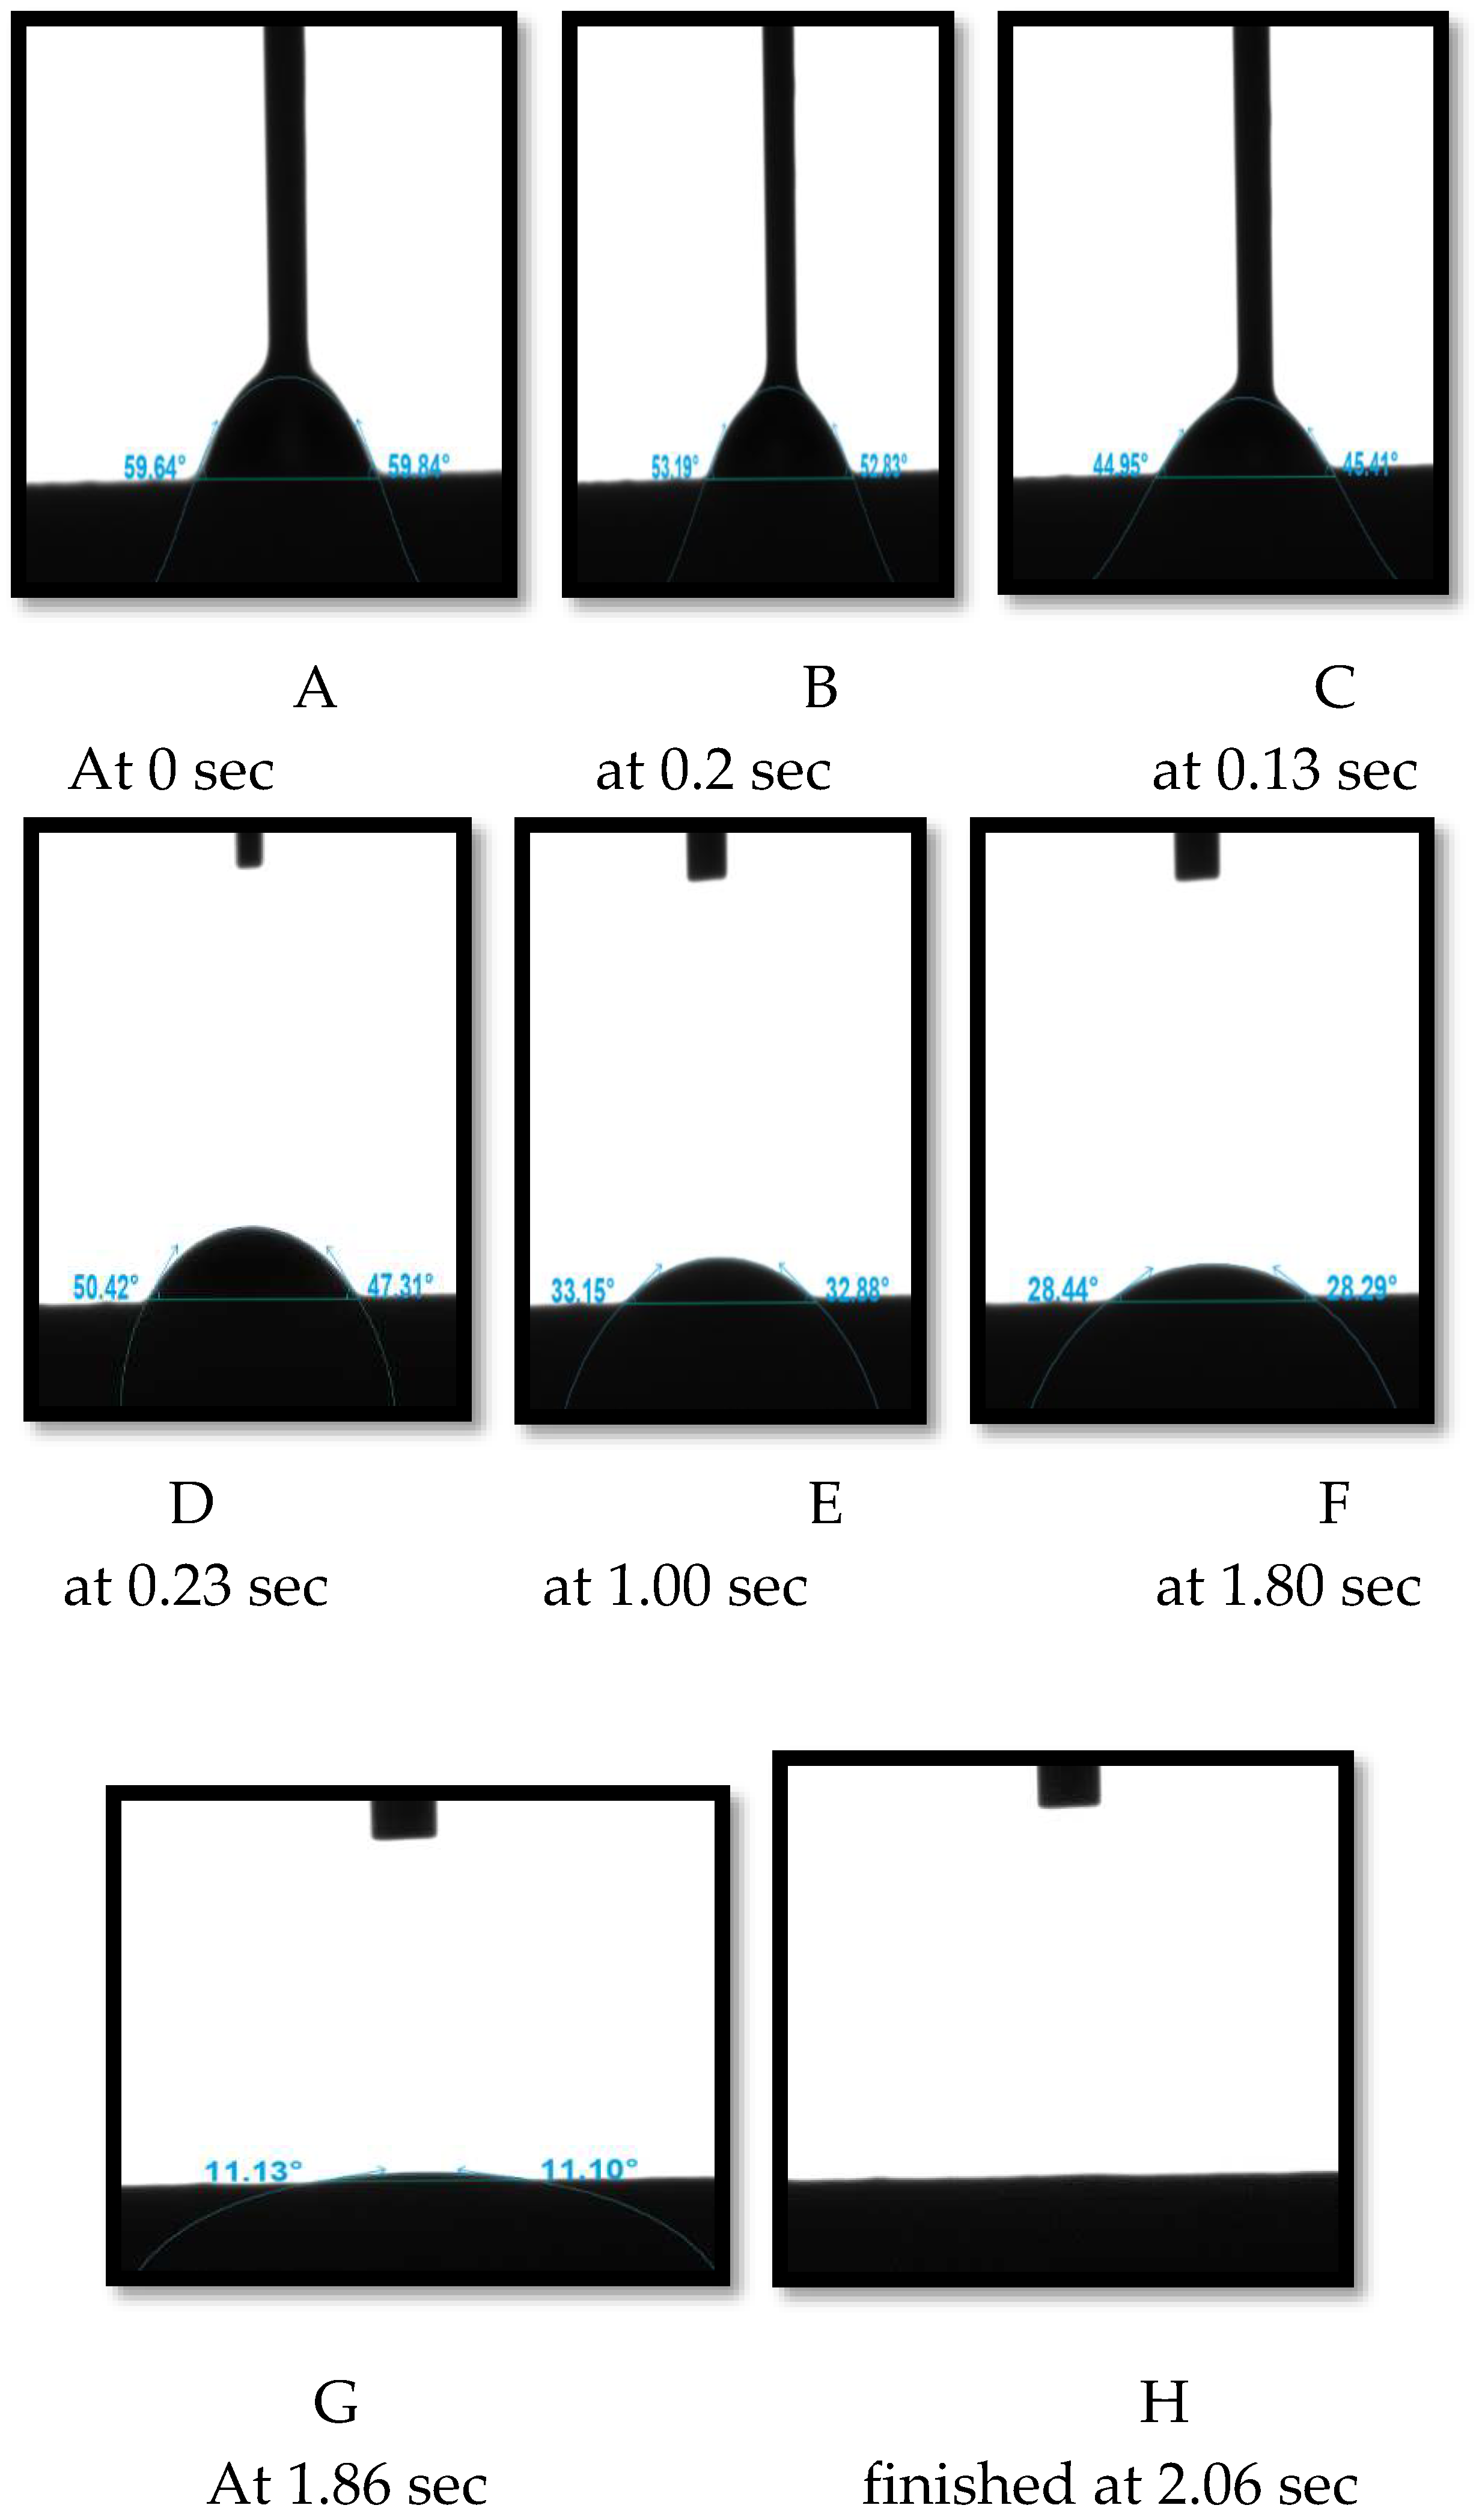
As an example, the contact angle value averaged 59.74 soon after the liquid was put onto the ceramic membrane approximately at 0 sec(see
Figure 8A). This contact angle decreased over time as the liquid interacted with the surface of the ceramic membrane. For example, the average contact angle value dropped to 53, 49, 45, 33, 28 and 11.16 approximately at 0.2, 0.13, 0.23, 1, 1.8, 1.86 seconds respectively into the first contact (see
Figure 8B–G). The liquid was completely absorbed in around 2 minutes and 6 seconds (as shown in
Figure 8H). These findings indicate that the ceramic membranes utilised are hydrophilic, or water-attracting.
Contact angle tests are a common method for measuring surface energy. This approach includes measuring the contact angle of a surface with several liquids, most often water, and then computing the surface free energy based on these measurements and the surface tension of the liquids. Contact angle measurements, used in practical applications, automate this analysis using equation-based approaches. The surface free energy (SFE) of a solid surface provides important information about how different liquids interact with the ceramic membranes utilised.
Table 2 shows the surface free energy values obtained from contact angle measurements, with the sample giving a value of 67.98. Based on these observations, it may be deduced that the surface free energy of the ceramic membrane indicated a possible interaction with water.
In essence, the wetting characteristics and surface free energy of the ceramic membrane have significant influences on its performance in processes such as Direct Air Carbon Capture.
4.3. Results And Discussion
4.3.1. Gas Permeation Experimental Results4.3.2. Pressure Dependence of CO2, N2, O2 Gas Fluxes
The behaviour of gas flow over the ceramic barrier is unique. This distinguishing feature was determined by calculating the flow J (mol m-2 s
-1), with the governing equation written as follows:
where J represents the gas flux across the membrane in mol/s m², reflecting the ratio of gas flow rate to the membrane's surface area, which was determined to be 3.112.
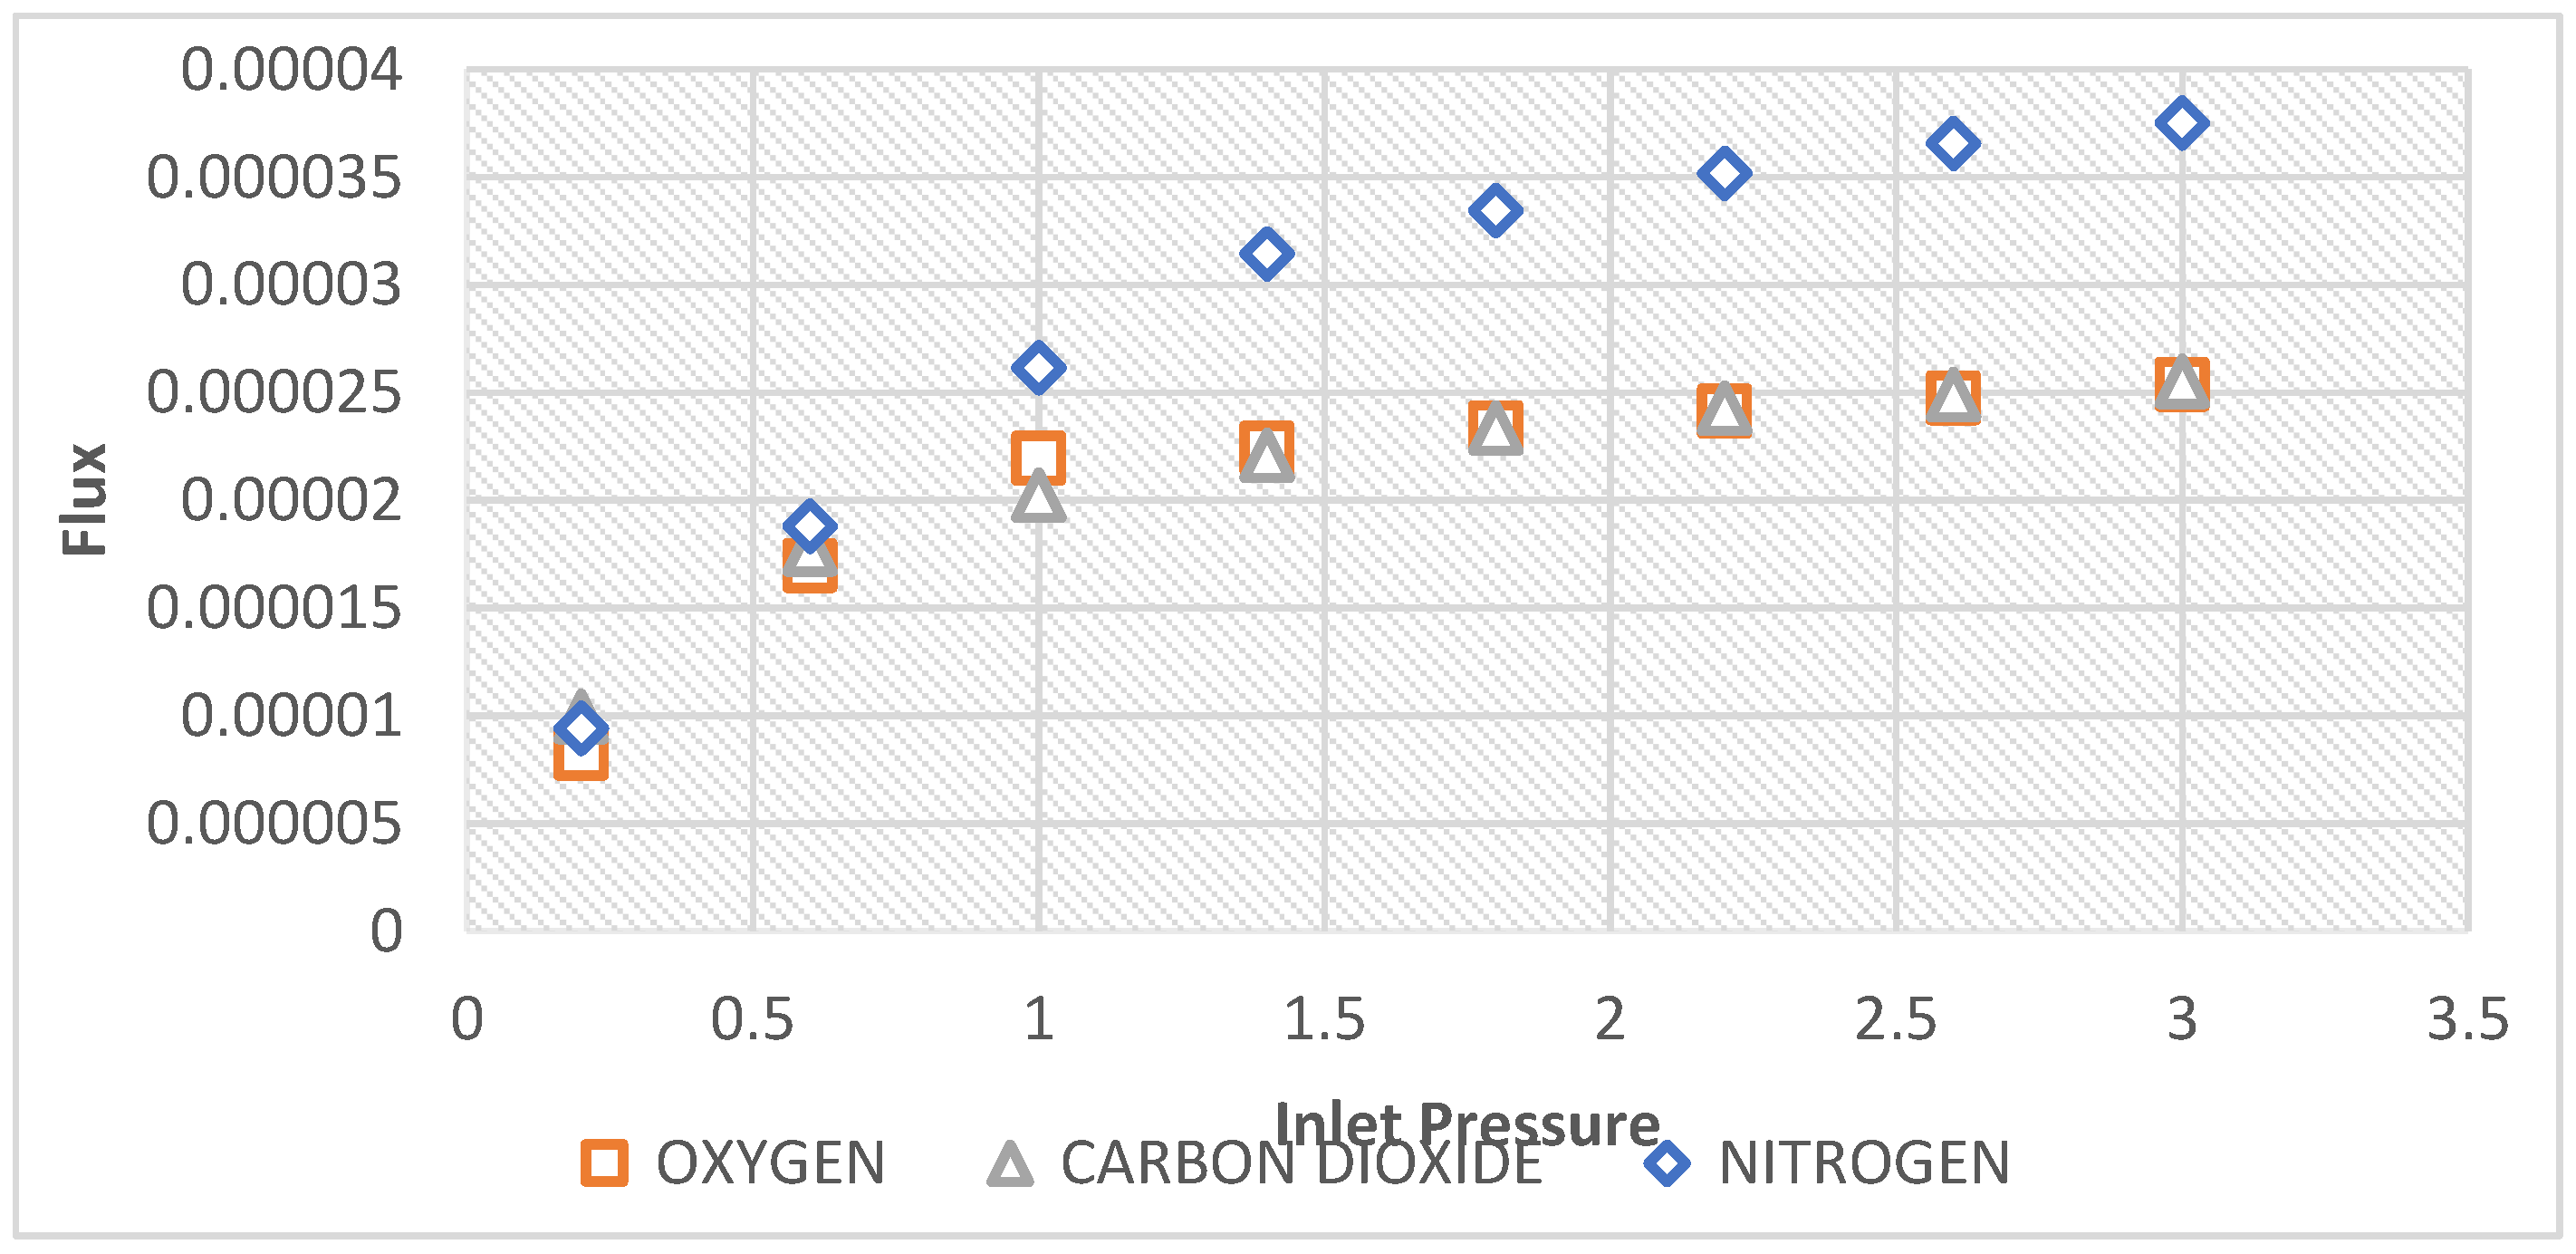
Figure 9 depicts the plot of the flow rate of CO
2, O
2 and N
2 gases versus inlet pressure. It can be observed that Nitrogen gas permeated faster with increase in feed pressure through the unmodified ceramic inorganic membrane more than the other two single gases, O
2, and CO
2. O
2 which has a molecular weight of 32 had the lowest flow rate. The high flow rate of Nitrogen however is attributed to its relatively smaller molecular weight in comparison to the other gases which affords its better mobility within the pore network of the membrane as illustrated below:
Flow rate: N2 > CO2 > O2
Molecular weight: CO2 > O2 > N2.
Accordingly, from 0.6 bar, Nitrogen gas which has a molecular weight of 28 had the highest flow rate with increase of inlet pressure up to 3 bars while O
2 of a higher molecular weight of 32 attained the second flow rate while CO
2 of a molecular weight 44 had the lowest flow rate confirming the predominance of Knudsen flow mechanism in the separation process occurred. This also shows that the flow is molecular weight dependent.
Figure 9 also attest the membrane effectiveness with respect to the gasses that permeate faster than the others through the membrane. Generally, the less selective membrane, the more permeable membrane it could be.
4.4. Effect of Pressure Dependence of CO2, N2, and O2, Gas Permeance at 200C
Permeability and perm-selectivity parameters are frequently used to quantify inorganic ceramic membrane performance. Permeability is defined as the flow normalised against the pressure difference and membrane thickness (mol m. m
- 2 s 1 pa), respectively, to determine the permeability. their permeance, Q (mol m
- 2 s 1 Pa
- 1), was calculated. From the following expression, gas permeance was calculated:
where Q is the permeance (mol m
-2 s
-1 pa
-1); F is the molar flow (mol/sec.); A is the membrane area (m
2); and P is the pressure differential (Pa) across the membrane.
Effect of pressure dependence of CO
2, N
2, O
2, gas permeance at 20
0c, is shown in
Figure 10. Oxygen has the lowest permeance at all pressure except at 1 bar, where in CO
2 falls below Nitrogen, whereas Nitrogen had the highest. According to Pandey and Chauhan 2001, who claimed that there is an inverse relationship between permeance and molecular weight, validating Knudsen flow mechanism, this phenomenon can be attributed to their respective molecular weights. Nitrogen (N
2) permeance was higher than both of CO
2 and Oxygen (O
2). As a result, only high permeance separation membranes with realistic size and pressure conditions may be considered of as a practical alternative for DAC [
6].
In this case, there is need to modify the ceramic membrane used to increase the permeance of CO
2. Due to the modified membrane using a new flow mechanism, it is anticipated that the permeance of CO
2 will rise with membrane alteration. The
Figure 10 show a flow did not show a consistent with Knudsen flow for an unaltered membrane at pressures greater than 0.2 bar. N
2 > CO
2 > O
2.
4.5. Results and Discussion
Membrane Knudsen Selectivity Results
Knudsen selectivity is the ration of the flow rate of different gasses as given by
Where Sxy is the Knudsen selectivity of x to y; Qx is the flow rate of x gasses; Qy is the flow rate of y gasses.
For the investigated temperature and pressure range,
Table 1 compare the experimental selectivity to the theoretical Knudsen selectivity. Equation (5) provides the theoretical selectivity of component x over y.
where My is the molecular weight of O
2, N
2, and M
x is the molecular weight of the target gas, CO
2 in this example. Both Equations (5) and (6) generate Knudsen selectivity that is identical.
The experimental and theoretical CO
2 selectivity over O
2 and N
2 at various pressures is shown in
Table 2. Overall, the experimental Knudsen selectivity of CO
2 gas relative to O
2 and N
2 decreased as intake pressure increased; nevertheless, the greatest experimental CO
2 selectivity was obtained at lower pressures.
Table 1 and the picture that follows depict this pattern.
At 0.2, 0.6, 1.00, 1.4, 1.8, 2.2, and 3.00 bar, the CO
2 selectivity over O
2 was found to be 1.20, 1.04, 0.92, 0.98, 1, 1.01, 1.01, and 1.01, respectively. At the same inlet pressures and temperatures, the experimental CO
2 selectivity over N
2 was 1.06, 0.94, 0.77, 0.70, 0.69, 0.69, 0.68, and 0.68. The theoretical Knudsen selectivity, on the other hand, was 1.17 and 1.25, respectively (see
Table 2). These findings show that the existing membrane structure must be modified to capture CO
2 directly from the air. Modifications such as membrane pore size might be investigated to improve Knudsen selectivity even more. Alternatively, using modified membranes with a molecular sieving separation mechanism might be beneficial for gas separation applications, especially for off-gases. It should be noted that different flow techniques may be required to successfully separate these gases.
5. Conclusions
Because of its reduced cost, simpler setup and operation, and lesser environmental effect, membrane technology is one of the most widely used techniques for absorbing CO2. SEM analysis is utilized for particle characterization. From the SEM analysis it can be understood that, across the whole surface of the ceramic membrane, the particles are spread evenly. The ceramic membrane's surface is smooth and free of cracks. Energy Dispersive X-ray Analysis (EDAX) was used to determine the elemental compositions of the alumina support and silica membrane. An analysis of the contact angle reveals crucial information on the hydrophilicity and hydrophobicity of the membrane surface. The data indicated that the ceramic membranes were used are hydrophilic, or water loving. The surface free energy results obtained via contact angle measurement. The sample’s results, is 67.98, Based on the results is believed that the surface free energy of the ceramic membrane is high and is suggest that it could interact with water. Effect of pressure dependence of CO2, N2, and O2, gas fluxes via the ceramic membrane support at temperatures of 200c, was studied. Since He has a smaller molecular weight (4.00) than other molecules, it therefore recorded the highest flux, as seen in the graphs. The lowest flux was reported by CO2. Effect of pressure dependence of CO2, N2, and O2, gas permeance at 200c, was investigated. The results showed carbon dioxide has the lowest permeance, whereas helium had the highest. In this case, there is need to modify the ceramic membrane used to increase the permeance of CO2. The findings show that the degree of penetration of the relevant gases is influenced by the direction of fluid flow, by studying the gas flow using the Knudsen Number. Both the experimental Knudsen selectivity and theoretical Knudsen selectivity was investigated. It can be concluded that, the outcomes are reasonably attainable. This suggests that the membrane requires a modification to capture CO2 directly from N2, and O2. To further improve the Knudsen selectivity, variables like as temperature and membrane pore size should be decreased.
Author Contributions
For research articles with several authors, a short paragraph specifying their individual contributions must be provided. The following statements should be used “Conceptualization, Idris Hashim. and Habiba methodology, Idris Hashim. and Habiba formal analysis, Idris Hashim. Investigation, Idris Hashim. Resources, Habiba.; writing—original draft preparation, Idris Hashim writing—review and editing, Muktar Ramalan, and Flurence Aisueni and Priscilla Ogunlude visualization, Ayo Giwa and James Njuguna supervision, Mamdud hossain and Aditiya funding acquisition, Habiba and Ayo Giwa.
Funding
In addition: we warmly acknowledge the sponsorship from Petroleum Trust and development Fund, Nigeria. And McAlpha, Canada for their support.
Acknowledgments
Sincere appreciation is extended by the author to the School of Life Sciences at Robert Gordon University for providing the SEM and EDXA observations as well as to the Centre for Process Integration and Membrane Technology of Robert Gordon University for providing the fresh membrane used in the study. In addition, we warmly acknowledge the sponsorship from Petroleum Trust and development Fund, Nigeria. And McAlpha, Canada for their support.
Conflicts of Interest
Declare conflicts of interest or state “The authors declare no conflict of interest”.
References
- APADULA, F. et al., 2019. Thirty years of atmospheric CO2 observations at the Plateau Rosa Station, Italy. Atmosphere, 10(7), pp.
- Arrhenius, S. XXXI. On the influence of carbonic acid in the air upon the temperature of the ground. London, Edinburgh, Dublin Philos. Mag. J. Sci. 1896, 41, 237–276. [Google Scholar] [CrossRef]
- Bai, H.; Ho, W.W. New sulfonated polybenzimidazole (SPBI) copolymer-based proton-exchange membranes for fuel cells. J. Taiwan Inst. Chem. Eng. 2009, 40, 260–267. [Google Scholar] [CrossRef]
- Bounaceur, R.; Lape, N.; Roizard, D.; Vallieres, C.; Favre, E. Membrane processes for post-combustion carbon dioxide capture: A parametric study. Energy 2006, 31, 2556–2570. [Google Scholar] [CrossRef]
- Fu, L.; Li, J.; Wang, G.; Luan, Y.; Dai, W. Adsorption behavior of organic pollutants on microplastics. Ecotoxicol. Environ. Saf. 2021, 217, 112207. [Google Scholar] [CrossRef]
- FUJIKAWA, S. et al., 2019. Ultra-fast, selective CO2 permeation by free-standing siloxane nanomembranes. Chemistry Letters, 48(11), pp. 1351. [Google Scholar]
- IPCC, A. , 2013. Climate change 2013: the physical science basis. 1535. [Google Scholar]
- Kumar, S. , Dang, T.D., Arnold, F.E., Bhattacharyya, A.R., Min, B.G., Zhang, X., Vaia, R.A., Park, C., Adams, W.W., Hauge, R.H. and Smalley, R.E., 2002. Synthesis, structure, and properties of PBO/SWNT Composites&. Macromolecules, 35(24), pp.9039-9043.
- Picard, C.; Larbot, A.; Sarrazin, J.; Janknecht, P.; Wilderer, P. Ceramic membranes for ozonation in wastewater treatment. Ann. de Chim. Sci. des Matériaux 2001, 26, 13–22. [Google Scholar] [CrossRef]
- Ping, Y.; Yang, S.; Han, J.; Li, X.; Zhang, H.; Xiong, B.; Fang, P.; He, C. N-self-doped graphitic carbon aerogels derived from metal–organic frameworks as supercapacitor electrode materials with high-performance. Electrochimica Acta 2021, 380. [Google Scholar] [CrossRef]
- Qi, W.; Fu, K.; Chen, X.; Qiu, M.; Fan, Y. Falling liquid-film on hydrophilic porous ceramic membrane for boosting CO2 absorption. Sep. Purif. Technol. 2022, 303. [Google Scholar] [CrossRef]
- Rezaei, M.; Ismail, A.; Hashemifard, S.; Bakeri, G.; Matsuura, T. Experimental study on the performance and long-term stability of PVDF/montmorillonite hollow fiber mixed matrix membranes for CO2 separation process. Int. J. Greenh. Gas Control. 2014, 26, 147–157. [Google Scholar] [CrossRef]
- Yu, X.; An, L.; Yang, J.; Tu, S.-T.; Yan, J. CO2 capture using a superhydrophobic ceramic membrane contactor. J. Membr. Sci. 2015, 496, 1–12. [Google Scholar] [CrossRef]
- Zou, L.; Liu, Y.; Wang, Y.; Hu, X. Assessment and analysis of agricultural non-point source pollution loads in China: 1978–2017. J. Environ. Manag. 2020, 263, 110400. [Google Scholar] [CrossRef] [PubMed]
|
Disclaimer/Publisher’s Note: The statements, opinions and data contained in all publications are solely those of the individual author(s) and contributor(s) and not of MDPI and/or the editor(s). MDPI and/or the editor(s) disclaim responsibility for any injury to people or property resulting from any ideas, methods, instructions or products referred to in the content. |
© 2023 by the authors. Licensee MDPI, Basel, Switzerland. This article is an open access article distributed under the terms and conditions of the Creative Commons Attribution (CC BY) license (https://creativecommons.org/licenses/by/4.0/).

