Preprint
Article

Modification of Genes Expression of Tomato Plants through Foliar Flavonoids Application in Relation to Enhanced Growth

Altmetrics

Downloads

71

Views

49

Comments

0

A peer-reviewed article of this preprint also exists.

  † These authors have contributed equally to this work.

This version is not peer-reviewed

Submitted:

16 October 2023

Posted:

16 October 2023

You are already at the latest version

Alerts
Abstract
The exogenous application of phenolic compounds is increasingly recognized as a valuable strategy for promoting growth and mitigating the adverse effects of abiotic stress. However, the biostimulant effect under optimal conditions have not been thoroughly explored. In this study, we investigated the impact of foliar application of flavonoids, specifically Crop Bio Life (CBL), on tomato plants grown under controlled conditions. Our study focused on determining growth parameters, such as cell size, and assessing the concentration of hormones. Principal component analysis (PCA) from all physiological variables were determined. Additionally, we utilized high-throughput mRNA sequencing technology and bioinformatic methodologies to robustly analyze the transcriptomes of tomato leaves regulated by flavonoids. The findings revealed that CBL primarily influenced cells enlargement, leading to increased growth. Furthermore, CBL-treated plants exhibited higher concentrations of the hormone zeatin but lower concentrations of IAA. Moreover, RNAseq analysis indicated that CBL-treated plants required increased mineral transport and water uptake, as evidenced by gene expression patterns. Genes related to pathways such as fatty acid degradation, phenylpropanoid biosynthesis, and ABC transporters showed regulatory mechanisms governing internal flavonoid biosynthesis, transport, and tissue concentration, ultimately resulting in higher flavonoid concentrations in tomato leaves.
Keywords: 
Subject: Biology and Life Sciences  -   Plant Sciences

1. Introduction

The changing environmental conditions coupled with the growing need for sustainable agriculture to ensure future food security, have been intensified during the last years. Therefore, the importance of application of biostimulants in agricultural practices is increasing. The incorporation of biobased products, including organic agriculture, employing biofertilizers, and implementing biocontrol methods, represents a significant step forward in achieving global food security sustainably [1]. Among these sustainable strategies, plant biostimulants have gained increasing attention in recent years for their potential to enhance crop productivity and resilience. These biostimulants include a diverse range of substances that, when applied to plants, promote growth and development. In this context, the tomato plant (Solanum lycopersicum L.) stands out as a key subject of study by the wide economic importance of the crop. Tomato is not only a globally significant crop but also a model organism for studying plant responses to various biostimulants and stressors [2].
Flavonoids, a class of secondary metabolites produced by plants, have emerged as promising candidates to act as biostimulants. Due to their relatively low molecular weight, they play integral roles in fundamental plant physiological functions and exhibit protective effects against environmental changes [3]. While previous research has primarily explored their in vitro antioxidant properties [4], recent studies have revealed their high capacity for maintaining homeostasis and regulating growth. For instance, enhanced accumulation of flavonols has been linked to the regulation of stomatal movement, facilitating concurrent photosynthesis and water uptake and transport [5]. Additionally, studies have demonstrated significant correlations between stomatal density, elevated levels of phenolic compounds and flavonoids, increased antioxidant activity, elevated chlorophyll levels, and enhanced photosynthesis [6]. Understanding the multifaceted roles of flavonoids in plant physiology, including their potential as biostimulants, is necessary. However, research on the external application of flavonoids to plants has been limited. In a recent study, we determined that foliar external application of phenolic compounds had potential to enhance plant growth by optimizing the exchange of CO2 and water in tomato leaves, thus positively influencing photosynthesis and transpiration. Also, this exchange of water and CO2 at the cellular level was linked to the activation of aquaporins, which can induce morphological changes, including an increase in leaf stomatal density [7].
Hormonal regulation has been highlighted as a potential target for biostimulants to promote higher crop yields. For instance, the bioactive form of auxin (IAA) facilitates vegetative growth through processes such as cell expansion, cell differentiation, morphogenesis, and organogenesis. Cytokinins play a crucial role in cell division and in establishing source-sink relations within the plant [31]. In fact, it has been reported that these phytohormones and their croos-talk play a pivotal role in determining agricultural productivity [8]. Furthermore, all the aforementioned processes are highly linked to the regulation of gene expression, adding further complexity to the mode of action of the biostimulants.
Due to progress in omics sciences, significant strides have been made in recent years towards investigating the modes of action of plant biostimulants. In this sense, RNA sequencing technology, which efficiently enables the study the global gene expression patterns in plants, stands out as the most comprehensive option for understanding the molecular mechanisms through which biostimulants influence plant growth. This technology provides deep insights into how biostimulants can modulate the expression of genes related to plant growth and development, contributing to a more complete understanding of their molecular-level functioning [9].
In this study, we investigate the effects of externally applied flavonoids as a novel bioestimulant (CropBiolife, CBL) on the growth and leaf cell size of tomato plants under hydroponic conditions. Our research focuses on elucidating how flavonoid treatment affects hormone concentrations. Additionally, we conduct an in-depth RNA-seq analysis to explore modifications in gene expression profiles resulting from CBL treatment. By addressing these key aspects, we aim to unravel the tripartite interactions among flavonoid-based biostimulants, hormonal regulation, and gene expression, providing valuable insights into their potential as tools for enhancing tomato plant growth and productivity.

2. Materials and Methods

2.1. Experimental design and culture conditions

Seeds of tomato (Solanum licopersicum L. cv Marmande from Ramiro Arnedo, Spain) were pre-hydrated with de-ionised water and aerated continuously for 24 h. After this, the seeds were germinated in vermiculite, in the dark at 28 °C, for three days. Then, the seedlings were transferred to a controlled-environment chamber with a light-dark cycle of 16-8 h, a temperature of 25-20 °C and relative humidity of 60-80%. Photosynthetically-active radiation (PAR) of 400 μmol m−2 s−1 was provided by LEDs (Pacific LED, WT 470 C, LED8OS/840 PSD WB L1600 lights, Philips). Then, they were transferred to hydroponic conditions in 16-L containers (6 plants in each) filled with Hoagland’s solution, pH 5.5. The solution was continuously aerated and changed every week. The composition of the solution was: 6 KNO3, 4 Ca(NO3)2, 1 KH2PO4, and 1 MgSO4 (mM), and 25 H3BO3, 2 MnSO4, 2 ZnSO4, 0.5 CuSO4, 0.5 (NH4)6Mo7O24, and 20 Fe-EDDHA (μM).
After 10 days, a first foliar spray of CBL (CropBiolife, Aussan Laboratories Pty Ltd, Australia, containing 12% of flavonoids) was applied (diluted to 3 ml L-1) to half of the plants and after 5 days, another application of CBL was done. The measurements and samples collection were carried out after 3 days from the second foliar treatment.

2.2. Dry weight

Five plants from each treatment were collected, separating the root from the shoot, and were kept in an oven at 60 °C for 5 days until they were completely dry. After that period of time, the dried plants were weighed. Finally, shoot to root ratio (shoot dry weight (DW)/root DW) was calculated.

2.3. Light optical microscopy preparations and measure of cell area

Section from three leaves from each treatment, all of them of the same size, were cut from the middle to the base of the leaf (growth zone), including the midrib. Immediately, the sections were immersed in a fixative solution of 2% (v/v) glutaraldehyde in 0.1 M phosphate buffer (pH 7.2) under vacuum for 1 hour until the sections sank and then for 12 hours at 4 °C. Subsequently, the samples were dehydrated in a gradual series of acetone-water (10% steps from 30 to 90%, each for 60 minutes, 100% for 180 minutes, and finally 100% overnight). The dehydrated samples were embedded in Epon-812 resin. Semi-thin cross-sections (500 nm) were obtained using a motorized microtome RM 2155 LEICA. Finally, the sections were affixed to slides and stained with 1% toluidine blue. Micrographs were obtained using a camera (Altra 20 Olympus UCMAP3) attached to an Olympus CKX41 microscope. The area of cells in the collenchyma, mesophyll (palisade parenchyma and lacunar parenchyma), and epidermis was measured using the open-access image processing software Fiji/Image J (https://imagej.nih.gov/ij/).

2.4. Hormones extraction and analysis

Deep-frozen ground leaf samples (0.1 g) at -80 °C were extracted, from three plants for each treatment, with 500 µl of a solvent solution of methanol:isopropanol:acetic acid (25:24.5:0.5) and sonicated for 30 min with vortex every 10 minutes. Subsequently, the samples were centrifuged for 5 minutes at 16,000 x g at 4 °C, collecting the supernatant and re-extracting the pellets with 250 µl of solvent solution. Finally, the supernatants were filtered through a 0.22 µm diameter pore size PVDF membrane. The separation and analysis of samples were performed with a High-Performance Liquid Chromatography – Mass Spectometry (HPLC-MS) system at the Service of Molecular Biology (SBM) within the Scientific and Technical Research Area (ACTI) of the University of Murcia. The analysis was performed in negative ion-mode on the Agilent 1290 Series II HPLC (Agilent Technologies, Santa Clara, CA, USA) equipped with an Automated Multisampler module and a High Speed BinaryPump, and connected to an Agilent 6550 Q-TOF Mass Spectrometer (Agilent Technologies, Santa Clara, CA, USA) using an Agilent Jet Stream Dual electrospray (AJS-Dual ESI) interface. Experimental parameters for HPLC and Q-TOF were set in MassHunter Workstation Data Acquisition software (Agilent Technologies, Rev. B.08.00). A reverse phase C18 column (Zorbax Eclipse Plus, 2.1 x 10 mm, 1.8 µm) was equilibrated at 25 ºC. The flow rate was 0.4 ml/min and the injection volume 20 µl. The mobile phase consisted of ultrapure water MilliQ + 0.05% acetic acid (A) and acetonitrile + 0.05% acetic acid (B), starting with 1% B and using a linear gradient to obtain 1% solvent B at 1 min. The percentage of solvent B was then increased to 99% at 7 min, 99% at 9 min. Finally, the system returned to the solvent B was reduced to 1 % for the last 5 minutes. Absorbance was recorded at 210, 254, 280, and 320 nm. Data analysis were performed with MassHunter Qualitative Analysis Navigator software (Agilent Technologies, Rev. B.08.00). Following extracted ion chromatograms were analyzed for the corresponding compounds: Indol acetic acid, C10H9NO2, 174.0561 > 130.0650 m/z; and Zeatine, C10H13N5O, 218.1047 > 200.0946 m/z.

2.5. RNA extraction

For RNA extraction, deep-frozen samples of leaf at -80 ºC were used. This process was performed using the NZY Total RNA Isolation kit (NZYtech, Lisbon, Portugal), following the manufacturer's protocol, and using 50 mg of sample. As an additional step, the ground samples were vortexed for 20 seconds after adding the extraction buffer. Possible traces of contaminating DNA were removed with DNase I included in the kit. The concentration and purity of the RNA was quantified with a UV/Vis NanoDrop 1000 microvolume spectrophotometer (Thermo Fisher Scientific, USA), and its integrity was verified by agarose gel electrophoresis . The extracted RNA was stored at ‒80 °C until analysis.

2.6. RNA-Seq analysis and differential expression

The RNA-seq data previously obtained by our laboratory [7] were re-analyzed according to the following protocol. Raw read quality was assessed using FastQC software version 0.11.2 [10], and subsequently subjected to preprocessing for quality and adapter trimming using Trimmomatic Version 0.39 software [11] with default parameters. Trimmed reads were then mapped to the tomato reference transcriptome "ITAG4.0," comprising 34076 protein-coding genes (http://solgenomics.net/), utilizing Hisat2 software [12]. The resulting BAM files were generated using Samtools View software version 1.9 and subsequently sorted by name with Samtools Sort software version 2.0.3. Finally, read counts were derived from alignment files using featureCounts software, a component of the Subread package 1.6.2 [13], with default parameters. This was based on the 'exon' feature within the 'gene_id' meta-feature of GTF annotation files obtained from Soil Genomics (http://solgenomics.net/). Reads with multiple mappings and overlapping regions were excluded from the counting process." Differential gene expression analysis between the control and CBL-treated plants was conducted using the R procedure within the Bioconductor package DESeq2 [14]. Additionally, q-values were adjusted using Benjamini and Hochberg’s approach to control the false discovery rate [15]. Genes with a p-value (q-value) of ≤0.05 and an absolute value of log2 fold change (|log2FC|) of ≥ 2 were considered differentially expressed. Gene Ontology (GO) and Kyoto Encyclopedia of Genes and Genomes (KEGG) analysis were performed to identify the Differentially Expressed Genes (DEGs) enriched in GO terms and metabolic pathways, respectively. To facilitate functional categorization and pathway visualization of DEGs, we utilized the GTF annotation file and Interproscan program [16] for GO term annotation and gene function. The enrichment of DEGs in KEGG pathways and GO analysis was assessed using the ClusterProfile R package [17]. A corrected p-value (q-value of ≤ 0.05 was set as the threshold for significantly enriched GO terms and KEGG pathways.

2.7. Statistical analysis

Statistical analysis was performed using R Studio software [18]. Significant differences between the values from all parameters were determined at p < 0.05, according to a one-way ANOVA, Student’s t-test. All the results are presented as the mean ± SE. R packages FactoMineR [19] and factoextra [20] were used to generate Principal Component Analysis (PCA) results.

3. Results

3.1. Plant growht and cell area

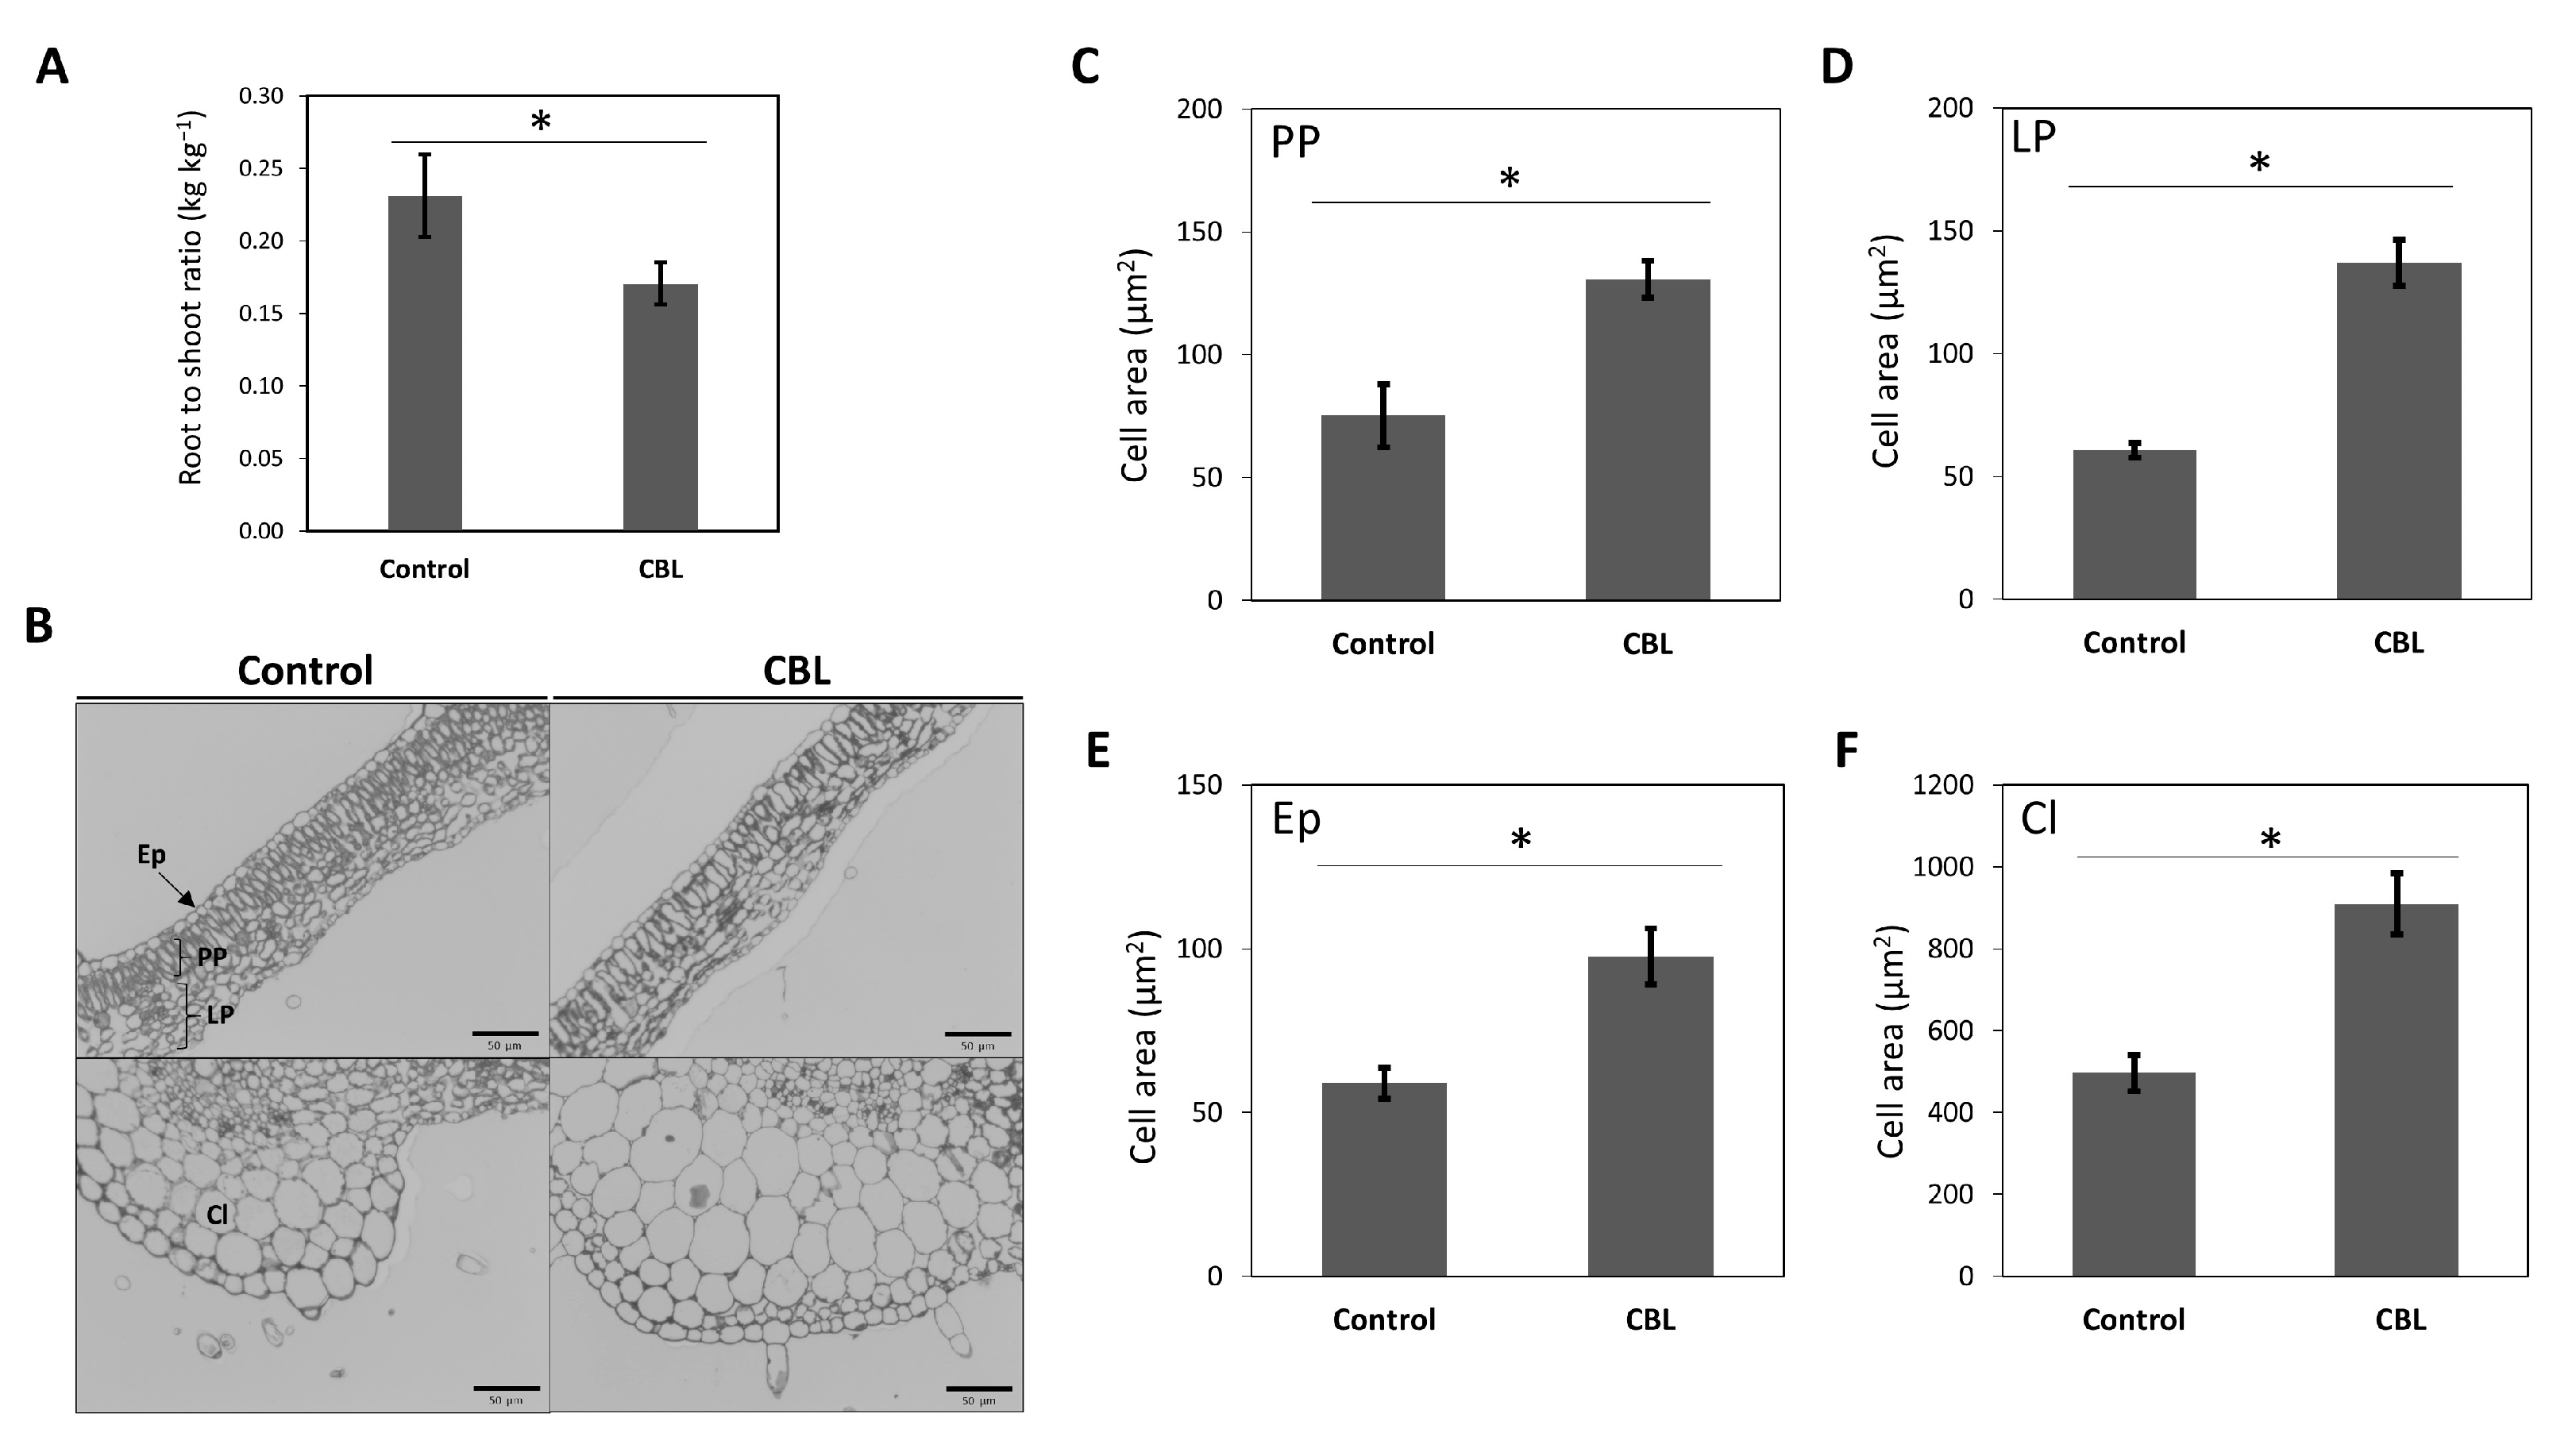
The growth parameters of tomato plants are significantly influenced by the bioestimulant CBL. Consequently, observable changes occurred in the root-to-shoot ratio (RSR) and cell area following treatment. On the one hand, RSR exhibited a statistically significant decrease, indicating vigorous growth in the aerial or productive part of the plants (Figure 1A). On the other hand, microscopic analysis of cell areas in thin sections revealed that cells in the CBL-treated plants were larger than those in the control plants (Figure 1B-F). Various cell types (palisade parenchyma, PP; lacunar parenchyma, LP; epidermis, Ep; collenchyma, Cl) were measured, all of which exhibited significant differences, with cells from leaves treated with CBL showing larger sizes.

3.2. Hormone content

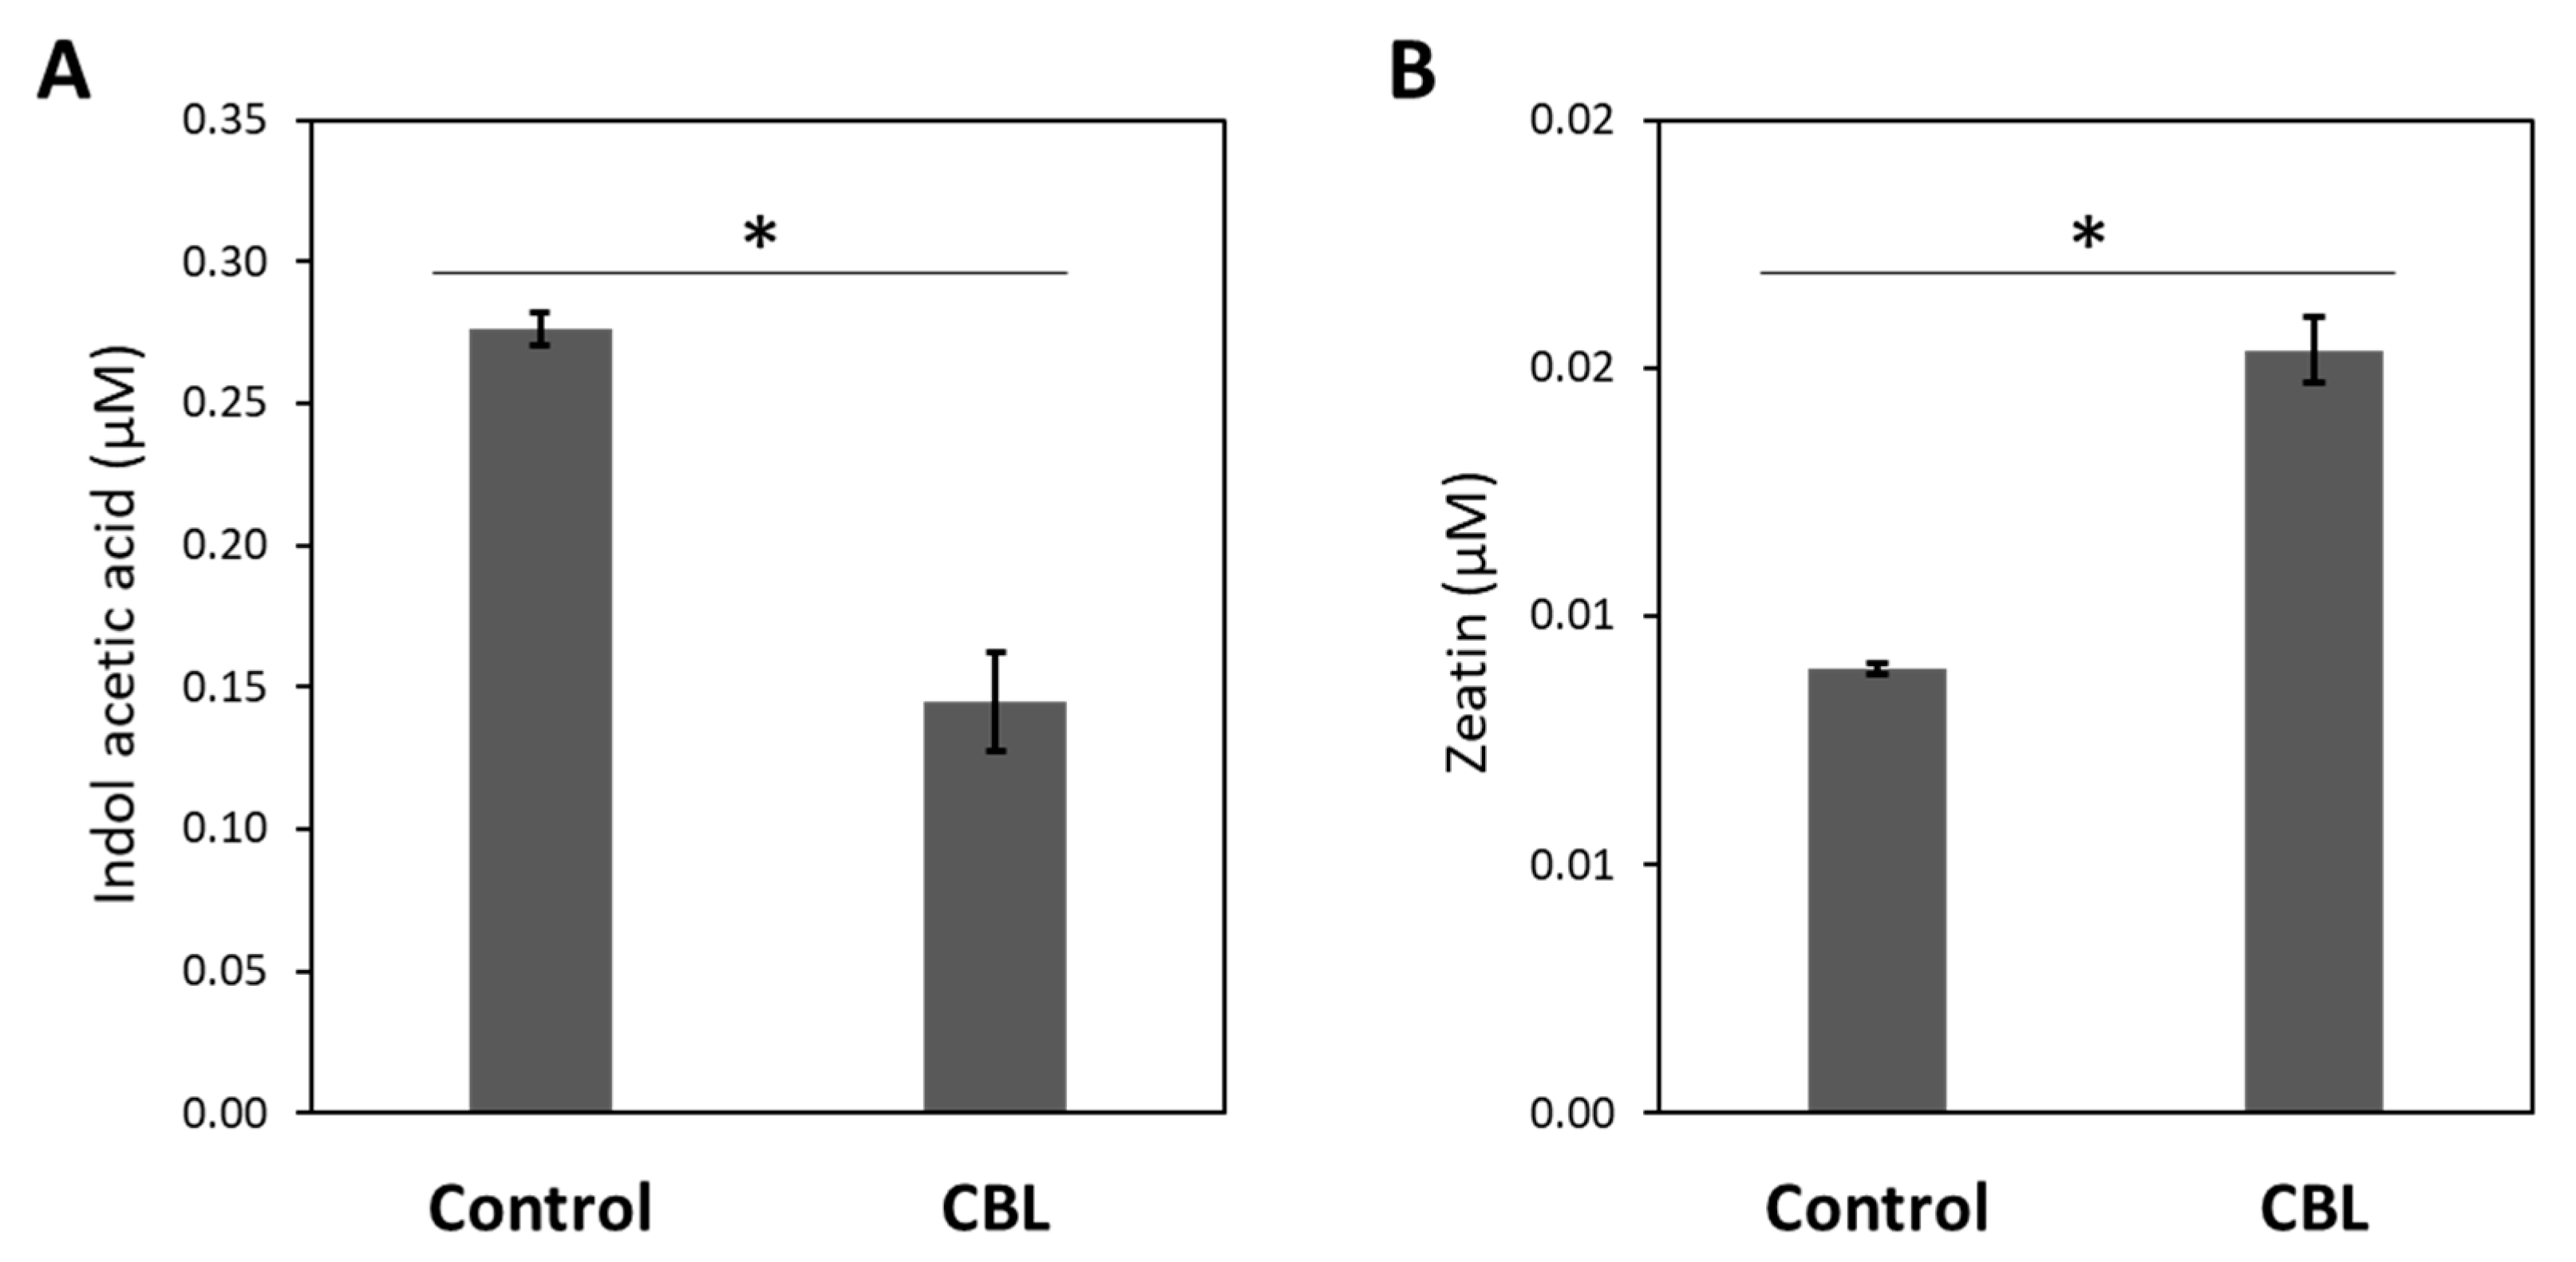
Hormone content, specifically indole acetic acid (IAA) and zeatin concentration, was measured in the leaves of both control tomato plants and those subjected to CBL treatment. The findings depicted inFigure 2 displays that CBL treatment brings about significant alterations in both hormones, with IAA decreasing by 48% (Figure 2A), while zeatin shows a noteworthy increase of approximately 42% (Figure 2B).

3.4. Global plant response

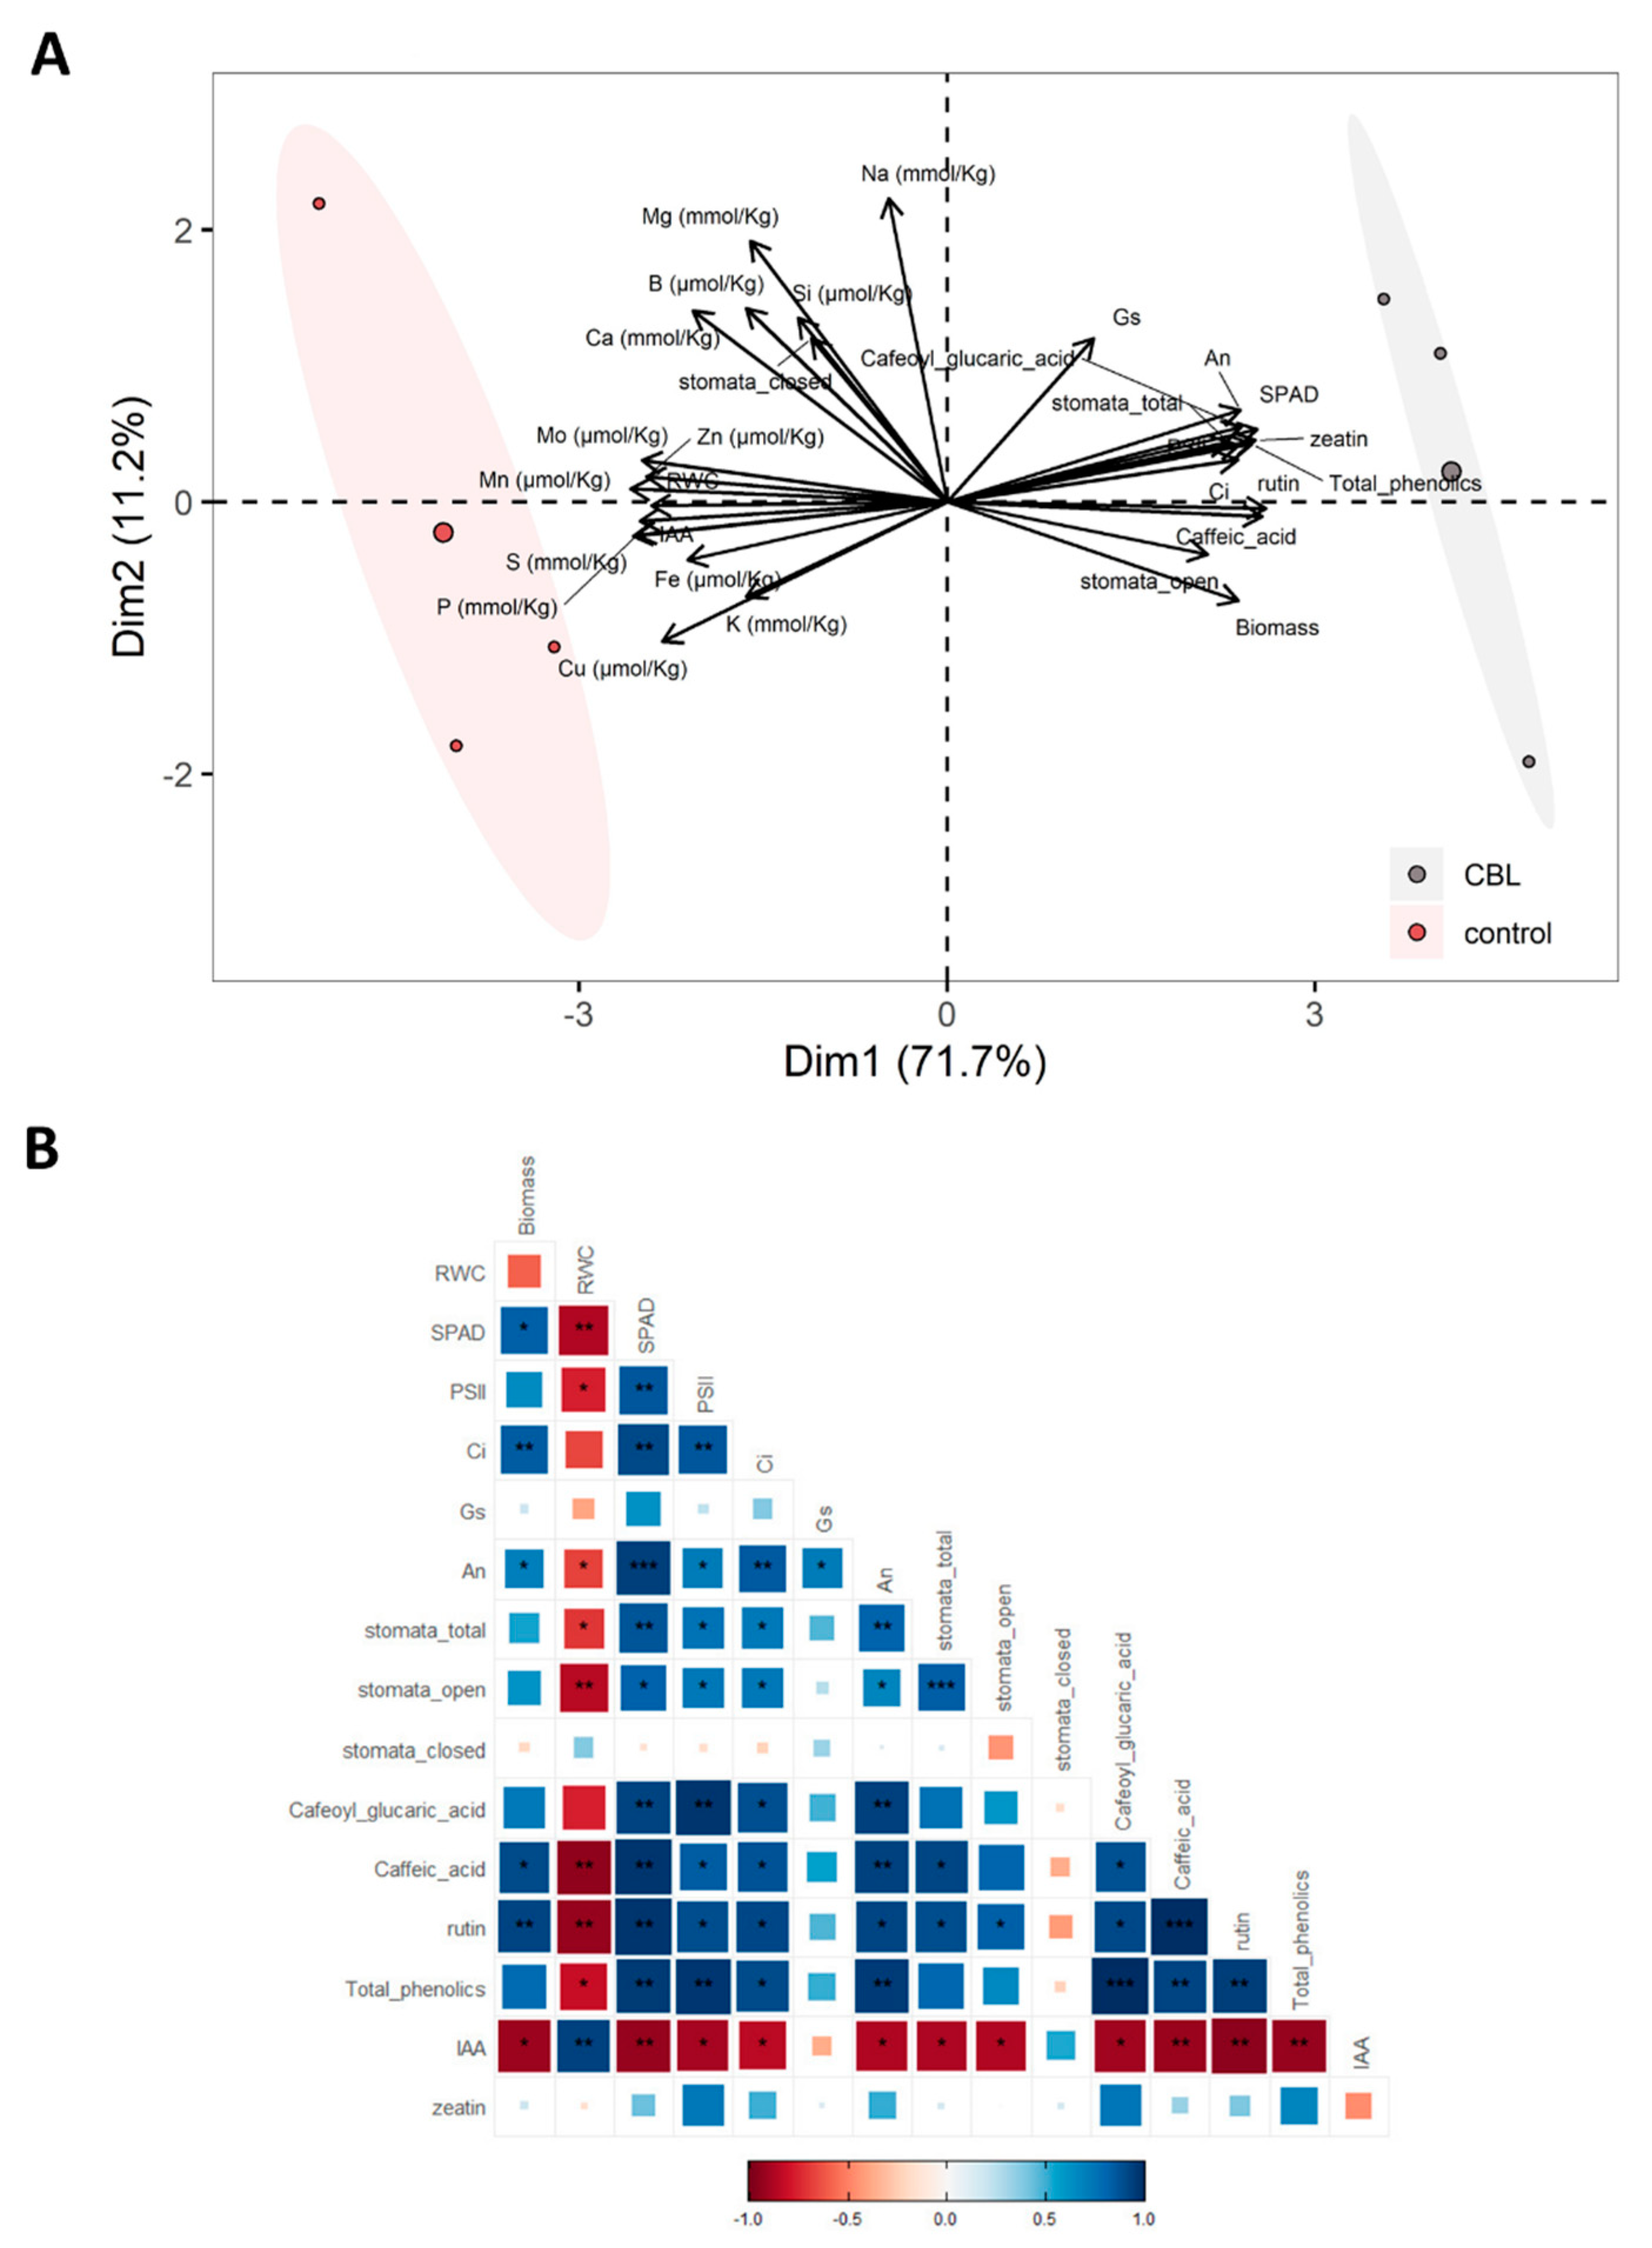
In order to integrate the analyses conducted in this study with those previously published [7], a PCA and a correlation plot were performed (Figure 3). From these multivariate analysis, on the one hand, a clear separation between the control group and the CBL-treated group are shown (Figure 3A). The separation is influenced by the variables that align parallel to the X-axis, along which the two groups are distributed, one to the right and the other to the left. Among these variables, phenolic compounds stand out, showing a positive correlation with CBL-treated plants, as is also the case with photosynthesis and biomass. It is important to note that the two hormones measured in this study, zeatin and auxin, significantly contribute to the separation of the groups. They also align in parallel to the X-axis but in opposite directions. On the other hand, multiple correlations among variables are revealed (Figure 3B). Among these correlations, it is worth noting that IAA correlates negatively with almost all variables, as does RWC. In contrast, total phenolics show positive correlations with the rest of the variables.

3.3. DEGs identification

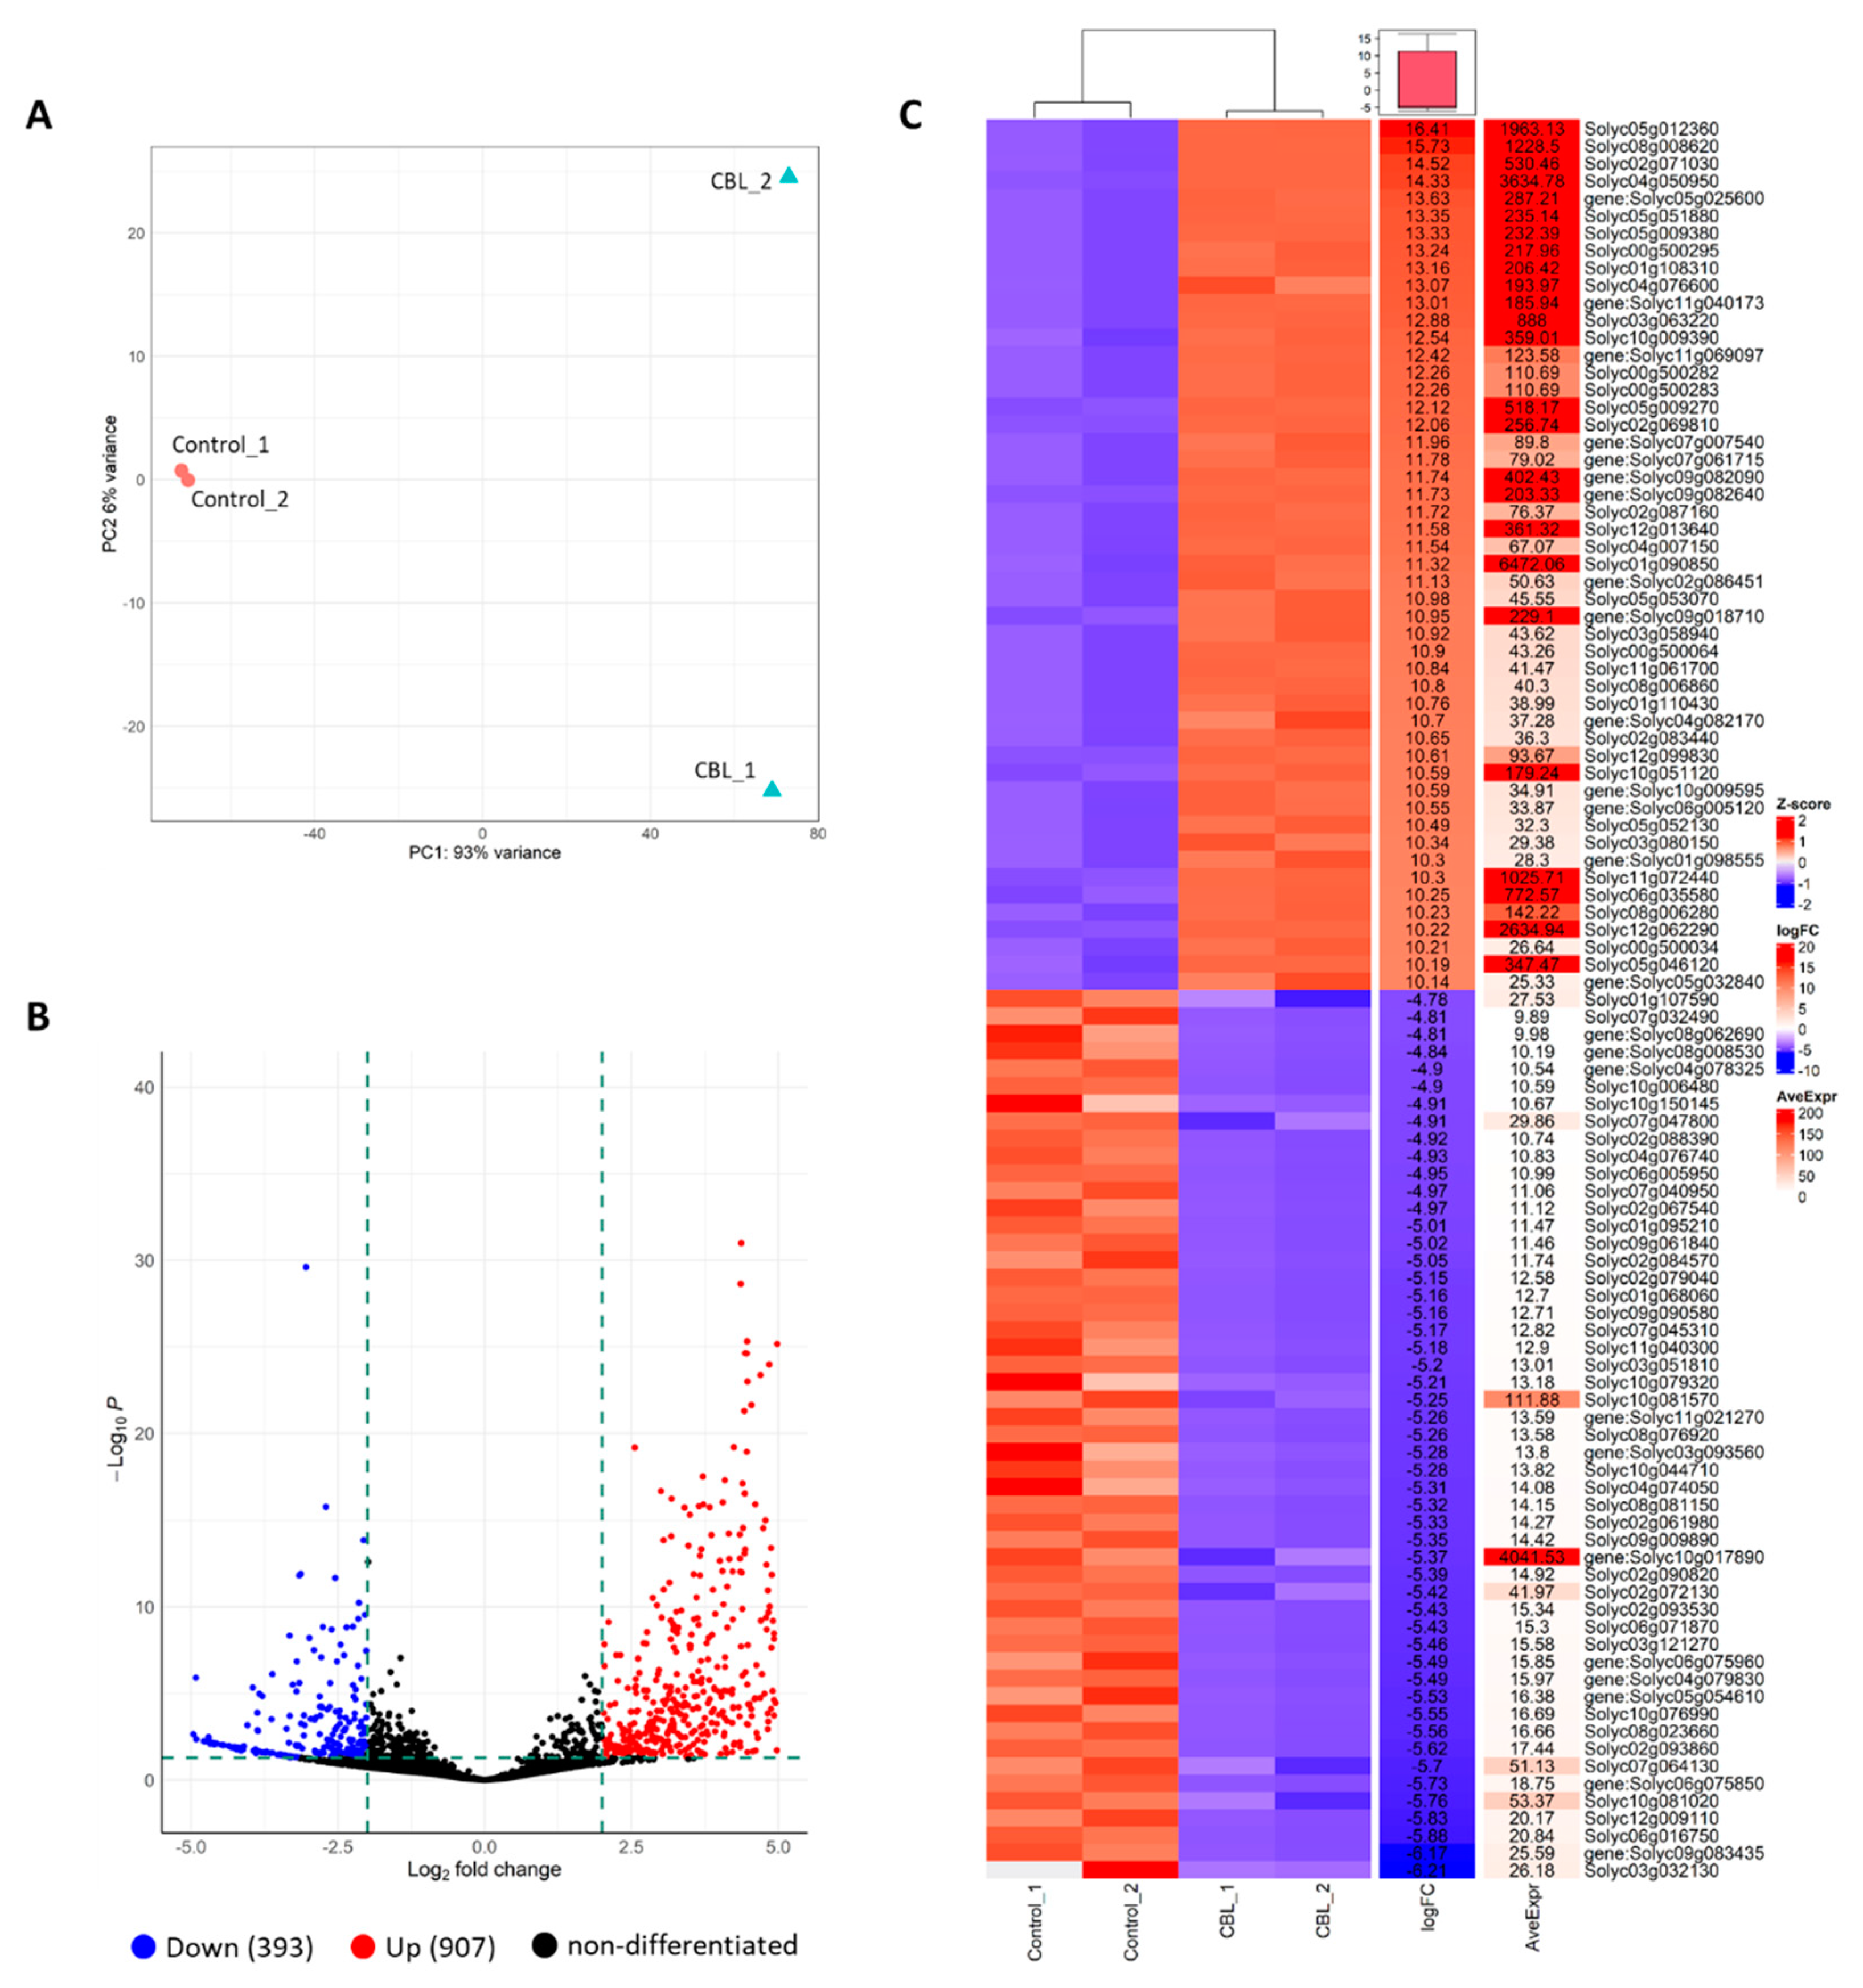
To explore the impact of CBL as a biostimulant, we performed RNA-Seq on tomato plants cultivated under control conditions, with foliar treatment using CBL, and without any treatment. In terms of the RNA-seq data, we assessed the variability among the replicates and across the treatments using a PCA plot (Figure 4A). This analysis revealed a clear clustering of replicates for the control group, while data points for the CBL-treated plants were scattered across the plot.
Moreover, the DEGs CBL vs. control were identified and it was predicted that the genes are involved in the response of plant to bioestimulant. The Volcano plot shows the distribution of DEGs at the threshold level for selection. Among 1300 DEGs, 907 and 393 were up- and down-regulated in CBL vs. control, respectively (Figure 4B).
In addition, a heatmap from the 50 most expressed genes is shown in Figure 4C. The aggregated data heatmap analysis summarizes the responses of tomato plants to CBL application. This analysis identified two main clusters, corresponding to control and CBL-treated plants. In addition to the relative gene expression in each group, the fold change (logFC) of CBL vs. Control is shown, highlighting the average expression (AveExpr), which allows for the identification of the most highly expressed genes in the analyzed samples.

3.4. Functional Annotation and Enrichment of DEGs

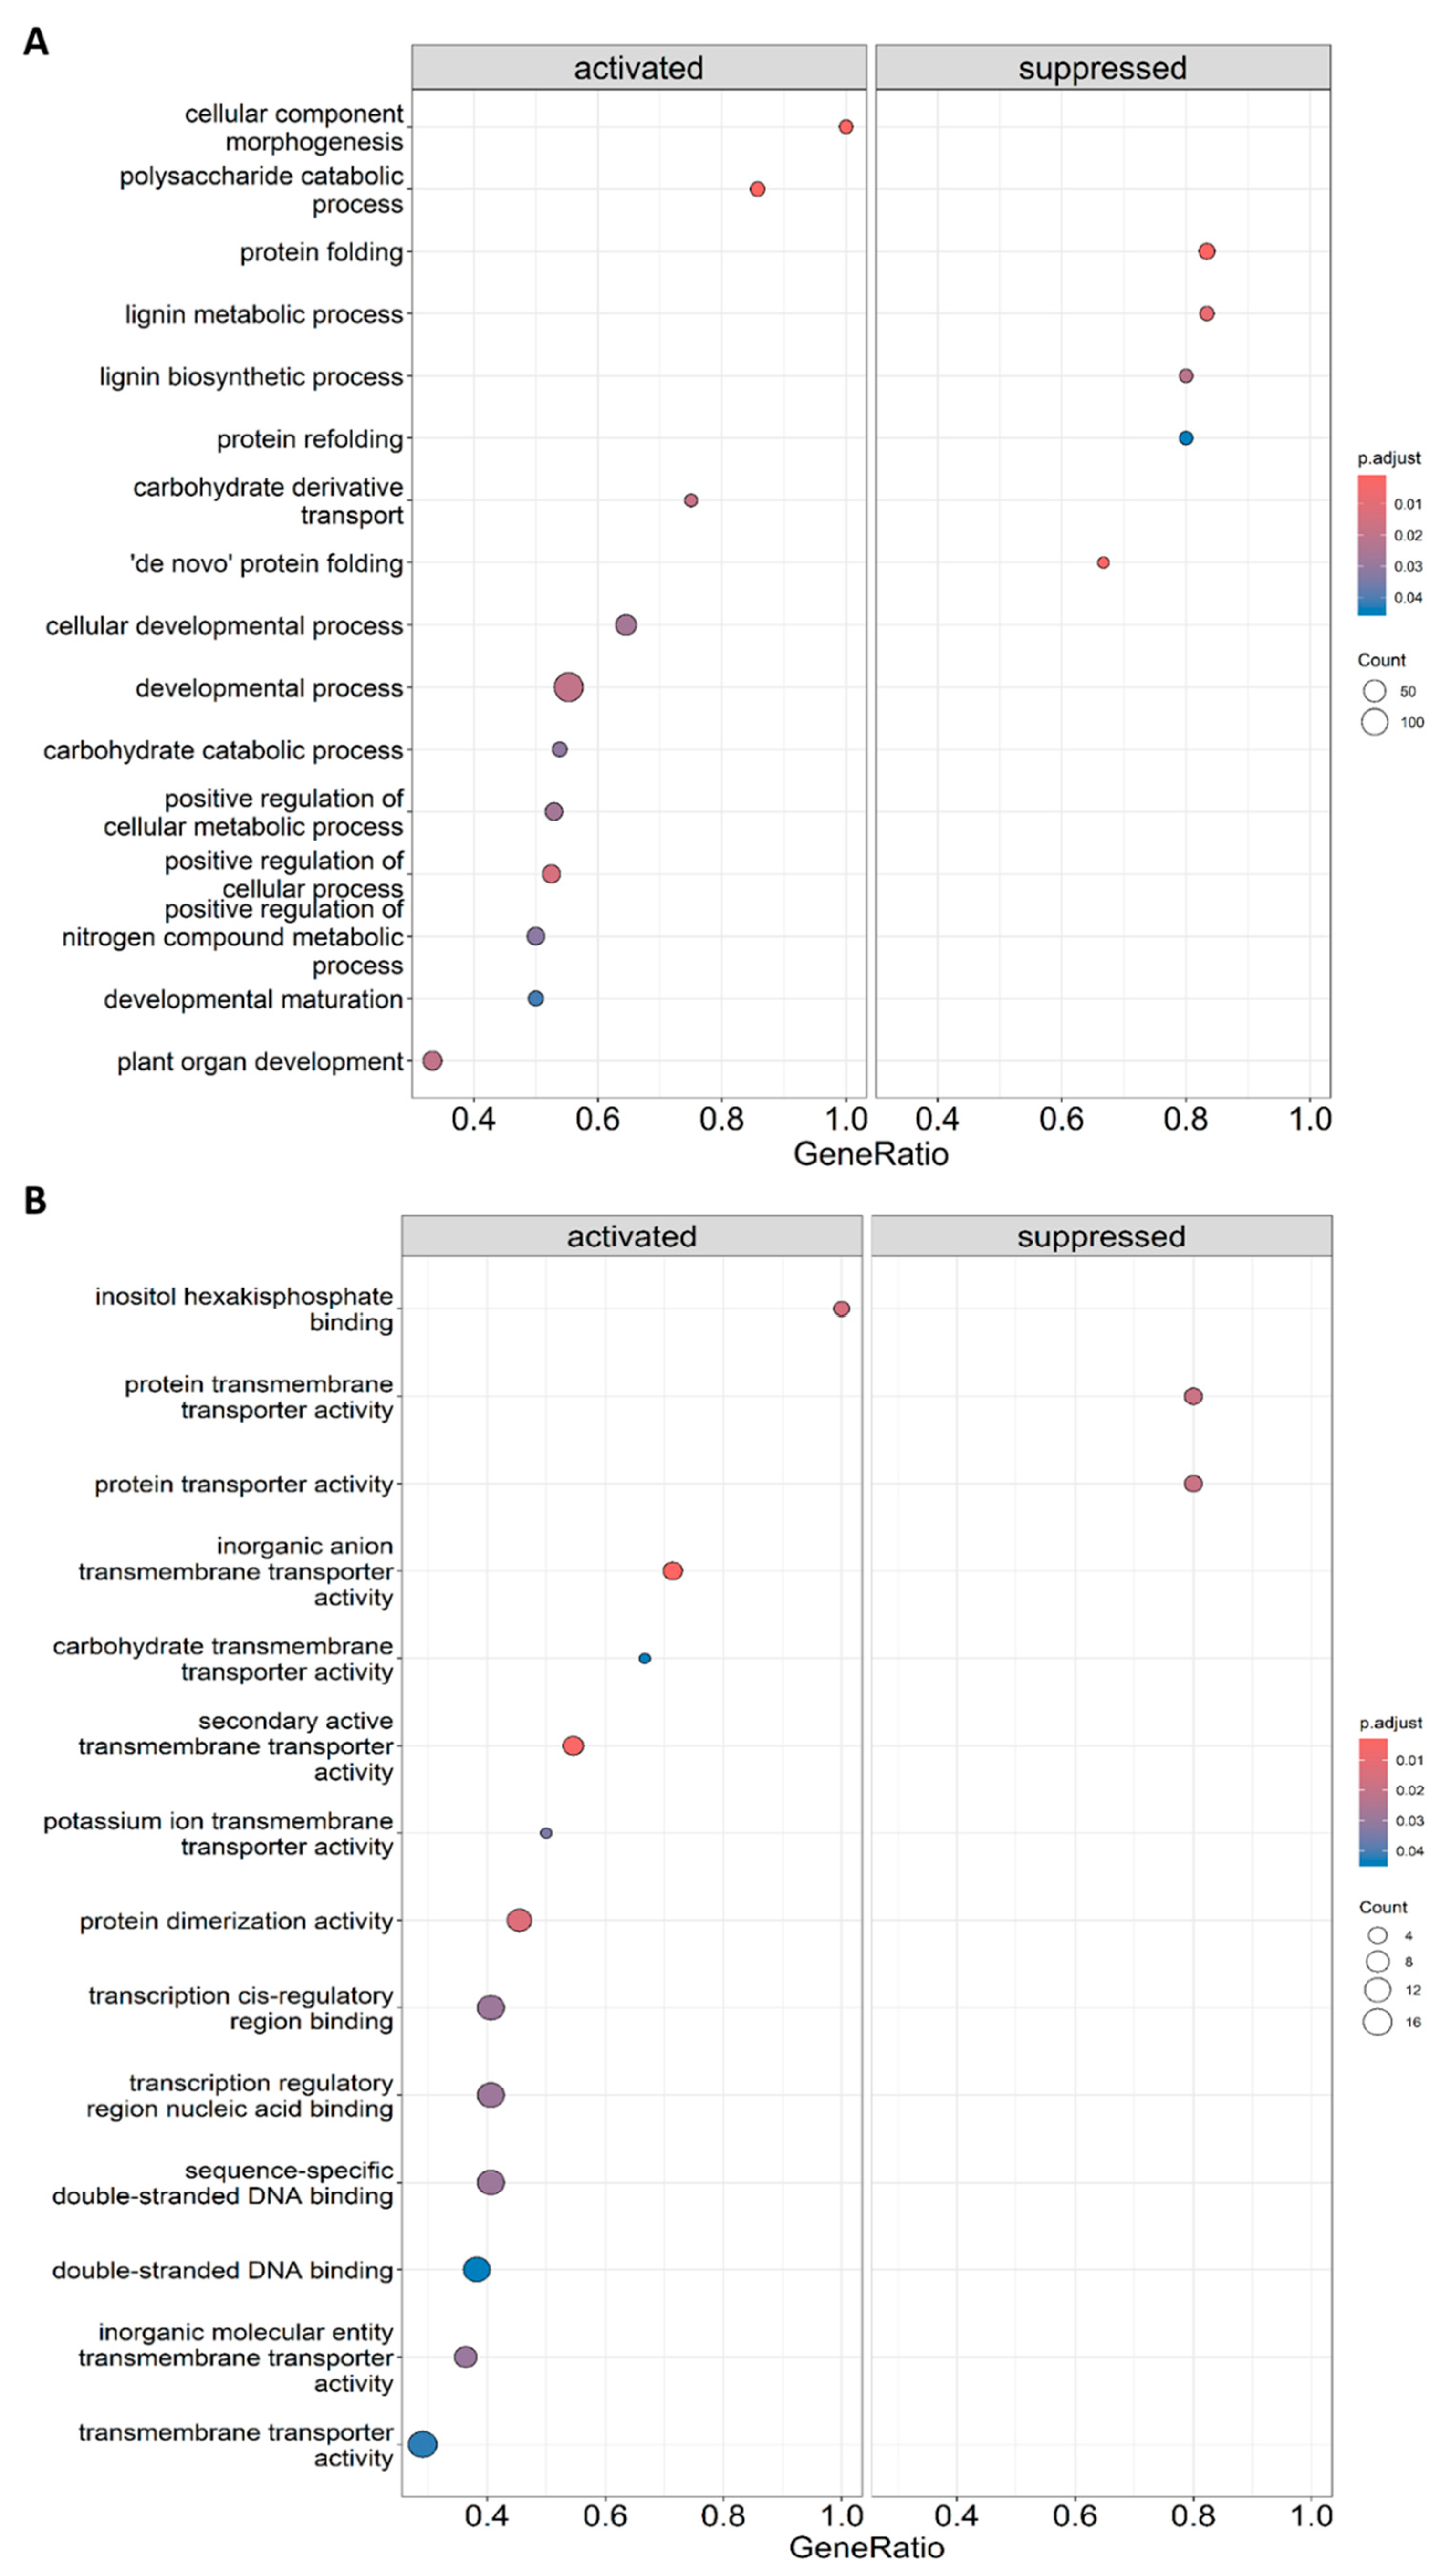
In order to understand the functional implications of the gene expression alterations induced by the biostimulant CBL treatment, we conducted a functional annotation and enrichment analysis of the DEGs using Gene Ontology (GO) terms. In both the Biological Process (BP) and Molecular Function (MF) categories, we observed various terms enriched in CBL-treated plants (Table S1). Some of the terms related to development and growth plants were plotted in Figure 5 to provide a better undestanding of the effects caused by CBL treatment. Among the activated BP terms, we identified "developmental process", "carbohydrate catabolic process", "positive regulation of cellular metabolic process", and "plant organ development". Additionally, we observed suppressed terms such as "protein folding", "protein refolding", "de novo protein folding", "lignin metabolic process", and "lignin biosynthetic process" (Figure 5A). On the other hand, in the MF category, we found several activated terms primarily related to transport activities, including "inorganic anion transmembrane transporter", "secondary active transmembrane transporter", "potassium ion transmembrane transporter", and terms related to binding activities, such as "transcription cis-regulatory region binding", "nucleic acid binding", "inositol binding", and "DNA binding" (Figure 5B).
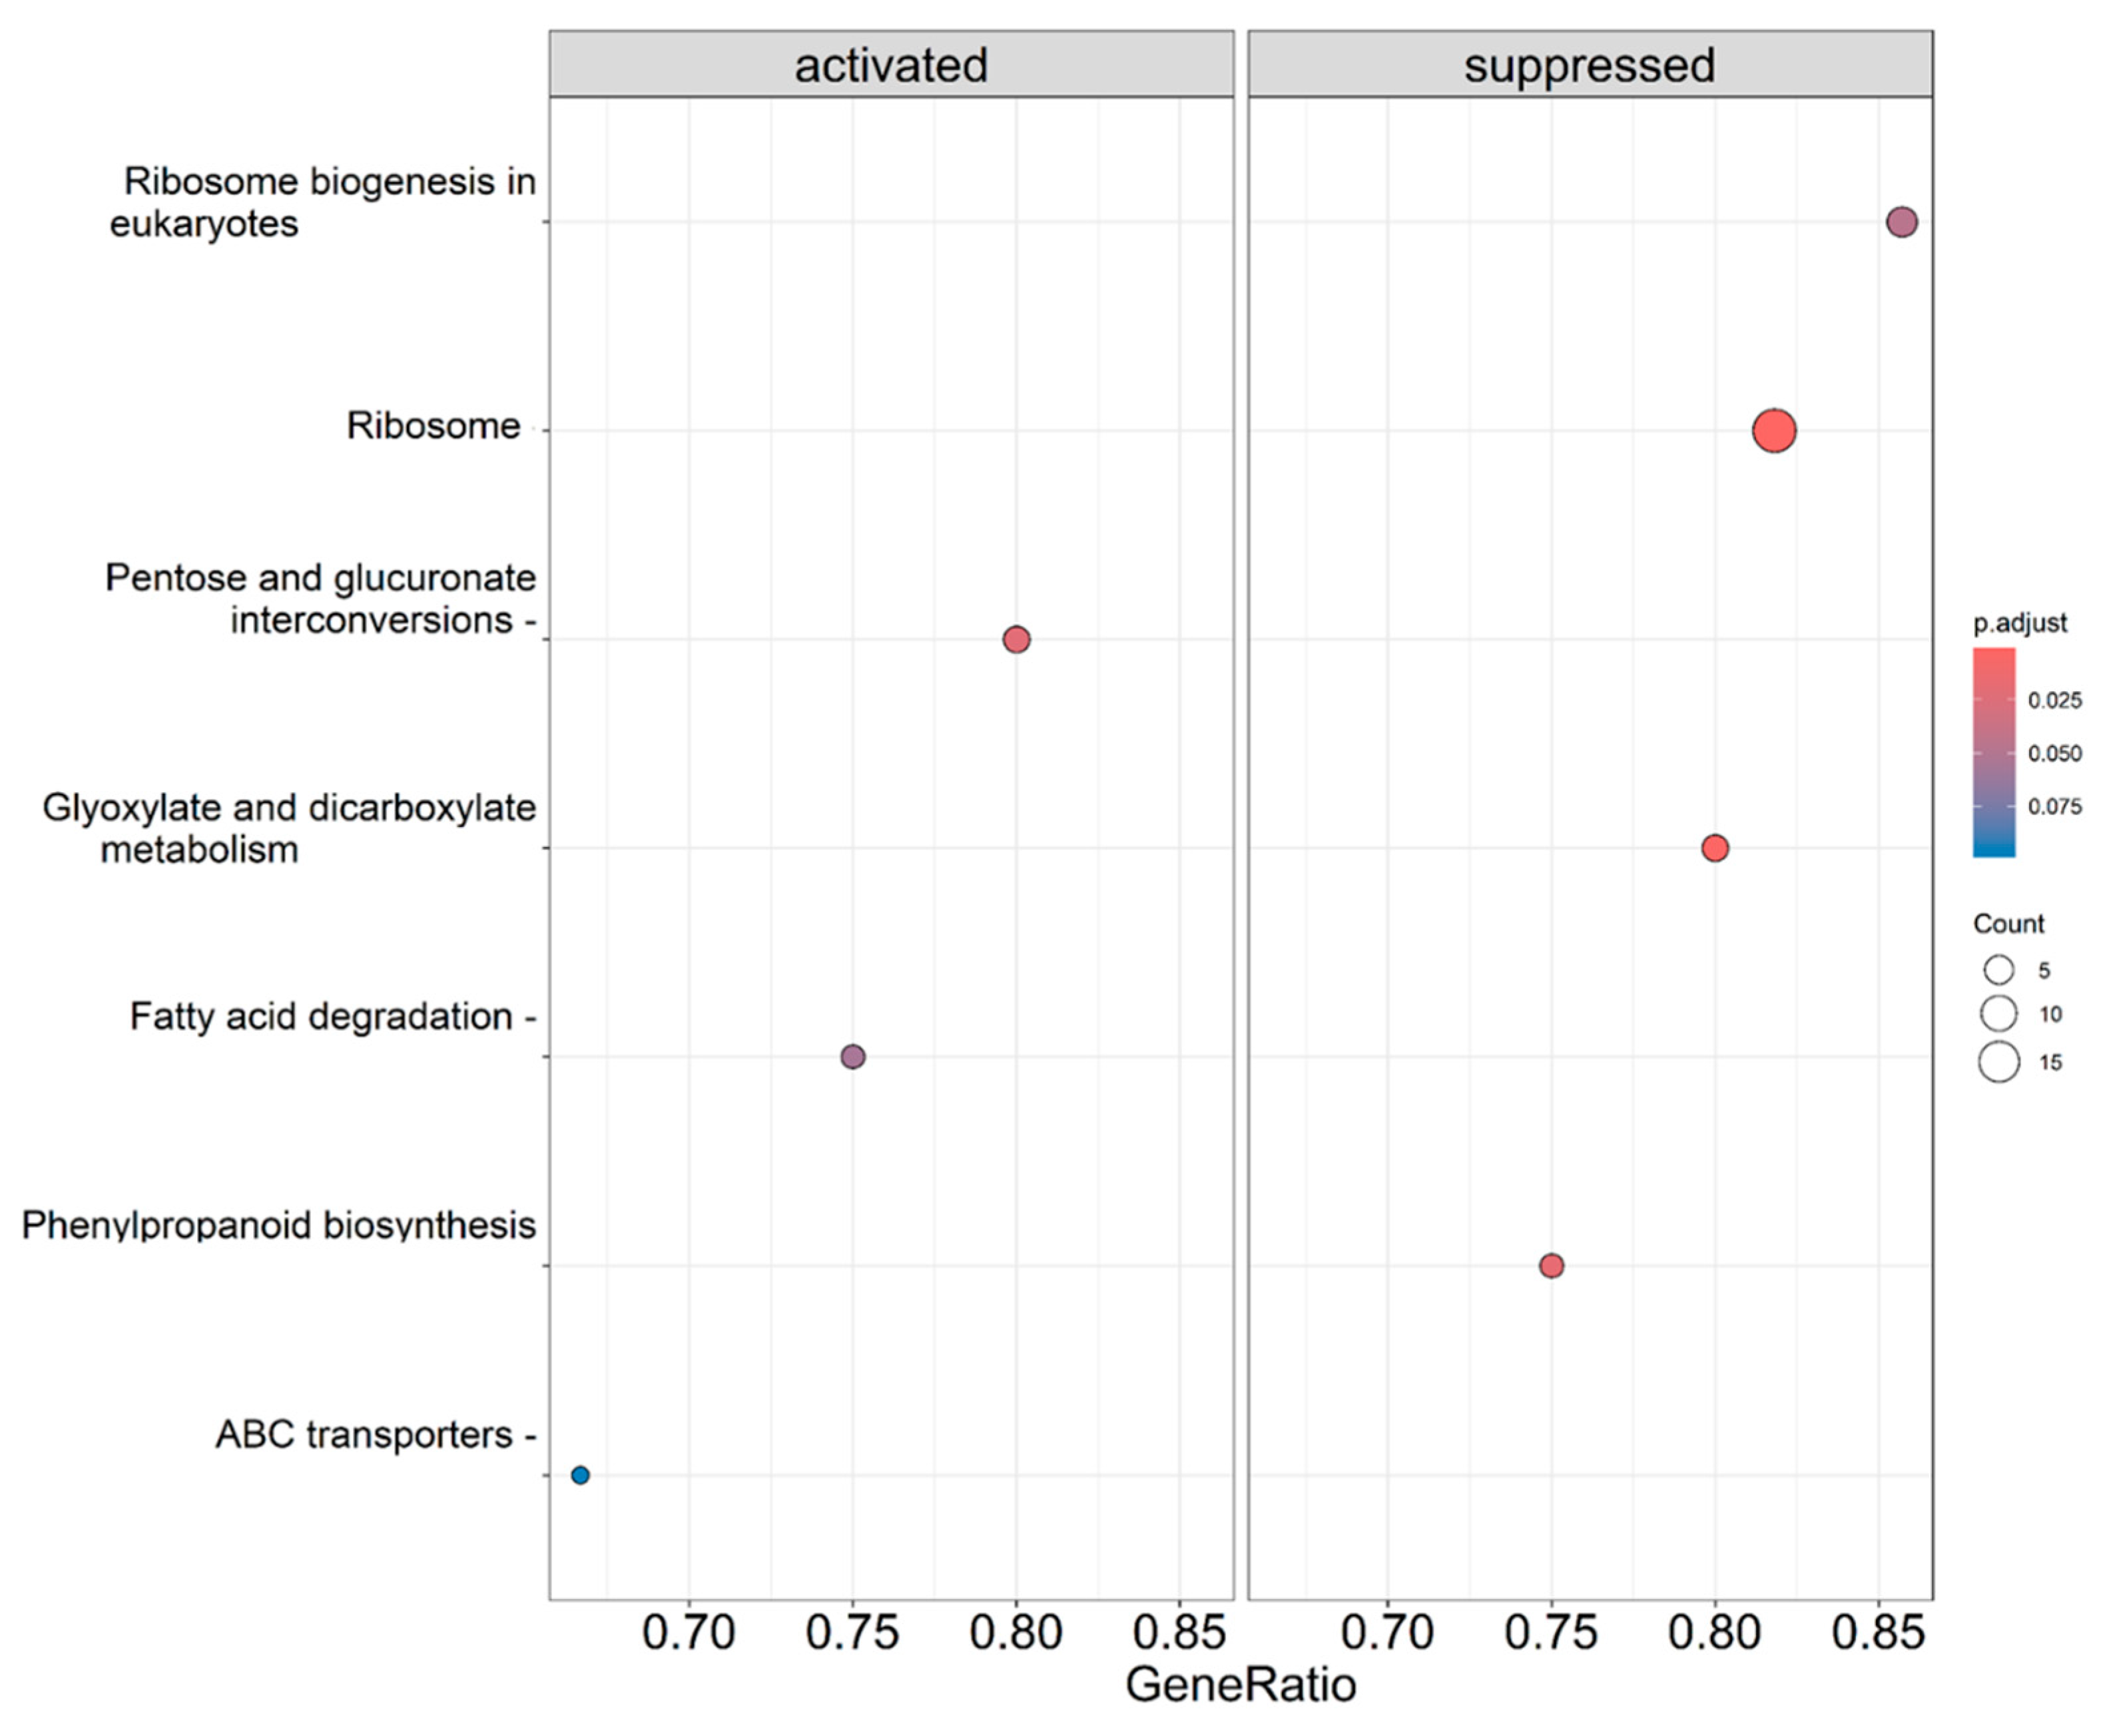
On the other hand, the same analysis was conducted for the KEGG pathways, and in this case, we observed several pathways that were positively enriched. These pathways include those related to “pentose and glucuronate interconversions”, “fatty acid degradation”, “phenylpropanoid biosynthesis”, and “ABC transporters”. In addition, pathways such as “ribosome biogenesis in eukaryotes”, “ribosome”, or “glycoxylate dicarboxylate metabolism” are suppressed (Figure 6).

4. Discussion

The utilization of biostimulants in modern agriculture has gained increasing importance in the context of evolving environmental conditions and the need for sustainable crop production. Our study deepens into the application of flavonoids, specifically CropBioLife (CBL), as a potential biostimulant for tomato plants under optimal growth conditions. Research in this field of bioestimulant is gaining interest in agricultural areas to study the biostimulant and signaling mechanisms that enhance significantly agricultural yields. Flavonoids, classified as secondary metabolites and biostimulants, have traditionally been associated with their pivotal role in promoting plant growth by increasing resistance to various biotic and abiotic stresses [21]. Their effects are often linked to protective mechanisms against factors such as UV-B radiation [22], salt stress [23], and drought [24]. These protective effects arise from their ability to detoxify Reactive Oxygen Species (ROS) generated during plant stress responses [25]. Additionally, some flavonoids have been found to act as natural defenses against certain pests and pathogens [26]. The stimulating effects of flavonoids on germination and growth observed in certain investigations can be attributed to allelopathy, a phenomenon associated with the presence of specific secondary metabolites [26]. Notably, compounds such as quercetin, isoquercitrin, and rutin, among others, have been shown to regulate plant growth [27]. Furthermore, in the few studies that flavonoids have externally applied, they have been shown to regulate plant growth [28].
In our previous results, we demonstrated the capacity of phenolic compounds presents in CBL to promote plant growth by enhancing the exchange of CO2 and water within tomato leaves, consequently improving photosynthesis and transpiration. These alteration in cellular CO2 and water exchange were closely linked to the activity of aquaporins, which could trigger morphological alterations such as an increase in stomatal density on leaf surfaces [7]. Building upon these findings, in this current work, we determine that the higher growth of the shoot observed with external flavonoid application was associated with cell enlargement (Figure 1). These findings highlight the substantial impact of flavonoid bioestimulant on the growth parameters of tomato plants, with a clear shift towards increased above-ground growth and larger individual cell size. This aspect has not been documented previously, but it has been reported that increasing flavonoids is connected with the trafficking factor GFS9, which plays a crucial role in facilitating vacuolar development by mediating membrane fusion within vacuoles in Arabidopsis. This introduces the concept that plants utilize the GFS9-mediated membrane trafficking machinery not only for transporting proteins but also for delivering phytochemicals, such as flavonoids, to vacuoles, a process associated with cell enlargement [29]. This could be related to the increased in the flavonoids concentration and to the increase in the aquaporins functionality regulation observed [7].
Plant growth regulators, particularly auxins and cytokinins, are vital for various aspects of plant development and environmental stress responses. Auxins, such as IAA and gibberellins asGA3 , have been associated with not only promoting plant growth and seed germination but also enhancing the synthesis of flavonoids, as they upregulate the expression of mRNA specific to flavonoid production [30]. Cytokinins, another class of plant growth regulators, are known for their multifaceted roles, including promoting cell division, controlling meristem activity, facilitating organogenesis, regulating leaf senescence, directing vascular differentiation, and aiding nutrient acquisition [31]. Additionally, cytokinins have been demonstrated to play a significant role in enhancing plant resistance to abiotic stress, particularly increasing drought tolerance [32].
The generation and accumulation of zeatin (a major endogenous cytokinin in plants) can promote cell division to enhance plant self-repair after exogenous application [33]. In addition, CBL positively affected the zeatin levels in the tomato leaves as vital phytohormone in promoting stem elongation [34]). However, GA3 was not detected in our plants either in control or in CBL treated plants. Moreover, there was a noteworthy reduction in IAA levels in the leaves of CBL-treated plants (Figure 2). The zeatin/IAA relation assumed significance in our study. In previous investigation it has been reported that variations in zeatin/IAA relation within meristematic cells can influence the choice between endoreduplication and cytokinesis [35]. The observed alteration in the zeatin/IAA relation in CBL-treated tomato tissues points towards the diversion of endoreduplication towards cytokinesis, which could underlie the growth-related effects of CBL. The increased expression and functionality of aquaporins previously reported in CBL-treated plants [7] may be intrinsically tied to the improved water uptake associated with cytokinesis, in line with previous research. Accordingly, Chapman and Estelle [36] observed that cytokinin regulated meristem size in the root by antagonizing auxin signaling in the transition zone. The region where cells leave the meristem to elongate and differentiate that should be connected with the water uptake and transport. Collectively, the physiological and biochemical findings, together with the multivariate analysis (Figure 3), distinctly demonstrate a positive correlation between CBL and various factors, including phenolic compounds, photosynthesis, biomass, and zeatin.
Valente et al. [37] also observed that auxin was able to induce DNA expression, which finally resulted in endoreduplication in the absence of cytokinin, but cytokinin was required for mitosis. Our investigation revealed a higher number of upregulated genes compared to those that were repressed by CBL treatment (Figure 4). The enhanced gene expression associated with biological processes such as "developmental process" and "carbohydrate catabolic process" aligns with the findings regarding increased chlorophyll concentration, enhanced fluorescence of photosystem II, and elevated internal CO2 concentration observed in our previous research [7]. Furthermore, the differentially expressed genes related to molecular functions included several upregulated genes linked to transport activities, including inorganic anion transmembrane transporter, secondary active transmembrane transporter, and potassium ion transmembrane transporter. This aligns with the well-established interplay between mineral uptake, plant water status, and growth [38]. While both ions and water are absorbed through specialized membrane transporters, including channels, antiporters, and ion transporters, as well as aquaporins for water, it was demonstrated that the regulation of these transporters is coordinated to maintain cellular homeostasis. Thus, the observed increase in growth in CBL-treated plants is intricately tied to elevated mineral transport and enhanced water uptake.
In addition to the transcriptomic changes, the KEGG analysis provide several pathways positively enriched as “fatty acid degradation”, “phenylpropanoid biosynthesis”, and “ABC transporters” (Figure 6). Cell division and enlargement represent the predominant processes during the initial phase of growth, concomitant with the production and buildup of organic acids, methoxypyrazines, as well as phenolic compounds [39]. The regulation of this phase in tomato has been related to auxins and cytokinins as it has been also shown in our work. According to the “fatty acid degradation pathways”, previous research on the impact of synthetic cytokinins on grapes demonstrated a reduction in genes associated with fatty acid biosynthesis [40]. In relation to phenylpropanoids, it comprises an extensive category of plant secondary metabolites originating from aromatic amino acids, primarily phenylalanine in the majority of plants or tyrosine in certain monocots. The primary branches of the phenylpropanoid pathway encompass lignans and lignins, stilbenes, coumarins, isoflavonoids, flavonoids, and proanthocyanidins [41]. Therefore, the concurrent increase in gene expression related to phenylpropanoid biosynthesis is closely linked to the observed elevation in flavonoid concentration in tomato leaves as detailed in our earlier work [7].

5. Conclusions

Our findings underscore the significance of external flavonoid application, specifically the biostimulant CropBioLife (CBL), in the context of optimal tomato plant growth. We observed a complex interplay between flavonoid application and induced cell enlargement. Effective flavonoid (CBL) application revealed a regulatory mechanism governed by hormones, as we noted an increase in zeatin concentration followed by a decrease in IAA concentration. Furthermore, we identified a positive correlation between CBL and phenolic compounds, photosynthesis, biomass, and zeatin. Our RNA-seq analysis also showed that CBL-treated plants should increase mineral uptake and transport, as suggested by gene expression. Additionally, genes associated with fatty acid degradation pathways, phenylpropanoid biosynthesis, and ABC transporters exhibited regulatory mechanisms governing internal flavonoid biosynthesis, transport, and tissue concentration, ultimately resulting in higher flavonoid levels in tomato leaves.
These significant advancements, made possible by the application of progressively sophisticated genetic and biochemical methodologies, have revealed that the upregulation of genes related to flavonoid synthesis and transport, along with those associated with mineral nutrient and water uptake, are key mechanisms shaping the response of tomato plants to external flavonoid application under optimal growth conditions. In this sense, transcriptomic, hormonomic, and metabolomics analyses are important to continue investigating the intricate relationship between flavonoids and the promotion of cell growth in plants from a biostimulant perspective, irrespective of responses to biotic or abiotic stress factors.
Supplementary Materials

The following supporting information can be downloaded at the website of this paper posted on Preprints.org. Table S1: Biological Process (BP) and Molecular Function (MF) categories enriched in CBL-treated plants.

Author Contributions

Conceptualisation: M.C.; Funding acquisition: M.C.; Investigation: A.M-A. and A.G.; Methodology: A.M-A. and A.G.; Supervision: M.C. and L.Y-M; Validation: M.C.; Writing—Original draft: A.M-A., A.G., L.Y-M. and M.C. All authors have read and agreed to the published version of the manuscript.

Funding

This research was funded by Spanish Ministerio de Ciencia e Innovacion, CDTI with the 0 E-Missions Project (MIP-20201045) in collaboration with J Huete, S.A.

Data Availability Statement

Not applicable

Acknowledgments

The authors thank Ramiro Arnedo, S.A. (Spain) for providing the seeds and to Aussan Laboratories Inc. (Australia) for providing Crop Biolife product.

Conflicts of Interest

The authors declare no conflict of interest.

References

  1. Malik, A.; Mor, V.S.; Tokas, J.; Punia, H.; Malik, S.; Malik, K.; Sangwan, S.; Tomar, S.; Singh, P.; Singh, N.; et al. Biostimulant-Treated Seedlings under Sustainable Agriculture: A Global Perspective Facing Climate Change. Agronomy 2020, 11, 14. [Google Scholar] [CrossRef]
  2. Francesca, S.; Arena, C.; Hay Mele, B.; Schettini, C.; Ambrosino, P.; Barone, A.; Rigano, M.M. The Use of a Plant-Based Biostimulant Improves Plant Performances and Fruit Quality in Tomato Plants Grown at Elevated Temperatures. Agronomy 2020, 10, 363. [Google Scholar] [CrossRef]
  3. Chen, S.; Wu, F.; Li, Y.; Qian, Y.; Pan, X.; Li, F.; Wang, Y.; Wu, Z.; Fu, C.; Lin, H.; et al. NtMYB4 and NtCHS1 Are Critical Factors in the Regulation of Flavonoid Biosynthesis and Are Involved in Salinity Responsiveness. Front Plant Sci 2019, 10. [Google Scholar] [CrossRef] [PubMed]
  4. Nakabayashi, R.; Yonekura-Sakakibara, K.; Urano, K.; Suzuki, M.; Yamada, Y.; Nishizawa, T.; Matsuda, F.; Kojima, M.; Sakakibara, H.; Shinozaki, K.; et al. Enhancement of Oxidative and Drought Tolerance in Arabidopsis by Overaccumulation of Antioxidant Flavonoids. The Plant Journal 2014, 77, 367–379. [Google Scholar] [CrossRef] [PubMed]
  5. An, Y.; Feng, X.; Liu, L.; Xiong, L.; Wang, L. ALA-Induced Flavonols Accumulation in Guard Cells Is Involved in Scavenging H2O2 and Inhibiting Stomatal Closure in Arabidopsis Cotyledons. Front Plant Sci 2016, 7. [Google Scholar] [CrossRef] [PubMed]
  6. Ahmed, Z.F.R.; Alnuaimi, A.K.H.; Askri, A.; Tzortzakis, N. Evaluation of Lettuce (Lactuca Sativa L.) Production under Hydroponic System: Nutrient Solution Derived from Fish Waste vs. Inorganic Nutrient Solution. Horticulturae 2021, 7, 292. [Google Scholar] [CrossRef]
  7. Martinez-Alonso, A.; Garcia-Ibañez, P.; Bárzana, G.; Carvajal, M. Leaf Gas Exchange and Growth Responses of Tomato Plants to External Flavonoids Application as Biostimulators under Normal and Salt-Stressed Conditions. Agronomy 2022, 12, 3230. [Google Scholar] [CrossRef]
  8. Zaman, M.; Kurepin, L. V; Catto, W.; Pharis, R.P. Enhancing Crop Yield with the Use of N-Based Fertilizers Co-Applied with Plant Hormones or Growth Regulators. J Sci Food Agric 2015, 95, 1777–1785. [Google Scholar] [CrossRef]
  9. Bolger, M.E.; Weisshaar, B.; Scholz, U.; Stein, N.; Usadel, B.; Mayer, K.F. Plant Genome Sequencing — Applications for Crop Improvement. Curr Opin Biotechnol 2014, 26, 31–37. [Google Scholar] [CrossRef]
  10. Andrews, S. FastQC: A Quality Control Tool for High Throughput Sequence Data 2010.
  11. Bolger, A.M.; Lohse, M.; Usadel, B. Trimmomatic: A Flexible Trimmer for Illumina Sequence Data. Bioinformatics 2014, 30, 2114–2120. [Google Scholar] [CrossRef]
  12. Kim, D.; Langmead, B.; Salzberg, S.L. HISAT: A Fast Spliced Aligner with Low Memory Requirements. Nat Methods 2015, 12, 357–360. [Google Scholar] [CrossRef] [PubMed]
  13. Liao, Y.; Smyth, G.K.; Shi, W. The Subread Aligner: Fast, Accurate and Scalable Read Mapping by Seed-and-Vote. Nucleic Acids Res 2013, 41, e108–e108. [Google Scholar] [CrossRef] [PubMed]
  14. Love, M.I.; Huber, W.; Anders, S. Moderated Estimation of Fold Change and Dispersion for RNA-Seq Data with DESeq2. Genome Biol 2014, 15, 550. [Google Scholar] [CrossRef] [PubMed]
  15. Benjamini, Y.; Hochberg, Y. Controlling the False Discovery Rate: A Practical and Powerful Approach to Multiple Testing. Journal of the Royal Statistical Society: Series B (Methodological) 1995, 57, 289–300. [Google Scholar] [CrossRef]
  16. Jones, P.; Binns, D.; Chang, H.-Y.; Fraser, M.; Li, W.; McAnulla, C.; McWilliam, H.; Maslen, J.; Mitchell, A.; Nuka, G.; et al. InterProScan 5: Genome-Scale Protein Function Classification. Bioinformatics 2014, 30, 1236–1240. [Google Scholar] [CrossRef] [PubMed]
  17. Yu, G.; Wang, L.-G.; Han, Y.; He, Q.-Y. ClusterProfiler: An R Package for Comparing Biological Themes Among Gene Clusters. OMICS 2012, 16, 284–287. [Google Scholar] [CrossRef] [PubMed]
  18. R Core Team R: A Language and Environment for Statistical Computing. R Foundation for Statistical Computing. R Foundation for Statistical Computing, Vienna. 2018.
  19. Lê, S.; Josse, J.; Husson, F. FactoMineR: An R Package for Multivariate Analysis. J Stat Softw 2008, 25, 1–18. [Google Scholar] [CrossRef]
  20. Kassambara, A.; Mundt, F. Package ‘Factoextra. ’ Extract and visualize the results of multivariate data analyses 2017, 76. [Google Scholar]
  21. Shah, A.; Smith, D.L. Flavonoids in Agriculture: Chemistry and Roles in, Biotic and Abiotic Stress Responses, and Microbial Associations. Agronomy 2020, 10, 1209. [Google Scholar] [CrossRef]
  22. Chalker-Scott, L. Environmental Significance of Anthocyanins in Plant Stress Responses. Photochem Photobiol 1999, 70, 1–9. [Google Scholar] [CrossRef]
  23. Chen, S.; Wu, F.; Li, Y.; Qian, Y.; Pan, X.; Li, F.; Wang, Y.; Wu, Z.; Fu, C.; Lin, H.; et al. NtMYB4 and NtCHS1 Are Critical Factors in the Regulation of Flavonoid Biosynthesis and Are Involved in Salinity Responsiveness. Front Plant Sci 2019, 10. [Google Scholar] [CrossRef]
  24. Shojaie, B.; Mostajeran, A.; Ghannadian, M. Flavonoid Dynamic Responses to Different Drought Conditions: Amount, Type, and Localization of Flavonols in Roots and Shoots of Arabidopsis Thaliana L. Turkish Journal of Biology 2016, 40, 612–622. [Google Scholar] [CrossRef]
  25. Brunetti, C.; Di Ferdinando, M.; Fini, A.; Pollastri, S.; Tattini, M. Flavonoids as Antioxidants and Developmental Regulators: Relative Significance in Plants and Humans. Int J Mol Sci 2013, 14, 3540–3555. [Google Scholar] [CrossRef]
  26. Cushnie, T.P.T.; Lamb, A.J. Antimicrobial Activity of Flavonoids. Int J Antimicrob Agents 2005, 26, 343–356. [Google Scholar] [CrossRef]
  27. Fritz, D.; Bernardi, A.P.; Haas, J.S.; Ascoli, B.M.; Bordignon, S.A. de L.; von Poser, G. Germination and Growth Inhibitory Effects of Hypericum Myrianthum and H. Polyanthemum Extracts on Lactuca Sativa L. Revista Brasileira de Farmacognosia 2007, 17, 44–48. [Google Scholar] [CrossRef]
  28. Shad, M.I.; Ashraf, M.A.; Rasheed, R.; Hussain, I.; Ali, S. Exogenous Coumarin Decreases Phytotoxic Effects of Manganese by Regulating Ascorbate–Glutathione Cycle and Glyoxalase System to Improve Photosynthesis and Nutrient Acquisition in Sesame (Sesamum Indicum L.). J Soil Sci Plant Nutr 2023, 23, 251–274. [Google Scholar] [CrossRef]
  29. Ichino, T.; Fuji, K.; Ueda, H.; Takahashi, H.; Koumoto, Y.; Takagi, J.; Tamura, K.; Sasaki, R.; Aoki, K.; Shimada, T.; et al. GFS9/TT9 Contributes to Intracellular Membrane Trafficking and Flavonoid Accumulation in Arabidopsis Thaliana. The Plant Journal 2014, 80, 410–423. [Google Scholar] [CrossRef]
  30. Yoon, H.K.; Muhammad, H.; Abdul, L.K.; Chae, I.N.; Sang, M.K.; Hyun, H.H.; In Jung, L. Exogenous Application of Plant Growth Regulators Increased the Total Flavonoid Content in Taraxacum Officinale Wigg. Afr J Biotechnol 2009, 8, 5727–5736. [Google Scholar] [CrossRef]
  31. Mok, D.W.; Mok, M.C. Cytokinin Metabolism and Action. Annu Rev Plant Physiol Plant Mol Biol 2001, 52, 89–118. [Google Scholar] [CrossRef]
  32. Van Oosten, M.J.; Pepe, O.; De Pascale, S.; Silletti, S.; Maggio, A. The Role of Biostimulants and Bioeffectors as Alleviators of Abiotic Stress in Crop Plants. Chemical and Biological Technologies in Agriculture 2017, 4, 5. [Google Scholar] [CrossRef]
  33. Hao, Y.; Ma, C.; Zhang, Z.; Song, Y.; Cao, W.; Guo, J.; Zhou, G.; Rui, Y.; Liu, L.; Xing, B. Carbon Nanomaterials Alter Plant Physiology and Soil Bacterial Community Composition in a Rice-Soil-Bacterial Ecosystem. Environmental Pollution 2018, 232, 123–136. [Google Scholar] [CrossRef] [PubMed]
  34. Hao, Y.; Ma, C.; White, J.C.; Adeel, M.; Jiang, R.; Zhao, Z.; Rao, Y.; Chen, G.; Rui, Y.; Xing, B. Carbon-Based Nanomaterials Alter the Composition of the Fungal Endophyte Community in Rice ( Oryza Sativa L.). Environ Sci Nano 2020, 7, 2047–2060. [Google Scholar] [CrossRef]
  35. Tank, J.G.; Pandya, R. V.; Thaker, V.S. IAA and Zeatin Controls Cell Division and Endoreduplication Process in Quiescent Center Cells of Allium Cepa Root. Indian J Plant Physiol 2015, 20, 124–129. [Google Scholar] [CrossRef]
  36. Chapman, E.J.; Estelle, M. Cytokinin and Auxin Intersection in Root Meristems. Genome Biol 2009, 10, 210. [Google Scholar] [CrossRef]
  37. Valente, P.; Tao, W.; Verbelen, J.-P. Auxins and Cytokinins Control DNA Endoreduplication and Deduplication in Single Cells of Tobacco. Plant Science 1998, 134, 207–215. [Google Scholar] [CrossRef]
  38. Bárzana, G.; Carvajal, M. Genetic Regulation of Water and Nutrient Transport in Water Stress Tolerance in Roots. J Biotechnol 2020, 324, 134–142. [Google Scholar] [CrossRef]
  39. Tyagi, K.; Maoz, I.; Kochanek, B.; Sela, N.; Lerno, L.; Ebeler, S.E.; Lichter, A. Cytokinin but Not Gibberellin Application Had Major Impact on the Phenylpropanoid Pathway in Grape. Hortic Res 2021, 8, 51. [Google Scholar] [CrossRef]
  40. Wang, W.; Khalil-Ur-Rehman, M.; Feng, J.; Tao, J. RNA-Seq Based Transcriptomic Analysis of CPPU Treated Grape Berries and Emission of Volatile Compounds. J Plant Physiol 2017, 218, 155–166. [Google Scholar] [CrossRef]
  41. Vogt, T. Phenylpropanoid Biosynthesis. Mol Plant 2010, 3, 2–20. [Google Scholar] [CrossRef]
Figure 1. Root to shoot ratio (kg kg-1) (A), microscopy images of leaf cells (B), and cell area (µm2) of palisade parenchyma, PP (C), lacunar parenchyma, LP (D), epidermis, Ep (E), and collenchyma, Cl (F) of tomato plants under control conditions and CBL treated. Data are mean ± SE (n = 5 plants in A, and n=20-25 cells in C-F). Asterisks indicate significant differences according to the Student-t test (p<0.05).
Preprints 87893 g001
Figure 2. Concentration (µM) of Indole Acetic Acid (A) and Zeatin (B) in the aerial parts of tomato plants under control conditions and CBL treated. Data are mean ± SE (n = 3). Asterisks indicate significant differences according to the Student-t test (p<0.05).
Preprints 87893 g002
Figure 3. Principal component analysis (PCA) (A) and correlation plot (B) from physiological variables (micronutrients, macronutrients, gas exchange parameters, biomass and phenolic compounds from Martinez-Alonso et. al, [7], and hormone content).
Preprints 87893 g003
Figure 4. Principal component analysis (PCA) plot for RNA-seq data of biological replicates of control and CBL-treated plants (A). Differentially Expressed Genes (DEGs) are visualized using a volcano plot (B) for the comparison between CBL-treated and control groups. The horizontal axis represents the fold-change value (log2(B/A)) of gene expression differences between the control and CBL-treated groups, while the vertical axis represents the significance level, with p-values indicating the extent of gene expression changes. Each point in the plot represents an individual gene, with blue indicating down-regulated genes, red indicating up-regulated genes, and black representing genes that show no significant difference in expression. Heatmap of top 50 genes differentially expressed in control and CBL groups, blue colour represents low expressed genes and red colour represents highly expressed genes (Z-score); fold change (logFC), average expression (AveExpr) and gene name are shown (C).
Preprints 87893 g004
Figure 5. Clusterprofiler GO enrichment results showing activation or suppression of genes in CBL-treated plants in comparison with control plants for the functional categories: Biological Process (BP) (A) and Molecular Function (MF) (B).
Preprints 87893 g005
Figure 6. Clusterprofiler KEGG enrichment results showing activation or suppression of genes in CBL-treated plants in comparison with control plants for the KEGG pathways.
Preprints 87893 g006
Disclaimer/Publisher’s Note: The statements, opinions and data contained in all publications are solely those of the individual author(s) and contributor(s) and not of MDPI and/or the editor(s). MDPI and/or the editor(s) disclaim responsibility for any injury to people or property resulting from any ideas, methods, instructions or products referred to in the content.
Copyright: This open access article is published under a Creative Commons CC BY 4.0 license, which permit the free download, distribution, and reuse, provided that the author and preprint are cited in any reuse.
Prerpints.org logo

Preprints.org is a free preprint server supported by MDPI in Basel, Switzerland.

Subscribe

© 2024 MDPI (Basel, Switzerland) unless otherwise stated