1. Introduction
Tropical cyclone (TC), characterized by a low-pressure center, organized convection, intense winds, heavy rainfall, and immense destructive potential, poses significant challenges for forecasting and early warning systems. Different stages in the TC’s life cycle typically follow one another sequentially, from tropical disturbance to tropical depression (TD), tropical storm (TS), and finally, typhoon. The study of tropical cyclogenesis involves examining complex interactions between atmospheric, oceanic and remote land surface processes that contribute to storm formation. Observations have shown that tropical disturbances can form and exist extensively outside the oceans, but only a few of them truly have the potential to develop into TCs [
1,
2]. In general, the tropical cyclogenesis constitutes the overall process of an embryo vortex/wave evolving into the tropical storm (TS) stage [
3,
4,
5]. In our study, the tropical cyclogenesis is partitioned into two subsequent processes: TC formation and development. The formation and development of TCs are a significant topic that attracts in-depth research across various fields in both theoretical and applied.
Understanding the predictability of tropical cyclogenesis, both practically and theoretically, is of paramount importance for disaster preparedness, risk mitigation, and the protection of vulnerable coastal regions. Accordingly, numerous studies have been undertaken to evaluate the dependability of model-predicted genesis [
6,
7,
8,
9,
10,
11,
12]. Evaluating the accuracy of genesis forecasting within deterministic models remains a prominent area of research interest [
7,
9,
13,
14,
15,
16]. Currently, the use of ensemble forecasts in predicting TC genesis is becoming increasingly common and demonstrating superior predictive skills compared to using a deterministic model. The ensemble prediction systems (EPSs) account for uncertainties in the initial conditions and imperfections in model formulation, aiming to convey a range of potential future atmospheric states [
17]. Despite the huge data volume required to process, ensemble forecasting has proven effective in improving the accuracy of TC track predictions [
18,
19]. Conducting an assessment study to predict TC geneses using two global EPSs, ECMWF-EPS and UKMO-EPS, during 2018 – 2020 in the Northwest Pacific, Northeast Pacific, and North Atlantic, Zhang et al. [
20] found that the forecasting skills were relatively good. The probabilistic forecast could be improved by combining all ensemble members. Addiontaly, the authors noted that if one ensemble member did not make an accurate prediction, it was also observed that the presence of favorable conditions for TC genesis existed.
The process of TC genesis often occurs over the open tropical oceans, where conventional observations such as radar, radiosondes, and surface observations are often limited and sparsely distributed, leading to limitations in forecasting and warnings of TCs in operational activities. Hence, the guidance provided by data assimilation plays a crucial role in enhancing TC genesis forecast quality. With advancements in numerical weather prediction through ensemble forecasting techniques and data assimilation methods, ensemble-based data assimilation systems (EPS-DA) integrate observational data from various sources, such as satellites, radiosondes, and buoys/ships into EPSs to enhance the accuracy of weather predictions. In this regard, the ensemble Kalman filtering method (EnKF) [
21] has been developed to satisfy both of these conditions in the most effective way. The Local Ensemble Transform Kalman Filter (LETKF) scheme, developed at the University of Maryland [
22], has been widely applied in various numerical models, notably in the Weather Research and Forecasting (WRF) weather model [
23,
24,
25,
26,
27]. Miyoshi and Kunii [
23] found that LETKF is particularly useful for handling highly heterogeneous data, such as satellite observations. Multi-physics construction of this scheme within the EPS-DA [
28] has demonstrated its effectiveness in forecasting TC Wutip (2013)’s genesis. Motivated from their case study, this study further examines the efficiency of EPS system assimilating augmented observations on the forecasts of 45 different TCs from 2012 to 2019.
The 45 TCs are limited over the the South China Sea (SCS). The specific basin of focus is a semi-enclosed subregion of the Western North Pacific (WNP), has a shallower bottom profile compared to the open waters, hence intricate air-sea interaction behaviors. While TC genesis depends largely on their geographical location, TCs forming and developing over the SCS usually have a shorter life than traversing TCs from the nearby open waters of WNP, as they make landfall shortly after forming near the coast. Surrounded by coastal areas, the process for TC genesis is far more complicated, with contributions from the physical properties of offshore convective systems and land-ocean contrasts [
29,
30].
Builds upon existing scientific knowledge, this study conducts a comprehensive analysis into the predictability of TC geneses over SCS. The assessment involves a systematic comparison of EPS-DA forecasts with observations, specifically focusing on fixed-event perspectives and highlights critical information about predicted TC genesis within the EPS-DA system. These scenarios are designed to detect the formation of TCs at the TD stage, and they may consider instances where false alarms occur if the TC progresses to TS stage despite observations suggesting otherwise. Our primary objective is to determine whether and to what extent these forecasts replicate tropical cyclogeneses. Additionally, we analyze the temporal evolution of predictability for these cyclones, identifying instances of changes in ensemble statistics as lead time progresses, contrasting with the anticipated gradual convergence towards the analysis value. The remainder of this paper is organized as follow. Experiment design is described in section 2.
Section 3 discuss the major findings of the ensemble probabilistic prediction of TC genesis across forecast cycles and examines associated environmental conditions in favoring TC genesis as predicted by the EPS-DA system. Summary and discussion are presented in section 4.
2. Experimental settings
2.1. Model descriptions
In order to investigate the predictability of tropical cyclogenesis over the SCS, the non-hydrostatic version of the WRF model (WRF-ARW) version 3.9.1 [
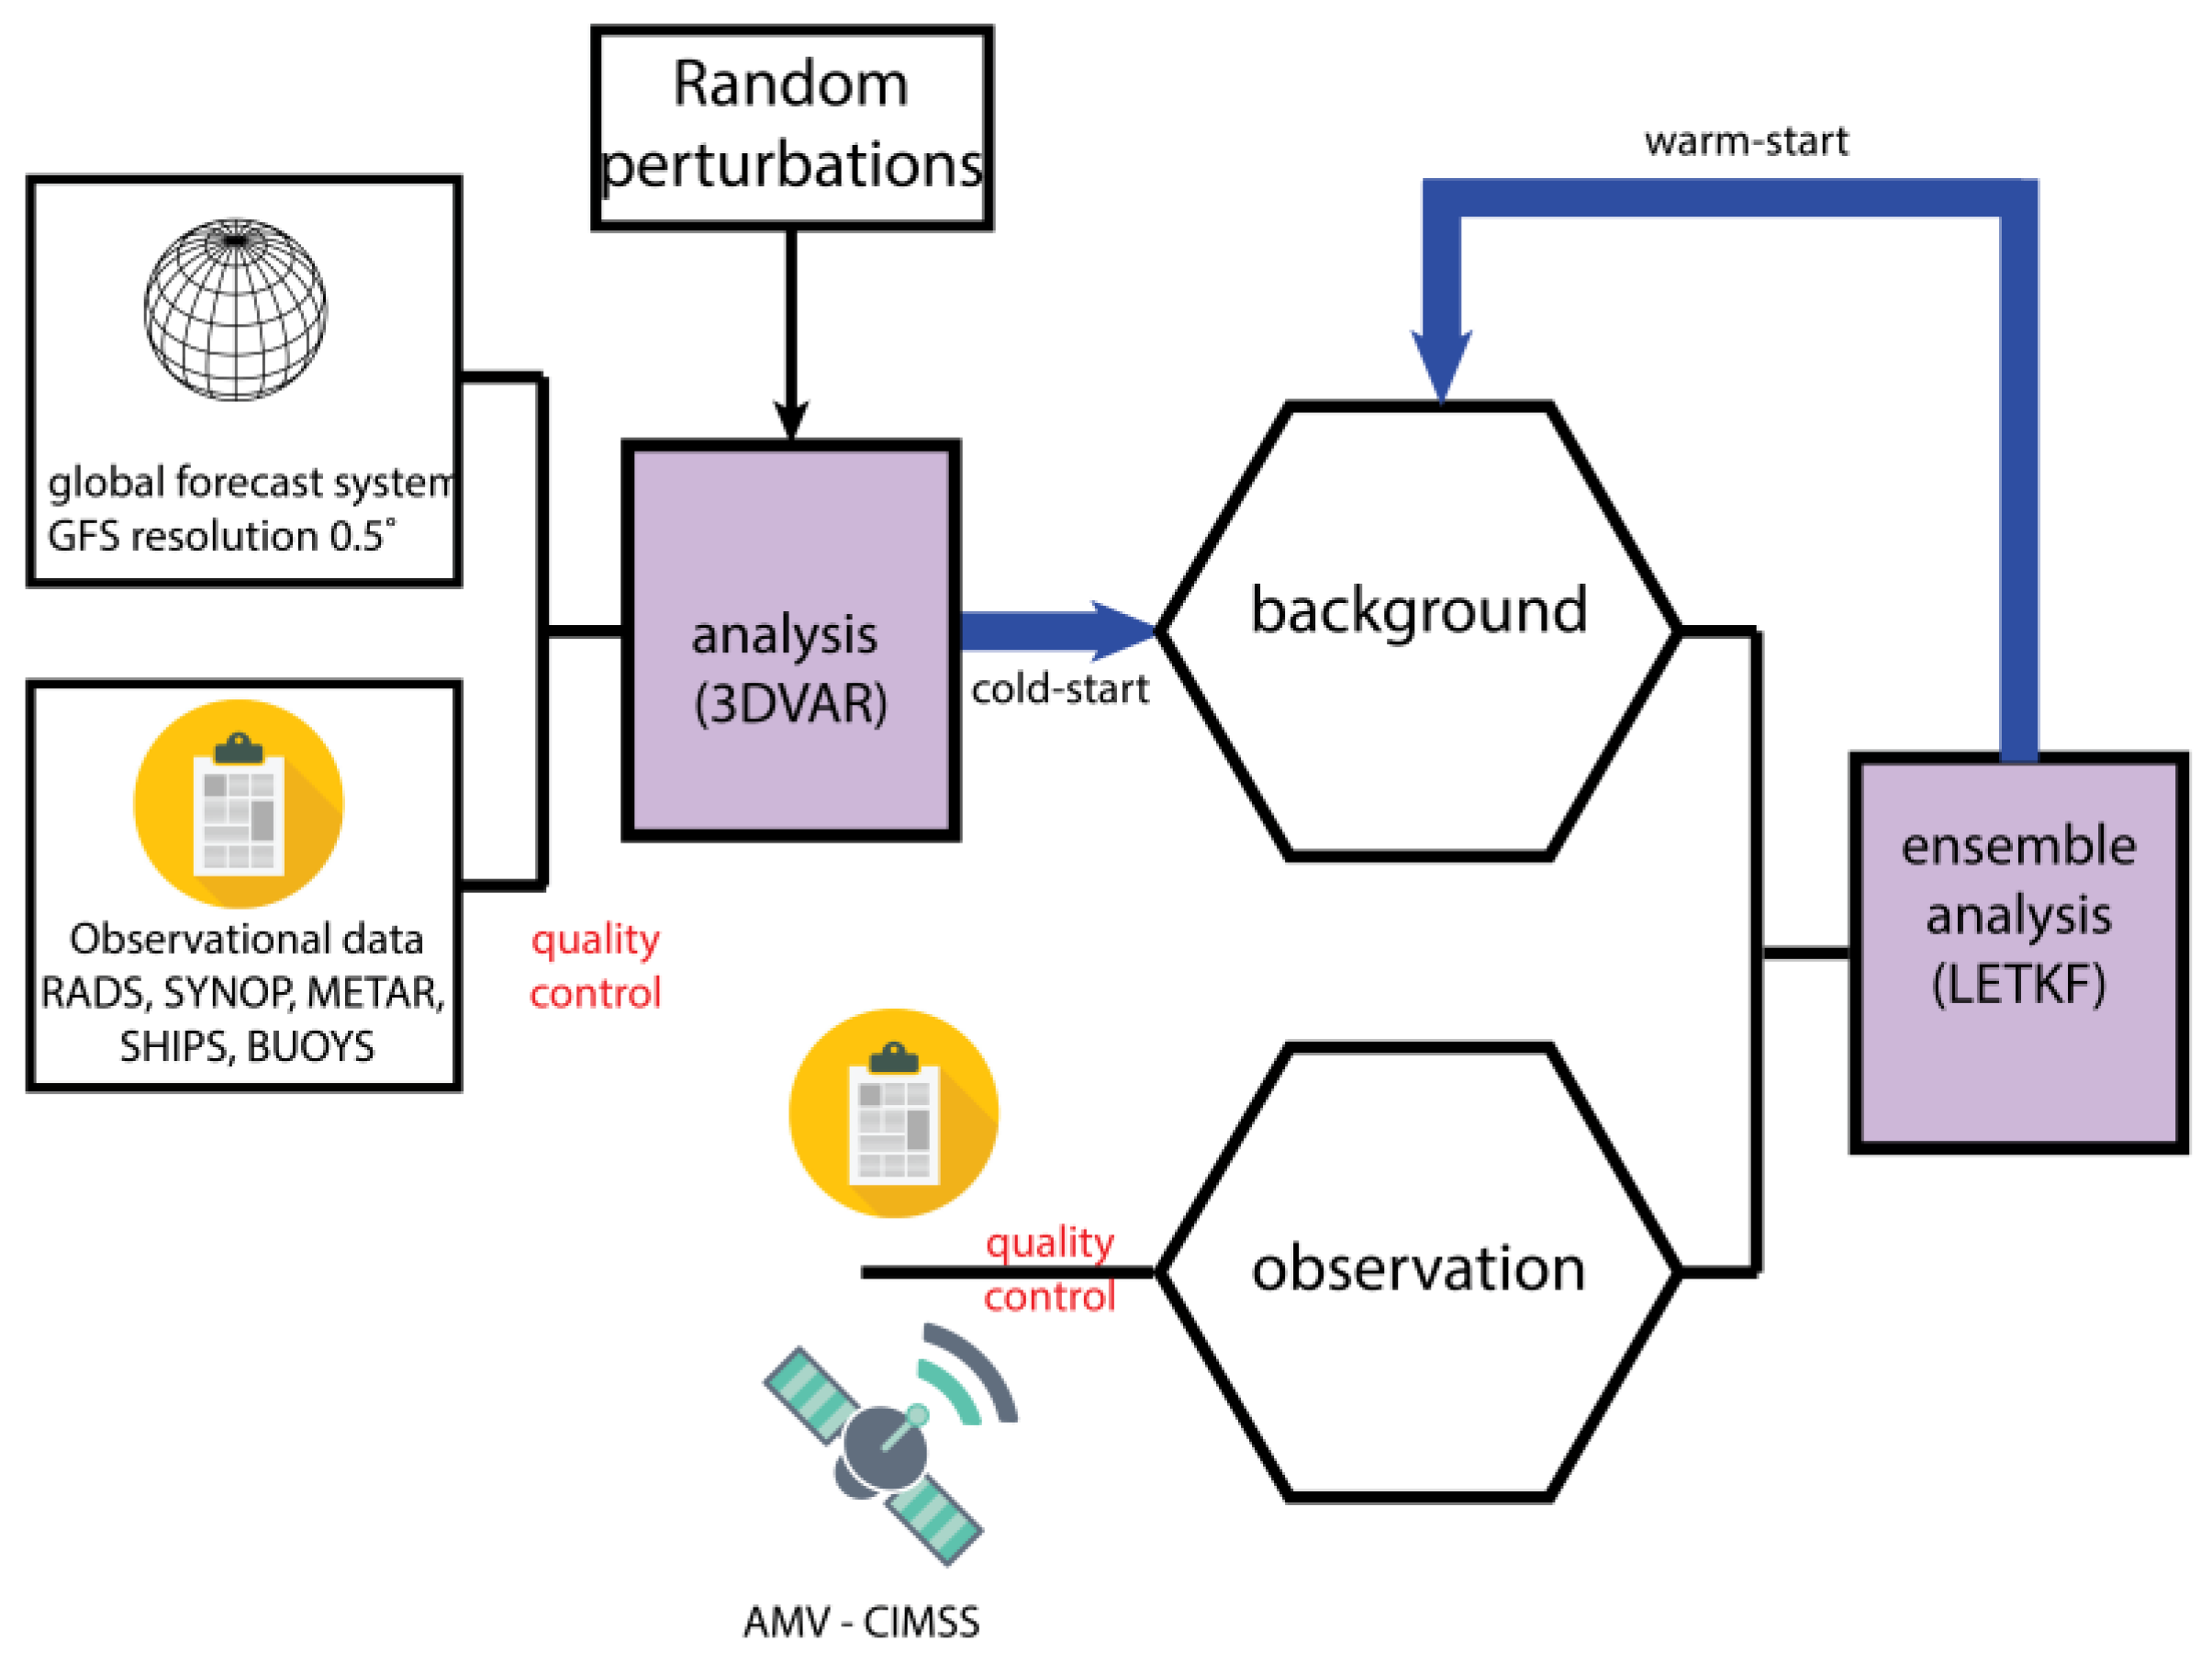
31] is employed with the ensemble-based data assimilation (EPS-DA) scheme. The procedure of the EPS-DA method is described in
Figure 1.
To initialize the EPS-DA system with a cold-start forecast field, the study employs the traditional 3DVAR variational assimilation scheme integrated from the WRFDA to generate an analysis field from the initial data of the global forecast GFS (Global Forecast System). The initial forecast field using 3DVAR scheme aims at improving the background field for the subsequent assimilation cycles through the stability of the variational assimilation scheme. More details of the assimilation algorithm was described in Tien et al. (hereafter, TIEN20) [
28].
In our experiments, we adopt an ensemble size of 21 members. For every warm-start cycle, 21 perturbations are generated and incorporated into the global deterministic analysis. The perturbations are derived from the atmospheric state of the previous cycle, utilizing the background matrix covariance along with observations within a predefined neighboring sub-space for each grid point. To ensure proper regulation of all the ensemble forecast and enhance the influence of ensemble noise on the analysis, all perturbations for the assimilated variables are uniformly scaled by an inflation factor of 1.1.
A multi-physic approach is implemented within the WRF model, the design of these ensemble members optimizes the spread while avoiding the necessity of using a larger number of members. A combination of parameterization schemes was selected to create ensemble members for the EPS-DA experiments. A set of physical schemes used for the EPS-DA consists of 2 convective schemes, 3 boundary-layer schemes, 3 microphysics schemes and 2 radiation schemes. In a total of 36 combinations from these physical schemes, some combinations are excluded due to model instability arising from internal conflicts during implementation. Among the 36 potential combinations, only 21 were utilized for operational purposes (see
Table 1, TIEN20).
2.2. Domain configuration and datasets
To investigate tropical cyclogenesis within the SCS, the WRF model is configured with a domain encompassing the entire SCS, the Indochina Peninsula and adjacent waters of the Western North Pacific, covering the area defined by geographical coordinates [95ºE – 145ºE]×[0º - 30ºN], as illustrated in
Figure 2. With such a domain, the interactions of land – sea, as well as the semi-enclosed area and the open-waters, are preserved, allowing for the assessment of TC genesis through these interactions. The domain has a horizontal resolution of 27 km and 31 vertical levels. It is evident that TCs during their incipient and early developmental stages are often susceptible to disruption due to environmental conditions, and their intensities are primarily influenced by large-scale circulations [
7,
9,
11,
32,
33,
34,
35,
36]. Therefore, the 27-km resolution is chosen for the ensemble forecasting as it strikes a balance between computational feasibility and retaining the characteristics of TCs within the meso-α and meso-β systems. The local sub-space for localized spatial covariance matrix perturbations in LETKF cycling is defined by a (7×7×3) grid points in the (x, y, z) dimensions, respectively, on a total of (200×122×31).
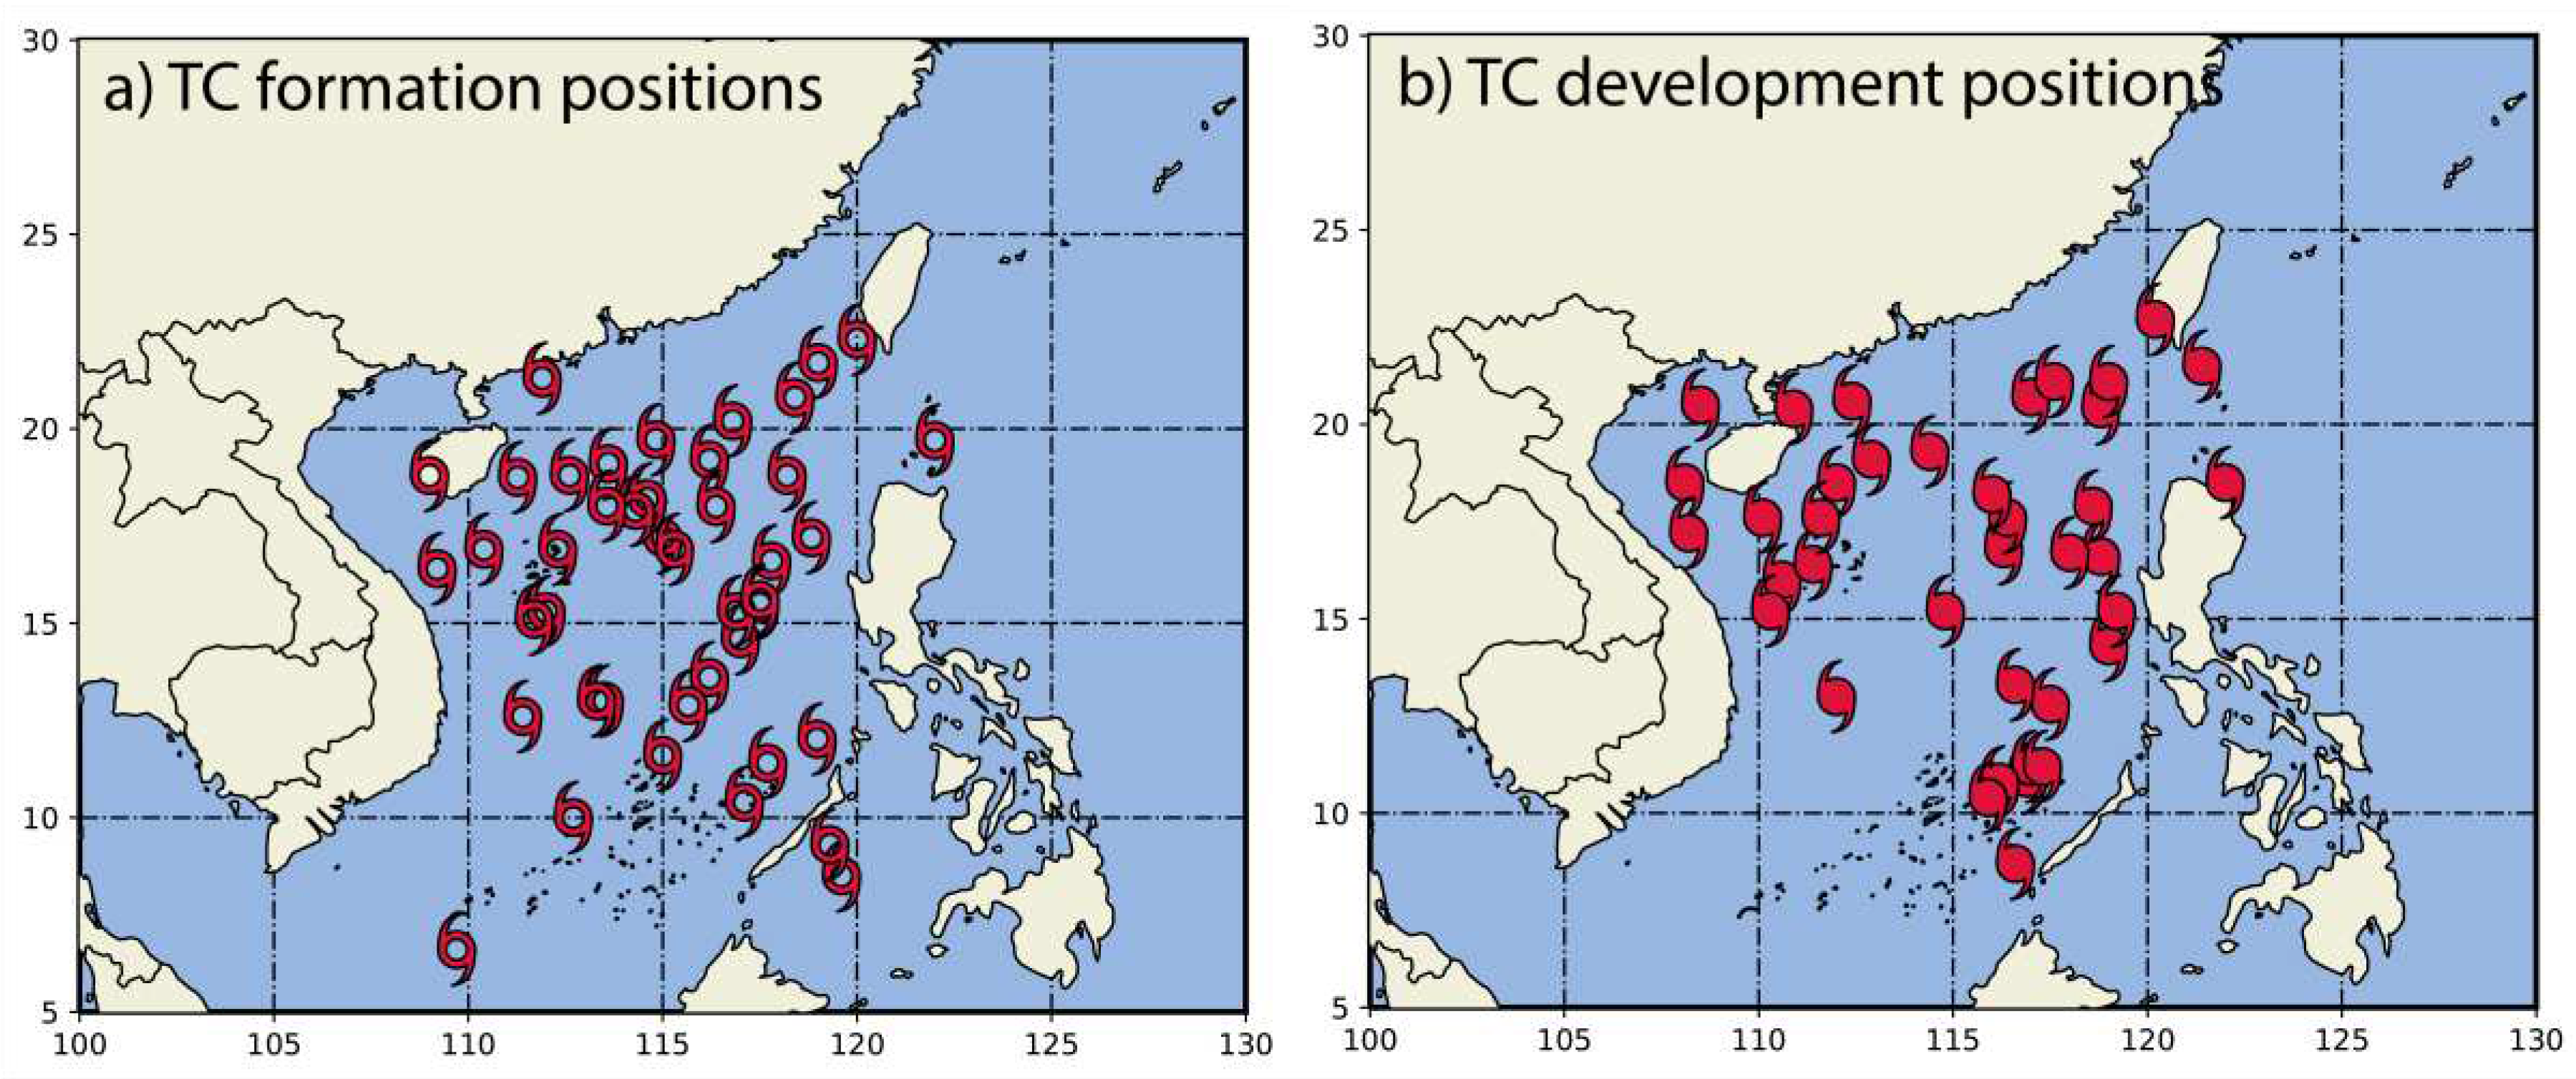
We use the International Best Track Archive for Climate Stewardship (IBTraCS) [
37] as the observed truth for fixed-event settings and statistical verification of the EPS-DA model. Our examination is exclusively centered on TCs occurring within the SCS during their initial stages. A TC formation is remarked when its maximum 10-m sustained wind speed (V
max) exceeds
20 kt (Figure. 3.10a), classifying it as a tropical depression (TD). Subsequently, a TC development is ascertained when V
max reaches a threshold exceeding
34 kt (Figure 3.10b) for the first time, qualifying it as a tropical storm (TS). In certain instances, the phases of TC formation and development may coincide. From the period spanning 2012 to 2019, a dataset of 45 formed TDs and 35 TSs within the SCS region has been culled. While an 8-year duration might not encapsulate the entirety of the model’s skill or performance, it nevertheless provides a foundational grasp of the EPS-DA system’s capacity to replicate observed TC geneses.
With the aim of real-time evaluation of tropical cyclogenesis ensemble forecasts, the boundary and first-guess initial conditions for all ensemble members are derived from the operational NCEP Global Forecast System (GFS) with a horizontal resolution of 0.5°×0.5° updated every 3-hr. In conjunction with the 3 hourly boundary condition updates, all integration methods are performed with sea surface temperature (SST) values also updated every 3 hours to enhance the responsiveness of the TC intensification process to actual SST conditions. The SST field is directly extracted from the GFS (GDAS/FNL) analysis fields of the NCEP product.
For the augmented observation dataset used in the data assimilation scheme, the experiments utilize two primary data sources. The first source is the satellite-derived wind field (Atmospheric Motion Vector – AMV) from the Cooperative Institute for Meteorological Satellite Studies (CIMSS) at the University of Wisconsin [
38,
39,
40,
41,
42]. For the TC genesis study, the CIMSS AMV wind data in the domain are sufficiently sampled to cover the region. The study employs a simplified approach to establish quality control in the assimilation, with a default observation error of 3.5 m s
-1 and corresponding quality index > 0.7. Details methodologies for quality control and error characterization of AMV wind data can be found in previous studies [
38,
40,
41,
43,
44]. In addition, the second data source consists of local observational data within the study domain. These local observations include SYNOP, METAR, ship/buoy observations during the forecast period. These local observational data are irregularly distributed and encompass a variety of data types.
2.3. TC detection
In the study, the objective TC vortex identification scheme employs several fundamental meteorological fields, including the maximum low-level vorticity at 850 – 500 hPa, minimum sea-level pressure (SLP), minimum geopotential height at 700 hPa, and surface wind speed. The three primary steps of the TC detection as follows:
- 1.
Identification of potential TC vortices at each time step
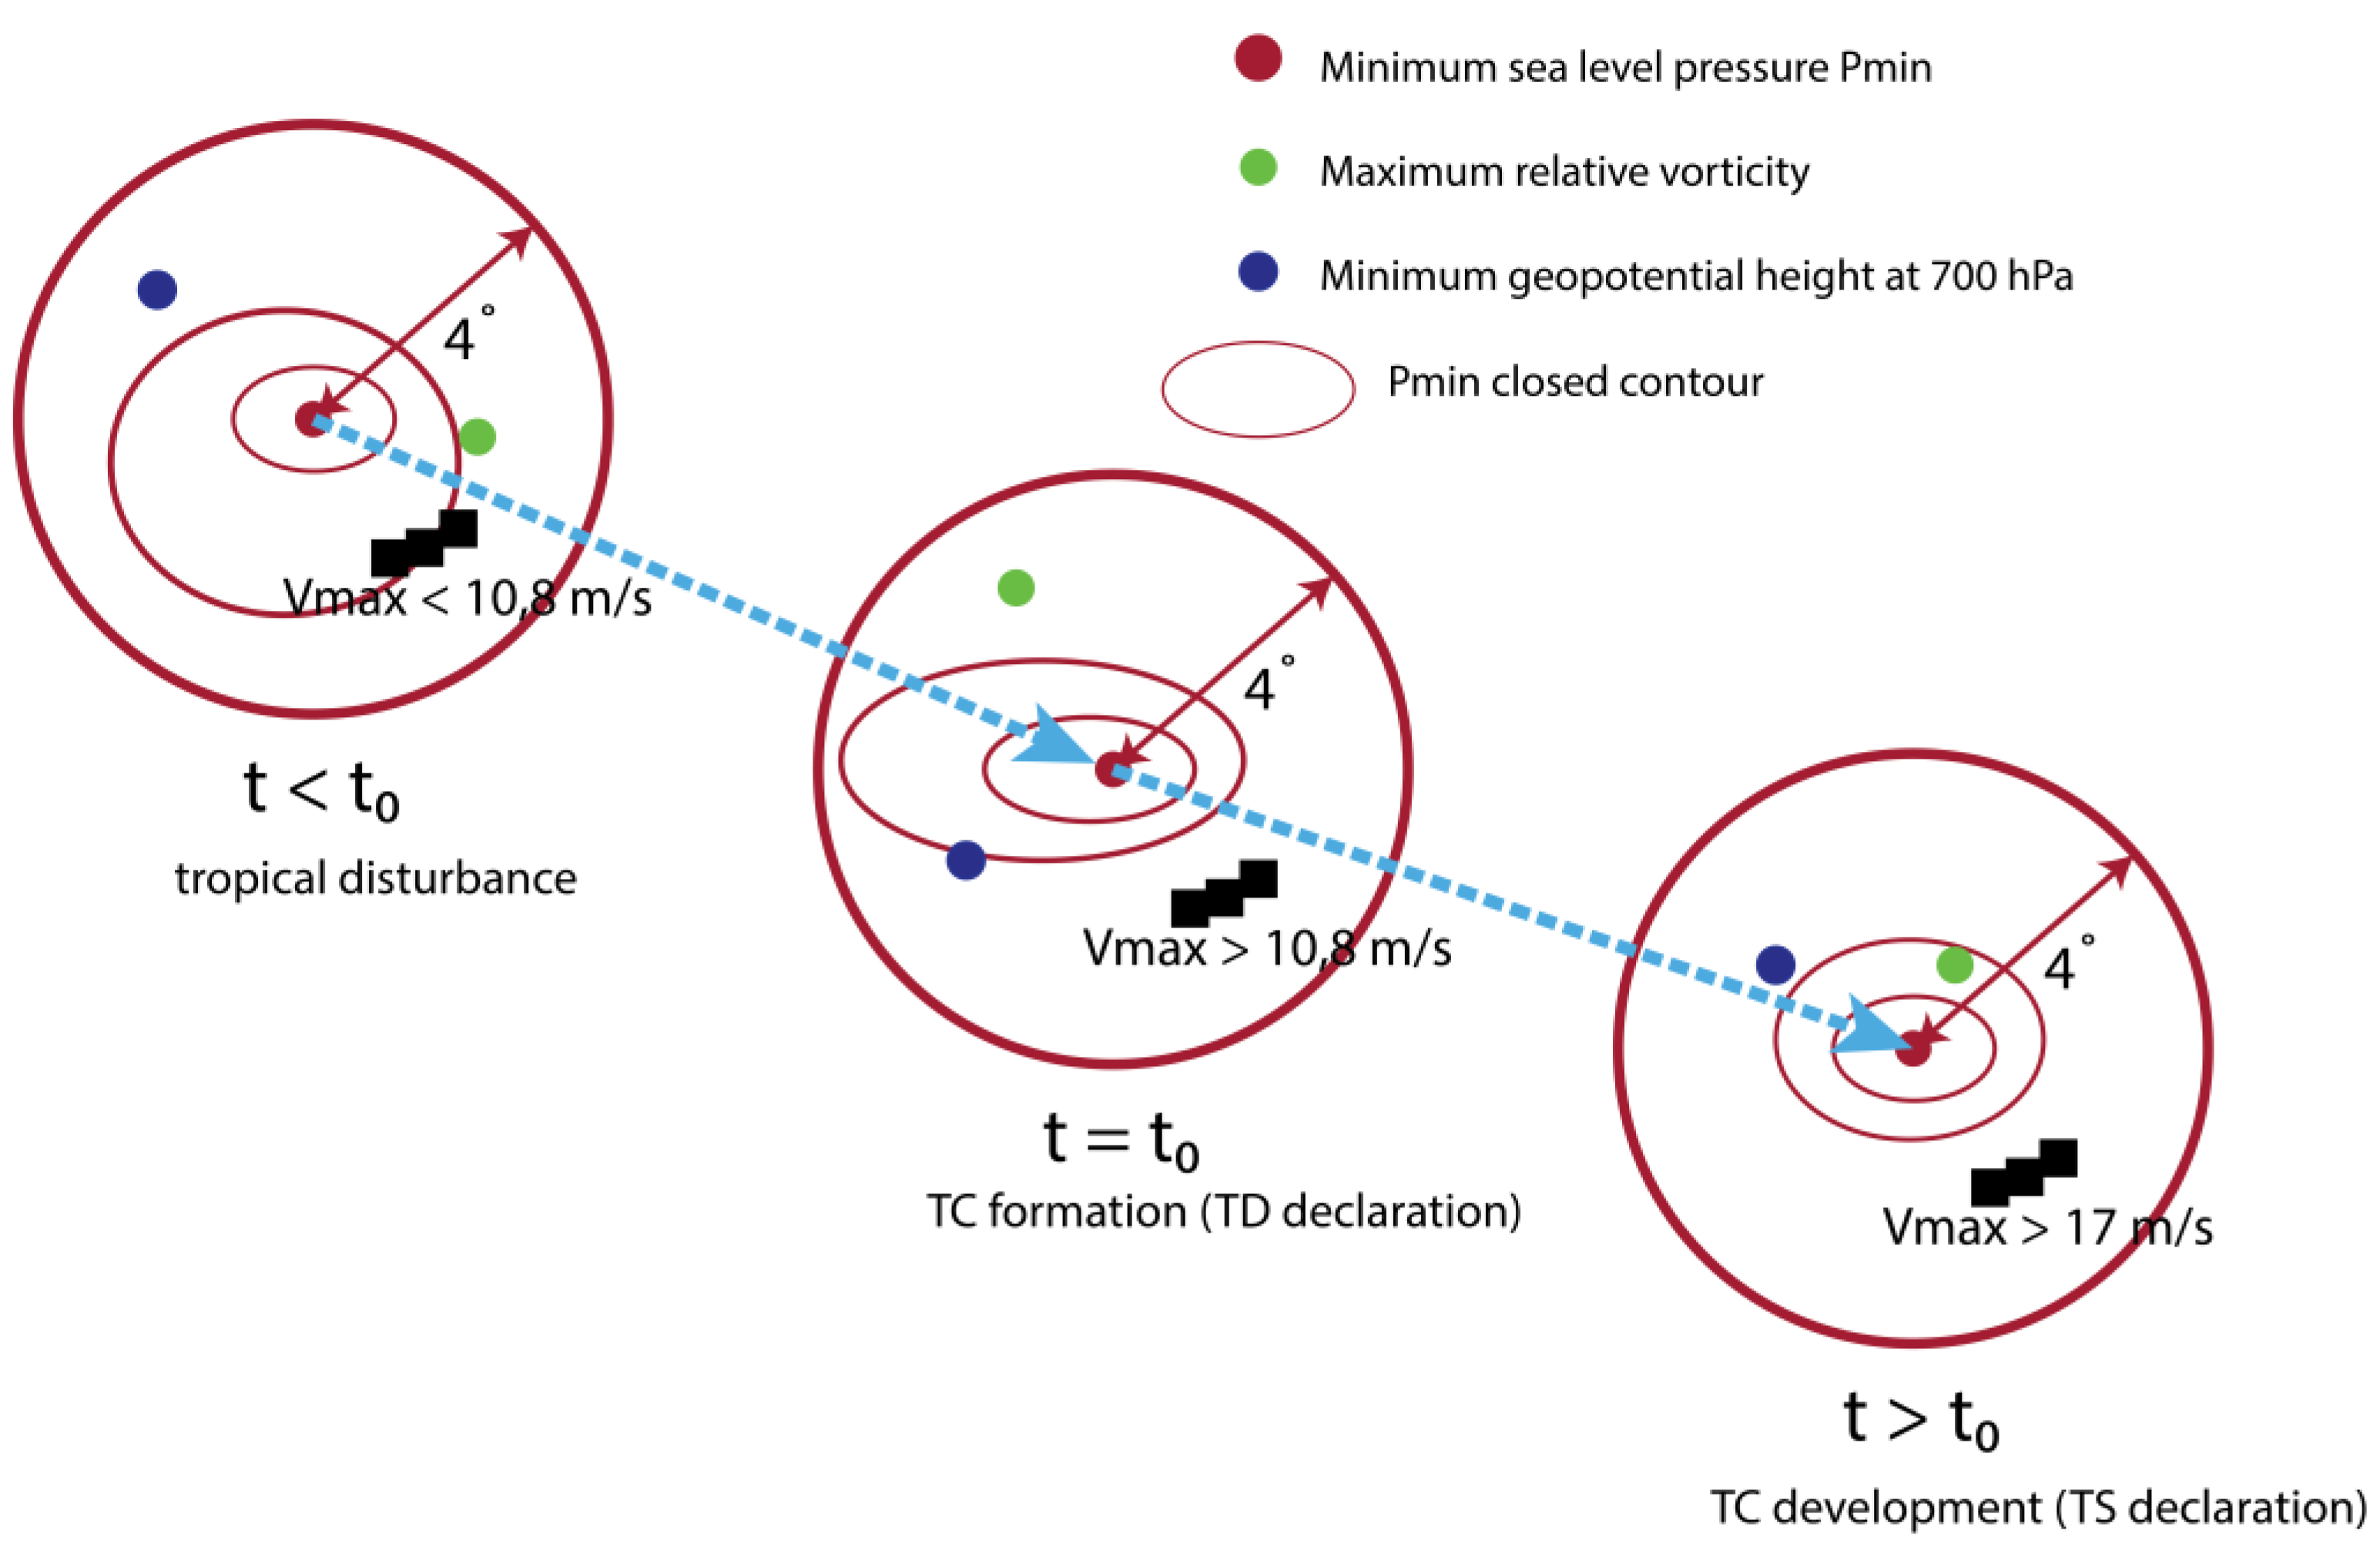
Identify maxima of positive vorticity at 850 – 500 hPa, mimima of sea level pressure (Pmin) and minima of geopotential height at 700 hPa within sub-domains of 12 x 12 grid points. To filter out local extrema, the extremum point must be encompassed by at least 2 closed contours with an interval of 0.1 x 10⁻⁵ s-1 (vorticity); 2 hPa (Pmin) and 4 dam (700-hPa geopotential height).
Combine all marked extremum points to form a nearest points in 2-dimensional space, these sets are stored and identified as potential TC centers. V max within a 4° radii from the corresponding Pmin center is computed.
- 2.
Assessment and selection of TC centers
Instantaneous thermodynamic fields often contain noises and false alarms. Therefore, the study employs the following algorithm to determine TCs from potential cyclonic centers obtained from stage (1):
Condition 1: Potential TC centers (Pmin) encompassing all points of maximum vorticity, and minimum 700-hPa geopotential height within 4° radii. TC centers over land and outside the SCS are excluded.
Condition 2: Selection of TC centers with Pmin < 1004 hPa.
Condition 3: A TC center is considered a TC formation if Vmax ≥ 20 kt (TD intensity) and a TC development if Vmax exceeds 34 kt (reaching TS intensity). TC at the time of formation (Vmax ≥ 20 kt) is considered a reference TC center.
Link the reference TC center (at formation) with all TC vortices persist before and after the formation time. The predefined distance threshold between 2 consecutive TC vortices is 5° (illustrated in
Figure 3).
2.4. Verification of probabilistic forecast
2.4.1. Categorization of cases
The experiments address the problem of forecasting fixed-event occurrences. In this approach, a series of ensemble forecasts are conducted with the goal of assessing the model’s ability to successfully simulate a predetermined TC formation event. Therefore, to evaluate the forecasting skill of the EPS-DA system based on the criteria of accurate event and non-event forecasts, we categorize TCs as follow:
TC formation: a forecast is considered to have correctly forecasted TC formation (FORM) when there exists at least 1 vortex center satisfying the conditions described in
Section 2.3 at any time within the 120-hr forecast period. Tracks of these TC centers corresponding to each individual forecast are recorded, and their potential to TS development in subsequent time steps following their formation are examined. Conversely, forecast members that do not predict the occurrence of TD are categorized as non-formation (NON-FORM).
TC development: Within each track obtained from the ensemble analysis, if a vortex center is identified after the formation with Vmax ≥ 34 kt, then the corresponding forecast is deemed to have forecasted TC development (DEV). If the track does not meet aforementioned condition, they are classified as non-developing cases (NON-DEV).
To score the probabilistic forecast, we use Brier score (BS; BRIER [
45]) and AUC-ROC. In the context of forecasting the likelihood that an EPS-DA system accurately describes the TC genesis, instead of quantifying a specific error value, BS and AUC-ROC serve as a statistical measure for the forecasted probability of a given event.
N represents the total number of observed (formation/development) events. pi corresponds to the forecasted probability of the occurrence, and ai is the actual observation, indicating whether the event indeed occurred (ai = 1) or not (ai = 0). BS lies between [0; 1], and as BS approaches 0, the forecast aligns more closely with reality.
The AUC-ROC (Area Under the Receiver Operating Characteristic Curve) is a representation used to assess the performance of binary classification models, evaluating the ability of a model to distinguish “positive” and “negative” classes based on the model’s sensitivity and specificity [
46,
47]. The AUC-ROC ranges from 0 to 1, with values near 1 signifying accuracy, near 0 suggesting inverse predictions, and 0.5 indicating the model’s inability to classify events. Since all the experiments are designed to target the occurrences of TC formation, we utilize AUC-ROC solely for the classification of TC development.
2.4.2. Environmental conditions of TC genesis
Upon obtaining a collection of TC tracks across all experimental forecasts, we assess the average environmental conditions in the vicinity surrounding the TC center. The evaluated environmental variables can be categorized into two types: dynamic – thermodynamic variables. The choice of these variables is critical for capturing the intensity and potential for the formation and development of TCs, including P
min, low-level vorticity, vertical velocity at the mid-tropospheric levels, and wind shear. As the primary energy sources driving TC genesis over the ocean involve ocean-atmosphere interactions and the release of latent heat energy from condensation, the chosen thermodynamic variables are linked to sources of latent heat energy and moist processes in the proximity of the vortex center. These variables encompass moist static energy, surface latent heat flux, and low-level moisture convergence up to 700 hPa.
Table 1. provides a summarized compilation of the assessed environmental variables in the study.
The quantities are averaged within a radius of 5° around the vortex. Convective activities within approximately 5° distance from the TC center are often related to the intensification of vorticity, constituting one of the most crucial processes influencing the TC genesis.
Table 1.
Environmental variables to assess the evolution of TCs at forming and developing periods.
Table 1.
Environmental variables to assess the evolution of TCs at forming and developing periods.
| Categorization |
Variable |
Descriptions |
| Dynamic |
Pmin
|
Minimum sea-level pressure |
| ζlow
|
Average low-level vertical vorticity |
| ω mid
|
Average vertical velocity in 700 – 500hPa |
| Vsh
|
Vertical shear between 200 and 850 hPa |
| Thermodynamic |
MSE |
Column-integrated moist static energy normalized by Cp |
| SLHF |
Surface latent heat flux |
| HMClow
|
Low-level horizontal moisture convergence |
3. Results
3.1. Verification of TC genesis
3.1.1. Probabilities of genesis
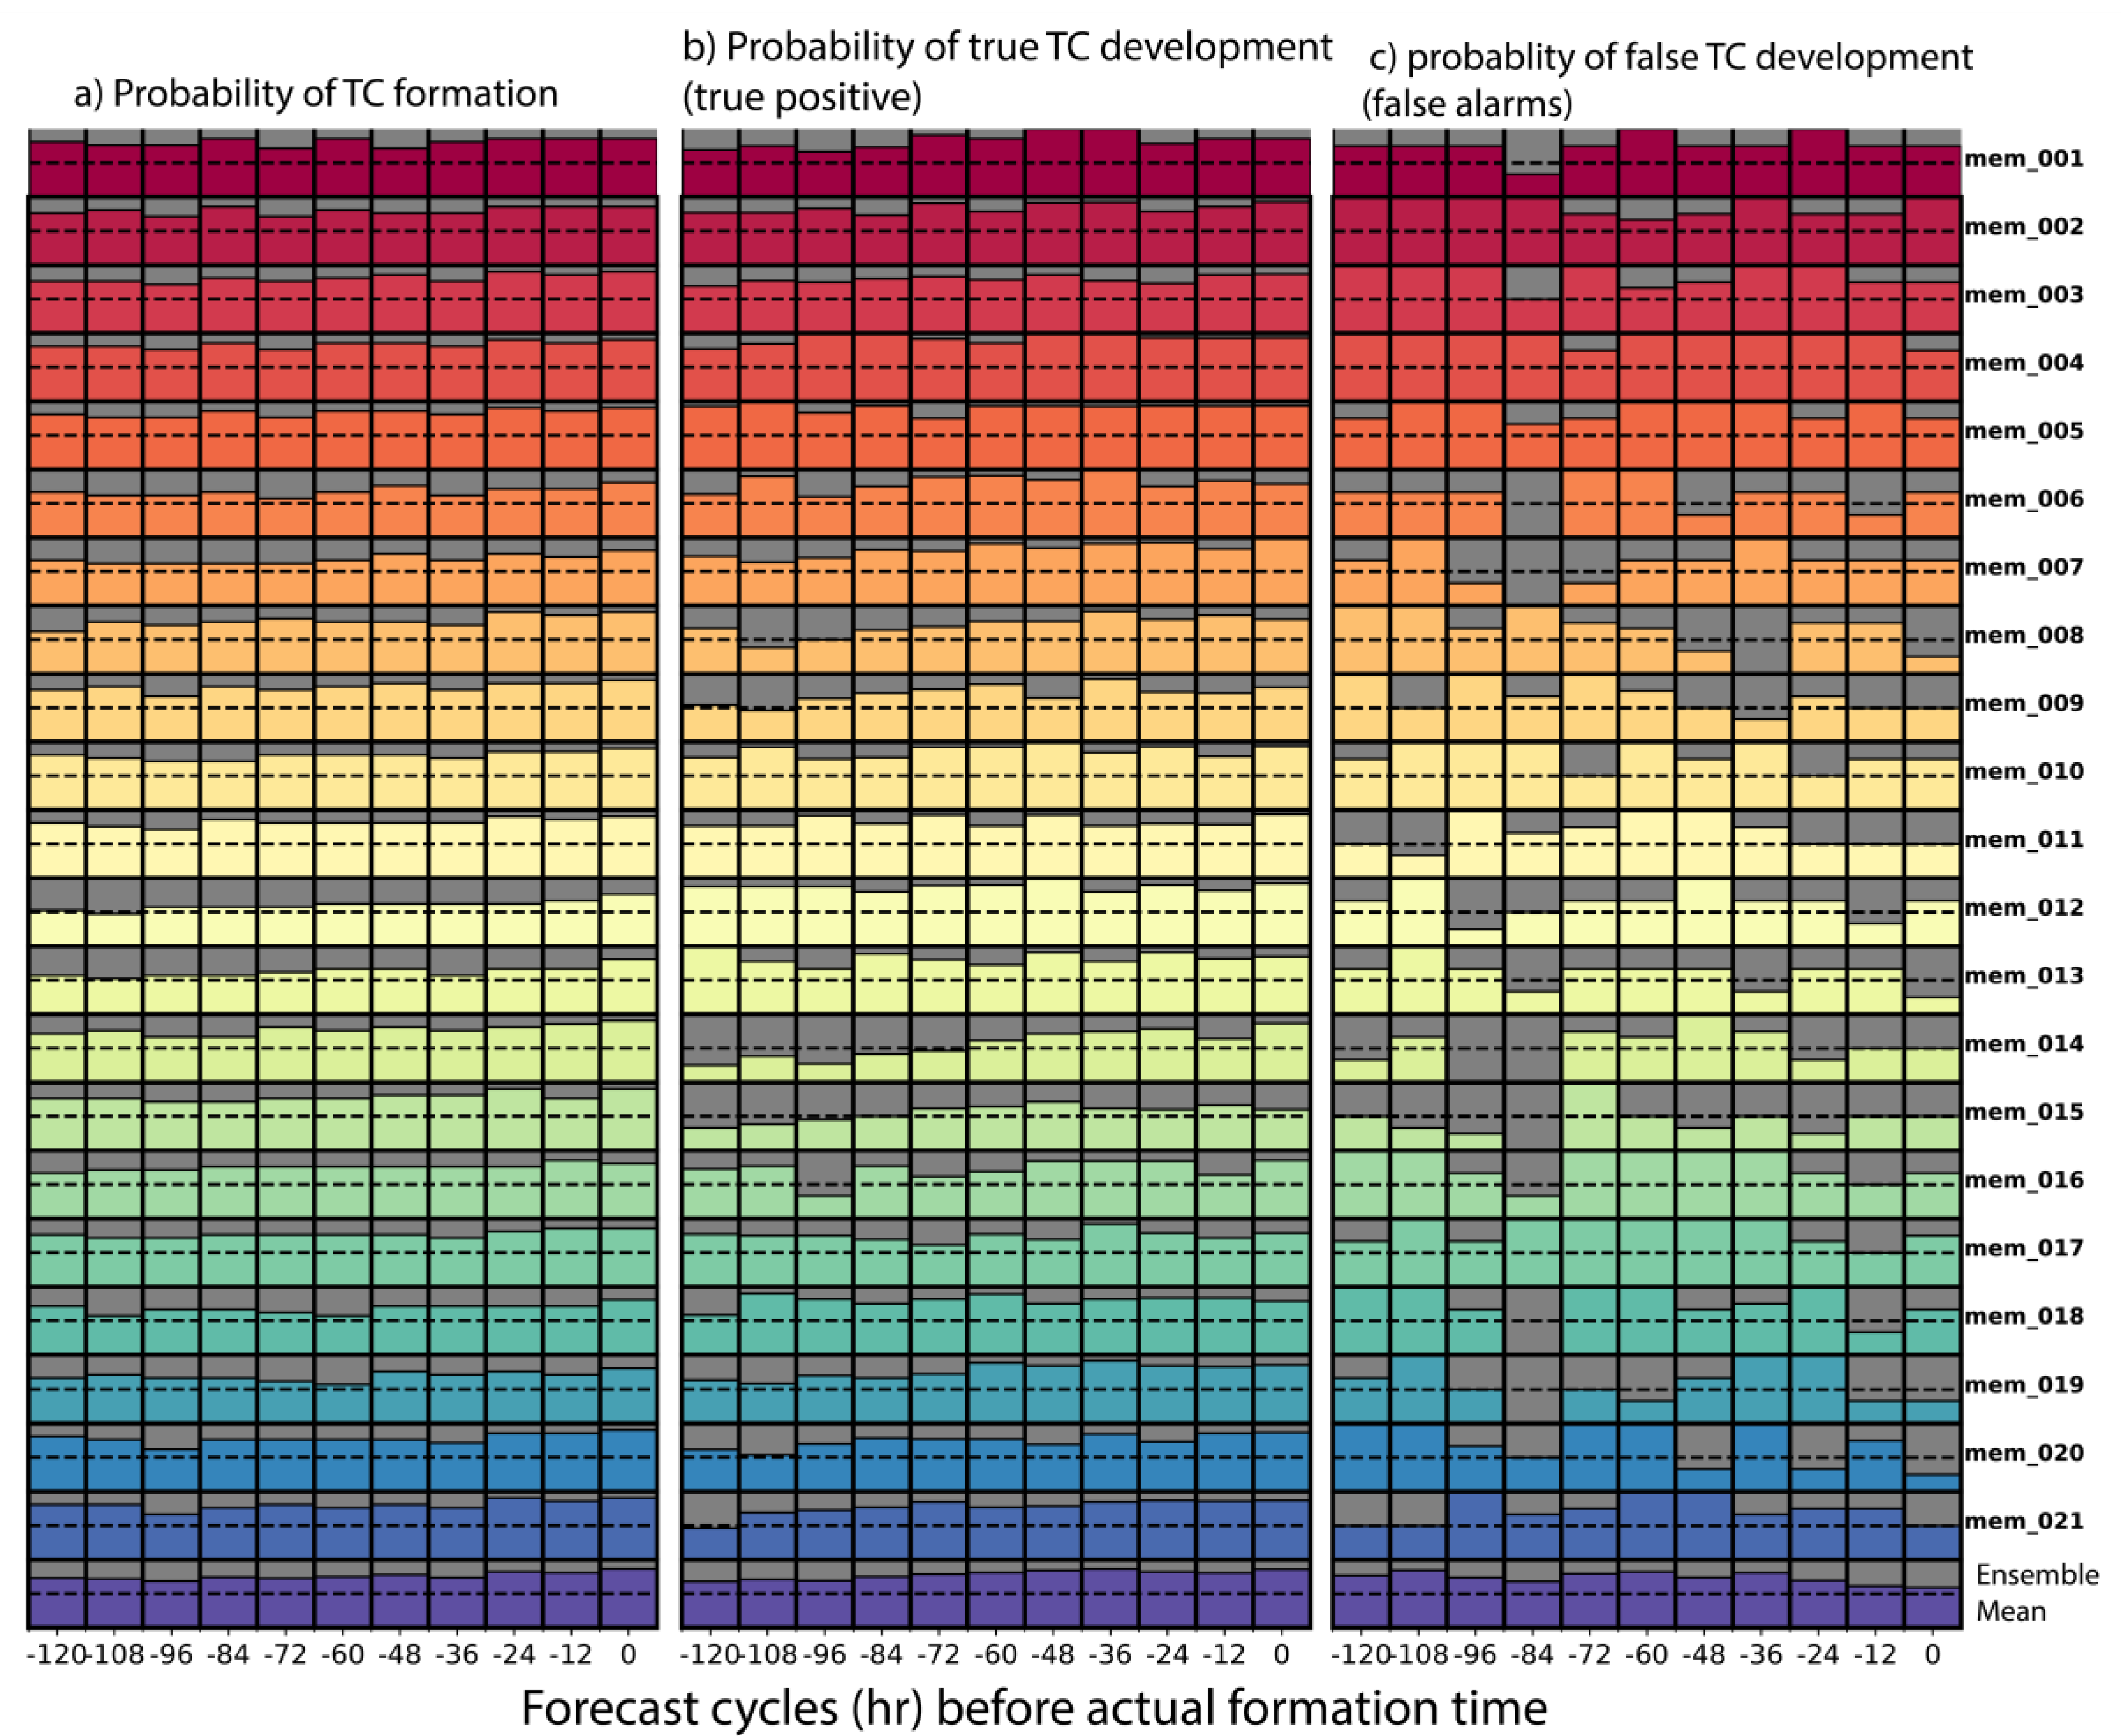
The synthesized tables of the probability of TC occurrences reaching TD intensity and the probability of corresponding cyclones continuing to develop into moderate-level TS are presented in
Figure 4. Overall, the forecasting skill of TC formation/development depends on the lead time. As the forecast cycles approach the actual formation time, the accuracy of predicting TC formation and development improves. This is evident in the increasing occurrence probabilty of accurately forecasted cases in the ensemble mean composite and the gradual decrease of the Brier score toward 0 in the near forecast cycles.
For the formation forecasts, the WRF-LETKF ensemble system demonstrates reasonably good forecasting skill up to 5-day lead time, with the lowest Brier score occurring at 3.5 days before the formation time (equivalently to 84 hours cycle). With the 48-hr forecast cycle, the ensemble system shows a stable increase in the probability of hit cases.
However, for the development forecast of TCs, the Brier score indicates a significant decrease compared to the formation forecast, with most values exceeding 0.1 and a clear decreasing trend in the near forecast cycles. When combined with the AUC-ROC skill score, it is observed that the EPS-DA model performs well in classifying the development of TCs in the forecast cycles from 96-hr, 84-hr, and 48-hr onward (AUC-ROC achieving values > 0.6). In the forecast cycles of 120-hr and 108-hr (4.5 – 5 days before the formation time), the model fails to classify the possibility of TD development into storms.
Nevertheless, the forecasting skill also relies on the performance of individual ensemble members. The statistics show that for the formation forecast, the listed members mem_006, mem_007, mem_012, and mem_013 exhibit the worst probability of detection for TC formation. The occurrence frequency of TCs in these ensemble members only significantly increases at the 48-hr forecast cycles. Correspondingly, mem_008, mem_014, and mem_015 show notably lower forecasting skill for the development of TCs compared to other groups. Thus, despite all ensemble members being provided with similar initial conditions and data assimilation, different combinations of physical parameterization schemes yield diverse forecasts for the formation and development of TCs. The multiple physical parameterization schemes, including convection, microphysics, planetary boundary layer processes, and longwave-shortwave radiation, all contribute significantly to the processes of TC genesis from initial disturbances. Therefore, the selection of physical schemes is crucial in the forecast of tropical cyclogenesis.
Table 2.
Values of Brier score and AUC-ROC to evaluate the quality of EPS-DA system in forecasting TC genesis at different forecast cycles.
Table 2.
Values of Brier score and AUC-ROC to evaluate the quality of EPS-DA system in forecasting TC genesis at different forecast cycles.
| |
|
-120h |
-108h |
-96h |
-84h |
-72h |
-60h |
-48h |
-36h |
-24h |
-12h |
0h |
| |
|
| Brier Score (formation) |
0,028 |
0,047 |
0,037 |
0,090 |
0,038 |
0,062 |
0,039 |
0,039 |
0,033 |
0,016 |
0,011 |
| Brier Score (development) |
0,294 |
0,283 |
0,268 |
0,212 |
0,246 |
0,269 |
0,228 |
0,187 |
0,235 |
0,179 |
0,166 |
AUC ROC
(development)
|
0,471 |
0,510 |
0,667 |
0,767 |
0,558 |
0,580 |
0,741 |
0,779 |
0,608 |
0,673 |
0,750 |
3.1.2. Predictability of TC positions at genesis
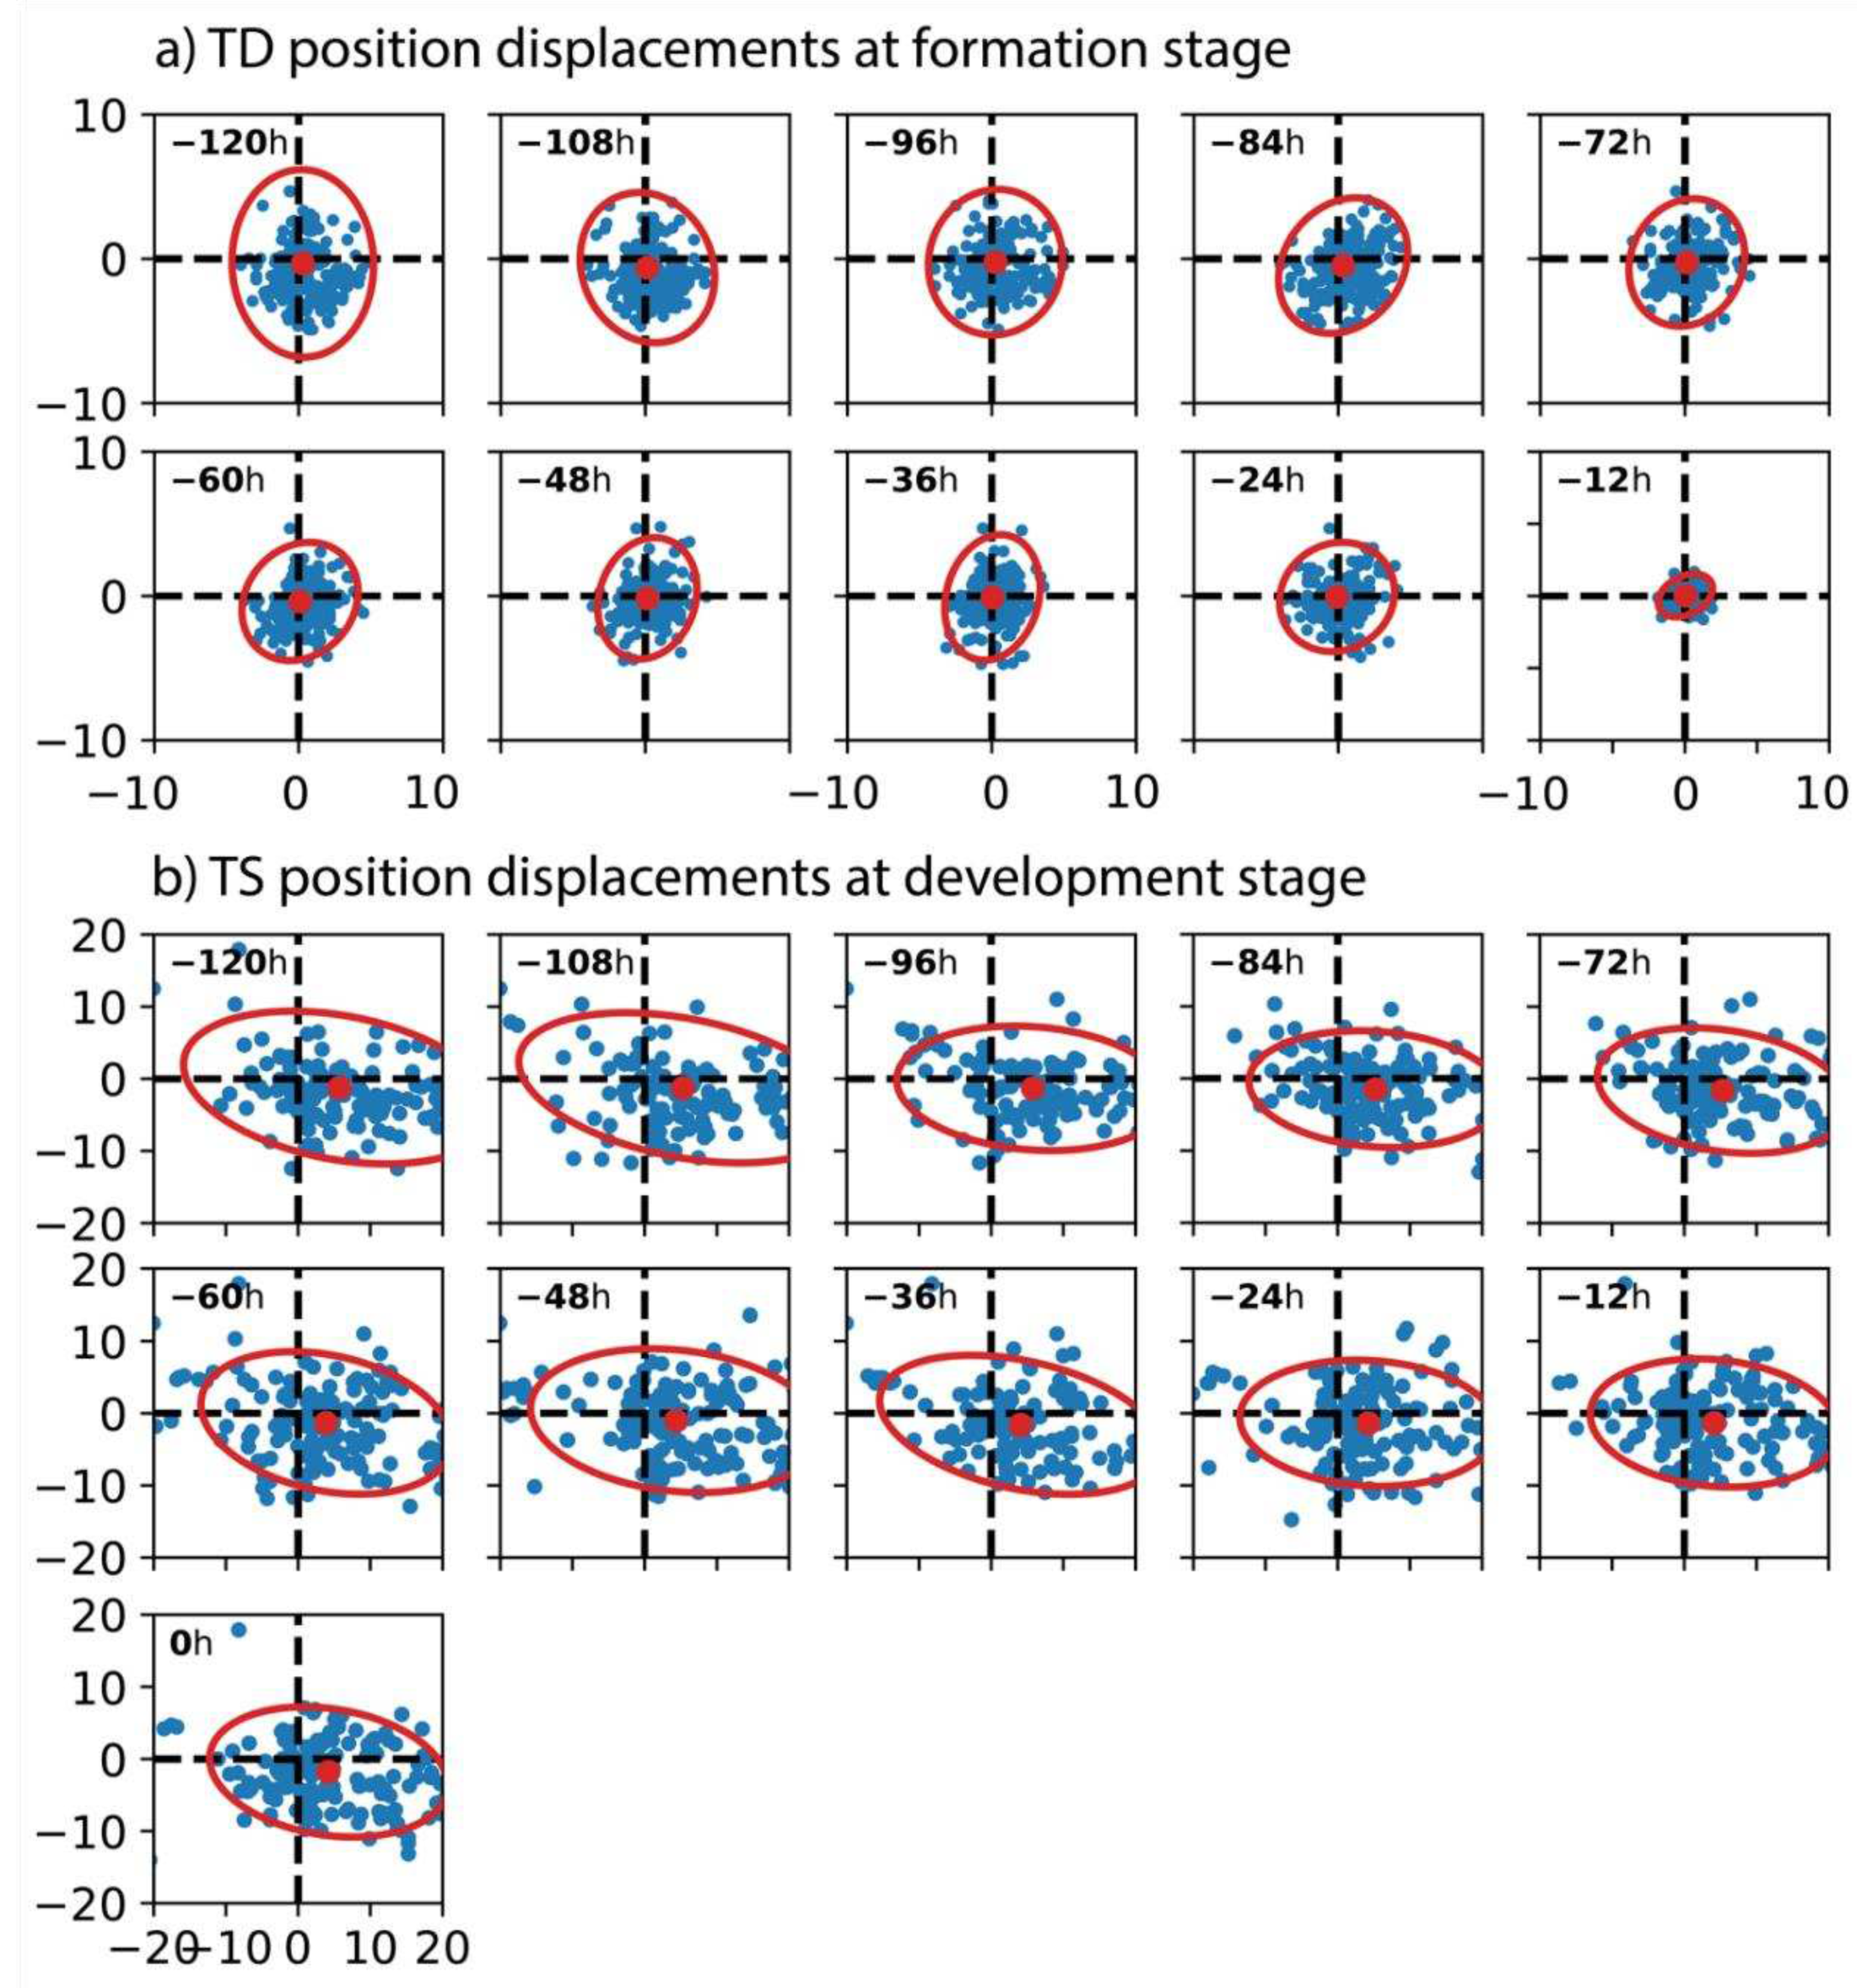
To evaluate the statistical error of the relative distance between the positions of TC centers during the formation and development stages and their corresponding actual forming locations, the study constructs ellipsoidal shapes representing the 3-sigma dispersion of the error distribution (
Figure 5).
Regarding the performance of the regional EPS-DA system for predicting the formation of TDs, the forecasted cyclone centers generally exhibit a tendency to converge toward the mean value as the forecast cycles approach the actual formation time, as indicated by the decreasing dispersion and error values approaching zero with the forecast cycles. Overall, this convergence occurs gradually, with occasional abrupt changes observed at the 12-hr forecast cycle before the actual formation time, resulting in a significant reduction in the ellipsoid size compared to the previous cycles. This finding aligns with the statements drawn above while analyzing the number of ensemble members correctly predicting formations. The sudden changes in the forecasting skill for the formation and location of the cyclone centers in the 12-hr forecast cycle suggest an optimized forecasting approach for TC formation when considering the interactions between atmospheric circulations at different scales. Notably, the spatial error distribution tends to change from stretching in the north-south direction (at 120-h forecast cycle) to nearly uniformly distributed and centered around the score of 0 in most forecast cases, corresponding to the tendency of the forecasted cyclone centers to converge toward nearby observational values. Hence, early forecasts from 3-5 days still provide crucial information for the prediction of TC formation, allowing the estimation of TDs developing into storms 5 days ahead by assessing the spatial distribution of the forecasted cyclone centers. One explanation is that a majority of the tropical disturbances in the SCS originate from the active areas of the monsoon (including depressions along the monsoon shearline, monsoon confluence zone and the southwesterlies,…) [
48,
49,
50,
51,
52] with persistence cycles up to 10 days, according to the study of Hsieh
, et al. [
53]. Therefore, the EPS-DA system can capture the general dynamic conditions leading to TC formation in these areas 5 days in advance before its actual occurrence.
3.1.3. Predictability of genesis timing and intensity
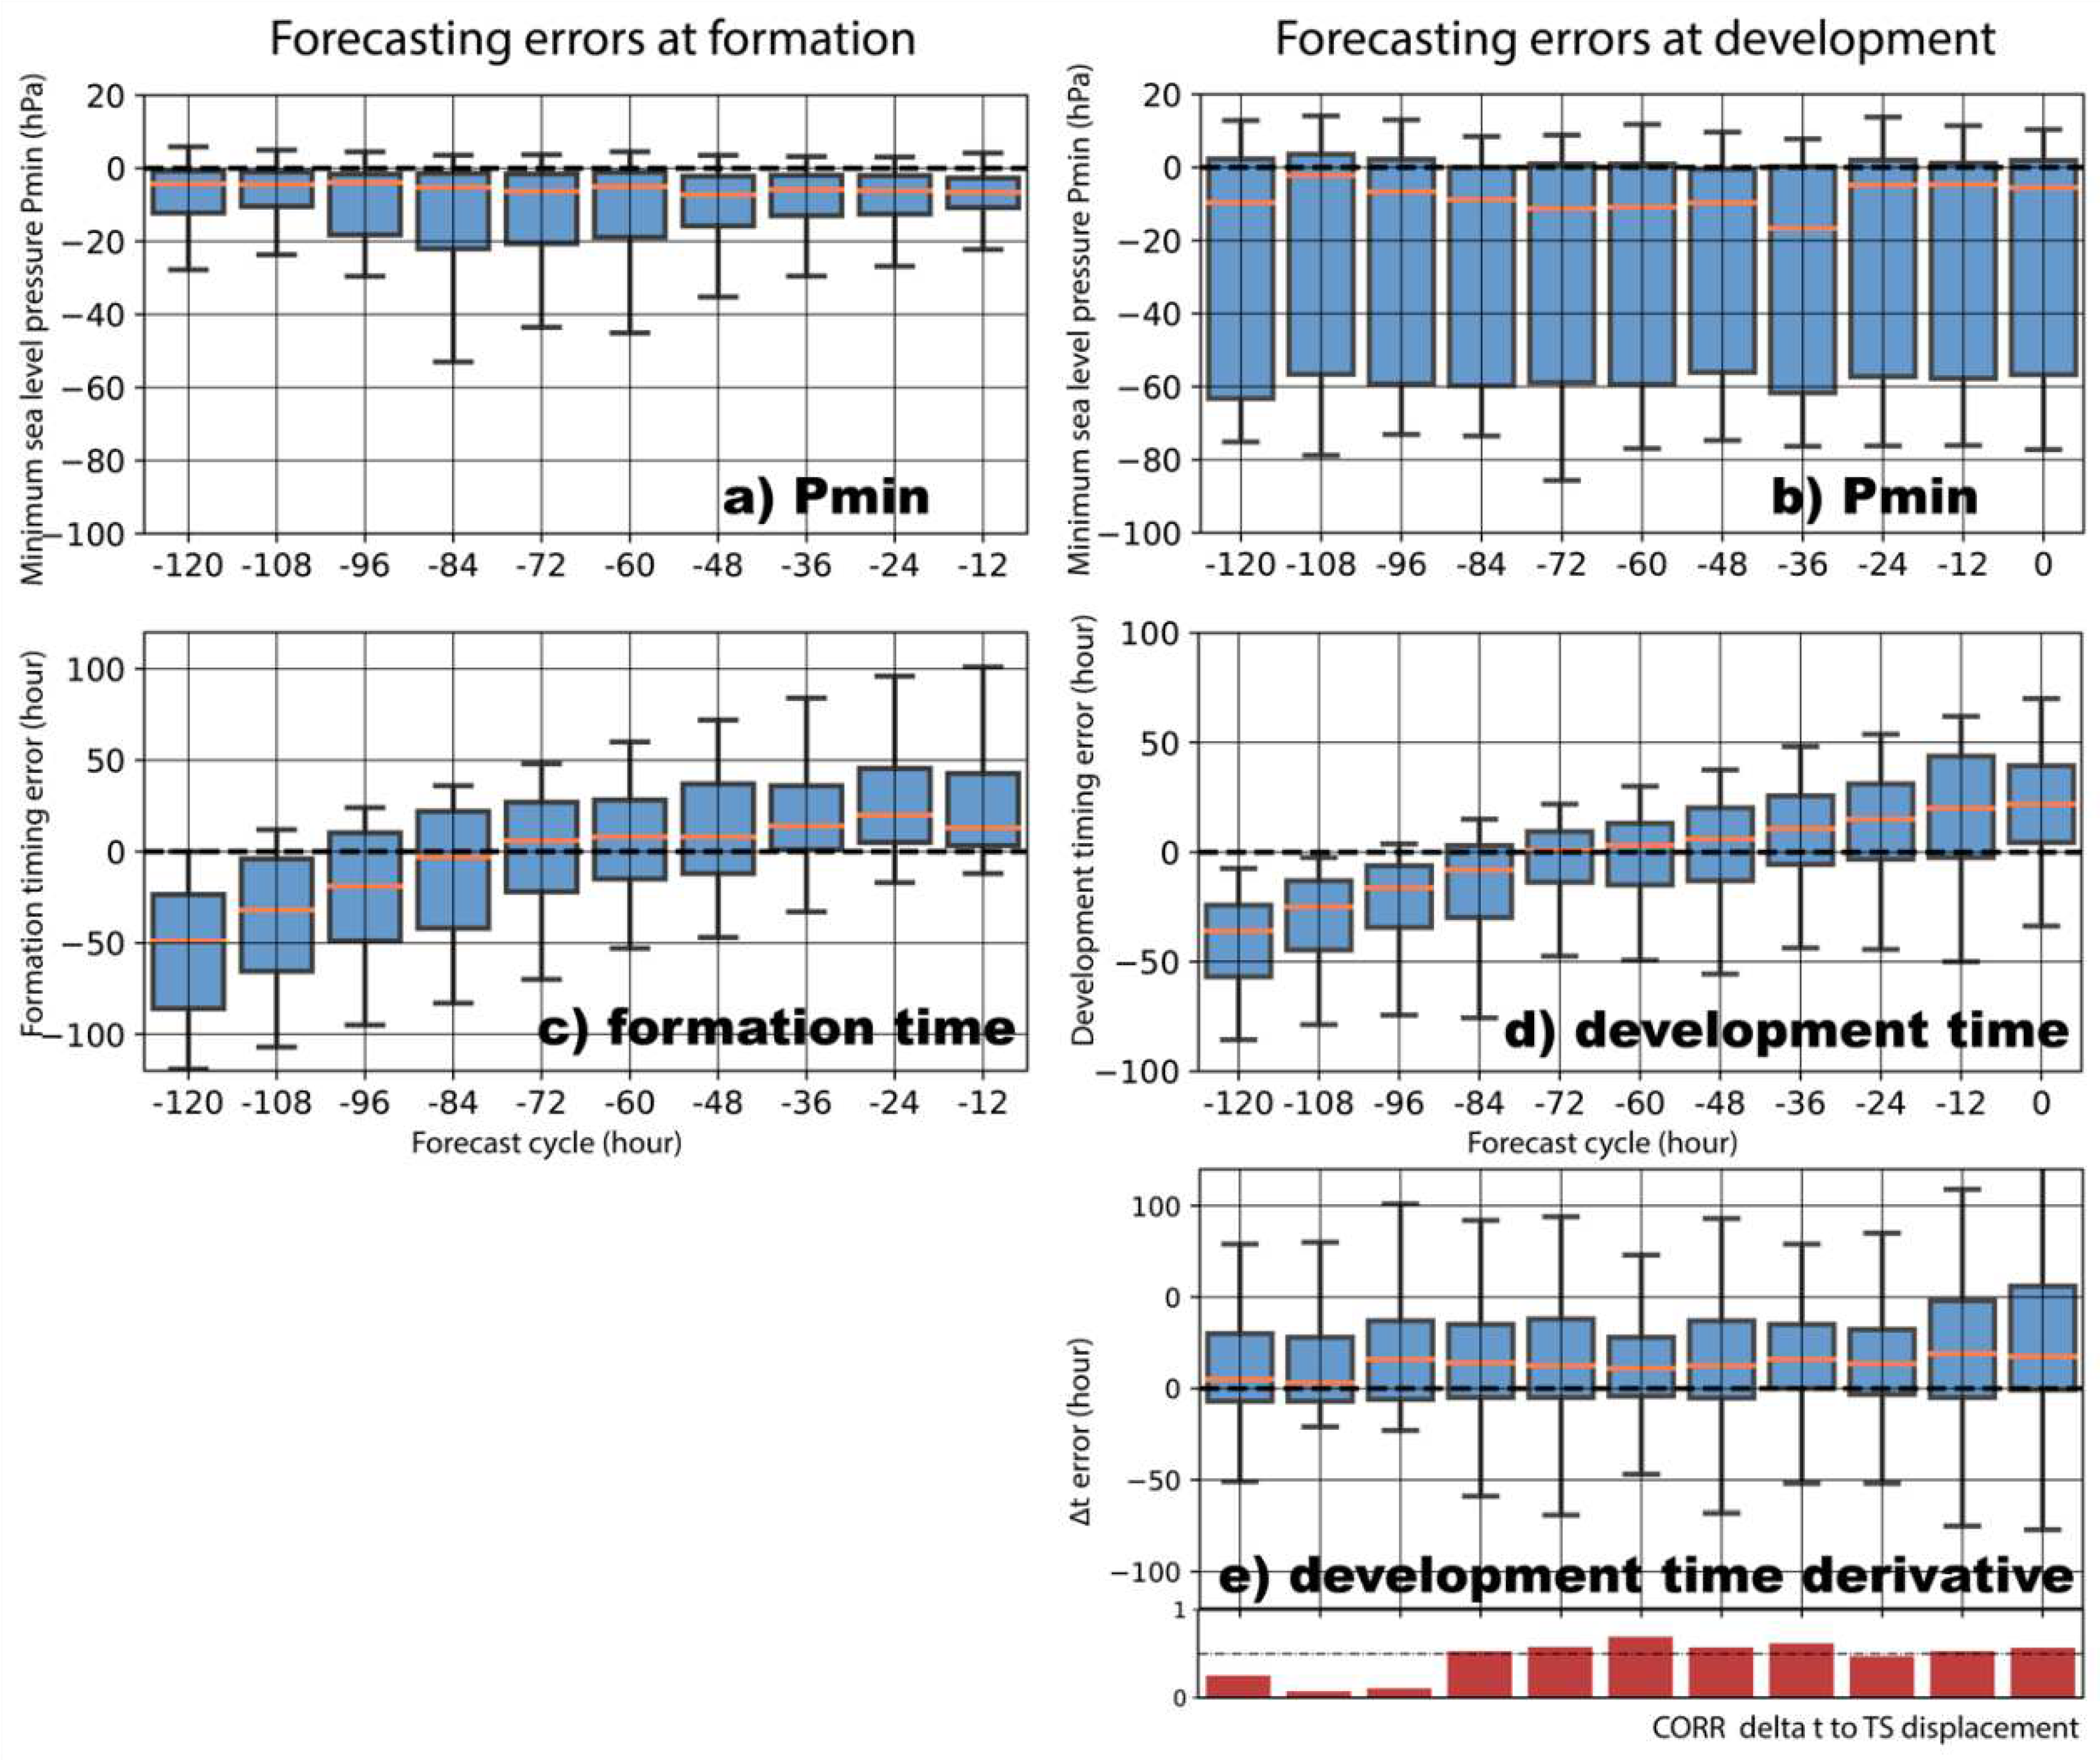
Throughout the tropical cyclogenesis period, the ensemble prediction system tends to predict TCs with intensities relatively higher than the observational values, as evidenced by the errors in P
min at the formation and development times across all forecast cycles (
Figure 6a-b). The median error values in the formation forecasts show little noticeable change and have errors of approximately 2 – 3 hPa compared to the observational values. The P
min errors increase for the development forecasts of TCs. These results may be due to the numerical model’s tendency to predict deeper TCs than observed, especially in longer forecast lead times. However, the spread is uneven throughout the forecast cycles, with more than 50% of the absolute error of P
min falling below 20-hPa for most of forecast cycles. The forecasting skill for the intensity of developing TCs is relatively good at the 108-hr forecast cycle and worst at the 36-hr cycle. Regarding the forecast of the timing errors for the formation and development, the forecasts show significant improvements as the forecast cycles approach the actual times. The best forecasts are obtained from 96 to 48-hr cycles (equivalent to from 4 – 2 days), with the timing error spread (in terms of interquartile range) encompassing the analysis value. The remaining cases either show forecasts that are too early or too late compared to the actual formation and development times.
Figure 6 illustrates the errors in this time frame, indicating that in most forecasts, TCs take longer to develop compared to observed, especially in the closer forecast cycles. This delay can impact the development location and the intensity of the TCs. Combining the analysis with … it suggests that the ensemble DA system often provides late warnings for TDs to develop into storms, impacting significantly the position of the storm’s development through verification with the positive correlation coefficient values. This result can be explained by the fact that TCs are not stationary weather systems solely influenced by the environmental steering flow induced by large-scale atmospheric circulations; thus, differences in development durance can easily lead to errors in the position of the storm’s development. The forecasting skill of the model decreases as the forecast lead times increase due to the chaotic nature of the atmosphere, which can blur essential information assimilated from the initial conditions.
In other words, the ensemble prediction for the event of a near-accurate TC formation in terms of timing, formation location, and vortex intensity does not necessarily offer more precise information about the cyclone’s subsequent development to attain TS intensity. No-forming tropical disturbances and mis-forecasted TCs that failed to accurately predict development may fall under the category of forecast errors. However, these cases can still provide valuable insights to forecasters when utilizing the WRF-LETKF ensemble DA model in operational tasks. In the following section, the study proceeds to assess the forecast quality of the ensemble members by investigating the environmental conditions’ changes favoring tropical cyclogenesis simulated by the prediction system across forecast cycles.
3.2. Composite analyses of environment conditions favoring tropical cyclogenesis
From the general assessment as described above, the EPS-DA demonstrates good performance in capturing the formation and development of TCs with a forecast lead time up to 5 days. With the characteristics of probabilistic forecasting and correlation with environmental conditions, the study conducts an analysis and comparison of the variations in some dynamic and thermodynamic factors between the forming/non-forming (FORM/NON-FORM) and developing/non-developing (DEV/NON-DEV) groups. The goal of this comprehensive assessment is to clarify the factors that create favorable or adverse conditions for these dynamic interactions in shaping the structure of TCs during the formation and development stages forecasted by the WRF-LETKF.
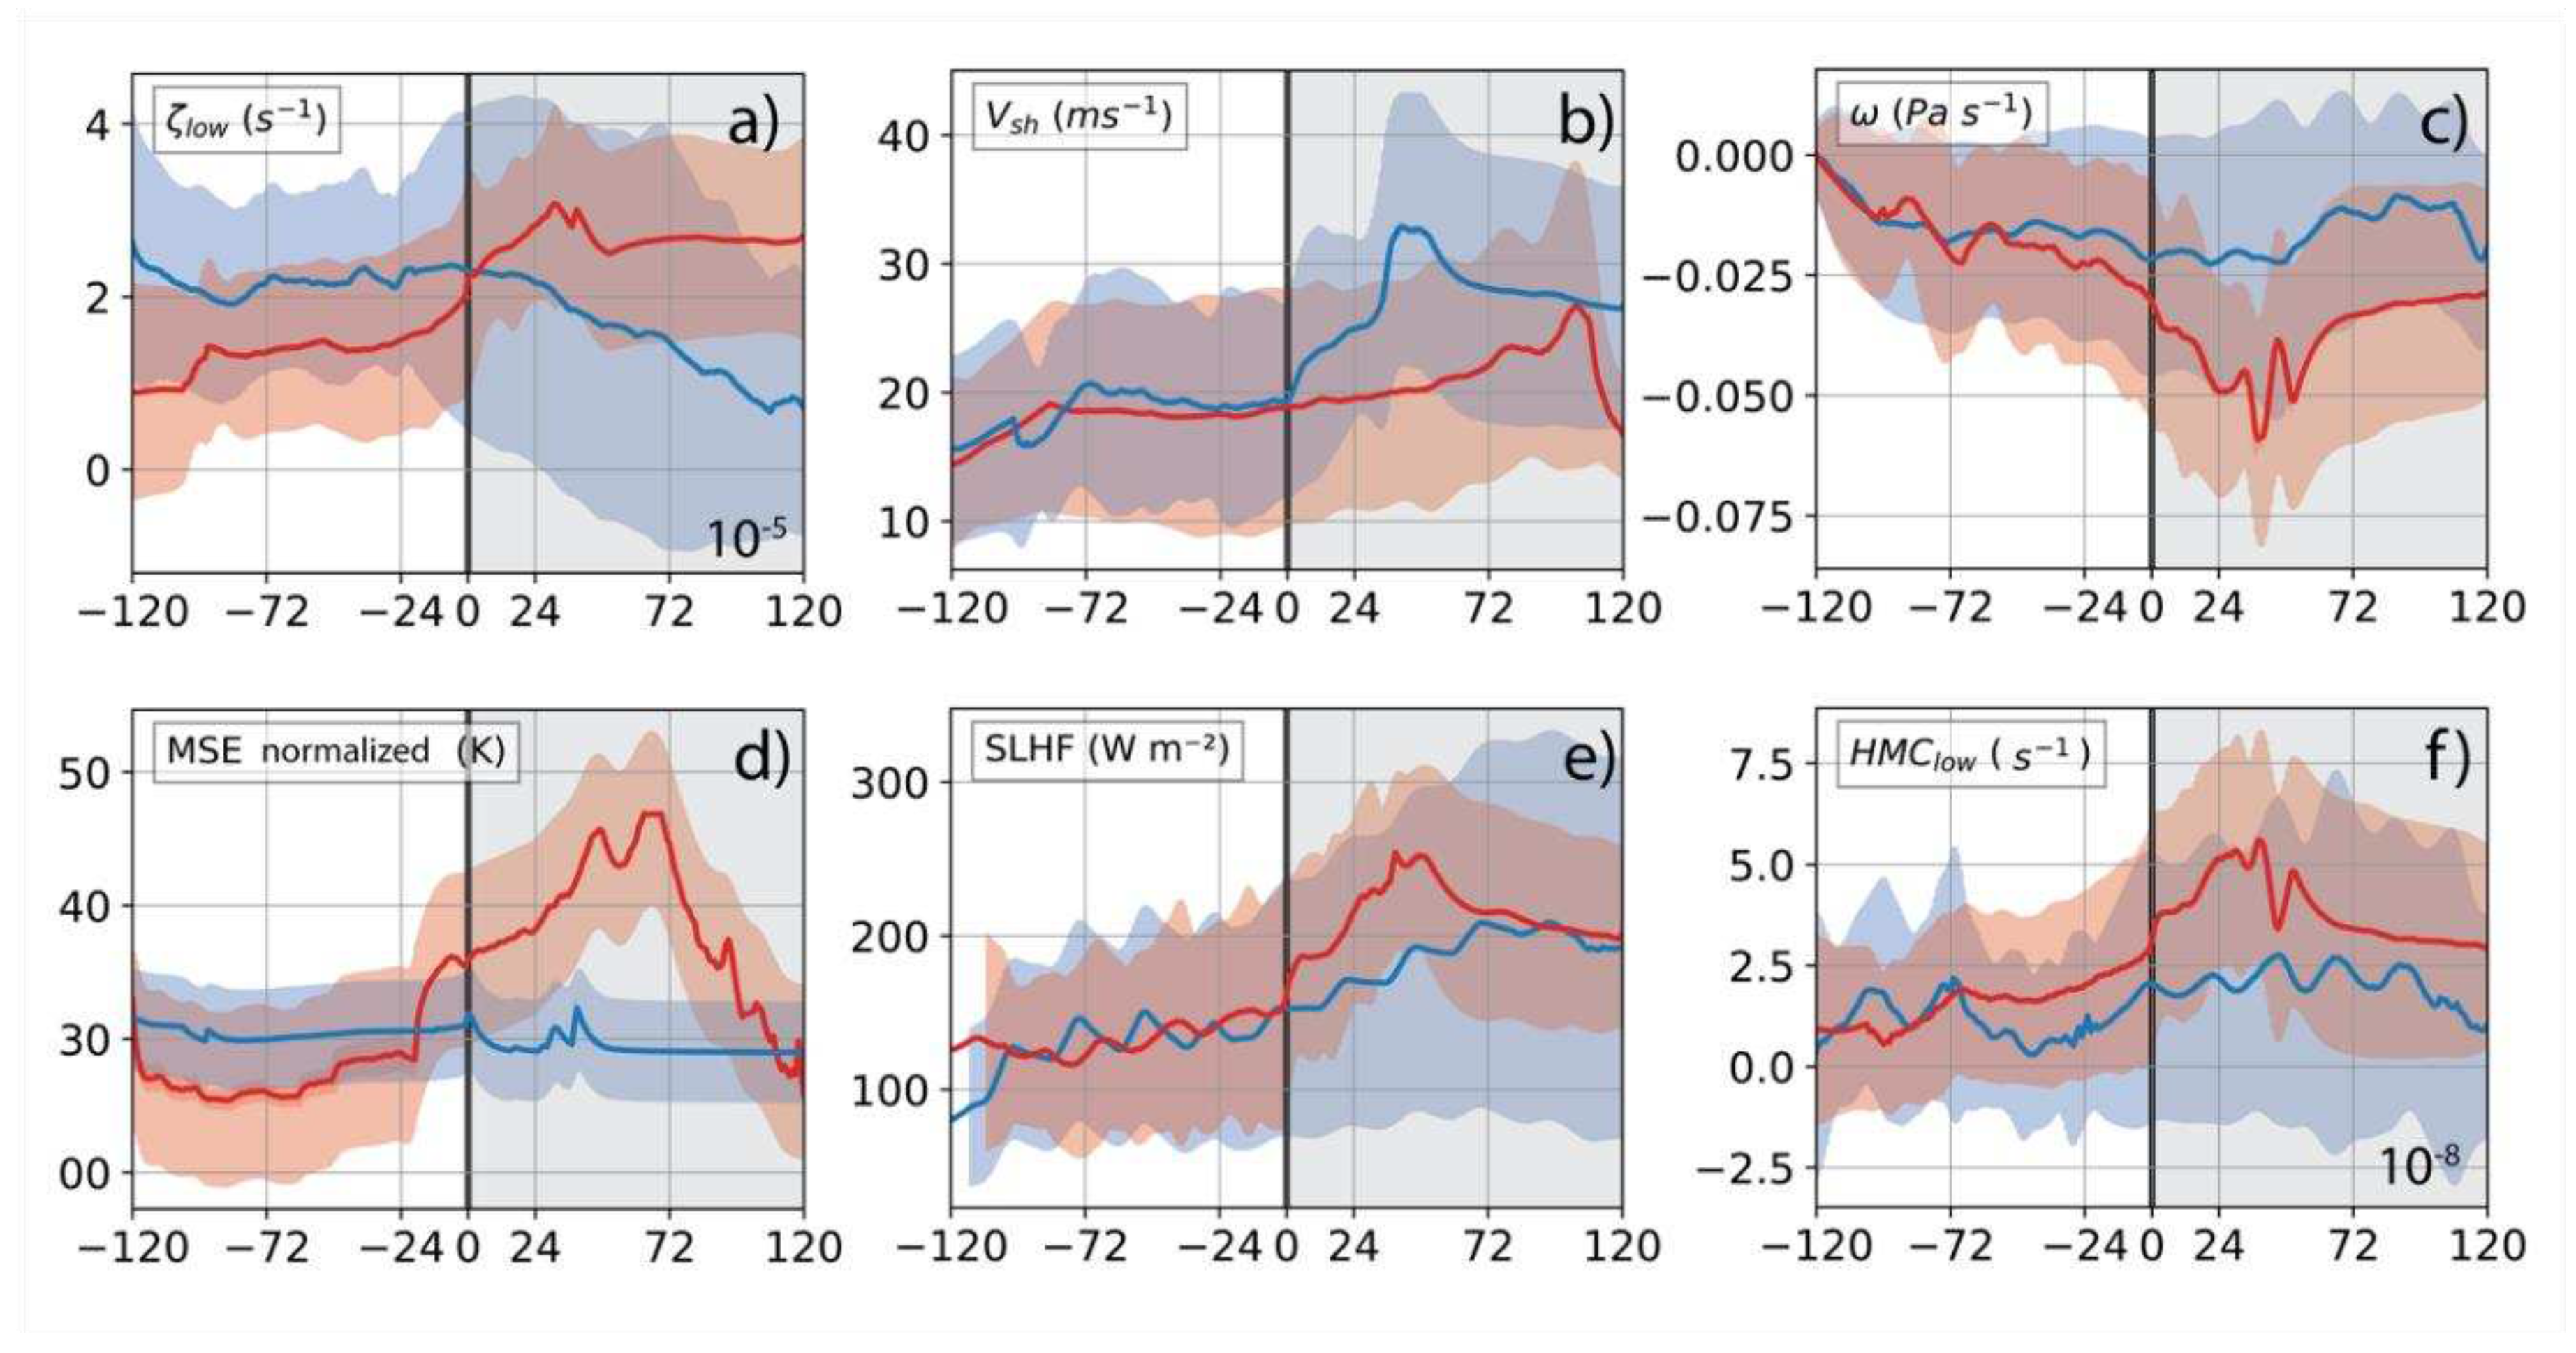
Figure 3 illustrates the distribution of average dynamic values within a 5° radii surrounding the center of TCs and their temporal variations among different groups. During the formation period, the dynamic variables exhibit insignificant differences between the two groups. Both groups experience a steady increase in vertical wind shear. Notably, the significant difference between the FORM and NON-FORM groups lies in the distribution spectra of column-integrated moist static energy (MSE) from 1 days, vertical velocity from 2.5 days, and low-level HMC from 3 days before formation. These variables are indicative of convective processes and enhanced moisture in the atmospheric column. The average moist static energy (MSE) over the entire column in TC’s core region is an important feature reflecting the oscillation of moisture related to organized convective activities [
54], and enhanced MSE signifies intensified TC intensity [
55]. Thus, it can be observed that enhanced convective processes during 3 days before TC formation can play a crucial role in determining the TC genesis, as forecasted by the WRF-LETKF ensemble assimilation system. Notably, there is a phase shift in the values of vertical vorticity between the FORM/NON-FORM and DEV/NON-DEV. In FORM group, the region of tropical disturbances’ activity tends to start at relatively lower vorticity compared to the NON-FORM, then increases significantly, while vorticity in the non-forming disturbances remain nearly unchanged throughout the period. This indicates that the model forecast can potentially resolve additional environmental conditions fore enhancing the vorticity process, especially in FORM group, rather than focusing solely on vorticity at a fixed time that cannot distinctly differentiate the potential for TC genesis.
Figure 7.
The time evolution of the mean dynamic - thermodynamic variables corresponding to the TC centers in FORM/DEV groups (red lines) and the NON-FORM/NON-DEV group (blue lines). The red/blue background corresponds to the standard deviation range of the dynamic variables in the 2 groups. For the FORM/DEV groups, the time reference point 0 is determined at the time of TC formation. For the NON-FORM/NON-DEV groups, the time reference point 0 corresponds to the time when minimum Pmin is reached along the track.
On the contrary, the results show distinct temporal variations in the environmental conditions between the developed and non-developed groups. The DEV demonstrates significant enhancements in rapid low-level vorticity, average vertical velocity, moist static energy, latent heat flux, and low-level moisture convergence. The time to reach the peak of these variables generally falls within the range of 36-72 hours after TC formation. All of the dynamic variables exhibit similar variations, with the average vorticity displaying slower enhancement but a much larger variation range compared to other variables. Alongside the pronounced differences in fields related to moisture enhancement and convective activities, vorticity of the NON-DEV rise rapidly after the formation time. Typically, TC tends to form and develop in areas with weak vertical wind shear near the storm’s center. Along with the dispersion of energy due to increased shear and diminished convective processes, these could be primary factors leading to the weakening and dissipation of TC in the SCS. It is also important to note that the wind shear quantity between 850 – 200 hPa often characterizes kinetic energy dispersion in the formation and development of TC processes. However, the spatial distribution of this variable in the vicinity of TC center could be closely linked to favorable conditions for TC development. Therefore, specific investigations into the distributions of this variable should also be considered to each specific case.
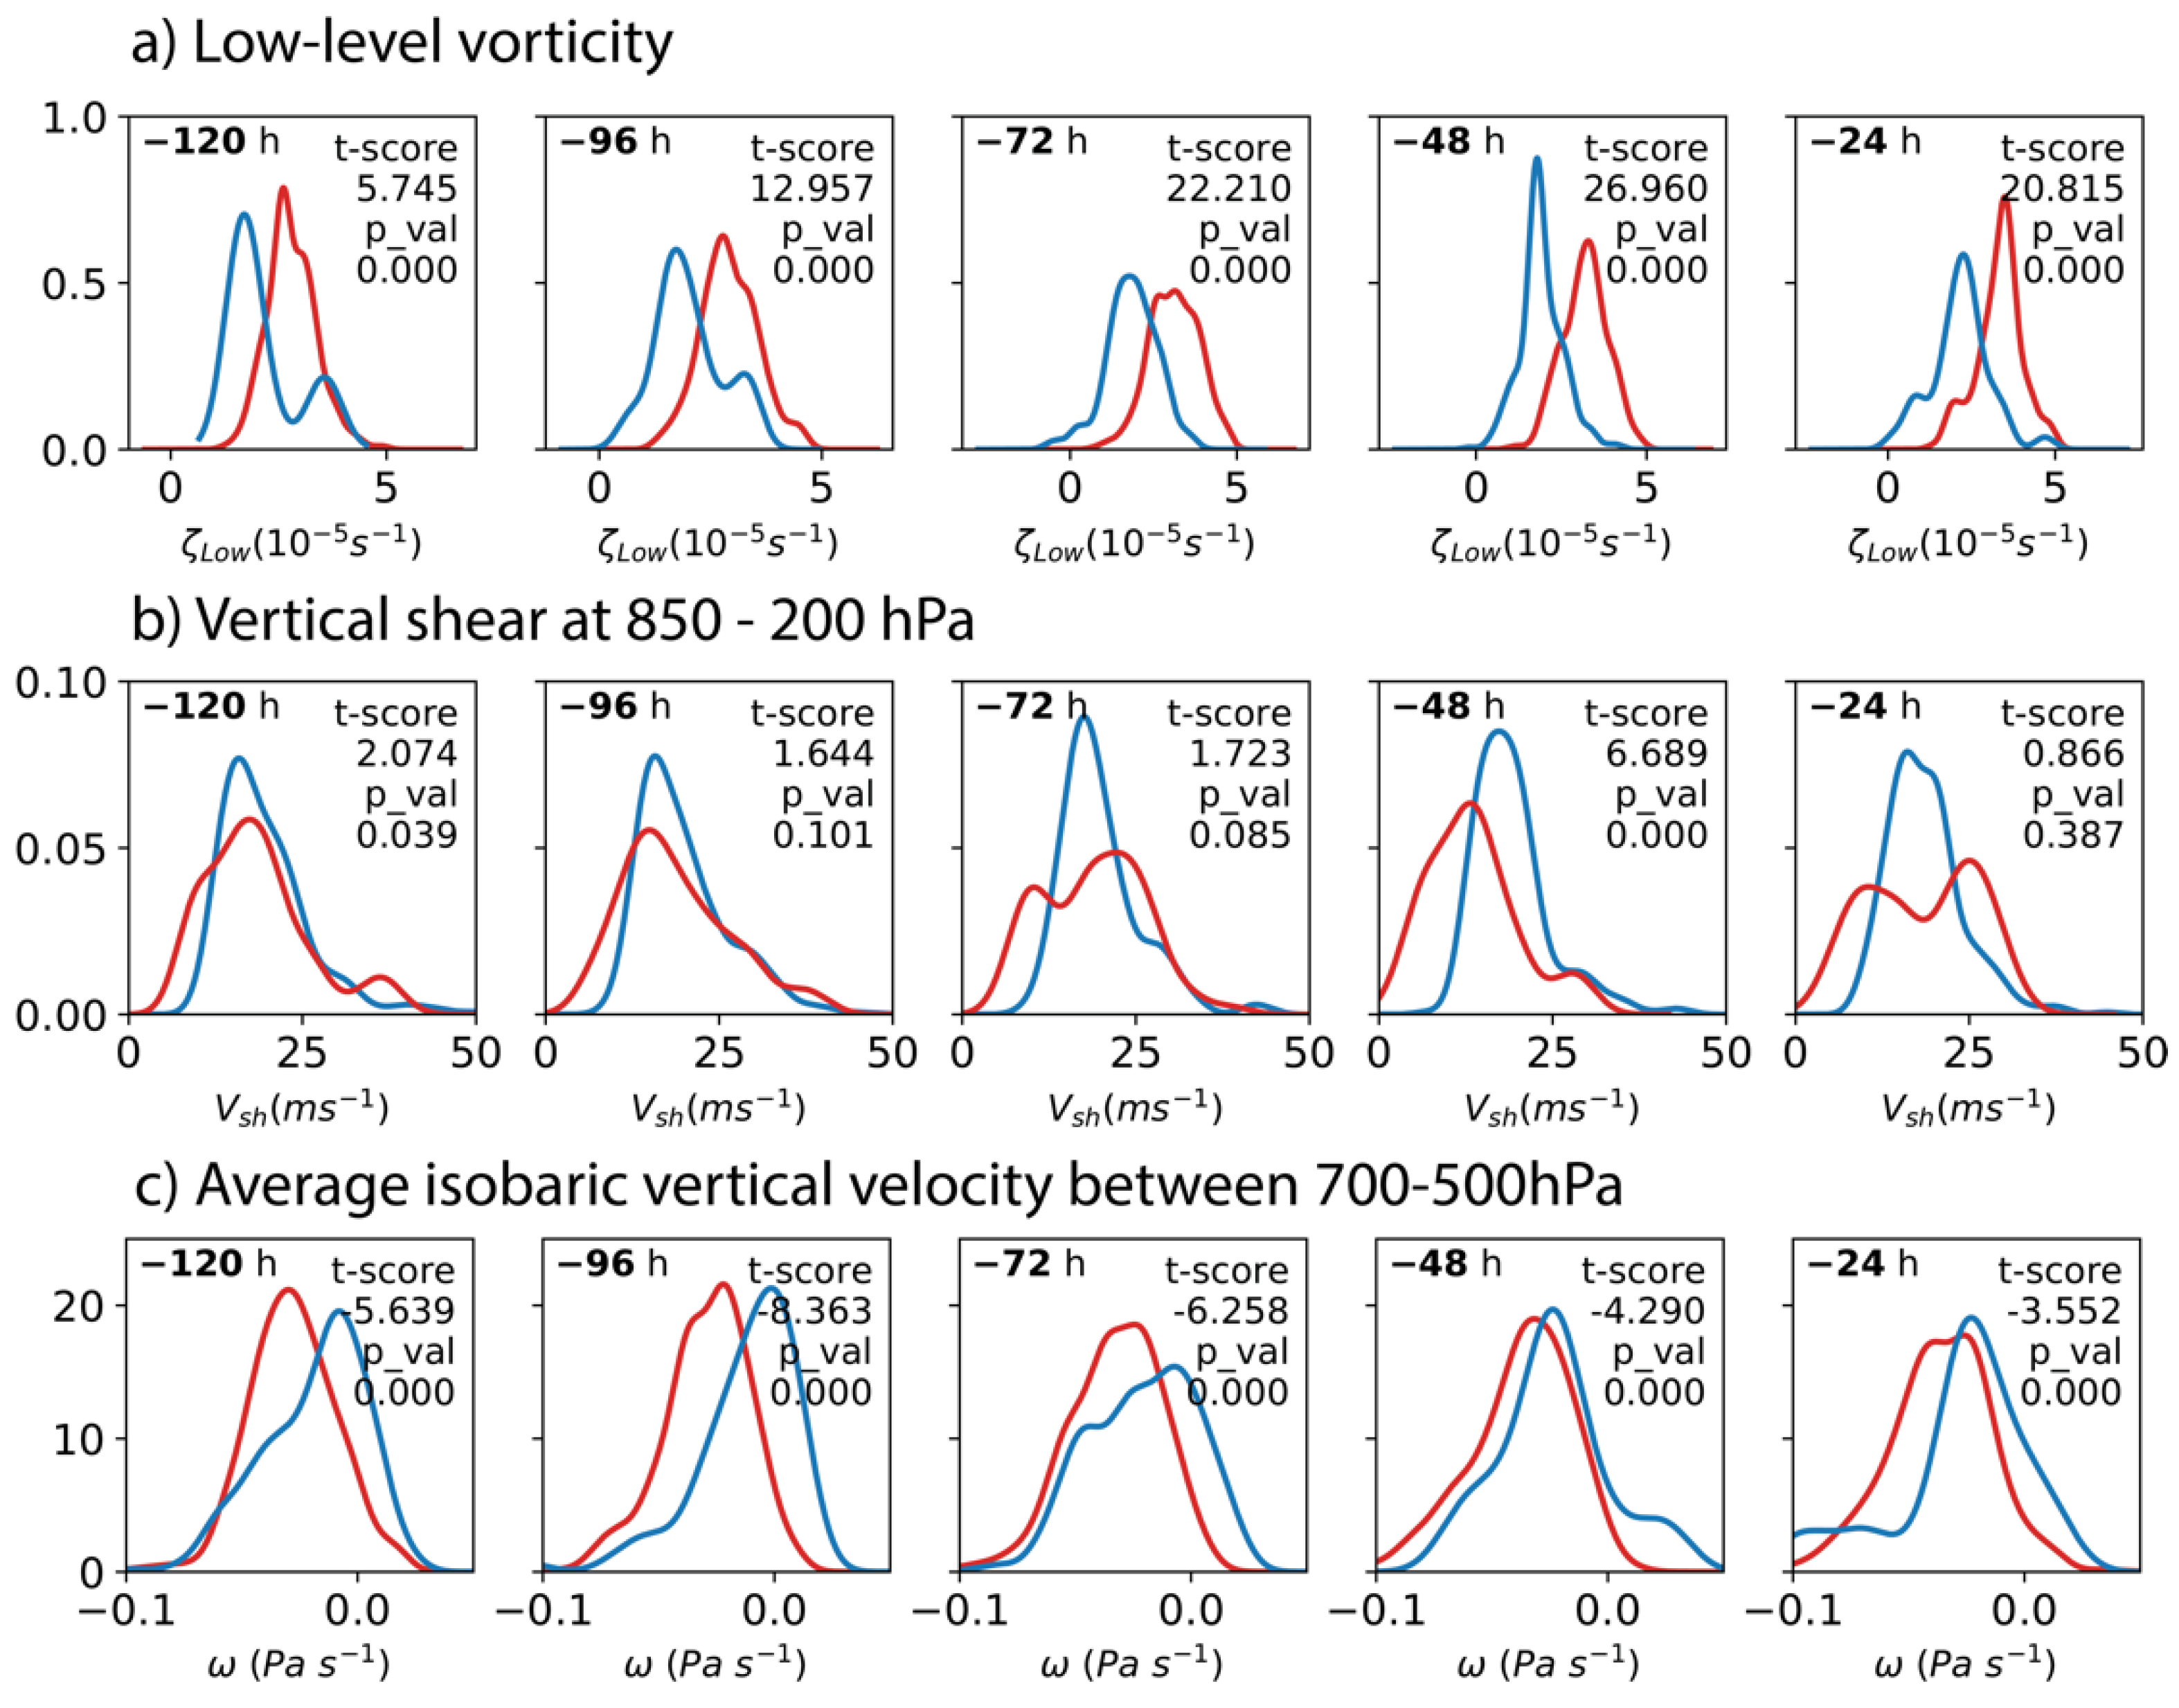
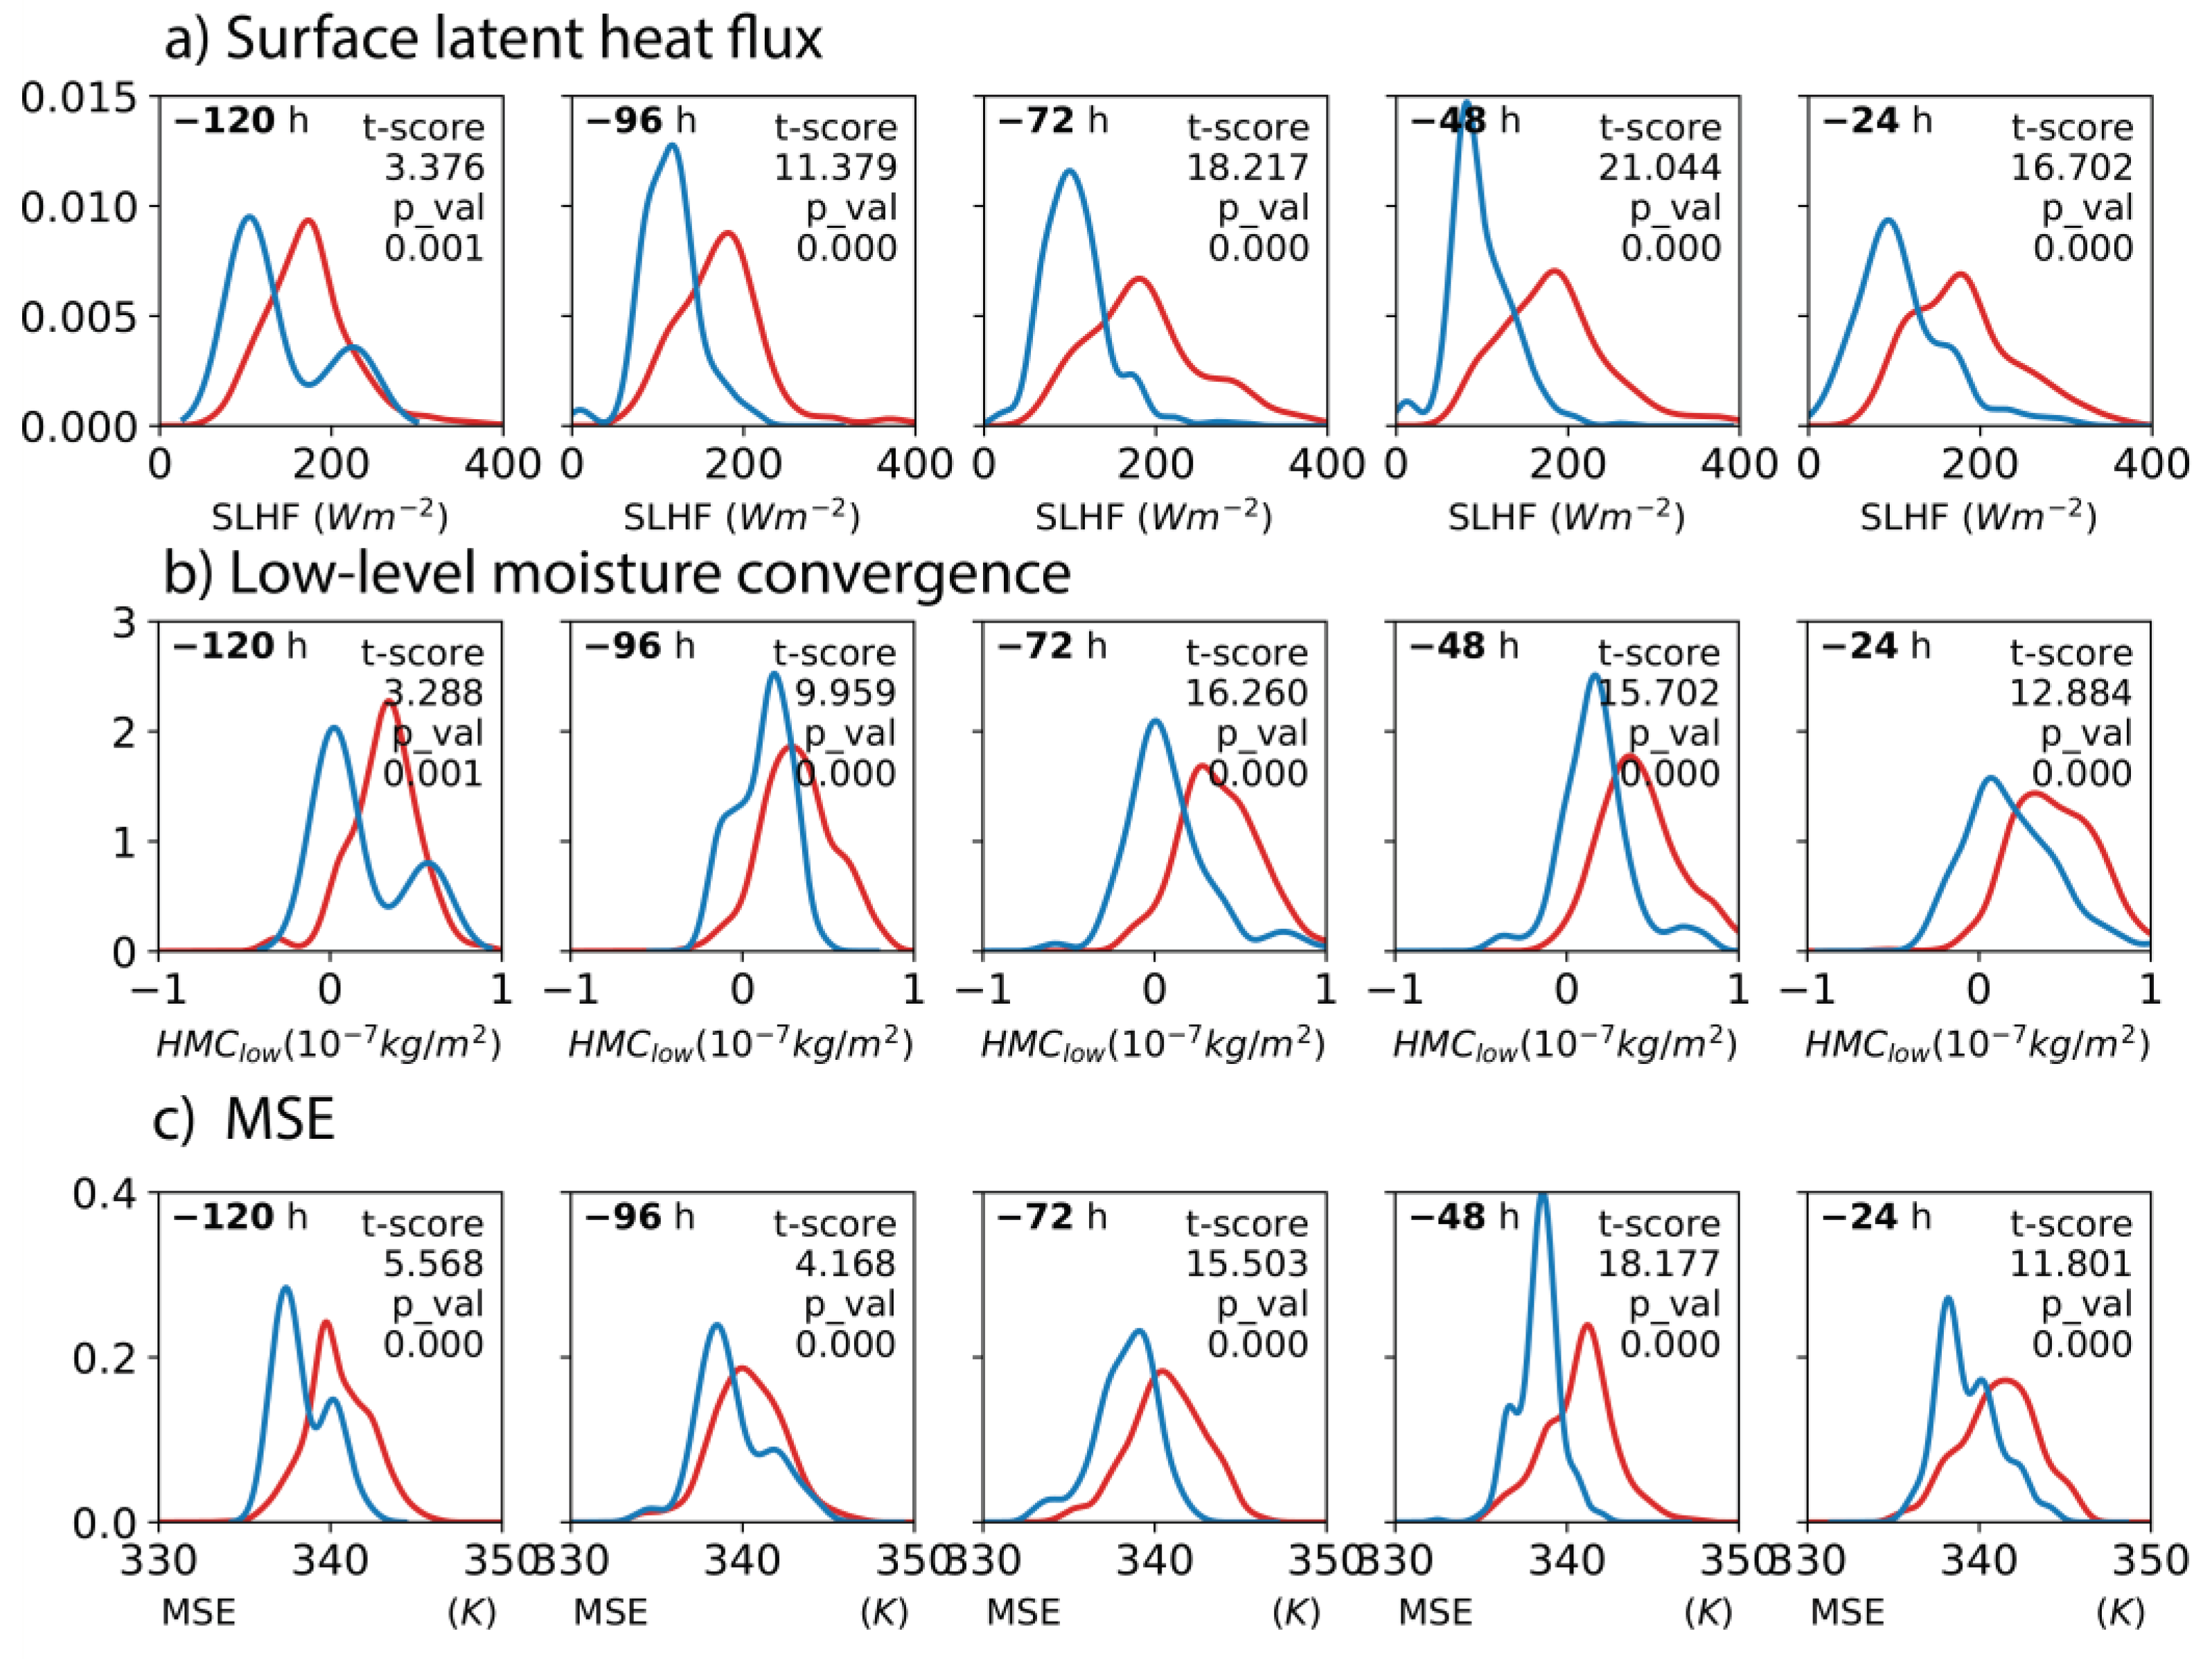
When comparing the probability distribution functions (PDFs) of environmental variables at the formation time among the developed and non-developed groups, exhibit significantly distinct probability distribution spectra between the two groups across all forecast cycles (
Figure 8 and
Figure 9). Except for the average wind shear and vertical velocity at 700 – 500 hPa, the PDFs of the DEV groups mostly follow distinct and well-separated single-mode Gaussian distributions with certain skewness compared to the NONDEV (statistically 95% significant as assessed by the Student t-test). This indicates that the development potential of TC predicted by the ensemble assimilation system is somewhat related to the environmental conditions at the formation time, closely tied to strong vorticity and enhanced moisture processes. The peak values at each forecast cycle also show negligible differences. Specifically, for low-level vorticity (ζ
Low), the peak in cases of formation tend to shift forward over time, accompanied by positively skewed distribution. A similar trend is observed for low-level moisture convergence (HMC
low) and MSE. For surface latent heat flux, the NON-DEV group usually exhibits a narrow distribution, oscillating around 150 Wm
-2, while the DEV group demonstrates a wider distribution that increases as the forecast cycles approaches, with the highest probability often centered around 200 Wm
-2.
It is evident that the dispersion of environmental variable PDFs (dynamic and thermodynamic) increases for forecast cycles from 72 hours and narrows as the actual formation time approaches. This is more prominent for vorticity and moisture variables. This trend is consistent with the pattern of minimum sea-level pressure P
min error displayed in
Figure 3.14. The result can be explained as TCs forecasted at longer lead times tends to have lower intensities compared to the analyzed field; and starting from the 3-day forecast cycle prior to the formation time, due to the addition of new information in the initial conditions, the forecasting system is capable of relatively well-capturing the intensification process of TCs in some ensemble members leading up to the genesis time.
4. Summary and discussion
In the study, we have conducted experiments and discussed the capability of forecasting the formation and development of TCs in the SCS using the assimilated multi-physics ensemble forecasting method by WRF-LETKF, with forecast lead times up to 5 days, for a total of 45 TC formation events during the period 2012 – 2019. The forecast results for the formation and development of TCs were evaluated using forecast probability assessments and errors in terms of position and timing of formation/development. The obtained results indicate that the ability to forecast the TC genesis as a whole depends on the forecast lead time and the quality of the initial conditions.
Additionally, we have investigated the statistical variations of characteristic dynamic and thermodynamic variables related to the formation and development processes of TCs. This helps provide an objective assessment of the advantages and limitations of the selected forecasting system in predicting the formation and development of TCs over the SCS. It should be noted that the selected meteorological variables are not sufficient to assess all the processes involved in the TC genesis. Furthermore, statistical evolutions of all sample sets cannot fully capture the variations in the developmental processes of TCs in particular case and with different forecast components. However, these variables provide a general framework for evaluating the most characteristic dynamic conditions for the formation and development of TCs.
Regarding the forecast of TC at formation period from an embryo vortex towards TD intensity, the EPS-DA system demonstrated a relatively good depiction of TC formation across the forecast cycles. The skill of forecasting the probability of TDs’ appearance significantly improved as the forecast lead time got closer to the actual formation time. Statistical analysis of the error in the distance of TC formation showed that cyclone centers tend to converge towards the observation location as the forecast lead time progresses, with the mean error falling below 1° (~110 km) around the observation-based formation position. Correspondingly, the formation intensity error, represented by the minimum sea-level pressure (P
min) deviation from the observation at formation time, indicated that the forecast members often provided P
min values lower than the actual value, with a relatively low spread of ensemble forecasts, and the median error oscillating below 3 hPa. Forecasts at cycles 96 to 48 hours showed improved TC formation timing forecast, as assessed by the statistical spread (interquartile range) surround the analysis value. These results emphasize the role of data assimilation in enhancing the forecast with augmenting data from 3 to 5 days prior to formation [
28].
Regarding the forecast of TC development to TS stage, the skill assessment of probabilistic forecast showed a significant decrease in the ability to forecast TC development compared to formation period, in alignment with the model’s uncertainty in forecasts at longer lead times since the initialization. The spread of development position error expanded east-west with higher amplitude compared to the formation error, and the mean error shifted eastward from the observation. This error correlated positively with the development timing error, where cyclones often developed later. The spread of Pmin error in the DEV forecast group was relatively large, with uneven distribution, indicating relatively good ensemble forecasting in the 4.5-day and 5-day cycles. Development timing resembled the formation timing error but with a smaller spread, covering observation-based information within the 3.5 to 2-day forecast cycles.
We assessed the impact of environmental conditions on TC genesis forecasts using the EPS-DA system and compared dynamic-thermodynamic variables of TC centers during thesis with non-forming/non-developing vortices. The results highlight convective and moisture convergence processes within 3 days before formation as effective forecasting factors for TC formation. A prominent feature is that the EPS-DA’s ability to predict TC development is somewhat influenced by the environmental conditions at the time of formation, suggesting that the products from dynamical models could serve as potential predictors for bias-correction in statistical-dynamical hybrid models.
Consequently, based on these findings, the utilization of products from the EPS-DA outlined in the study for forecasting the TC genesis within the SCS, with a forecast lead time of 3-5 days, is feasible. Our study mainly focused on examining and comprehending the performance of our EPS-DA system in depicting TC genesis processes across the SCS. Future work can be done on improving the the forecast quality of the EPS-DA system through innovative designs to incorporate the forecasting process into operational practices. This includes expanding the number of ensemble members, refining spatial resolution within the modeling domain, constructing flow-dependent error covariance matrix instead of a fixed matrix, integrating the benefits of both variational and LETKF schemes, and so on. In addition, a more comprehensive bias-correction strategy can be applied in both dynamical and statistical methodologies to elevate the quality of forecasting TC development.
Author Contributions
conceptualization, D.N.Q.H and D.T.L; resources, D.N.Q.H; methodology, D.N.Q.H and D.T.L; formal analysis, D.N.Q.H; project administration, D.N.Q.H and D.T.L; supervision, D.T.L; validation, D.T.L; writing-original draft preparation, D.N.Q.H; writing-review and editing, D.T.L. All authors have read and agreed to the published version of this manuscript.
Funding
This research received no external funding.
Institutional Review Board Statement
Not applicable.
Informed Consent Statement
Not applicable.
Data Availability Statement
Acknowledgments
The authors are grateful for the time and effort given by the anonymous reviewers whose contributions greatly strengthened this manuscript.
References
- Hennon, C.; Papin, P.; Zarzar, C.; Michael, J.; Caudill, J.; Douglas, C.; Groetsema, W.; Lacy, J.; Maye, Z.; Reid, J.; et al. Tropical Cloud Cluster Climatology, Variability, and Genesis Productivity. Journal of Climate 2013, 26, 3046–3066. [Google Scholar] [CrossRef]
- Peng, X.; Wang, L.; Wu, M.; Gan, Q. A Contrast of Recent Changing Tendencies in Genesis Productivity of Tropical Cloud Clusters over the Western North Pacific in May and October. Atmosphere 2021, 12, 1177. [Google Scholar] [CrossRef]
- Riehl, H. ON THE FORMATION OF TYPHOONS. Journal of Atmospheric Sciences 1948, 5, 247–265. [Google Scholar] [CrossRef]
- Riehl, H. A Model of Hurricane Formation. Journal of Applied Physics 2004, 21, 917–925. [Google Scholar] [CrossRef]
- Gray, W.M. Global view of the origin of tropical disturbances and storms. Monthly Weather Review 1968, 96, 669–700. [Google Scholar] [CrossRef]
- Liang, M.; Chan, J.C.L.; Xu, J.; Yamaguchi, M. Numerical prediction of tropical cyclogenesis part I: Evaluation of model performance. Quarterly Journal of the Royal Meteorological Society 2021, 147, 1626–1641. [Google Scholar] [CrossRef]
- Halperin, D.J.; Fuelberg, H.E.; Hart, R.E.; Cossuth, J.H.; Sura, P.; Pasch, R.J. An evaluation of tropical cyclone genesis forecasts from global numerical models. Wea. Forecasting 2013, 28, 1423–1445. [Google Scholar] [CrossRef]
- Tang, B.H.; Fang, J.; Bentley, A.; Kilroy, G.; Nakano, M.; Park, M.-S.; Rajasree, V.P.M.; Wang, Z.; Wing, A.A.; Wu, L. Recent Advances in Research on Tropical Cyclogenesis. Tropical Cyclone Research and Review 2020. [Google Scholar] [CrossRef]
- Halperin, D.J.; Fuelberg, H.E.; Hart, R.E.; Cossuth, J.H. Verification of tropical cyclone genesis forecasts from global numerical models: Comparisons between the North Atlantic and eastern North Pacific basins. Wea. Forecasting 2016, 31, 947–955. [Google Scholar] [CrossRef]
- Yamaguchi, M.; Koide, N. Tropical Cyclone Genesis Guidance Using the Early Stage Dvorak Analysis and Global Ensembles. Weather and Forecasting 2017, 32, 2133–2141. [Google Scholar] [CrossRef]
- Chan, J.C.L.; Kwok, R.H. Tropical cyclone genesis in a global numerical weather prediction model. Mon. Wea. Rev. 1999, 127, 611–624. [Google Scholar] [CrossRef]
- Wang, Z.; Dunkerton, T.J.; Montgomery, M.T. Application of the Marsupial Paradigm to Tropical Cyclone Formation from Northwestward-Propagating Disturbances. Monthly Weather Review 2012, 140, 66–76. [Google Scholar] [CrossRef]
- Chan, J.C.L.; Kwok, R.H.F. Tropical cyclone genesis in a global numerical weather prediction model. Mon. Wea. Rev. 1999, 127, 611–624. [Google Scholar] [CrossRef]
- Cheung, K.K.W.; Elsberry, R.L. Tropical cyclone formations over the western North Pacific in the Navy Operational Global Atmospheric Prediction System forecasts. Wea. Forecasting 2002, 17, 800–820. [Google Scholar] [CrossRef]
- Liang, M.; Chan, J.C.L.; Xu, J.; Yamaguchi, M. Numerical prediction of tropical cyclogenesis Part I: Evaluation of model performance. Quart. J. Roy. Meteor. Soc. 2021, 147, 1626–1641. [Google Scholar] [CrossRef]
- Jaiswal, N.; Kishtawal, C.M.; Bhomia, S.; Pal, P.K. Multi-model ensemble-based probabilistic prediction of tropical cyclogenesis using TIGGE model forecasts. Meteor. Atmos. Phys. 2016, 128, 601–611. [Google Scholar] [CrossRef]
- Pedlosky, J. Geophysical Fluid Dynamics. 1979.
- Zhang, X.; Yu, H. A probabilistic tropical cyclone track forecast scheme based on the selective consensus of ensemble prediction systems. Wea. Forecasting 2017, 32, 2143–2157. [Google Scholar] [CrossRef]
- Zhang, X.; Chen, G.; Yu, H.; Zeng, Z. Verification of ensemble track forecasts of tropical cyclones during 2014. Trop. Cyclone Res. Rev. 2015, 4, 79–87. [Google Scholar]
- Zhang, X.; Fang, J.; Yu, Z. The Forecast Skill of Tropical Cyclone Genesis in Two Global Ensembles. Weather and Forecasting 2023, 38, 83–97. [Google Scholar] [CrossRef]
- Evensen, G. Sequential data assimilation with a nonlinear quasi-geostrophic model using Monte Carlo methods to forecast error statistics. Journal of Geophysical Research: Oceans 1994, 99, 10143–10162. [Google Scholar] [CrossRef]
- Hunt, B.R.; Kostelich, E.J.; Szunyogh, I. Efficient data assimilation for spatiotemporal chaos: A local ensemble transform Kalman filter. Physica D 2007, 230, 112–126. [Google Scholar] [CrossRef]
- Miyoshi, T.; Kunii, M. Using AIRS retrievals in the WRF-LETKF system to improve regional numerical weather prediction. Tellus A 2012, 64. [Google Scholar] [CrossRef]
- Kieu, C.Q.; Truong, N.M.; Mai, H.T.; Ngo-Duc, T. Sensitivity of the Track and Intensity Forecasts of Typhoon Megi (2010) to Satellite-Derived Atmospheric Motion Vectors with the Ensemble Kalman Filter. Journal of Atmospheric and Oceanic Technology 2012, 29, 1794–1810. [Google Scholar] [CrossRef]
- SZUNYOGH, I.; KOSTELICH, E.J.; GYARMATI, G.; KALNAY, E.; HUNT, B.R.; OTT, E.; SATTERFIELD, E.; YORKE, J.A. A local ensemble transform Kalman filter data assimilation system for the NCEP global model. Tellus A 2008, 60, 113–130. [Google Scholar] [CrossRef]
- Yang, S.-C.; Corazza, M.; Carrassi, A.; Kalnay, E.; Miyoshi, T. Comparison of Local Ensemble Transform Kalman Filter, 3DVAR, and 4DVAR in a Quasigeostrophic Model. Monthly Weather Review 2009, 137, 693–709. [Google Scholar] [CrossRef]
- Liu, J.; Fertig, E.; Li, H.; Kalnay, E.; Hunt, B.; Kostelich, E.; Szunyogh, I.; Todling, R. Comparison between Local Ensemble Transform Kalman Filter and PSAS in the NASA finite volume GCM - Perfect model experiments. Nonlinear Processes in Geophysics 2007, 15. [Google Scholar] [CrossRef]
- Tien, T.T.; Hoa, D.N.-Q.; Thanh, C.; Kieu, C. Assessing the Impacts of Augmented Observations on the Forecast of Typhoon Wutip (2013)’s Formation using the Ensemble Kalman Filter. Weather and Forecasting 2020. [Google Scholar] [CrossRef]
- Park, M.-S.; Kim, H.-S.; Ho, C.-H.; Elsberry, R.L.; Lee, M.-I. Tropical Cyclone Mekkhala’s (2008) Formation over the South China Sea: Mesoscale, Synoptic-Scale, and Large-Scale Contributions. Monthly Weather Review 2015, 143, 88–110. [Google Scholar] [CrossRef]
- Park, M.-S.; Lee, M.; Kim, D.; Bell, M.; Cha, D.; Elsberry, R. Land-Based Convection Effects on Formation of Tropical Cyclone Mekkhala (2008). Monthly Weather Review 2017, 145, 1315–1337. [Google Scholar] [CrossRef]
- Skamarock, W.C.; Klemp, J.; Dudhia, J.; Gill, D.O.; Barker, D.; Wang, W.; Powers, J.G. A Description of the Advanced Research WRF Version 3. 2008, 27, 3–27. [Google Scholar]
- Chan, J.C.L.; Xu, M. Inter-annual and inter-decadal variations of landfalling tropical cyclones in East Asia. Part I: Time series analysis. Int. J. Climatol. 2009, 29, 1285–1293. [Google Scholar] [CrossRef]
- Cheung, K.K.; Elsberry, R.L. Tropical cyclone formations over the western North Pacific in the Navy Operational Global Atmospheric Prediction System forecasts. Wea. Forecasting 2002, 17, 800–820. [Google Scholar] [CrossRef]
- Strachan, J.; Vidale, P.L.; Hodges, K.; Roberts, M.; Demory, M.-E. Investigating global tropical cyclone activity with a hierarchy of AGCMs: The role of model resolution. Available online: (accessed on. Available online.
- Chen, J.; Lin, S.; Zhou, L.; Chen, X.; Rees, S.; Bender, M.; Morin, M. Evaluation of tropical cyclone forecasts in the next generation global prediction system. Mon. Wea. Rev. 2019, 147, 3409–3428. [Google Scholar] [CrossRef]
- Zhou, L.; Lin, S.-J.; Chen, J.-H.; Harris, L.M.; Chen, X.; Rees, S. Toward convective-scale prediction within the Next Generation Global Prediction System. Bull. Amer. Meteor. Soc. 2019, 100, 1225–1243. [Google Scholar] [CrossRef]
- Knapp, K.R.; Kruk, M.C.; Levinson, D.H.; Diamond, H.J.; Neumann, C.J. The International Best Track Archive for Climate Stewardship (IBTrACS): Unifying Tropical Cyclone Data. Bulletin of the American Meteorological Society 2010, 91, 363–376. [Google Scholar] [CrossRef]
- Velden, C.S.; Hayden, C.; Nieman, S.; Menzel, W.; Wanzong, S.; Goerss, J. Upper-tropospheric winds derived from geostationary satellite water vapor observations. Bull. Amer. Meteor. Soc. 1997, 78, 173–195. [Google Scholar] [CrossRef]
- Le Marshall, J.; Rea, A.; Leslie, L.; Seecamp, R.; Dunn, M. Error characterisation of atmospheric motion vectors. Aust. Meteor. Mag. 2004, 53, 123–131. [Google Scholar]
- Holmlund, K.; Velden, C.; Rohn, M. Enhanced automated quality control applied to high-density satellite-derived winds. Mon. Wea. Rev. 2001, 129, 517–529. [Google Scholar] [CrossRef]
- Velden, C.S.; Hayden, C.M.; Menzel, W.P.; Franklin, J.L.; Lynch, J.S. The impact of satellite-derived winds on numerical hurricane track forecasting. Wea. Forecasting 1992, 7, 107–118. [Google Scholar] [CrossRef]
- Li, J.; Li, J.; Velden, C.; Wang, P.; Schmit, T.J.; Sippel, J. Impact of rapid-scan-based dynamical information from GOES-16 on HWRF hurricane forecasts. J. Geophys. Res. Atmos. 2020, 125. [Google Scholar] [CrossRef]
- Wu, T.; Liu, H.; Majumdar, S.J.; Velden, C.S.; Anderson, J.L. Influence of assimilating satellite-derived atmospheric motion vector observations on numerical analyses and forecasts of tropical cyclone track and intensity. Mon. Wea. Rev. 2014, 142, 49–71. [Google Scholar] [CrossRef]
- Wu, T.; Velden, C.S.; Majumdar, S.J.; Liu, H.; Anderson, J.L. Understanding the influence of assimilating subsets of enhanced atmospheric motion vectors on numerical analyses and forecasts of tropical cyclone track and intensity with an ensemble Kalman filter. Mon. Wea. Rev. 2015, 143, 2506–2531. [Google Scholar] [CrossRef]
- BRIER, G.W. VERIFICATION OF FORECASTS EXPRESSED IN TERMS OF PROBABILITY. Monthly Weather Review 1950, 78, 1–3. [Google Scholar] [CrossRef]
- Swets, J.A. The Relative Operating Characteristic in Psychology. Science 1973, 182, 1000–1990. [Google Scholar] [CrossRef] [PubMed]
- Buizza, R.; Miller, M.; Palmer, T.N. Stochastic representation of model uncertainties in the ECMWF Ensemble Prediction System. 1999, 125, 2887–2908. [Google Scholar] [CrossRef]
- Chen, J.M.; Tan, P.H.; Wu, L.; Liu, J.-S.; Chen, H.-S. Climatological analysis of passage-type tropical cyclones from the Western North Pacific into the South China Sea. Terrestrial Atmospheric and Oceanic Sciences 2017, 28, 327–343. [Google Scholar] [CrossRef]
- Chen, J.M.; Wu, C.-H.; Gao, J.; Chung, P.-H.; Sui, C.-H. Migratory Tropical Cyclones in the South China Sea Modulated by Intraseasonal Oscillations and Climatological Circulations. Journal of Climate 2019. [Google Scholar] [CrossRef]
- Ling, Z.; Wang, G.; Wang, C. Out-of-phase relationship between tropical cyclones generated locally in the South China Sea and non-locally from the Northwest Pacific Ocean. Climate Dynamics 2014, 45, 1129–1136. [Google Scholar] [CrossRef]
- Ling, Z.; Wang, Y.; Wang, G. Impact of Intraseasonal Oscillations on the Activity of Tropical Cyclones in Summer over the South China Sea. Part I: Local Tropical Cyclones. Journal of Climate 2016, 29, 855–868. [Google Scholar] [CrossRef]
- Tu, J.-Y.; Chen, J.-M.; Tan, P.-H.; Lai, T.-L. Seasonal contrasts between tropical cyclone genesis in the South China Sea and westernmost North Pacific. International Journal of Climatology 2022, 42, 3743–3756. [Google Scholar] [CrossRef]
- Hsieh, Y.-H.; Lee, C.-S.; Sui, C.-H. A Study on the Influences of Low-Frequency Vorticity on Tropical Cyclone Formation in the Western North Pacific. Monthly Weather Review 2017, 145, 4151–4169. [Google Scholar] [CrossRef]
- Carstens, J.; Wing, A. Simulating Dropsondes to Assess Moist Static Energy Variability in Tropical Cyclones. Geophysical Research Letters 2022, 49. [Google Scholar] [CrossRef]
- Chen, X.; Zhang, J.A.; Marks, F.D. A Thermodynamic Pathway Leading to Rapid Intensification of Tropical Cyclones in Shear. Geophysical Research Letters 2019, 46, 9241–9251. [Google Scholar] [CrossRef]
|
Disclaimer/Publisher’s Note: The statements, opinions and data contained in all publications are solely those of the individual author(s) and contributor(s) and not of MDPI and/or the editor(s). MDPI and/or the editor(s) disclaim responsibility for any injury to people or property resulting from any ideas, methods, instructions or products referred to in the content. |
© 2023 by the authors. Licensee MDPI, Basel, Switzerland. This article is an open access article distributed under the terms and conditions of the Creative Commons Attribution (CC BY) license (http://creativecommons.org/licenses/by/4.0/).
