2. Literature Review
Zalutskyy [
1] defined the digital economy as an economy based on digital technology that provides inclusive socioeconomic development and prosperity. Sabina [
2] noted that the digital economy is not limited to changes in technical infrastructure, and the institutional environment in the context of the digital economy is reaching a new form. Aghion and Howitt [
3] introduced environmental pollution and resource constraints into Schumpeter’s model and found that continuous technological innovation could promote the outwards movement of the economic equilibrium point and enhance output. Cui et al. [
4] proposed that the mitigation of ecological imbalance is mainly due to enhanced water resource protection and the sustainable nature of the scale and speed of socioeconomic development. Ma et al. [
5] incorporated an environmental index and a digital economy index into the Environmental Kuznets (EKC) model and found that the impact of the digital economy on the environment displays a positive "U" shape. Notably, the digital economy made a significant contribution to improvements in the environment in China during the investigation period. Tang and Wang [
6] used the SDM model and intermediary effect model to study the impact of the digital economy on ecological resilience and the corresponding mechanism and found that the digital economy is characterized by a significant spatial spill over effect that promotes the ecological resilience of regions and neighbouring regions. Zhao [
7] found that industrial production has a considerable impact on the ecological environment, and the increase in tertiary industry has promoted the green economy. Using panel data for 72 countries from 2003-2019, Shahbaz et al. [
8] demonstrated that the digital economy has had a positive impact on the energy transition. Lv et al. [
9] proposed the main path for the digital economy to promote the realization of the value of ecological products. Shen et al. [
10] and Dong et al. [
11] used an improved coupled coordination degree model to verify the coupled relationships between socioeconomics and carbon emissions, urbanization and air quality. Yan et al. [
12] verified that energy, the economy and the environment interact, restrict and promote each other. Weng et al. [
13] conducted an empirical analysis of the coupled and coordinated development of the economy, environment and society in 31 provinces and regions in China. The results showed that the comprehensive index and coupled coordination degree are highest in the eastern region, although the degrees coupling is similar in the eastern, central and western provinces. Han et al. [
14] and Liu et al. [
15] explored the coupled coordination relationship among the regional digital economy, level of technological innovation and ecological environment in detail; they applied spatiotemporal and geographical weighted regression models and verified that human capital is the main force promoting coupled and coordinated development. Liu et al. proposed that the economic development level, technological innovation level and environmental driving mechanism are the main drivers of the coupled development of the three systems above in China’s provinces and cities. Fu et al. [
16] calculated the coordinated development level of the digital economy and environment by using an entropy method and a coupled coordinated development (CCD) model, and the results showed that the coordinated development levels of the two systems presented regional heterogeneity. Zhang [
17] proposed that attention be given to the integration of the digital economy and agricultural development, as the digital economy is an important driver that can promote economic and ecological development in rural areas.
In summary, scholars’ research on the digital economy and environmental quality has mainly focused on the following two aspects. First, the measurements of the digital economy and environmental quality have been obtained. The digital economy is a new economic model driven by advancements in digital technology [
18], and it can significantly reduce resource and environmental loss [
19,
20], support green development [
21,
22], and protect the ecological environment [
23,
24]. Quantitative assessments of the digital economy have focused on added value [
25,
26] and the compilation of development indices [
28]. Notably, scholars tend to base the measurements of the digital economy on the levels of Internet access and digital financial inclusion [
27,
28]. Environmental quality research has mainly focused on the development and evaluation of indicators. Comprehensively, urban environmental quality can include air quality, the quality of the sound environment, solid waste, soil quality, water quality and other factors [
29,
30,
31,
32,
33,
34]. With the gradual increase in the popularity of the concept of sustainable development, many countries have proposed series of indicator systems to support sustainable urban development [
35,
36,
37]. In 1990, the United Nation‘s Organization for Economic Cooperation and Development (OECD) adopted the PSR system to represent the pressure caused by human activities on the ecological environment as an environmental indicator [
38,
39,
40]. In general, due to the different research purposes and approaches of scholars, there are extensive differences in the construction of environmental quality indicators.
Second, we discuss the relationship between the digital economy and environmental quality. This approach is mainly manifested from two aspects. First, the impact of the digital economy on environmental quality is explored. The digital economy has an important impact on the quality of the environment [
5,
6,
8]. Notably, the digital economy has an inhibitory effect on energy consumption in the short term [
41] and a growth effect in the long term [
42]. The digital economy is an important driver of ecological development [
17], which can limit environmental pollution [
43,
44] and enable green development [
45,
46] by enhancing innovation. The second is the interaction between the digital economy and the environment. The two systems are characterized by a coupled and coordinated development relationship [
11,
12,
13,
14,
16]. Human capital [
14], the economic development level, the technological innovation level, and environmental mechanisms [
15] are the main drivers that promote the coupled and coordinated relationship between the digital economy and environmental quality.
Based on a comprehensive view of the literature, although research on the digital economy and environmental quality has attracted increasing attention from scholars, there is still room for further expansion regarding the coupled and coordinated development of the digital economy and environmental quality. First, existing studies mainly focused on the coupled relationship between economic development and environmental quality and gave insufficient attention to the connection between digital economy development and environmental quality. Second, the existing studies mainly focused on the role and mechanism of the digital economy in improving the environment, including in specific regions through case studies. Empirically, panel data econometric models have been used to analyse the scope and intensity of the effect of the digital economy on environmental pollution at the provincial and city levels, and the coupled and coordinated relationship between the digital economy and environmental quality has not been comprehensively discussed.
Compared with those of previous studies, the main contributions of this paper are as follows: (1) a comprehensive evaluation index system is established for the digital economy and environmental quality, the coupled and coordinated relationship between the digital economy and environmental quality is established, and kernel density estimation is used to analyse the dynamic evolution trends of the two systems. The Dagum Gini coefficient was used to analyse the variations in regional differences in the coupled coordination index. (2) Exogenous and endogenous driving factors of the two systems are discussed, and the core and major driving factors affecting the coupled coordination degree are verified with an individual fixed-effect model. The purpose of this paper is to provide a scientific basis for relevant research and for various departments to formulate relevant policies related to the digital economy and environmental protection. Subsequently, the trend of the coupling and coordination of the two systems can be assessed over time.
2.1. Samples and Data Sources
In this paper, 31 provinces and autonomous regions in China (excluding Hong Kong, Macao, and Taiwan) are selected for analysis, and the sample investigation period is 2011-2020. The data are mainly from the 2012-2021 China Statistical Yearbook, China Environmental Statistical Yearbook, China Energy Statistical Yearbook, Tertiary Industry Statistical Yearbook, Information Industry Yearbook, Peking University Digital Financial Inclusion Index and provincial statistical yearbooks. Some ecological and environmental data are from the EPS data platform. Additionally, some data gaps were filled with linear interpolation and the ARIMA model.
2.2. Index System
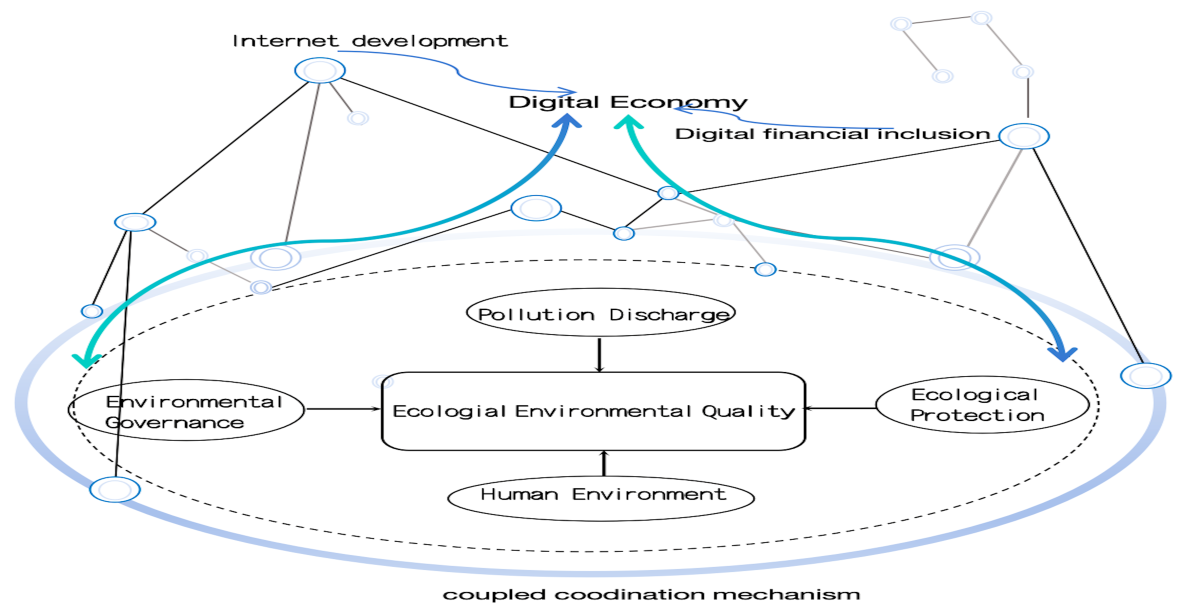
In accordance with the principles of data availability and index representativeness and with reference to relevant research results, the evaluation index system of the regional ecological environmental quality is constructed by selecting 12 one-way indicators, including the amount of general industrial solid waste, the forest coverage rate of each region, the urban gas penetration rate, etc., based on the four first-level indicators of pollution emissions, ecological protection, the level of human activities and environmental governance, as shown in
Table 1.
Table 1.
Index system of regional ecological environmental quality.
Table 1.
Index system of regional ecological environmental quality.
| Primary index |
Secondary index |
Index attribute |
Weight |
| Pollution discharge |
Amount of general industrial solid waste produced |
Negative |
0.012034229 |
| Industrial sulphur dioxide emission intensity |
Negative |
0.017184897 |
| Industrial solid waste effect |
Negative |
0.011631183 |
| Ecological protection |
Forest coverage by region |
Positive |
0.07798519 |
| Green coverage rate in built-up areas |
Positive |
0.006508551 |
| Expenditures on energy conservation and environmental protection |
Positive |
0.080671149 |
| Human environment |
Per capita water resources |
Positive |
0.61623046 |
| Urban gas penetration rate |
Positive |
0.004545198 |
| Environmental governance |
Investment in industrial pollution control |
Positive |
0.132815803 |
| Comprehensive utilization rate of general industrial solid waste |
Positive |
0.022935958 |
| Urban sewage treatment rate |
Positive |
0.006014107 |
| Treatment rate of harmless household garbage |
Positive |
0.011443274 |
The system of the digital economy includes two first-level indicators, namely, Internet development and digital financial inclusion, and five individual indicators, such as the Internet penetration rate and the number of Internet-related employees, as shown in
Table 2.
Table 2.
Index system of the digital economy development level.
Table 2.
Index system of the digital economy development level.
| Primary index |
Secondary index |
Index attribute |
Weight |
| Internet development |
Internet penetration |
Positive |
0.079554021 |
| Number of Internet-related employees |
Positive |
0.142595924 |
| Internet-related output |
Positive |
0.298073372 |
| Number of mobile Internet users |
Positive |
0.073869761 |
| Digital financial inclusion |
Digital financial inclusion index |
Positive |
0.405906923 |
2.3. Research Methods
2.3.1. Entropy Weight TOPSIS Method
The entropy weight method is used to determine the weights of indicators, and the ranking of evaluation objects is determined according to the Technique for Order of Preference by Similarity to the Ideal Solution (TOPSIS) method. The calculation steps in the entropy-weighted TOPSIS method are as follows:
Assume that the research object is m provinces, each province has an evaluation indicators, and a judgement matrix is constructed:
The following expressions are used to standardize the indicators:
Information entropy is calculated as follows:
Among them, and .
The weight of indicator j is determined as:
The weight matrix is obtained as follows:
The Euclidean distance between each value and the best and worst solutions is given by:
The comprehensive evaluation index is expressed as:
In this case, the larger is, the higher the corresponding score and the higher the levels of the digital economy and environmental quality in the province.
2.3.2. Coupling Evaluation
With formula (1) to formula (7), the environmental development index (EDI) and digital economy development index (DDI) can be calculated for each factor, referring to the method of Cong [
47]. The following formula is used to construct an evaluation model for the coupling degree of the regional digital economy and environmental development:
where
is the degree of coupling between the digital economy and environmental quality of region i in year t, which reflects the mutual influence between systems. The greater the
value is, the stronger the coupling between the digital economy and environmental quality.
2.3.3. Coordination Degree Evaluation
To further explore the coordinated development level of the digital economy and environmental quality, a coupled coordination degree evaluation model of the provincial digital economy and environmental quality is constructed. The formulas are as follows:
is the coordination index of the regional digital economy and environmental quality, and β1 and β2 are weights. In this paper, it is assumed that the digital economy and environment are equally important in the development of provinces; therefore, β1=β2=
,
is the coupled coordination degree of the digital economy and environmental quality in region i in year t. The value of
is between 0 and 1, and the closer
is to 1, the more benign the overall effect generated by the interactions of the digital economy and environmental quality. The coupled coordination degree is divided into 10 different levels according to the approach of Tang et al. [
48].
2.3.4. Kernel Density Estimation
The probability density function of coupled coordination degree D is established as follows:
is the i
th observed value of the coupled coordination degree D of the random variable, h is the bandwidth, and
is the kernel density. The Gaussian kernel density function is used to estimate the dynamic evolution trend of the distribution of the coupled coordination degree between the digital economy and ecological environmental quality. The kernel function expression is as follows:
2.3.5. Dagum Gini Coefficient
To reveal the trend of the relative differences in evaluation indicators, the Dagum Gini coefficient decomposition method is used to calculate the regional differences in evaluation indicators, and the calculation is as follows:
Here, q and m are the number of regions and the number of provinces, respectively, l and h are the inner sets for region m, i and r are different provinces, and
and
represent the coupled coordination degree of province i in region l and province r in region h, respectively. The contribution value of Gini coefficient decomposition is calculated as follows:
are the Gini coefficients for region l and region h with respect to region l, is the Gini coefficient within the group, is the intergroup Gini coefficient, and is the supervariable density coefficient. is the ratio of the number of provincial units in l region to the total number;is the relative influence of the coupled coordination degree of the digital economy and environmental quality in regions l and h; is the difference in the coupled coordination degree between two systems and is the mathematical expectation of the sum of sample values satisfying in region l and region h; is the first hypervariable moment, or the mathematical expectation of the sum of sample values satisfying in region l region and region h; and is th cumulative density distribution function for the region.
2.3.6. Establishment of the Measurement Model
Based on the panel data from 31 provinces in China from 2011to 2020, the dynamic factor measurement model of coupled and coordinated development is constructed as follows:
where i represents each province, t represents time,
is the coupled coordination degree, PECO is the level of economic development, STR is the upgrading of the industrial structure, PINN is the technological innovation ability, FIN is the level of financial development, GOV is the degree of government intervention, MI is the marketization index, ER is the degree of environmental regulation and
is the error term.
3. Analysis of Results
3.1. Coupled Coordination Level Analysis
The regional EDI and DDI were calculated according to formulas (1)-(7), and the coupling degree
values of the two systems were calculated according to formulas (8), (9) and (10). The measurement results for the coupling and coordination degree
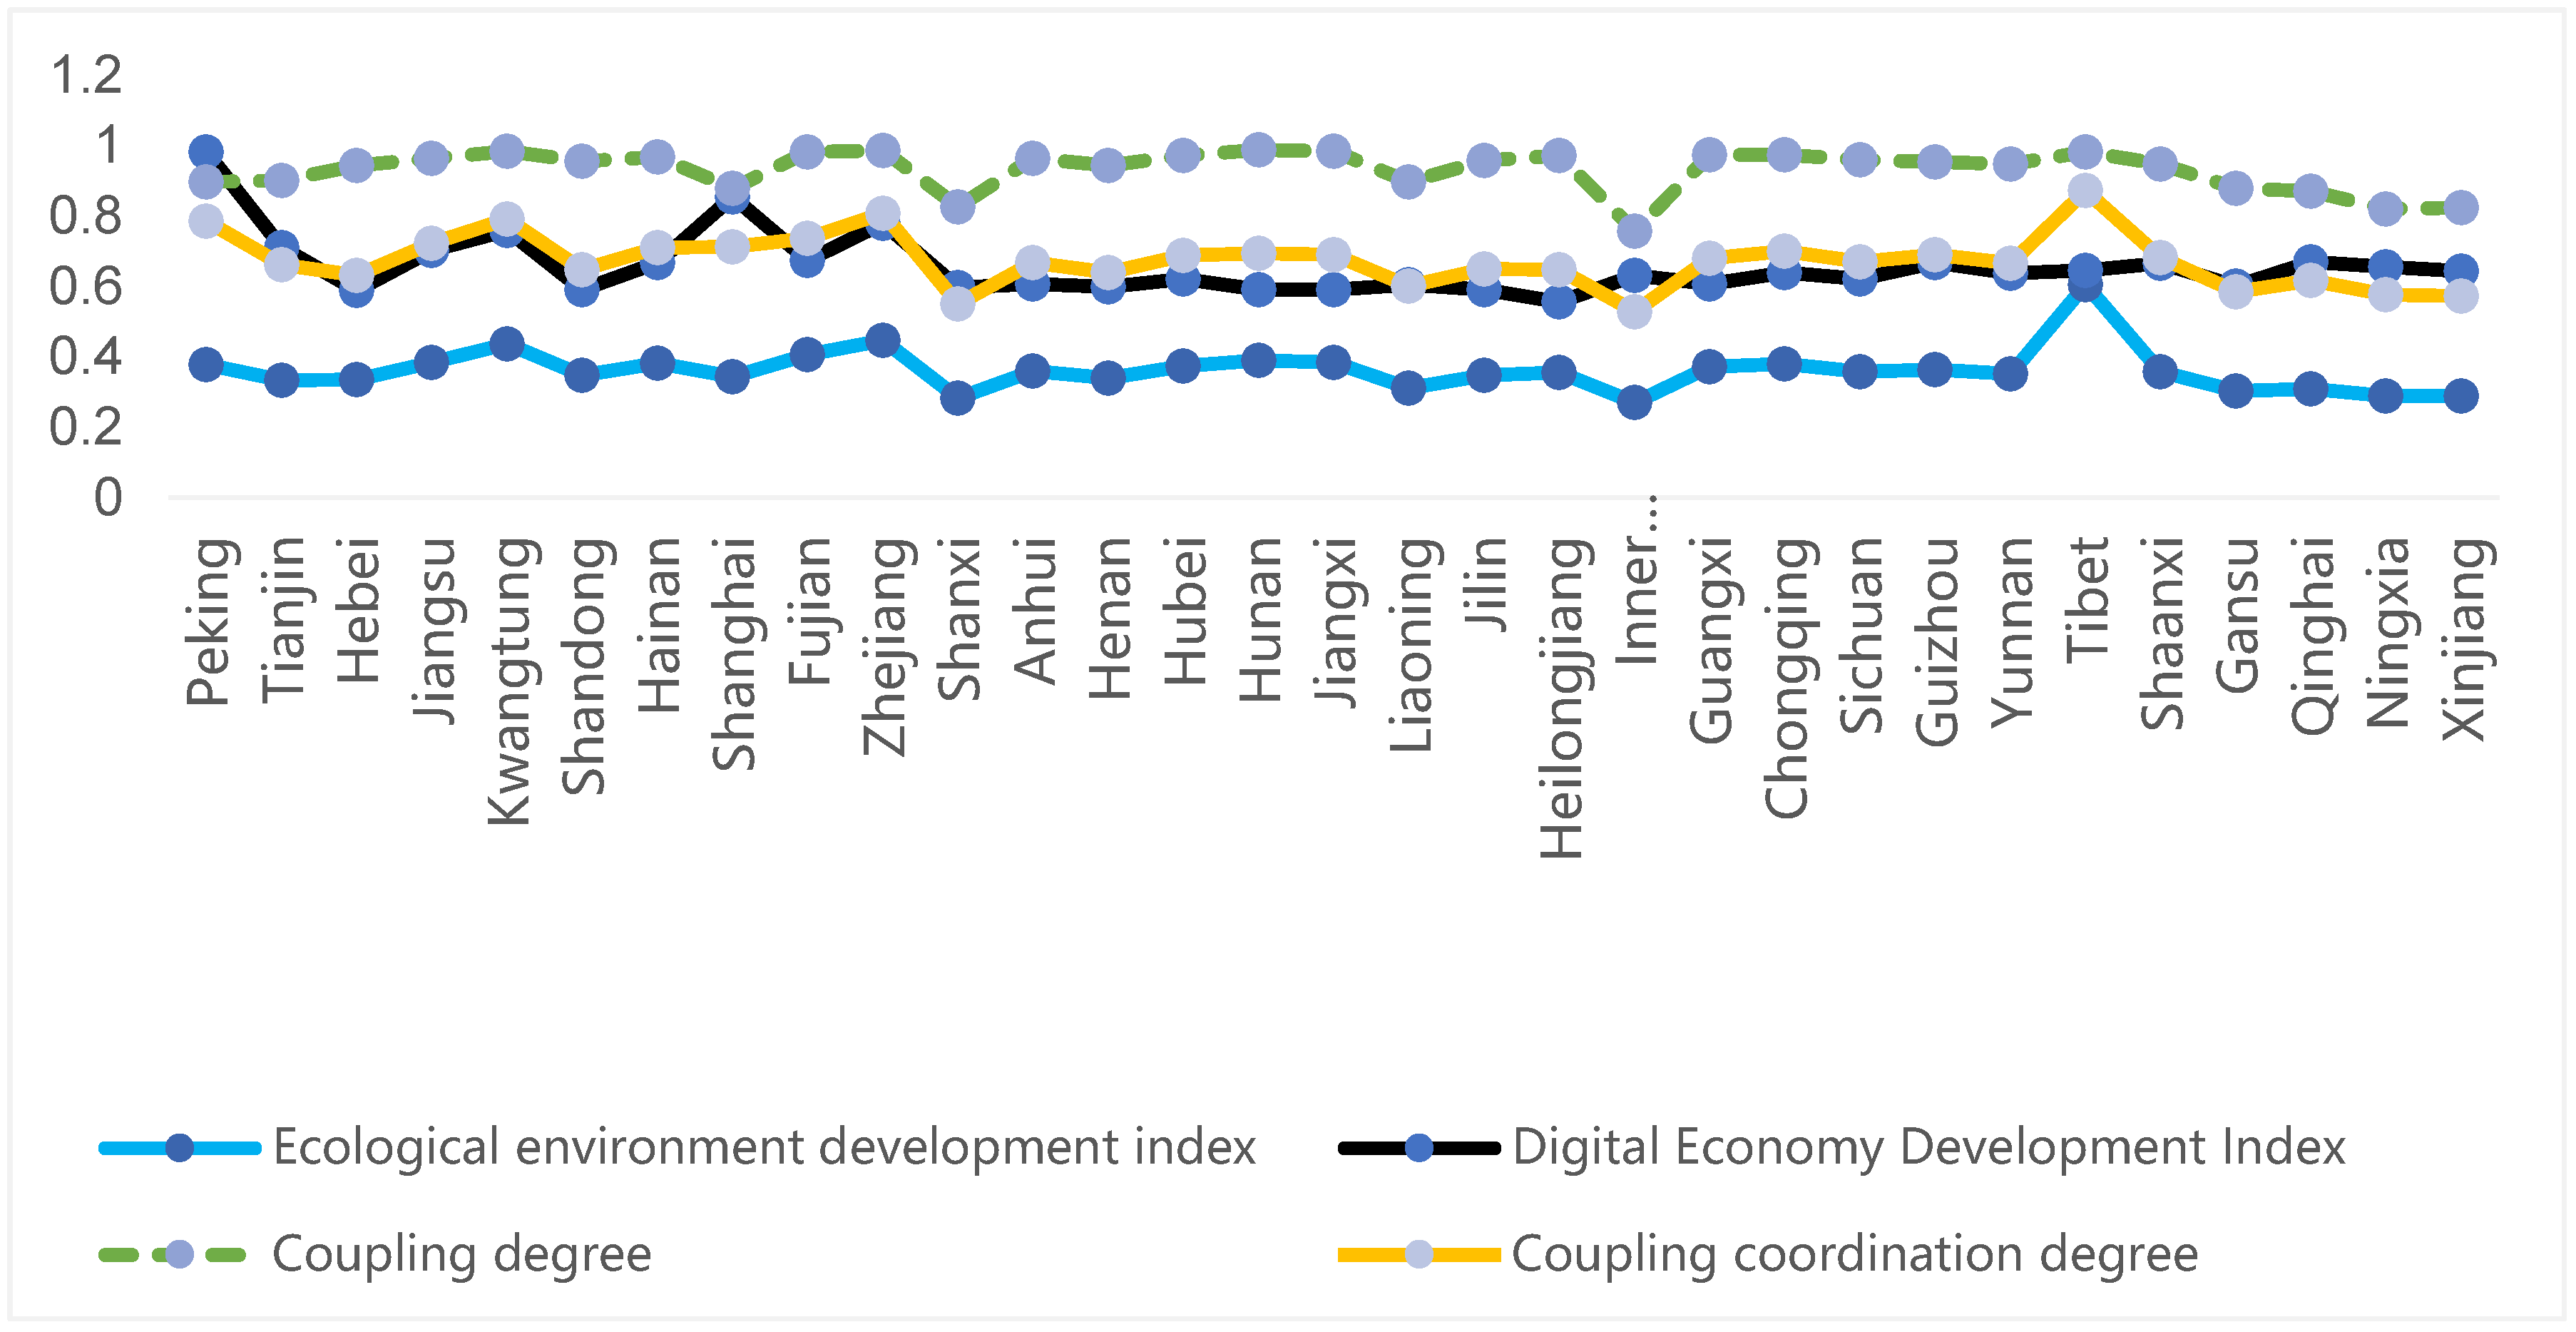
values of the two systems are shown in
Figure 1. Combined with the data characteristics, the following findings were obtained. First, although the value ranges of the environmental quality index and digital economy index are different in different regions, the distribution patterns of the two are relatively similar, forming the basis for the coupled relationship between the two systems. Second, the level in the eastern region is above the national average level, and Beijing, Guangdong, Shanghai and Zhejiang display the highest levels, reflecting good coupled coordination degrees. Third, the levels in the central region and the northeast region are at the national average level, and those in Shanxi and Liaoning are lower. Fourth, the level in the western region is generally lower than the national average level, especially in Inner Mongolia, with the lowest observed value, but the measurement level in Tibet reflects a good system coupling effect. Overall, the development level of the digital economy in the eastern region is relatively strong, and the degree of correlation and mutual promotion between the two systems of the digital economy and environmental quality displays regional heterogeneity.
Figure 1.
Evaluation index, coupling degree and coupled coordination degree in each region.
Figure 1.
Evaluation index, coupling degree and coupled coordination degree in each region.
The average value of the coupling degree C in Inner Mongolia is 0.757, ranging from 0.5 to 0.8, indicating that the digital economy and environmental quality systems in Inner Mongolia are in the run-up stage, and the C values in other regions are higher than 0.8, with many close to 1; this suggests that the two systems in other regions are in a high-level coupling stage. The D-value grade and division standard for the coupled coordination degree are shown in
Table 3.
Table 3.
Evaluation criteria for the coupled coordination degree.
Table 3.
Evaluation criteria for the coupled coordination degree.
| Coupled coordination degree |
Coordination level |
Value range |
| Hyperdysregulation |
1 |
[0~0.1) |
| Severe disorder |
2 |
[0.1~0.2) |
| Moderate dysregulation |
3 |
[0.2~0.3) |
| Mild disorder |
4 |
[0.3~0.4) |
| Borderline disorder |
5 |
[0.4~0.5) |
| Forced misalignment |
6 |
[0.5~0.6) |
| Primary coordination |
7 |
[0.6~0.7) |
| Intermediate coordination |
8 |
[0.7~0.8) |
| Good coordination |
9 |
[0.8~0.9) |
| Quality coordination |
10 |
[0.9~1) |
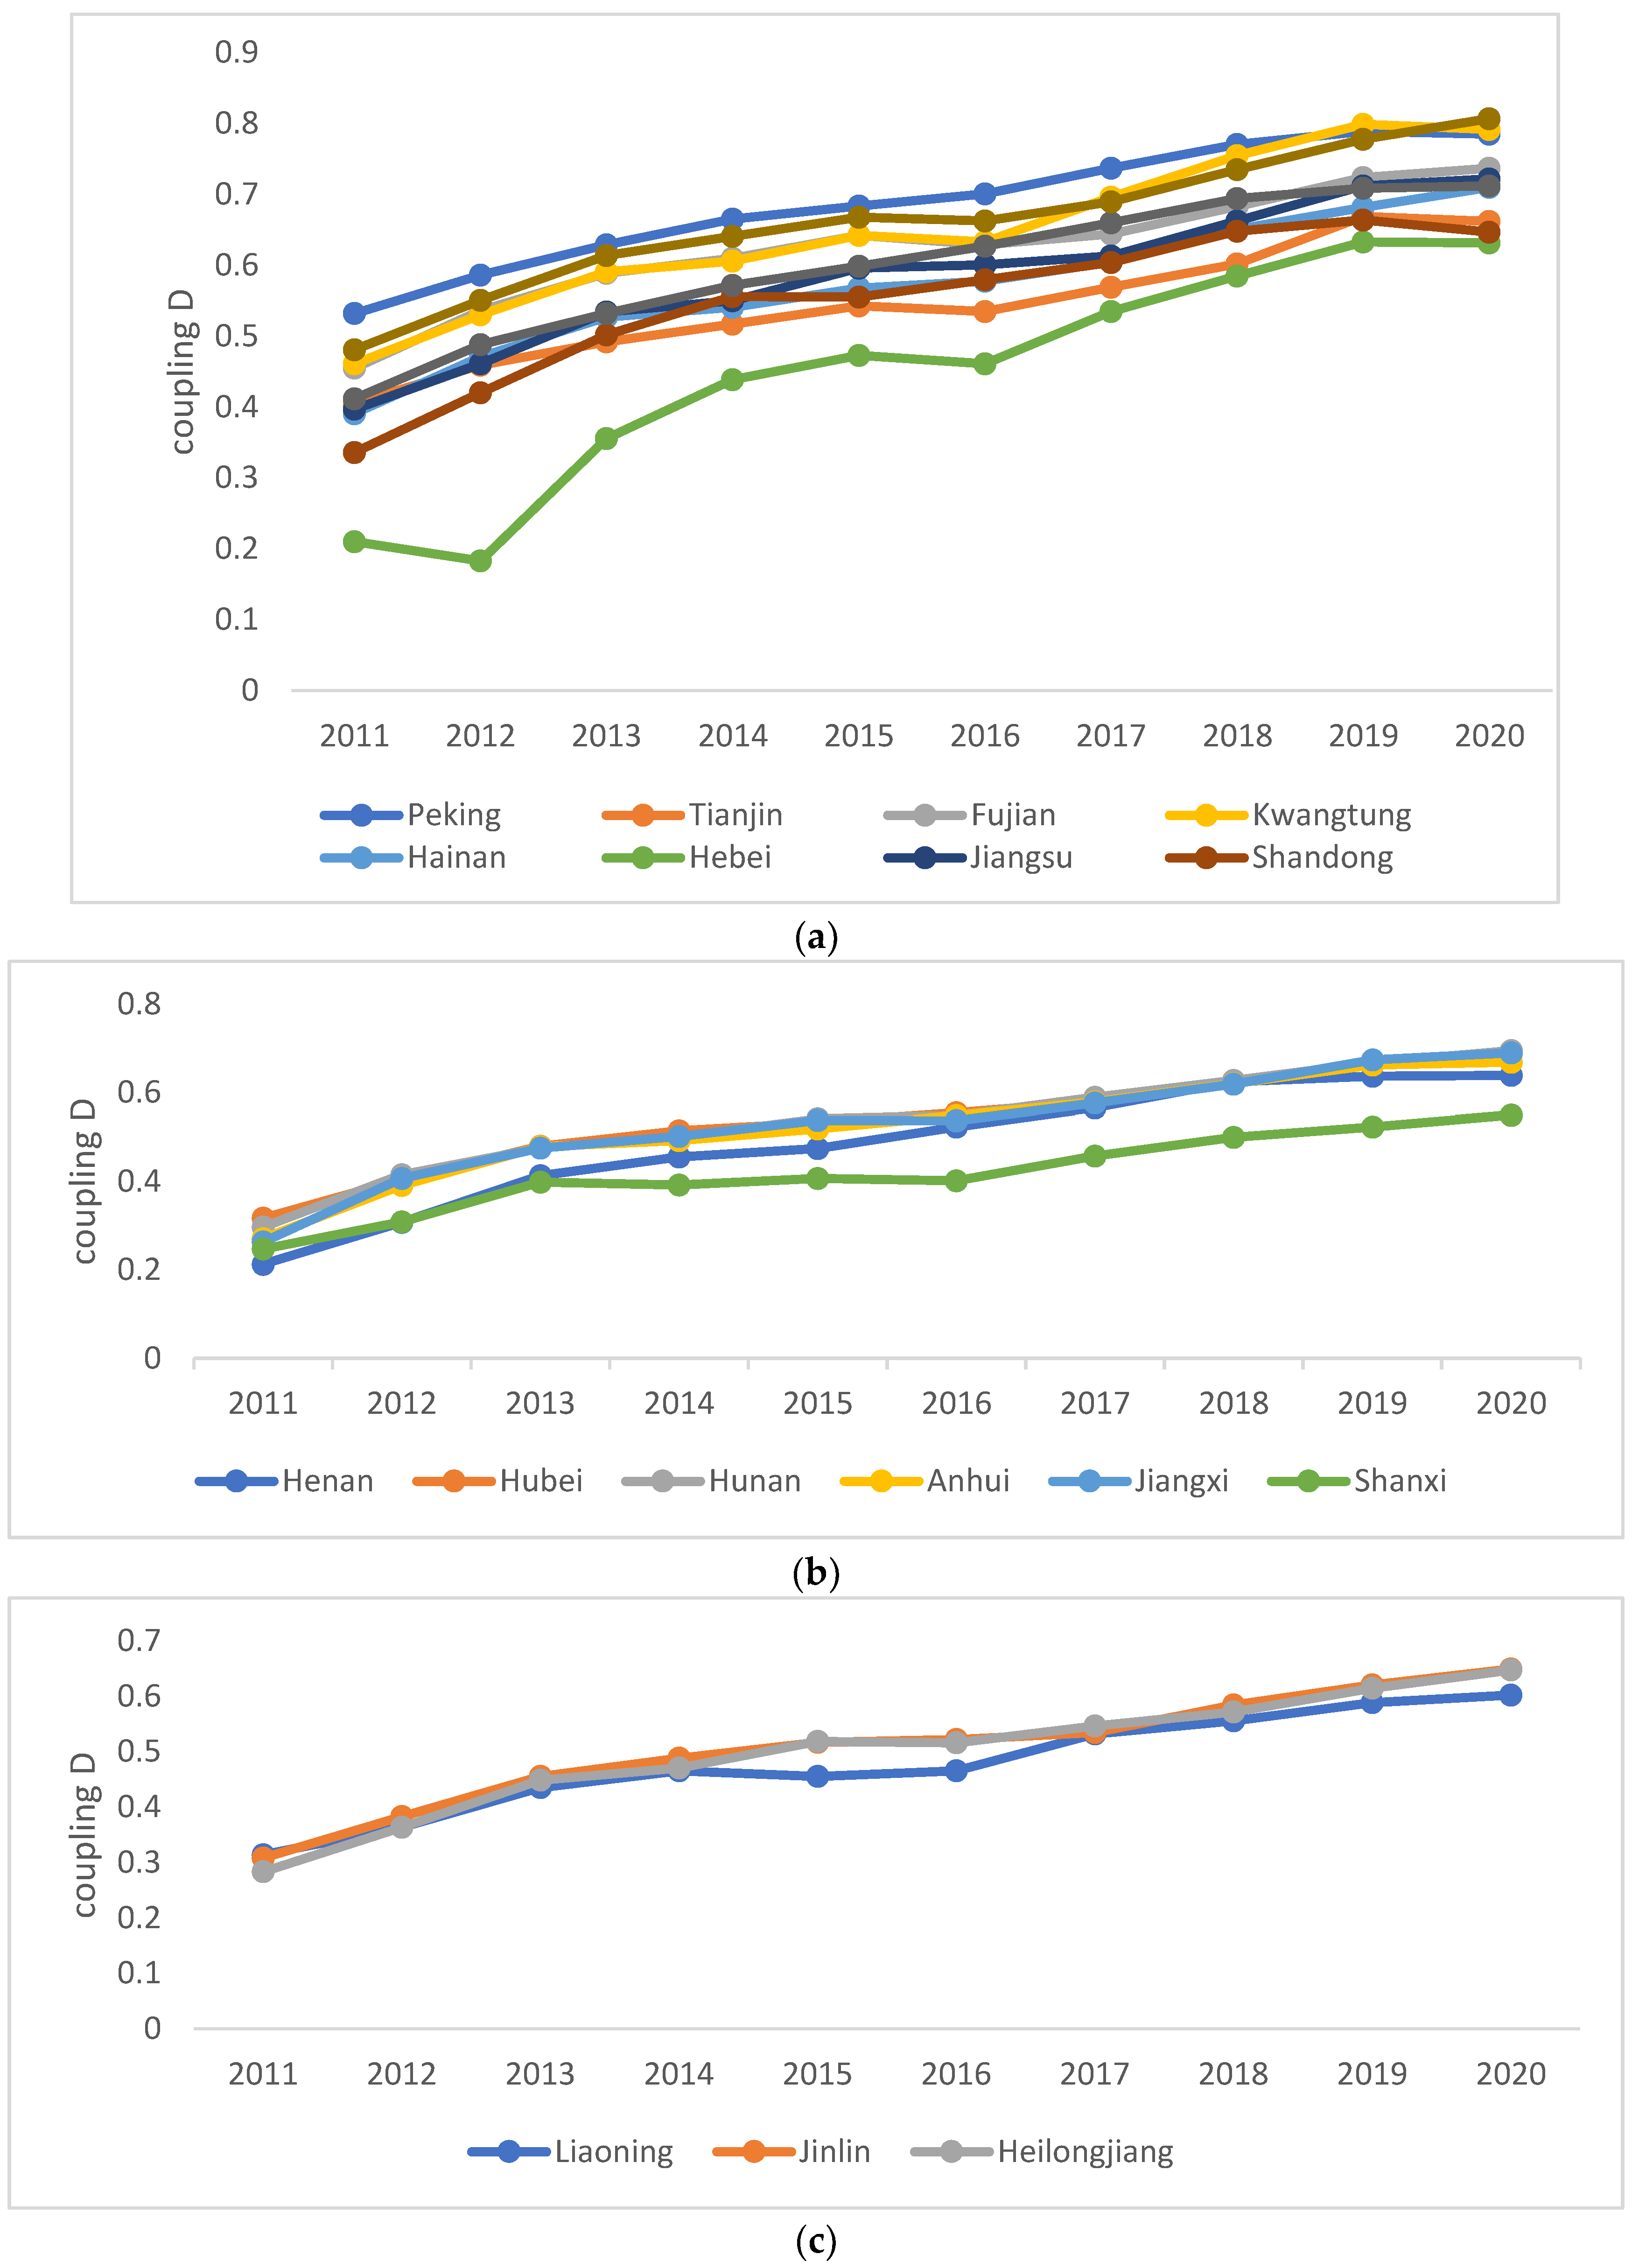
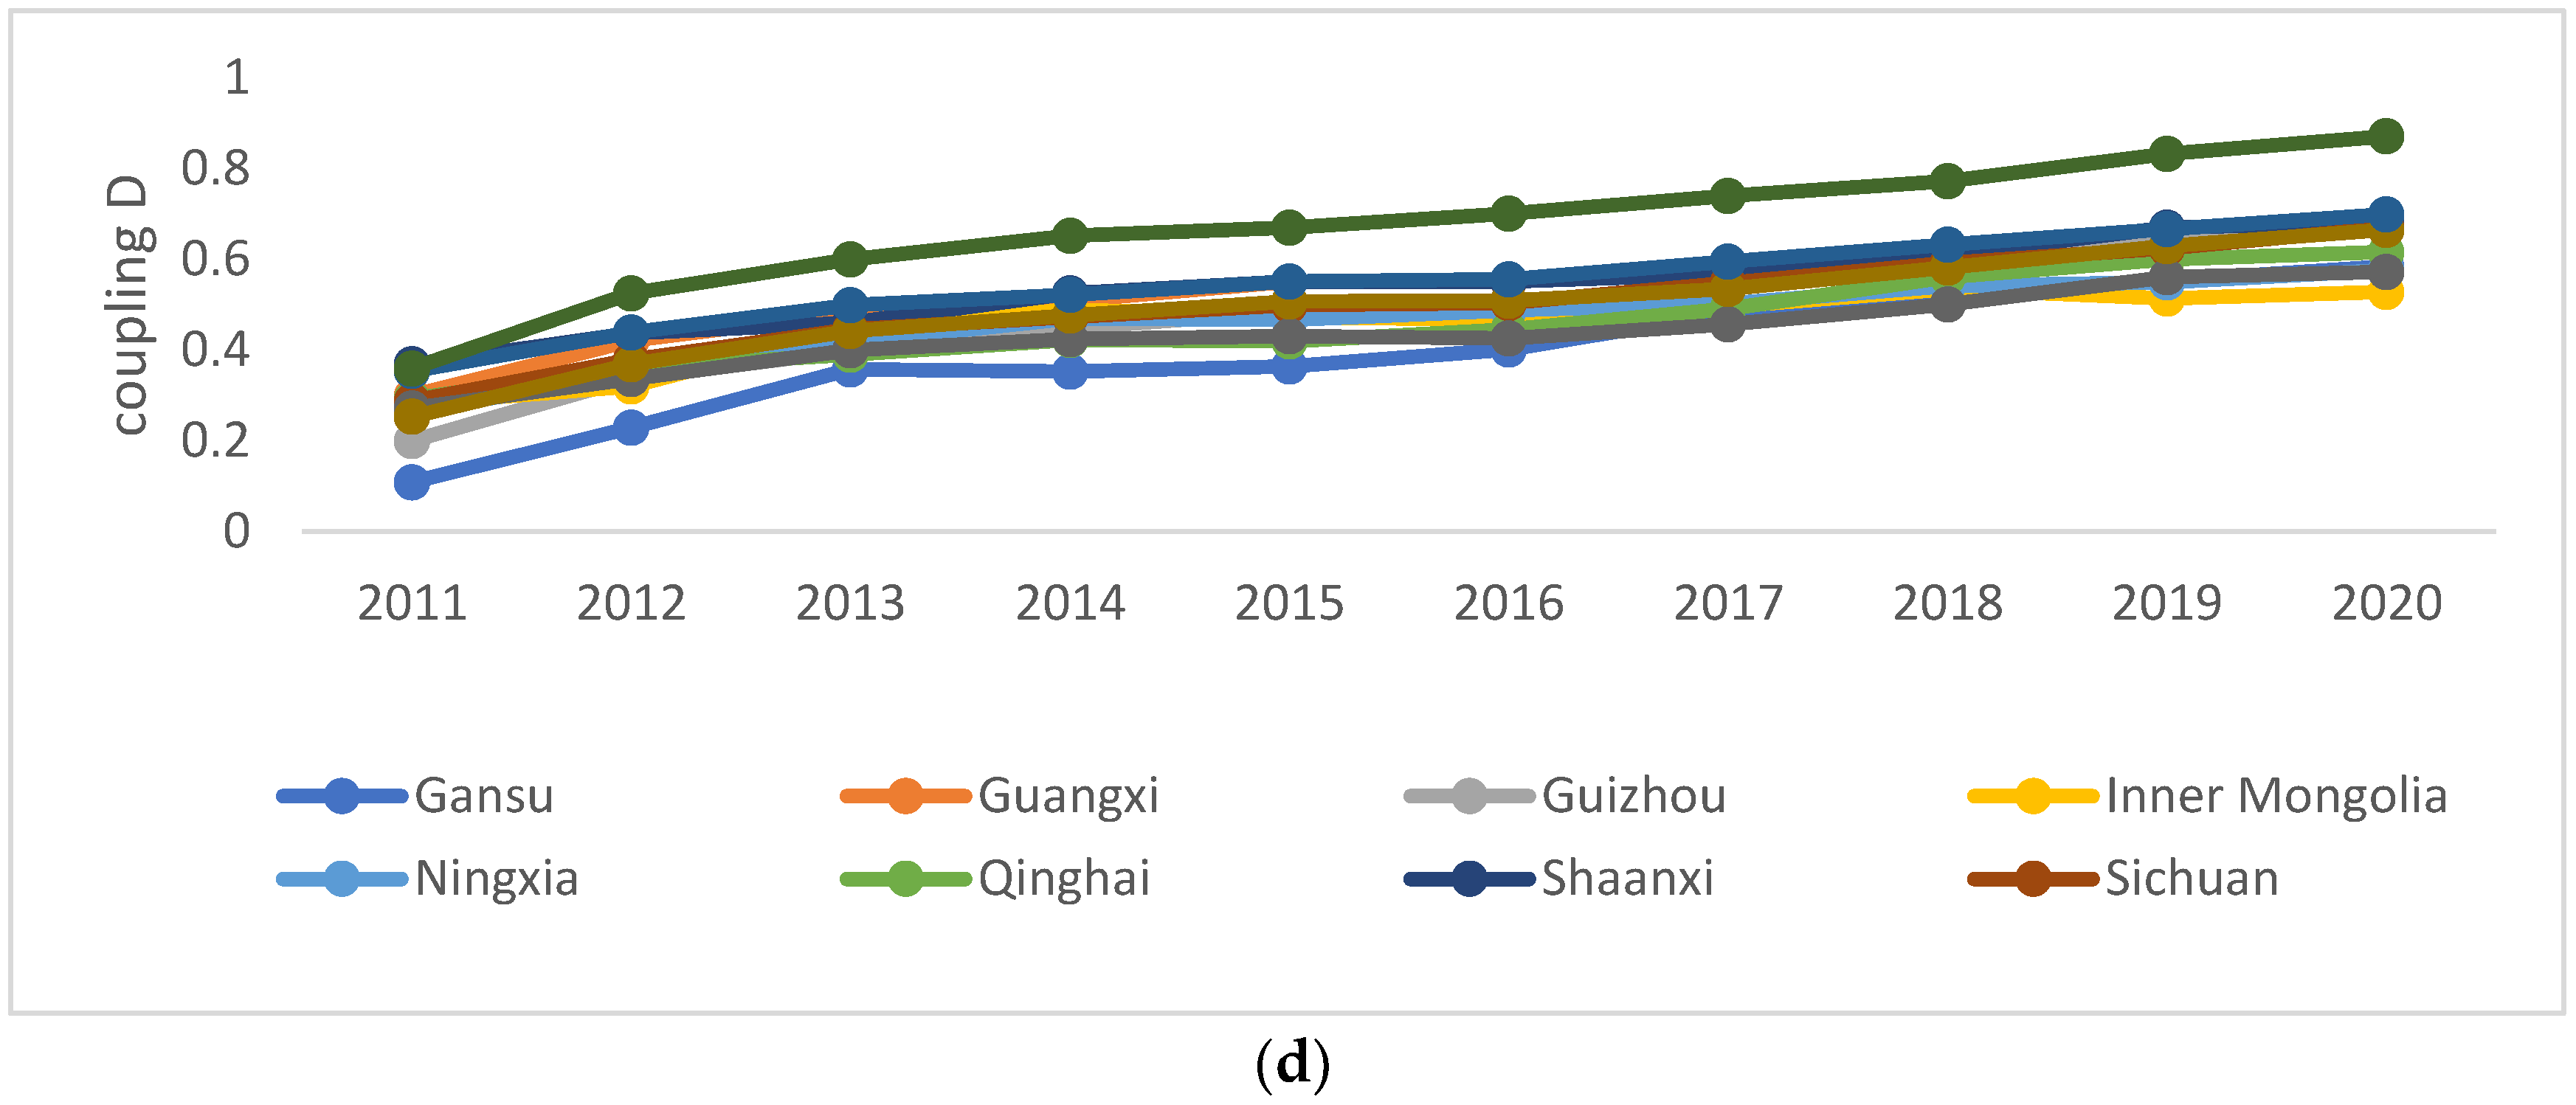
Figure 2a-d show the coupled coordination levels in the four economic regions during the investigation period, reflecting the coupled coordination degree trend of the digital economy and environmental quality in each province and city. The average coupled coordination degree from 2011 to 2020 ranks as follows: eastern (0.59311)
central (0.50455)
western (0.49988)
northeast (0.49367). Therefore, from a data perspective, the coupled coordination degree of the digital economy and environmental quality systems displays obvious regional heterogeneity.
Figure 2.
a. Coupled coordination degree in the eastern region. b. Coupled coordination degree in the central region. c. Coupled coordination degree in Northeast China. d. Coupled coordination degree in the western region.
Figure 2.
a. Coupled coordination degree in the eastern region. b. Coupled coordination degree in the central region. c. Coupled coordination degree in Northeast China. d. Coupled coordination degree in the western region.
The coupled coordination degree of the digital economy and environmental quality in the eastern region is higher than the national average level. Hebei Province experienced a brief decline in this degree in 2012, but a rapid growth trend has since occurred. In 2017, the coupled coordination degree of Hebei reached 0.535, an increase of 2.9 times that in 2012, among the highest values nationally, reflecting a jump in the coupled coordination level from low to high. The coupled coordination levels in Hainan, Jiangsu and Shandong provinces also increased considerably by 81.59%, 81.86% and 92.56%, respectively. The lowest increase was in Tianjin at 47.56%.
The development trend of the coupled coordination level in the central region is good. The gap between the coupled coordination level of Shanxi and the other provinces after 2013 varied, but the levels in the other five provinces were similar. The increase in the coupled coordination level in the six central provinces was generally higher than that in most of the eastern regions, ranging from 1.2 to 2, with the largest increase in Henan Province. In 2020, the coupled coordination degree of the two systems in Henan Province was 0.639, twice that in 2011, indicating that the correlation between the digital economy and environmental quality systems in Henan Province improved over time.
The coupled coordination degree of the Jilin and Heilongjiang systems in Northeast China steadily improved, and that in Liaoning declined in 2015 and 2016; additionally, the growth rate slowed after 2018, indicating that the coupled coordination level of the digital economy and environmental quality was not stable.
In the western region, the coupled coordination level of Tibet far exceeds the levels in other areas, outpacing the western average level by approximately 74%. The coupled coordination level in Gansu Province increased the most, approximately 4.37 times the original value. Second, the coupled coordination level in Guizhou increased by more than a factor of 2, and the coupled coordination levels in other provinces and cities increased to different degrees. Ningxia displayed a low coupled coordination level before 2013, with subsequent reductions in 2014 and 2015, indicating that the coupled coordination between the digital economy and environmental quality in some provinces and cities is still in the run-up period. Thus, it is necessary to work together to improve the coupling of the two systems.
During the study period, the coupled coordination level of 31 provinces (autonomous regions) in China improved, and by 2020, the values in all regions reached levels 6, 7, 8 and 9. The classified coupled coordination level of each province in 2011 and 2020 is shown in
Table 4. In 2011, no province reached the level of primary coordinated development or above, only one region in Beijing reached the level of slight coordinated development, and the coupled coordination degree of Beijing was 0.532. This indicates that the coordinated promotion of the digital economy and environmental quality had not yet begun nationwide. In 2020, the coupled coordination levels of Zhejiang and Tibet reached the good level, with values of 0.807 and 0.872 in Zhejiang and Tibet, respectively, leading the country. The coupled coordination levels of the two systems in Beijing, Shanghai, Jiangsu, Fujian, Guangdong, Hainan and Chongqing, accounting for approximately 23% of the country, reached the intermediate level of coordinated development. These seven provinces have experienced rapid development, and the coordination and interaction between the two systems have been remarkable. The coupled coordination level of the two systems in 17 regions, such as Tianjin and Hebei, accounting for approximately 55% of the country in total, has reached a primary level of coordinated development, indicating that the coupling of the two systems has occurred in more than half of the country. The remaining five regions are characterized by partially coordinated development, indicating that there is still much room for the coordinated promotion of the environment and digital economy in these provinces. Overall, during the sample investigation period, the coupled coordination level of the digital economy and environmental quality in 31 provinces and regions around the country improved to varying degrees.
Table 4.
Coupled coordination level of each province.
Table 4.
Coupled coordination level of each province.
| Coupled coordination type |
The year 2011 |
The year 2020 |
Sound and coordinated development
|
—— |
Zhejiang, Tibet |
Intermediate coordinated development
|
—— |
Peking, Shanghai, Jiangsu, Fujian, Kwangtung, Hainan, Chongqing |
Primary coordinated development
|
—— |
Tianjin, Hebei, Liaoning, Jilin, Heilongjiang, Anhui, Jiangxi, Shandong, Henan, Hubei, Hunan, Guangxi, Sichuan, Guizhou, Yunnan, Shaanxi, Qinghai |
Partially coordinated development
|
Peking |
Shanxi, Inner Mongolia, Gansu, Ningxia, Xinjiang |
3.2. Dynamic Evolution Characteristics of the Coupled Coordination Degree
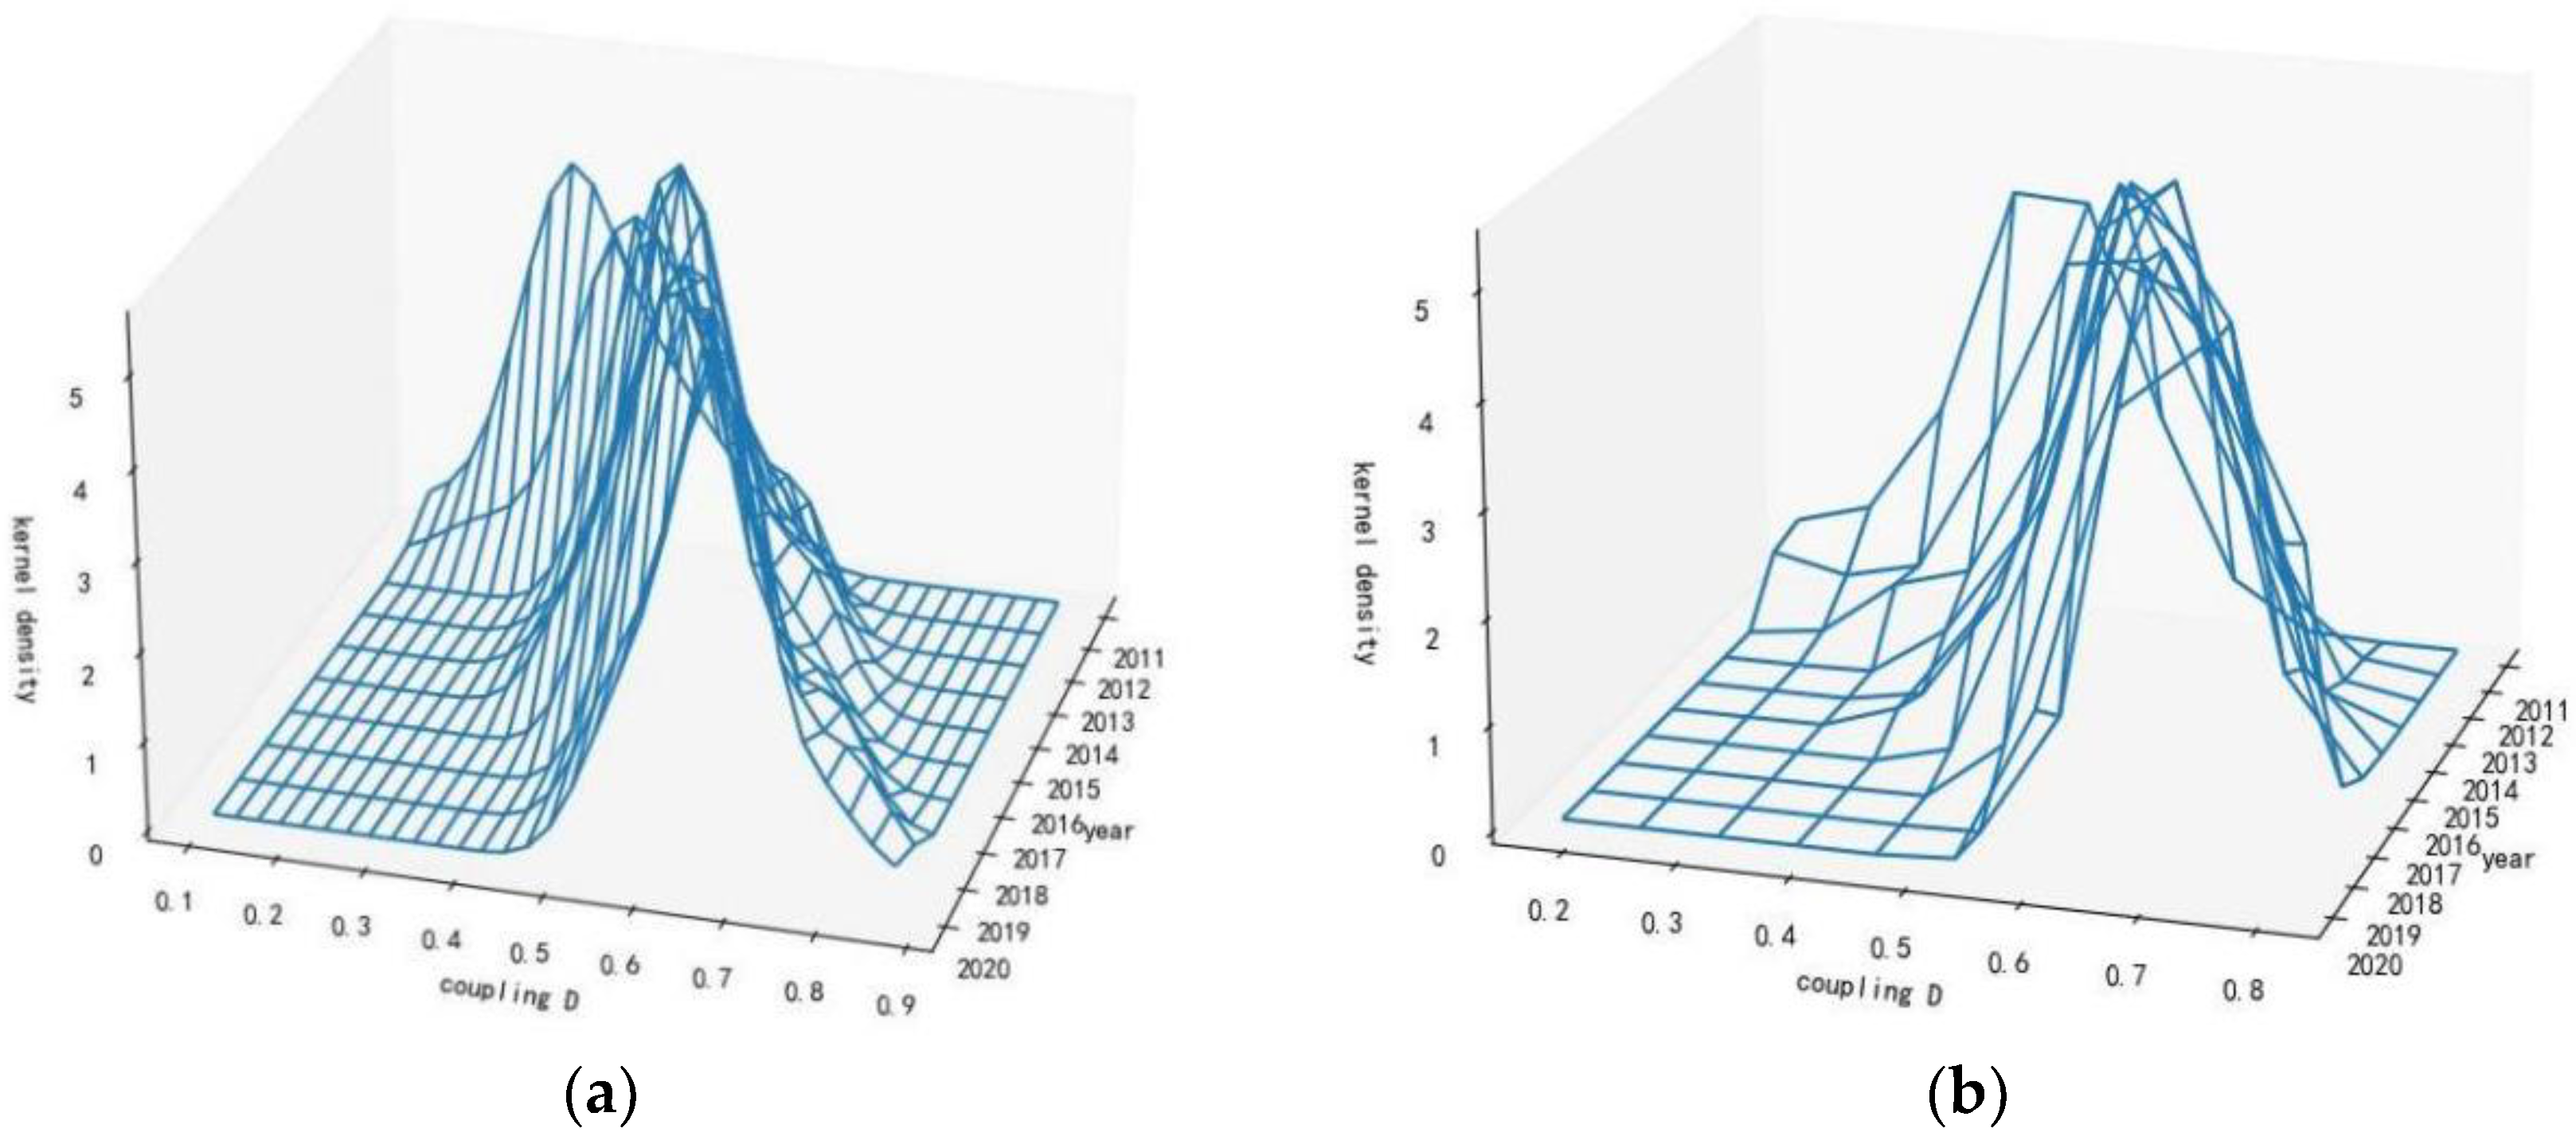
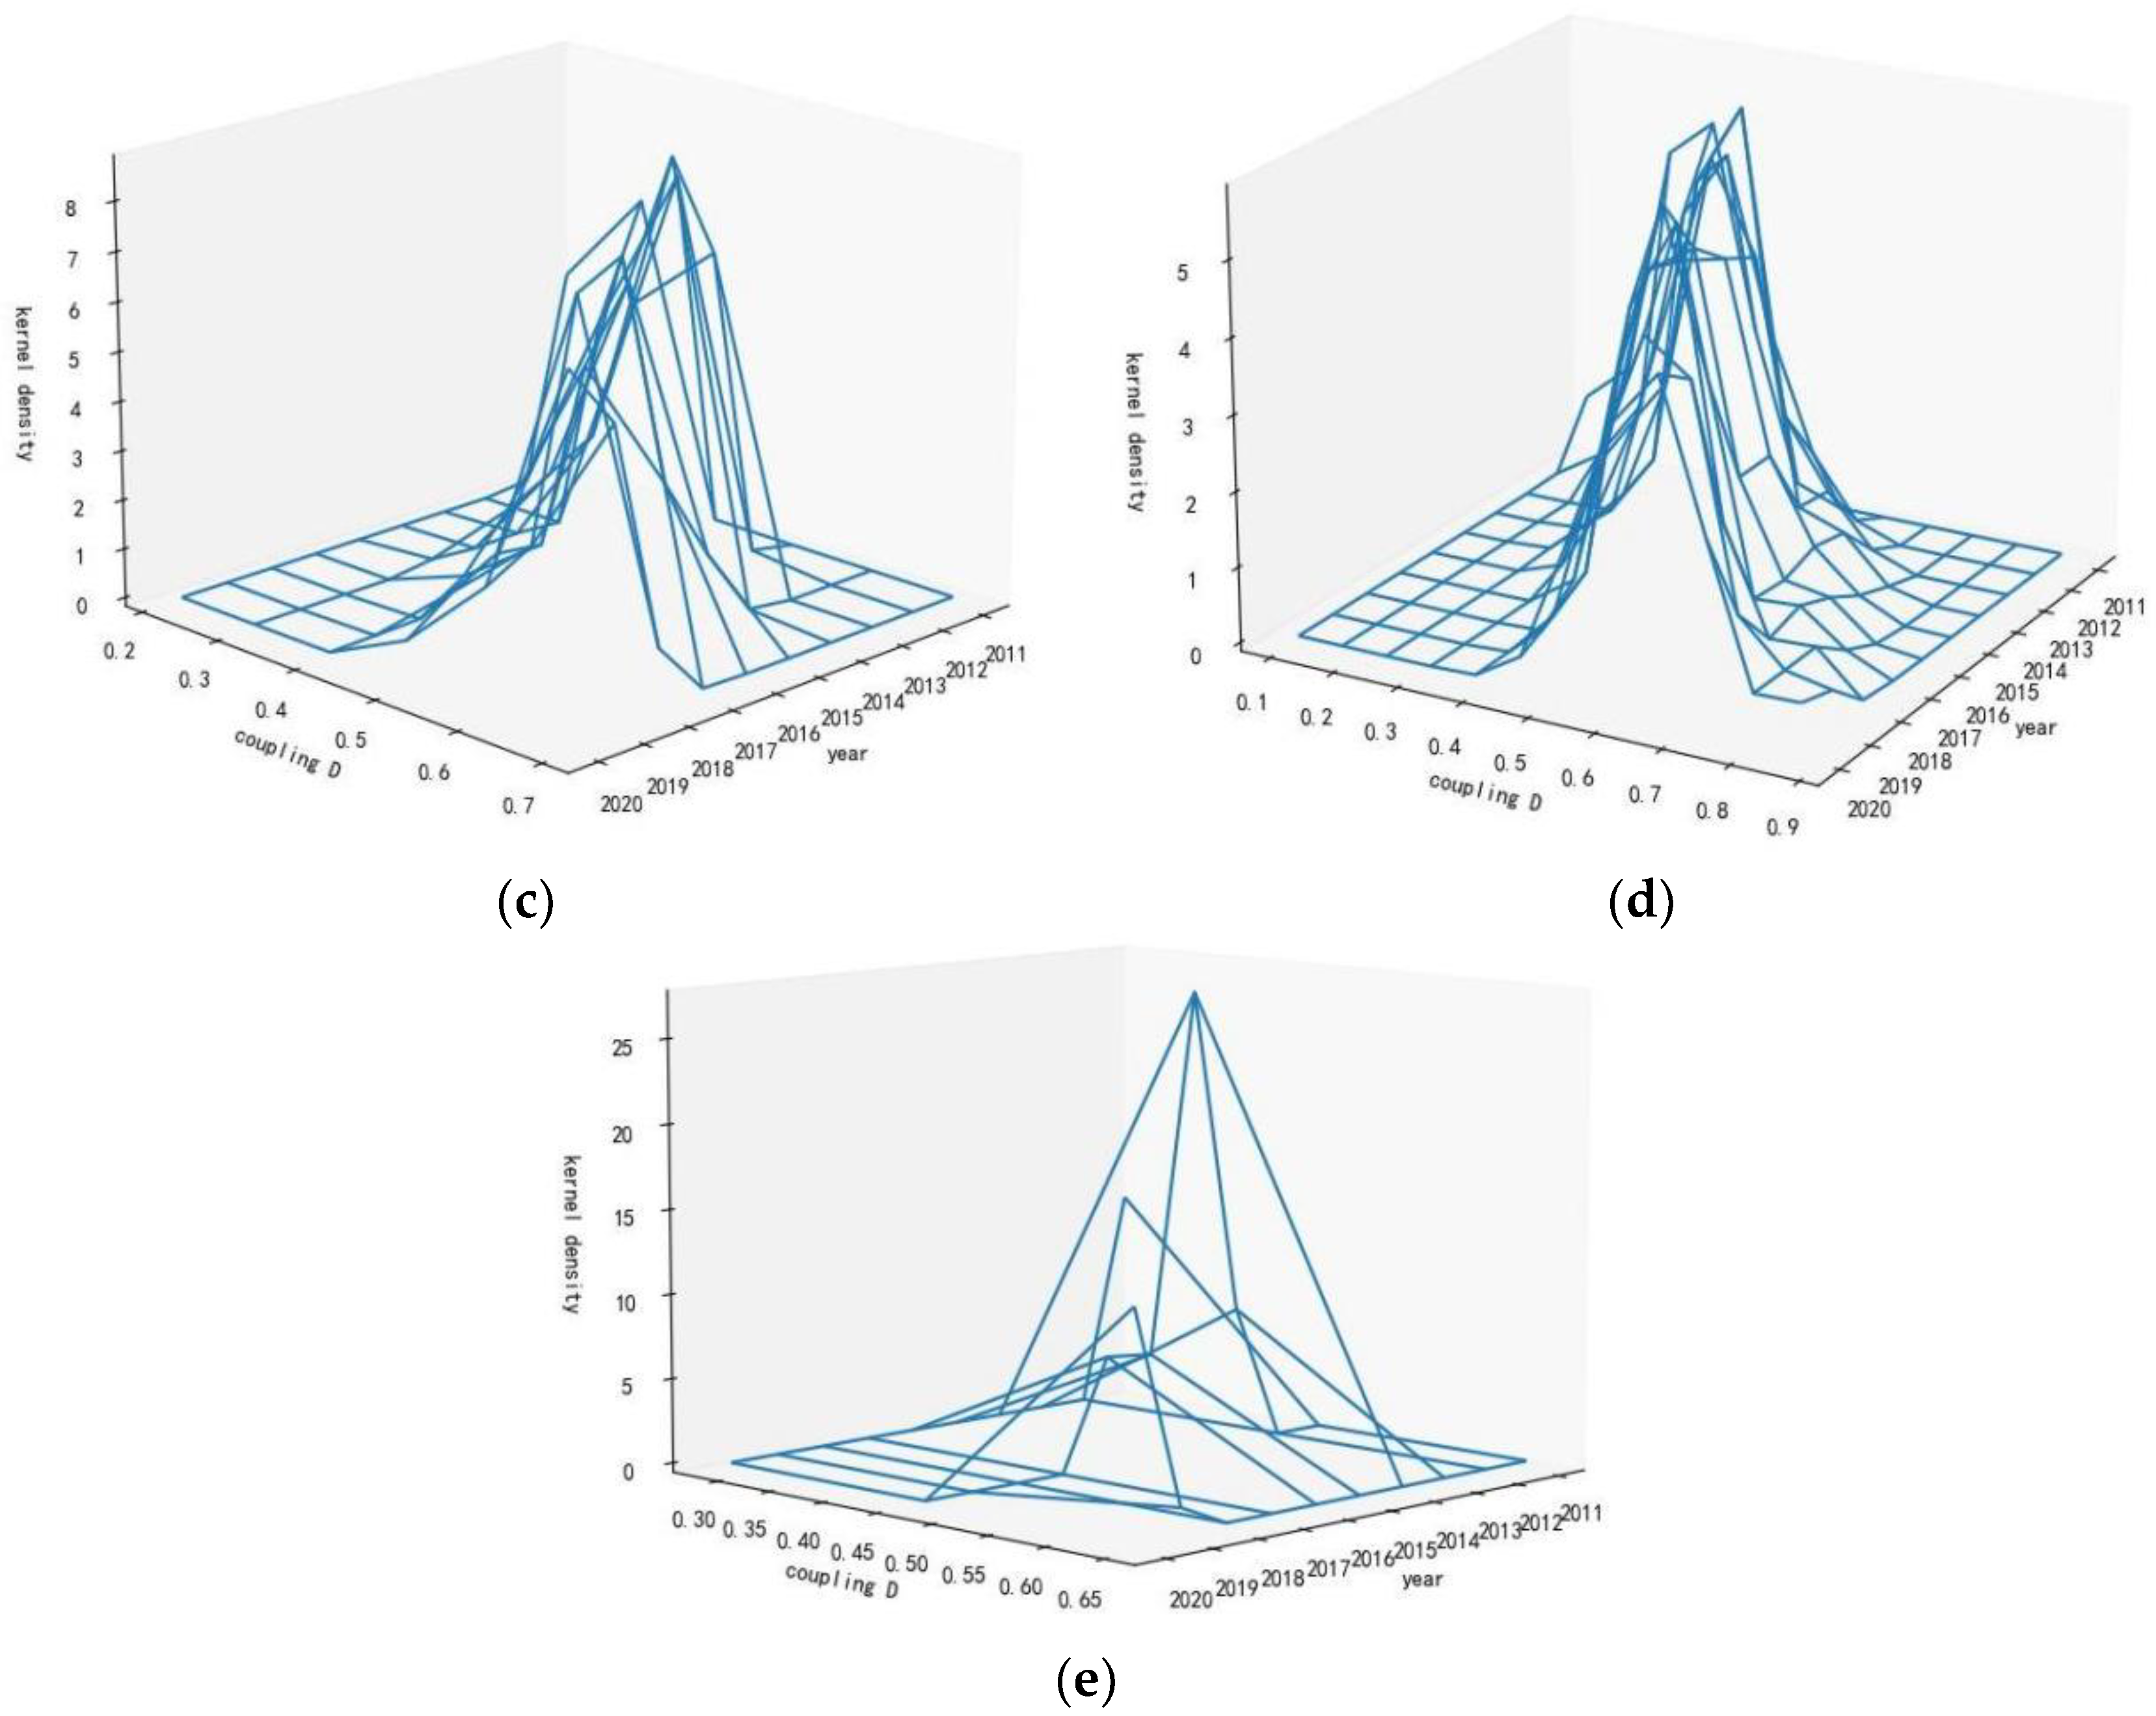
In this paper, Python 3.6 software was used to estimate the kernel density of the coupled coordination degree between the digital economy and environmental quality from 2011 to 2020, as shown in
Figure 3.
Figure 3.
(a) Nationwide; (b) Eastern region; (c) Central region; (d) Western region; (e) Northeast region.
Figure 3.
(a) Nationwide; (b) Eastern region; (c) Central region; (d) Western region; (e) Northeast region.
Figure 3(a) shows the dynamic evolution trend of the overall national coupled coordination degree during the sample period. Notably, the kernel curve gradually shifts to the right, indicating that the overall coupled coordination level of the country continues to improve. From the perspective of the distribution pattern, the kernel curve displays a slight trailing phenomenon in 2012, 2014, 2017 and 2018, indicating that there is a certain spatial gap in the coupled coordination levels in 2012, 2014, 2017 and 2018 nationwide. Some provinces rely on their own resource endowments and advanced development experience; they took the lead in improving the coupled coordination level of the digital economy and ecological environment system. The variations in the kernel curve display a narrowing trend to a certain extent, which indicates that the spatial gap of the coupled coordination level in the country is gradually narrowing. Based on the distribution pattern, the vertical height of the curves remains basically unchanged, the horizontal width decreases, and the number of peaks decreases, which indicates that the horizontal density of the national coupled coordination degree tends to move in the direction of numerical reduction, and there is a dynamic convergence characteristic. The dynamic distribution and evolution trend of the coupled coordination degree between the digital economy and environmental quality in the four economic regions is shown in
Figure 3(b)-(e).
In the eastern region, the kernel curve gradually shifts to the right, and the coupled coordination degree generally shows an upwards trend. From the distribution pattern, the height of the main peak exhibits a steady upwards trend, the width of the main peak gradually narrows, and the interprovincial difference in the coupled coordination degree in the eastern region decreases. From the perspective of distribution variations, there is no obvious tailing phenomenon in the right tail of the kernel curve, indicating that the spatial difference in the interprovincial coupled coordination level is relatively small in the eastern region. The kernel density curve of the coupled coordination degree maintains a unimodal peak, indicating that the interprovincial coupled coordination level is evenly distributed in the eastern region, and there is no multipolar or bipolar phenomenon.
In the central region, the kernel curve moves to the right, and the coupled coordination degree generally shows an upwards trend. The kernel density curve of the coupled coordination degree maintains a unimodal peak, indicating that the interprovincial coupled coordination level is evenly distributed in the eastern region, and there is no multipolar or bipolar phenomenon. From the distribution pattern, the height of the main peak displays an "up-down" trend, and the width of the main peak exhibits an "enlarging-narrowing" trend, indicating that the coupled coordination level in the central region first increased and then slightly decreased. Additionally, the interprovincial difference in the coupled coordination degree in the central region first increased and then decreased.
In the western region, the kernel curve gradually shifts to the right, and the coupled coordination degree generally displays an upwards trend. From the distribution pattern, the height of the main peak presents a trend of "up-down-up", and the width of the main peak exhibits a trend of "narrowing-enlarging-narrowing". From the perspective of distribution ductility, there is no obvious tailing phenomenon in the right tail of the kernel curve, indicating that the spatial gap in the interprovincial coupled coordination level is relatively small in the western region. The kernel density curve of the coupled coordination degree displays a unimodal state, indicating that the interprovincial coupled coordination level is evenly distributed and that there is no multipolar differentiation in western China.
In Northeast China, the kernel curve displays three stages of "right shift-left shift-right shift", and the increase in the coupled coordination degree exhibits breakpoints from 2014-2017 and 2018-2020. Moreover, the main peak displays a multistage trend of "rising-sharply declining-slightly rising". This shows that the coupled coordination level of the two systems in Northeast China is trending downwards, and the interprovincial coupled coordination level varied in the two stages from 2015 to 2017 and 2018 to 2020.
3.3. Regional Differences in and Decomposition of the Coupled Coordination Degree
3.3.1. Overall and Intraregional Differences
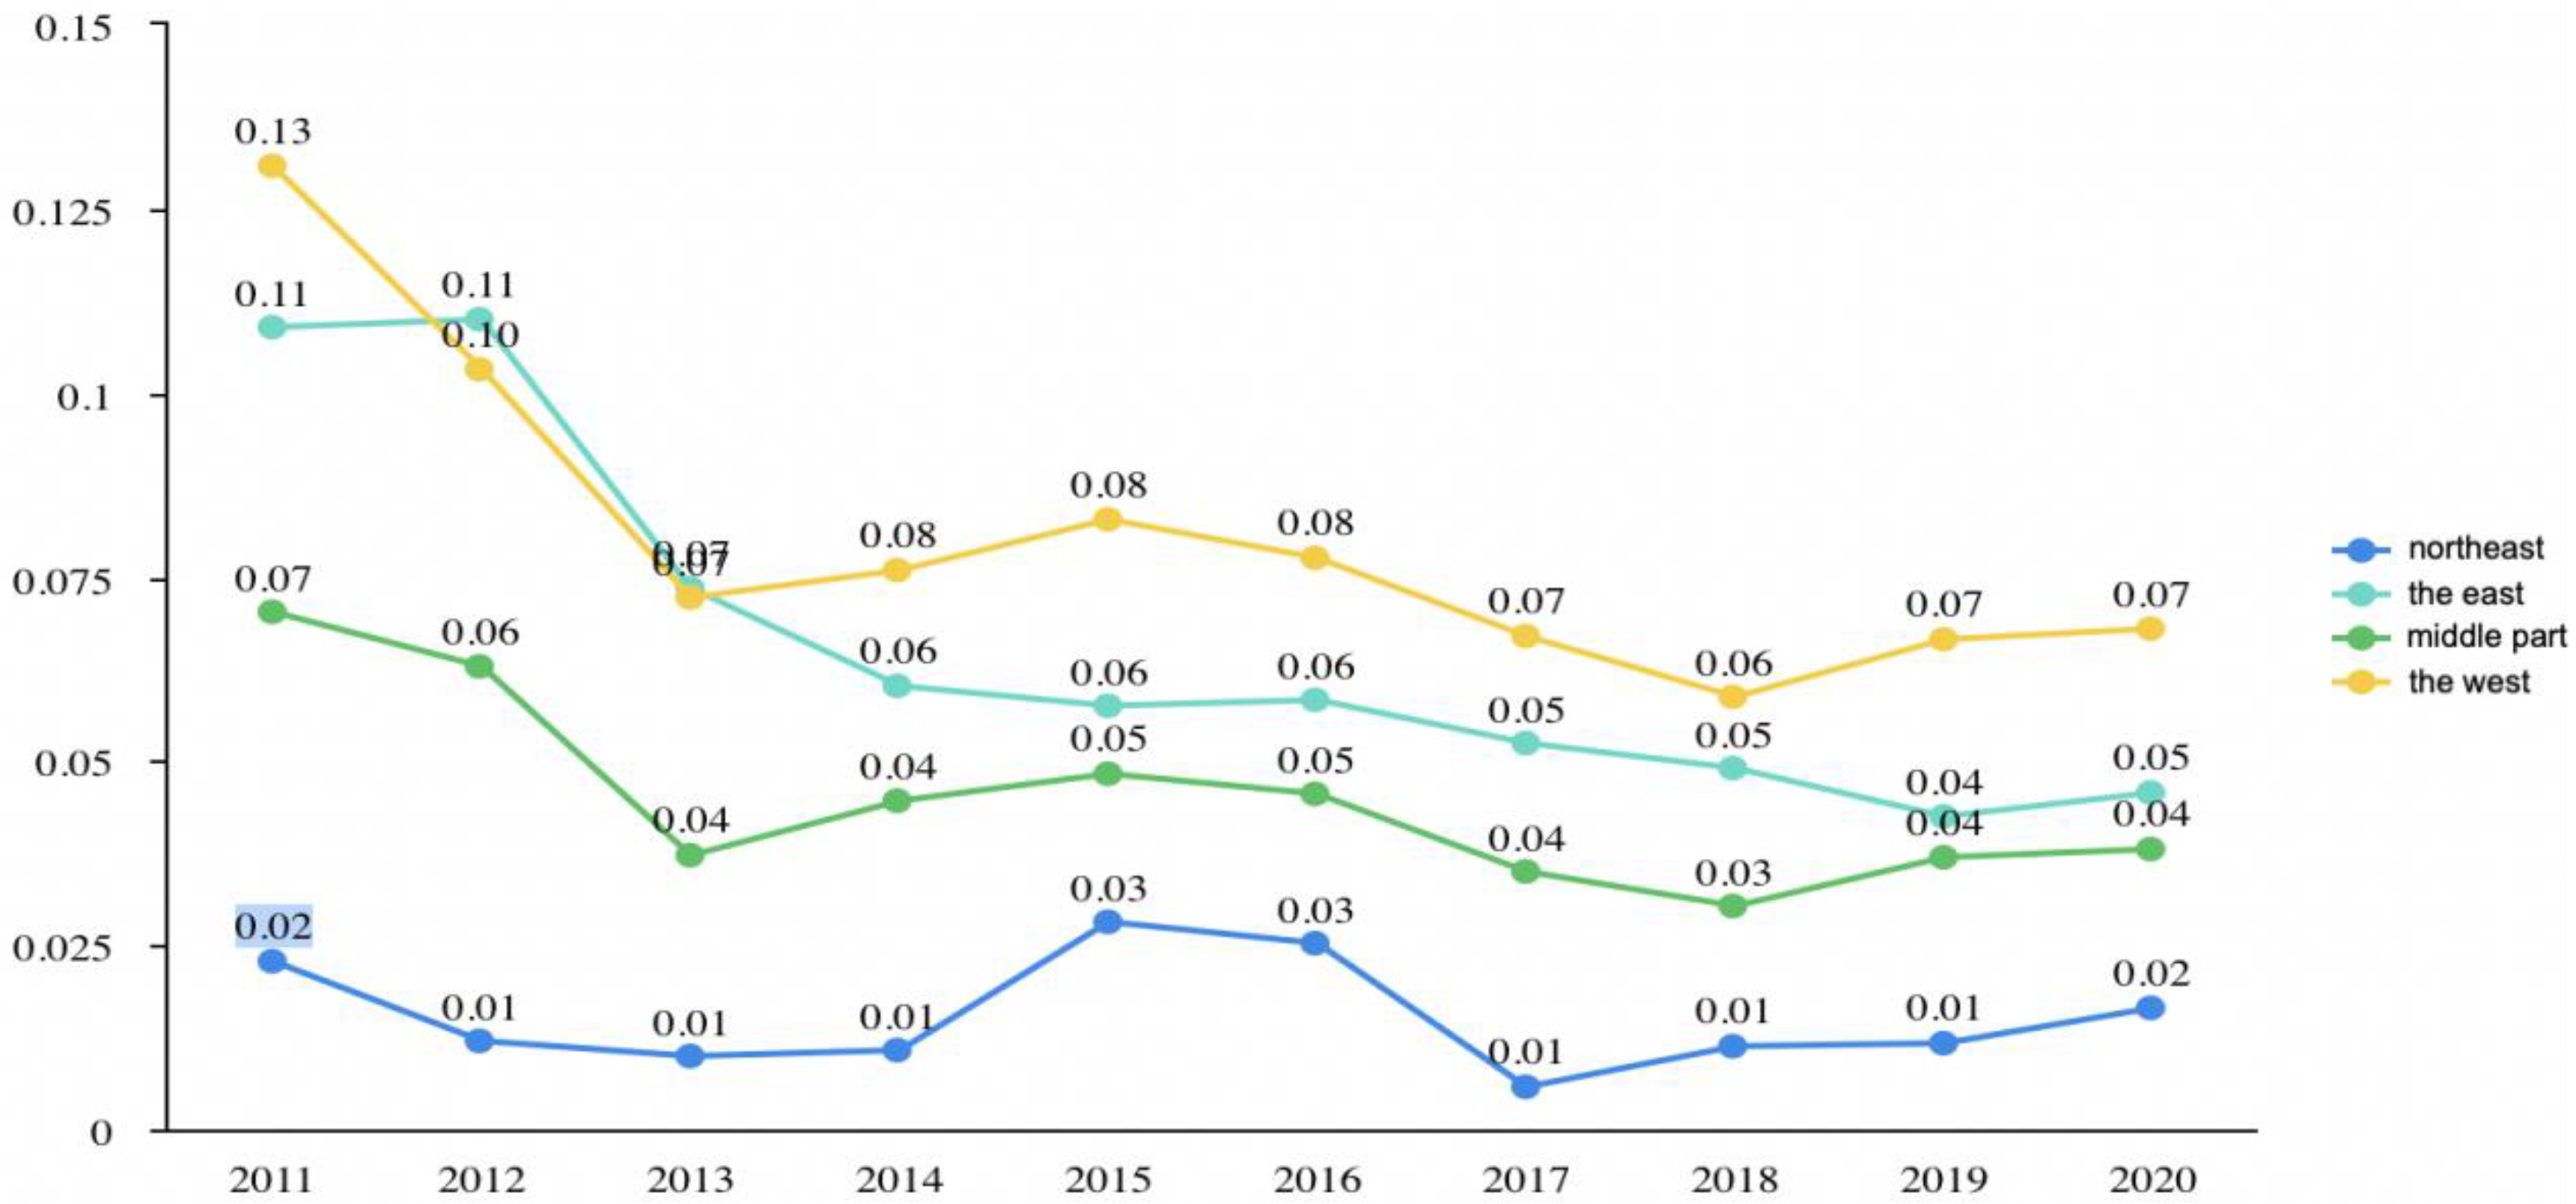
Figure 4 shows the spatiotemporal evolution of the Gw value of the Gini coefficient within the four regions in each year. Notably, the intragroup Gini coefficient Gw is high in the western region and the eastern region, reflecting heterogeneity in coupled coordination. However, the Gini coefficient in the northeast region is small, reflecting relatively uniform coupled coordination. The value of the Gini coefficient in the central region is moderate. In addition,
Figure 4 shows that the intragroup Gini coefficient value in the eastern region displays a downwards trend, which suggests that the heterogeneity of the coupled coordination degree between the digital economy and environmental quality in the provinces in the eastern region has been decreasing in the past 10 years. However, this heterogeneity is increasing in the western, central and north-eastern regions.
Figure 4.
Decomposition of the Gini coefficient by region.
Figure 4.
Decomposition of the Gini coefficient by region.
3.3.2. Interregional Differences
As shown in
Table 5, the regional differences between the eastern and central regions showed a significant downwards trend, with a decrease of 73.7%; the regional differences between the northeast and eastern regions and the eastern regions and western regions displayed an oscillating downwards trend, with decreases of 61.9% and 64.8%, respectively. Notably, various regions have established multiple measures to manage and protect the environment and vigorously develop the digital economy. With spatial spillover and the regional coordination of the development level of the two systems, the regional differences in the coupled coordination degree have gradually decline. The interregional differences fluctuate greatly between the northeast and the west and frequently between the central and the western regions.
Table 5.
Values of the interregional Gini coefficient.
Table 5.
Values of the interregional Gini coefficient.
| Year |
Northeast & East |
Northeast & Central |
Northeast & West |
East & Central |
East & West |
Central & West |
| 2011 |
0.176 |
0.071 |
0.094 |
0.224 |
0.213 |
0.111 |
| 2012 |
0.162 |
0.059 |
0.073 |
0.159 |
0.163 |
0.092 |
| 2013 |
0.111 |
0.039 |
0.051 |
0.103 |
0.119 |
0.062 |
| 2014 |
0.098 |
0.038 |
0.053 |
0.098 |
0.105 |
0.064 |
| 2015 |
0.097 |
0.045 |
0.064 |
0.094 |
0.107 |
0.071 |
| 2016 |
0.098 |
0.050 |
0.059 |
0.087 |
0.106 |
0.071 |
| 2017 |
0.084 |
0.043 |
0.047 |
0.072 |
0.094 |
0.062 |
| 2018 |
0.087 |
0.047 |
0.043 |
0.067 |
0.086 |
0.055 |
| 2019 |
0.082 |
0.047 |
0.050 |
0.061 |
0.084 |
0.059 |
| 2020 |
0.067 |
0.041 |
0.054 |
0.059 |
0.075 |
0.057 |
3.3.3. Sources of Differences
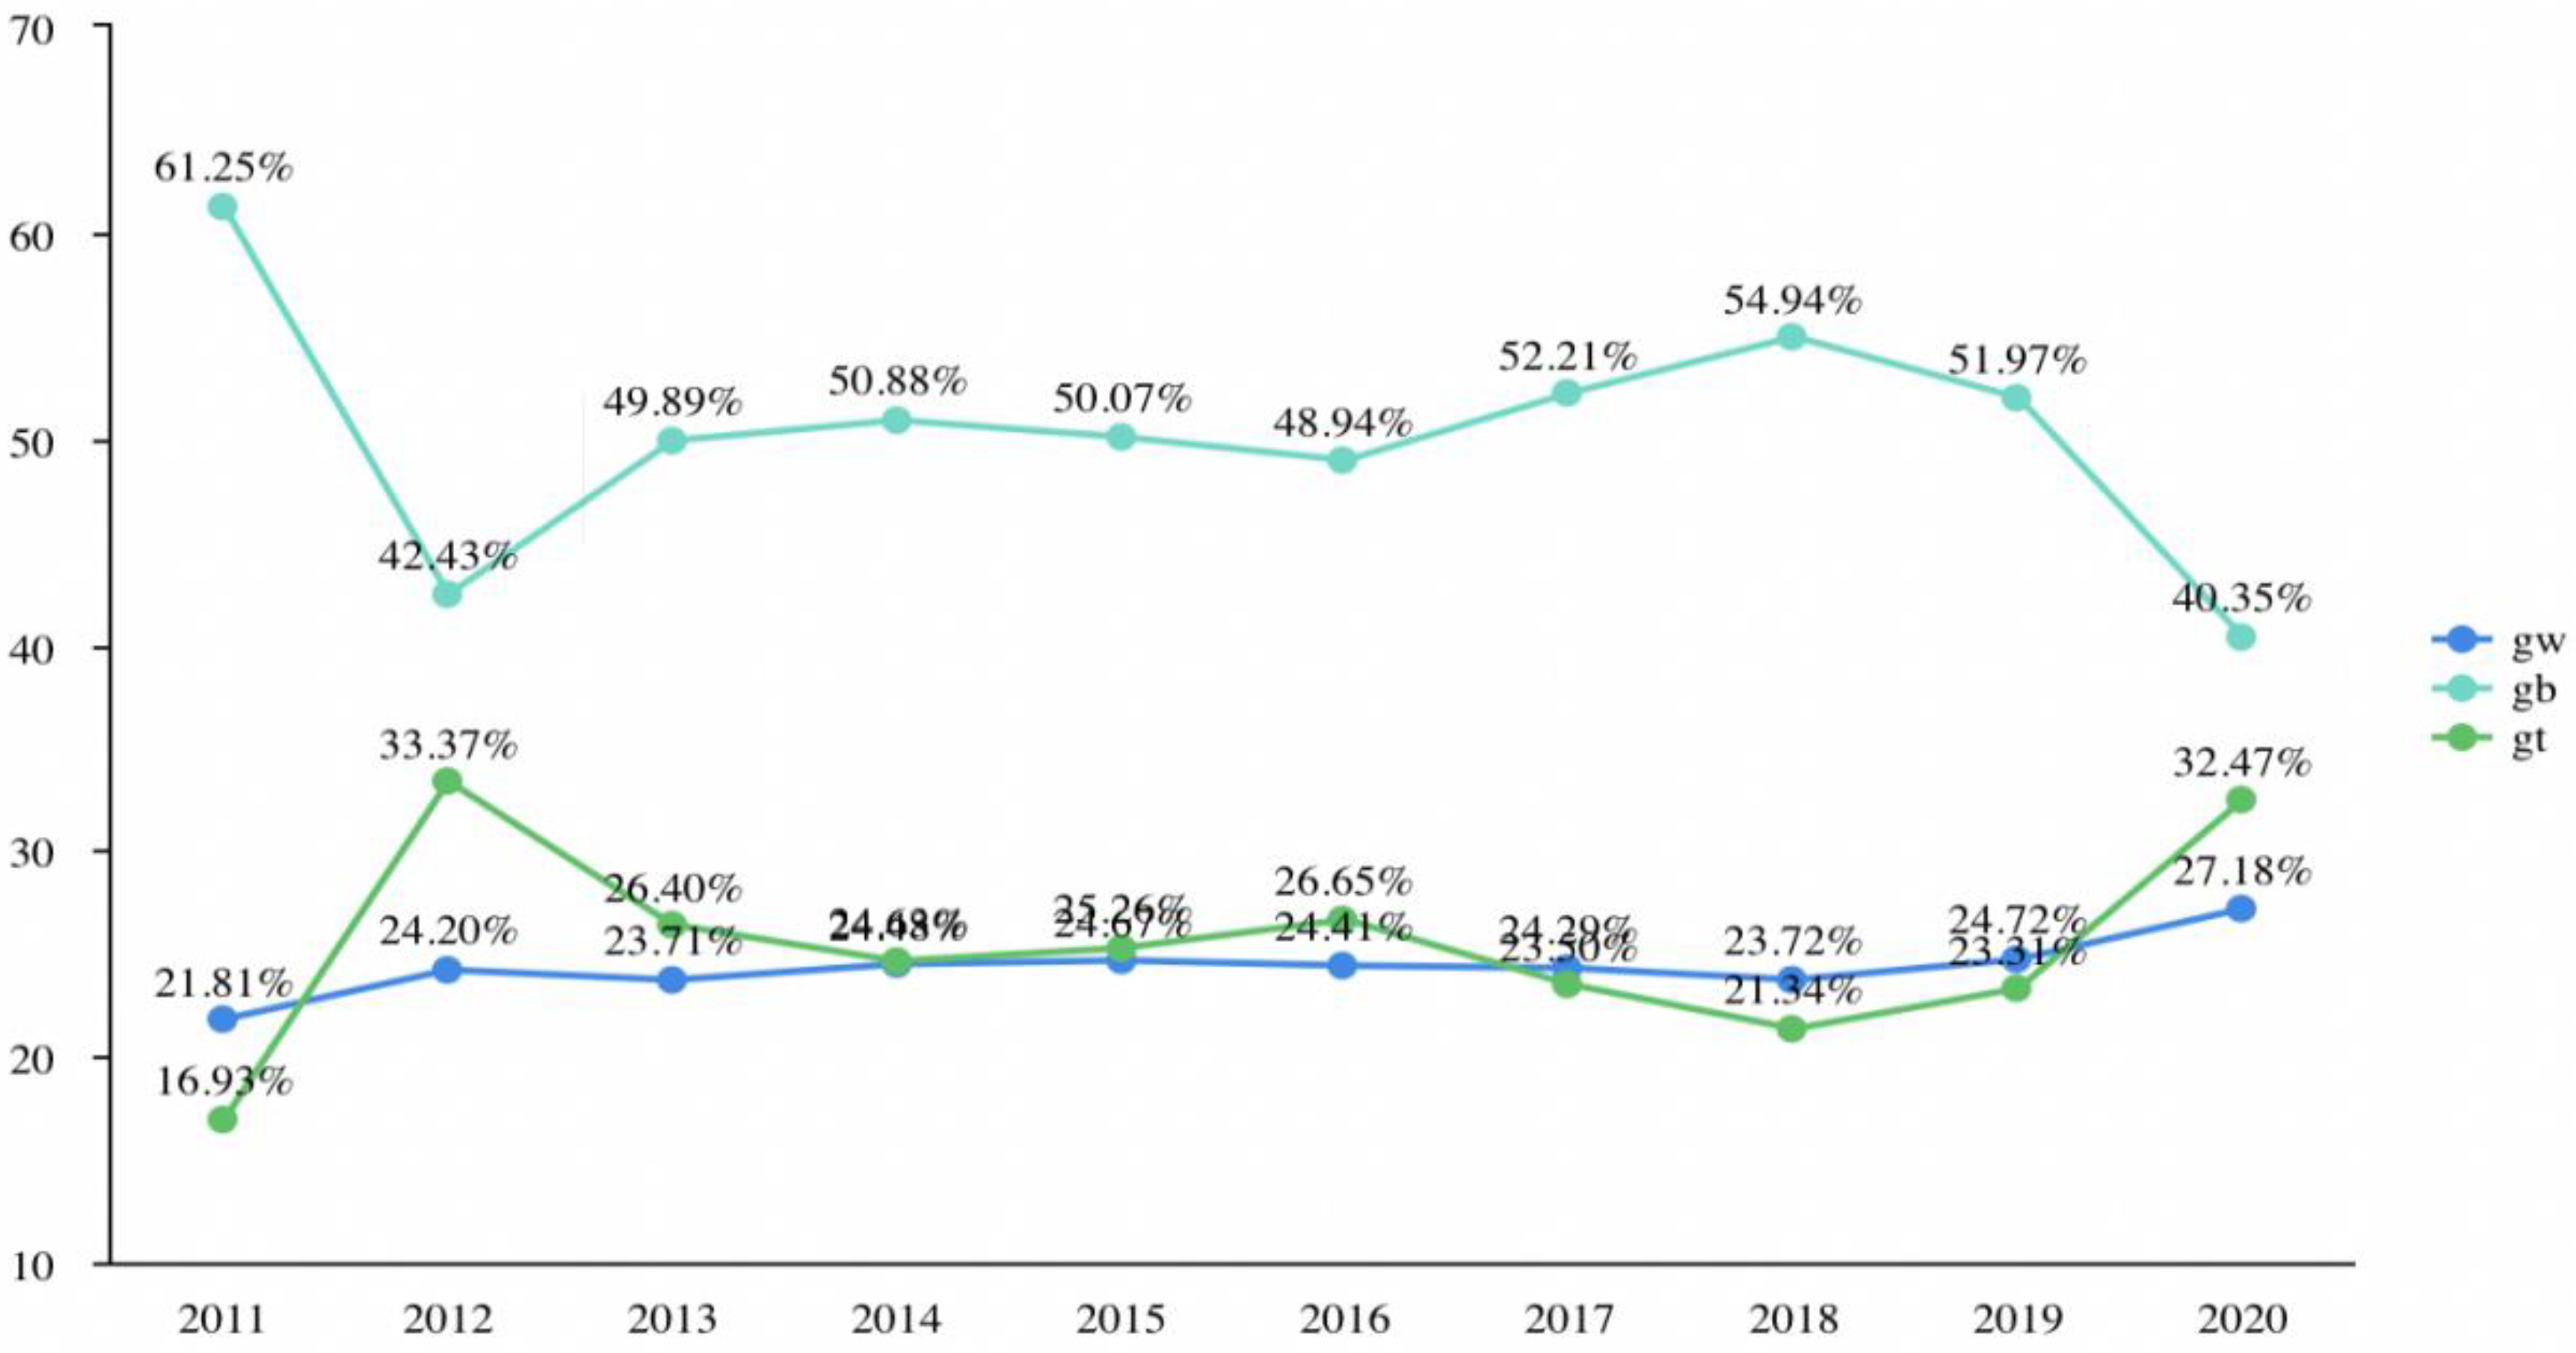
Figure 5 visually shows the contributions of Gw within each group, Gb between the groups and Gt over time. The overall Gini coefficient of the coupled coordination degree between the digital economy and environmental quality displayed a certain downwards trend, ranging from 0.155 in 2011 to 0.061 in 2020. Except for fluctuations in 2015, the overall regional differences and imbalances have gradually decreased. In comparison, the main source of disequilibrium is associated with intergroup Gb. In the past 10 years, the intergroup contribution has been greater than 40%, the average intragroup contribution Gw has been approximately 24.3%, and the average contribution Gt of has been 25.4%. In other words, the main source of regional imbalance in the coupled development of China’s digital economy and environmental quality systems is the coupled coordination imbalance among regions. Additionally, the overlap of samples within and between/among regions has made a relatively small contribution to the coupled coordination imbalance between the two systems. Since 2020, the gap between the intragroup contribution rate and the intergroup contribution rate of the coupled coordination degree has narrowed significantly, with the intergroup contribution rate dropping to 40.35% and the intragroup contribution rate rising to 27.18%, indicating that the interregional difference in the coupled coordination degree of the national digital economy and environmental quality has decreased, while the intraregional difference has increased. Notably, the strategy for vigorously developing the digital economy and promoting environmental restoration has varied by region, resulting in the main overall difference in the coupled coordination degrees of the two systems. Therefore, attention should be given to regional differences to promote the digital economy and effectively enhance the quality of the environment.
Figure 5.
Trends of the contributions of differences in factors to the coupled coordination degree.
Figure 5.
Trends of the contributions of differences in factors to the coupled coordination degree.
5. Conclusions and Policy Recommendations
5.1. Conclusions
Based on the panel data from 31 provinces and cities in China from 2011 to 2020, the entropy of the digital economy and environmental quality is measured, and the degree of coordinated development of the two systems is analysed. On this basis, the kernel density model and Gini coefficient model are established to analyse the distribution dynamics, evolution trends and regional differences of the coupled coordination of the two systems. An individual fixed-effect model is established, and the driving factors of the coordinated development of the two systems are analysed. The main conclusions of this paper are four-fold. First, the overall level of development of China’s digital economy and the quality of the environment have maintained steady growth, and the digital economy is developing fastest. Second, the coupled coordination degree of the two systems in each region has displayed a gradual upwards trend and an overall upwards trend, respectively. In 2018, the country entered a state of coordination, with the eastern region reaching this state first. The digital economy and environmental quality system in Inner Mongolia are in the run-up stage, and in other regions, these systems are in the stage of high-level coupling and coordination. Third, the spatial gap in the level of coupled coordination across the country is gradually narrowing. The national coupled coordination level is characterized by dynamic convergence, and the coupled development level of the digital economy and environmental quality displays some regional imbalance. Fourth, the coupling and coordination of the digital economy and environmental quality systems is the result of the joint impacts of many factors, with environmental regulation being the main external driver. Among the internal factors, the level of economic development, the level of technological innovation, the upgrading of the industrial structure and the degree of openness to the outside world are the main driving factors of the coupled coordination level of the digital economy and environmental quality.
5.2. Policy Recommendations
Based on the above research results, the following policy recommendations are proposed. 1) Continue to expand the depth and breadth of the application of digital technologies; improve the allocation mechanism of digital resources; coordinate regional development; effectively consider the positive role of the government in strengthening relations, improving the supply of public services and optimizing the business environment; enhance the internal driving forces; promote innovation in the high-quality development of the digital economy; and realize the sustainable development of the digital economy. These tasks could provide new momentum for improving the quality of the environment. 2) Strengthen ecological and environmental protection and restoration. Strict environmental protection standards should be established considering local conditions, and environmental restoration should be strengthened from four perspectives: pollution discharge, ecological protection, the living environment, and environmental improvement. 3) Promote the development level of the digital economy, and improve the quality of the ecological environment in parallel. The factor supply system should be optimized to support the two-way development of the digital economy and environmental quality. A reasonable and efficient resource allocation mechanism should be established, continuous support for the coordinated promotion of the digital economy and environmental quality should be provided, and a long-term mechanism to promote the coupled coordination of the digital economy and environmental quality should be formed. 4) In the process of digital economy transformation and environmental governance, all regions should focus on balanced within and among regions and promote regional coordinated development to optimize the overall efficiency of the two systems. 5) Promote the opening and sharing of public data, establish a regional collaborative governance mechanism for the environment, actively remove policy barriers that hinder the coordinated development of the digital economy and environmental quality, fully consider the external driving forces of the coordinated development of the two systems, further explore internal driving forces, and promote the coordination and common progress of the two systems.
In view of the availability of data, the research period selected in this paper is relatively short, and the actual background in China is different from that in other developed countries; consequently, the conclusions may be different. Subsequent studies will further enrich relevant research in terms of the depth and breadth of the research field.
