Preprint
Article
A Privacy and Energy-Aware Federated Framework for Human Activity Recognition
Altmetrics
Downloads
85
Views
71
Comments
0
A peer-reviewed article of this preprint also exists.
This version is not peer-reviewed
Submitted:
14 October 2023
Posted:
17 October 2023
You are already at the latest version
Alerts
Abstract
Human activity recognition (HAR) using wearable sensors is gaining popularity in the healthcare domain, enabling continuous monitoring and timely interventions. The conventional HAR systems are centralised and need data sharing with a server for processing and model training. However, this data sharing leads to various challenges, such as privacy concerns, increased communication and storage costs, inefficient computational algorithms, data scarcity due to unwillingness to share, and difficulty achieving high accuracy and personalised models simultaneously. To overcome these challenges, this paper introduces a privacy and energy-aware federated learning (FL) framework for model training without data sharing. The proposed scheme incorporates spiking neural networks (SNNs), which are particularly suited for resource-constrained devices due to their event-driven information processing. The key idea is to synergise the strengths of SNNs and long short-term memory (LSTM) to create a hybrid model for robust HAR. The proposed hybrid spiking LSTM (S-LSTM) model uses the LSTM as an input layer to capture temporal dependencies efficiently, followed by spiking layers that replace the typical activation using leaky integrate-and-fire neurons. We employ the combination of surrogate gradient learning and backpropagation through time (BPTT) to update the weights of SNN layers in a supervised manner. The performance of the proposed model is evaluated using two publicly available datasets for both indoor and outdoor scenarios. The results show that the proposed S-LSTM performs much better than spike convolutional neural networks (S-CNN) and simple CNN, achieving the accuracy of 97% and 87% for indoor and outdoor datasets, respectively. Personalisation, also known as fine-tuning the global model using local data, is crucial in HAR. It allows the model to adapt to individual behaviour and preferences, making predictions more accurate. The results also show that personalisation improves the performance of participants up to 9% on average. Additionally, analysis with 50% random client participation reduces communication costs by 50% with minimal impact on accuracy.
Keywords:
Subject: Engineering - Electrical and Electronic Engineering
1. Introduction
Human Activity Recognition (HAR) aims to identify the physical movements of people, enabling intelligent systems to assist individuals in improving their quality of life. This technology has numerous indoor and outdoor applications, including smart homes, healthcare, public safety, and sports [1]. Additionally, the proliferation of devices such as smartphones, smartwatches, and fitness trackers has paved the way for numerous new applications. These devices capture a rich amount of contextual data, facilitating remote patient monitoring, identifying and preventing potential hazards like falls, promoting healthier lifestyles, and creating automated activity records [2]. Such advancements are particularly beneficial for elderly care, aiding their independent living by ensuring safety and timely interventions. Despite recent advancements in HAR technology, challenges persist in accuracy, real-time processing, data scarcity, computational complexity, and user privacy.
Building on the importance of HAR, especially in the context of independent living for the elderly, two primary technologies have emerged for data acquisition: vision-based and sensor-based systems. Vision sensing relies on high-resolution cameras coupled with advanced computer vision techniques. However, it faces challenges such as privacy concerns and quality degradation due to lighting conditions and camera limitations [3]. In contrast, sensor-based techniques offer both wearable and non-wearable solutions. Non-wearable sensors, especially those utilising radio frequencies (RF) like channel state information (CSI) or received signal strength indicator (RSSI), are gaining popularity for indoor human activity monitoring due to their non-invasive and privacy-conscious nature [4,5]. Wearable sensors, including pedometers, accelerometers, and gyroscopes, remain popular choices for HAR, with smartphones and smartwatches emerging as preferred devices for activity tracking.
The decision to use vision or sensor-based systems depends on application requirements, environment, and user preferences, each with its own advantages and challenges. However, wearable sensors provide more accurate data for HAR as they directly capture detailed human movements. This precision is crucial, especially in dynamic environments and is particularly vital for elderly care, where individuals may engage in activities that vary in intensity and nature [6]. On the other hand, non-invasive sensing techniques, such as video, present significant privacy concerns, making them less suitable for applications where user privacy is paramount. Moreover, establishing infrastructure for outdoor HAR using vision or RF sensing presents challenges, often due to environmental factors, equipment costs, and maintenance requirements. Additionally, non-invasive RF-based systems, while promising, still face hurdles in achieving high accuracy, especially when monitoring multiple individuals simultaneously [7]. The decision between these techniques requires a careful balance of accuracy, privacy, and feasibility based on the specific context of the application.
Traditionally, HAR systems are predominantly operated in a centralised architecture, as depicted in Figure 1. In such setups, various sensors collect data from multiple participants and share it with a central server or cloud infrastructure for processing and analysis [8]. This centralised data processing inherits several limitations, especially when the volume and variety of data sources have expanded. With the advent of advanced data analytics, deep learning (DL) has emerged as a powerful tool for HAR, enabling the extraction of intricate patterns directly from raw sensor data, thereby eliminating the need for manual feature engineering. DL models, such as convolutional neural networks (CNNs) [9] and recurrent neural networks (RNNs) [10,11], have shown remarkable success in HAR applications, often outperforming traditional machine learning techniques. However, the adoption of DL approaches in HAR is not without challenges. One of the primary concerns is data scarcity, especially labelled data, which is crucial for training DL models. The process of labelling vast amounts of data is labour-intensive and often requires domain expertise [3]. Furthermore, the centralised nature of HAR systems poses significant communication and storage costs, especially when transmitting high-dimensional raw data [12]. Additionally, processing this data in centralised servers can incur additional latency, especially when dealing with real-time activity recognition tasks. More critically, centralising user data exposes individuals to potential privacy breaches, a concern that has gained prominence in the age of stringent data protection regulations [13].
To overcome the limitations of centralised model training, federated learning (FL) has emerged as a promising distributed learning paradigm. FL enables collaborative learning using multiple participants for model training, without any data sharing [14]. This distributed learning architecture offers privacy by design, reduces communication and storage overhead, and ensures real-time processing, a crucial requirement for HAR tasks [8]. Furthermore, the participation of multiple clients in FL offers significant advantages. Each participant, with their distinct data, contributes to the overall model, resulting in a more generalised and robust global model that captures a broader range of human activities. FL enables real-time processing by dividing computational tasks among different devices. Its decentralised architecture is scalable and can accommodate various devices and data sources. Additionally, FL’s collaborative training approach allows personalisation, which is achieved by fine-tuning the global model using local data, improving the accuracy and relevance of activity recognition. These personalised models use individual-specific data to provide more precise and context-aware activity recognition, aligning the system’s predictions with the user’s unique patterns and behaviours.
In the realm of HAR, the need for distributed learning is becoming increasingly important, especially given the challenges associated with centralised systems. As we transition towards more decentralised and edge-based processing, the computational demands of traditional DL models can become a significant bottleneck, especially on resource-constrained edge devices [15]. While FL offers several advantages, one major drawback is the hardware available in the market often struggles to support this distributed intelligence with energy efficiency. To overcome this challenge, neuromorphic computing emerges as a potential solution. Inspired by the human biological neural systems, neuromorphic computing promises energy-efficient and rapid signal processing. Spiking neural networks (SNNs), a subset of neuromorphic learning, are gaining attention due to their unique event-driven processing of binary inputs, known as ’spikes’ [16]. Unlike traditional DL models, SNNs operate on a temporal, event-driven paradigm, making them particularly suitable for on-device learning. The real-time and continuous nature of activity data in HAR accentuates the potential advantages of neuromorphic computing, highlighting the necessity for models that can adeptly capture the temporal dynamics of human activities.
Although SNNs are computationally efficient, traditional DL models such as LSTM networks are more effective in processing sequential data [17]. Given these considerations, a compelling need emerges for a model that synergistically combines the strengths of SNNs and LSTMs. Therefore, we introduce the hybrid neuromorphic federated learning (HNFL) approach, which integrates the SNN with LSTM, creating a Spiking-LSTM (S-LSTM) model. The S-LSTM is ingeniously crafted to leverage the computational efficiency of SNNs while harnessing the sequential data processing capabilities of LSTMs. This fusion offers a harmonious balance between efficiency and accuracy, positioning the S-LSTM as a pioneering model for HAR in a federated setting. To the best of the authors’ knowledge, no prior research has presented such a hybrid model for HAR. The key contributions of this paper are as follows:
- We introduce a novel HNFL framework tailored for HAR using wearable sensing technology. The hybrid design of S-LSTM seamlessly integrates the strengths of both LSTM and SNN in a federated setting, offering privacy preservation and computational efficiency.
- A comprehensive analysis is conducted using two distinct publicly available datasets, and the results of the S-LSTM are compared with spiking CNN (S-CNN) and simple CNN. This dual-dataset testing approach validates the robustness of the proposed framework and provides valuable insights into its performance in varied environments and scenarios.
- This study addresses a significant issue of client selection within the context of federated HAR applications. We conduct a thorough investigation into the implications of random client selection and its impact on the overall performance of the HAR model. This analysis provides valuable insights into achieving the optimal balance between computational, communication efficiency and model precision, which guides the ideal approach for client selection in federated scenarios.
The rest of the paper is organised as follows: Section 2 introduces the related work for FL-based HAR. In Section 3, preliminaries and system model is discussed, whereas Section 4 explains the simulation setup. Section 5 provides the details on results and discussion, and Section 6 concludes the research findings.
2. Related Work
HAR has witnessed significant advancements, particularly with the proliferation of wearable sensors across diverse applications. Initially dominated by traditional machine learning techniques, HAR has shifted towards more sophisticated DL models, offering enhanced accuracy and reliability. However, with the digital landscape becoming increasingly decentralised and privacy-focused, it is imperative to adapt these models to ensure user privacy while maintaining computational efficiency. Neuromorphic computing, particularly SNN, emerges as a promising solution to overcome these challenges. Hence, this section reviews the state-of-the-art work in (a) centralised learning-based HAR system, and (b) federated learning-based HAR.
2.1. Centralised Learning-Based HAR Systems
In recent times, various studies have investigated HAR using wearable sensing and DL. For instance, the authors in [18], proposed a novel heterogeneous convolution operation that was explicitly introduced for HAR. This approach divides convolutional filters into two uneven groups. The smaller group of filters undergoes a down-sampling process and captures the broader perspective from input samples. The output of this process provides feedback to the larger group of filters, recalibrating the model to enhance feature diversity. This method demonstrated significant performance improvements through extensive testing on multiple HAR datasets without necessitating changes to the underlying network architecture. Notably, the heterogeneous convolution can be seamlessly integrated into standard convolutional layers without adding computational overhead. In [19], a novel approach that uses a DL method called neural structured learning has been proposed. This system uses LSTM to process wearable sensor data and applies nonlinear generalised discriminant analysis to extract features. The analysis shows a high recall rate of 99% on a publicly available dataset, surpassing traditional methods like CNN and RNN, which only achieved a maximum recall rate of 94%. In [20], a hybrid approach was introduced for HAR, leveraging a bi-convolutional recurrent neural network (Bi-CRNN) for feature extraction. The proposed scheme employs a random forest classifier for final predictions. This approach, enhanced by an auto-fusion technique for multi-sensor data processing, outperformed existing HAR algorithms. Despite its computational demands, the feature extraction ability of Bi-CRNN has significantly improved its performance, achieving a remarkable % accuracy.
The study in [21] proposed a fast and robust deep convolutional neural network (FR-DCNN) for HAR using smartphone data. This framework optimises computational efficiency by employing a data compression module, allowing for swift training while maintaining high precision in recognising 12 distinct activities. The FR-DCNN model uses raw data samples collected from triaxial accelerometers and gyroscopes. Notably, its performance surpasses other DL algorithms in terms of speed and accuracy, achieving a prediction accuracy of 95.27%. Even with compressed datasets, the accuracy remains impressive at 94.18%. Another innovative approach is the merging-squeeze-excitation (MSE) technique for HAR using wearable sensors [22]. This method recalibrates feature maps during fusion, allowing the model to emphasise or suppress certain features based on their relevance. This recalibration, combined with local and global skip connections, global channel attention, and deeper fusion, enhances the model’s adaptability and precision. When tested with DL models like LeNet5, AlexNet, and VGG16 for feature extraction, the proposed methods consistently achieved high accuracy across three different datasets. In summary, the current landscape of DL for HAR involves the combination of novel architectures, hybrid models, and advanced feature re-calibration techniques. These advancements collectively aim to enhance the accuracy, reliability, and adaptability of HAR systems, making them more suited for real-world applications.
2.2. Federated Learning-Based HAR
With the evolution of the digital landscape, user privacy and data decentralisation are becoming more important. Hence, FL offers a paradigm shift from traditional centralised training, allowing models to be trained directly on an edge node (participant) without transferring raw data to a central server. This preserves user privacy and reduces communication overheads, making it suitable for HAR applications. In recent years, numerous studies have investigated FL-based HAR. For instance, the authors in [12], proposed a multimodal data fusion approach for fall detection in a FL environment. The time-series data from wearable sensors is initially transformed into images using the gramian angular field method. The fusion process combines the transformed data with visual data captured using cameras. This input-level fusion enhances fall detection accuracy, achieving 99.92% for binary fall detection and 89.76% for multi-class fall activity recognition. The study in [3], introduced FedHAR, a personalised framework designed to deal with privacy, label scarcity and real-time processing using smartphone and wearable sensing data. Furthermore, a novel algorithm is proposed for computing unsupervised gradients and an aggregation strategy to handle concept drift and convergence instability in online learning. Experimental results from two real-world HAR datasets show that FedHAR outperforms existing methods. Notably, when customised for unlabelled clients, it achieves an average improvement of around 10% across all metrics.
In real-world environments, HAR systems often face challenges due to non independently and identically distributed (Non-IID) data in which the data distribution varies across devices, leading to imbalances and inconsistencies. This can severely impact the performance of HAR systems as they may become biased towards specific activities or users, reducing their generalisation capability across diverse real-world scenarios. Hence, the study in [23] proposed ProtoHAR, a prototype-guided FL framework designed for sensor-based HAR to deal with Non-IID data. ProtoHAR addresses this issue by decoupling representation and classifiers, using a global activity prototype to correct local representations and optimising user-specific classifiers for personalised HAR. This ensures privacy and reduces local model drift during customised training. The study also showed that ProtoHAR outperforms existing FL methods in terms of accuracy and convergence speed when tested on four publicly HAR datasets. However, it is important to note that the current ProtoHAR model assumes a static activity data distribution and cannot continuously learn from new data without retraining. The study in [24], introduced ClusterFL, a novel clustering-based FL system tailored for HAR. This approach is designed to understand the intrinsic relationships between data from different users. This framework minimises training loss across multiple models while intuitively identifying clustering relationships among nodes, allowing it to exclude slower or less correlated participant within each cluster efficiently. Hence, leading to faster convergence without sacrificing accuracy and reducing communication overhead by 50%. Similarly, a novel federated learning via augmented knowledge distillation (FedAKD), is designed for the collaborative training of heterogeneous DL models [25]. FedAKD showed significant communication efficiency, surpassing the federated averaging (FedAvg) algorithm by 200 times. Additionally, it achieved 20% higher accuracy than other knowledge distillation-based FL methods. In summary, FL has emerged as a revolutionary approach to HAR. The studies highlighted in the literature underscore the versatility of FL in handling non-IID data distributions and optimising communication efficiency in various scenarios.
As the digital landscape evolves, demand for on-device processing is increasing. However, conventional DL algorithms often struggle to run efficiently on edge devices due to computational demands, particularly in real-time processing. Neuromorphic computing, particularly SNNs, emerges as a promising solution to address this challenge. Several recent studies, including [15,26,27], have investigated the potential of SNNs. These studies have explored the use of SNNs as an alternative to traditional DL models, demonstrating how they can improve energy efficiency and accuracy in federated environments.
However, it is important to note that the HAR domain has significantly shifted from traditional machine learning to more advanced DL models and then to FL. The focus has been primarily on individual aspects such as accuracy (in centralised systems), communication efficiency and privacy (in FL). Furthermore, most existing studies in the literature focus on the energy efficiency of SNNs, and no study has yet harnessed the combined power of DL and SNNs, specifically for HAR. Additionally, as HAR devices continue to miniaturise, the desire for on-device processing grows, requiring an energy-efficient model. Hence, we proposed a hybrid model S-LSTM that combines the computational efficiency of SNNs with the sequential data processing capabilities of LSTMs. This fusion aims to provide a balanced trade-off between the energy efficiency and accuracy of HAR using wearable sensors.
3. Preliminaries and System Model
This section explains the foundational principles of FL, SNNs and introduces a hybrid model S-LSTM that combines both paradigms to improve the performance of HAR.
3.1. Federated Learning
FL is a distributed learning approach that trains the model across multiple participants, where the dataset is highly decentralised. As illustrated in Figure 2, this framework consists of a federated server (FS) and N participants capable of processing data effectively. The FS is the controlling entity which orchestrates the model training and aggregation process. FL is an iterative process involving several communication rounds between FS and participants to obtain an updated global model. Initially, the FS initialises and shares the global model parameters. The participants at the edge train its model using the local data and send back updates to the server. The server aggregates the global model and shares the updated model with participants. This process continues until the global model achieves the desired accuracy or maximum number of rounds reached.
For each participant , there is a local copy of the dataset, which is represented by , where is the subset of the dataset at the device and the entire dataset is given by . Given by the model parameter vector , loss function for any example x, the local empirical loss at the participant is denoted as:
where, represents the local loss function for participant based on the parameter vector . Using the local loss function, FL optimises the global function on the FS mathematically represented as:
where is the global loss function based on the dataset D. FL is an iterative process; hence, for time iterations each participant compute local gradient using following equation:
where represent model parameters at participant is the learning rate, represents the model parameters of previous iteration, is gradient of loss function p, with respect to model parameters for the data point . The FS performs the model aggregation once all the local updates are received, and this process is mathematically represented as:
3.2. Spiking Neural Network
The SNNs are inspired by biological neural networks that use discrete events “spike” for information processing, as shown in Figure 3. SNNs offer substantial improvements in computational efficiency over traditional DL models due to their event-driven activation, sparse information coding, and lower precision arithmetic. Event-driven computing is enabled using discrete spikes for processing, allowing them to remain inactive until incoming spikes are received [15]. Additionally, at any given time, only a subset of neurons in SNN are actively spiking to achieve sparsity. Furthermore, spike signals in SNNs are binary (1s and 0s), which are processed using low-precision arithmetic. Collectively, these attributes allow SNNs to operate using significantly fewer computations per data sample, making SNNs uniquely well-suited for efficient processing on resource-constrained edge devices [28].
Each spiking neuron has a membrane potential that accumulates spike signals received from other neurons. Depending on the duration t, the membrane potential of a neuron can increase, decrease or stay the same. If the potential exceeds a certain threshold called , the neuron generates a spike signal that is transmitted to the next layer of neurons. After this, the neuron enters a short refractory phase where its membrane potential stays constant, regardless of any incoming spikes. To simulate the spiking behaviour of neurons, we utilised a widely recognised leaky-integrate-and-fire (LIF) model due to its straightforwardness and adaptability [29]. This model is closely analogous to an electrical circuit comprising a capacitor Q, a resistor Z, a power source v, and an input current J. The LIF model can be mathematically represented as:
where denotes the membrane potential’s time constant decay, neuron’s membrane potential at time t, and is the resting potential. Z and represents the resistance and input current at time t, respectively.
For a specific neuron k, the membrane potential at time step t can be expressed as:
where is the leakage factor, and l represents the neuron count in the preceding layer, represents the binary output of neuron at time stamp t. The spike sequence emitted by neuron k at time t can be defined as:
In SNNs, neurons communicate through discrete spike events, where the decision is based on a step function, which is non-differentiable at the threshold. This non-differentiable behaviour poses challenges for gradient-based optimisation methods like backpropagation, which rely on continuous and differentiable activation functions. The core issue is that the step function’s gradient is either zero or undefined, preventing meaningful weight updates during training. To address this, surrogate gradient methods have been introduced, which employ a smooth, differentiable approximation of the step function during the backward pass, allowing for gradient computation. This approach ensures that the network can be trained using traditional techniques but still operates with the unique spiking behaviour of SNNs during inference. The surrogate piece-wise linear function is mathematically represented as:
where is a decaying factor controlling the SNNs’ update magnitude, and is the threshold voltage. In essence, SNNs’ backpropagation method mirrors that of ANNs, with the exception of using a surrogate function to approximate the non-differentiable threshold function. Thus, the model update for the l-th SNN layer can be represented as:
Several training techniques have been proposed to harness the full potential of SNNs and address inherent challenges, such as the non-differentiability of spike functions. One of the unsupervised methods, spike timing dependent plasticity (STDP), employs temporal learning principles, which is suitable for unlabelled data [30]. For tasks requiring supervised learning, the backpropagation through time (BPTT) method extends the conventional backpropagation technique to propagate errors across multiple timesteps [15]. This proves invaluable for spatiotemporal datasets, capturing their inherent time dependencies. Furthermore, surrogate gradient learning has been introduced to provide a continuous differentiable approximation to the non-linear spike function, thus allowing for gradient-based optimisation techniques. Similarly, reward-modulated STDP combines concepts from reinforcement learning by using rewards to modulate STDP in an episodic trial-and-error manner [27]. Our problem involves training an SNN with diverse data using supervised learning. Hence, we have developed a system that combines surrogate gradient learning with BPTT. This integration serves two purposes. Firstly, the spike function in SNNs is non-differentiable, which makes traditional gradient-based optimisation techniques challenging. Surrogate gradient learning offers a solution by providing a continuous, differentiable approximation of the non-linear spike function, allowing for gradient-based optimisation. Secondly, to effectively capture the temporal dependencies in HAR data, we need a training technique that can handle these sequences. BPTT extends conventional backpropagation to propagate errors across multiple time steps, minimising a global loss function by applying a gradient descent that propagates backwards in time. As a result, the the weight update for layer l is governed by:
where denotes the weight matrix for layer l, represents the output (spike) of the previous layer, is the derivative of the surrogate gradient function, and is an intermediate-term representing the gradient of the loss with respect to the membrane potential at the time step.
3.3. Training of SNN
| Algorithm 1 Federated S-LSTM training with surrogate gradient and BPTT |
|
3.4. Proposed S-LSTM Model
Our proposed S-LSTM model seamlessly combines LSTM units with the spiking behaviour of LIF neurons, as shown in Figure 4. The model starts with an LSTM layer consisting of 100 neurons to process input data. This LSTM layer returns sequences, ensuring that the temporal dependencies in the data are captured. Next, the spiking layer with LIF replaces the conventional activation functions. The spiking layer has a trainable threshold that determines neuron firing and uses a surrogate gradient to approximate the gradient during back propagation due to the non-differentiable nature of spiking behaviour. After this, another LSTM layer with 100 units processes the sequences further, followed by a dense layer with 300 neurons, which employs LIF neurons to replace the typical activation function. A dropout layer is added to mitigate over-fitting, followed by a fully connected output layer. The output layer uses a SoftMax activation function, producing a probability distribution over the possible activity classes. The training process of federated S-LSTM for HAR is given in Algorithm 1.
4. Simulation Setup
This section provides a detailed discussion of the datasets, performance evaluation strategy and metric used in this study.
4.1. Dataset Description
Despite HAR being a well-investigated topic, attempts to evaluate it using smartphone data is a recent and very active area of research. Several datasets have been collected using smartphones, which exhibit severe challenges, including sensor configuration, sampling frequencies, accessibility, realism, size, heterogeneity, and annotation quality. Additionally, there is an extreme class imbalance due to the stark differences in activity patterns between classes. Thus, HAR is the perfect testbed for assessing neuromorphic federated learning (NFL) in practical heterogeneous contexts. Furthermore, our focus was on reproducibility, heterogeneity, and realistic datasets, which led us to select two publicly available datasets. The UCI dataset [31], which is one of the most commonly used in HAR benchmarking studies, was chosen first. However, UCI was collected in a strictly controlled laboratory environment, and the sample size was also very limited. Therefore, we also employed the Real-World dataset [32], recorded outdoors without restrictions. The details of these two datasets are explained below:
UCI dataset:
- The UCI dataset is obtained using the Samsung Galaxy S II smartphones worn by 30 volunteers for distant age groups and genders. The volunteers were engaged in six daily routine activities: sitting, standing, lying down, walking, walking downstairs and walking upstairs. Each subject repeated these activities multiple times with two distant scenarios for device placement. These scenarios include the placement of a smartphone on the left wrist and the preferred position of each subject. The smartphone’s embedded accelerometer and gyroscope sensors captured triaxial linear acceleration and angular velocity at a rate of 50 Hz. The raw signals are pre-processed to minimise noise interference, and 17 distinctive signals were extracted, encompassing various time and frequency domain parameters, such as magnitude, jerk, and Fast Fourier Transform (FFT). For analysis, signals were segmented into windows of 2.56 seconds, with an overlap of 50%, culminating in 561 diverse features per window derived from statistical and frequency measures. This dataset contains 10,299 instances, with a strategic split of 70% for training and 30% reserved for testing.
However, the dataset is merged and split into five subsets to make a local dataset of each participant. The data distribution among participant is kept highly unbalanced to ensure the actual case for the FL scenario. Further, the dataset of each client is further divided into training (80%) and testing (20%) split and the test split of each client is combined to create a global testset for performance evaluation.
Real-World dataset:
- Although the UCI dataset is very commonly used in HAR studies, however, it has limitations as it is collected in a controlled laboratory environment. Additionally, the sample size is very small to explore the true potential of FL. Hence, we chose a more realistic dataset collected by Sztyler and Stuckenschmidt [32]. The data was gathered from 15 participants (eight male, seven female) executing eight common real-world activities, including jumping, running, jogging, climbing stairs, lying, standing, sitting, and walking. The accelerometer data was collected from seven different locations on the body, which includes the head, chest, upper arm, wrist, forearm, thigh, and shin. In the data collection process, smartphones and a smartwatch are mounted on the aforementioned anatomical sites, collecting the data at the frequency of 50 Hz. The dataset incorporates 1065 minutes of accelerometer measurements per on-body position per axis, amounting to extensive volume.
Additionally, the Real-World dataset is also well-suited for HAR study as it is captured in a naturalistic environment, exhibiting the realistic class imbalance. For instance, the jumping activity comprises 2% of data compared to standing, which constitutes 14% of the total data. Additionally, factors such as high-class imbalance and the availability of separated user data make this dataset an appropriate choice for an extensive study on FL approaches for HAR.
4.2. Performance Metrics
HAR is treated as a multi-class classification problem where various metrics are used to evaluate the performance of the model. One commonly used metric is accuracy, defined as the ratio of correctly predicted instances to the total number of cases. However, the accuracy limitations become pronounced in the context of highly imbalanced datasets. For example, in scenarios where one class dominates a dataset, a model may achieve higher accuracy by simply predicting that class, disregarding the distribution of other classes. This phenomenon is known as the accuracy paradox, highlighting the risk of relying solely on accuracy as a performance metric when dealing with diverse datasets. Therefore, the alternative metrics to evaluate the performance of the model are precision, recall and F1-Score, defined as follows:
Precision: This metric quantifies the number of correct positive predictions made by the model relative to the total number of positive predictions mathematically represented as:
where TP and FP are true positives and false positives, respectively.
Recall (Sensitivity): This metric measures how well the model can correctly identify positive instances, which is particularly important in contexts where missing positive instances (false negatives) can have serious consequences. Recall is mathematically represented as:
where FN represents a false negative.
F1-Score: It is the harmonic mean of precision and recall, which provides a balance between the two metrics, especially when there’s an uneven class distribution. F1-Score is mathematically represented as:
Furthermore, all experimental procedures are done in a simulated environment for a comprehensive evaluation. This allowed us to gauge the effectiveness of the models’ two metrics: global performance evaluation and personalised model assessment. The global metric is used to determine the proficiency of the model across an entire dataset using global testset, which helps to assess its generalisation capabilities. On the other hand, personalised performance assessments are done at the participant level, with the best global model fine-tuning using local data. This personalised training creates a customised model, and its performance is evaluated using the local testset. We compare the results of both personalised and global models for each participant.
5. Results and Discussion
In this study, the performance of NFL in the context of HAR is evaluated using two distinct datasets: the UCI dataset and the Real-World dataset. Each dataset offers a unique perspective on the challenges and intricacies of HAR, making them invaluable for a comprehensive assessment. The UCI dataset is divided into 5 participant, and the Real-World dataset was already collected for 15 subjects, which is used for the training of participant. As discussed earlier, there is an 80-20 split on each participant to obtain the local training and testset. Furthermore, the local testset for each participant is combined to obtain a global testset used to evaluate the generalised performance of the model. The results of each dataset are discussed in the subsequent sections.
5.1. UCI Results
In the UCI case, the total number of communication rounds were kept 500, where each participant trains the local model for 3 epochs. The results shown in Figure 5 illustrate the comparative learning curves for three distinct models, S-LSTM, S-CNN, and CNN, considered in this study. These curves show the classical learning behaviour steeply increasing in initial rounds with a steady increase peaking at 0.97% for S-LSTM, showing its superiority in dealing with sequential data. The results in Figure 6 depict the confusion matrix, which provides a comprehensive view of the model’s performance across various activities. The diagonal elements of the confusion matrix represent the accuracy of the predicted class. For instance, in Figure 6 (c), the confusion matrix of the S-LSTM model’s adeptness at predicting six distinct activities in the UCI HAR dataset. Notably, the model exhibits remarkable accuracy, exceeding 0.99% for classes 1, 2, 3, and 6, which is evident from the diagonal of the matrix. However, it does encounter some difficulty distinguishing between classes 4 (sitting) and 5 (standing), with a minor percentage of misclassifications occurring between them due to their similar motion patterns.
The results in Table 1 present a comparative analysis of Precision, Recall, and F1-Score for three models when trained using the UCI dataset. Each model’s performance is evaluated across six distinct daily routine activities. The results show that the S-LSTM performed better than the other two models across all activities. For instance, the S-LSTM achieves an F1-Score of 0.99 for walking and walking upstairs, indicating its superior ability to classify these activities accurately. Similarly, all three models achieve a perfect score for the lying, highlighting the distinctiveness of this activity’s motion patterns, making it easier to classify.
However, the results also reveal the challenges in differentiating between sitting and standing activities. While the S-LSTM model achieves better performance with an F1-Score of 0.93 and 0.94 for both activities, respectively. The CNN and S-CNN models exhibit slightly lower scores in the range of 0.88 to 0.90. This indicates that the motion patterns for sitting and standing activities are closely related, resulting in difficulty in discerning them, particularly for the CNN and S-CNN models.
5.2. Real-World Dataset Results
In case of the Real-World dataset, communication rounds were kept to 300, and each participant used 5 epochs for local training. The results in Figure 7, present a comparative analysis of the learning curve using the Real-World dataset. The learning curves exhibit classical learning, and the results underscore the enhanced capabilities of the spiking models, with both S-LSTM and S-CNN outperforming the conventional CNN model. Specifically, the S-LSTM model achieves an accuracy of 0.87%, while the S-CNN model closely follows with an accuracy of 0.86%. In contrast, the CNN model lags slightly behind, achieving an accuracy of 0.83%.
In this study, three models were analysed, and their confusion matrices are illustrated in Figure 8. Specifically, Figure 8 (c) provides a detailed overview of the S-LSTM model’s classification capabilities for eight different activities in the Real-World HAR dataset. The diagonal elements indicate the accuracy of the predicted class. These results show that the S-LSTM model is proficient in classifying more prominent activities, with an accuracy of 0.96% for jumping, 0.86% for running, and 0.91% for walking. However, the confusion matrix also reveals that the S-LSTM model encounters challenges in classifying activities with subtle motion patterns, such as climbing down 0.88%, climbing up 0.87%, and standing 0.80%. Misclassifications mainly arise between activities that share similar motion characteristics. For example, climbing down is occasionally misclassified as walking, climbing up is confused with running, and sitting is sometimes classified as standing.
The results in Table 2, provide a thorough comparison of the models trained on the Real-World HAR dataset in a federated environment. The results show that the S-LSTM consistently exhibits better performance across most activities, emphasising its proficiency in handling sequential data. For example, activities like jumping, S-LSTM achieves an F1-Score of 0.97, better than S-CNN and CNN.
The results also show the challenging aspect of detecting subtle movements like climbing down and climbing up. For example, S-LSTM shows good results with an F1-Score of 0.89 and 0.88 for these activities, but it still faces difficulties in distinguishing between activities with nuanced motion patterns, which is also true for CNN and S-CNN. Additionally, it is worth noting that all models face challenges in differentiating between sitting and standing with F1-Scores hovering around the 0.75 to 0.80 range.
To further enhance our comparative study, we adopted a strategy to select 50% of participants randomly for training and aggregation in FL settings. The results in Figure 9 depict the accuracy learning curve, providing comprehensive insight into the performance trajectory over 300 communication rounds. This approach assessed the impact of reduced client participation on model performance and communication cost benefits. From the results, the S-LSTM emerges as the top performer, achieving an accuracy of 0.86%. This is closely followed by the S-CNN with an overall accuracy of 0.84% and the CNN, serving as a baseline with 0.83%. It is worth noting that these results were accomplished with only half of the clients actively participating in the training process, which were chosen randomly on each communication round. This indicates a considerable decrease in communication costs by 50%, which can be beneficial, particularly in FL scenarios where communication overhead is a limiting factor. However, it is essential to take into account a slight performance degradation in performance.
All the previous results discussed were obtained using the global model and combined global testset. However, the participant has the processing capabilities and fine-tune the global model to customise it using the local data. Therefore, we also evaluated the performance of the personalised model using the local testset of each participant and the results are compared with the global model. The results depicted in Figure 10 show the contrast of the test accuracy for global and personalised models at the client level. Spanning 15 clients, the x-axis enumerates each client, with two accuracy plots for each. Personalised accuracy is obtained using the local testset after fine-tuning the global model using the local data. Personalisation improves performance and emphasises the model’s adaptability to specific local data. All three model architectures, including S-LSTM, which boasts the highest global accuracy, exhibit this trend. These findings underscore the advantages of personalisation in FL, where client-specific fine-tuning can substantially bolster local accuracy, which is evident in the results where the average accuracy for S-LSTM improved from 0.87% to 0.96%.
6. Conclusions
This paper proposed a HNFL framework that combines energy-efficient SNN and LSTM networks for accurate indoor and outdoor HAR using wearable sensor data. The S-LSTM architecture integrates LSTM layers to capture sequential dependencies in time-series sensor data with spiking layers that provide event-driven processing for energy efficiency. The model is trained using a combination of surrogate gradient learning and BRTT, which enables supervised end-to-end learning. Extensive evaluations were performed on two publicly HAR datasets - UCI and Real-World, which exhibited distant data distributions and activities. The simulation results demonstrated that the proposed S-LSTM model achieved higher accuracy compared to CNN and S-CNN models in the federated settings. For instance, S-LSTM showed an improvement of 2% and 4% compared to CNN and S-CNN when tested on the indoor scenario. In the case of a more diverse Real-World outdoor dataset, S-LSTM showed 4% compared to CNN. Furthermore, the results also showed significant communication cost reduction using random client selection during the training process. While testing with 50% client participation, the communication cost is reduced to one-half with only 1% degradation in the classification accuracy compared to baseline. Additionally, fine-tuning the global model to achieve personalisation improved the performance by 9% on average for each participant.
Author Contributions
Conceptualization, A.Khan, H.Manzoor, and A.Zoha; methodology, A.Khan, H.Manzoor, F. Ayaz, A.Zoha; software, A.Khan; validation, A.Khan, H.Manzoor, and A.Zoha; formal analysis, A.Khan, H.Manzoor, F.Ayaz, and A.Zoha; writing original draft, A.Khan; writing, review and editing, A.Khan, H.Manzoor, F.Ayaz, M.Imran, and A.Zoha; supervision, A.Zoha
Data Availability Statement
This study is conducted using a publicly available dataset.
Conflicts of Interest
The authors declare no conflict of interest.
References
- Diraco, G.; Rescio, G.; Siciliano, P.; Leone, A. Review on Human Action Recognition in Smart Living: Sensing Technology, Multimodality, Real-Time Processing, Interoperability, and Resource-Constrained Processing. Sensors 2023, 23, 5281. [Google Scholar] [CrossRef]
- Kalabakov, S.; Jovanovski, B.; Denkovski, D.; Rakovic, V.; Pfitzner, B.; Konak, O.; Arnrich, B.; Gjoreski, H. Federated Learning for Activity Recognition: A System Level Perspective. IEEE Access 2023. [Google Scholar] [CrossRef]
- Yu, H.; Chen, Z.; Zhang, X.; Chen, X.; Zhuang, F.; Xiong, H.; Cheng, X. FedHAR: Semi-supervised online learning for personalized federated human activity recognition. IEEE Transactions on Mobile Computing 2021. [Google Scholar] [CrossRef]
- Bokhari, S.M.; Sohaib, S.; Khan, A.R.; Shafi, M.; others. DGRU based human activity recognition using channel state information. Measurement 2021, 167, 108245. [Google Scholar] [CrossRef]
- Ashleibta, A.M.; Taha, A.; Khan, M.A.; Taylor, W.; Tahir, A.; Zoha, A.; Abbasi, Q.H.; Imran, M.A. 5g-enabled contactless multi-user presence and activity detection for independent assisted living. Scientific Reports 2021, 11, 17590. [Google Scholar] [CrossRef]
- Islam, M.M.; Nooruddin, S.; Karray, F.; Muhammad, G. Human activity recognition using tools of convolutional neural networks: A state of the art review, data sets, challenges, and future prospects. Computers in Biology and Medicine 2022, 106060. [Google Scholar] [CrossRef] [PubMed]
- Sannara, E.; Portet, F.; Lalanda, P.; German, V. A federated learning aggregation algorithm for pervasive computing: Evaluation and comparison. 2021 IEEE International Conference on Pervasive Computing and Communications (PerCom). IEEE, 2021, pp. 1–10.
- Yao, S.; Hu, S.; Zhao, Y.; Zhang, A.; Abdelzaher, T. Deepsense: A unified deep learning framework for time-series mobile sensing data processing. Proceedings of the 26th international conference on world wide web, 2017, pp. 351–360.
- Wang, J.; Chen, Y.; Hao, S.; Peng, X.; Hu, L. Deep learning for sensor-based activity recognition: A survey. Pattern recognition letters 2019, 119, 3–11. [Google Scholar] [CrossRef]
- Guan, Y.; Plötz, T. Ensembles of deep lstm learners for activity recognition using wearables. Proceedings of the ACM on interactive, mobile, wearable and ubiquitous technologies 2017, 1, 1–28. [Google Scholar] [CrossRef]
- Singh, M.S.; Pondenkandath, V.; Zhou, B.; Lukowicz, P.; Liwickit, M. Transforming sensor data to the image domain for deep learning—An application to footstep detection. 2017 International Joint Conference on Neural Networks (IJCNN). IEEE, 2017, pp. 2665–2672.
- Qi, P.; Chiaro, D.; Piccialli, F. FL-FD: Federated learning-based fall detection with multimodal data fusion. Information Fusion 2023, 101890. [Google Scholar] [CrossRef]
- Hafeez, S.; Khan, A.R.; Al-Quraan, M.; Mohjazi, L.; Zoha, A.; Imran, M.A.; Sun, Y. Blockchain-Assisted UAV Communication Systems: A Comprehensive Survey. IEEE Open Journal of Vehicular Technology 2023. [Google Scholar] [CrossRef]
- McMahan, B.; Moore, E.; Ramage, D.; Hampson, S.; y Arcas, B.A. Communication-efficient learning of deep networks from decentralized data. Artificial intelligence and statistics. PMLR 2017, 1273–1282. [Google Scholar]
- Venkatesha, Y.; Kim, Y.; Tassiulas, L.; Panda, P. Federated learning with spiking neural networks. IEEE Transactions on Signal Processing 2021, 69, 6183–6194. [Google Scholar] [CrossRef]
- Wang, Y.; Duan, S.; Chen, F. Efficient asynchronous federated neuromorphic learning of spiking neural networks. Neurocomputing 2023, 557, 126686. [Google Scholar] [CrossRef]
- Khatun, M.A.; Yousuf, M.A.; Ahmed, S.; Uddin, M.Z.; Alyami, S.A.; Al-Ashhab, S.; Akhdar, H.F.; Khan, A.; Azad, A.; Moni, M.A. Deep CNN-LSTM with self-attention model for human activity recognition using wearable sensor. IEEE Journal of Translational Engineering in Health and Medicine 2022, 10, 1–16. [Google Scholar] [CrossRef] [PubMed]
- Han, C.; Zhang, L.; Tang, Y.; Huang, W.; Min, F.; He, J. Human activity recognition using wearable sensors by heterogeneous convolutional neural networks. Expert Systems with Applications 2022, 198, 116764. [Google Scholar] [CrossRef]
- Uddin, M.Z.; Soylu, A. Human activity recognition using wearable sensors, discriminant analysis, and long short-term memory-based neural structured learning. Scientific Reports 2021, 11, 16455. [Google Scholar] [CrossRef]
- Jain, V.; Gupta, G.; Gupta, M.; Sharma, D.K.; Ghosh, U. Ambient intelligence-based multimodal human action recognition for autonomous systems. ISA transactions 2023, 132, 94–108. [Google Scholar] [CrossRef]
- Qi, W.; Su, H.; Yang, C.; Ferrigno, G.; De Momi, E.; Aliverti, A. A fast and robust deep convolutional neural networks for complex human activity recognition using smartphone. Sensors 2019, 19, 3731. [Google Scholar] [CrossRef]
- Laitrakun, S. Merging-Squeeze-Excitation Feature Fusion for Human Activity Recognition Using Wearable Sensors. Applied Sciences 2023, 13, 2475. [Google Scholar] [CrossRef]
- Cheng, D.; Zhang, L.; Bu, C.; Wang, X.; Wu, H.; Song, A. ProtoHAR: Prototype Guided Personalized Federated Learning for Human Activity Recognition. IEEE Journal of Biomedical and Health Informatics 2023. [Google Scholar] [CrossRef]
- Ouyang, X.; Xie, Z.; Zhou, J.; Xing, G.; Huang, J. ClusterFL: A Clustering-based Federated Learning System for Human Activity Recognition. ACM Transactions on Sensor Networks 2022, 19, 1–32. [Google Scholar] [CrossRef]
- Gad, G.; Fadlullah, Z. Federated Learning via Augmented Knowledge Distillation for Heterogenous Deep Human Activity Recognition Systems. Sensors 2022, 23, 6. [Google Scholar] [CrossRef] [PubMed]
- Aouedi, O.; Piamrat, K.; Südholt, M. HFedSNN: Efficient Hierarchical Federated Learning using Spiking Neural Networks. 21st ACM International Symposium on Mobility Management and Wireless Access (MobiWac 2023) 2023.
- Xie, K.; Zhang, Z.; Li, B.; Kang, J.; Niyato, D.; Xie, S.; Wu, Y. Efficient federated learning with spike neural networks for traffic sign recognition. IEEE Transactions on Vehicular Technology 2022, 71, 9980–9992. [Google Scholar] [CrossRef]
- Roy, K.; Jaiswal, A.; Panda, P. Towards spike-based machine intelligence with neuromorphic computing. Nature 2019, 575, 607–617. [Google Scholar] [CrossRef]
- Gerstner, W.; Kistler, W.M.; Naud, R.; Paninski, L. Neuronal dynamics: From single neurons to networks and models of cognition; Cambridge University Press, 2014.
- Lee, C.; Srinivasan, G.; Panda, P.; Roy, K. Deep spiking convolutional neural network trained with unsupervised spike-timing-dependent plasticity. IEEE Transactions on Cognitive and Developmental Systems 2018, 11, 384–394. [Google Scholar]
- Anguita, D.; Ghio, A.; Oneto, L.; Parra, X.; Reyes-Ortiz, J.L. others. A public domain dataset for human activity recognition using smartphones. Esann 2013, 3, 3. [Google Scholar]
- Sztyler, T.; Stuckenschmidt, H. On-body localization of wearable devices: An investigation of position-aware activity recognition. 2016 IEEE International Conference on Pervasive Computing and Communications (PerCom). IEEE, 2016, pp. 1–9.
Figure 1.
Conceptual framework of centralised indoor HAR using wearable sensor.
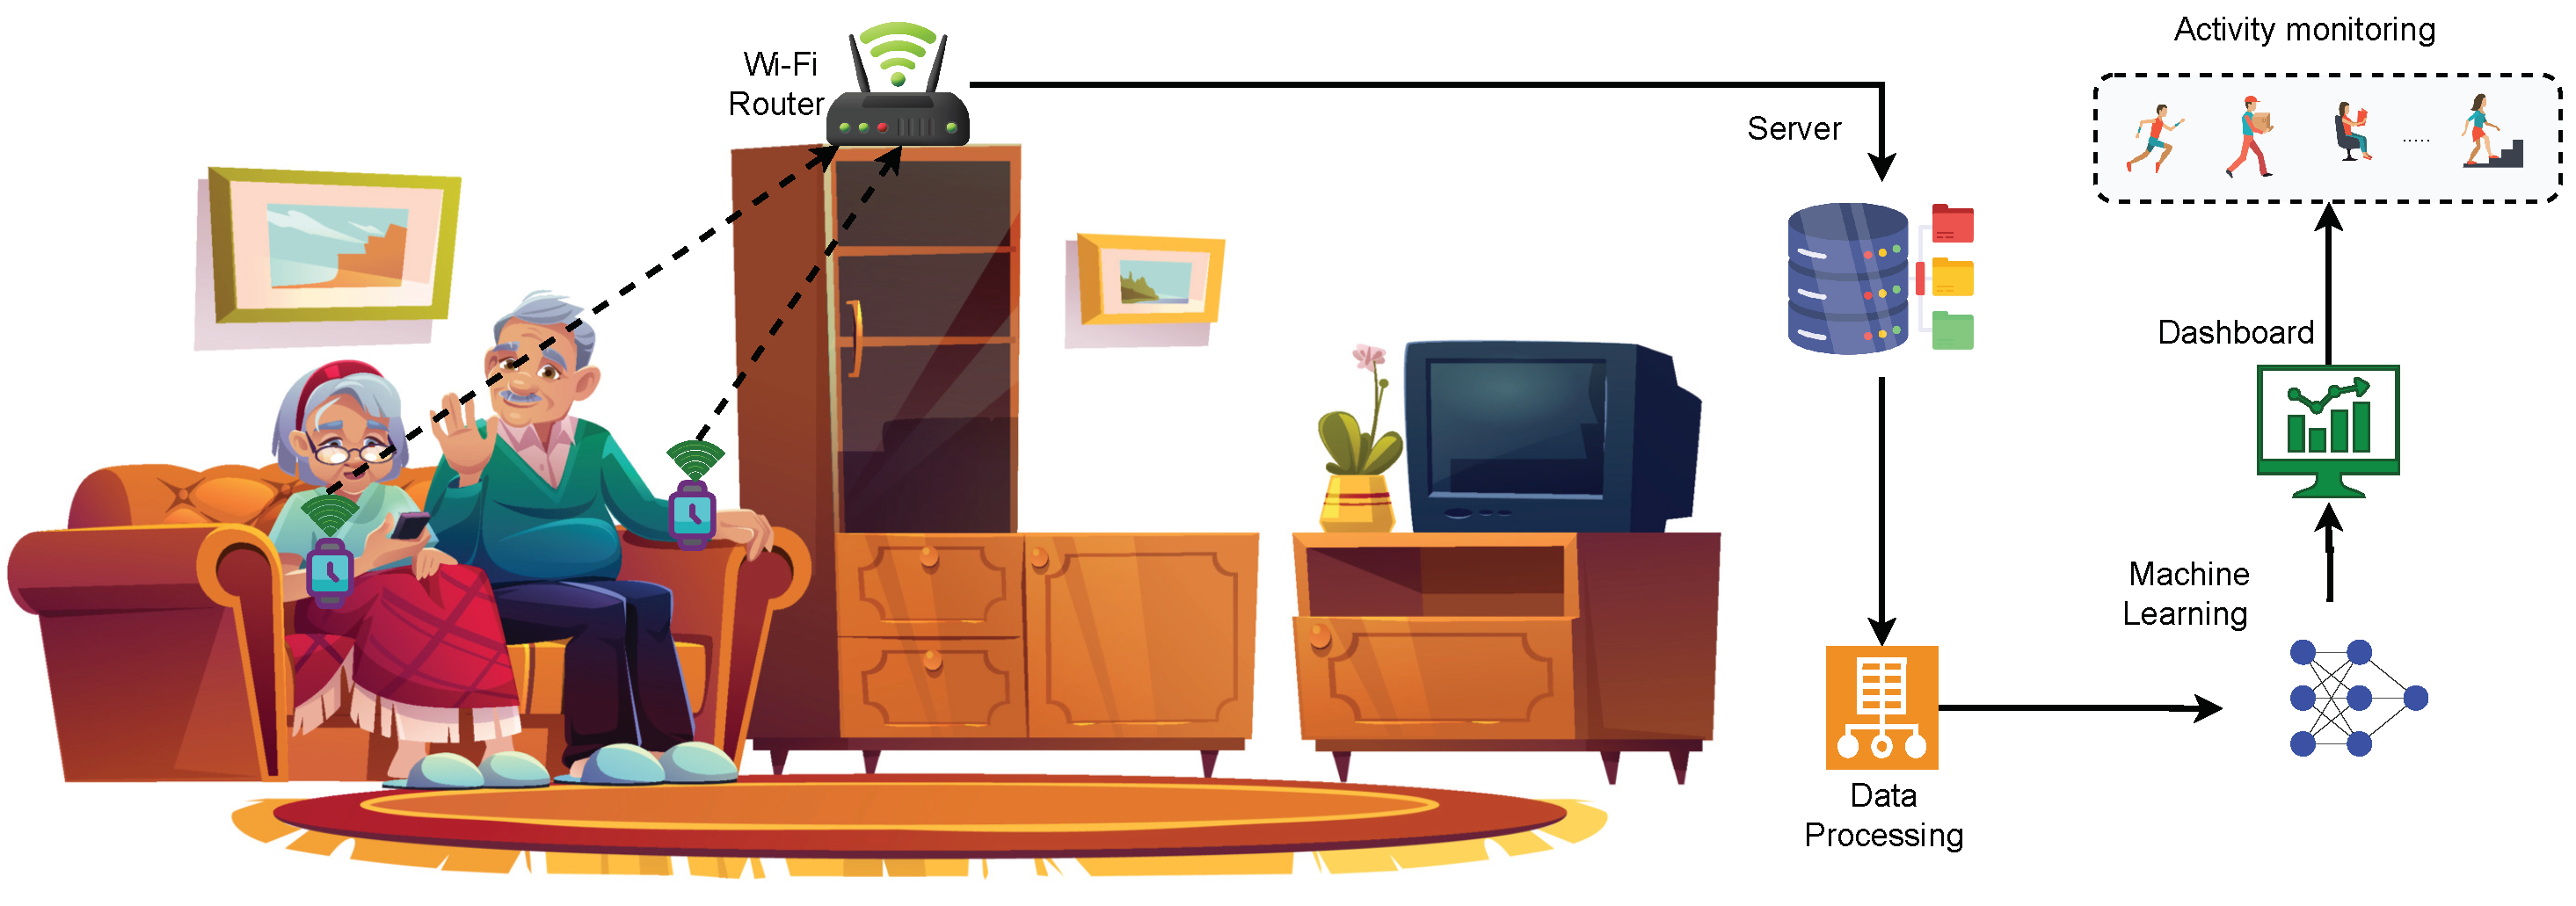
Figure 2.
Conceptual FL framework for HAR using wearable sensing in the outdoors.
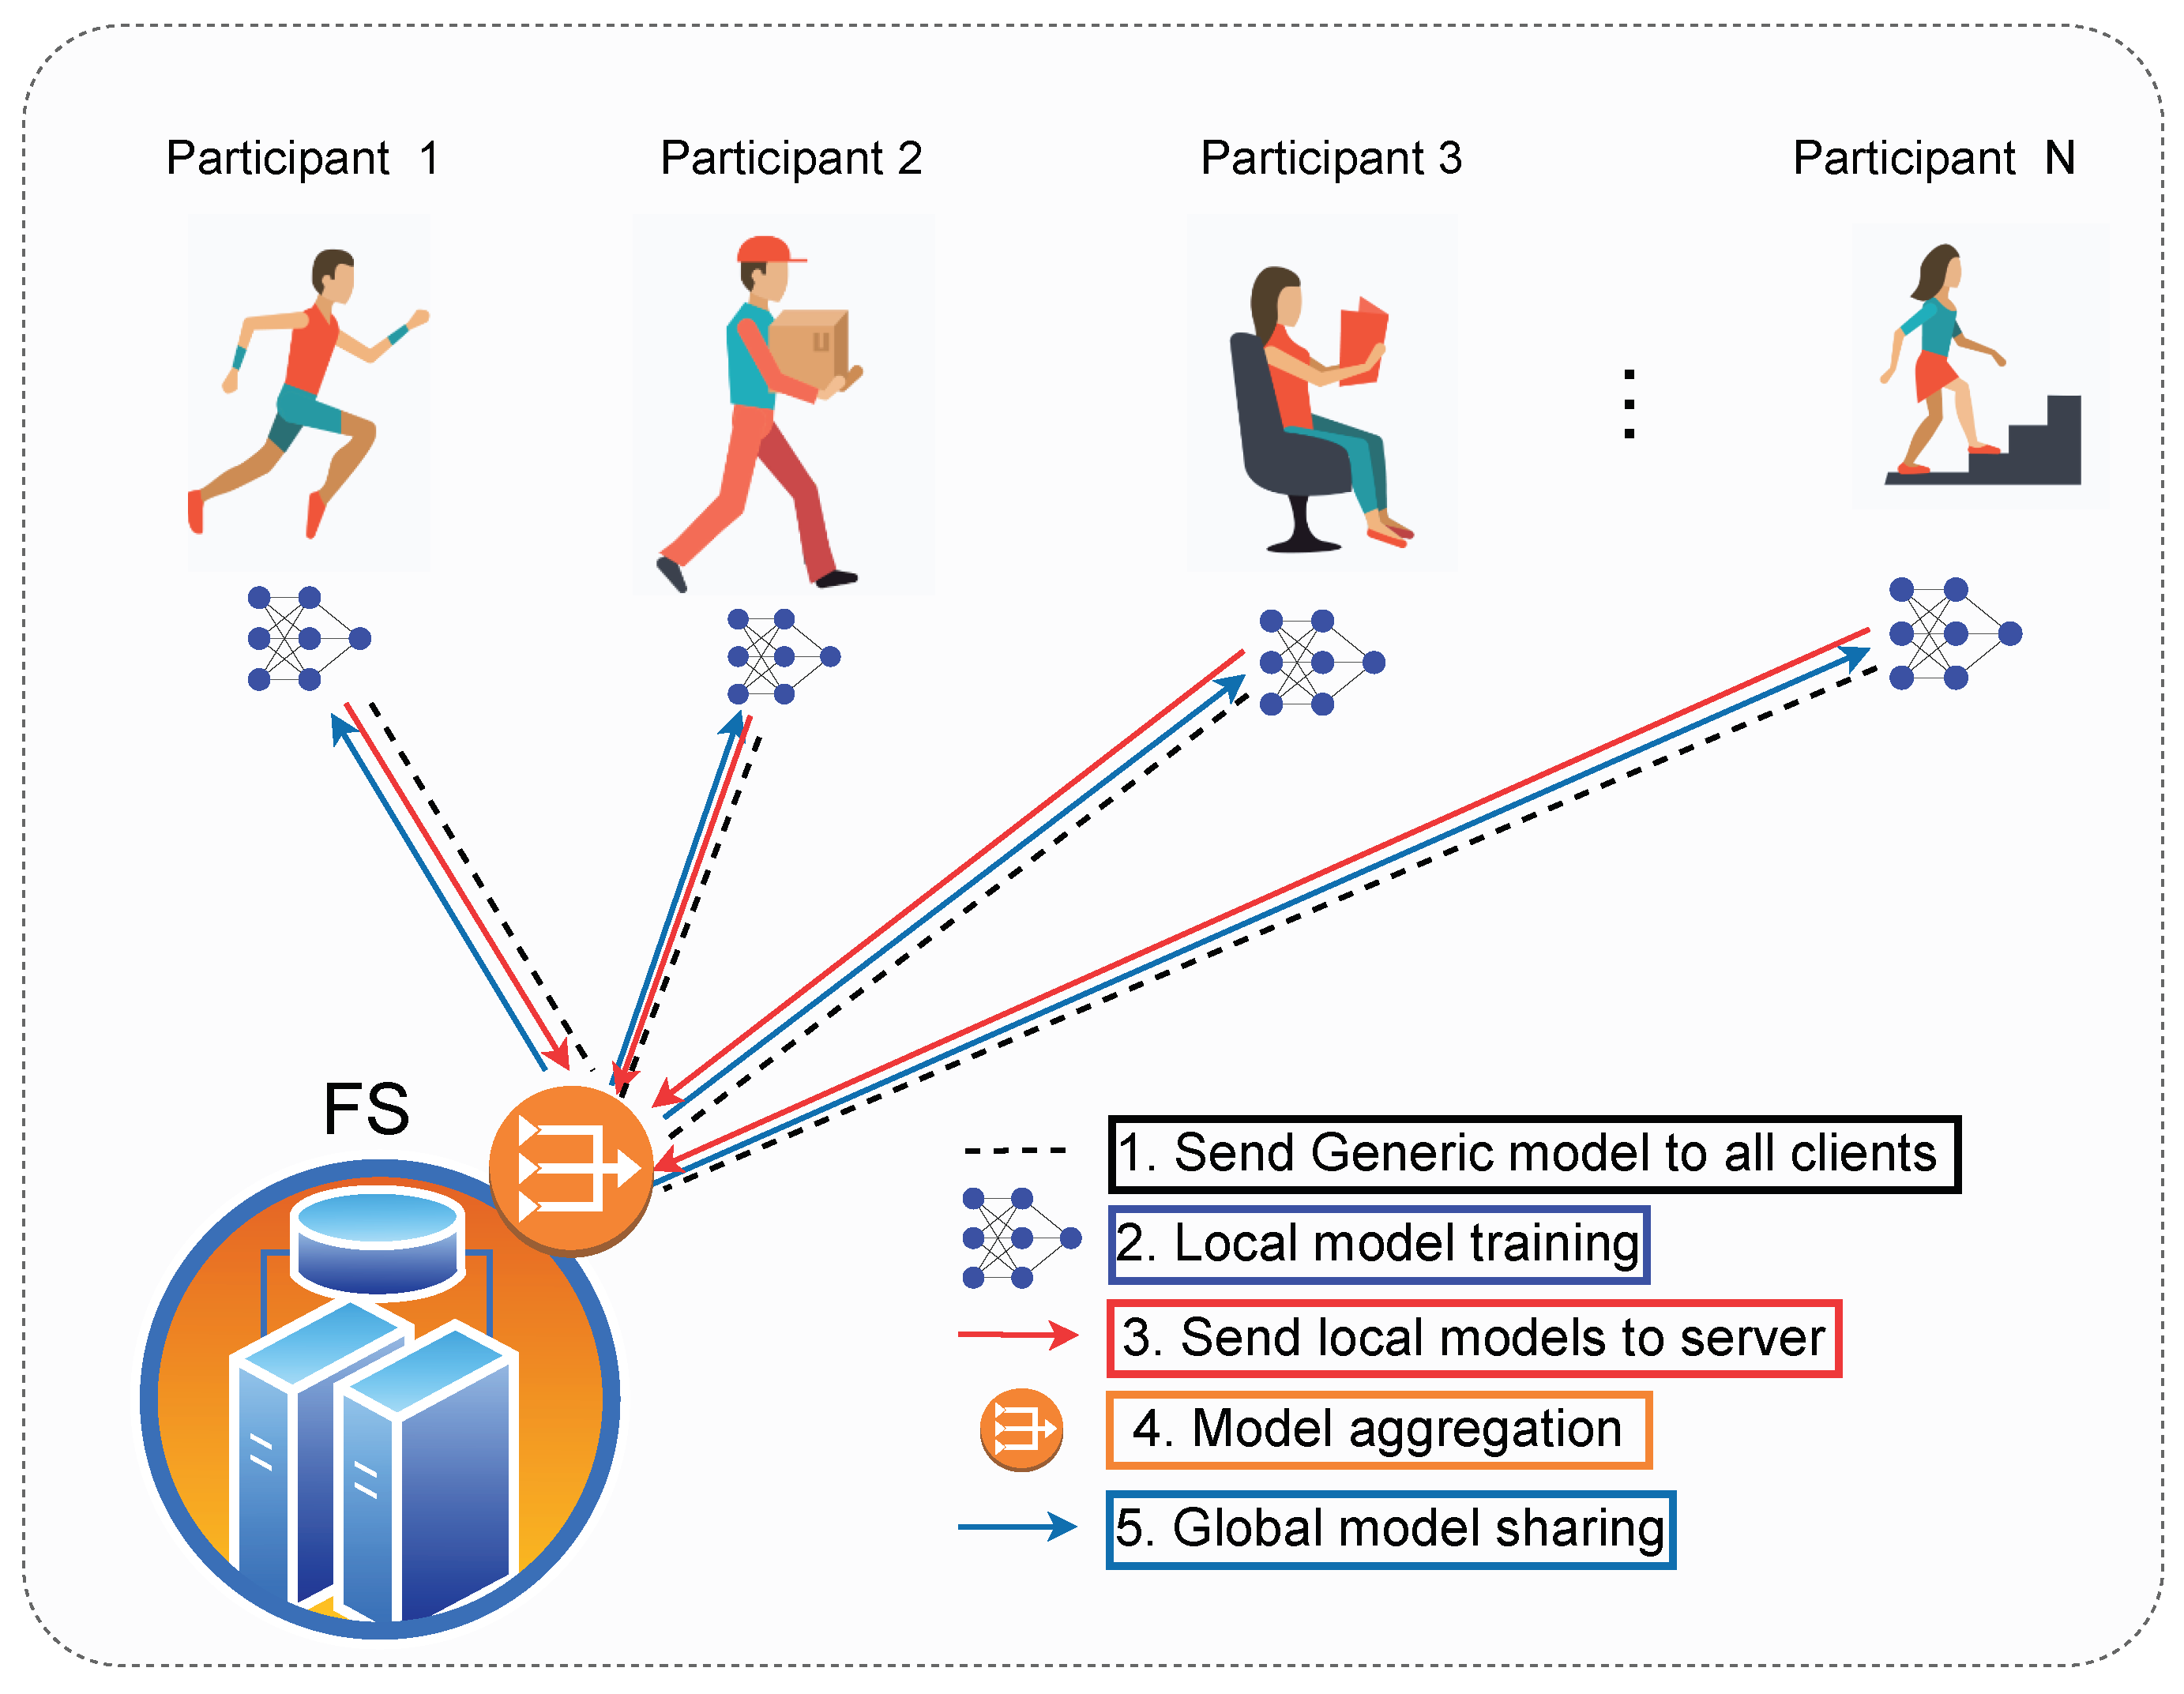
Figure 3.
Spiking neurons propagation process.
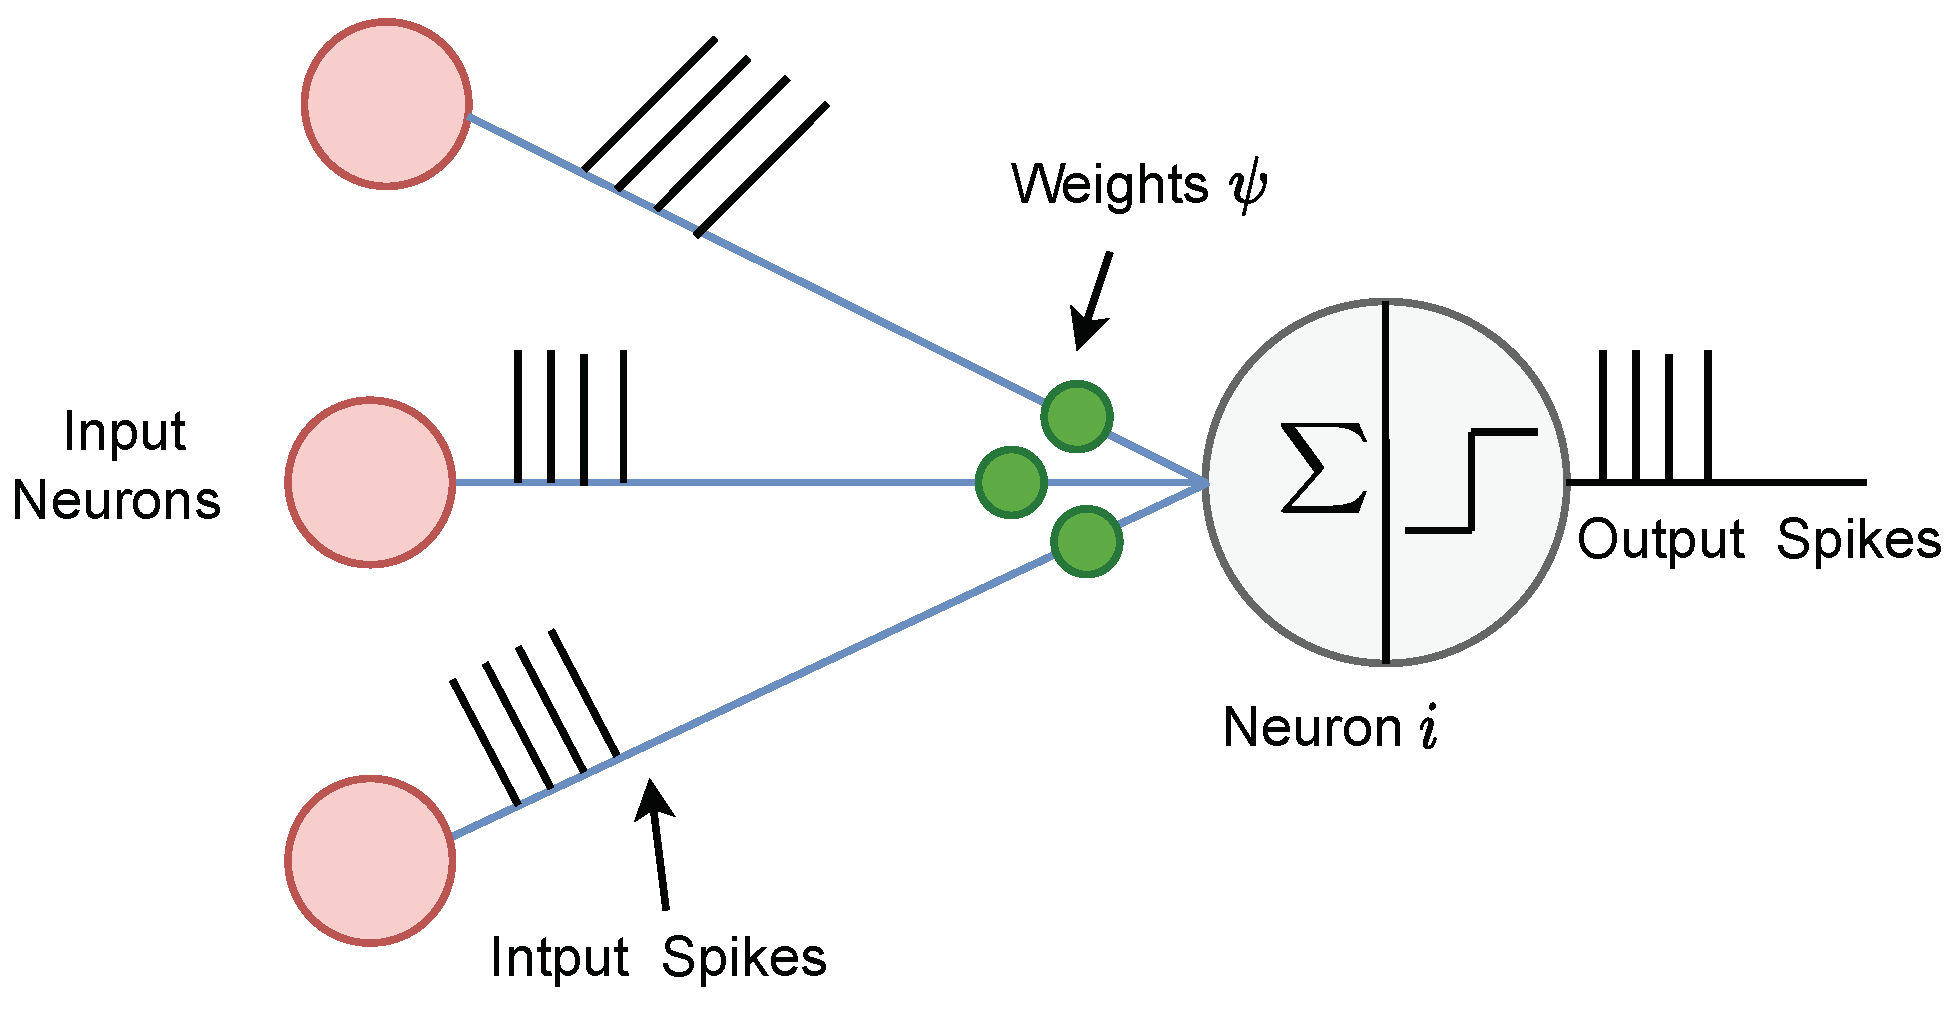
Figure 4.
Proposed hybrid S-LSTM model.
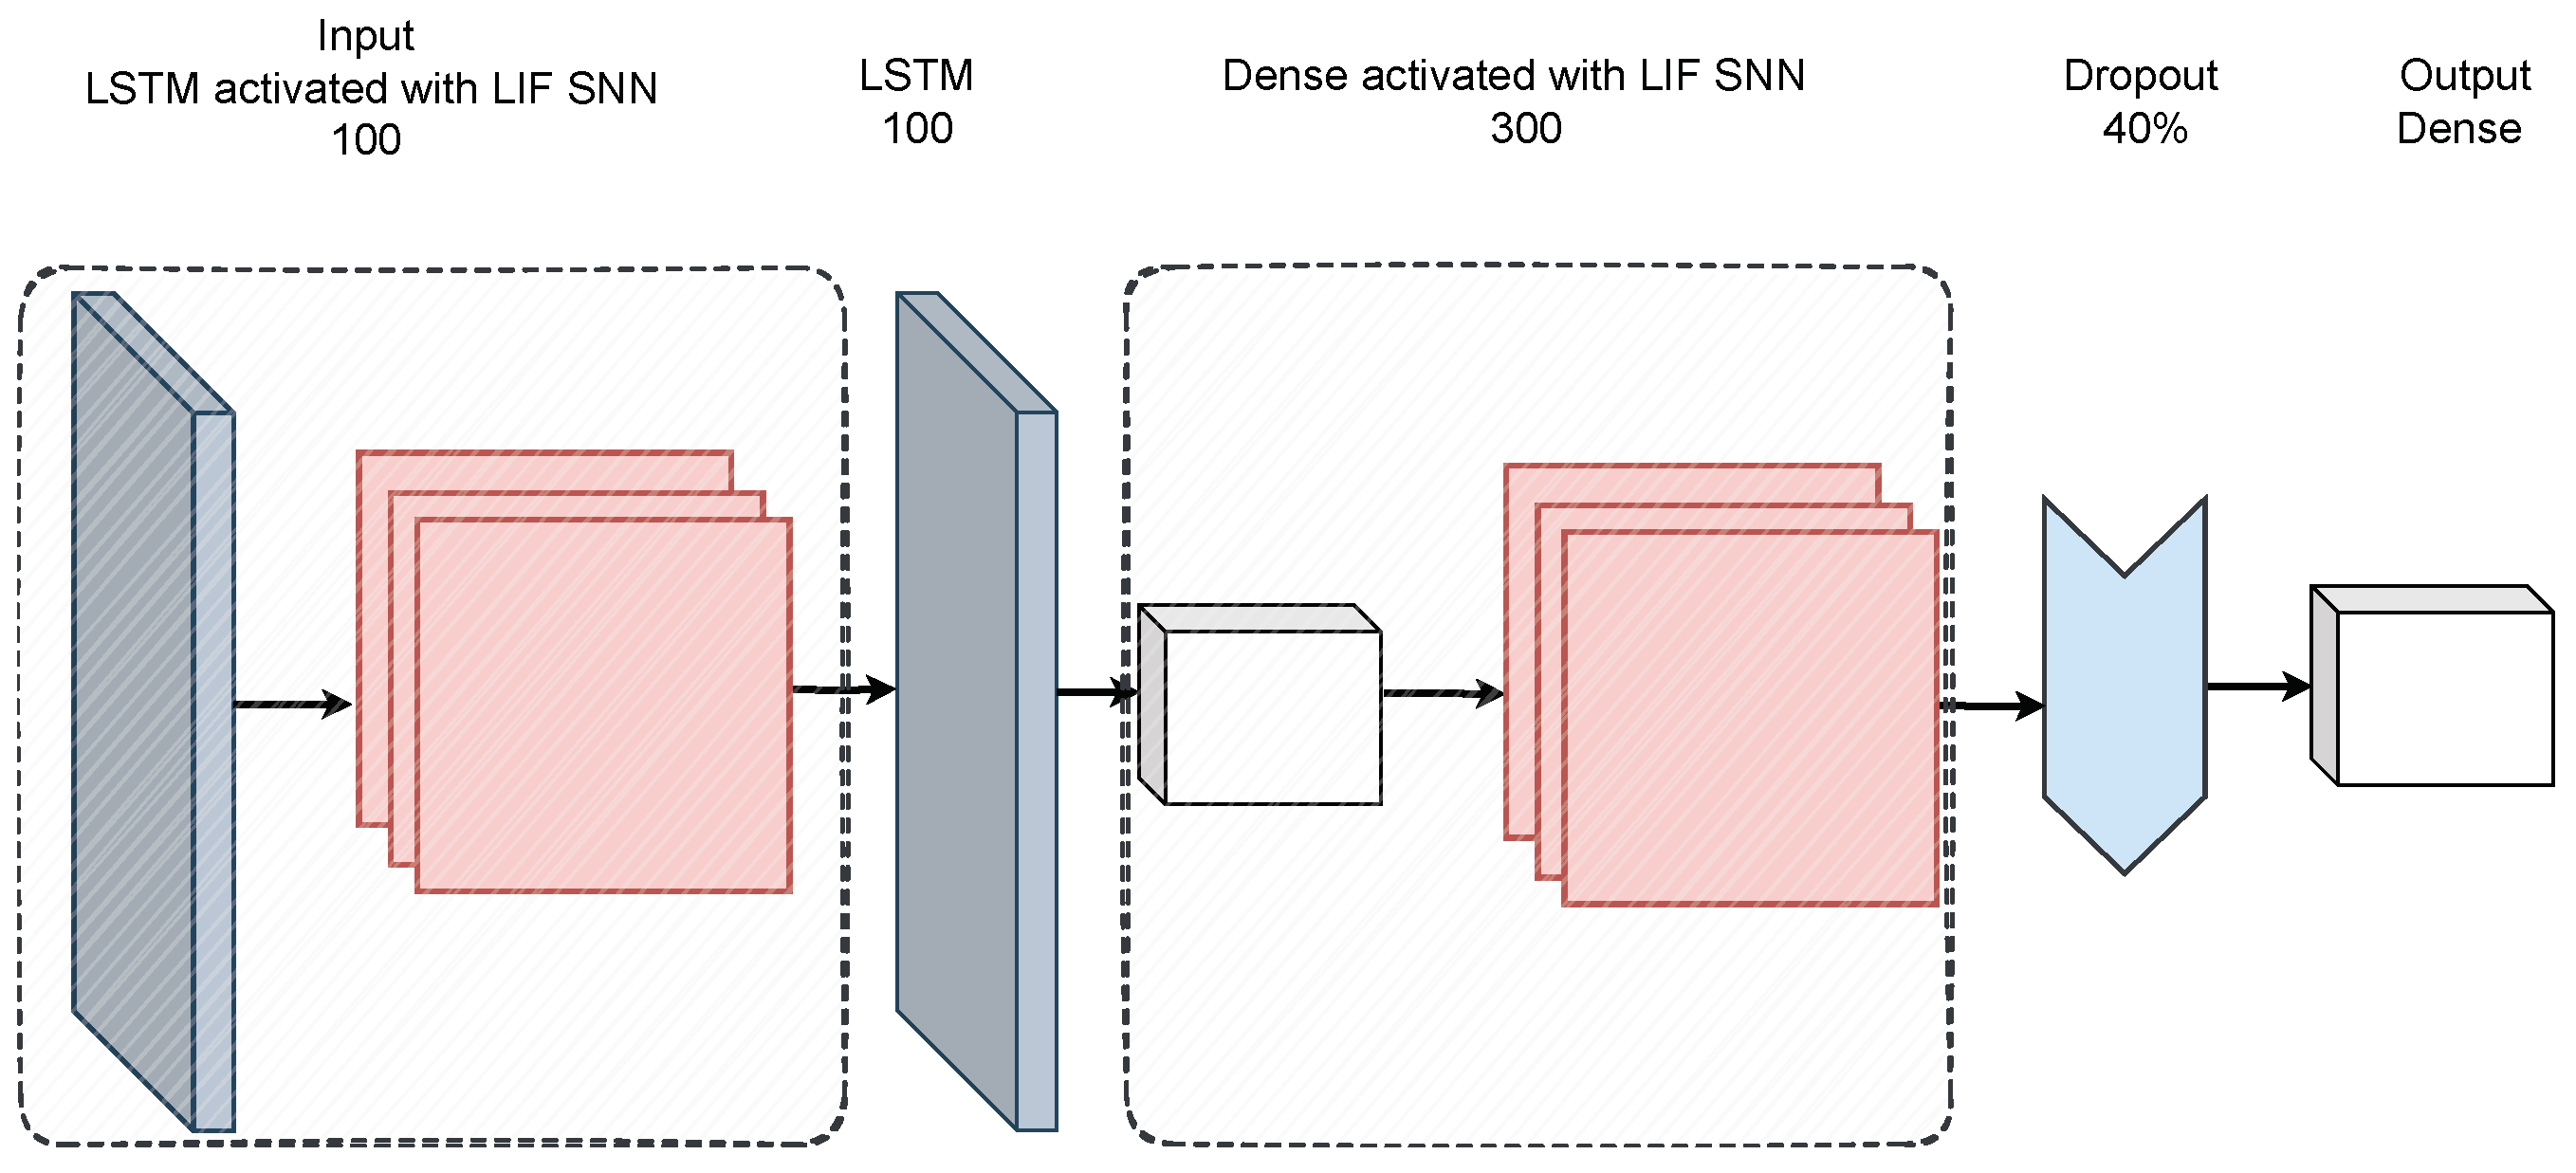
Figure 5.
Learning curve for UCI-dataset, trained for 500 communication rounds.
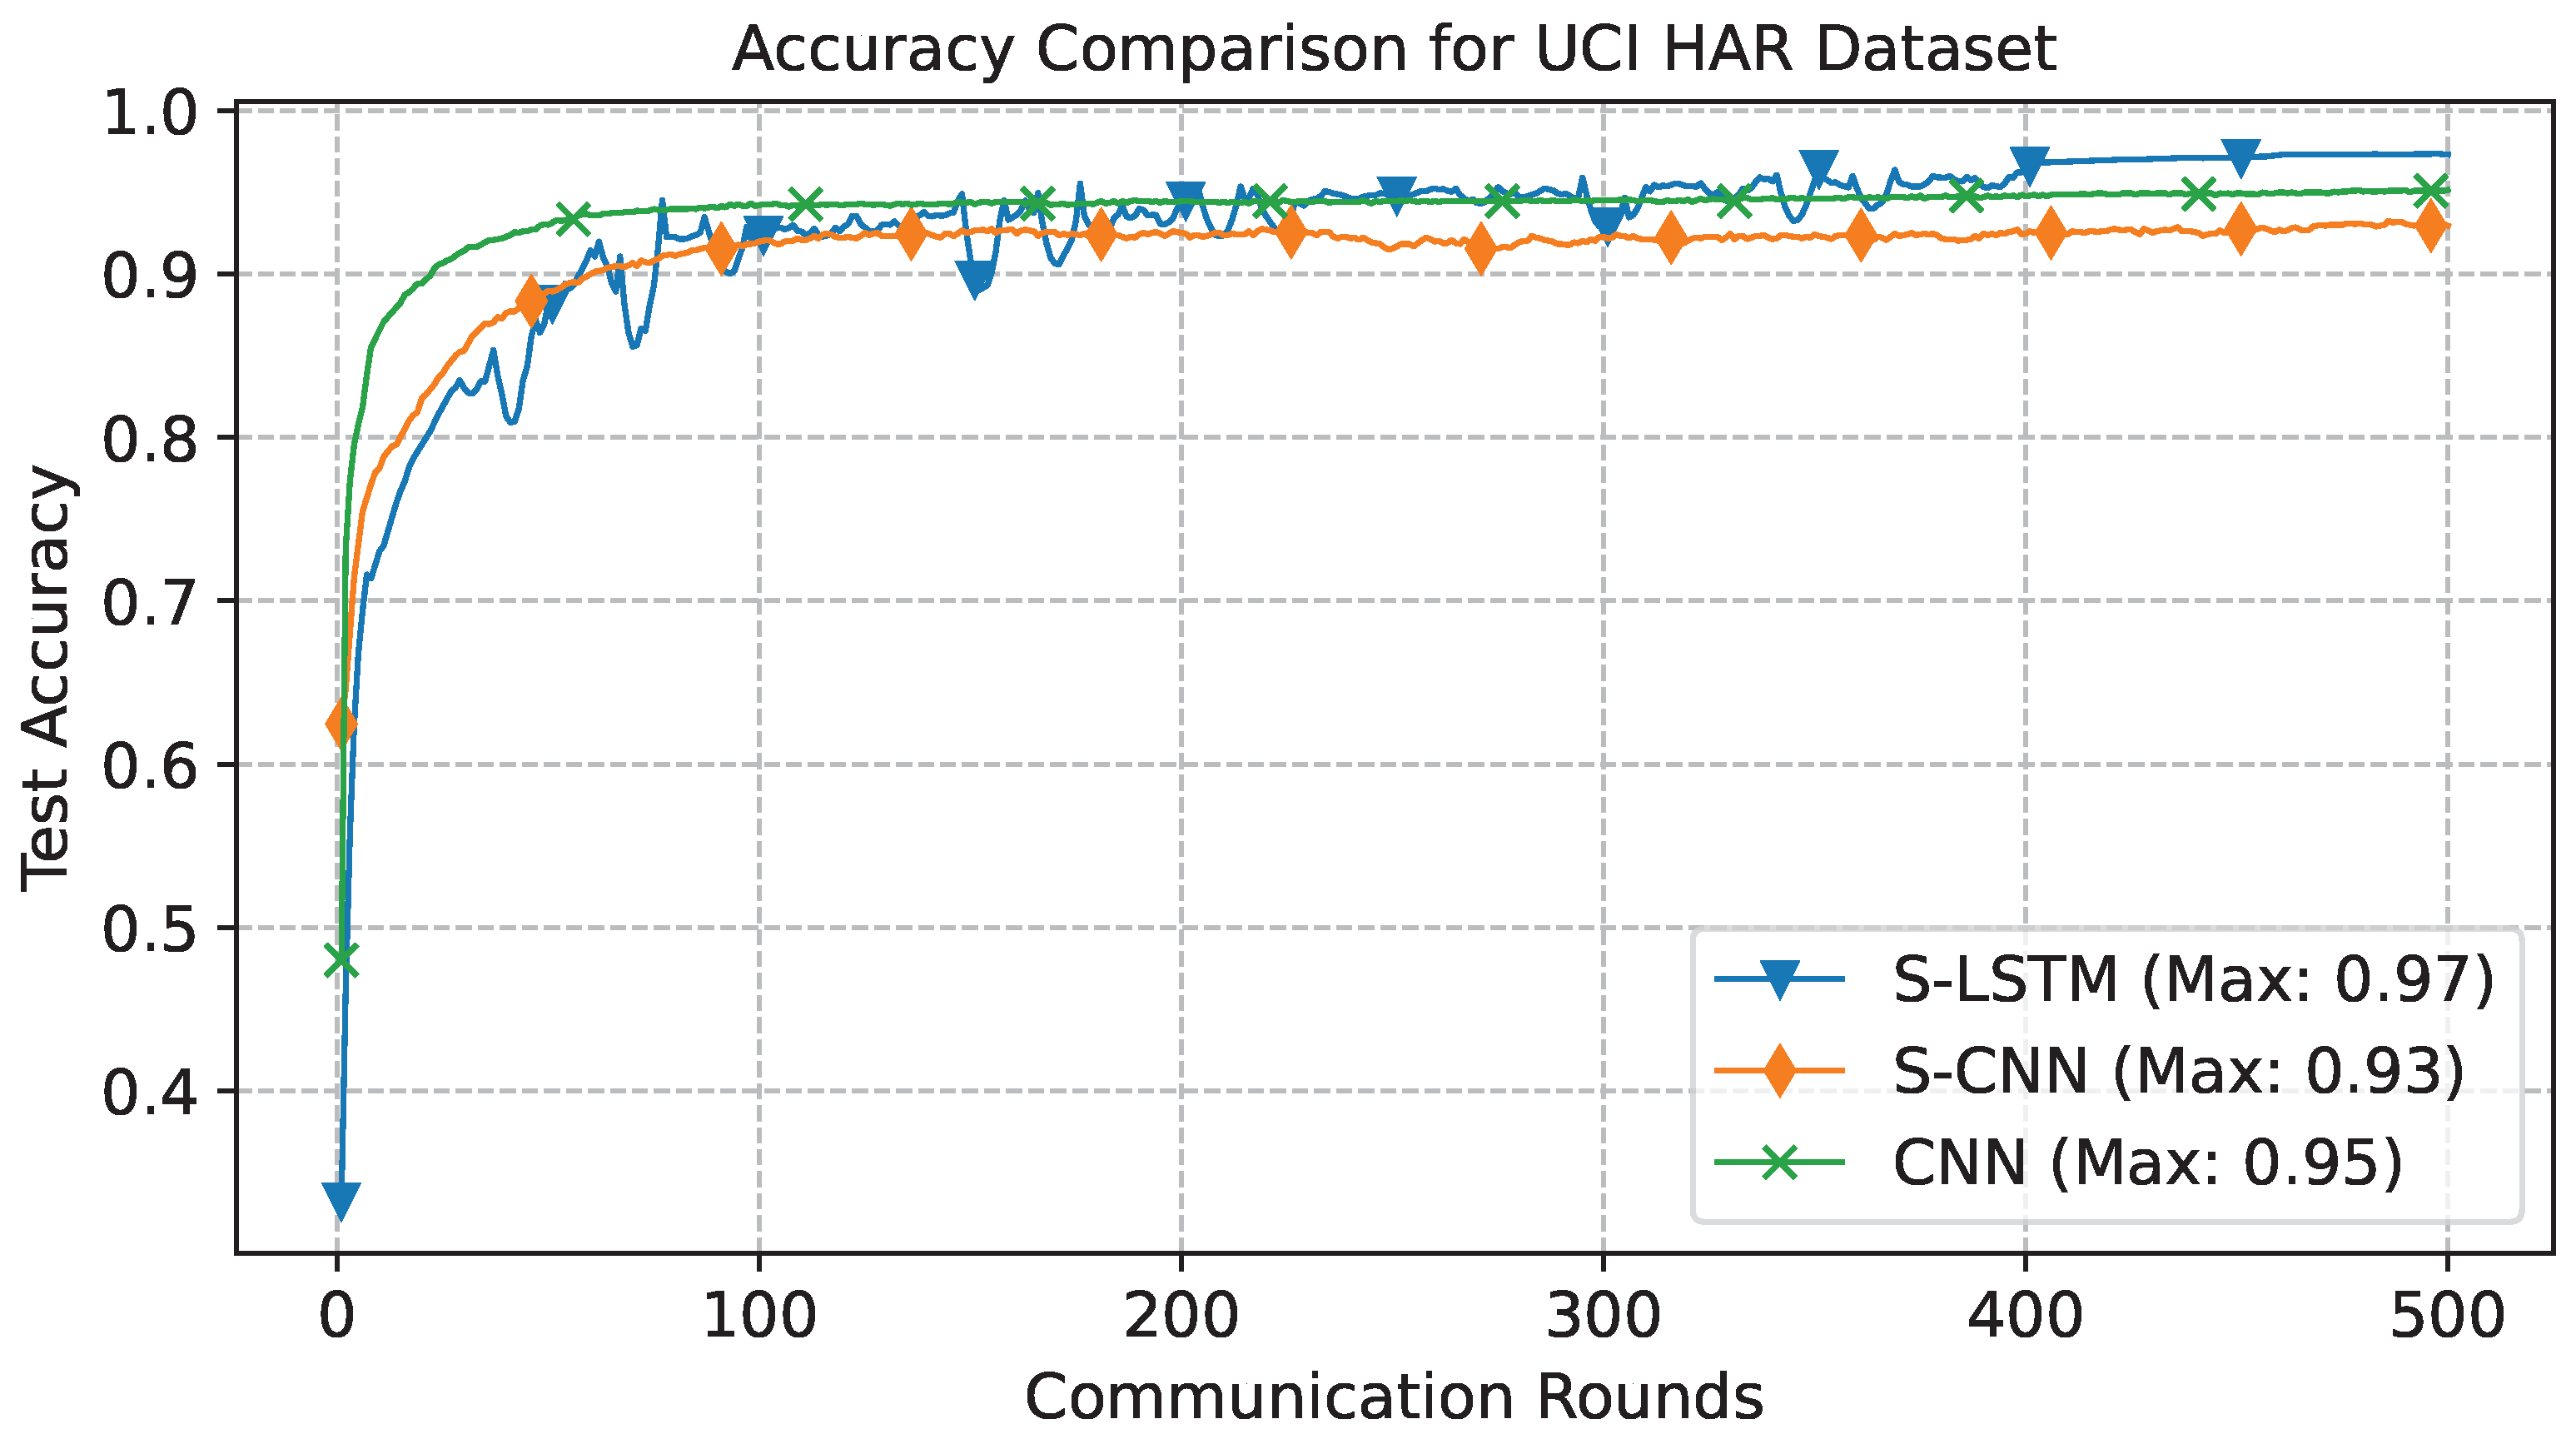
Figure 6.
The confusion matrix for three DL models compared in this study. The index represents the activity where the label corresponding to the activities are: ([1]: Walking, [2]: Walking upstairs, [3]: Walking downstairs, [4]: Sitting, [5]: Standing, [6]: Laying).
Figure 6.
The confusion matrix for three DL models compared in this study. The index represents the activity where the label corresponding to the activities are: ([1]: Walking, [2]: Walking upstairs, [3]: Walking downstairs, [4]: Sitting, [5]: Standing, [6]: Laying).
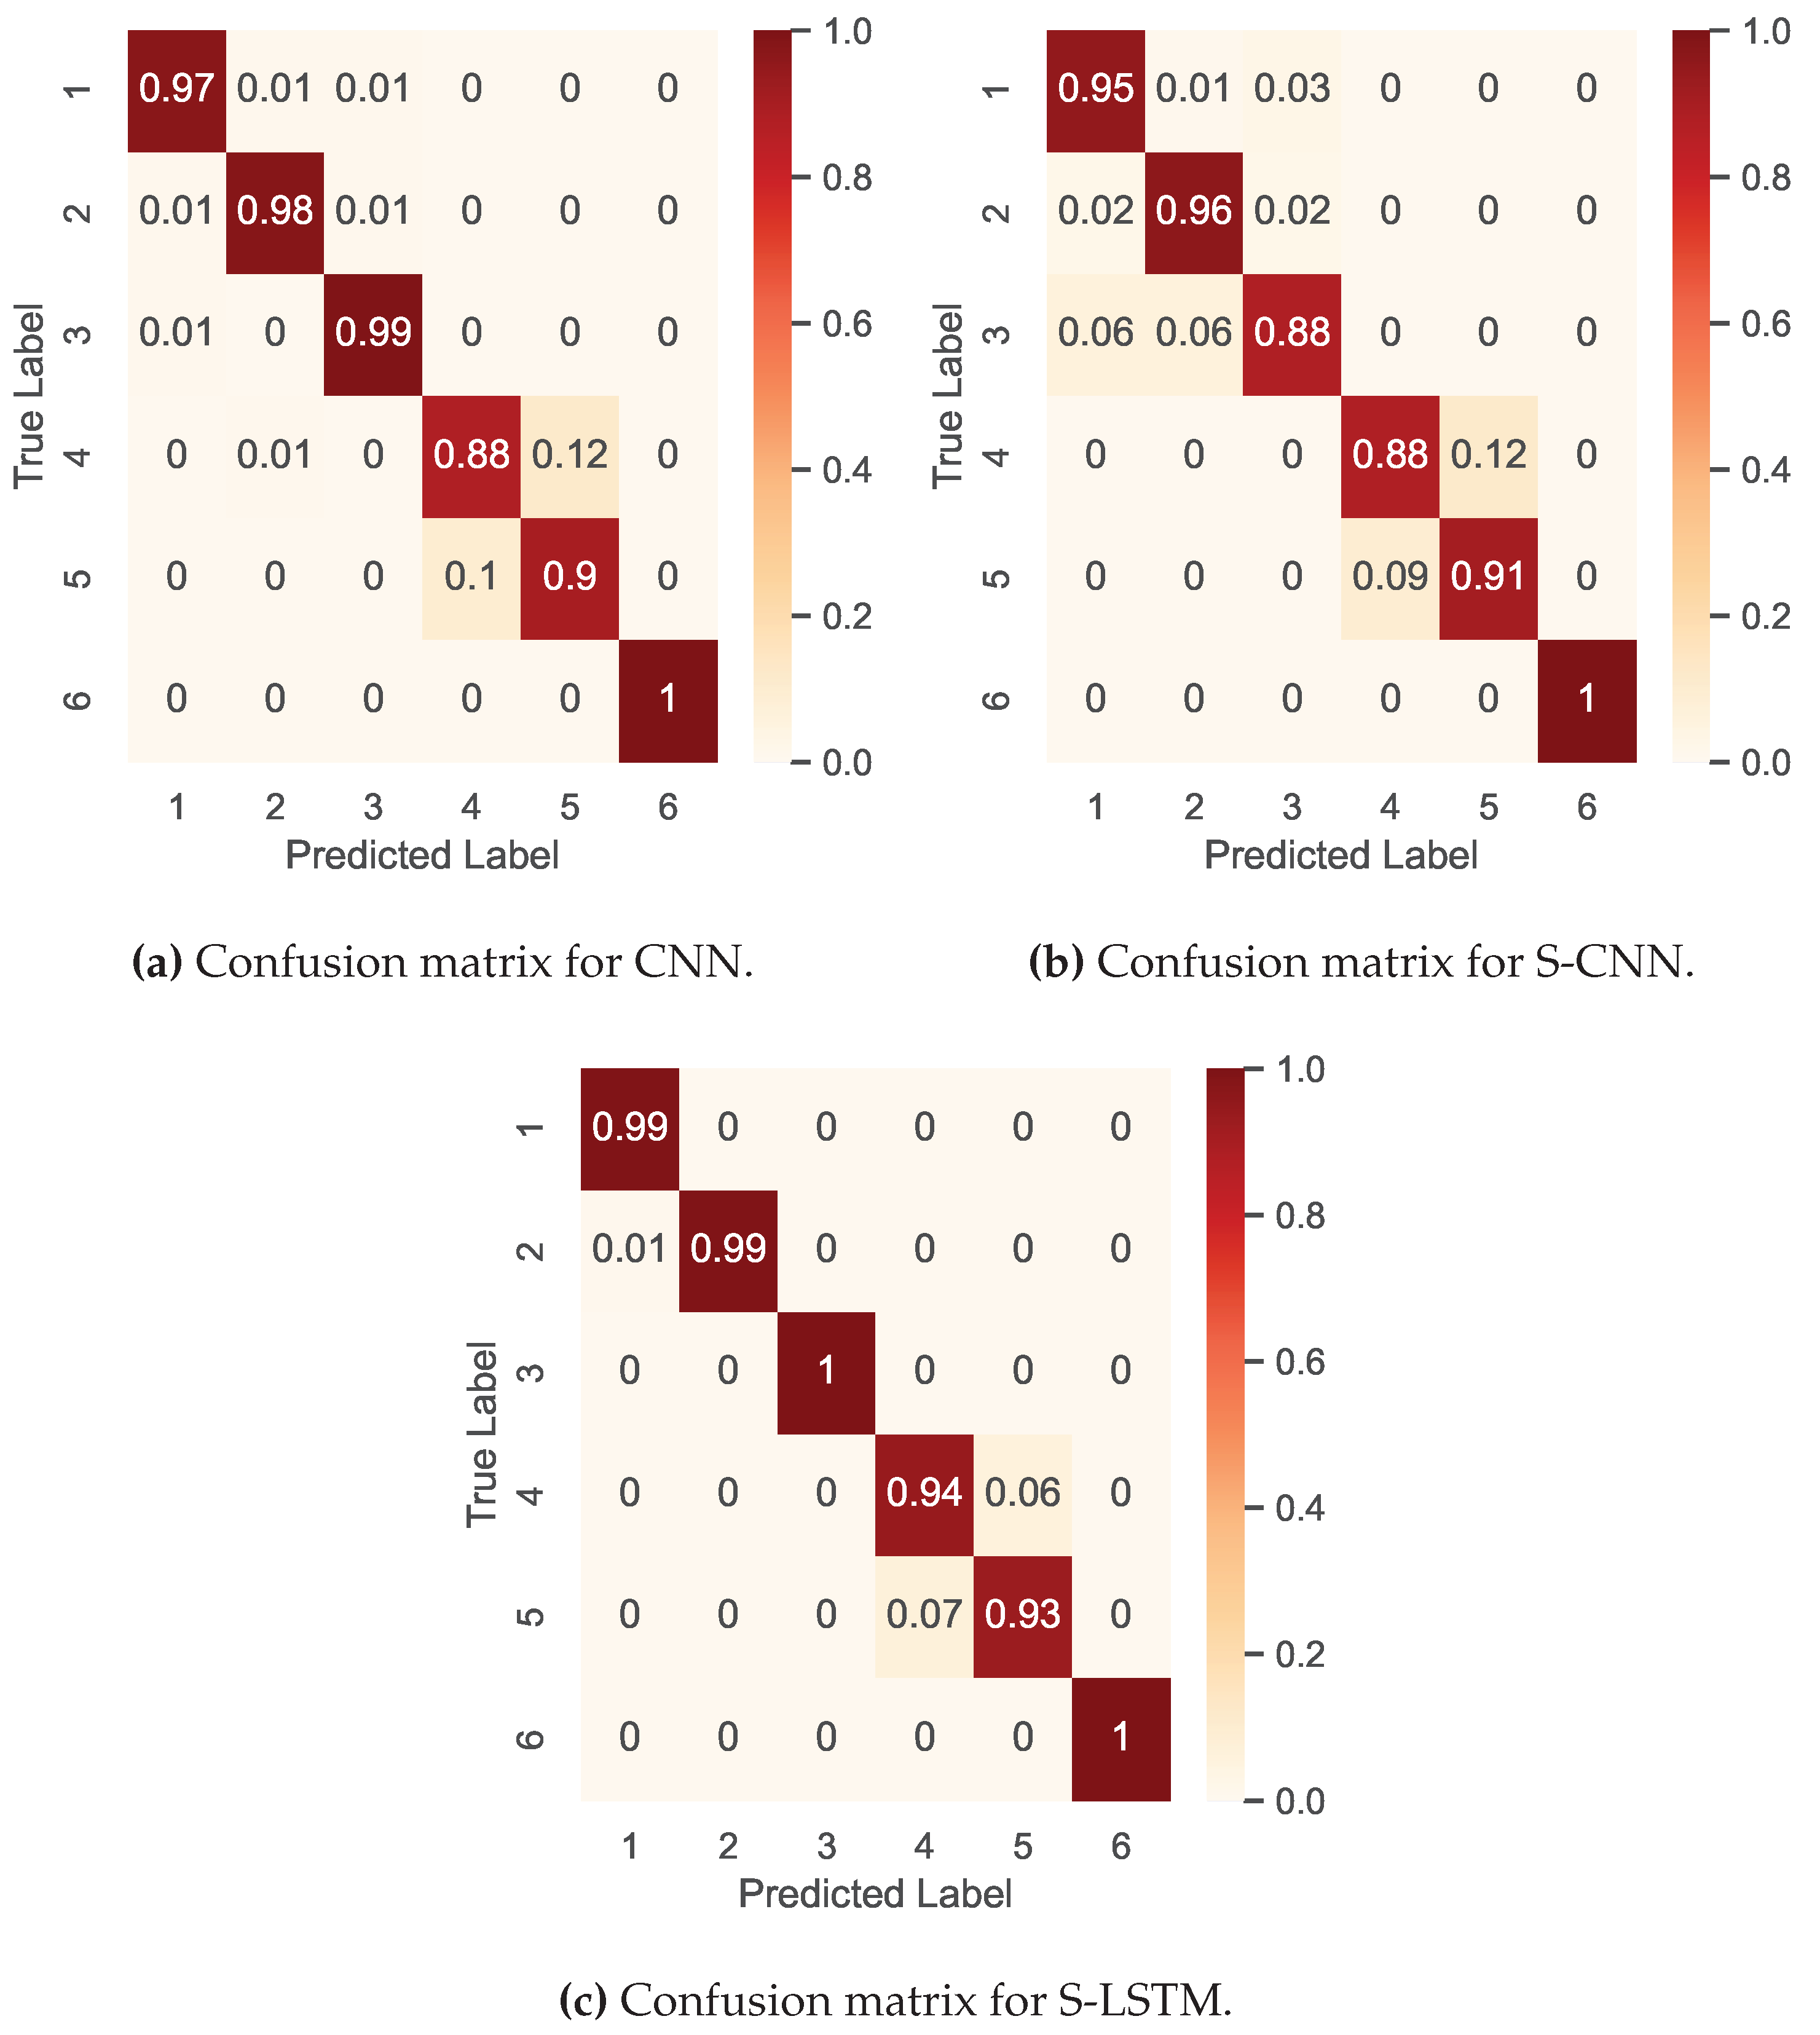
Figure 7.
Learning curve for Real-World dataset, trained for 300 communication rounds.
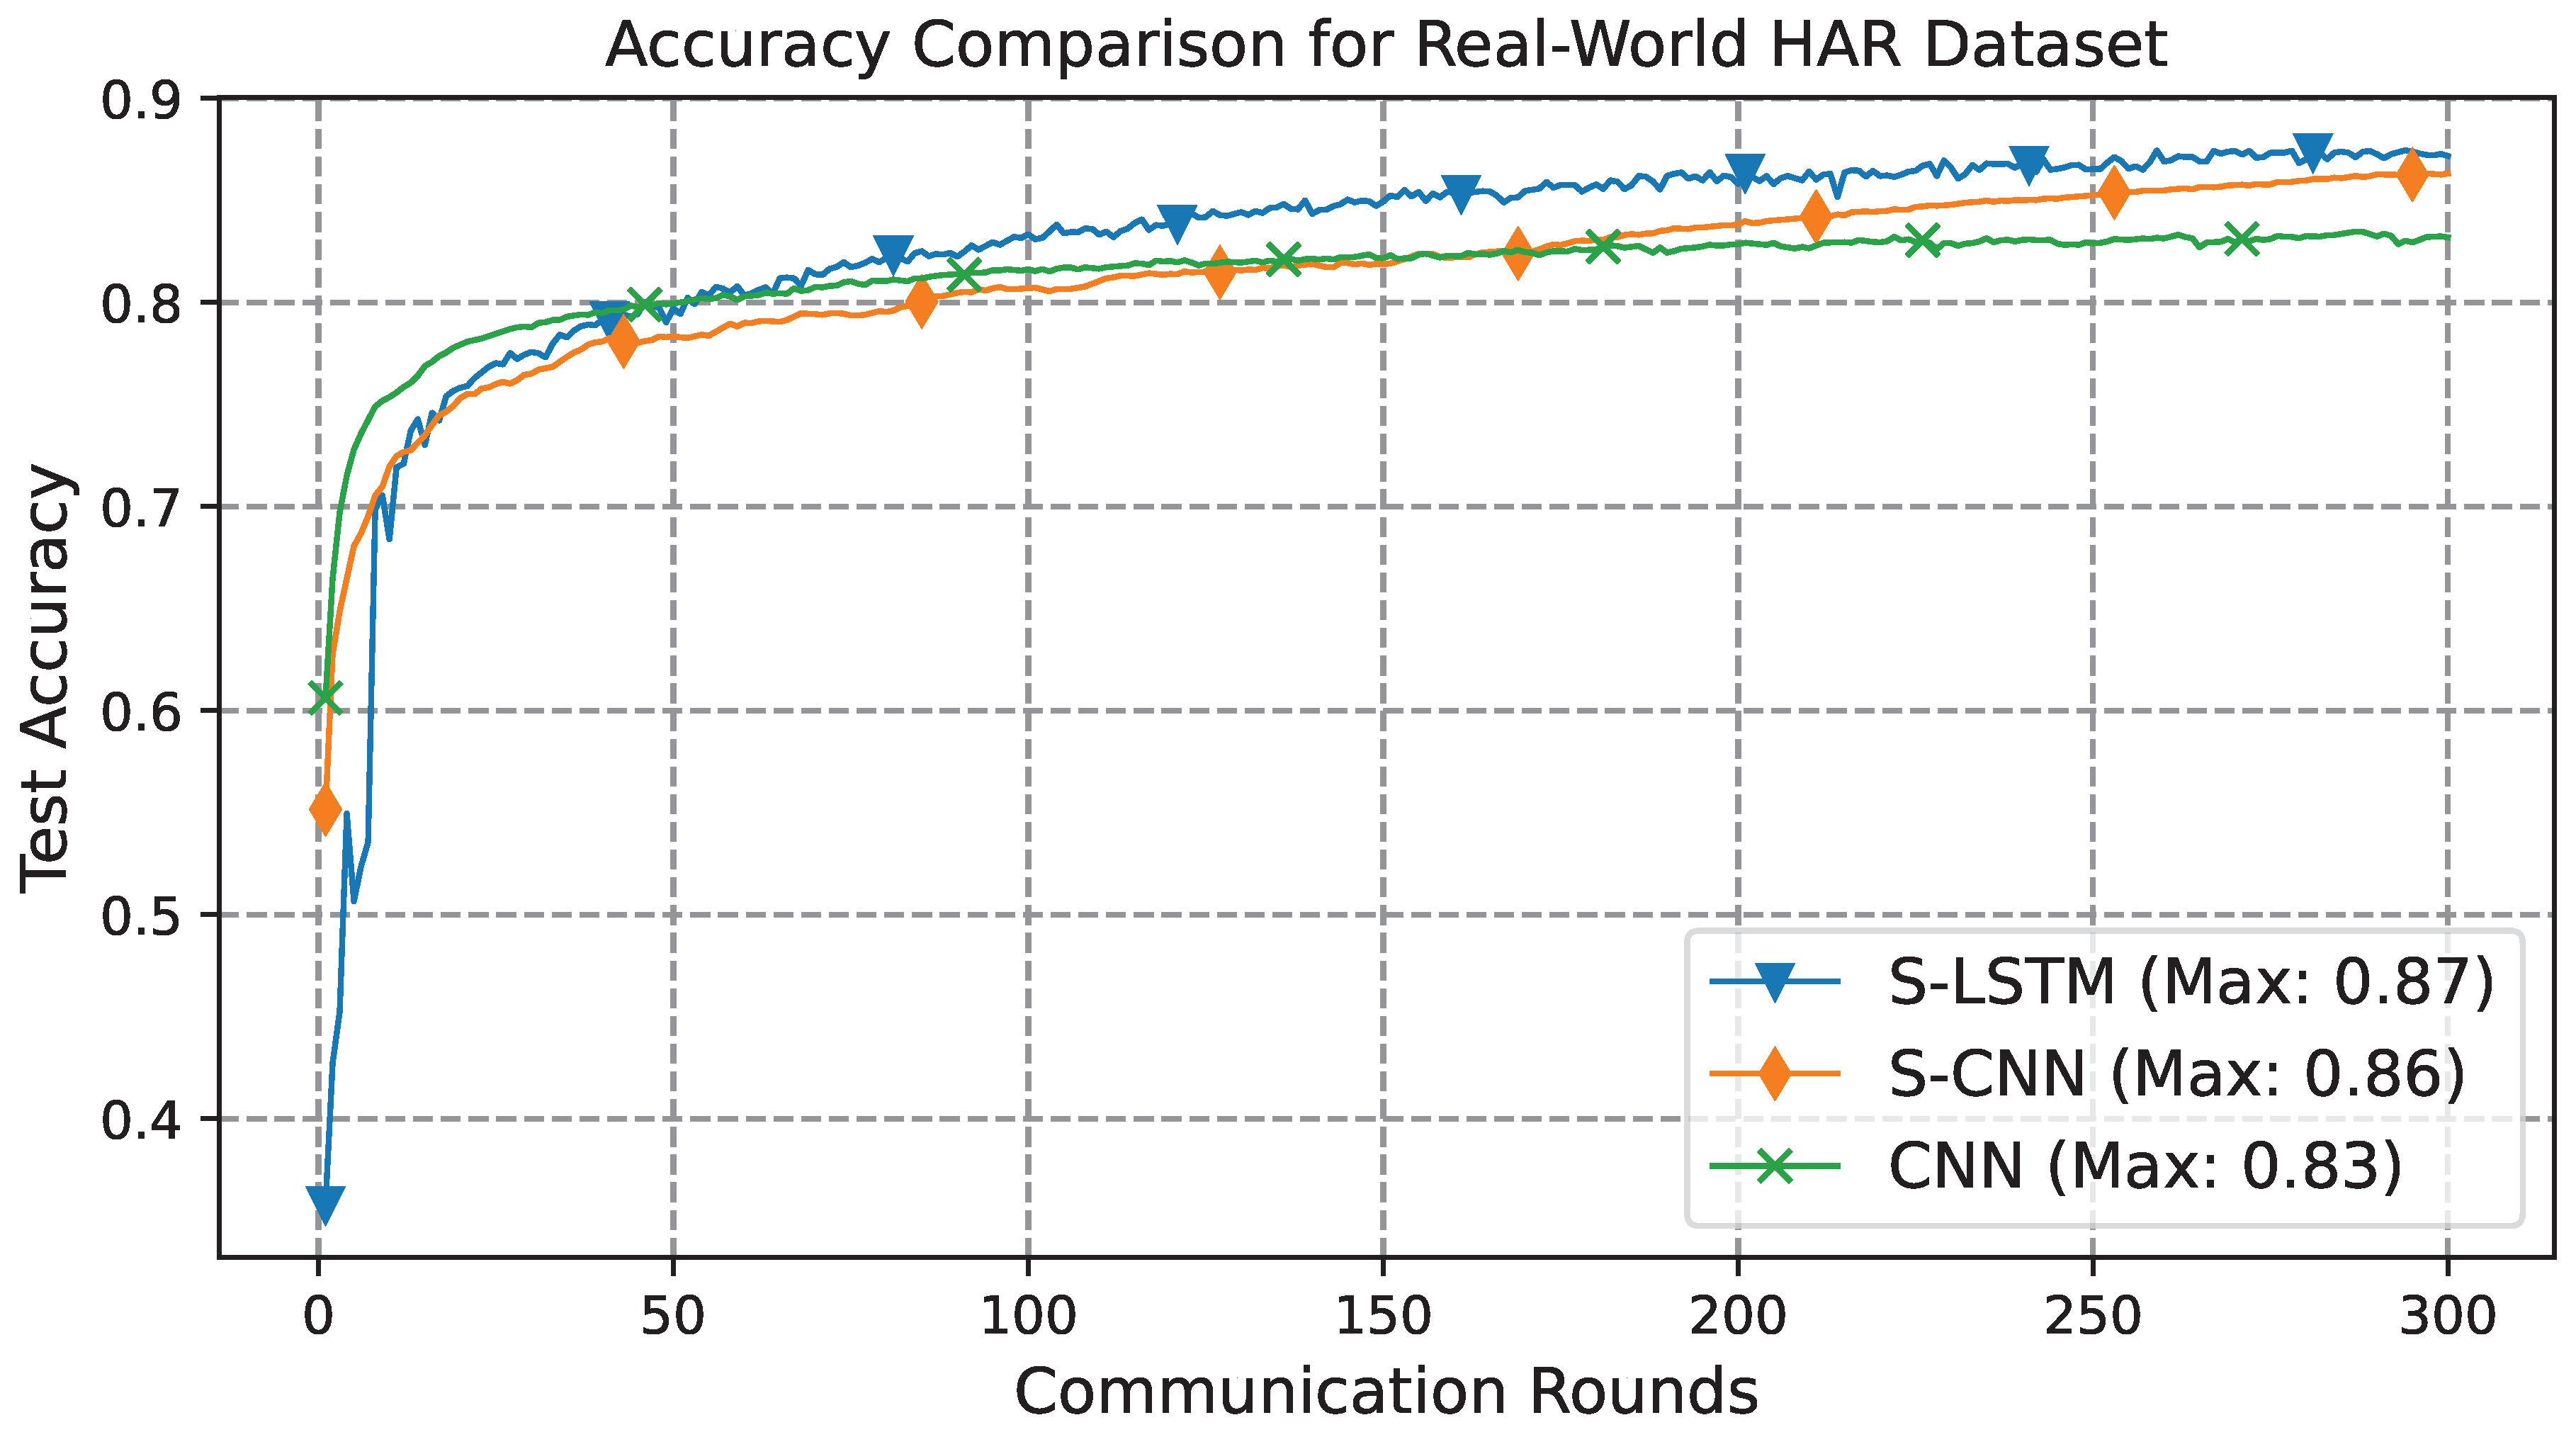
Figure 8.
The confusion matrix for three DL models compared for Real-World data set. The index represents the activity where the label corresponding to the activities are: ([1]: climbing down, [2]: climbing up, [3]: jumping, [4]: lying, [5]: running, [6]: sitting, [7]: standing, [8]: walking).
Figure 8.
The confusion matrix for three DL models compared for Real-World data set. The index represents the activity where the label corresponding to the activities are: ([1]: climbing down, [2]: climbing up, [3]: jumping, [4]: lying, [5]: running, [6]: sitting, [7]: standing, [8]: walking).
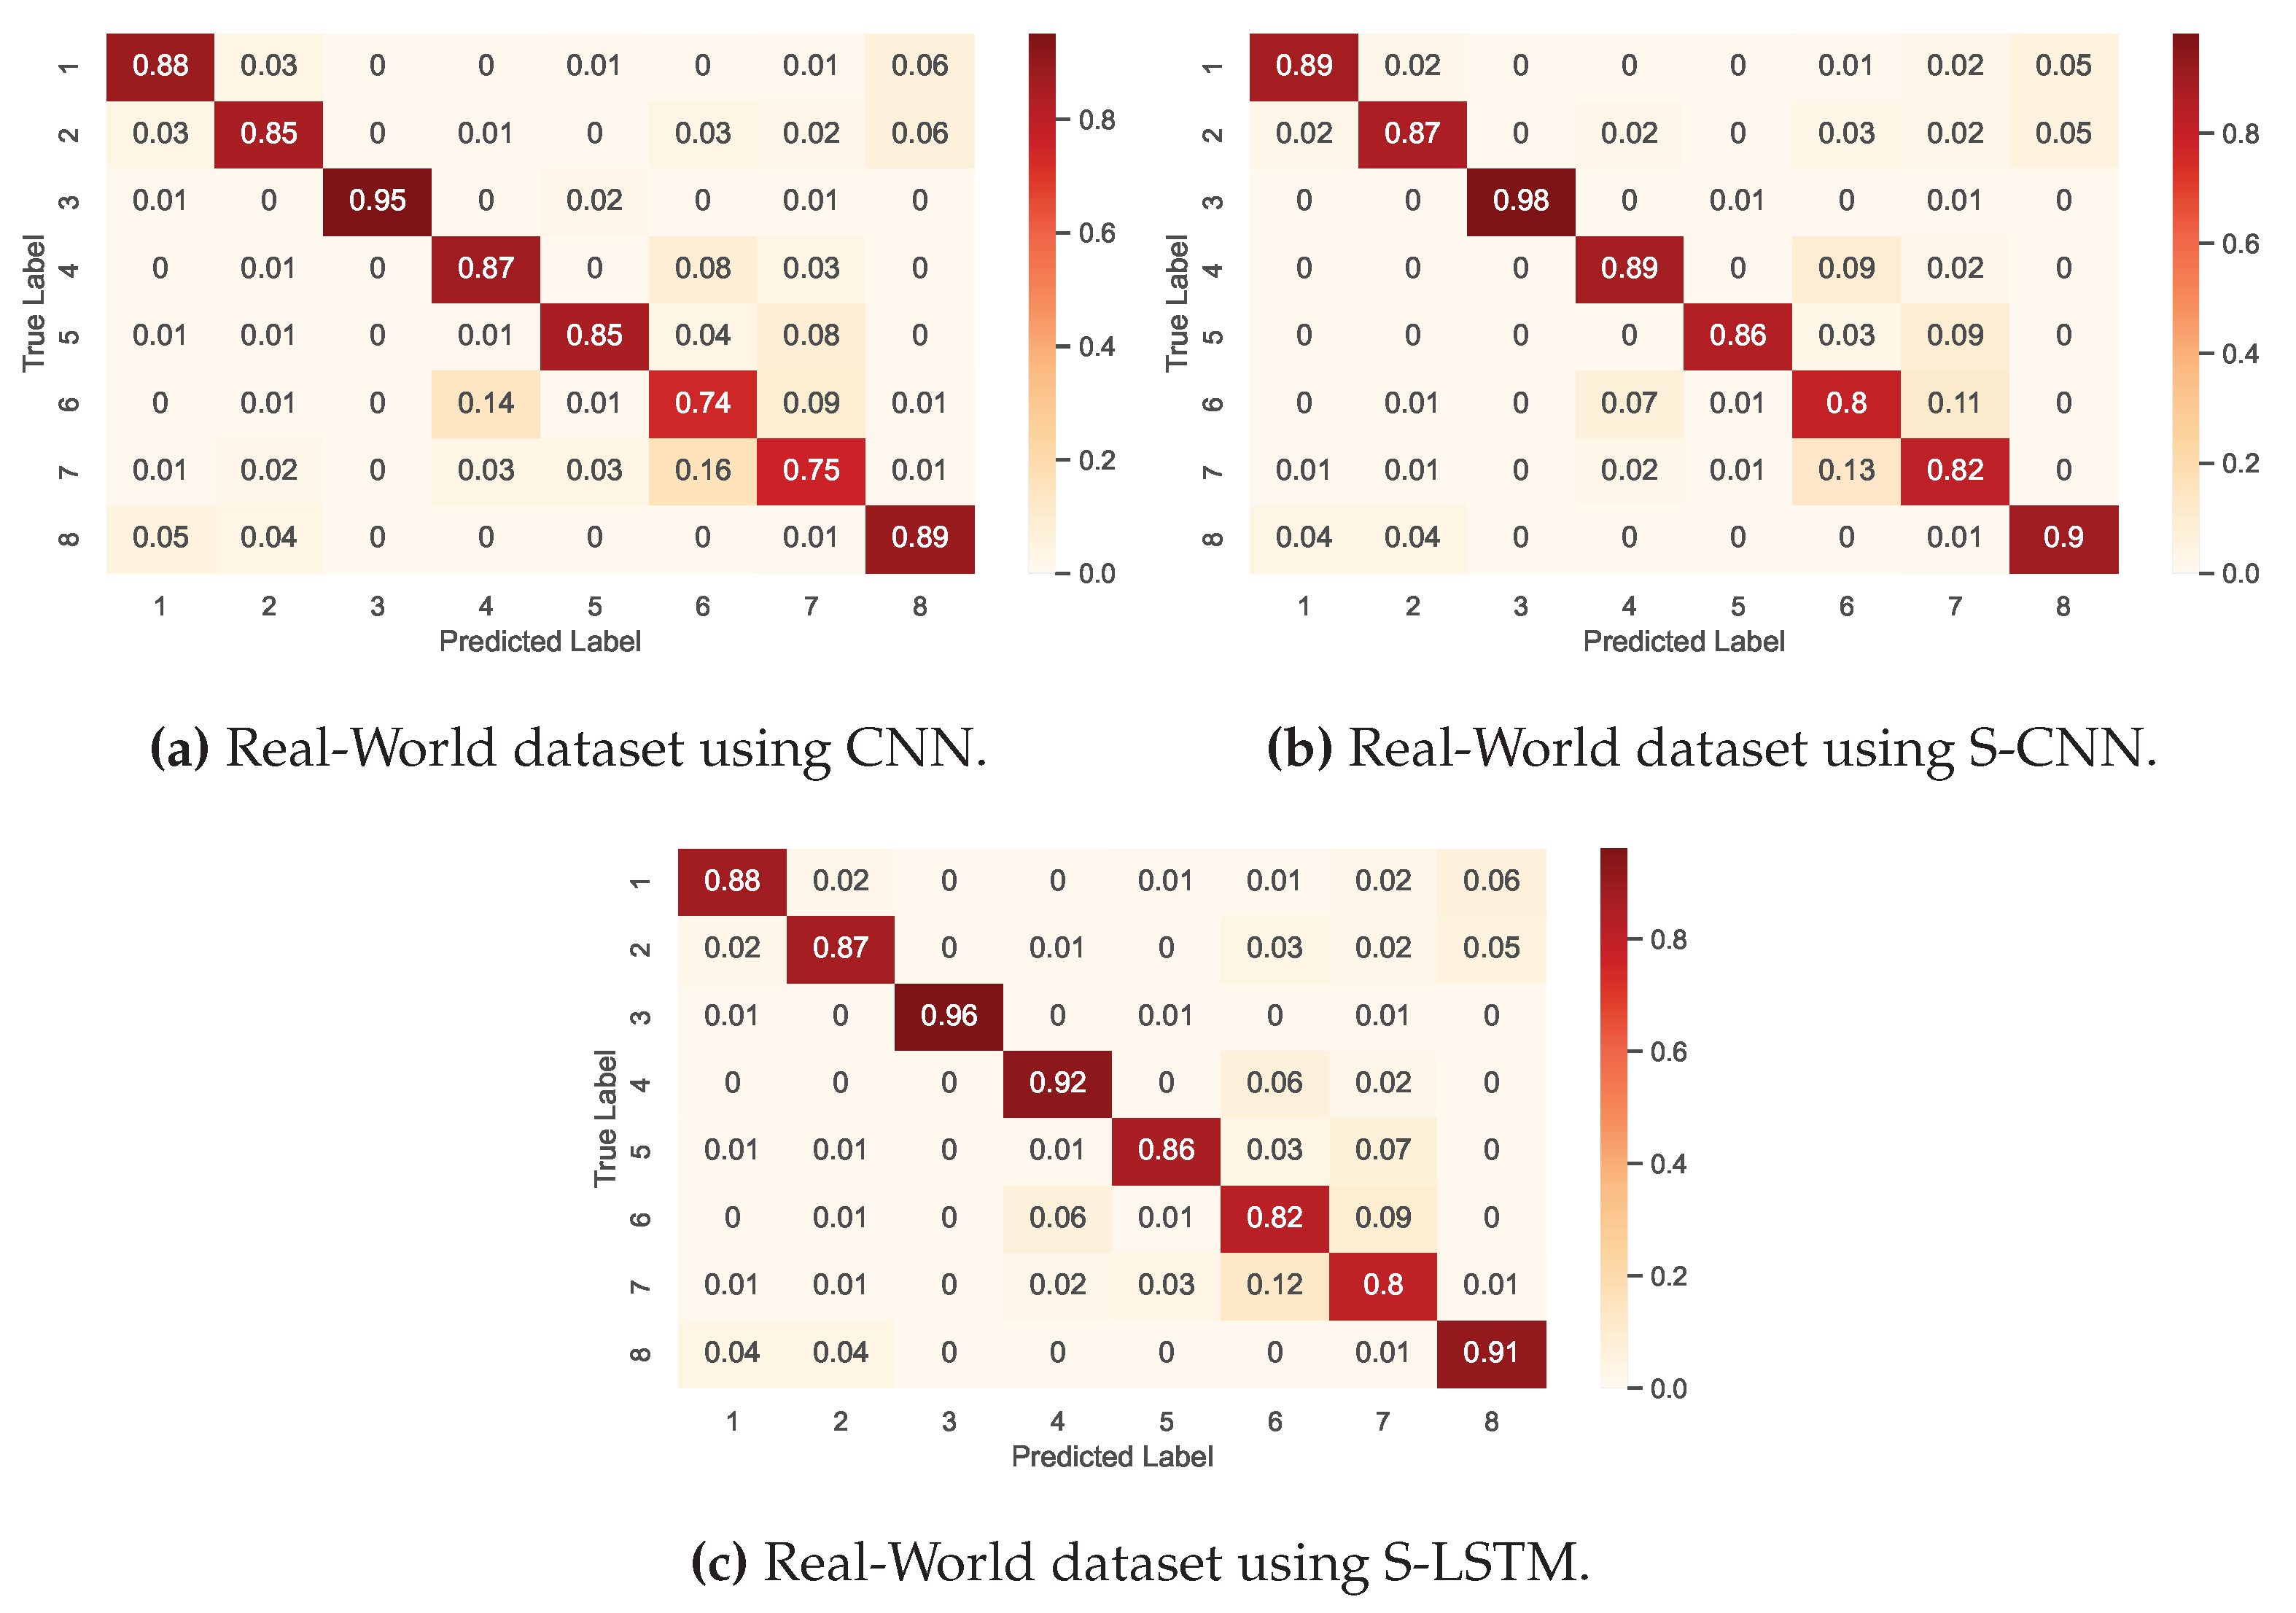
Figure 9.
Learning curve for Real-World dataset, with 50% random choosing of participant trained for 300 communication rounds.
Figure 9.
Learning curve for Real-World dataset, with 50% random choosing of participant trained for 300 communication rounds.
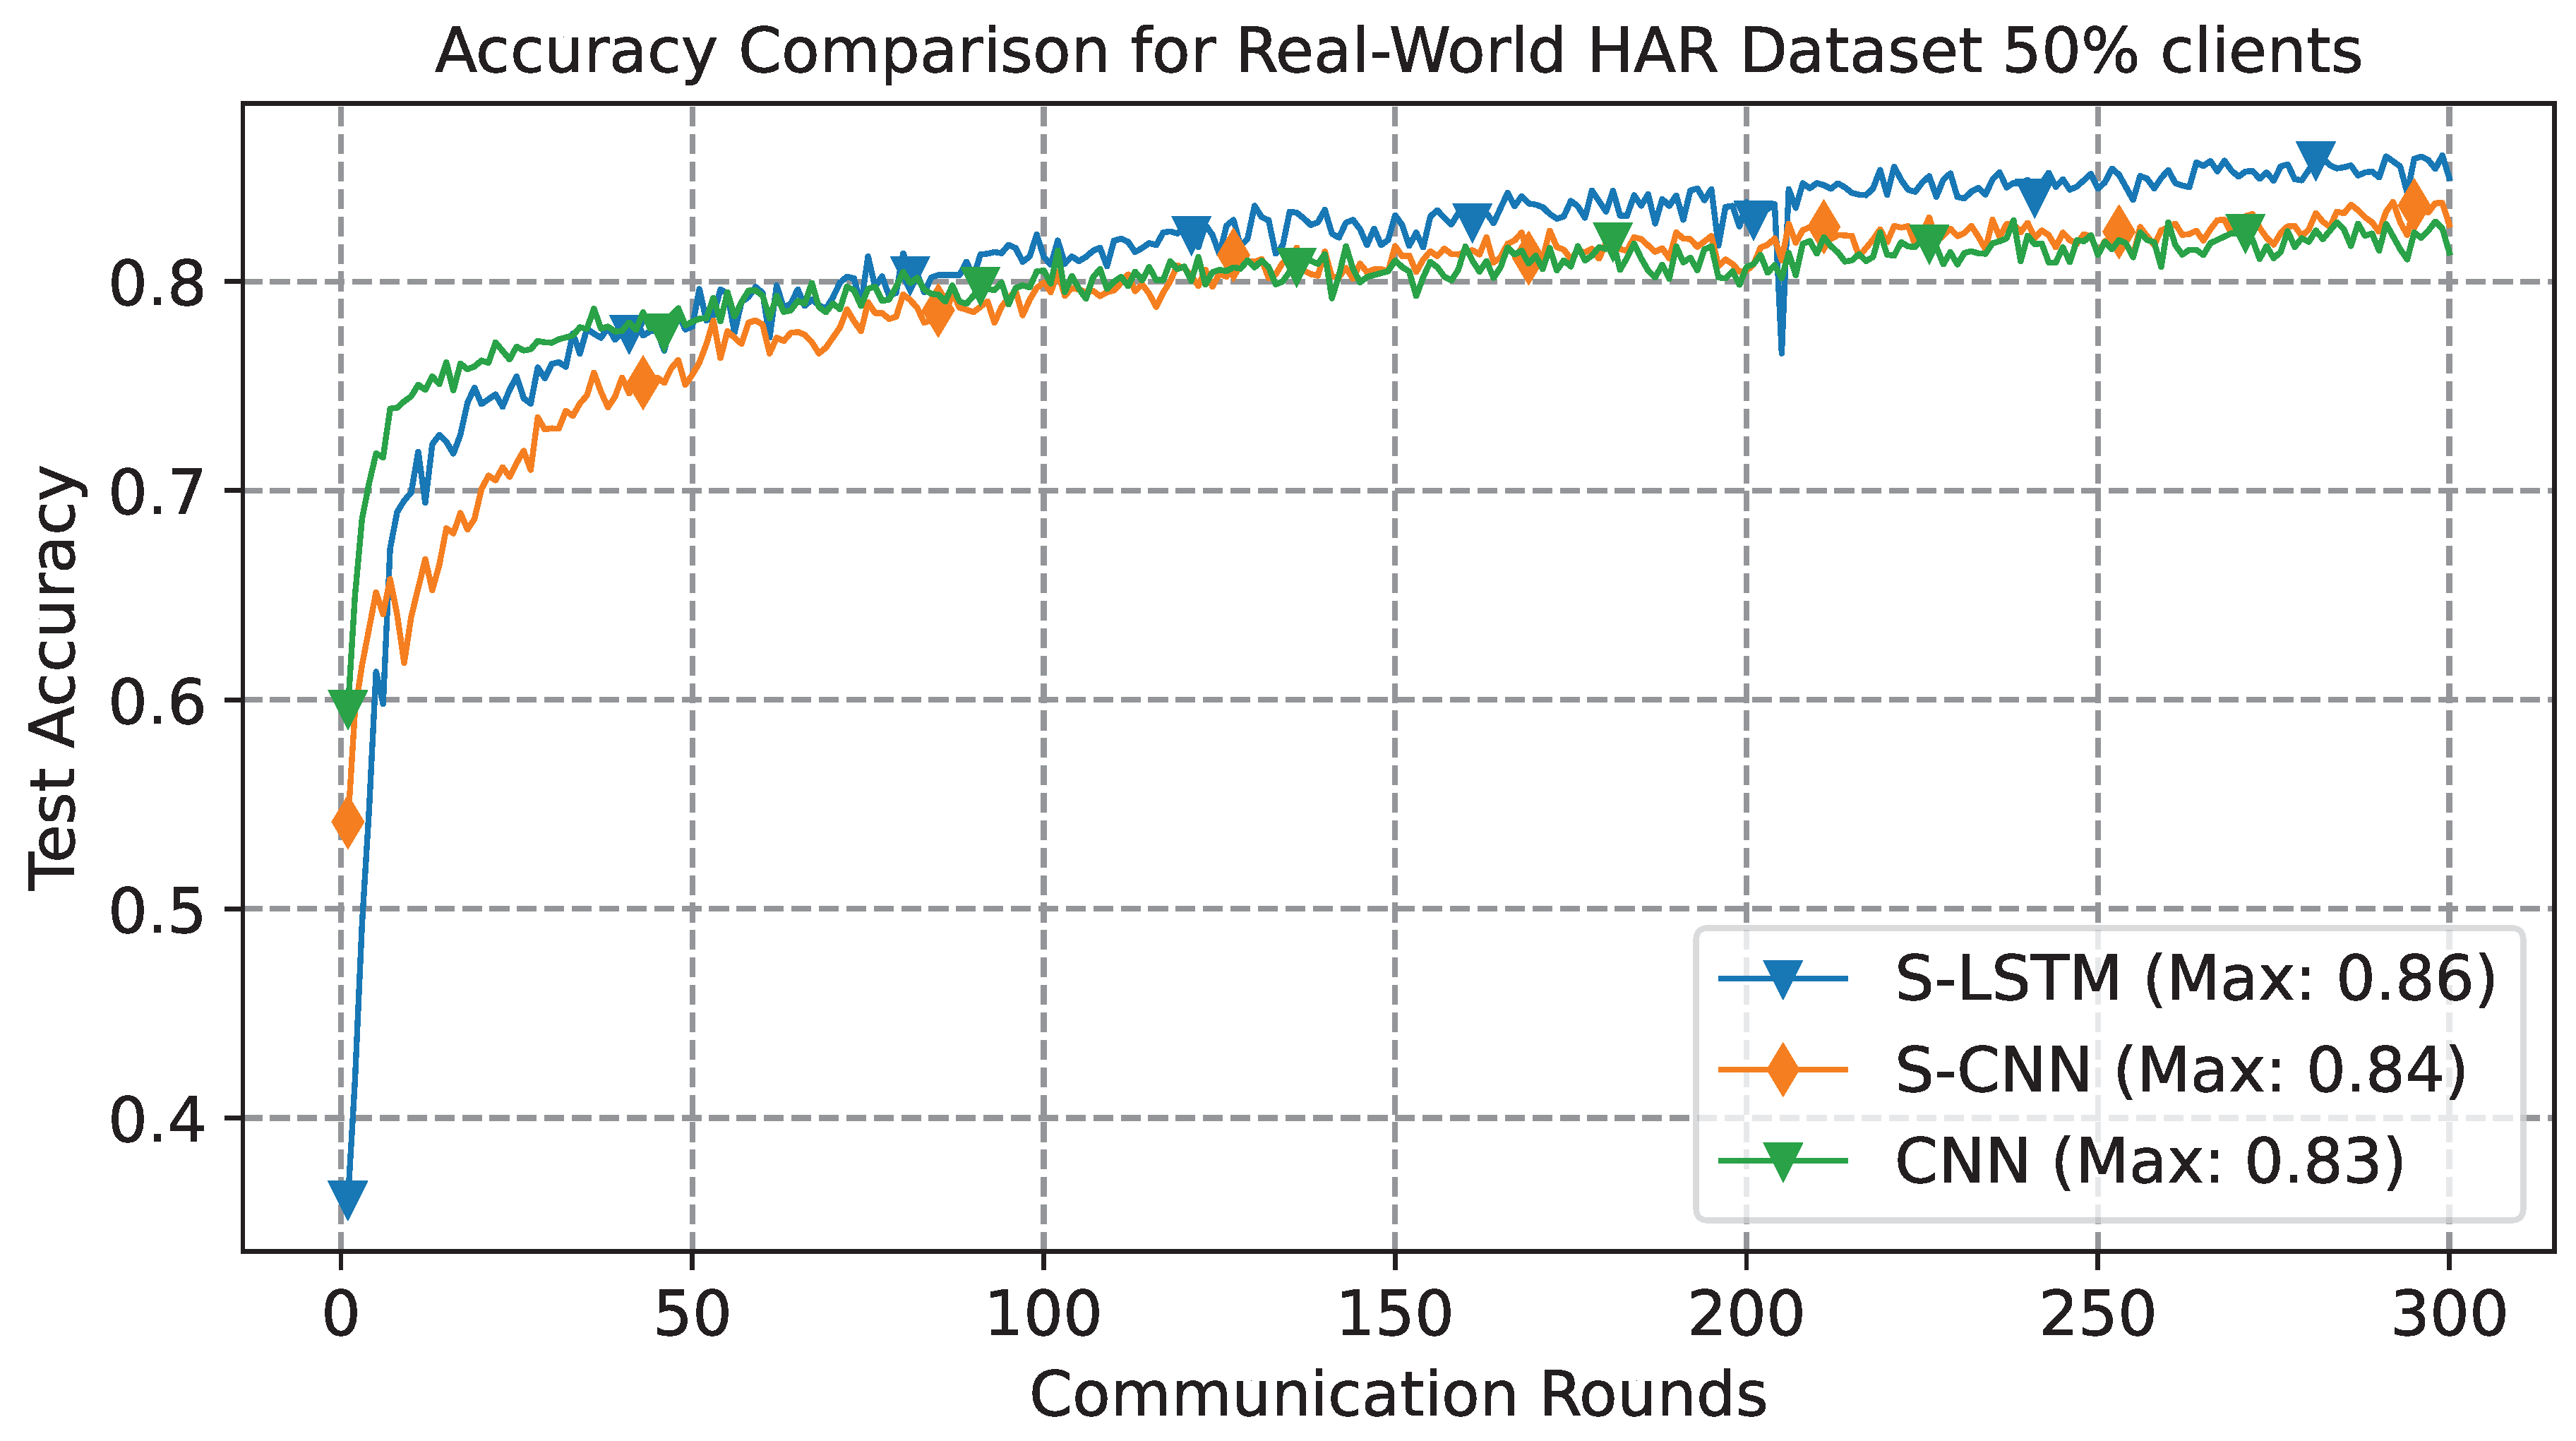
Figure 10.
Accuracy comparison graph for global model and personalised model for each client using the local test set. The personalised accuracy is obtained after fine-tuning using the local dataset.
Figure 10.
Accuracy comparison graph for global model and personalised model for each client using the local test set. The personalised accuracy is obtained after fine-tuning using the local dataset.

Table 1.
Comparative results of a global model for CNN, S-CNN and S-LSTM for UCI dataset trained in federated environment.
Table 1.
Comparative results of a global model for CNN, S-CNN and S-LSTM for UCI dataset trained in federated environment.
| CNN | S-CNN | S-LSTM | |||||||
|---|---|---|---|---|---|---|---|---|---|
| Class | Precision | Recall | F1-Score | Precision | Recall | F1-Score | Precision | Recall | F1-Score |
| Walking | 0.98 | 0.97 | 0.98 | 0.93 | 0.95 | 0.94 | 0.99 | 0.99 | 0.99 |
| Walking upstairs | 0.98 | 0.98 | 0.98 | 0.93 | 0.96 | 0.95 | 0.99 | 0.99 | 0.99 |
| Walking downstairs | 0.98 | 0.99 | 0.98 | 0.93 | 0.88 | 0.91 | 1.00 | 1.00 | 1.00 |
| Sitting | 0.89 | 0.88 | 0.88 | 0.90 | 0.88 | 0.89 | 0.93 | 0.94 | 0.93 |
| Standing | 0.89 | 0.90 | 0.89 | 0.89 | 0.91 | 0.90 | 0.94 | 0.93 | 0.94 |
| Laying | 1.00 | 1.00 | 1.00 | 1.00 | 1.00 | 1.00 | 1.00 | 1.00 | 1.00 |
Table 2.
Comparison of classification metrics between different DL techniques for Real-World dataset.
Table 2.
Comparison of classification metrics between different DL techniques for Real-World dataset.
| CNN | S-CNN | S-LSTM | |||||||
|---|---|---|---|---|---|---|---|---|---|
| Class | Precision | Recall | F1-Score | Precision | Recall | F1-Score | Precision | Recall | F1-Score |
| Climbing down | 0.86 | 0.88 | 0.87 | 0.91 | 0.89 | 0.90 | 0.90 | 0.88 | 0.89 |
| Climbing up | 0.87 | 0.85 | 0.86 | 0.91 | 0.87 | 0.89 | 0.90 | 0.87 | 0.88 |
| Jumping | 0.95 | 0.95 | 0.95 | 0.96 | 0.98 | 0.97 | 0.98 | 0.96 | 0.97 |
| Lying | 0.82 | 0.87 | 0.84 | 0.88 | 0.89 | 0.88 | 0.90 | 0.92 | 0.91 |
| Running | 0.95 | 0.85 | 0.90 | 0.97 | 0.86 | 0.91 | 0.94 | 0.86 | 0.90 |
| Sitting | 0.70 | 0.74 | 0.72 | 0.73 | 0.80 | 0.76 | 0.77 | 0.82 | 0.80 |
| Standing | 0.75 | 0.75 | 0.75 | 0.75 | 0.82 | 0.78 | 0.77 | 0.80 | 0.78 |
| Walking | 0.88 | 0.89 | 0.89 | 0.91 | 0.90 | 0.90 | 0.89 | 0.91 | 0.90 |
Disclaimer/Publisher’s Note: The statements, opinions and data contained in all publications are solely those of the individual author(s) and contributor(s) and not of MDPI and/or the editor(s). MDPI and/or the editor(s) disclaim responsibility for any injury to people or property resulting from any ideas, methods, instructions or products referred to in the content. |
© 2020 by the authors. Licensee MDPI, Basel, Switzerland. This article is an open access article distributed under the terms and conditions of the Creative Commons Attribution (CC BY) license (https://creativecommons.org/licenses/by/4.0/).
Copyright: This open access article is published under a Creative Commons CC BY 4.0 license, which permit the free download, distribution, and reuse, provided that the author and preprint are cited in any reuse.
MDPI Initiatives
Important Links
© 2024 MDPI (Basel, Switzerland) unless otherwise stated


