Preprint
Article

Aqueous Fraction from Cucumis sativus Aerial Parts Attenuates Angiotensin II-induced Endothelial Dysfunction In vivo by Activating Akt

Altmetrics

Downloads

83

Views

29

Comments

0

A peer-reviewed article of this preprint also exists.

Submitted:

15 October 2023

Posted:

17 October 2023

You are already at the latest version

Alerts
Abstract
Background: Endothelial dysfunction (ED) is a marker of vascular damage and the precursor of cardiovascular diseases such as hypertension, which involve inflammation and organ damage. Nitric oxide (NO) produced by eNOS, which is induced by pAKT, plays a crucial role in the function of a healthy endothelium. Methods: A combination of the subfractions SF1 and SF3 (C4) of the aqueous fraction from Cucumis sativus (Cs-Aq) was evaluated to control endothelial dysfunction in vivo, and on HMEC-1 cells to assess the involvement of pAkt in vitro. C57BL/6J mice were daily injected with Ang-II for 10 weeks. Once hypertension was established, Cs-AqC4 or losartan were orally administered along with Ang-II for another 10 weeks. Blood pressure (BP) was measured at weeks 0, 5, 10, 15, and 20. Serum creatinine was quantified; the inflammatory status was evaluated in kidney, and tissue damage and vascular remodeling were studied in liver and aorta. Cs-AqC4 was also evaluated in vitro on HMEC-1 cells stimulated by angiotensin II (Ang-II) to assess the involvement of Akt phosphorylation. Results: Cs-AqC4 decreased systolic and diastolic BP, reversed vascular remodeling, decreased IL-1β and TGF-β and increased IL-10 and decreased kidney and liver damage. In HMEC-1 cells, AKT phosphorylation and NO production were increased. Conclusions: Cs-AqC4 controlled inflammation and vascular remodeling, resulting in BP regulation; it also improved tissue damage associated with ED, probably via Akt activation.
Keywords: 
Subject: Medicine and Pharmacology  -   Medicine and Pharmacology

1. Introduction

Endothelial dysfunction (ED) is a marker of vascular damage and a precursor of cardiovascular diseases such as hypertension and renal failure, leading causes of death worldwide [1]. Angiotensin II (Ang-II) is the main effector molecule of the renin-angiotensin system. It activates several signaling pathways that regulate vascular biology and, when altered, it is a major contributor to the development of vascular diseases such as endothelial dysfunction [2]. ED is characterized by oxidative stress, inflammation, vascular remodeling, vasoconstriction, and a prothrombotic state [3].
The pathological basis of ED is an imbalance in the synthesis, release, or effects of factors synthesized by endothelial cells [4], such as nitric oxide (NO), a key regulator of the cardiovascular system [5] whose lack impairs the ability of the endothelium to modulate the physiological functions of the vascular bed [4]. The main source of NO production in endothelium is the enzyme endothelial nitric oxide synthase (eNOS), whose activation depends on protein kinase B (Akt) [6].
In ED, the Akt/eNOS/NO signaling pathway is altered either by the effect of Ang-II, reactive oxygen species (ROS), or inflammatory mediators (IL-6, TNF-α, protein C reactive), among other stimuli [7,8]. The failure of NO to diffuse to the vascular smooth muscle cells (VSMCs) has two main effects: 1) actomyosin relaxation is prevented, thus promoting the maintenance of a vasoconstricted state, and 2) VSMC proliferation is induced, causing the vessel walls to thicken (remodel) [8,9].
On the other hand, stimuli that promote ED, including ROS, Ang-II, oxLDL, and advanced glycosylation end products, also activate NF-κB, which induces the synthesis of proinflammatory cytokines (IL-1b, IL -6, TNF-α), chemokines (MCP-1), and adhesion molecules (VCAM-1, ICAM-1, E-selectin). This proinflammatory environment promotes the adhesion, transmigration, and activation of inflammatory cells (neutrophils, monocytes, T lymphocytes), leading to an overexpression of cytokines, chemokines, growth factors and ROS, which further contribute to the progression of inflammation and damage [4] to target organs such as kidney and liver [10].
Previous studies have reported that Cucumis sativus has antioxidant and anti-inflammatory activities [11-13]. In our research group, we observed that the subfractions SF1 and SF3 of the aqueous fraction of C. sativus aerial parts showed protective effects in vitro on Ang-II-induced ED using HMEC-1 cells. The main components found in both subfractions were glycine, arginine, asparagine, lysine, and aspartic acid [14]. This study aims to assess in vivo the ability of a combination of SF1 and SF3, labeled C4, to control hypertension, vascular remodeling, inflammation, and renal and hepatic damage induced by Ang-II administration, as well as to preliminarily elucidate the mechanism of action underlying the activity against ED in vitro.

2. Materials and Methods

2.1. Plant material and fractions preparation

Aerial parts of C. sativus, including fruits, were collected from an edible crop, free of pesticides and fertilizers, in Xochitepec, Mexico, from July to August. Plant material was identified by Biol. Margarita Avilés Flores and Macrina Fuentes Mata (Herbario del Jardín Etnobotánico del Instituto Nacional de Antropología e Historia, INAH, Cuernavaca). Voucher specimens were stored for future reference (INAH-Morelos 3001). Plant material was kept protected from light at room temperature (RT) and dried.
Dry plant material was ground in a Pulvex electric mill (Büchi R-114, Büchi Labortechnik, Flawil, Switzerland) until particles smaller than 4 mm were obtained. An exhaustive maceration process with ethanol/water (60:40 v/v) was performed at RT to obtain the hydroalcoholic extract. This extract was concentrated by reduced-pressure distillation and then lyophilized. A sample of this extract (50 g) underwent bipartition with ethyl acetate/water, obtaining the aqueous fraction. This fraction was concentrated by reduced-pressure distillation. Aqueous fractions were suspended in methanol (700 mL) for 24 h; the liquid phase was filtered and concentrated in a rotary-evaporator (Laborota 4000, Heidolph, Schwabach, Germany), yielding the subfraction SF1, which was dried by lyophilization. On the other hand, the organic phase was suspended in acetone (700 mL), yielding the subfractions SF2 (soluble phase) and SF3 (precipitate), which finally were concentrated under reduced pressure and lyophilized.

2.2. Cell culture

Human microvascular endothelial cells-1 (HMEC-1) were provided by Aida Castillo from the Department of Physiology, CINVESTAV-IPN, Mexico City. The cells were cultured in MCDB-131 medium, supplemented with 10% fetal serum bovine (FBS), L-glutamine 10 mM, 100 U/mL of penicillin-streptomycin (Invitrogen, Carlsbad, CA, USA), 10 ng/mL of endothelial growth factor, and 1 μg/mL of hydrocortisone (Sigma) at 37 °C under a CO2 atmosphere (5%). All experiments were performed using passages 3 to 8. The cells were cultured in Petri dishes to a density of 4 × 10⁶ cells/dish in medium supplemented with Ang-II 5000 nM and either losartan (10 μmol) or C4 (10 μg/mL of each SF1 and SF3), for 24 h.

2.3. Western blot

HMEC-1 cells were washed with PBS and lysed by incubating with lysis buffer (Tris 20 mM, pH 7.4; NaCl 150 mM, ethylenediaminetetraacetic acid [EDTA] 1 mM, pH 7.4; Triton X-100 0.5%; sodium dodecyl sulfate [SDS] 0.1%, sodium deoxycholate 0.5%), using a cocktail of phosphatase and protease inhibitors (tablets, Roche) for 15 min. The lysates were scraped off the plates and centrifuged at 9000 x g for 10 min at 4°C. Proteins in the supernatant were quantified by the Bradford method. The volume of supernatant equivalent to 20 μg of protein were denatured by boiling for 5 min in sample buffer, separated by SDS-PAGE (polyacrylamide gel electrophoresis) in 10% acrylamide gels and electro-transferred to a polyvinylidene difluoride (PVDF) membrane (Merck) using transfer buffer (Tris 25 mM, pH 8.5; glycine 193 mM; methanol 20%). The membranes were blocked for 1 h in blocking buffer Tris-buffered saline containing Tween-20 [TBS-T] 0.1%) with bovine serum albumin (BSA) 2%. Thereafter, the membranes were incubated for 2 h with primary anti-Akt (1:1000), anti-phospho-Akt (1:1000), or anti-β-actin (Cell Signaling Technology, Danvers, Massachusetts, USA). After washing five times for 5 min with TBS-T, the blots were incubated with rabbit anti-mouse (Cell Signaling) diluted at 1:2000 for 2 h. Antibody binding was detected with the SuperSignal West Dura Extended Duration Substrate solution (Thermo Scientific). The bands were analyzed using the ImageJ software (National Institute of Health, Bethesda, MD, USA), using the anti-actin signal for data normalization.

2.4. Animals

Male C57BL/6J mice (8–10 weeks old) obtained from our animal facility were used. All experiments followed the guidelines of the National Institutes of Health Guide for the Care and Use of Laboratory Animals, and experimental protocols were reviewed and approved by the Ethical Committee for the Care and Use of Laboratory Animals (Permit No. 008/2016) of the FM-UAEM. The mice were housed in four groups of five animals each and kept in the animal house of the Faculty of Medicine of the Universidad Autónoma del Estado de Morelos under pathogen-free conditions, constant temperature (21–23 °C) and humidity (45–50%), with a 12-h light/dark cycle. The experiments were repeated three times. ED was established during the first 10 weeks of the experiment. Once the blood pressure (BP) of the mice increased by 15% or more from baseline values (systolic or diastolic), the animals were considered as hypertensive. All treatments were administered for the next 10 weeks of the experiment. The control group was given saline solution only, and the other three groups were treated daily with Ang-II (0.1 μg/kg) via intraperitoneal injection throughout the experiment [10]. One treated group was left as control, receiving only Ang-II; another was treated p.o. with Losartan (10 mg/kg/day), and the last group was orally administered with C4 (19 mg/kg of SF1 y 6.7 mg/kg of SF3) diluted in water. The amount of each fraction was determined based on a previous pilot test in which the effect of 50 mg/kg of the hydroalcoholic extract, or the ethyl-acetic or aqueous fractions was evaluated in an ED murine model (data not shown) and the yield of SF1 and SF3 per gram of the aqueous fraction. At the end of the experiment, the mice were killed by CO2 inhalation and exsanguinated.

2.5. Blood pressure measurement

Systolic blood pressure (SBP) and diastolic blood pressure (DBP) were measured in mice under surgical anesthesia (Xylazine, 10 mg/kg, i.p.) using a noninvasive blood pressure system (LE5002 system, Panlab, Barcelona, Spain) by the tail-cuff method. BP was reported as the average of seven successive measurements.

2.6. Organ retrieving

After the last BP measurement, the mice were perfused with cold PBS under surgical anesthesia (sodium pentobarbital, 30 mg/kg, i.p.). Then, the blood, liver, kidneys, and aortas were obtained.

2.7. Biochemical analysis of plasma and liver

Plasma samples were obtained by centrifugation of heparinized whole blood at 1000 × g for 10 min and stored at −80 °C for further analysis. Creatinine, urea, and uric acid levels were measured with commercial assay kits (Química Clínica Aplicada, S.A., Spain), following the manufacturer’s instructions. Livers were weighed and then macerated with ice-cold PBS (1:10 w/v). The suspensions were centrifuged at 1000 × g for 8 min at 4 °C, and the supernatants were used to quantify triglycerides and glucose, using commercial assay kits (Química Clínica Aplicada, S.A.).

2.8. ELISA

Kidneys were weighed and frozen at −80 °C until used. The organs were macerated with ice-cold PBS-PMSF (0.1%) 1:5 w/v. The suspensions were centrifuged, and supernatants were recovered and frozen at −80 °C until used. Various ELISA kits were used to determine cytokine concentrations, following the manufacturer’s instructions. OptEIA Mouse IL-1β, IL-6, TNF-α and IL-10 ELISA kits were purchased from BD (Franklin Lakes, NJ, USA), whilst mouse TGF-β ELISA kit were purchased from Applied Biosystems (Foster City, CA, USA). Briefly, 96-well flat-bottomed ELISA plates were coated with the respective capture antibody and incubated overnight at 4 °C. Non-specific binding sites were blocked by incubating for 1 h at RT with PBS-1% BSA. Aqueous kidney extracts were added and incubated for 2 h at RT. Then, the plates were incubated with the corresponding detection anti-cytokine-HRP antibodies for 1 h at RT. Bound complexes were detected with the substrate tetramethylbenzidine after 30 min of incubation in the dark. The reaction was stopped with H2SO4 2N and absorbance was measured at 450 nm at 37 °C in a VERSAmax ELISA plate reader (Molecular Devices). Cytokine concentration was calculated with standard curves for each cytokine and reported as pg/mg protein.

2.9. Histopathology

Kidneys, aortas, and livers were fixed in buffered formalin (PBS, 10% formaldehyde, pH 7.0). Then, the tissues were dehydrated and embedded in paraffin. Tissue sections (5 μm) were transferred to poly-L-lysine-coated slides (Sigma), deparaffinized, and rehydrated. For histopathological studies, the slides were stained with either the hematoxylin-eosin or Masson trichrome stain. All slides were observed under an ECLIPSE 80i microscope (Nikon, Tokyo, Japan) and analyzed with the software Metamorph v.6.1. (Molecular Devices, San Jose, CA, USA).

2.10. Statistical analysis

Data are reported as mean ± standard error (SE). Data were analyzed using the software InStat (GraphPad, San Diego, CA, USA). Significant differences among conditions were determined by ANOVA and the post-hoc Tukey’s test, with a significance value of p < 0.05.

3. Results

3.1. C4 regulates blood pressure

An increase in BP is one of the most evident consequences of ED [3]. The kinetics of systolic (SBP, Figure 1A) and diastolic BP (DBP, Figure 1B) is shown in Figure 1. After 10 weeks of Ang-II administration, SBP increased (p < 0.05) by 22.2% (141.5 ± 3.4 mmHg), whilst DBP increased by 29.9% (78.4 ± 2.9 mmHg) with respect to the control group (SBP, 117.3 ± 2.9 mmHg; DBP 60.3 ± 3.3 mmHg) (p < 0.05). After five weeks of treatment with Losartan, both pressure values decreased significantly (p < 0.05) with respect to experimental week 10, recovering the level of the control group. On the other hand, both pressure values gradually decreased in mice receiving C4; after 5 weeks of treatment, the animals still showed significantly higher BP values with respect to the control group (9.2% and 13.5% higher in SBP and DBP, respectively). However, C4 treatment decreased both blood pressure values to levels comparable to the control group after 10 weeks of treatment. In contrast, the Ang-II group showed BP values 19.9% (SBP) and 27.8% (DBP) higher than those in the control group.

3.2. C4 stimulates Akt phosphorylation and NO production

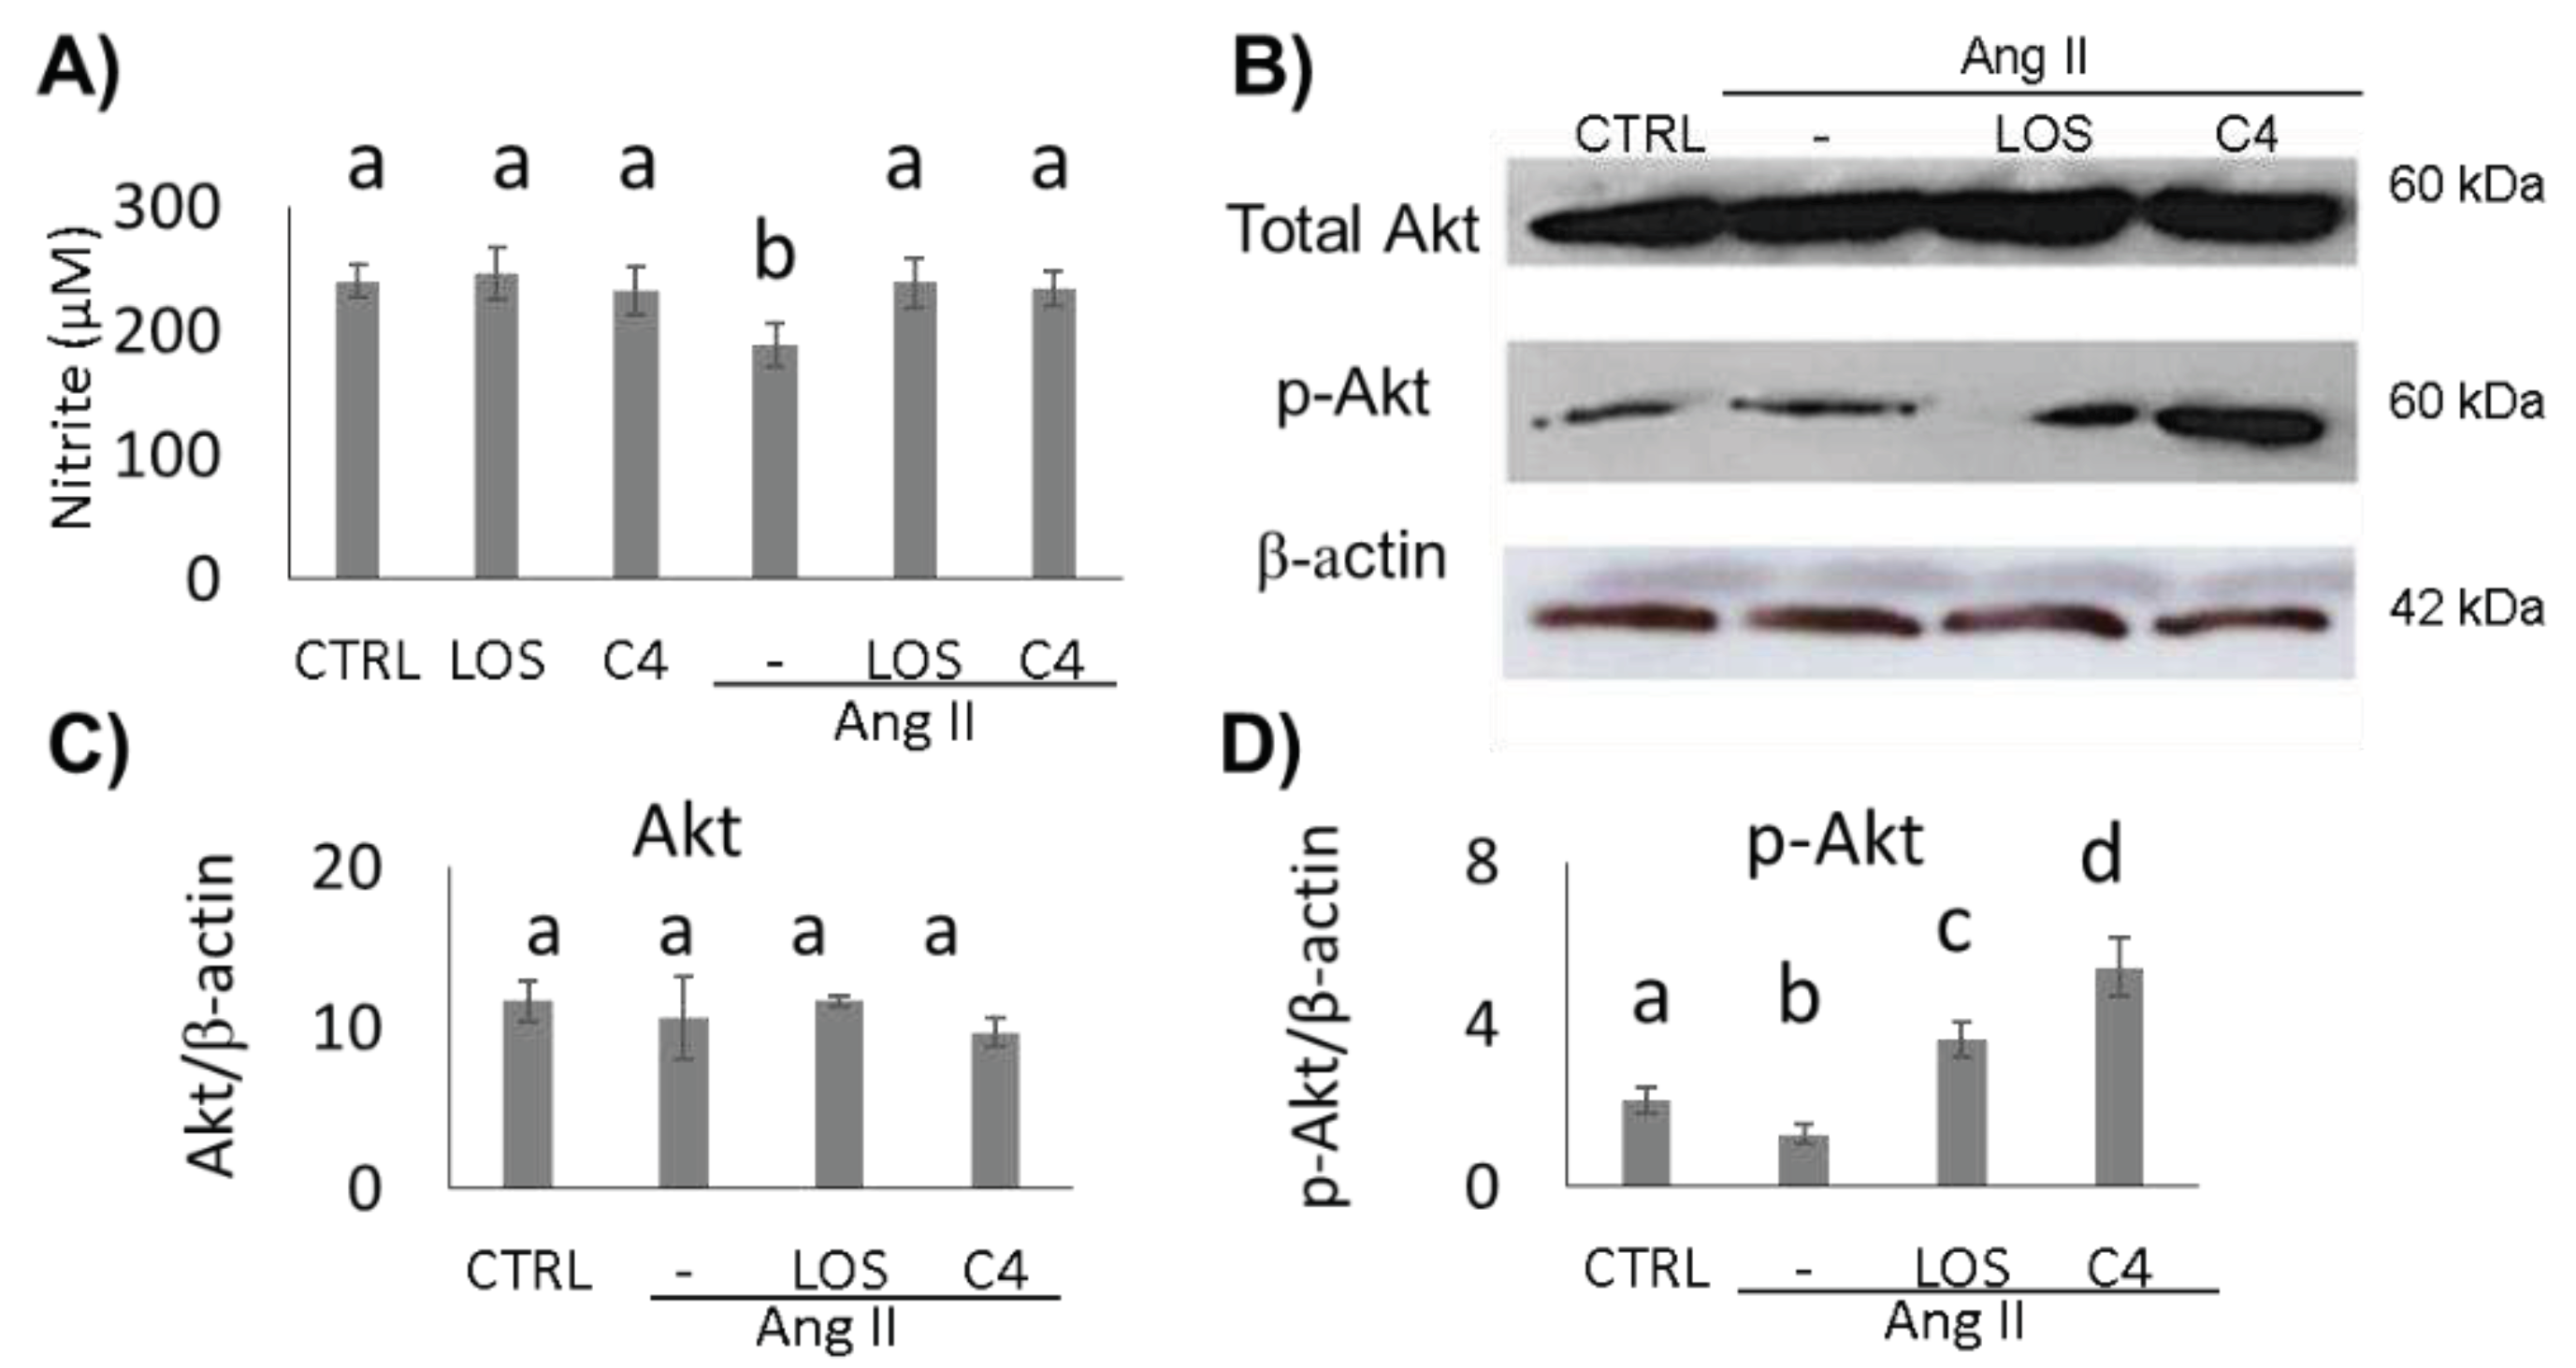
To determine whether the effect of C4 on blood pressure was linked to both increased NO bioavailability and Akt phosphorylation status, these parameters were analyzed in HMEC-1 endothelial cells cultured in the presence of Ang-II, plus either C4 or Losartan, for 24 h. On one hand, treatment with Ang-II decreased NO production by 22.4% (p < 0.05), whereas treatment with Losartan or C4 prevented this decrease (Figure 2A) despite the continued presence of Ang-II. No changes in this parameter were observed in control cells cultured with C4 or Losartan. NO is produced from arginine by eNOS, an enzyme that is activated by Akt, a serine-threonine kinase [15]. To determine the mechanism by which C4 prevents the decrease in NO levels, phosphorylated Akt expression was measured. Our results indicate that basal levels of total Akt remain unchanged regardless of treatment (Figure 2B–C). However, Losartan increased Akt phosphorylation by 71% (p < 0.05), whereas C4 increased it even more (156%, p < 0.05) (Figure 2B and D).

3.3. C4 reverses vascular remodeling

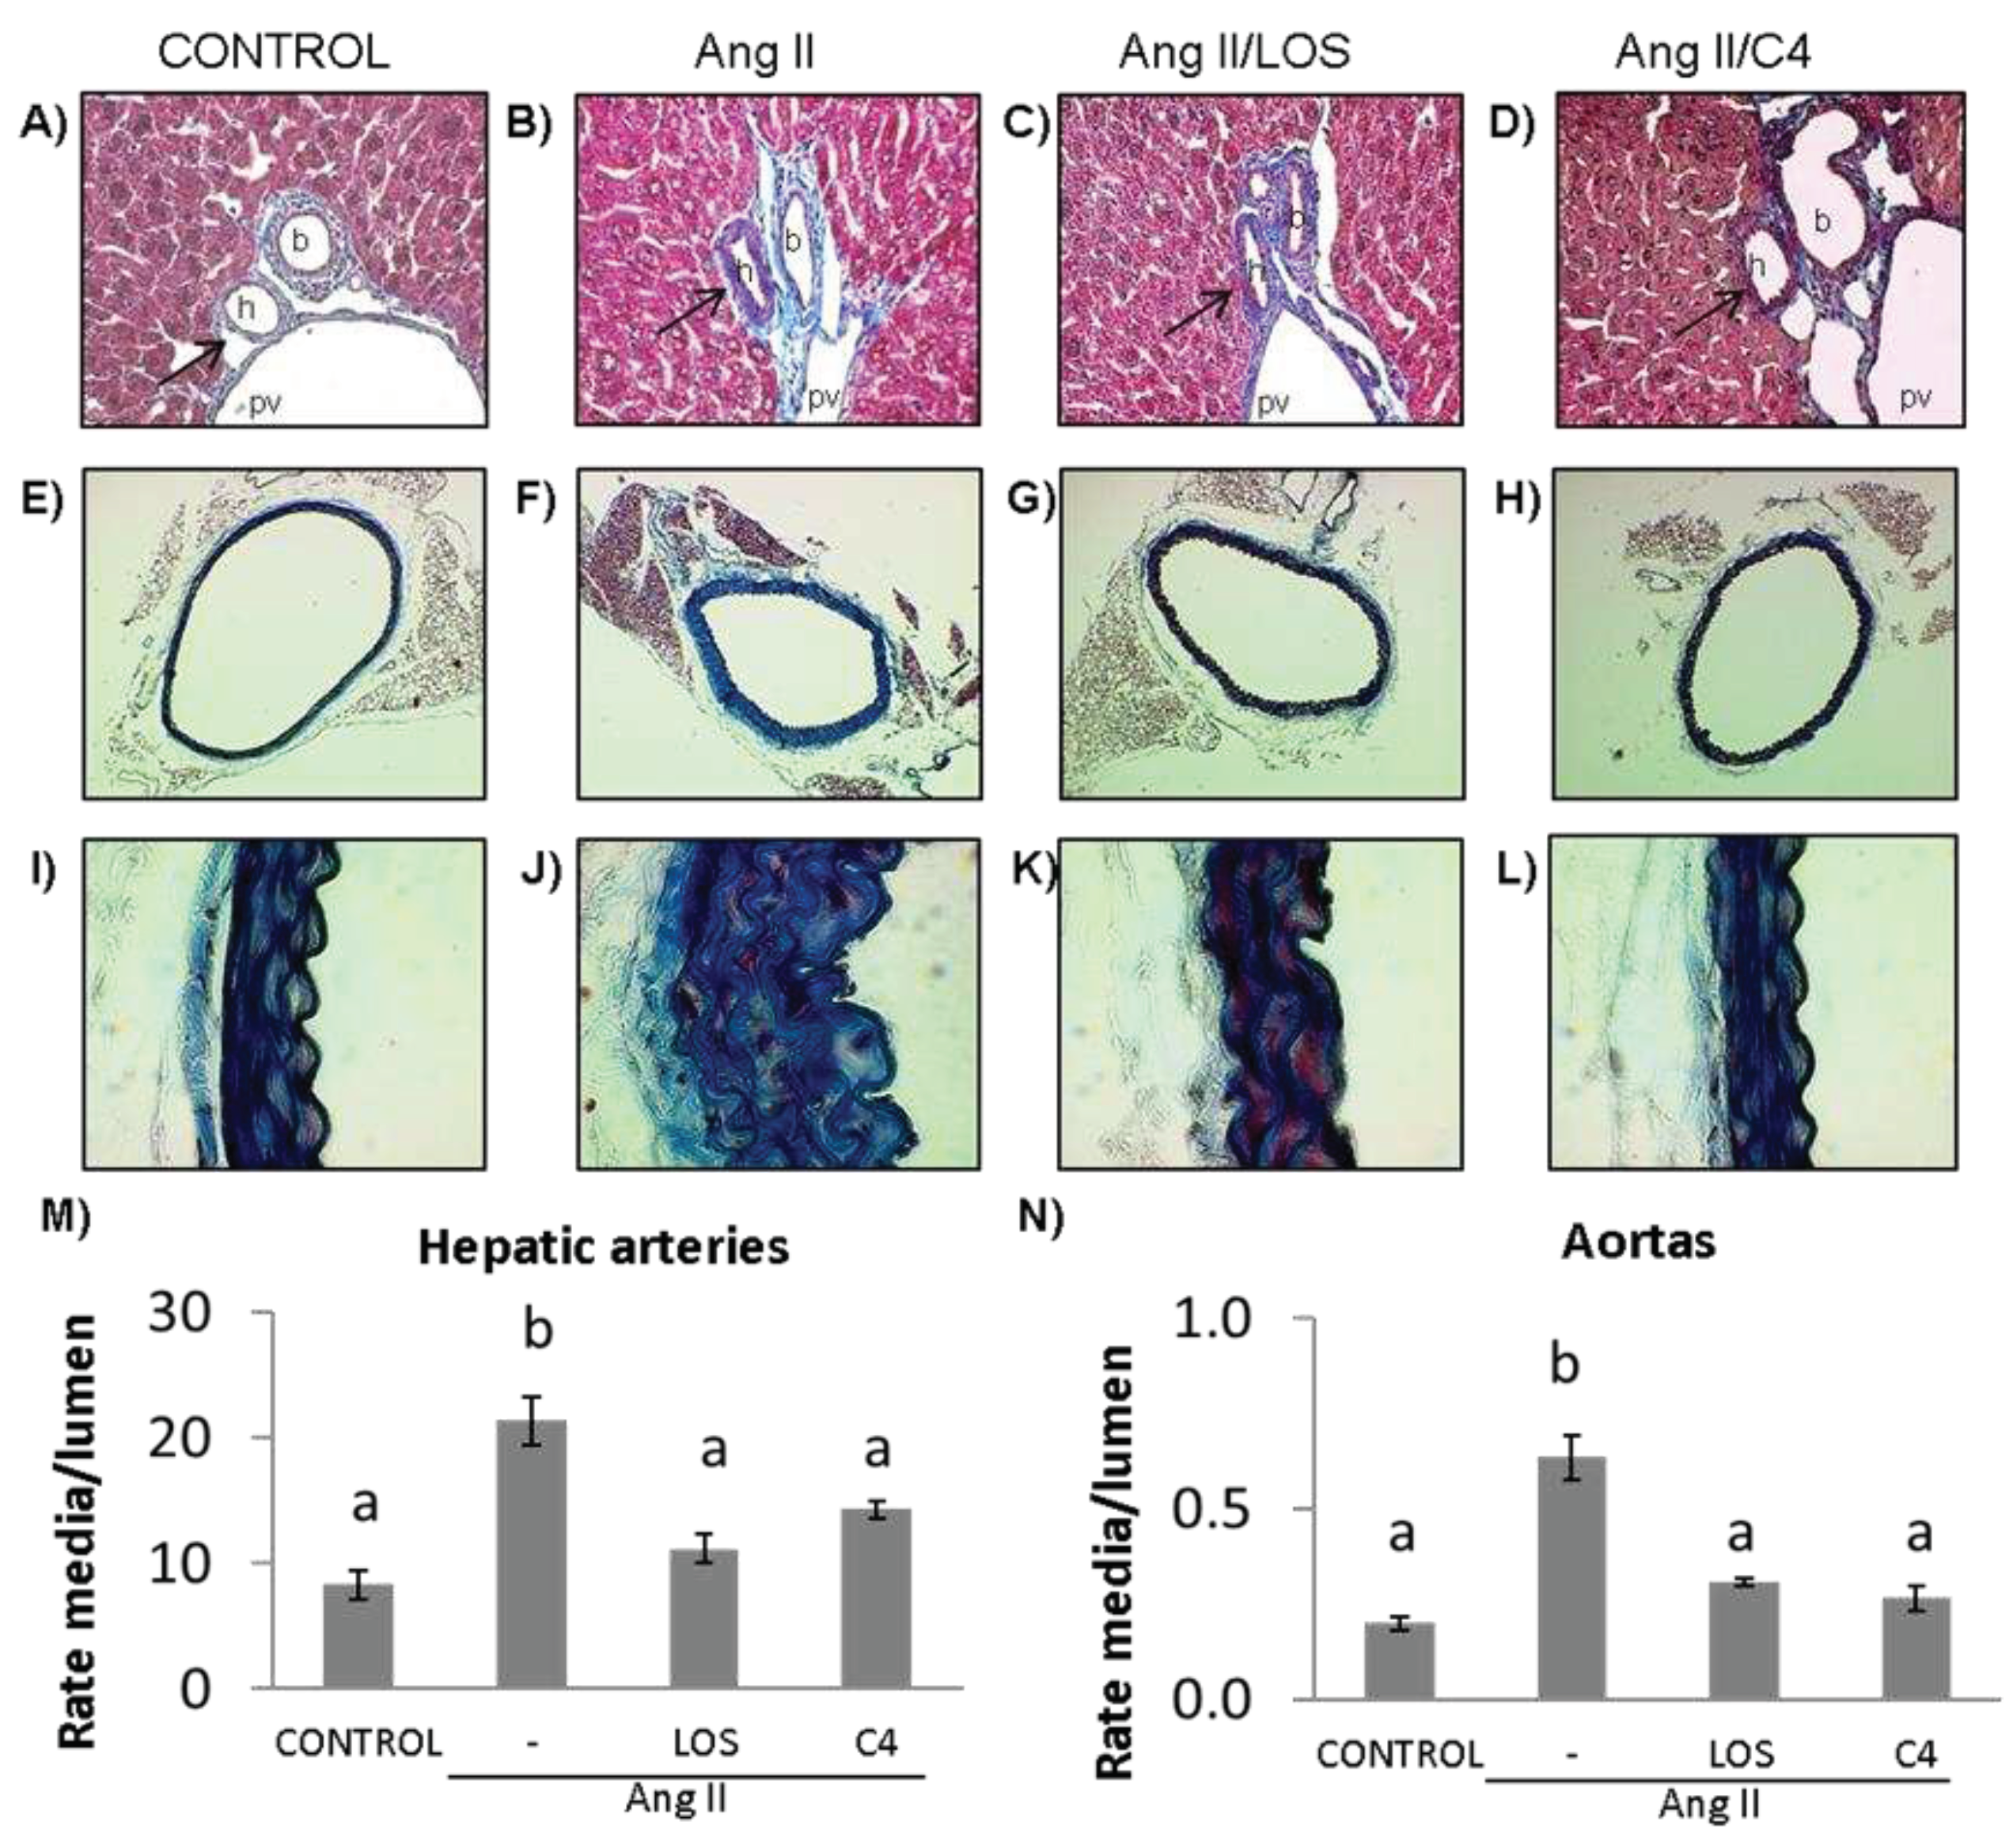
A key effect of reduced NO bioavailability is the proliferation of VSMCs, which increases the thickness of blood vessel walls, decreasing their lumen [16] and contributing to hypertension. Our results show that Ang-II promoted the thickening of the tunica media of both small (hepatic arteriole) (Figure 3B, 3M) (156%) (p < 0.05) and large arteries (aorta) (Figure 3F, 3J, 3N) (200%) (p < 0.05) with respect to the control group (Figure 3A, 3E, 3I, 3M, and 3N). Both losartan (47.4% and 53.2%, respectively) (Figure 3C, 3G, 3K, 3M and 3N) and C4 (43.9% and 59.4%, respectively) decreased this effect (p < 0.05) (Figure 3D, 3H, 3L, 3M and 3N), returning this parameter to values similar to the control group.

3.4. C4 modifies the inflammatory environment

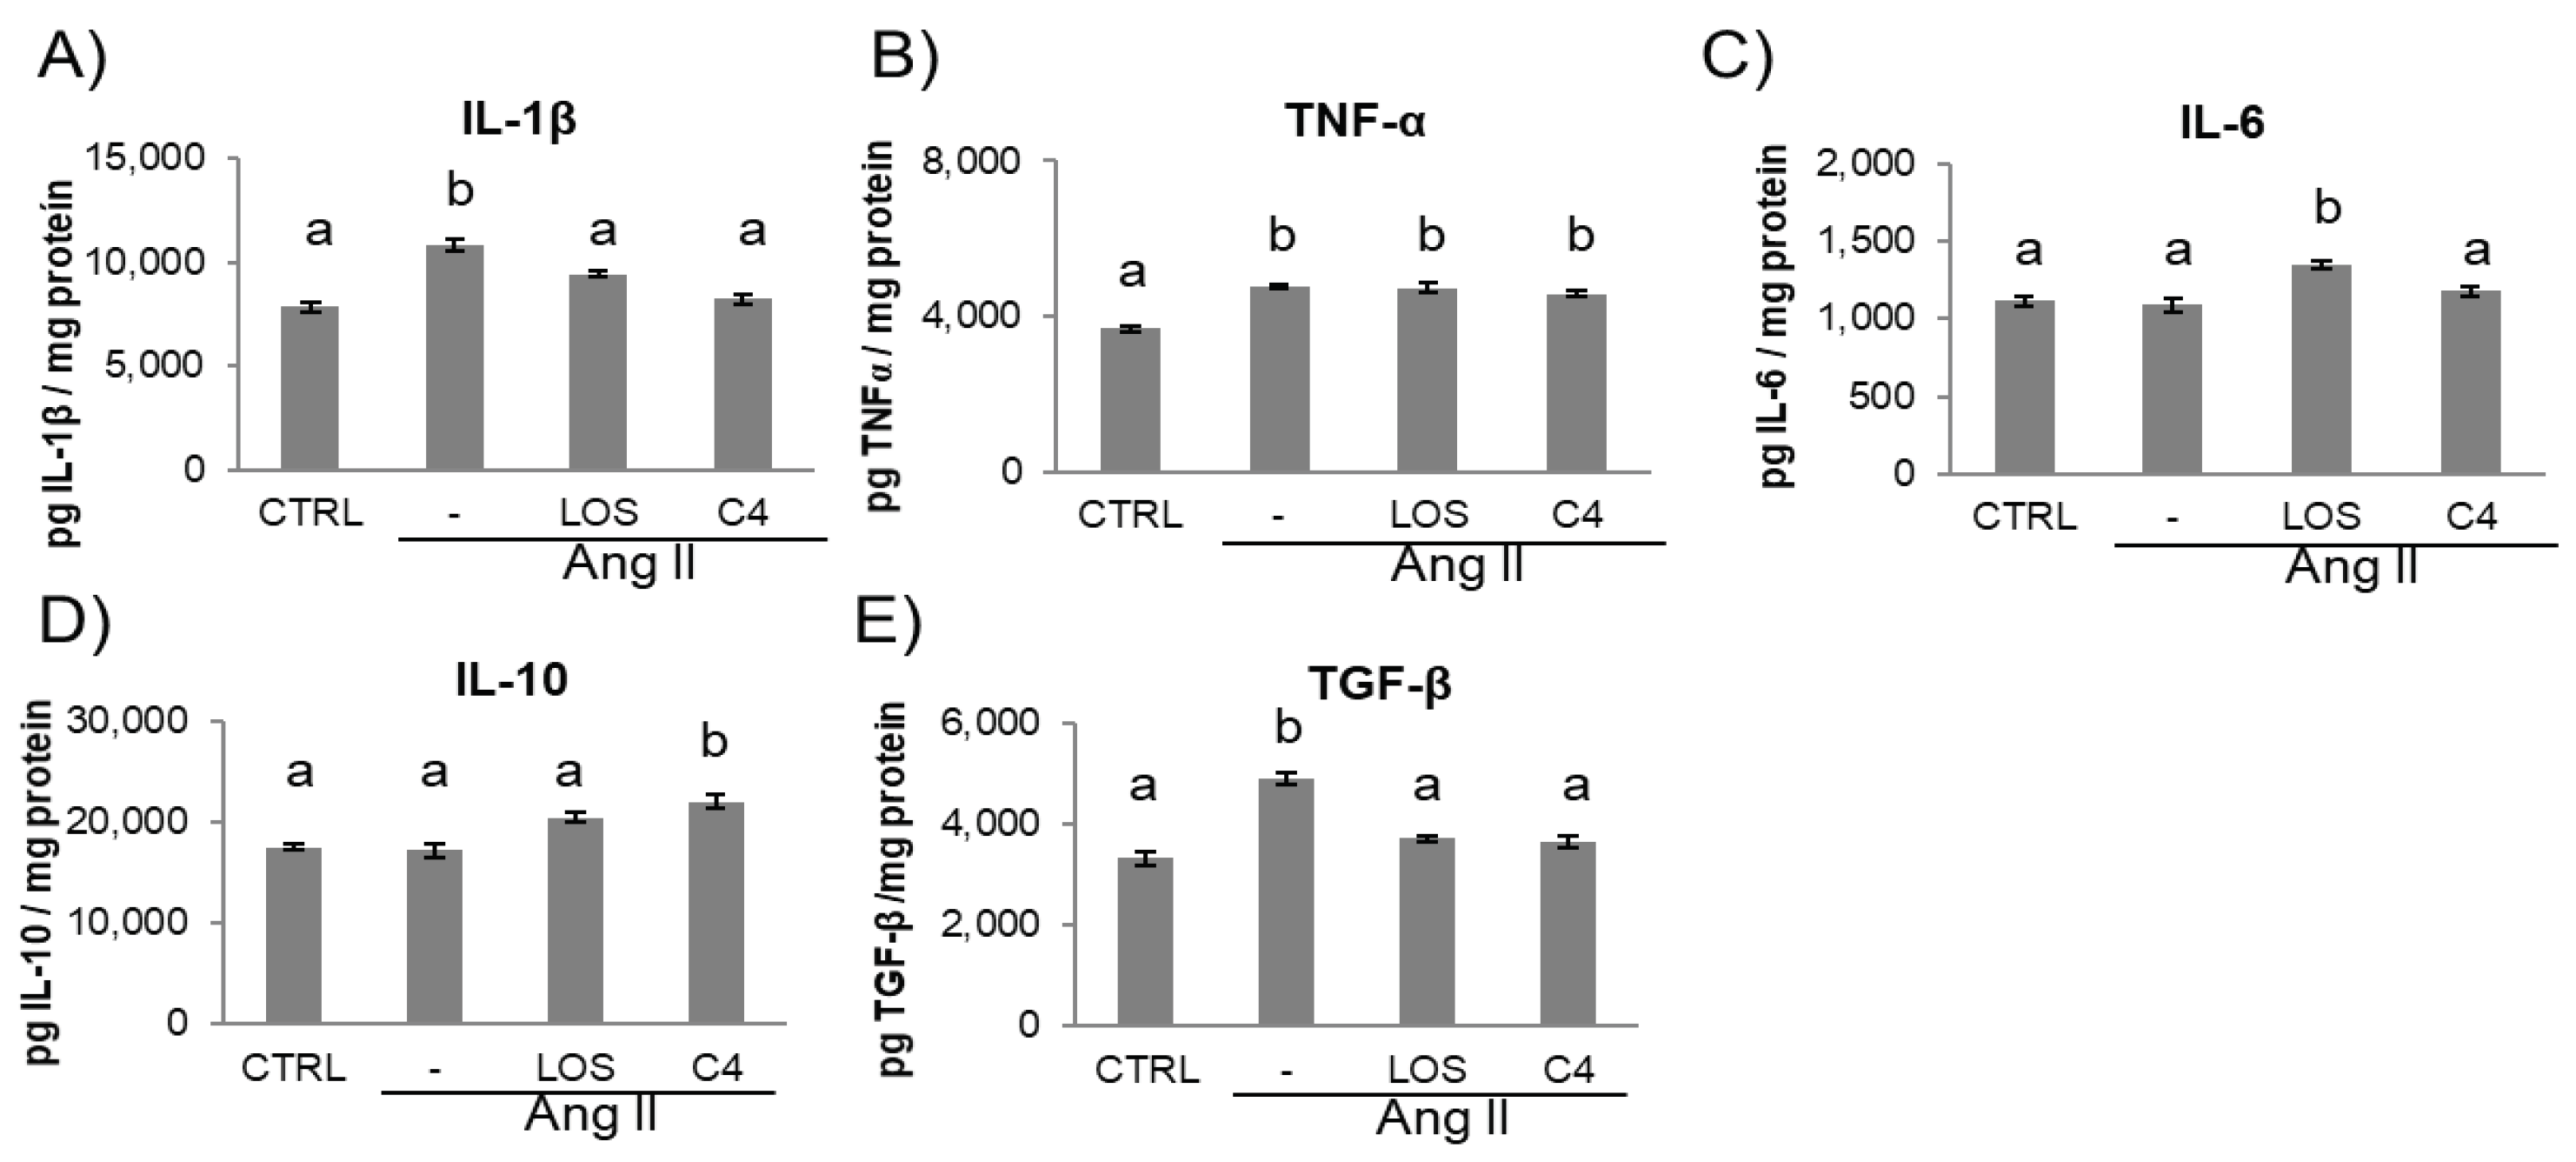
Ang-II leads to a chronic, low-grade synthesis of proinflammatory cytokines such as IL-1β, IL-6 and TNF-α in the vascular wall, which impairs endothelial function [17]. To probe the inflammatory environment, these cytokines were quantified by ELISA in the kidney, which is a target organ of ED. As shown in Figure 4, Ang-II increased (p < 0.05) the production of IL-1β (Figure 4A), TNF-α (Figure 4B) and TGF-β (Figure 4E), while keeping IL-6 and IL-10 levels unchanged (Figure 4C–D). Both losartan and C4 controlled the increase in IL-1β (Figure 4A), returning it to levels similar to those of the control group. However, both treatments failed to control the increase in TNF-α (Figure 4B). On the other hand, only C4 caused a significant increase in IL-10 levels (Figure 4E), whereas both C4 and Losartan reduced TGF-β concentration to control levels (Figure 4E).

3.5. C4 ameliorates kidney damage

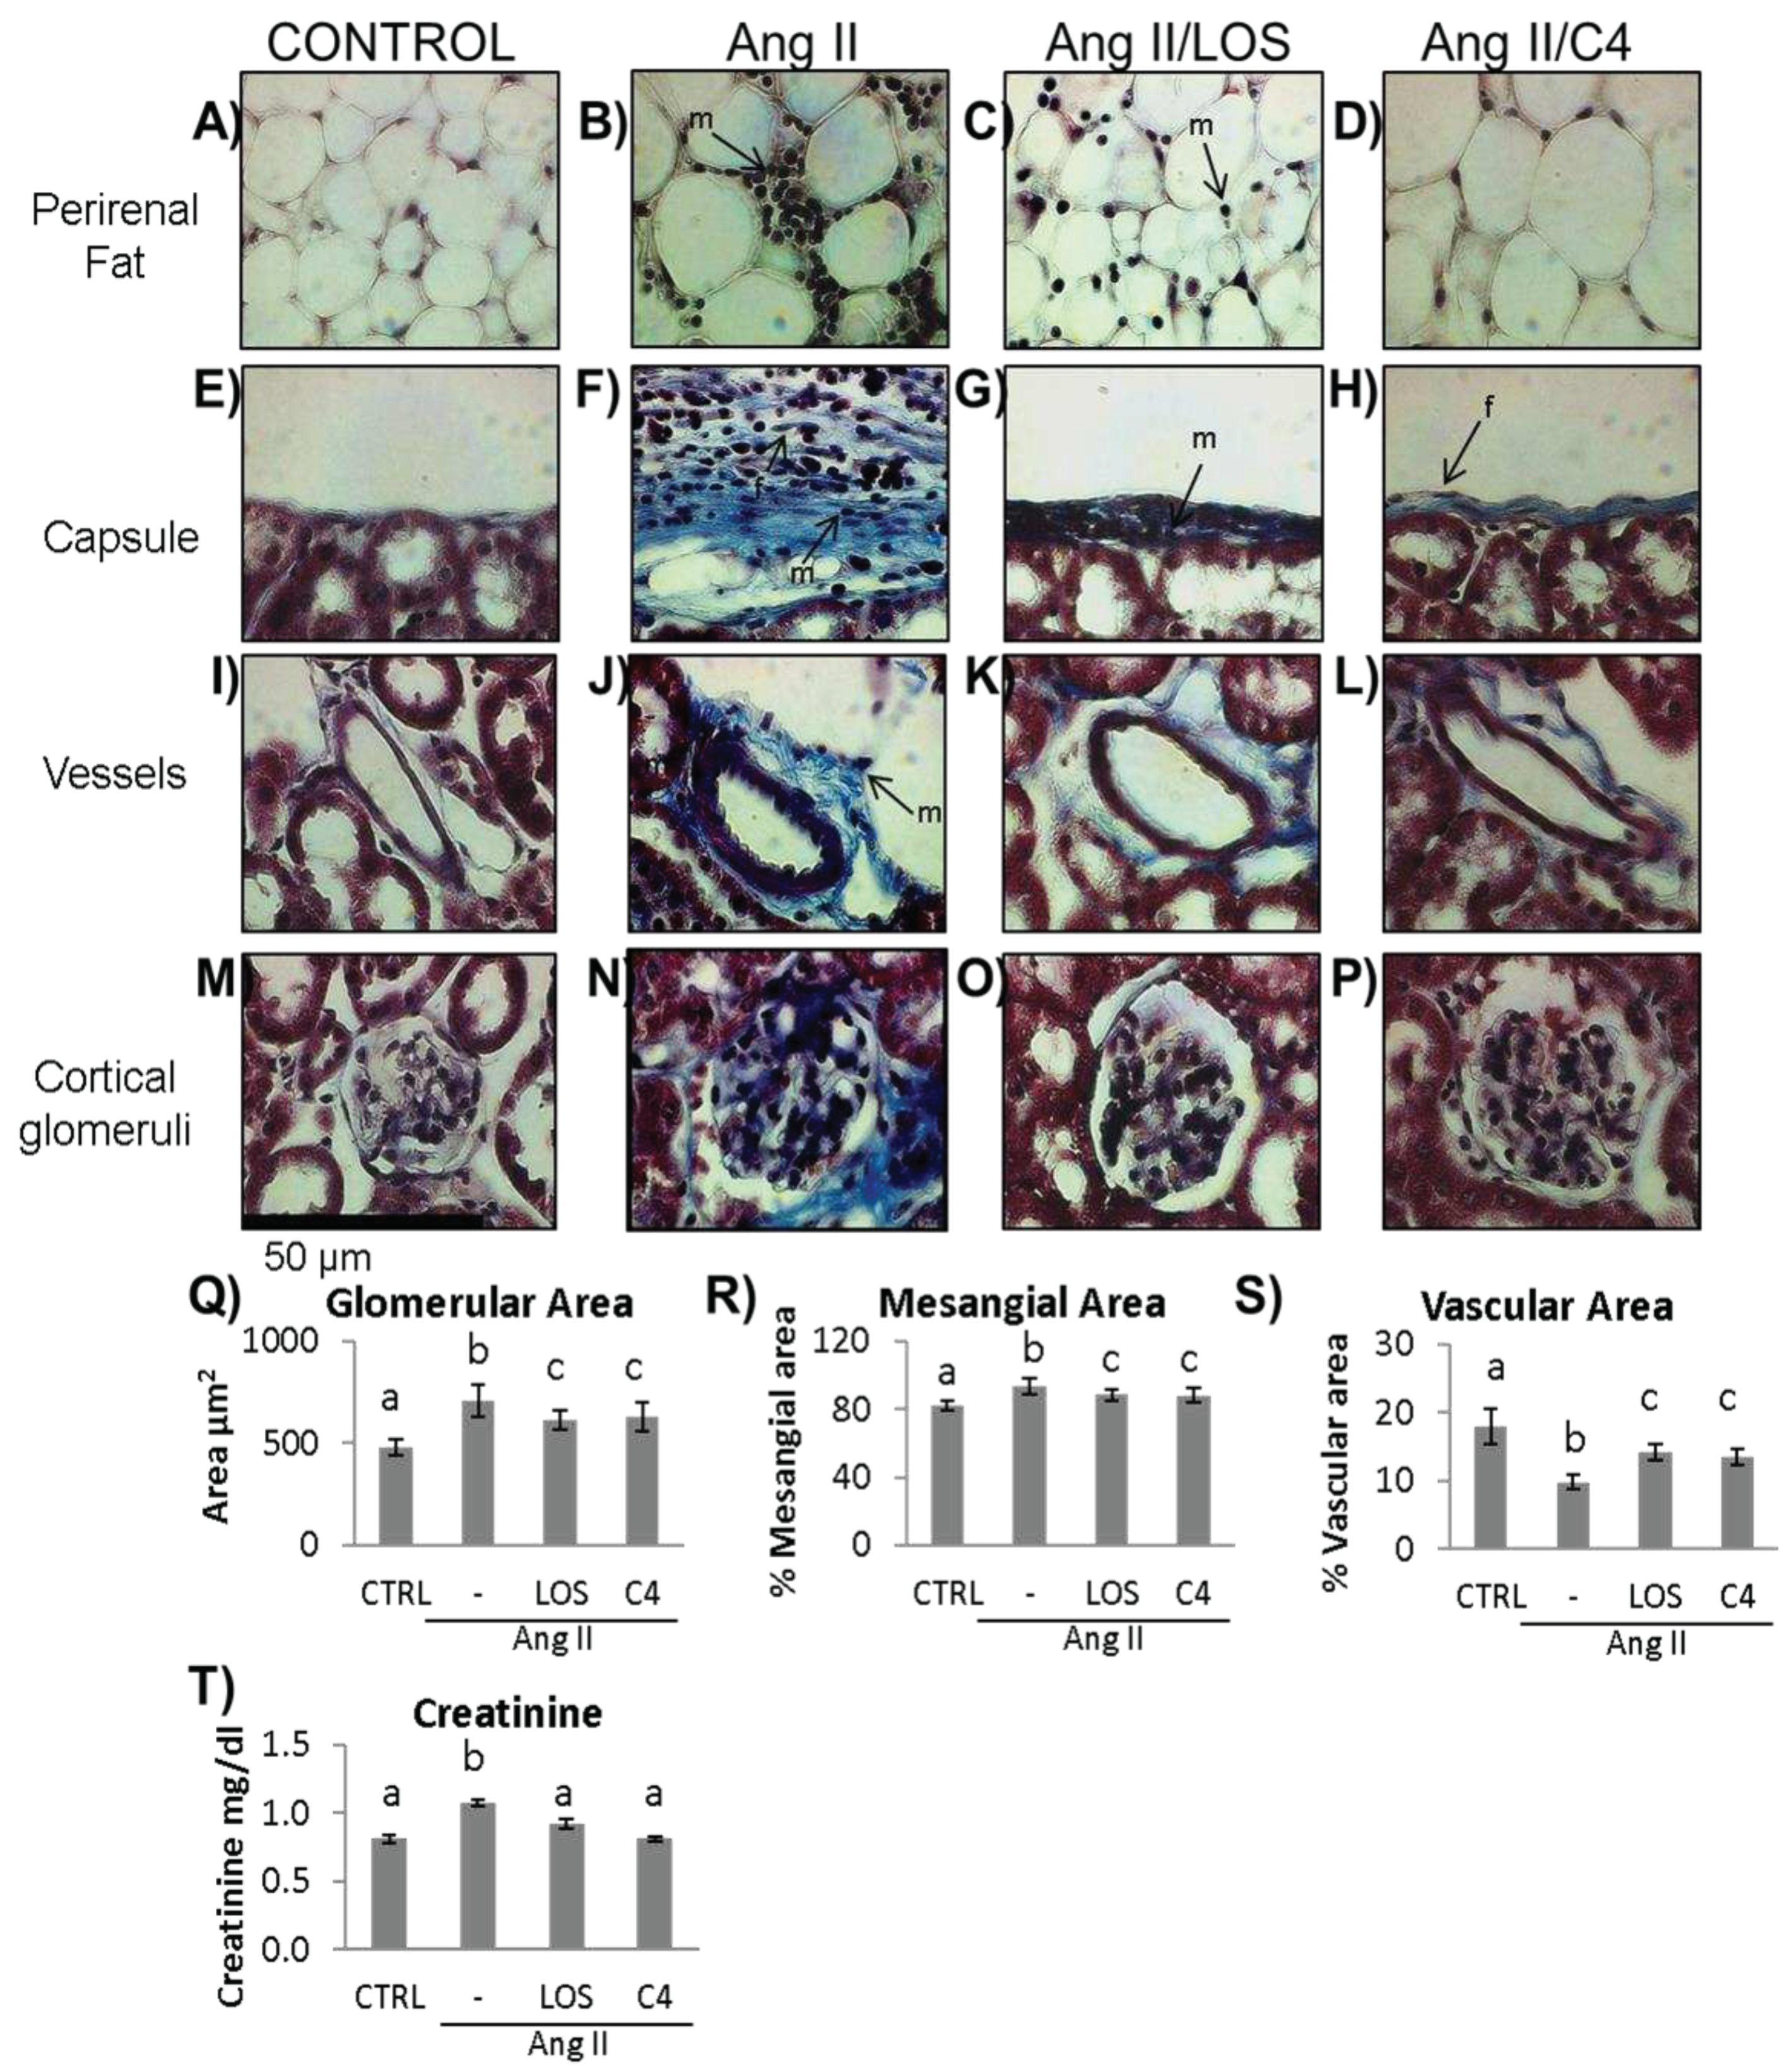
To determine whether C4 reversed the renal damage due to Ang-II-related ED, both renal function (as measured by creatinine serum levels) and the histopathological condition of kidneys were analyzed. Mice were anesthetized at week 20, and peripheral blood and organs were obtained. The condition renal in the experimental groups is shown in Figure 5. As shown, Ang-II induced mononuclear cell infiltration in perirenal fat (Figure 5B), in the renal capsule (Figure 5F), and in the connective tissue the microvasculature (Figure 5J). In these last two structures, thickened vascular walls due to collagen fibers are seen, related to the presence of fibroblasts. Finally, Ang-II induced glomerular hypertrophy (Figure 5N and 5Q), collagen deposits around glomeruli (Figure 5N), decreased glomerular capillary lumen (Figure 5R), and increased mesangial area (Figure 5S). Both Losartan and C4 decreased the amount of cellular infiltrate in perirenal fat and renal capsule (Figure 5C, D, G, and H). C4 restored both structures to conditions similar to the control group (Figure 5A, E). On the other hand, both C4 and Losartan decreased renal capsule thickness (Figure 5H and G, respectively), as the amount of collagen fibers and fibroblasts was reduced. With respect to the microvasculature, both Losartan (Figure 5K) and C4 (Figure 5L) regenerated the vessels, bringing them back to conditions comparable to the control group (Figure 5I). Finally, C4 reduced glomerular hypertrophy (Figure 5P and Q) and mesangial expansion (Figure 5R); it also improved glomerular capillary (Figure 5S) to a similar extent as Losartan.
To assess renal function in Ang-II-treated mice, serum creatinine was quantified. As shown in Figure 5T, Ang-II increased creatinine levels (p < 0.05), which then were reduced to values similar to controls by both Losartan and C4, indicating that both treatments restored renal filtration.

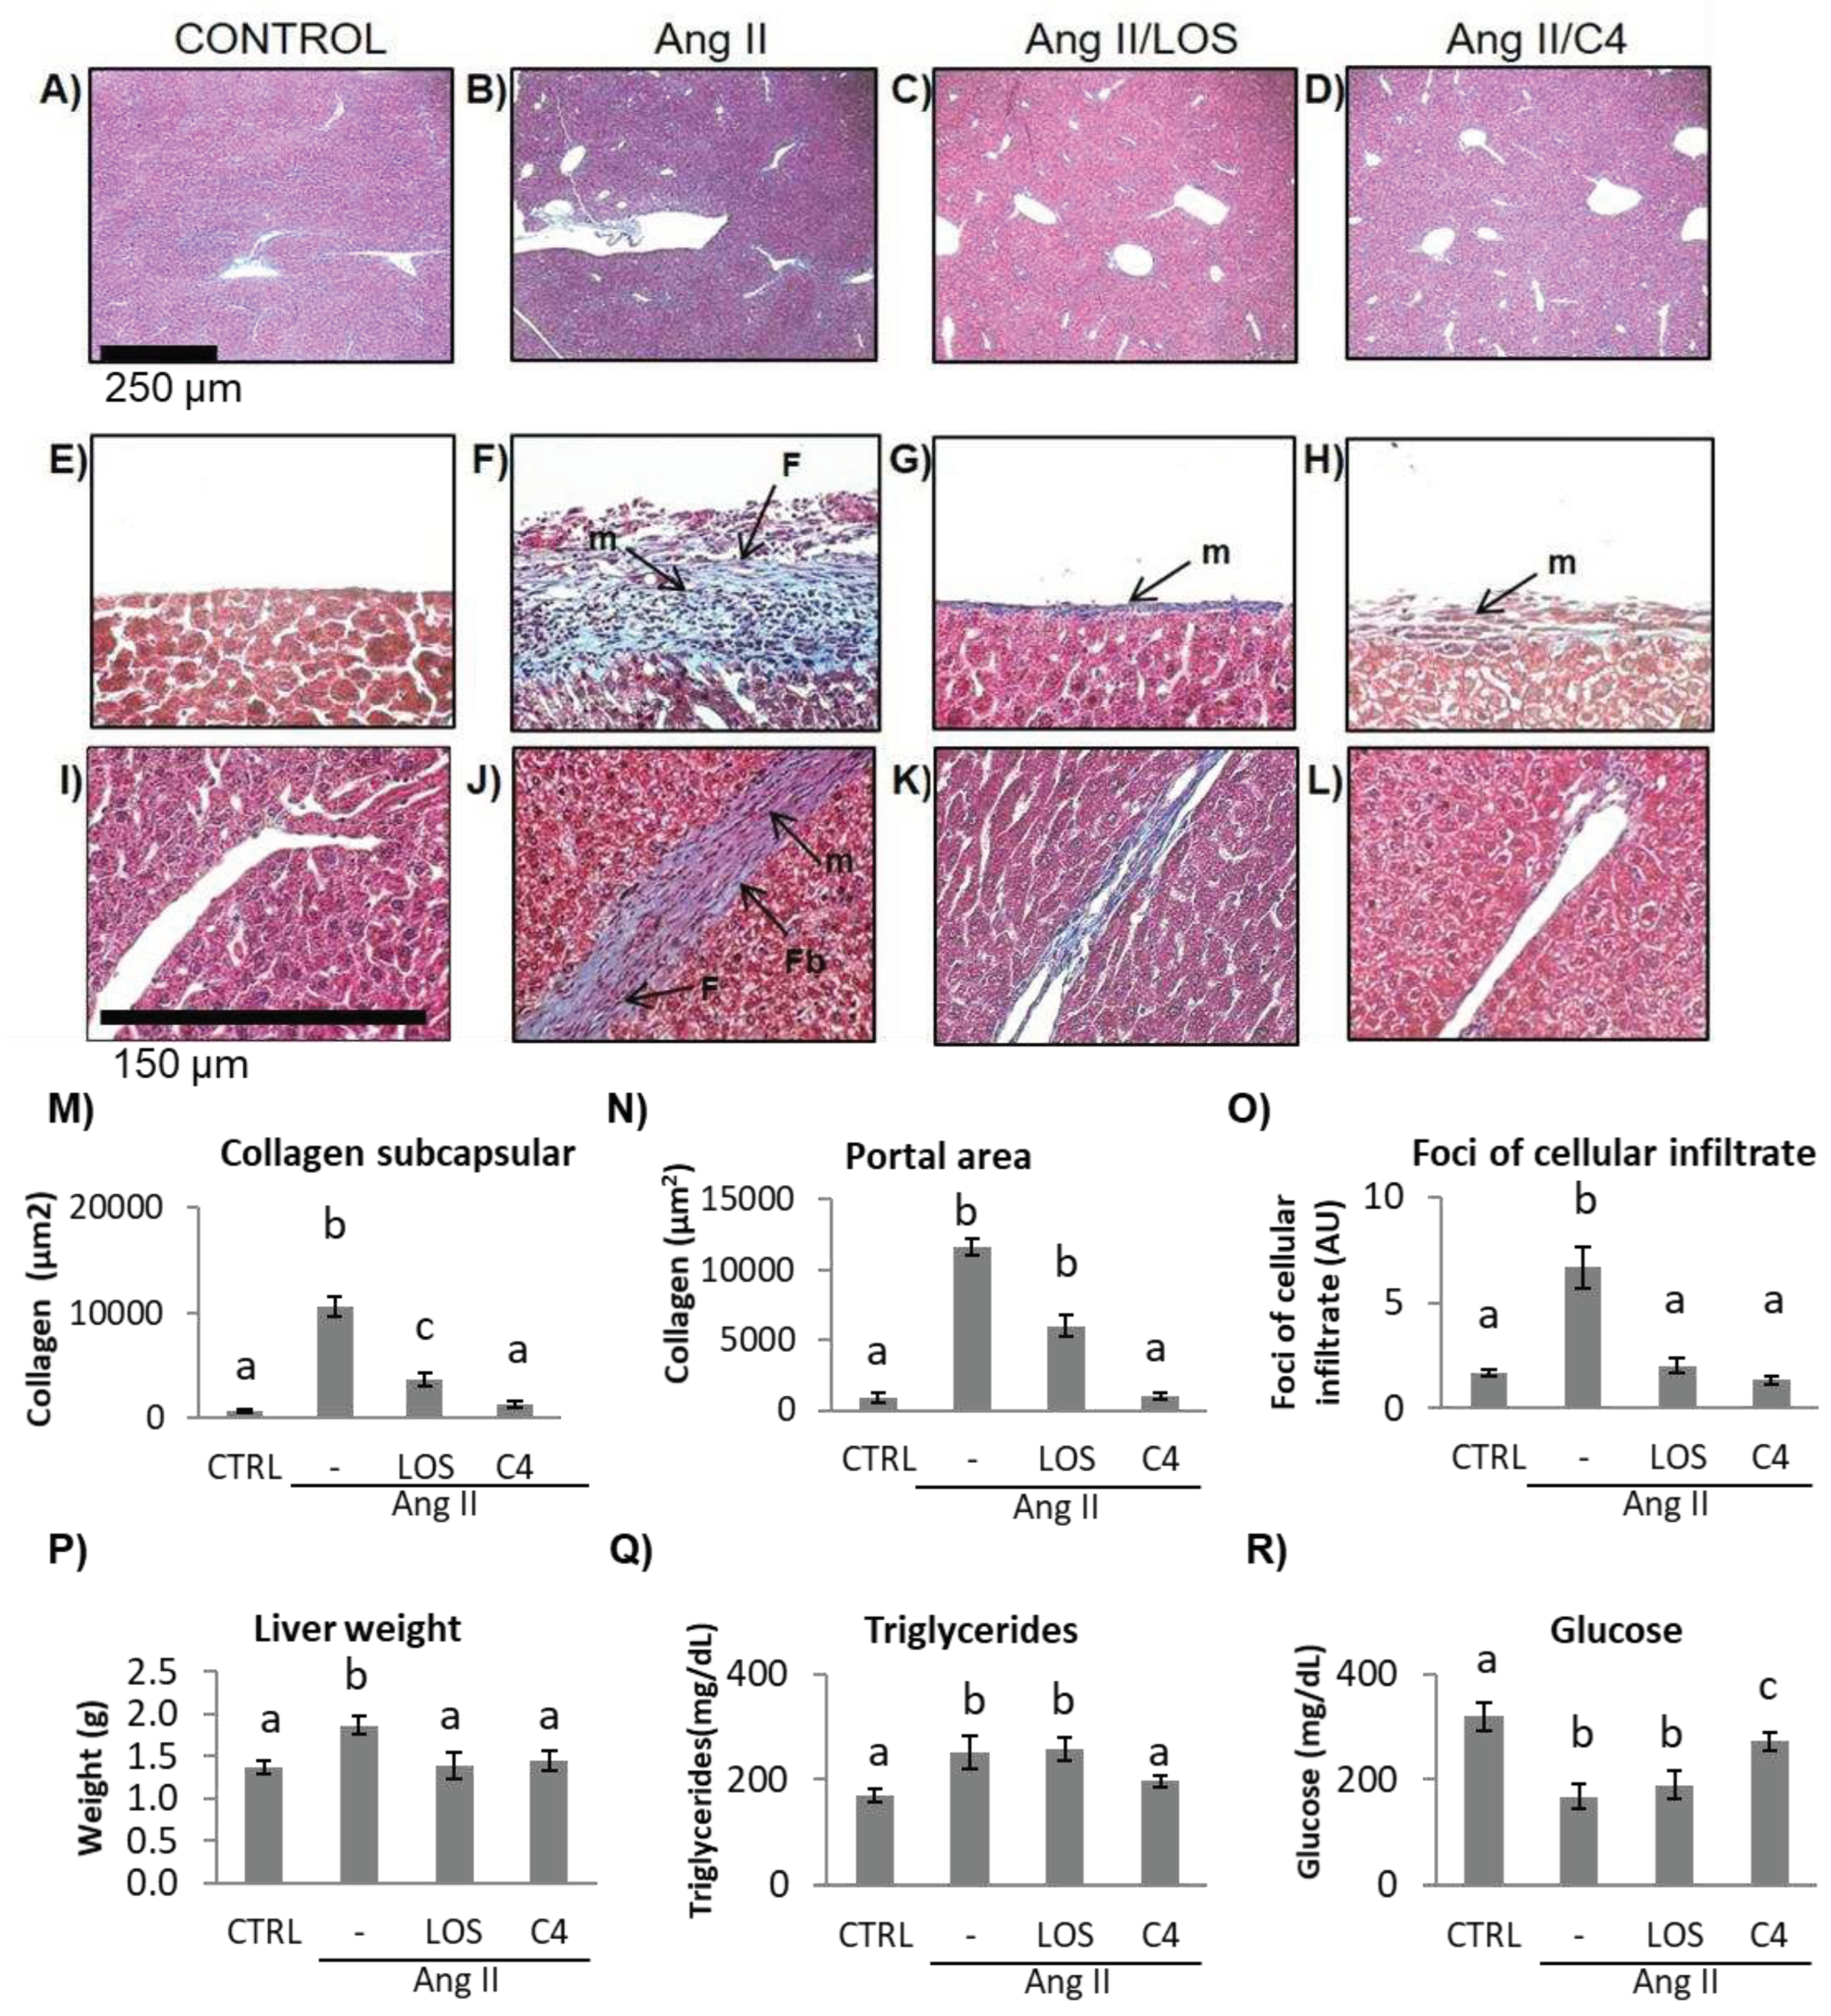
3.6. C4 ameliorates liver damage

ED, which is characterized by a low bioactivity of NO in the hepatic circulation (due to the combined effect of a reduced bioavailability of NO and its accelerated degradation by reactive oxygen species), has been reported to cause liver damage [18]. In a murine model of Ang-II-induced ED, we observed that not only the kidney but also the liver was damaged [10]. Since C4 prevented kidney damage, liver status was assessed by histopathological studies, organ weight, and triglyceride and glucose concentrations. As shown in Figure 6, mice from all groups developed fatty liver (Figure 6A–D). In Ang-II-treated animals, thickening of Glisson’s capsule (Figure 6F) and trabeculae (Figure 6J) due to deposition of collagen fibers (Figure 6M, N) was observed (p < 0.05), as well as infiltration of fibroblasts, fibrocytes, and mononuclear cells such as lymphocytes and macrophages. Our results indicate the chronicity of the inflammatory state and the ongoing repair process. Treatment with C4 (Figure 6D, H, L, M, N) reversed these parameters, as did Losartan (Figure 6C, G, K, M, N), returning them to a state similar to the control group (Figure 6A, E, I). On the other hand, Ang-II induced hepatomegaly, triglyceride accumulation, and cellular infiltrate foci formation (Figure 6O-Q) (p < 0.05), in addition to lower glucose accumulation (Figure 6R) (p < 0.05). Both Losartan and C4 prevented cellular infiltrate foci formation (Figure 6O) and hepatomegaly (Figure 6P) (p < 0.05), but only C4 reversed triglyceride accumulation (Figure 6Q) (p < 0.05); while C4 failed to normalize glucose concentrations, these were significantly increased with respect to the animals treated with Ang-II only and Ang-II/Losartan (Figure 6R).

4. Discussion

Endothelial dysfunction is characterized by sustained vasoconstriction, VSMC hyperproliferation, oxidative stress, and a proinflammatory, prothrombotic status [3]. A major cause of ED is a decreased bioavailability of NO, since this small molecule regulates various activities of the endothelium, including the control of vascular tone, platelet aggregation, endothelial permeability, and neoangiogenesis (Laccarino et al., 2004). NO is produced in endothelial cells by eNOS. In turn, this enzyme is positively regulated by the serine/threonine kinase Akt; thus, this kinase is a key control point for eNOS activation and endothelial dysfunction [6,19] and a clear therapeutic target. In this work, it was shown that C4 treatment induced Akt activation and NO production in dysfunctional endothelial cells (Figure 2). This effect could be due to the presence in C4 of glycine, arginine, and aspartic acid, the main constituents of SF1 and SF3 [14]. Glycine has been reported to increase Akt phosphorylation while decreasing the expression of its negative regulator PTEN [20-21]. Glycine also increases the expression of eNOS mRNA and the enzyme itself [22-23]. On the other hand, arginine, in addition to being the substrate of eNOS, can stimulate the phosphatidylinositol-3-kinase (PI3K)/Akt pathway, favoring eNOS activation, NO production and its vasodilator effects, thus improving endothelial function [24-26]. Finally, while aspartic acid is not directly involved in NO synthesis, this amino acid can be converted to argininosuccinate by argininosuccinate synthetase, and then to arginine by argininosuccinate lyase; therefore, increased substrate availability for eNOS favors NO production [27]. By increasing the bioavailability of NO, C4 may offset several pathologic features of ED. Although mice continuously received Ang-II stimulation, vascular remodeling was significantly improved in our study (Figure 3). In addition to the effects of glycine, arginine and aspartic acid on Akt activation and NO availability, this finding could also be due to increased expression of the silent information regulatory protein 1 (SIRT1) homologue by arginine [28]. This protein acts as an activator of histone deacetylase protein-1 (AP-1), modulating neointimal layer formation and reducing the proliferation and migration of VSMCs [29]. As a result of the mitigation of vascular remodeling, blood pressure returns to normal levels (Figure 1).
Another relevant marker of DE is inflammation. In this work, C4 promoted a significant increase in IL-10 expression and decreased that of IL-1β. IL-10 is an anti-inflammatory cytokine that suppresses the activation of the IL-1 converting enzyme and the subsequent processing and release of mature IL-1β [30]. This effect could be due to glycine and arginine, as glycine has been reported to increase IL-10 production [31], whereas arginine epigenetically regulates IL-10 through hypomethylation of its gene promoter [32]. Furthermore, pro-IL-1β production is partially mediated by NF-κB activation [33]. Glycine and arginine have been reported to have anti-inflammatory effects by negatively regulating NF-κB activity, inhibiting the expression of IL-6, IL-1β, IL-17, TNF-α and cyclooxygenase 2, as well as macrophage infiltration [22, 25, 34-36]. Despite these anti-inflammatory effects, neither Losartan nor C4 controlled the increase of TNF-α in this work. Another signaling pathway involved in the production of TNF-α is MAPK p38 [37]; thus, even though glycine and arginine inhibited NF-kB activation, they may not inhibit the p38 pathway [37].
In addition to inflammation and oxidative stress, ED causes tissue damage in different organs, particularly kidney and liver [38]. In renal arterioles, glomerular capillaries, and peritubular capillaries, ED causes impairment of renal function and contributes to the development of acute and chronic kidney diseases [39] such as glomerulosclerosis, characterized by an increase in mesangial volume [40-41]. Ang-II-induced ROS production leads to hyperplasia and hypertrophy of various cell types and increases the expression of cytokines and adhesion molecules [42]. These alterations promote the synthesis of extracellular matrix proteins by activating mesangial cells and interstitial and tubular fibroblasts, stimulating plasminogen activator inhibitor 1 (PAI-1), and promoting macrophage infiltration and activation, which further potentiates inflammation and fibrosis [14,42-43]. In this work, treating mice with Ang-II resulted in renal structural alterations such as the deposition of collagen fibers, infiltration of mononuclear cells (lymphocytes, macrophages, and fibroblasts), and an increase in mesangial and glomerular area (Figure 5). C4 reversed renal damage, possibly due to the anti-inflammatory effect described above, by inhibiting the activation of the involved cells and macrophages. Indeed, activation of the glycine receptor (GlyR, an ionotropic or ligand-gated receptor) has been reported to contribute to the hyperpolarization of macrophages, hindering their activation [44]. On the other hand, the control of fibrosis in various tissues could be due to the content of arginine. Ramprasath et al. [45] reported that arginine increased the expression of Nrf2, a transcription factor that promotes the expression of cytoprotective genes such as phase-2 enzymes (heme oxygenase-1, glutathione-S-transferase A1, and NAD(P)H quinone oxidoreductase 1) [46], which can offset the fibrinogenic and oxidative damage [47-49].
Using in vivo [10,50-51] and in vitro [52] models, several authors have shown that Ang-II causes hepatic steatosis, increasing liver weight and triglyceride concentrations. However, there are few reports on the effect of this hormone on lipid synthesis [51]. In this study, we found that Ang-II decreased the concentration of glucose in the liver, in line with the results of Wu et al. [52] on the effect of Ang-II on HepG2 hepatocytes. Those authors demonstrated that Ang-II activates the transcription factor SREBP2, involved in de novo lipogenesis, a process that uses glucose as a raw material to produce oleic and palmitic acid [53], which are immediately transformed into triglycerides [54]. Previously, we observed that chronic application of Ang-II in mice induces steatosis by activating the de novo lipogenesis pathway [51], an effect that would be evidenced by lower intracellular glucose concentrations [51, 54]. We also observed that Losartan increased triglyceride concentrations and decreased glucose levels within the hepatocyte, in agreement with the report by Schupp et al. [55] that Losartan induced steatosis via activation of SREBP2 and PPAR. Meanwhile, C4 reduced triglyceride levels and partly restored glucose concentration, possibly due to the glycine and arginine content in C4, as these amino acids have been reported to have anti-steatosis activity in vivo [56-57].
Steatosis itself induces lipid degradation, which in turn leads to oxidative stress and ultimately cell death due to necrosis and inflammation, which together promote collagen fiber deposition [58]. Binding of Ang-II to the AT1 receptor of Kuppfer cells and hepatocytes increases the production of proinflammatory cytokines, including chemokines such as CXCL8 [59-60], triggering an immune response by attracting more cells to the site of injury. In addition, Ang-II has been reported to activate hepatic stellate cells through ATR1, promoting the development of fibrosis by increasing the expression of collagen I by induction of the intracellular MAPK/ERK pathway. Also promotes an increase of tissue inhibitor of metalloproteases-1 (TIMP-1) in the liver, producing disequilibrium with increased collagen and protein deposition in the extracellular matrix (ECM) [61-62]. Interestingly, C4 decreased both cellular infiltrate and fibrosis in mice, possibly due to its content of glycine, which has been reported to inhibit inflammation and liver fibrosis; however, its mechanism of action is still unknown [35, 63-64].
Overall, we found that C4 promotes the Akt/eNOS pathway, improves NO production and endothelial functions, helping to regulate blood pressure, vascular remodeling, and inflammation, whilst ameliorating tissue damage. These effects support its potential use as a phytomedicine.

Author Contributions

Conceptualization, Celeste Trejo-Moreno; Formal analysis, Gladis Fragoso; Investigation, Mario Ernesto Cruz-Muñoz, Gerardo Arrellín-Rosas, Alejandro Zamilpa and Jesús Enrique Jimenez-Ferrer; Methodology, Celeste Trejo-Moreno, Zimri Alvarado-Ojeda, Marisol Méndez-Martínez, Gabriela Castro-Martínez, Alejandro Zamilpa and Juan Baez-Reyes; Resources, Gladis Fragoso; Validation, Jesús Enrique Jimenez-Ferrer and Gladis Fragoso; Writing—original draft, Celeste Trejo-Moreno and Gladis Fragoso; Writing—review & editing, Celeste Trejo-Moreno and Gladis Fragoso.
Author Contributions
C.T.-M. and G.R.-S. were responsible for experiment design, collection, analysis, and interpretation of data, and drafting the manuscript. Z. A. A-O., M.M.-M., M. E. C-M., G. C-M., G. A-R., A. Z., and J. C. B-R. helped to perform experiments. A.Z., E.J.-F., G.F. and G.R.-S. contributed to the analysis and interpretation of the results. G.F. and G.R.-S helped to write the final version of the manuscript. All authors read and approved the final manuscript.

Funding

This research was funded by CONACyT, grant number CB 2012-169011.

Institutional Review Board Statement

The animal study protocol was approved by the Ethical Committee for the Care and Use of Laboratory Animals of the Facultad de Medicina of the Universidad Autónoma del Estado de Morelos (Permit No. 008/2016).

Acknowledgments

The authors thank Juan Francisco Rodríguez for helping in the preparation of this manuscript. They also thank Biol. Nancy Arias García for her support in animal care and Noemi Gelista Herrera for slide preparation and their valuable help in histological procedures. Celeste Trejo-Moreno thanks CONAHCyT for her postdoctoral stay 2022-2023; Marisol Méndez-Martínez thanks CONAHCyT for her postdoctoral stay 2022-2023, Gabriela Castro-Martínez thanks CONAHCyT for her doctoral scholarship.

Conflicts of Interest

The authors declare no conflict of interest.

References

  1. Cyr, A. R. , Huckaby, L. V., Shiva, S. S., & Zuckerbraun, B. S. Nitric Oxide and Endothelial Dysfunction. Crit Care Clin 2020, 36(2), 307–321. [Google Scholar] [CrossRef] [PubMed]
  2. Kinzenbaw, D. A. , Langmack, L., & Faraci, F. M.. Angiotensin II-induced endothelial dysfunction: Impact of sex, genetic background, and rho kinase. Physiol Rep 2022, 10. [Google Scholar] [CrossRef]
  3. Gallo, G. , Volpe, M., & Savoia, C. Endothelial Dysfunction in Hypertension: Current Concepts and Clinical Implications. Front Med, 8958. [Google Scholar] [CrossRef]
  4. Theofilis, P. , Sagris, M., Oikonomou, E., Antonopoulos, A. S., Siasos, G., Tsioufis, C., & Tousoulis, D. Inflammatory Mechanisms Contributing to Endothelial Dysfunction. Biomedicines 2021, 9. [Google Scholar] [CrossRef]
  5. Kobayashi, N. , Mita, S., Yoshida, K., Honda, T., Kobayashi, T., Hara, K., Nakano, S., Tsubokou, Y., & Matsuoka, H. Celiprolol activates eNOS through the PI3K-Akt pathway and inhibits VCAM-1 Via NF-kappaB induced by oxidative stress. Hypertension 2003, 42, 1004–1013. [Google Scholar] [CrossRef] [PubMed]
  6. Iaccarino, G. , Ciccarelli, M., Sorriento, D., Cipolletta, E., Cerullo, V., Iovino, G. L., Paudice, A., Elia, A., Santulli, G., Campanile, A., Arcucci, O., Pastore, L., Salvatore, F., Condorelli, G., & Trimarco, B. AKT participates in endothelial dysfunction in hypertension. Circulation 2004, 109, 2587–2593. [Google Scholar] [CrossRef]
  7. Ding, J. , Yu, M., Jiang, J., Luo, Y., Zhang, Q., Wang, S., Yang, F., Wang, A., Wang, L., Zhuang, M., Wu, S., Zhang, Q., Xia, Y., & Lu, D. Angiotensin II Decreases Endothelial Nitric Oxide Synthase Phosphorylation via AT1R Nox/ROS/PP2A Pathway. Fron Physiol 2020, 11, 566410. [Google Scholar] [CrossRef]
  8. Medina-Leyte, D. J. , Zepeda-García, O., Domínguez-Pérez, M., González-Garrido, A., Villarreal-Molina, T., & Jacobo-Albavera, L. Endothelial Dysfunction, Inflammation and Coronary Artery Disease: Potential Biomarkers and Promising Therapeutical Approaches. Int J Mol Sci 2021, 22. [Google Scholar] [CrossRef]
  9. da Silva, G. M. , da Silva, M. C., Nascimento, D. V. G., Lima Silva, E. M., Gouvêa, F. F. F., de França Lopes, L. G., Araújo, A. V., Ferraz Pereira, K. N., & de Queiroz, T. M. Nitric Oxide as a Central Molecule in Hypertension: Focus on the Vasorelaxant Activity of New Nitric Oxide Donors. Biology (Basel) 2021, 10. [Google Scholar] [CrossRef]
  10. Trejo-Moreno, C. , Jiménez-Ferrer, E., Castro-Martínez, G., Méndez-Martínez, M., Santana, M. A., Arrellín-Rosas, G., Pedraza-Chaverri, J., Medina-Campos, O. N., Hernández-Téllez, B., Ramírez-Pliego, O., Herrera-Ruiz, M., Cervantes-Torres, J., Alvarado-Ojeda, Z. A., Costet-Mejía, A., Fragoso, G., & Rosas-Salgado, G. Characterization of a murine model of endothelial dysfunction induced by chronic intraperitoneal administration of angiotensin II. Sci Rep 2021, 11. [Google Scholar] [CrossRef]
  11. Mukherjee, P. K. , Nema, N. K., Maity, N., & Sarkar, B. K. Phytochemical and therapeutic potential of cucumber. Fitoterapia 2013, 84, 227–236. [Google Scholar] [CrossRef]
  12. Kumar, D. , Kumar, S., Singh, J., Narender, Rashmi, Vashistha, B., & Singh, N. Free Radical Scavenging and Analgesic Activities of Cucumis sativus L. Fruit Extract. J Young Pharm. [CrossRef]
  13. Bernardini, C. , Zannoni, A., Bertocchi, M., Tubon, I., Fernandez, M., & Forni, M. Water/ethanol extract of Cucumis sativus L. fruit attenuates lipopolysaccharide-induced inflammatory response in endothelial cells. BMC Complement Altern Med 2018, 18. [Google Scholar] [CrossRef]
  14. Trejo-Moreno, C. , Méndez-Martínez, M., Zamilpa, A., Jiménez-Ferrer, E., Perez-Garcia, M. D., Medina-Campos, O. N., Pedraza-Chaverri, J., Santana, M. A., Esquivel-Guadarrama, F. R., Castillo, A., Cervantes-Torres, J., Fragoso, G., & Rosas-Salgado, G. Cucumis sativus Aqueous Fraction Inhibits Angiotensin II-Induced Inflammation and Oxidative Stress In Vitro. Nutrients 2018, 10. [Google Scholar] [CrossRef]
  15. Liang, X. X. , Wang, R. Y., Guo, Y. Z., Cheng, Z., Lv, D. Y., Luo, M. H., He, A., Luo, S. X., & Xia, Y. Phosphorylation of Akt at Thr308 regulates p-eNOS Ser1177 during physiological conditions. FEBS open bio 2021, 11, 1953–1964. [Google Scholar] [CrossRef] [PubMed]
  16. Ghimire, K. , Altmann, H. M., Straub, A. C., & Isenberg, J. S. Nitric oxide: what’s new to NO? Am J Physiol Cell Physiol 2017, 312, C254–C262. [Google Scholar] [CrossRef] [PubMed]
  17. Schwingshackl, L. , Christoph, M., & Hoffmann, G. Effects of Olive Oil on Markers of Inflammation and Endothelial Function-A Systematic Review and Meta-Analysis. Nutrients, 7651. [Google Scholar] [CrossRef]
  18. Vairappan, B. Endothelial dysfunction in cirrhosis: Role of inflammation and oxidative stress. World J Hepatol 2015, 7, 443–459. [Google Scholar] [CrossRef] [PubMed]
  19. Taguchi, K. , Hida, M., Hasegawa, M., Matsumoto, T., & Kobayashi, T. Dietary polyphenol morin rescues endothelial dysfunction in a diabetic mouse model by activating the Akt/eNOS pathway. Mol Nutr Food Res 2016, 60, 580–588. [Google Scholar] [CrossRef] [PubMed]
  20. Zhao, D. , Chen, J., Zhang, Y., Liao, H. B., Zhang, Z. F., Zhuang, Y., Pan, M. X., Tang, J. C., Liu, R., Lei, Y., Wang, S., Qin, X. P., Feng, Y. G., Chen, Y., & Wan, Q. Glycine confers neuroprotection through PTEN/AKT signal pathway in experimental intracerebral hemorrhage. Biochem Biophys Res Commun 2018, 501, 85–91. [Google Scholar] [CrossRef] [PubMed]
  21. Tsuji-Tamura, K. , Sato, M., Fujita, M., & Tamura, M. The role of PI3K/Akt/mTOR signaling in dose-dependent biphasic effects of glycine on vascular development. Biochem Biophys Res Commun 2020, 529, 596–602. [Google Scholar] [CrossRef]
  22. Gómez-Zamudio, J. H. , García-Macedo, R., Lázaro-Suárez, M., Ibarra-Barajas, M., Kumate, J., & Cruz, M. Vascular endothelial function is improved by oral glycine treatment in aged rats. Can J Physiol Pharmacol 2015, 93, 465–473. [Google Scholar] [CrossRef]
  23. Ruiz-Ramírez, A. , Ortiz-Balderas, E., Cardozo-Saldaña, G., Diaz-Diaz, E., & El-Hafidi, M. Glycine restores glutathione and protects against oxidative stress in vascular tissue from sucrose-fed rats. Clin Sci (Lond) 2014, 126, 19–29. [Google Scholar] [CrossRef]
  24. Hnia, K. , Gayraud, J., Hugon, G., Ramonatxo, M., De La Porte, S., Matecki, S., & Mornet, D. L-arginine decreases inflammation and modulates the nuclear factor-kappaB/matrix metalloproteinase cascade in mdx muscle fibers. Am J Pathol 2008, 172(6), 1509–1519. [Google Scholar] [CrossRef]
  25. Ren, W. , Yin, J., Wu, M., Liu, G., Yang, G., Xion, Y., Su, D., Wu, L., Li, T., Chen, S., Duan, J., Yin, Y., & Wu, G. Serum amino acids profile and the beneficial effects of L-arginine or L-glutamine supplementation in dextran sulfate sodium colitis. PloS one 2014, 9. [Google Scholar] [CrossRef]
  26. Fujiwara, T. , Kanazawa, S., Ichibori, R., Tanigawa, T., Magome, T., Shingaki, K., Miyata, S., Tohyama, M., & Hosokawa, K. L-arginine stimulates fibroblast proliferation through the GPRC6A-ERK1/2 and PI3K/Akt pathway. PloS one 2014, 9. [Google Scholar] [CrossRef]
  27. Hou, E. , Sun, N., Zhang, F., Zhao, C., Usa, K., Liang, M., & Tian, Z. Malate and Aspartate Increase L-Arginine and Nitric Oxide and Attenuate Hypertension. Cell Rep 2017, 19, 1631–1639. [Google Scholar] [CrossRef]
  28. Rizk, S. M. , El-Maraghy, S. A., & Nassar, N. N. A novel role for SIRT-1 in L-arginine protection against STZ induced myocardial fibrosis in rats. PloS one 2014, 9. [Google Scholar] [CrossRef]
  29. Gao, P. , Xu, T. T., Lu, J., Li, L., Xu, J., Hao, D. L., Chen, H. Z., & Liu, D. P. Overexpression of SIRT1 in vascular smooth muscle cells attenuates angiotensin II-induced vascular remodeling and hypertension in mice. J Mol Med (Berl) 2014, 92, 347–357. [Google Scholar] [CrossRef] [PubMed]
  30. Kim, H. J. , Hart, J., Knatz, N., Hall, M. W., & Wewers, M. D. Janus kinase 3 down-regulates lipopolysaccharide-induced IL-1 beta-converting enzyme activation by autocrine IL-10. J Immunol 2004, 172, 4948–4955. [Google Scholar] [CrossRef]
  31. Chen, J. , Ma, X., Yang, Y., Dai, Z., Wu, Z., & Wu, G. Glycine enhances expression of adiponectin and IL-10 in 3T3-L1 adipocytes without affecting adipogenesis and lipolysis. Amino acids 2018, 50, 629–640. [Google Scholar] [CrossRef] [PubMed]
  32. Yu, H. R. , Tsai, C. C., Chang, L. S., Huang, H. C., Cheng, H. H., Wang, J. Y., Sheen, J. M., Kuo, H. C., Hsieh, K. S., Huang, Y. H., Yang, K. D., & Hsu, T. Y. l-Arginine-Dependent Epigenetic Regulation of Interleukin-10, but Not Transforming Growth Factor-β, Production by Neonatal Regulatory T Lymphocytes. Front Immunol 2017, 8, 487. [Google Scholar] [CrossRef] [PubMed]
  33. Morais, S. R. L. , Brito, V. G. B., Mello, W. G., & Oliveira, S. H. P. l-arginine modulates inflammation and muscle regulatory genes after a single session of resistance exercise in rats. Scand J Med Sci Sports 2018, 28, 425–435. [Google Scholar] [CrossRef]
  34. Wang, H. D. , Lü, X. X., Lu, D. X., Qi, R. B., Wang, Y. P., Fu, Y. M., & Wang, L. W. Glycine inhibits the LPS-induced increase in cytosolic Ca2+ concentration and TNFalpha production in cardiomyocytes by activating a glycine receptor. Acta Pharmacol Sin 2009, 30, 1107–1114. [Google Scholar] [CrossRef]
  35. Almanza-Perez, J. C. , Alarcon-Aguilar, F. J., Blancas-Flores, G., Campos-Sepulveda, A. E., Roman-Ramos, R., Garcia-Macedo, R., & Cruz, M. Glycine regulates inflammatory markers modifying the energetic balance through PPAR and UCP-2. Biomed Pharmacother. [CrossRef]
  36. Amin, F. U. , Shah, S. A., & Kim, M. O. Glycine inhibits ethanol-induced oxidative stress, neuroinflammation and apoptotic neurodegeneration in postnatal rat brain. Neurochem Int. [CrossRef]
  37. Campbell, J. , Ciesielski, C. J., Hunt, A. E., Horwood, N. J., Beech, J. T., Hayes, L. A., Denys, A., Feldmann, M., Brennan, F. M., & Foxwell, B. M. A novel mechanism for TNF-alpha regulation by p38 MAPK: involvement of NF-kappa B with implications for therapy in rheumatoid arthritis. J Immunol. 2004, 173, 6928–6937. [Google Scholar] [CrossRef]
  38. Diaz-Ricart, M. , Torramade-Moix, S., Pascual, G., Palomo, M., Moreno-Castaño, A. B., Martinez-Sanchez, J., Vera, M., Cases, A., & Escolar, G. Endothelial Damage, Inflammation and Immunity in Chronic Kidney Disease. Toxins (Basel). [CrossRef]
  39. Guerrot, D. , & Bellien, J. (2014). Editorial: renal endothelial dysfunction: evolving concepts and perspectives. Cardiovasc Hematol Disord Drug Targets 2014, 14(1), 1–2. [Google Scholar] [CrossRef] [PubMed]
  40. Anderson, P. W. , Do, Y. S., & Hsueh, W. A. (1993). Angiotensin II causes mesangial cell hypertrophy. Hypertension 1993, 21(1), 29–35. [Google Scholar] [CrossRef] [PubMed]
  41. Orth, S. R. , Weinreich, T., Bönisch, S., Weih, M., & Ritz, E. Angiotensin II induces hypertrophy and hyperplasia in adult human mesangial cells. Exp Nephrol 1995, 3(1), 23–33. [Google Scholar]
  42. Ruiz-Ortega, M. , Rupérez, M., Esteban, V., Rodríguez-Vita, J., Sánchez-López, E., Carvajal, G., & Egido, J. Angiotensin II: a key factor in the inflammatory and fibrotic response in kidney diseases. 2006. [Google Scholar] [CrossRef]
  43. Froh, M. , Thurman, R. G., & Wheeler, M. D. Molecular evidence for a glycine-gated chloride channel in macrophages and leukocytes. Am J Physiol Gastrointest Liver Physiol. [CrossRef]
  44. Ramprasath, T. , Kumar, P. H., Puhari, S. S., Murugan, P. S., Vasudevan, V., & Selvam, G. S. L-Arginine ameliorates cardiac left ventricular oxidative stress by upregulating eNOS and Nrf2 target genes in alloxan-induced hyperglycemic rats. Biochem Biophys Res Commun 2012, 428(3), 389–394. [Google Scholar] [CrossRef] [PubMed]
  45. Korkina L., G. Phenylpropanoids as naturally occurring antioxidants: from plant defense to human health. Cell Mol Biol (Noisy-le-grand.
  46. Oh, C. J. , Kim, J. Y., Min, A. K., Park, K. G., Harris, R. A., Kim, H. J., & Lee, I. K. Sulforaphane attenuates hepatic fibrosis via NF-E2-related factor 2-mediated inhibition of transforming growth factor-β/Smad signaling. Free Radic Biol Med. [CrossRef]
  47. Choi, H. K. , Pokharel, Y. R., Lim, S. C., Han, H. K., Ryu, C. S., Kim, S. K., Kwak, M. K., & Kang, K. W. Inhibition of liver fibrosis by solubilized coenzyme Q10: Role of Nrf2 activation in inhibiting transforming growth factor-beta1 expression. Toxicol Appl Pharmacol. [CrossRef]
  48. Choi, B. H. , Kang, K. S., & Kwak, M. K. Effect of redox modulating NRF2 activators on chronic kidney disease. Molecules 2014, 19(8), 12727–12759. [Google Scholar] [CrossRef] [PubMed]
  49. Wei, Y. , Clark, S. E., Morris, E. M., Thyfault, J. P., Uptergrove, G. M., Whaley-Connell, A. T., Ferrario, C. M., Sowers, J. R., & Ibdah, J. A. Angiotensin II-induced non-alcoholic fatty liver disease is mediated by oxidative stress in transgenic TG(mRen2)27(Ren2) rats. J Hepatol. [CrossRef]
  50. Alvarado-Ojeda, Z. A. , Coset, Mejia, A., Arrellin, Rosas, G., Jiménez-Ferrer, J. E., Zamilpa, A., Trejo-Moreno, C., Castro, Martínez, G., Méndez, Martínez, M., Cervantes, Torres, J., Báez, Reyes, J. C., Fragoso, G. & Rosas, Salgado, G. Hepatoprotective effect of hydroalcoholic extract from root of Sechium edule (Jacq.) Sw. over hepatic injury induced by chronic application of angiotensin II. Front. Nat. Produc. 2022, 1. [Google Scholar] [CrossRef]
  51. Wu, Y. , Ma, K. L., Zhang, Y., Wen, Y., Wang, G. H., Hu, Z. B., Liu, L., Lu, J., Chen, P. P., Ruan, X. Z., & Liu, B. C. Lipid disorder and intrahepatic renin-angiotensin system activation synergistically contribute to non-alcoholic fatty liver disease. Liver Int, 1525. [Google Scholar] [CrossRef]
  52. Edvardsson, U. , Ljungberg, A., & Oscarsson, J. Insulin and oleic acid increase PPARgamma2 expression in cultured mouse hepatocytes. Biochem Biophys Res Commun 2006, 340(1), 111–117. [Google Scholar] [CrossRef]
  53. Rogue, A. , Anthérieu, S., Vluggens, A., Umbdenstock, T., Claude, N., de la Moureyre-Spire, C., Weaver, R. J., & Guillouzo, A. PPAR agonists reduce steatosis in oleic acid-overloaded HepaRG cells. Toxicol Appl Pharmacol. [CrossRef]
  54. Schupp, M. , Janke, J., Clasen, R., Unger, T., & Kintscher, U. Angiotensin type 1 receptor blockers induce peroxisome proliferator-activated receptor-gamma activity. Circulation, 2054. [Google Scholar] [CrossRef]
  55. Yin, M. , Ikejima, K., Arteel, G. E., Seabra, V., Bradford, B. U., Kono, H., Rusyn, I., & Thurman, R. G. Glycine accelerates recovery from alcohol-induced liver injury. J Pharmacol Exp Ther, 1014. [Google Scholar]
  56. Taha, M. O. , Caricati-Neto, A., Ferreira, R. M., Simões, M.deJ., Monteiro, H. P., & Fagundes, D. J. L-arginine in the ischemic phase protects against liver ischemia-reperfusion injury. Acta Cir Bras. 2012, 27(9), 616–623. [Google Scholar] [CrossRef]
  57. Kawano, Y. , & Cohen, D. E. (2013). Mechanisms of hepatic triglyceride accumulation in non-alcoholic fatty liver disease. J Gastroenterol. [CrossRef]
  58. Brasier, A. R. , Jamaluddin, M., Han, Y., Patterson, C., & Runge, M. S. Angiotensin II induces gene transcription through cell-type-dependent effects on the nuclear factor-kappaB (NF-kappaB) transcription factor. Mol Cell Biochem.
  59. Guo, F. , Chen, X. L., Wang, F., Liang, X., Sun, Y. X., & Wang, Y. J. Role of angiotensin II type 1 receptor in angiotensin II-induced cytokine production in macrophages. J Interferon Cytokine Res. [CrossRef]
  60. Gressner, A. M. , Weiskirchen, R., Breitkopf, K., & Dooley, S. Roles of TGF-beta in hepatic fibrosis. Front Biosci. [CrossRef]
  61. Lugo-Baruqui, A. , Muñoz-Valle, J. F., Arévalo-Gallegos, S., & Armendáriz-Borunda, J. Role of angiotensin II in liver fibrosis-induced portal hypertension and therapeutic implications. Hepatol Res. [CrossRef]
  62. Rivera, C. A. , Bradford, B. U., Hunt, K. J., Adachi, Y., Schrum, L. W., Koop, D. R., Burchardt, E. R., Rippe, R. A., & Thurman, R. G. Attenuation of CCl(4)-induced hepatic fibrosis by GdCl(3) treatment or dietary glycine. Am J Physiol Gastrointest Liver Physiol. [CrossRef]
  63. Senthilkumar, R. , & Nalini, N. Glycine prevents hepatic fibrosis by preventing the accumulation of collagen in rats with alcoholic liver injury. Pol J Pharmacol. 2004, 56(1), 121–128. [Google Scholar] [PubMed]
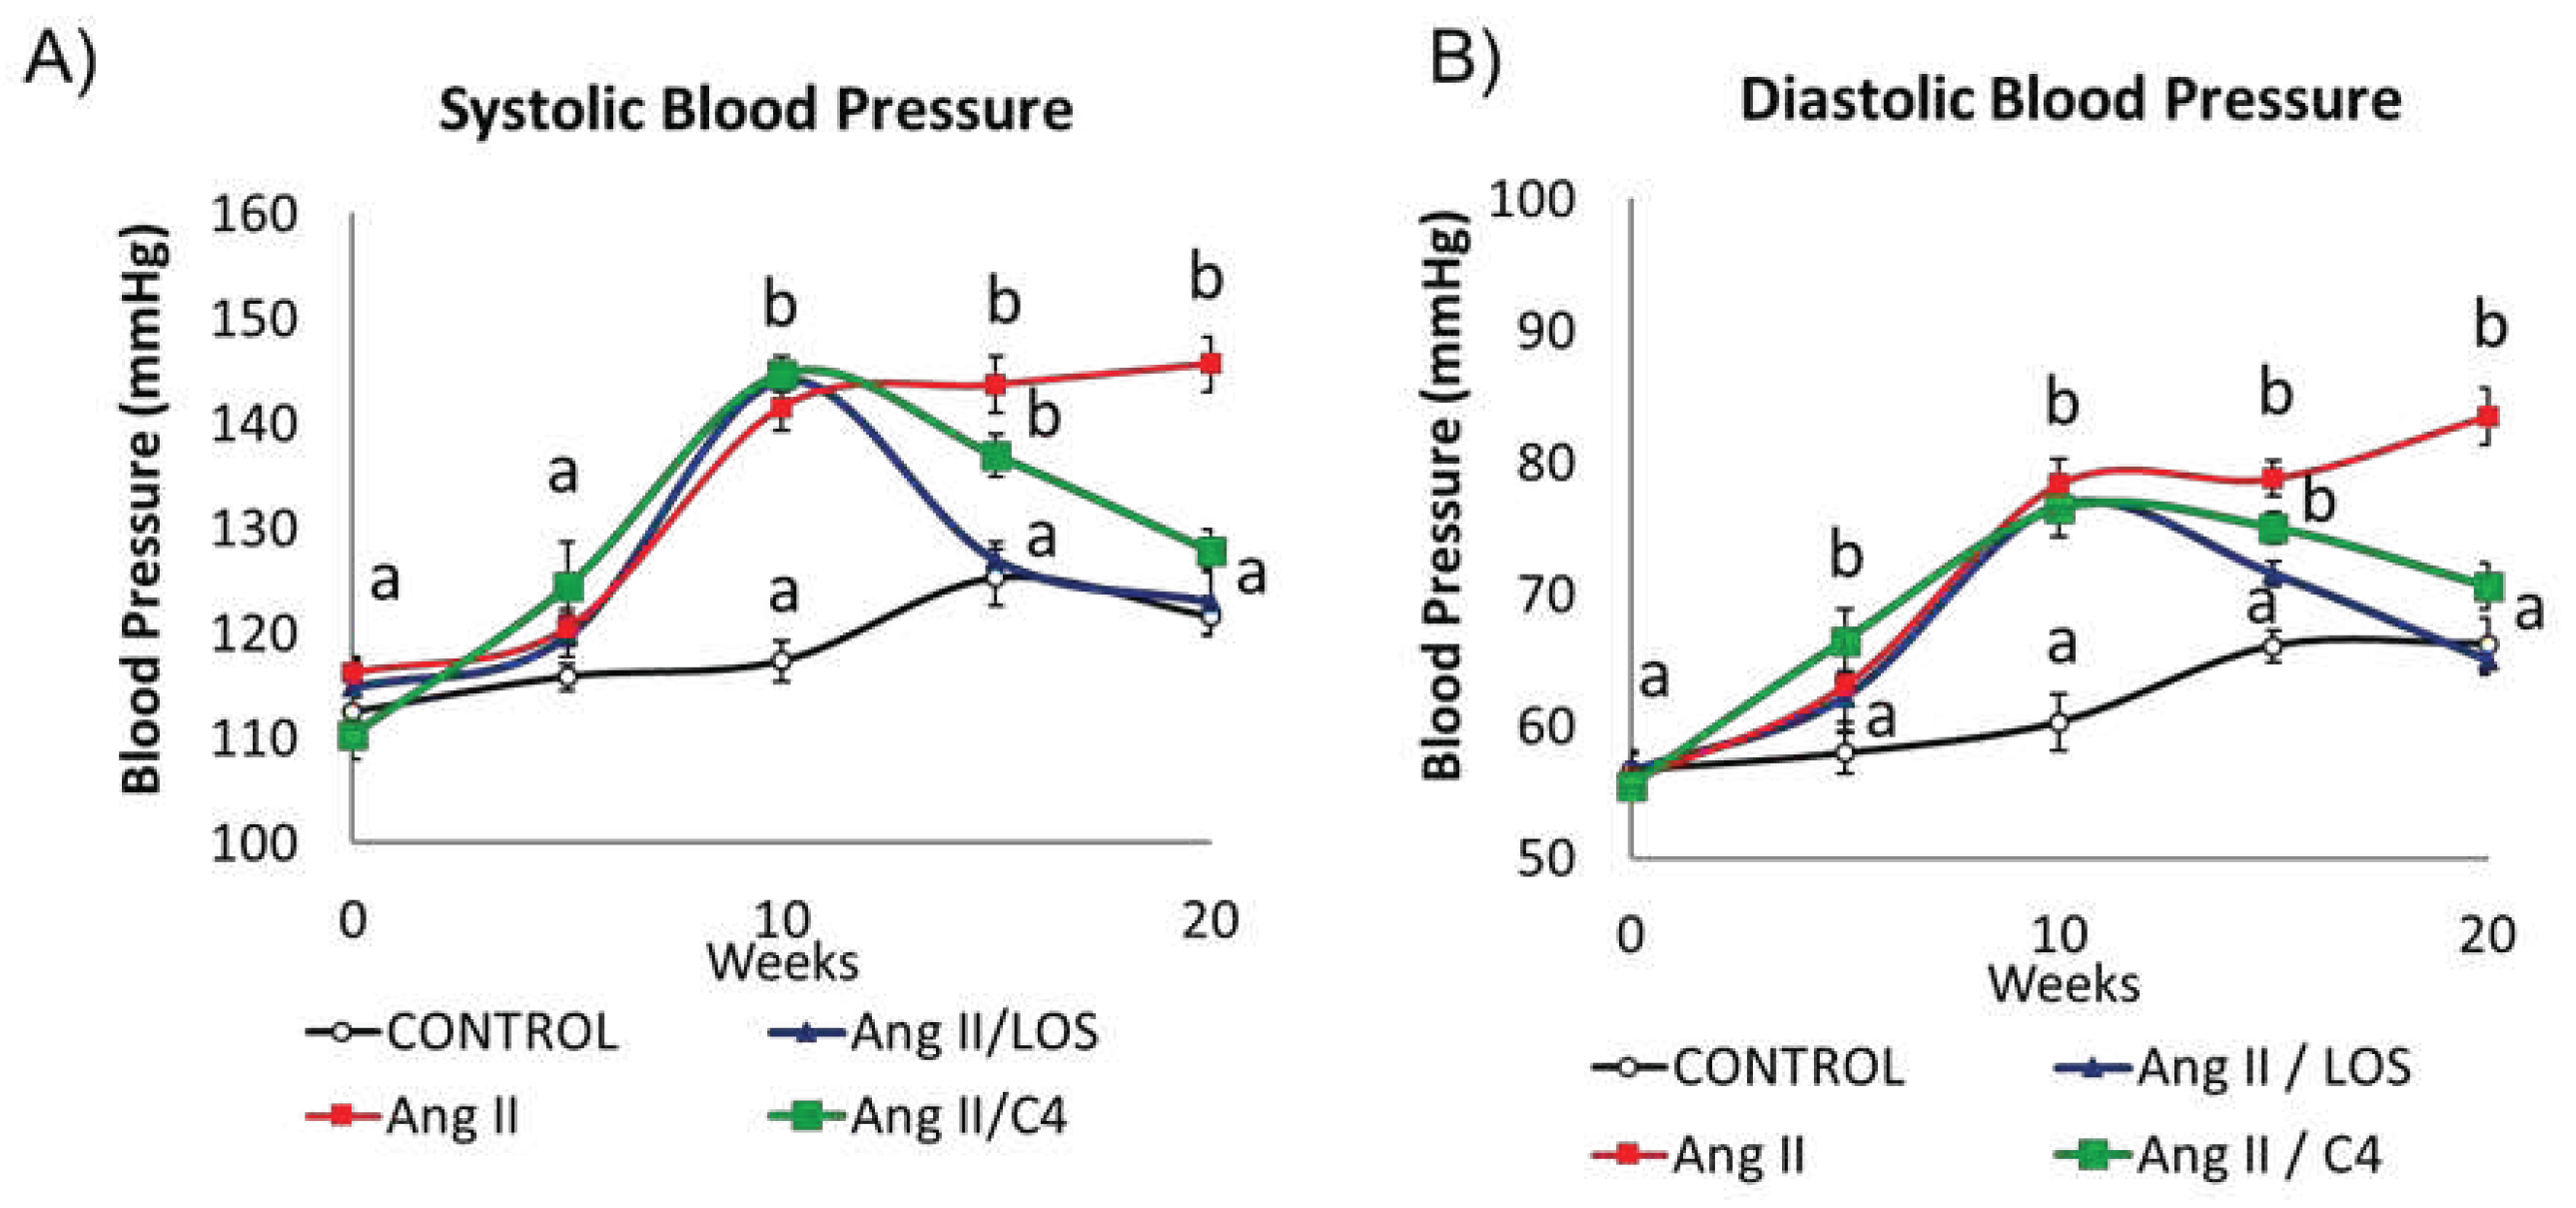
Figure 1. Blood pressure kinetics: (A) systolic (SBP) and (B) diastolic (DBP). Both blood pressure values were measured in all mice every 5 weeks throughout the experiment (20 weeks). At week 10, all Ang-II-treated mice showed a significant increase in pressure from baseline (week 0). Administration of either C4 or Losartan started at week 10. Losartan and C4 decreased both pressure values at week 5 of treatment, with Losartan being more effective. Data are reported as mean ± SE, and they were analyzed by ANOVA and Tukey’s post-hoc test. Different letters indicate significant differences (p < 0.05) between groups (n = 15).
Preprints 87856 g001
Figure 2. Nitrite quantification and expression of AKT and p-AKT. A) Nitrite quantification (n = 7). B) Western blot of AKT and phospho-AKT (n = 2). C–D) AKT and phospho-AKT expression. Ang-II treatment reduced NO availability, while both treatments prevented its decrease, which can be linked to AKT phosphorylation. Data are reported as mean ± SE, and they were analyzed by ANOVA and Tukey’s post-hoc test. Different letters indicate significant differences (p < 0.05) between groups.
Preprints 87856 g002
Figure 3. Vascular remodeling. (A–D) Photomicrographs of hepatic arteries, 40X. (E–L) Photomicrographs of aorta stained with Masson’s trichrome (4X, E–H; 100X, I–L). (M) Microvascular remodeling, determined as the media/lumen ratio in hepatic arteries (n = 10). (N) Macrovascular remodeling, determined as the media/lumen ratio in aorta (n = 5). Ang-II induced remodeling in micro- (hepatic arteries) and macrovasculature (aorta); both Losartan and C4 reversed this effect. Data are reported as mean ± SE, and they were analyzed by ANOVA and Tukey’s post-hoc test. Different letters indicate significant differences (p < 0.05) between groups. LOS: Losartan; C4: combination of subfractions SF1 and SF3; b: bile duct; pv: portal vein; h: hepatic artery. Arrows show the hepatic artery.
Preprints 87856 g003
Figure 4. Concentration of pro- and anti-inflammatory cytokines in kidney. The levels of proinflammatory (IL-1β, TNF-α and IL-6) and anti-inflammatory cytokines (TGF-β and IL-10) were measured in the kidney at the end of the experiment (week 20). Data are reported as mean ± SE, and they were analyzed by ANOVA and Tukey’s post-hoc test. Different letters indicate significant differences (p < 0.05) between groups. LOS: Losartan; C4: combination of subfractions SF1 and SF3. n =10 mice per group.
Preprints 87856 g004
Figure 5. Kidney damage. Representative images of: A–D) perirenal fat; E–H) renal capsule; I–L) vessels; and M–P) cortical glomerulus of control and Ang-II-, Ang-II/Losartan-, and Ang-II/C4-treated mice. Analysis of glomerular damage (Q–S) and renal profile (T) (n = 10). Ang-II induces inflammation, evidenced by infiltrate mononuclear cells and fibroblasts and deposition of collagen fibers, which were stained in blue (B, F, J, N). Treatment with C4 decreases these parameters (D, H, L, P) better than Losartan (C, G, K, O). Ang-II induced glomerular hypertrophy (Q) and mesangial expansion (R), while decreasing glomerular capillarity (S). Treatment with C4 partially reversed these parameters. Ang-II-induced increased serum creatinine levels, indicative of a compromised kidney function, were reverted by C4 and Losartan (T). Photomicrographs were taken at 100X. Data are reported as mean ± SE, and they were analyzed by ANOVA and Tukey’s post-hoc test. Different letters indicate significant differences (p < 0.05) between groups. LOS: Losartan; C4: combination of subfractions SF1 and SF3; m: mononuclear cell; f: fibroblasts.
Preprints 87856 g005
Figure 6. Liver damage assessment by Masson’s trichrome stain. A–D) hepatic parenchyma, 4X. E–H) Glisson’s capsule, 40X; I–L) trabeculae, 40X, control, Ang-II-, Ang-II/Losartan-, and Ang-II/C4-treated mice. Ang-II-treated mice showed steatosis, mononuclear cell infiltrate, and collagen fiber deposition. Both Losartan and C4 decreased Glisson’s capsule and trabeculae thickening. Photomicrographs taken at 4X and 40X. Data are reported as mean ± SE, and they were analyzed by ANOVA and Tukey’s post-hoc test. Different letters indicate significant differences (p < 0.05) between groups (n = 5). LOS: Losartan; C4: combination of subfractions SF1 and SF3; m: inflammatory mononuclear cells; F: fibroblasts; Fb: fibrocytes.
Preprints 87856 g006
Disclaimer/Publisher’s Note: The statements, opinions and data contained in all publications are solely those of the individual author(s) and contributor(s) and not of MDPI and/or the editor(s). MDPI and/or the editor(s) disclaim responsibility for any injury to people or property resulting from any ideas, methods, instructions or products referred to in the content.
Copyright: This open access article is published under a Creative Commons CC BY 4.0 license, which permit the free download, distribution, and reuse, provided that the author and preprint are cited in any reuse.
Prerpints.org logo

Preprints.org is a free preprint server supported by MDPI in Basel, Switzerland.

Subscribe

© 2024 MDPI (Basel, Switzerland) unless otherwise stated