1. Introduction
In the past few decades, optical fiber technology has fascinated attention in medical, industrial engineering, and environmental monitoring [
1]. This technology has been widely examined for the measurements of several parameters, such as refractive index (RI), temperature, magnetic field, and liquid sensing due to the remarkable benefits of high sensitivity, flexibility, electromagnetic interference, anti-corrosion properties, efficient size, and low cost as compared to the conventional sensors [2,3].
Recently many types of optical fibers have been utilized in sensing technology such as single mode fiber (SMF), multimode fiber (MMF), microstructure fiber, and photonic crystal fiber (PCF) [
4] . Sensing techniques rely on the Mach-Zehnder interferometer (MZI) [
5], Fabry-Perot interferometer (FPI) [
6], and Michelson interferometer (MI) [
7]. SMF structures are highly attractive to environmental parameters, particularly side polished SMF design has obtained an extensive devotion and been occupied in many kinds of optical sensing devices thanks to evanescent filed extended outside to core into the side-polished region [
8]. D-type SMF structure play a key role in the measurements of RI through a precise relation to the intensity of analytes [
9].
In this regard, two schemes of side polished arrangement can be considered: the first one is based on the filling of liquids or analytes inside the fibers, where these analytes are inserted into the core or the cladding regions of the fibers [
10]. Mostly microstructure fibers have been exploited for this method. The benefit of this scheme is related to its high sensitivity and manageability because the filled analyte inside the fiber directly impacts the dispersion of the fiber [
11]. However, the major drawback is related to the fact that filling the fiber with liquids can be very complex or difficult as related to other approaches in which analyte keep on the exterior part of the fiber [
12]. Therefore, D-shaped fibers, with sensing or tapered region located outside the fiber, can be considered as mainstream for real time measurements [
13].
In recent years, D-shaped fiber structures are reported, in which half part of the cladding section is polished, which allows a stronger interaction between the optical mode and the target analytes [14,15]. Wang et al. demonstrated the temperature sensor based on helical core fiber which is polished as a D-type fiber coated with the layer of gold [
16]. Studies of Ag/TiO
2 plasmonic formation combined with side polish fiber has been described by Yousuf et al. to build the humidity sensor [
17]. Further, Xu et al. designed the magnetic field sensor based on the magnetic fluid and side polished hollow core optical fiber [
18]. A recent work reports the measuring the liquid level and refractive index by using the side polished plastic optical fiber [
19].
Moreover, for the manufacturing method, more polishing intensity indicates extra refined input development which creates fabrication cost of fiber sensor more expensive. As far as sensitivity factor, sensors with numerous sensing paths are more responsive than the specific sensing channel over the same circumstances [
20]. The operating wavelength range is also a significant element for the sensing devices. Therefore, it is possible to achieve a higher sensitivity and wider range of detection at certain conditions with different analytes placed outside the D-type SMF sensors.
In this study, the characterization of commercially available SP-SMF associated with air and analytes has been proposed. Both the simulation and experimental studies have been analyzed to describe the matching results. On the bases of optical transmittance spectrum, air, water, and isopropanol (IPA) have been taken into account. The characteristic of the light confinement depends on the analytes, which leads to the change in optical output power. The performance of the proposed model is achieved as 1.207 V/RIU for the experimental study. This type of structure could be used as a building block in liquid sensing applications as well as refractive index sensing.
2. Geometrical structure
The cross section and side view of the proposed SP-SMF structure has been shown in
Figure 1(a) and (b) respectively. The commercial SP-SMF (manufactured by Phoenix Photonics Ltd) has been taken to perform the experimental study. The geometrical parameters for the simulation study have been set up according to the commercial fiber.
The central part of the fiber consists of the core region with the diameter (
2*r1) of 9.5µm which is surrounded by the cladding region. The whole cladding diameter (
2*r2) of the fiber is equal to 62.5µm in which the length (
L) of the polished region is equal to 17mm, which behaves as an active region through adding the analytes. The “Etch depth” refers to the depth at which the cladding of a SMF is removed during the fabrication process of polishing, and the distance between the core and the tapered section is about 2µm.
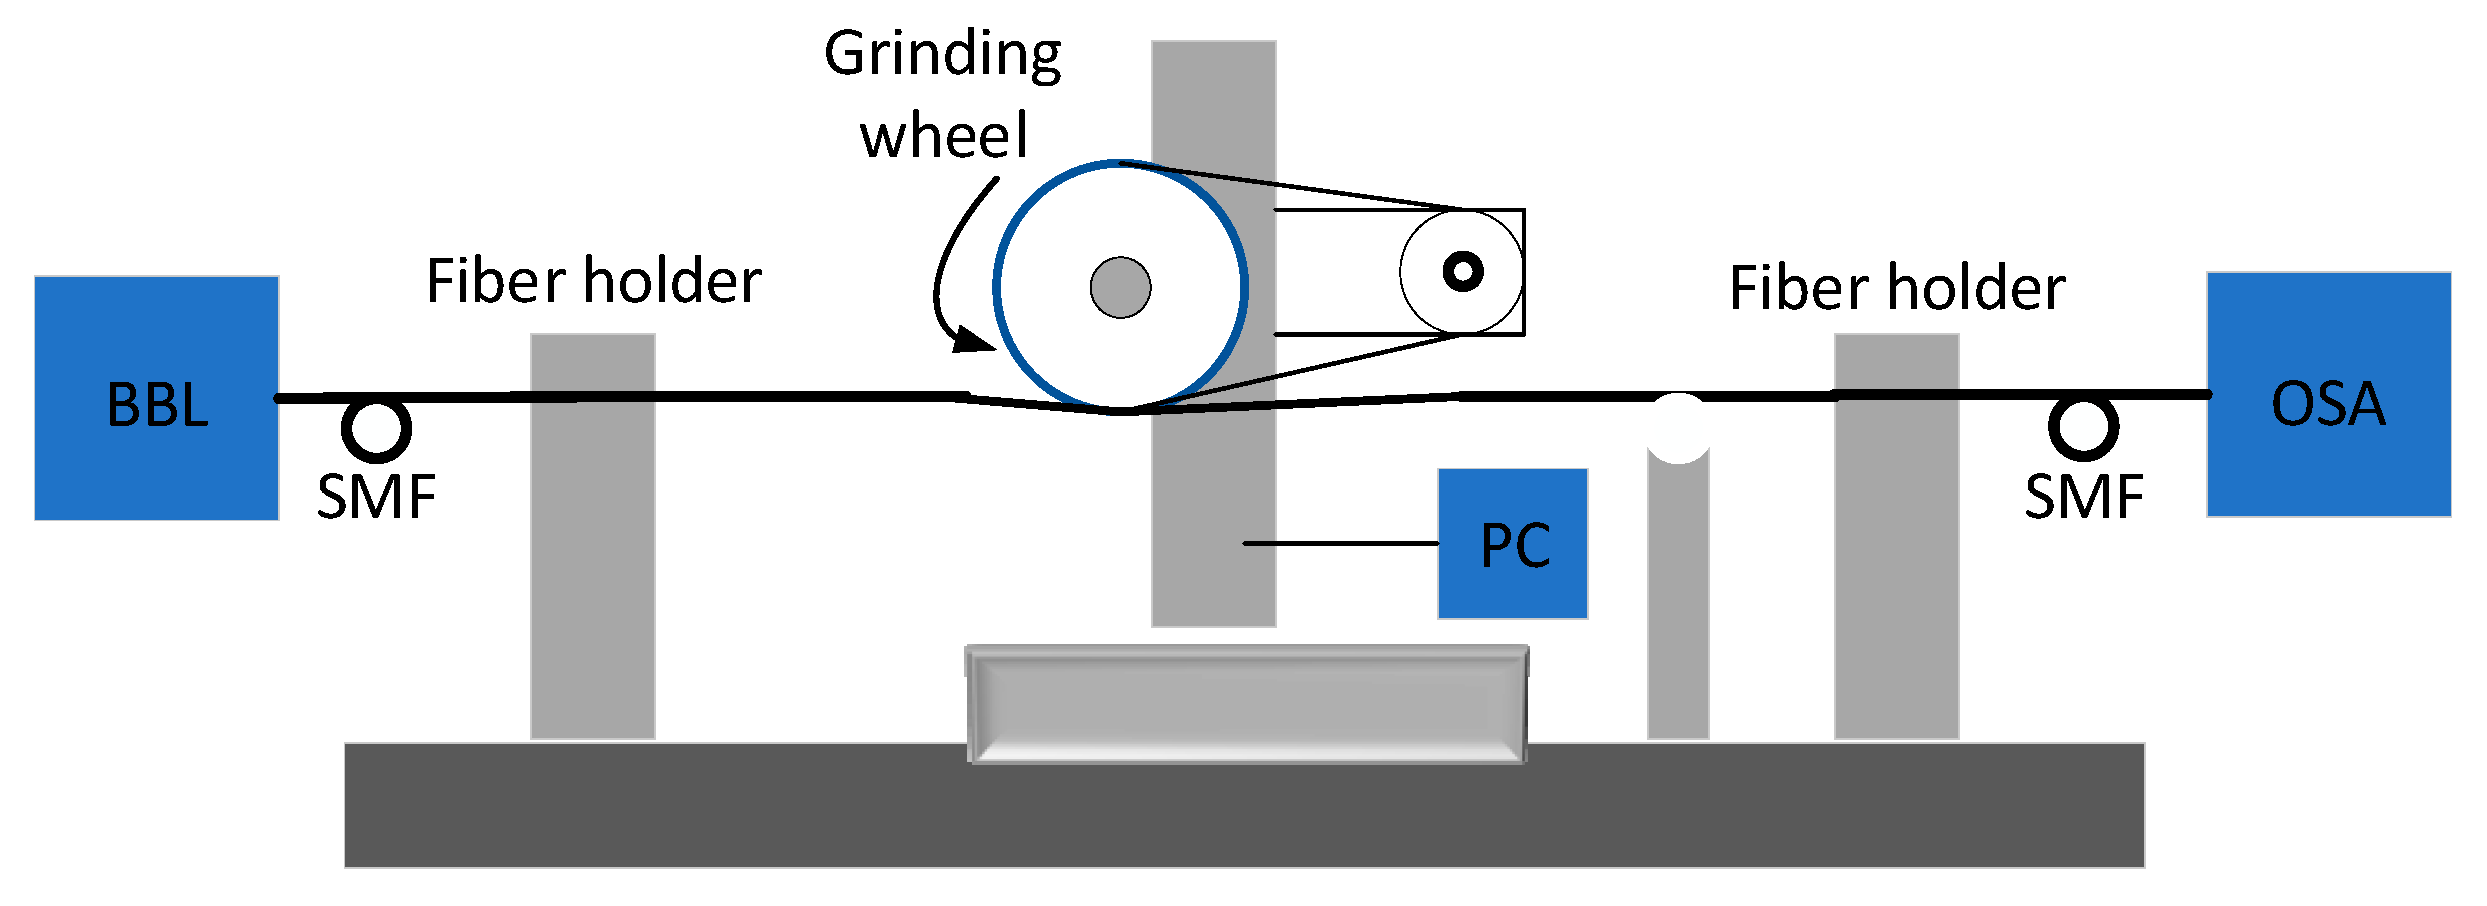
Figure 2 indicates the wheel side polishing technique which is used for manufacturing the SP fiber [
21]. The coated section of SMF is held compactly over the fixed motor driven wheel by two fiber clampers. In this method, a PC controller is associated to the polished layer for observing remaining fiber depth till the fiber core is revealed. The connection of light source and optical spectrum analyzer monitors the overall polishing process and attenuation of light transmission along the fiber [
22].
3. Numerical results
In the simulation analysis, two different studies have been carried out based on (i) COMSOL Multiphysics and (ii) Beam PROP implementing (i) the Finite Element Method (FEM) and (ii) the finite differences beam propagation method (FD-BPM), respectively [
23]. In the FEM model, the completed mesh consists of 1512 domain elements and 184 boundary elements. The wavelength range is taken from 1460 to 1580 nm. Pure silica is used as a background material of the cladding region with a refractive index of 1.444, while the core section consists of the doped silica with the refractive index of 1.445 at the wavelength equal to 1500nm.
The dispersion relation of the refractive index of pure silica and analytes have been calculated by using the Sellimeier equation [24,25]. For silica the following equation has been used [
26].
where
n is the effective refractive index of the pure silica glass, the values for the constant variables are
A1 = 0.6961663, A2 = 0.4079426, A3 = 0.8974794, B1 = 0.0684043, B2 = 0.1162414, B3 = 98.96161 and
λ is the operating wavelength in (nm).
In the FEM, the light transmission of the SP-SMF has been examined which is employed to evaluate and calculate the propagating modes profile of the proposed structure. During the simulation assessment an external coating covers a perfectly matched layer (PML). The refractive index of analytes like air, water, and isopropanol have been assumed at the polished region of the fiber. The different mode profiles of light spectra with respect to change in refractive index have been shown in
Figure 3.
The chosen analytes have lower refractive indexes than 1.45 (silica) in which the most part of light confines into the core region. From the inspection of
Figure 3, it seems that a small portion of light is gradually moving from the core to tapered region as the refractive index of the analyte
n increases. The propagation of light totally depends on the refractive index of the materials. When the signals pass through the tapered region, the light spectrum moves to the polished surface due to the effect of analytes. Thus, the transient impulse is created, and light modes travel through the analytes section. In this way, the impacts of the SP-SMF arrangements converted the digital signals into physical parameters involving the silica refractive index.
Similarly, a simulation study based on the beam propagation method is carried out to analyses the mode distribution when the refractive index of the analyte is changing. The mode profile in the tapered region with the analytes of (air, water, and IPA) is depicted in
Figure 4. The beam propagation method shows the electric field distribution on the transmitting mode varies with the change of analytes. It seems that there is a little conversion of light mode to the tapered region as the refractive index increases from 1.0 to 1.37. When it reaches up to 1.45 (silica), the confinement of light fully transferred from core region to tapered region due to the higher refractive index of analytes.
The transmitted signals of the side polished SMF composition have been simulated, which can be determined by using the following equation [
27]:
where
refers the operating wavelength,
considers the imaginary part of the effective refractive index of the fundamental mode, and
L indicates the length of the sensing area of the side-polished fiber.
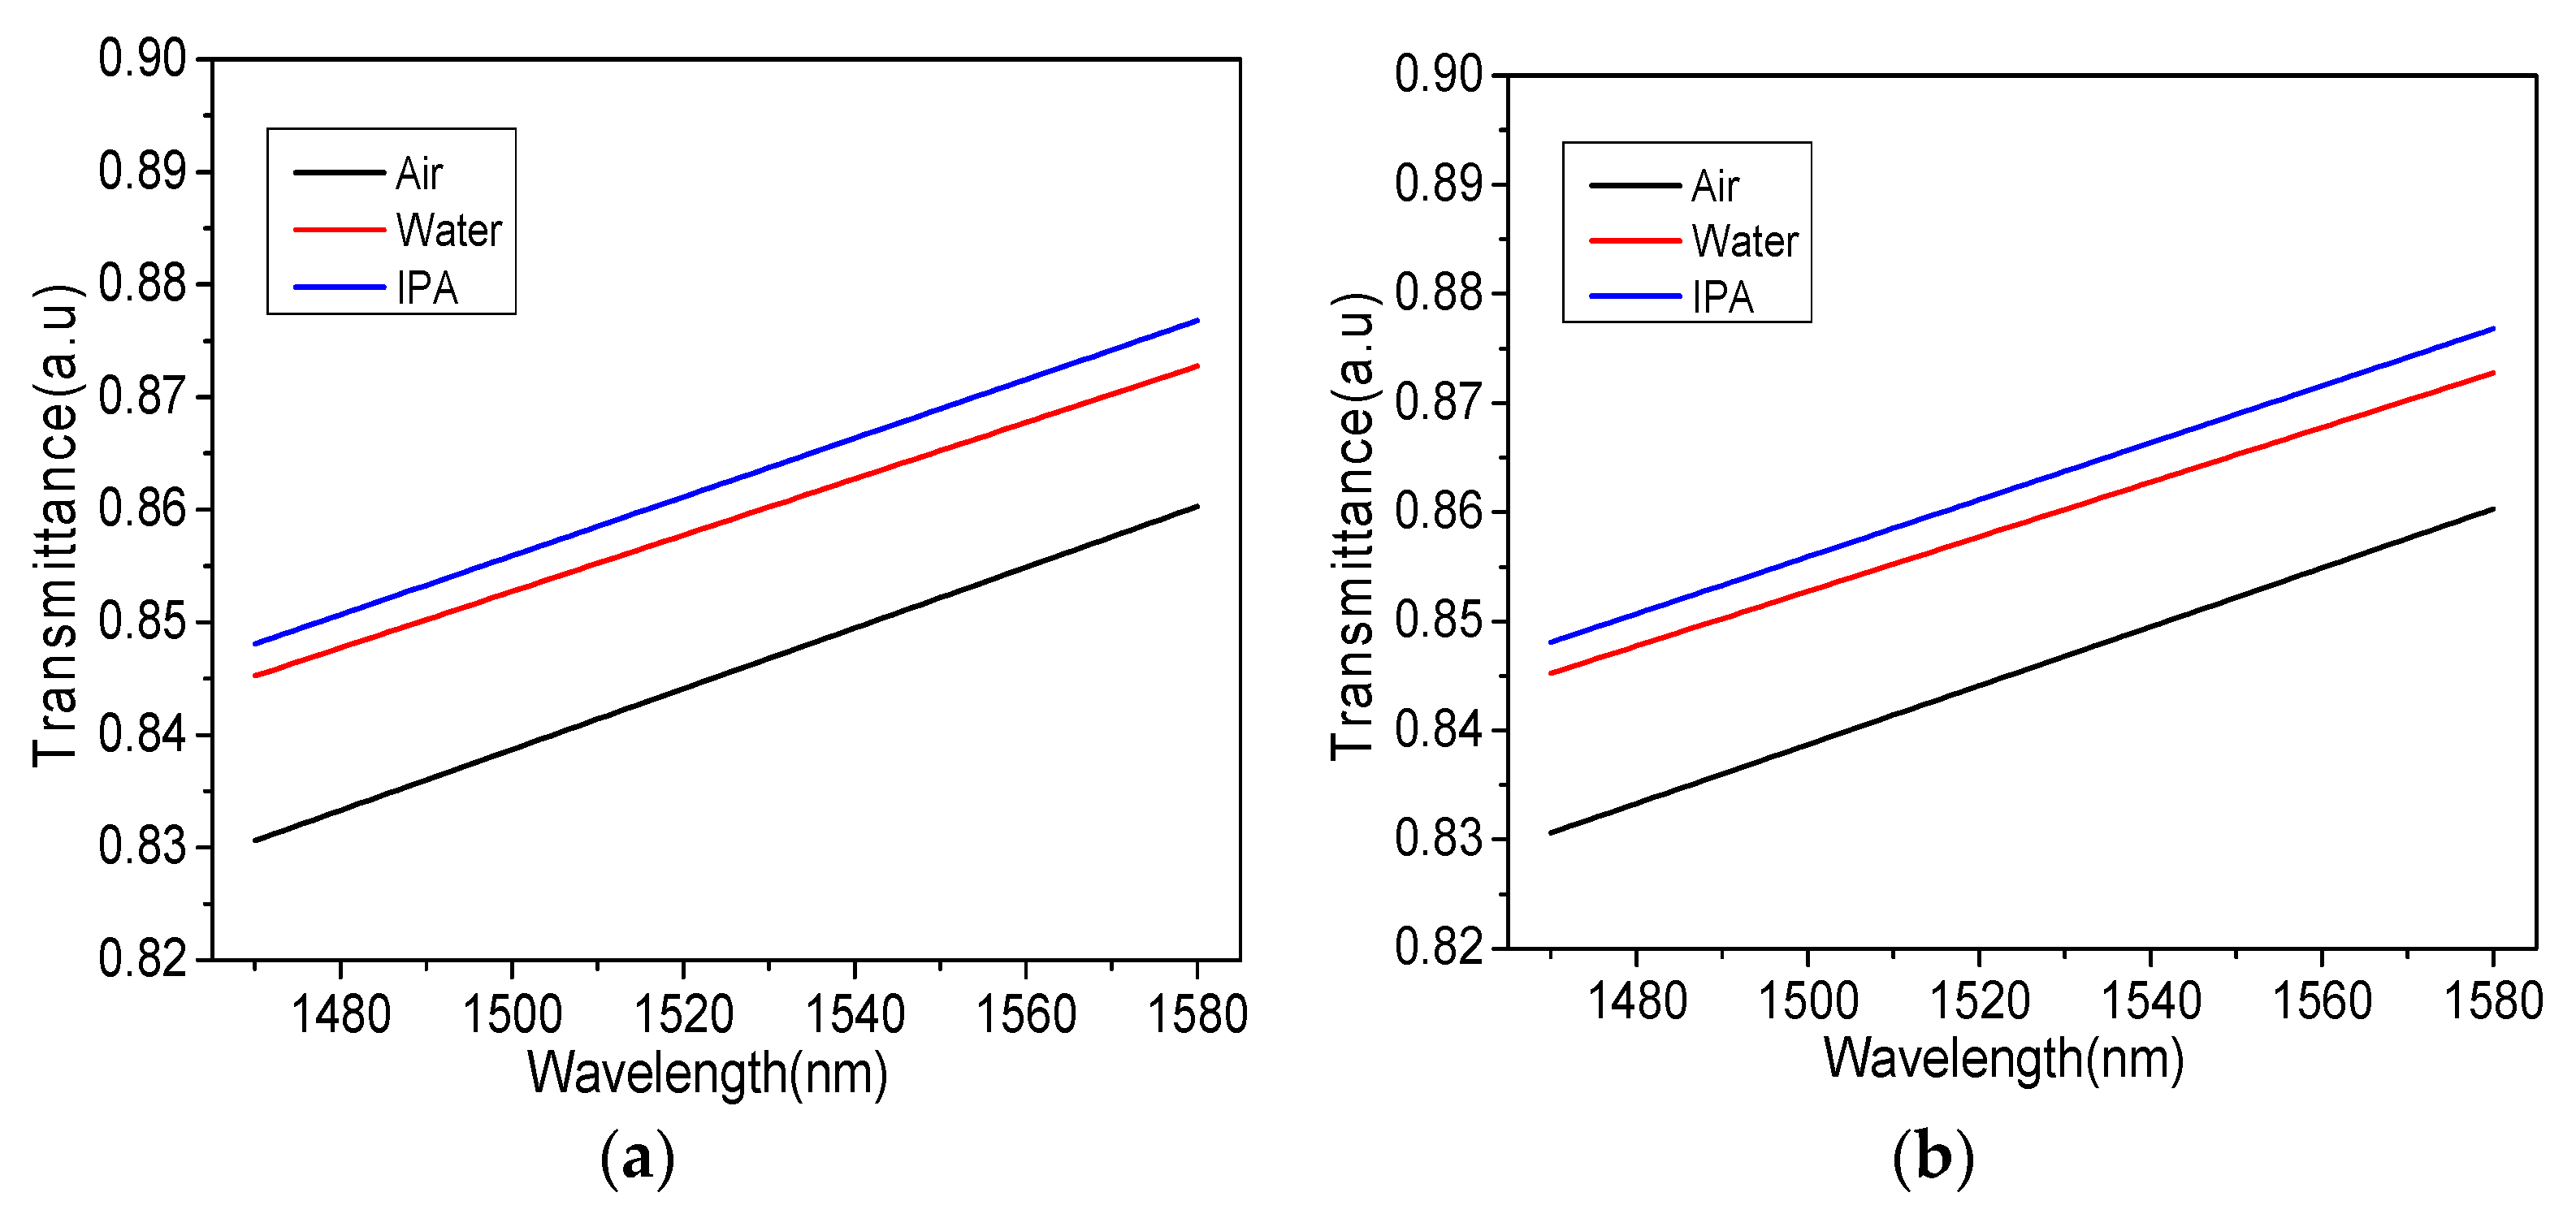
Moreover, the transmittance when air, water, and isopropanol are set in the polished region has been studied by using the FEM and FD-BPM as shown in
Figure 5(a) and 5(b), respectively. The plot in Fig. 4(a) shows that, at the wavelength of 1530nm, the transmittance of isopropanol (T=0.869) is higher than water (T=0.859) and air (T=0.842) respectively. The transmittance also depends on the wavelength, which is going to increase as wavelength increases.
The same trend has been obtained in the case of the FD-BPM method leading to a good agreement between the two methods.
4. Experimental setup
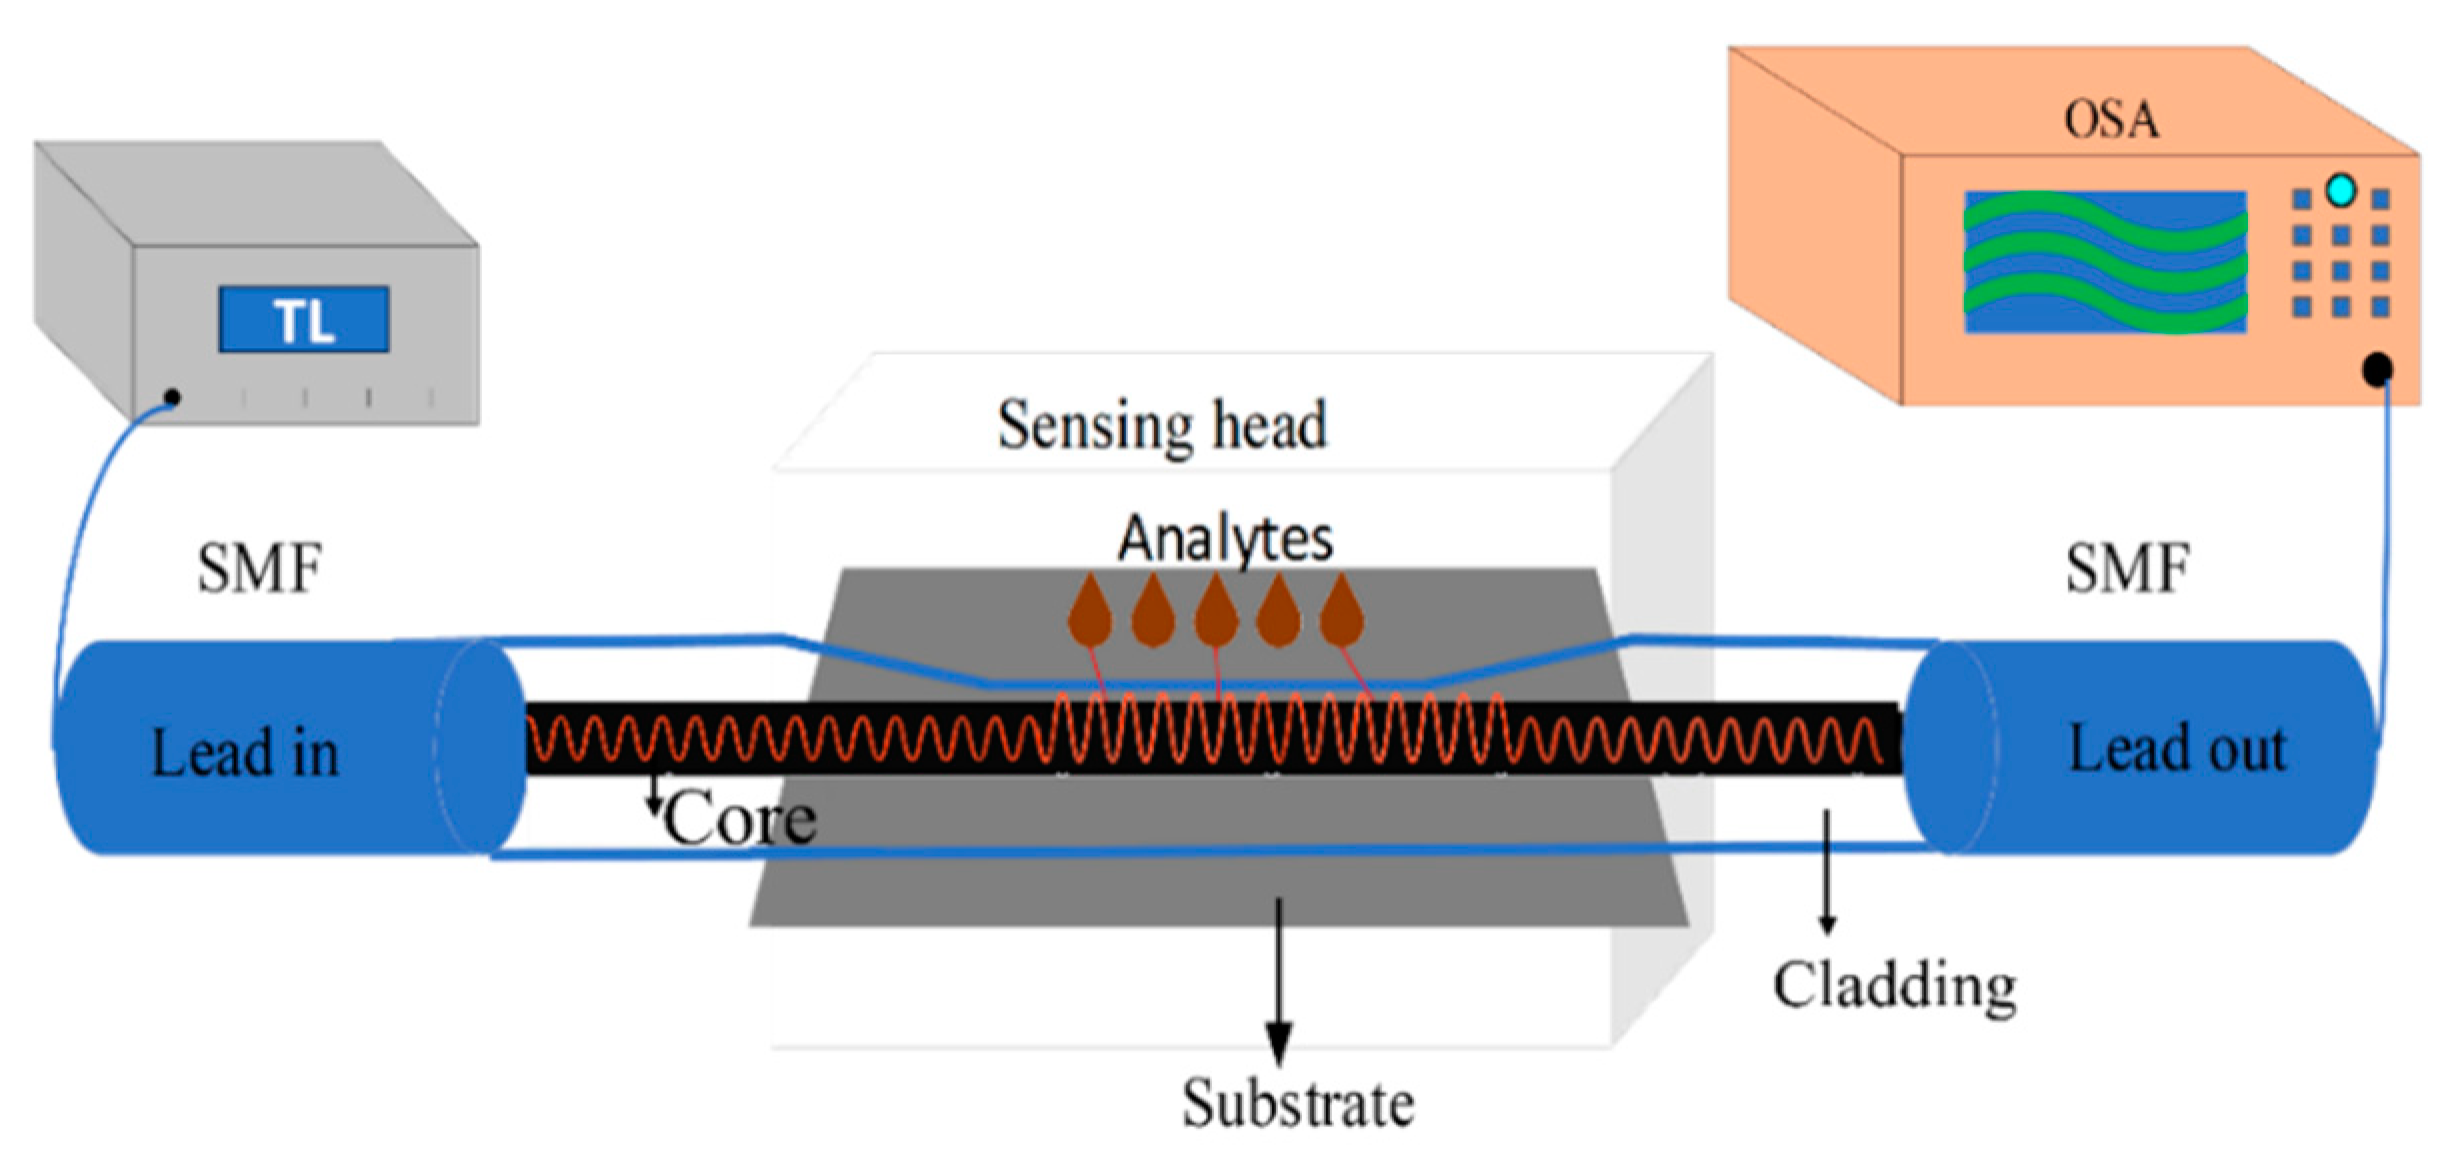
To validate the above simulation studies, the experimental setup has been designed to exploit the side polished SMF-28 (from Phoenix Photonics Ltd). The overall experimental schematic diagram has been shown in
Figure 6, which comprises the necessary instruments for the optical characterization. A tunable laser (TL) with a tunable wavelength range of 1460nm to 1580nm has been used as a source and connected to the fiber. The output signal was sent to a photodetector (New Focus-2033, USA) that was connected to an oscilloscope to detect the transmitted signal. The whole experimental process is taken under the room temperature (25
oC).
The microscopic view of tapered or polished region has been shown in
Figure 7(a). Here the sensing and polished of the SP fiber is shown along with the tapered regions (on the left and right sides). Both ends of SP fiber are connectorized by FC/PC connectors to lead in and out the light. To achieve the stability and minimize the signal noise, SP fiber has been kept inside a 3D printed reservoir which is shown in
Figure 7(b). The shape of the reservoir is shallow deep in the middle, where the analytes or liquids have been filled at the upper part of the tapered region.
5. Results and discussion
In the wavelength range of interest (1460nm to 1580nm), the photodetector sensitivity was set to low, and the input power was set to 4mW.
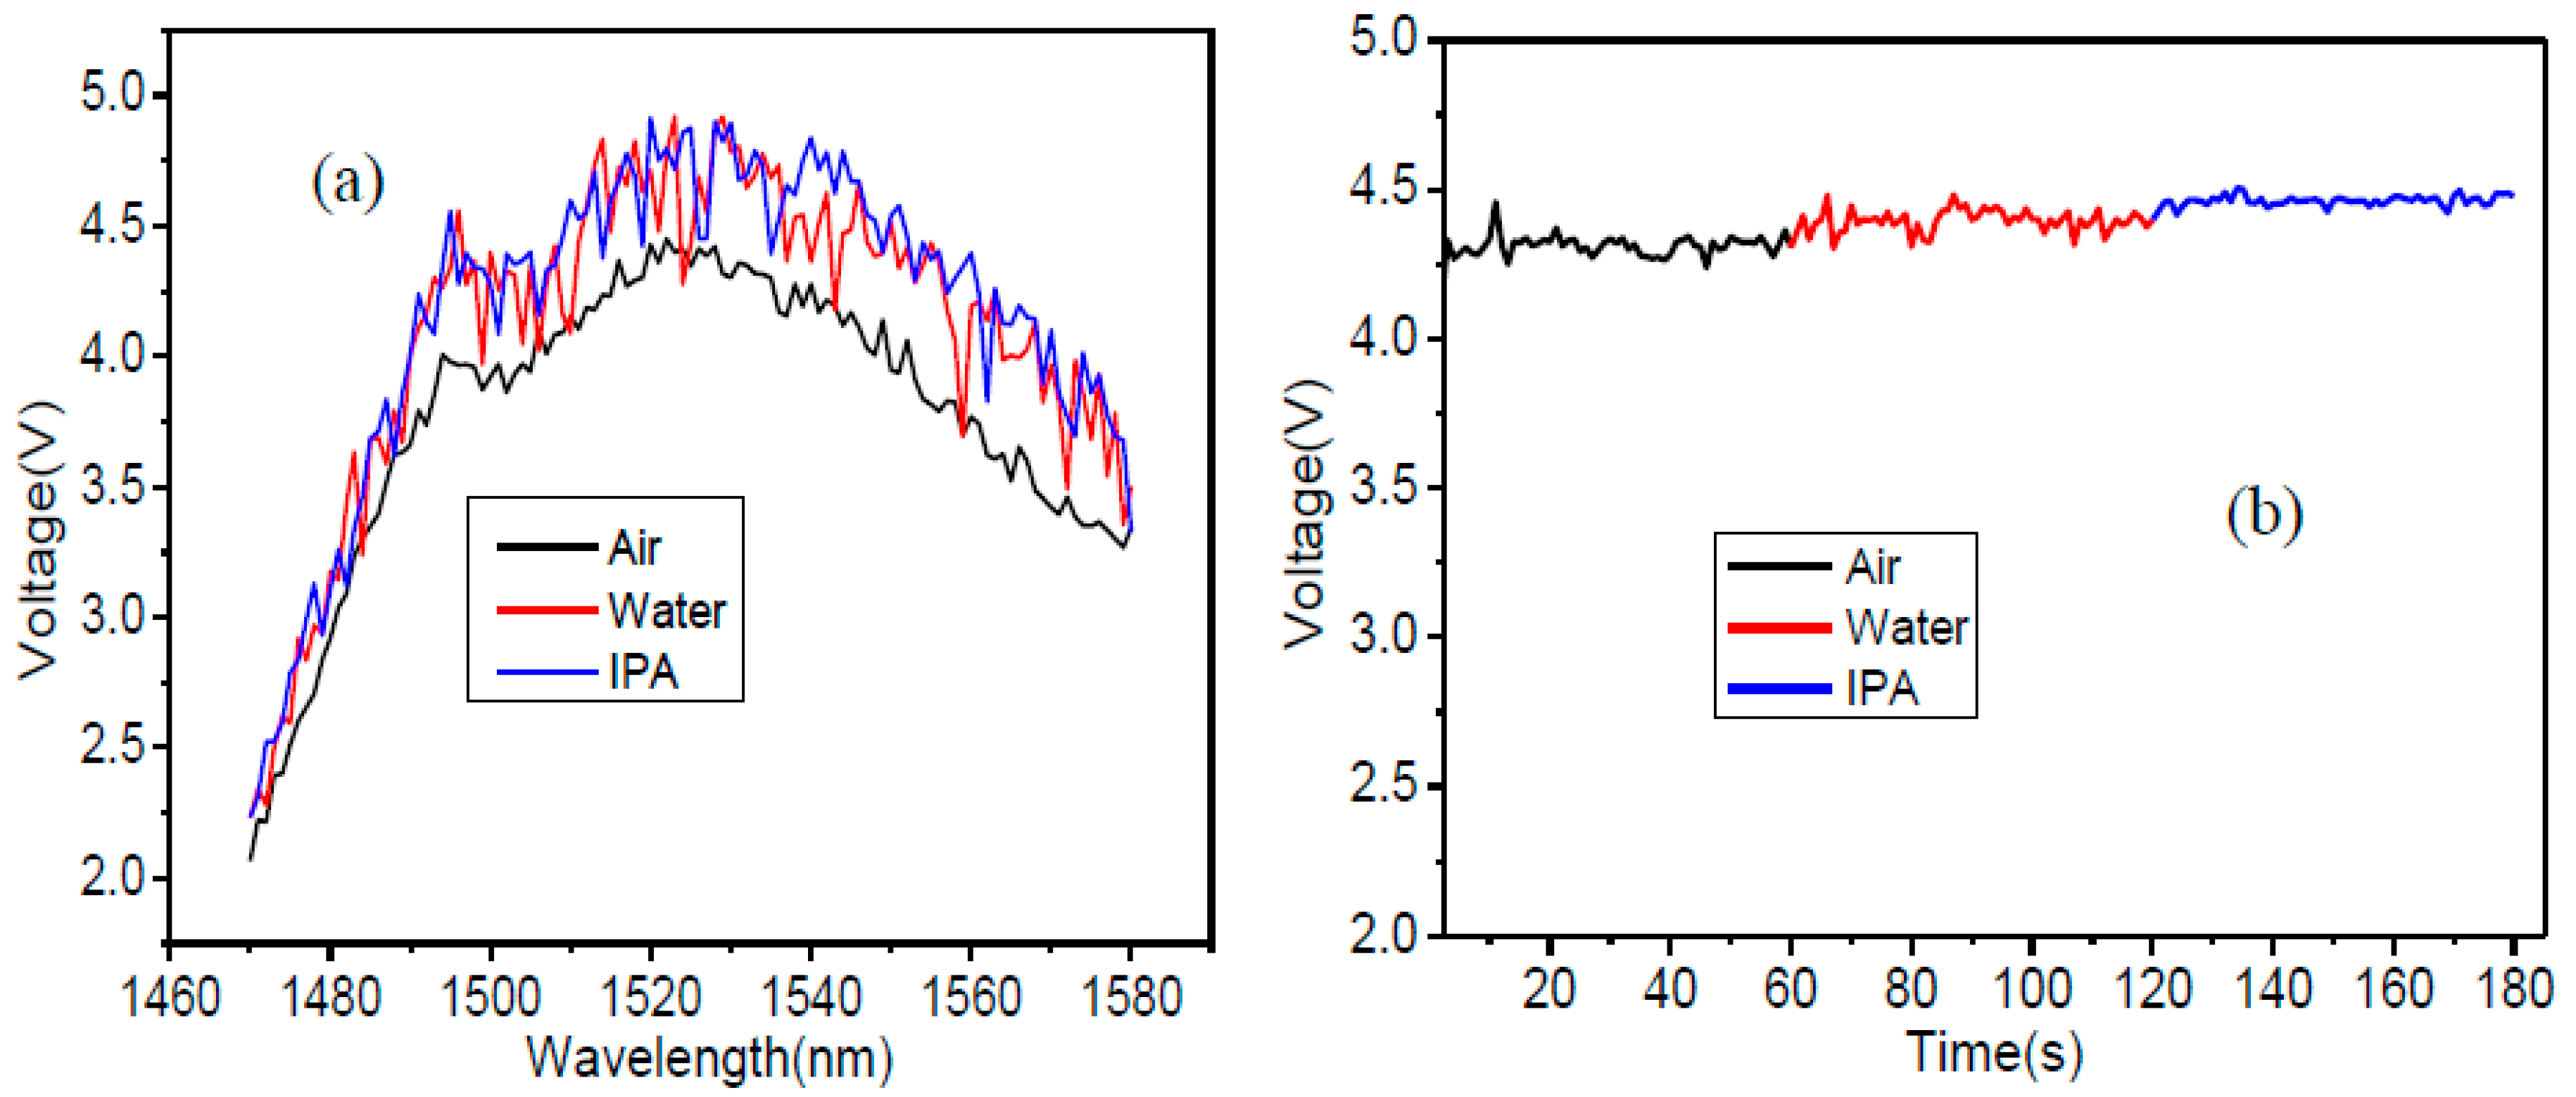
Figure 8(a) indicates experimental results with air, water, and isopropanol, respectively. This graph illustrates that isopropanol (blue curve) shows a higher voltage as it has a higher refractive index than air and water. After that there is a decrease in the voltage with the increase of wavelength. Here, the effect of some noise can be seen which depends on the optical setup and instruments (photodetector and oscilloscope). Furthermore, the plotted graph indicates the highest voltage at the wavelength of 1530nm at which the maximum voltages of air, water and IPA are 4.350 V, 4.708 V, and 4.797 V, respectively. The voltage differences between air, water, and isopropanol are 0.44 V, 0.35 V, and 0.089 V as the refractive index of air water and isopropanol are 1.0, 1.33, and 1.37 respectively. The voltage of isopropanol is higher than the water and air. However, there is not much difference in voltage between the isopropanol and water, due to the close refractive indexes.
Moreover, the analysis of air, water, and isopropanol has been explored with respect to time variation. The wavelength has been fixed at 1530nm, where the maximum power is achieved. The same parameters as the input power equal to 4 mW and low sensitivity was used. The overall time duration was set equal to 0 to 180s, which was equally distributed for the whole analytes. The experimental graph with respect to voltage and time variation has been outlined in
Figure 8(b). This graph indicates the evaluation of air, water and isopropanol with real time measurement. It has been seen that with the variation of time and change the analytes, the voltage is changing accordingly, the average voltage for each liquid is quite constant. This accounts for the repeatability and validation of SP-SMF fiber effect with various liquids and air. Hence it is confirmed that the voltage with respect to wavelength and time variations of analytes (air, water, and isopropanol) have the same behavior.
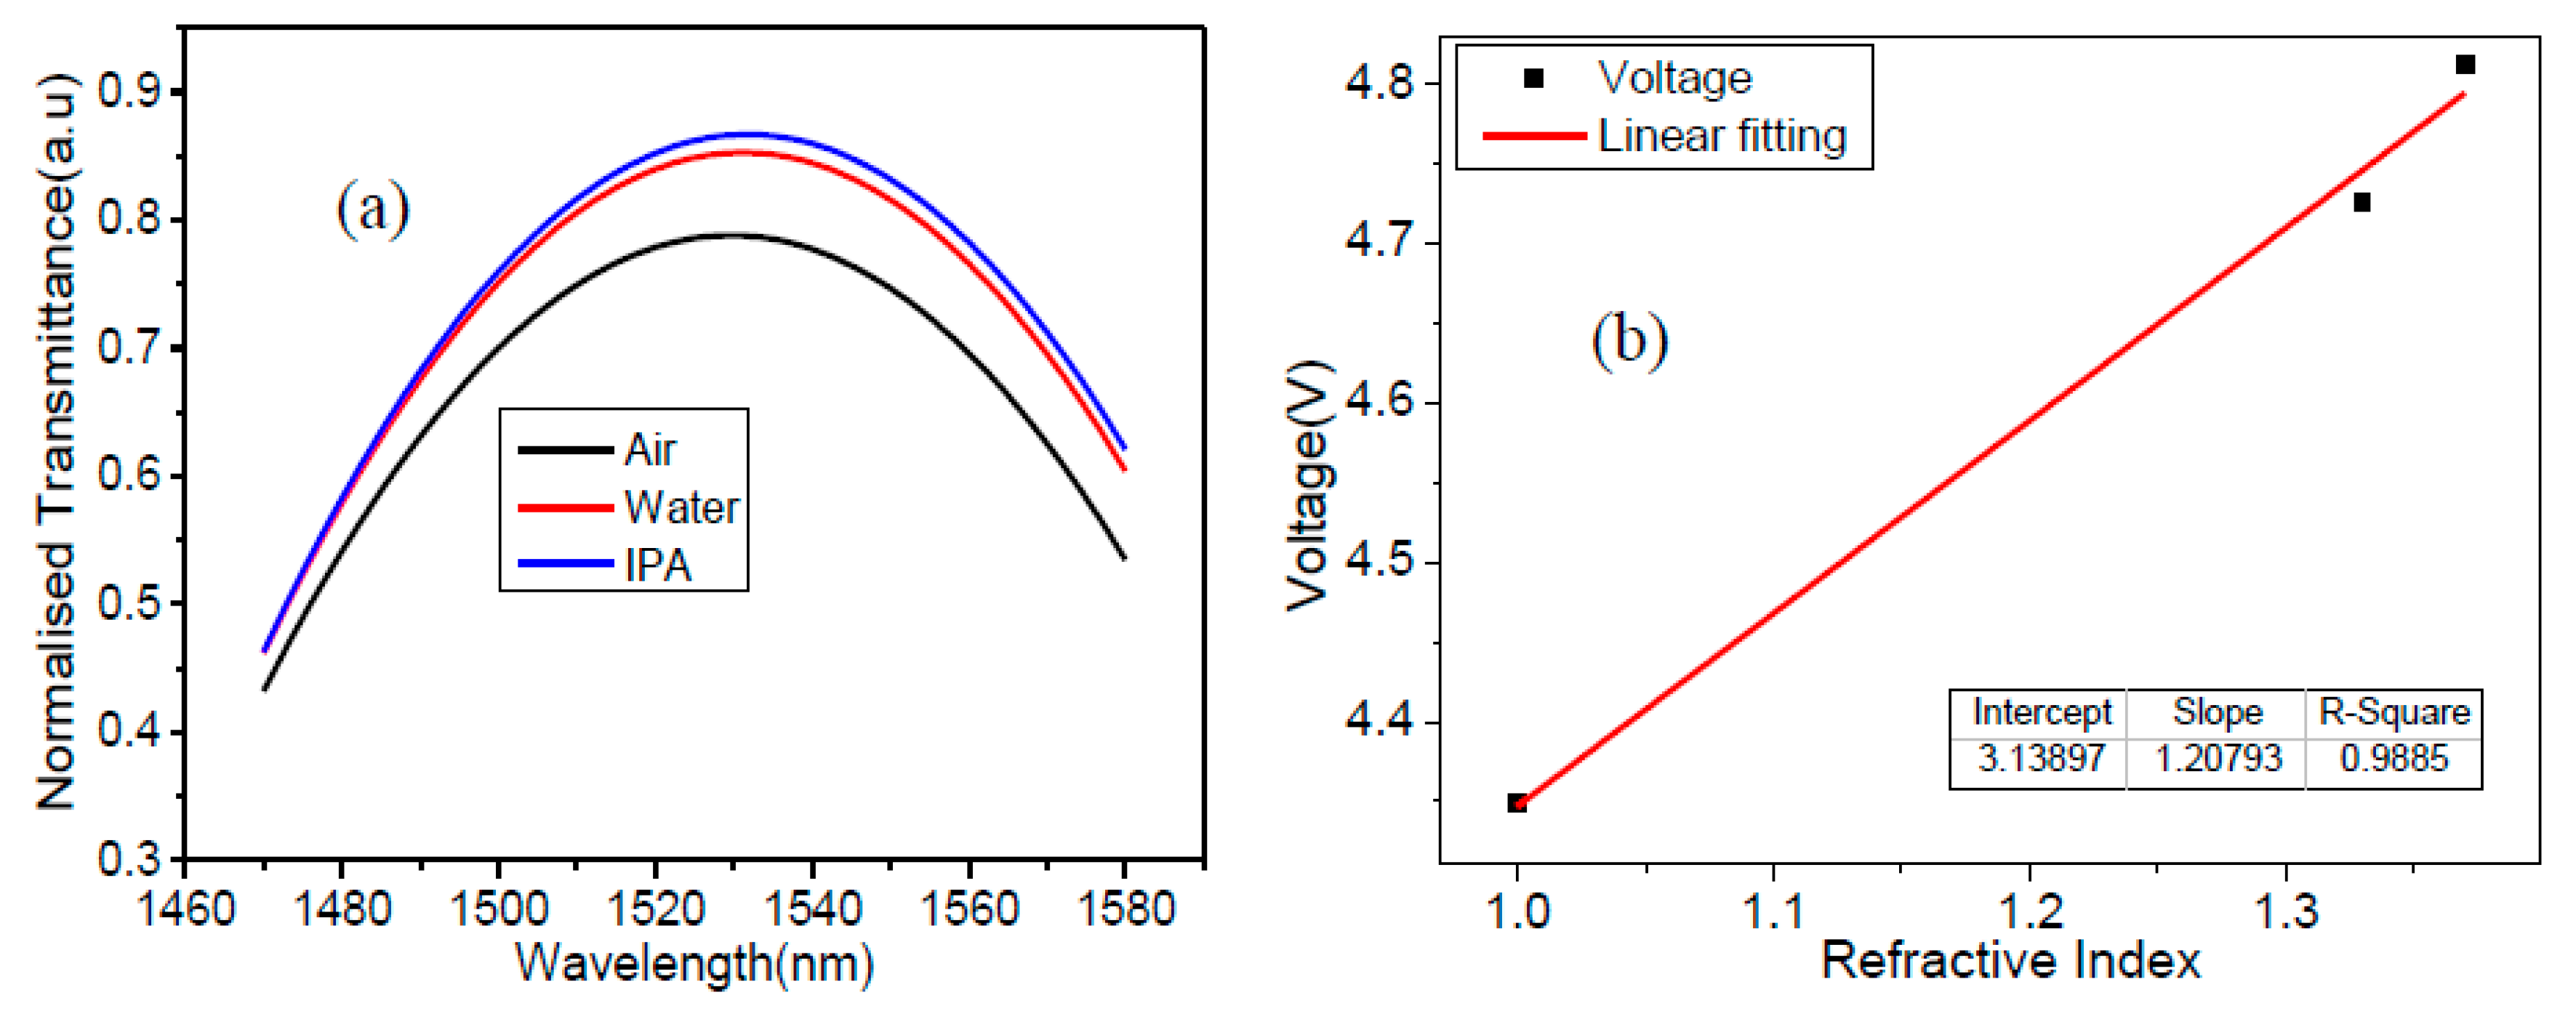
Furthermore, to shed the light comparison with the simulation study, the experimental results are normalized and fitted for air, water, and IPA as a surrounding media. Notably,
Figure 9(a), shows a discernible difference in transmittance, revealing a relative change of 6 % between air and water and 2 % between water and IPA at the wavelength of 1530 nm. To check the performance of the proposed SP-SMF model, the sensitivity has been calculated which is the variation of refractive index occurs with the change of analytes and the voltage. The sensitivity
(S) of the proposed model with respect to wavelength and the voltage has been measured by the following equation [
28]:
where
is the variation of the refractive index, and
is the change of voltage.
Correspondingly,
Figure 9(b) shows the linear fitting curve of experimental study by relating the voltage with the change of refractive index of considered analytes. The sensitivity of the analytes is achieved as 1.207
V/RIU with the adjacent R
2 is 0.988. By comparing the simulations and experimental work, the results are in good agreement since the same behavior has been achieved.
6. Conclusion
In conclusion, the SP-SMF structure for assessing the refractive index of different analytes (air, water, and isopropanol) has been investigated through numerical and experimental study. Two different numerical tools, based on FEM and FD-BPM, have been explored to verify the proposed geometry and calculate the effective refractive index and the transmittance. Moreover, an experimental setup has been realized to compare the experimental results with the numerical findings when the tapered region of SPF structure is filled with different analytes. The obtained sensitivity of the analytes is received as 1.207 V/RIU with the adjacent R2 is 0.988.This designed model and setup could be exploited for the realization of building blocks for sensing applications. Furthermore, the investigation of different sizes of core region, tapered layer, and sensing region could be adjusted and optimized to improve the sensing performance of new types of SP-SMF.
Author Contributions
Conceptualization, S.L.-A and M.G.; Methodology M.M.B and A.T.; Validation, M.G and S.L.-A.; Formal analysis, M.M.B.; Data curation, A.T.; Writing—original draft, M.M.B.; Writing—review & editing, A.T.; Supervision, S.L.-A and M.G. All authors have read and agreed to the published version of the manuscript.
Funding
This research is funded by Instituto Tecnológico y de Estudios Superiores de Monterrey, Mexico.
Data availability
Data implicit in the results submitted in this report are not publicly accessible at this time but may be obtained from the authors upon reasonable request.
Acknowledgment
We are thankful by the support and help of Conacyt Organization, Mexico. We also acknowledge the fruitful discussion with Liam O’ Faolain, Tyndall National Institute, T12 PX46 Cork, Ireland.
Disclosures
The authors declare that there is no conflict of interest.
References
- W. Lin, Y. Liu, L. Shao, and V. MI, "A fiber ring laser sensor with a side polished evanescent enhanced fiber for highly sensitive temperature measurement," Micromachines (Basel) 12(5), 586 (2021). [CrossRef]
- H. Lu, Y. Yue, J. Du, L. Shao, T. Wu, J. Pan, and J Hu, "Temperature and liquid refractive index sensor using PD fiber structure-based Sagnac loop," Opt Express 26(15), 18920–18927 (2018). [CrossRef]
- Y. Dong, S. Xiao, B. Wu, H. Xiao, and S Jian, "Refractive index and temperature sensor based on D-shaped fiber combined with a fiber Bragg grating," IEEE Sensors Journal 19(4), 1362–1367 (2018). [CrossRef]
- M. M. Bilal, W. Bi, F. Jaleel, L. Y, M. N. Sohail, M. Irshad, and H. A. Madni, "Magnetic fluid-based photonic crystal fiber for temperature sensing," Optical Engineering 58(7), 072008 (2019). [CrossRef]
- M. M. Bilal, W. Bi, X. Liu, L. Yang, J. Wa, and H. A. Madni, "Magnetic field sensor based on the magnetic fluid infiltration into the cladding air holes of the solid-core photonic crystal fiber," Optical Engineering 58(09), 096107 (2019). [CrossRef]
- Chen, Y. Liu, Q. Liu, and W Peng, "Temperature-compensating fiber-optic surface plasmon resonance biosensor," IEEE Photonics Technology Letters 28(2), 213–216 (2015). [CrossRef]
- Y. Dong, S. Xiao, H. Xiao, J. Liu, and C Sun, "An optical liquid-level sensor based on D-shape fiber modal interferometer," IEEE Photonics Technology Letters 29(13), 1067–1070 (2017). [CrossRef]
- H. A. Madni, S. Koziel, M. M. Bilal, M. Afzal, F. Jaleel, A. Sohaib, and W. X. Jiang, "Shrinking-shifting and amplifying-shifting device using transformation optics," Opt Quantum Electron 54(7), 399 (2022). [CrossRef]
- L. Liu, Z. Liu, Y. Zhang, and S Liu, "Side-polished D-type fiber SPR sensor for RI sensing with temperature compensation," IEEE Sens J 21(15), 16621–16628 (2021). [CrossRef]
- G. An, S. Li, H. Wang, X. Zhang, and X Yan, "Quasi-D-shaped optical fiber plasmonic refractive index sensor," Journal of Optics 20(3), 035403 (2018). [CrossRef]
- D. Li, W. Zhang, H. Liu, J. Hu, and G Zhou, "High sensitivity refractive index sensor based on multicoating photonic crystal fiber with surface plasmon resonance at near-infrared wavelength," IEEE Photonics Journal 9(2), 1–8 (2017). [CrossRef]
- N. Cennamo, P. Zuppella, and D Bacco, "SPR sensor platform based on a novel metal bilayer applied on D–shaped plastic optical fibers for refractive index measurements in the range 1.38–1.42," IEEE Sensors Journal 16(2), 4822–4827 (2016). [CrossRef]
- A. Patnaik and K Senthilnathan, "Graphene-based conducting metal oxide coated D-shaped optical fiber SPR sensor," IEEE Photonics Technology Letters 27(23), 2437–2440 (2015). [CrossRef]
- N. Luan, R. Wang, W. Lv, and J Yao, "Surface plasmon resonance sensor based on D-shaped microstructured optical fiber with hollow core," Opt Express 23(7), 8576–8582 (2015). [CrossRef]
- W. Jin, X. Li, S. Wu, X. Fu, G. Fu, M. M. Bilal, and W Bi, "Highly sensitive temperature sensing probes based on liquid cladding elliptical micro/nanofibers," Opt Express 28(14), 20062–20073 (2020). [CrossRef]
- X. Wang, X. Wang, H. Deng, and L. Yuan, "Ultra-high sensitivity SPR temperature sensor based on a helical-core fiber," Opt Express 29(14), 22417–22426 (2021)
. [CrossRef]
- S. Yusoff, C. Lim, S. Azzuhri, H. Ahmad, and R Zakaria, "Studies of Ag/TiO2 plasmonics structures integrated in side polished optical fiber used as humidity sensor," Results in Physics 10, 308–316 (2018). [CrossRef]
- R. Xu, G. Niu, Y. Xue, C. Ke, H. Deng, and S Deng, "An All-Optical Vector Magnetic Field Sensor Based on Magnetic Fluid and Side-Polished Hollow-Core Optical Fiber," IEEE Sensors Journal 21(19), 21410–21416 (2021). [CrossRef]
- C. Teng, S. Ying, R. Min, S. Deng, H. Deng, M. Chen, X. Chu, L. Yuan, Y. Cheng, and M. Xue, "Side-Polish Plastic Optical Fiber Based SPR Sensor for Refractive Index and Liquid-Level Sensing," Sensors 22(16), 6241 (2022). [CrossRef]
- G. Wang, S. Li, G. An, X. Wang, Y. Zhao, W. Zhang, and H. Chen, "Highly sensitive D-shaped photonic crystal fiber biological sensors based on surface plasmon resonance," Opt Quantum Electron 48(1), 1–9 (2016). [CrossRef]
- R. Chu, C. Guan, Y. Bo, J. Shi, Z. Zhu, and P. Li, "All-optical graphene-oxide humidity sensor based on a side-polished symmetrical twin-core fiber Michelson interferometer," Sens Actuators B Chem 284, 623–627 (2019). [CrossRef]
- L. Zhuo, J. Tang, W. Zhu, H. Zheng, H. Guan, H. Lu, Y. Chen, Y. Luo, J. Zhang, Y. Zhong, J. Yu, and Z. Chen, "Side Polished Fiber: A Versatile Platform for Compact Fiber Devices and Sensors," Photonic Sensors 13(1), 1–24 (2022). [CrossRef]
- U. Kamilov, I. N. Papadopoulos, M. H. Shoreh, A. Goy, C. Vonesch, M. Unser, and D. Psaltis, "Optical tomographic image reconstruction based on beam propagation and sparse regularization," IEEE Trans Comput Imaging 2(1), 59–70 (2016). [CrossRef]
- M. M. Bilal, S. López-Aguayo, M. Szczerska, and H.A Madni, "Multi-functional sensor based on photonic crystal fiber using plasmonic material and magnetic fluid," Appl Opt 61(35), 10400–10407 (2022). [CrossRef]
- K. Moutzouris, M. Papamichael, S. C. Betsis, I. Stavrakas, G. Hloupis, and D. Triantis, "Refractive, dispersive and thermo-optic properties of twelve organic solvents in the visible and near-infrared," Applied Physics B 116(3), 617–622 (2014). [CrossRef]
- G. Hale and MR Querry, "Optical constants of water in the 200-nm to 200-μm wavelength region," Appl Opt 12(3), 555–563 (1973).
- Q. Wang, J. Jing, X. Wang, LY Niu, and W. M. Zhao, "A D-shaped fiber long-range surface plasmon resonance sensor with high Q-factor and temperature self-compensation," IEEE Transactions on Instrumentation and Measurement 69(5), 2218–2224 (2019). [CrossRef]
- M. A. Mollah, H. Sarker, M. Ahsan, M. T. Elahi, M. A. Based, J. Haider, and S. Palani, "Designing Highly Sensitive Surface Plasmon Resonance Sensor with Dual Analyte Channels," IEEE Access 9, 139293–139302 (2021). [CrossRef]
|
Disclaimer/Publisher’s Note: The statements, opinions and data contained in all publications are solely those of the individual author(s) and contributor(s) and not of MDPI and/or the editor(s). MDPI and/or the editor(s) disclaim responsibility for any injury to people or property resulting from any ideas, methods, instructions or products referred to in the content. |
© 2023 by the authors. Licensee MDPI, Basel, Switzerland. This article is an open access article distributed under the terms and conditions of the Creative Commons Attribution (CC BY) license (http://creativecommons.org/licenses/by/4.0/).

