Preprint
Article

Splenic Stiffness Measured by 3-Tesla Magnetic Resonance Elastography Is Correlated with Age in Healthy Individuals

Altmetrics

Downloads

61

Views

22

Comments

0

This version is not peer-reviewed

Submitted:

16 October 2023

Posted:

17 October 2023

You are already at the latest version

Alerts
Abstract
Background: We aimed to determine the splenic stiffness (SS) values in healthy individuals as measured by 3 Tesla magnetic resonance elastography (3T MRE) and to investigate the possible effects of parameters such as age, sex, spleen volume, diameter, and parenchyma thickness on SS. Methods: A total of 54 healthy volunteers were included in this cross-sectional study. Participants' age and sex information were recorded, in addition to spleen craniocaudal and anteroposterior diameter, cortical thickness, spleen volume, and SS, which were measured using 3T magnetic resonance imaging and MRE. Results: Twenty-nine male and 25 female subjects with a mean age of 54.78±15.40 years were included in the study. Mean cradiocaudal diameter was 10.46±1.16 cm, anteroposterior diameter was 9.88±1.29 cm, parenchyma thickness was 4.08±0.67 cm, SS was 3721.94±709.69 Pascal (Pa), and median spleen volume was 292.54 (239.40-311.00) cm3. A significant positive correlation was observed between age and SS (r=0.779, p<0.001). The SS values were not associated with sex, craniocaudal diameter, anteroposterior diameter, parenchymal thickness, or volume Conclusion:Age should be considered when using SS in the diagnosis and staging of relevant diseases such as portal hypertension and esophageal varices. Our results should be confirmed by future studies using 3T MRE in larger populations.
Keywords: 
Subject: Medicine and Pharmacology  -   Medicine and Pharmacology

1. Introduction

The spleen, the largest secondary immune organ in humans, plays a pivotal role in initiating immune responses against antigens present in the blood, as well as carrying out its better-known function as a filter that removes foreign particles and old or impaired red blood cells from the circulation [1]. The size and elasticity (firmness or stiffness) of the spleen are important clinical examination findings which can be associated with infections, malignancies, storage disorders, and diseases impacting the liver and the hematological system [2].
Spleen elasticity has demonstrated its utility in diagnosing, staging, and evaluating conditions such as portal hypertension and esophageal varices. Examination of elasticity can also be used to assess response to β-blocker therapy in high-risk esophageal varices, to monitor patients receiving transjugular intrahepatic portosystemic shunts, and to examine cirrhosis or hepatic fibrosis [3,4,5,6,7,8].Over the past decade, spleen stiffness (SS) measurements have been demonstrated to be valuable in predicting especially esophageal varices and clinically significant portal hypertension [9]. These relationships are largely explained by the impact of the portal vein system [10], since passive congestion and tissue hyperplasia due to extrahepatic hemodynamics can increase SS [11]. While certain studies underscore the effectiveness of SS in forecasting and staging esophageal varices [3,12,13,14], some studies highlight its inconsistency and poor repeatability [15,16,17]. These controversial findings may be a result of different measurement methodologies and insufficient examination of various factors that could affect SS and its quantification. For instance, it remains uncertain whether factors such as spleen volume, diameter, thickness, age, sex, ethnicity, genetic factors, and anthropometric measurements affect SS. In addition, there is a paucity of data regarding reference ranges for SS, due to the small number of studies in healthy individuals [2,10,18,19,20,21].
Various techniques have been described for measuring SS, such as transient elastography, acoustic radiation force impulse (ARFI) [21], shear wave elastography (SWE) [22], real-time tissue elastograph (RTE) [23], virtual touch tissue quantification [24], and magnetic resonance elastography (MRE) [25,26]. However, each modality has certain disadvantages. Transient elastography, which is one of the most widely used methods for the evaluation of organ stiffness, requires a special fibroscan device and reliability is proven to be limited in the presence of obesity and ascites [27]. ARFI and 2-dimensional SWE are newly-emerging ultrasound-based technologies that can be used in the presence of ascites. However, the validity of these two techniques is limited, quality criteria are not well defined, and there are concerns about their reproducibility [14,28].Although RTE, an ultrasound-based technique measuring relative elasticity, has been reported to outperform aforementioned techniques [23], there are very few studies examining this particular modality [29].MRE of the spleen is known to be a technically successful and feasible method in healthy volunteers and patients with chronic liver disease [20,29].Recent studies have shown that MRE has high test-retest consistency as well as low intra- and inter-observer variability [25,26,30]. MRE also allows the organ to be evaluated in its entirety and has standardization between producer platforms and field strengths [31].
Despite the existence of studies utilizing MRE to evaluate SS, the majority of research on this topic is hindered by several important limitations. Most studies used 1.5 Tesla (T) MR imaging (MRI) [25,31,32], with limited research on 3T devices [19,33]. The number of participants is often very low [18,25,33] and this limitation is particularly pertinent in healthy populations [18,19,20,32]. Finally, to our knowledge, there are very few studies which have examined healthy volunteers [18], which is an important problem limiting data on SS variability in the healthy population. Finally, as far as our knowledge extends, no study has exclusively included healthy volunteers for SS examination via 3T MRE or examined factors influencing SS in this population. Therefore, in this prospectively-planned study, we aimed to determine SS range in healthy adult volunteers (measured by 3T MRE), and to investigate the impacts of age, sex, spleen volume, diameter, and parenchyma thickness on SS.

2. Materials and Methods

2.1. Study design, setting and ethical issues

Our study was conducted in the radiology department of the BHT Clinic Istanbul Tema Hospitalwith the approval and permission of the Academic Board and Ethics Committee of Istanbul Nişantaşı University (meeting number 2023/33-13). All procedures were performed in accordance with the Declaration of Helsinki and its amendments. Written informed consent was obtained from all the participants.

2.2. Subjects

A total of 54 healthy volunteers selected from outpatients admitted to the internal medicine outpatient clinic who underwent abdominal MRI for any reason were included in the study. Patients younger than 18 years of age; those with known abdominal, cardiovascular, autoimmune, or hematologic diseases; individuals who had a history of splenic trauma or surgery; patients with comorbidities who required regular drug use; and those with findings consistent with any diagnoses that could affect MRI findings were excluded from the study.

2.3. Data collection

Participants' age and sex were recorded. Patients underwent clinical examinations after obtaining a detailed medical history to determine whether they met the exclusion criteria. Information about liver disease(s) was obtained by retrieving hospital records. The following data examined with MRI and MRE studies were recorded: SS, craniocaudal and anteroposterior spleen diameters, cortical thickness, and spleen volume.

2.4. MRI and MRE protocols

All patients underwent MRI using an MR scanner with a general torso coil with 30 channel AIR technology (General Electric 3.0TeslaSignaArchitect, Waukesha, WI, USA) according to the routine protocol for the upper abdomen. All patients underwent imaging following a 6-hour fast. Routine unenhanced upper abdominal MRIs included Coronal T2 SSFSE, Axial T2 SSFSE, Axial MR Touch, Axial T2 fat-saturated SSFSE, axial T1 dual-echo, axial DWI B50.800, Coronal DWI B50.800, Axial Proton Density Fat Fraction, Coronal Proton Density Fat Fraction sequences. For this purpose, upper abdominal scans were obtained to completely cover the spleen with 6-mm axial and 6-mm coronal section thicknesses, planned on T2 images (axial TR/TE values,1100/93 ms; coronal TR/TE values,1250/87 ms; axial and coronal FOV, 400 × 400 mm; axial matrix, 320 × 288; coronal matrix, 352 × 288).
The MRE was obtained by placing an internal driver with a pneumatic membrane of 19 cm in the substernal region. MRE acquisitions were performed using single breath-hold. Propagating shear waves were imaged using a motion-sensitized imaging sequence. A Spin-Echo Echo Planar Imaging (SE-EPI) sequence was used to acquire axial wave images with the following parameters: repetition time (ms)/echo time (ms), 50/23; continuous sinusoidal vibration, 60 Hz; field of view, 32–42 cm; matrix size, 256 × 64; flip angle, 30°; section thickness, 9 mm; four evenly spaced phase offsets; and four pairs of 60-Hz trapezoidal motion-encoding gradients with zeroth and first moment nulling along the through-plane direction. All processing steps were applied automatically without manual intervention to yield quantitative images of tissue shear stiffness in the Pascals.
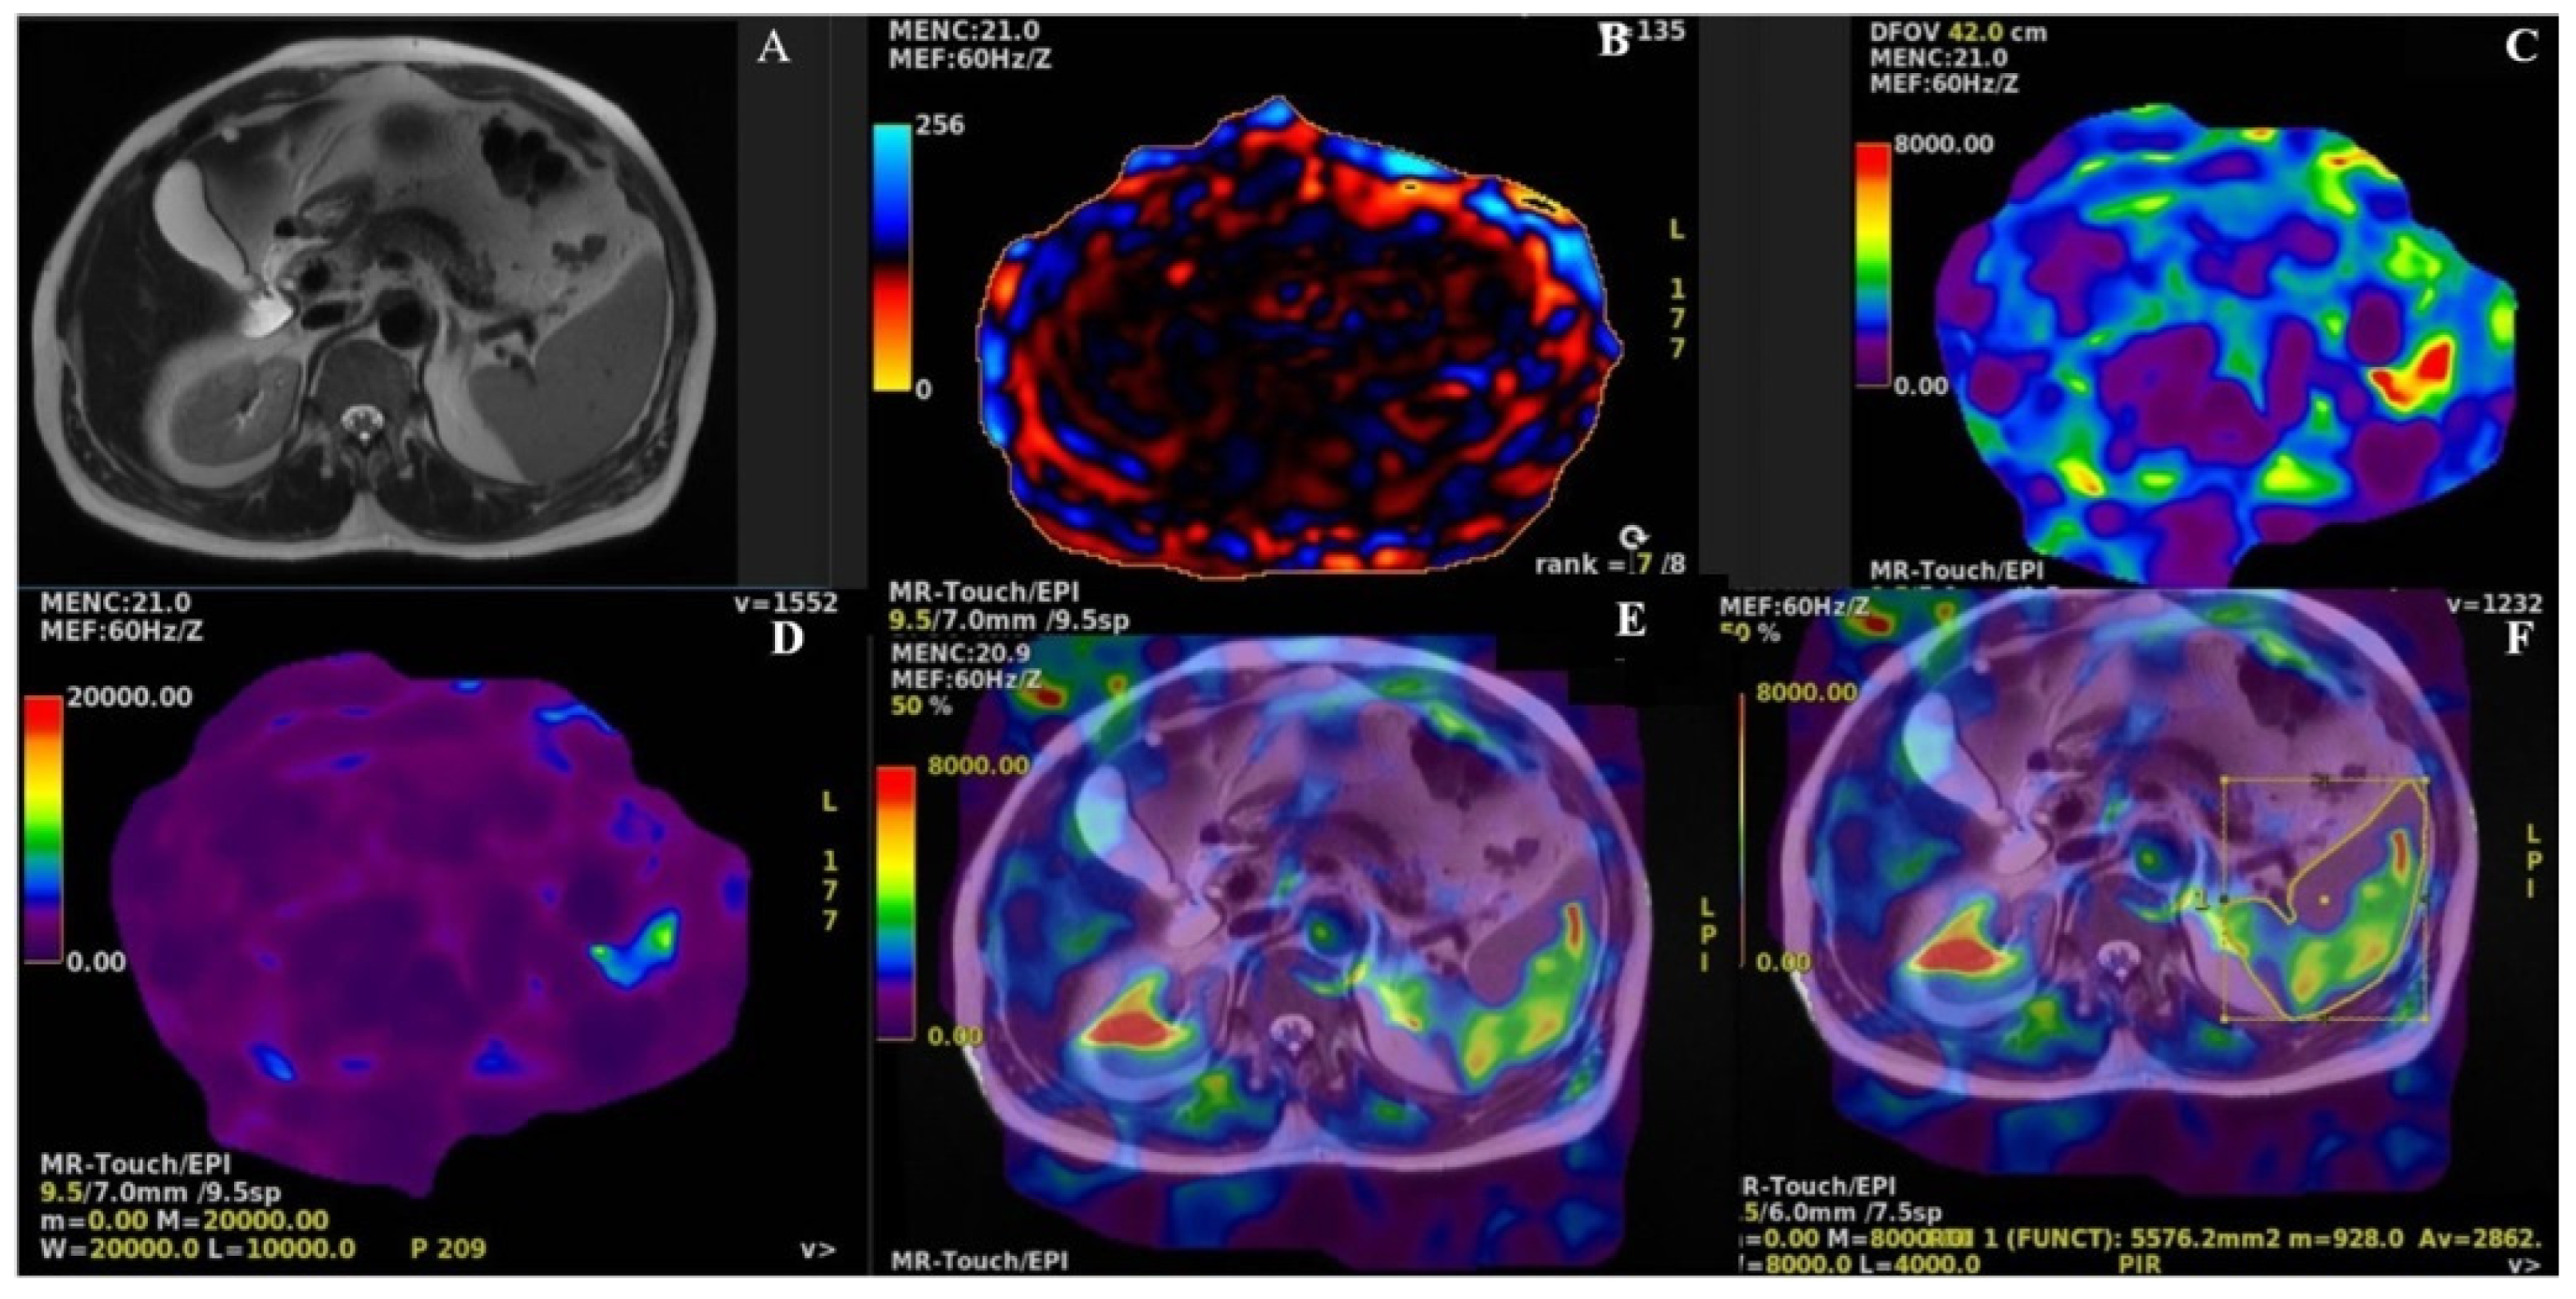
Routine upper abdominal MRIs scans were evaluated by two radiologists with > 10 years of experience in abdominal imaging. The evaluations were performed on a General Electric AW workstation using the MR Touch software. Spleen size and volume measurements were performed on coronal and axial single-shot fast spin-echo (SSFSE) sections on the same workstation. Spleen parenchymal thickness and the longest length were measured in the axial plane, and the craniocaudal length was measured in the best coronal plane in the section with the largest spleen surface. At the workstation, the Volume Viewer application was used to measure the splenic volume based on the Cavalieri method. Subsequently, axial SSFSE T2 slices and color map data were combined. Using the image cloning technique, a manual region of interest was initially delineated along the spleen contours on the axial slice with the most extensive spleen surface. After cloning the fusion images, the SS was measured in Pascal (Pa) units from the largest splenic slice. The described protocol was repeated three times on the widest splenic surface in all the cases (Figure 1).
Figure 1. A.Axial T2 SE. B. Phase wave image. C. Elastography colour map. D.Elastography wave map. E. T2 SE and EPI elastohgraphy fusion image. F. Elastography stiffness (Pa) measurement from fusion image.
Preprints 87951 g001

2.5. Outcomes

The primary outcome of the study was to investigate the normal range of SS measured by 3T MRE in healthy individuals and to investigate the relationship between SS and the following parameters: age, sex, splenic parenchymal thickness, craniocaudal and anteroposterior length of the spleen, and spleen volume.

2.6. Statistical Analysis

All statistical analyses, subject to a significance threshold of p< 0.05, were conducted using IBM SPSS for Windows (version 25.0; IBM Corp., NY, USA). The distribution of continuous variables was assessed using the Kolmogorov-Smirnov test. Descriptive statistics are presented as mean ± standard deviation for normally distributed continuous variables, median (1st quartile–3rd quartile) for non-normally distributed continuous variables, and frequency (percentage) for categorical variables. To explore the relationships between the variables and spleen stiffness (SS), Pearson, Spearman, or point-biserial correlation coefficients were calculated as appropriate.

3. Results

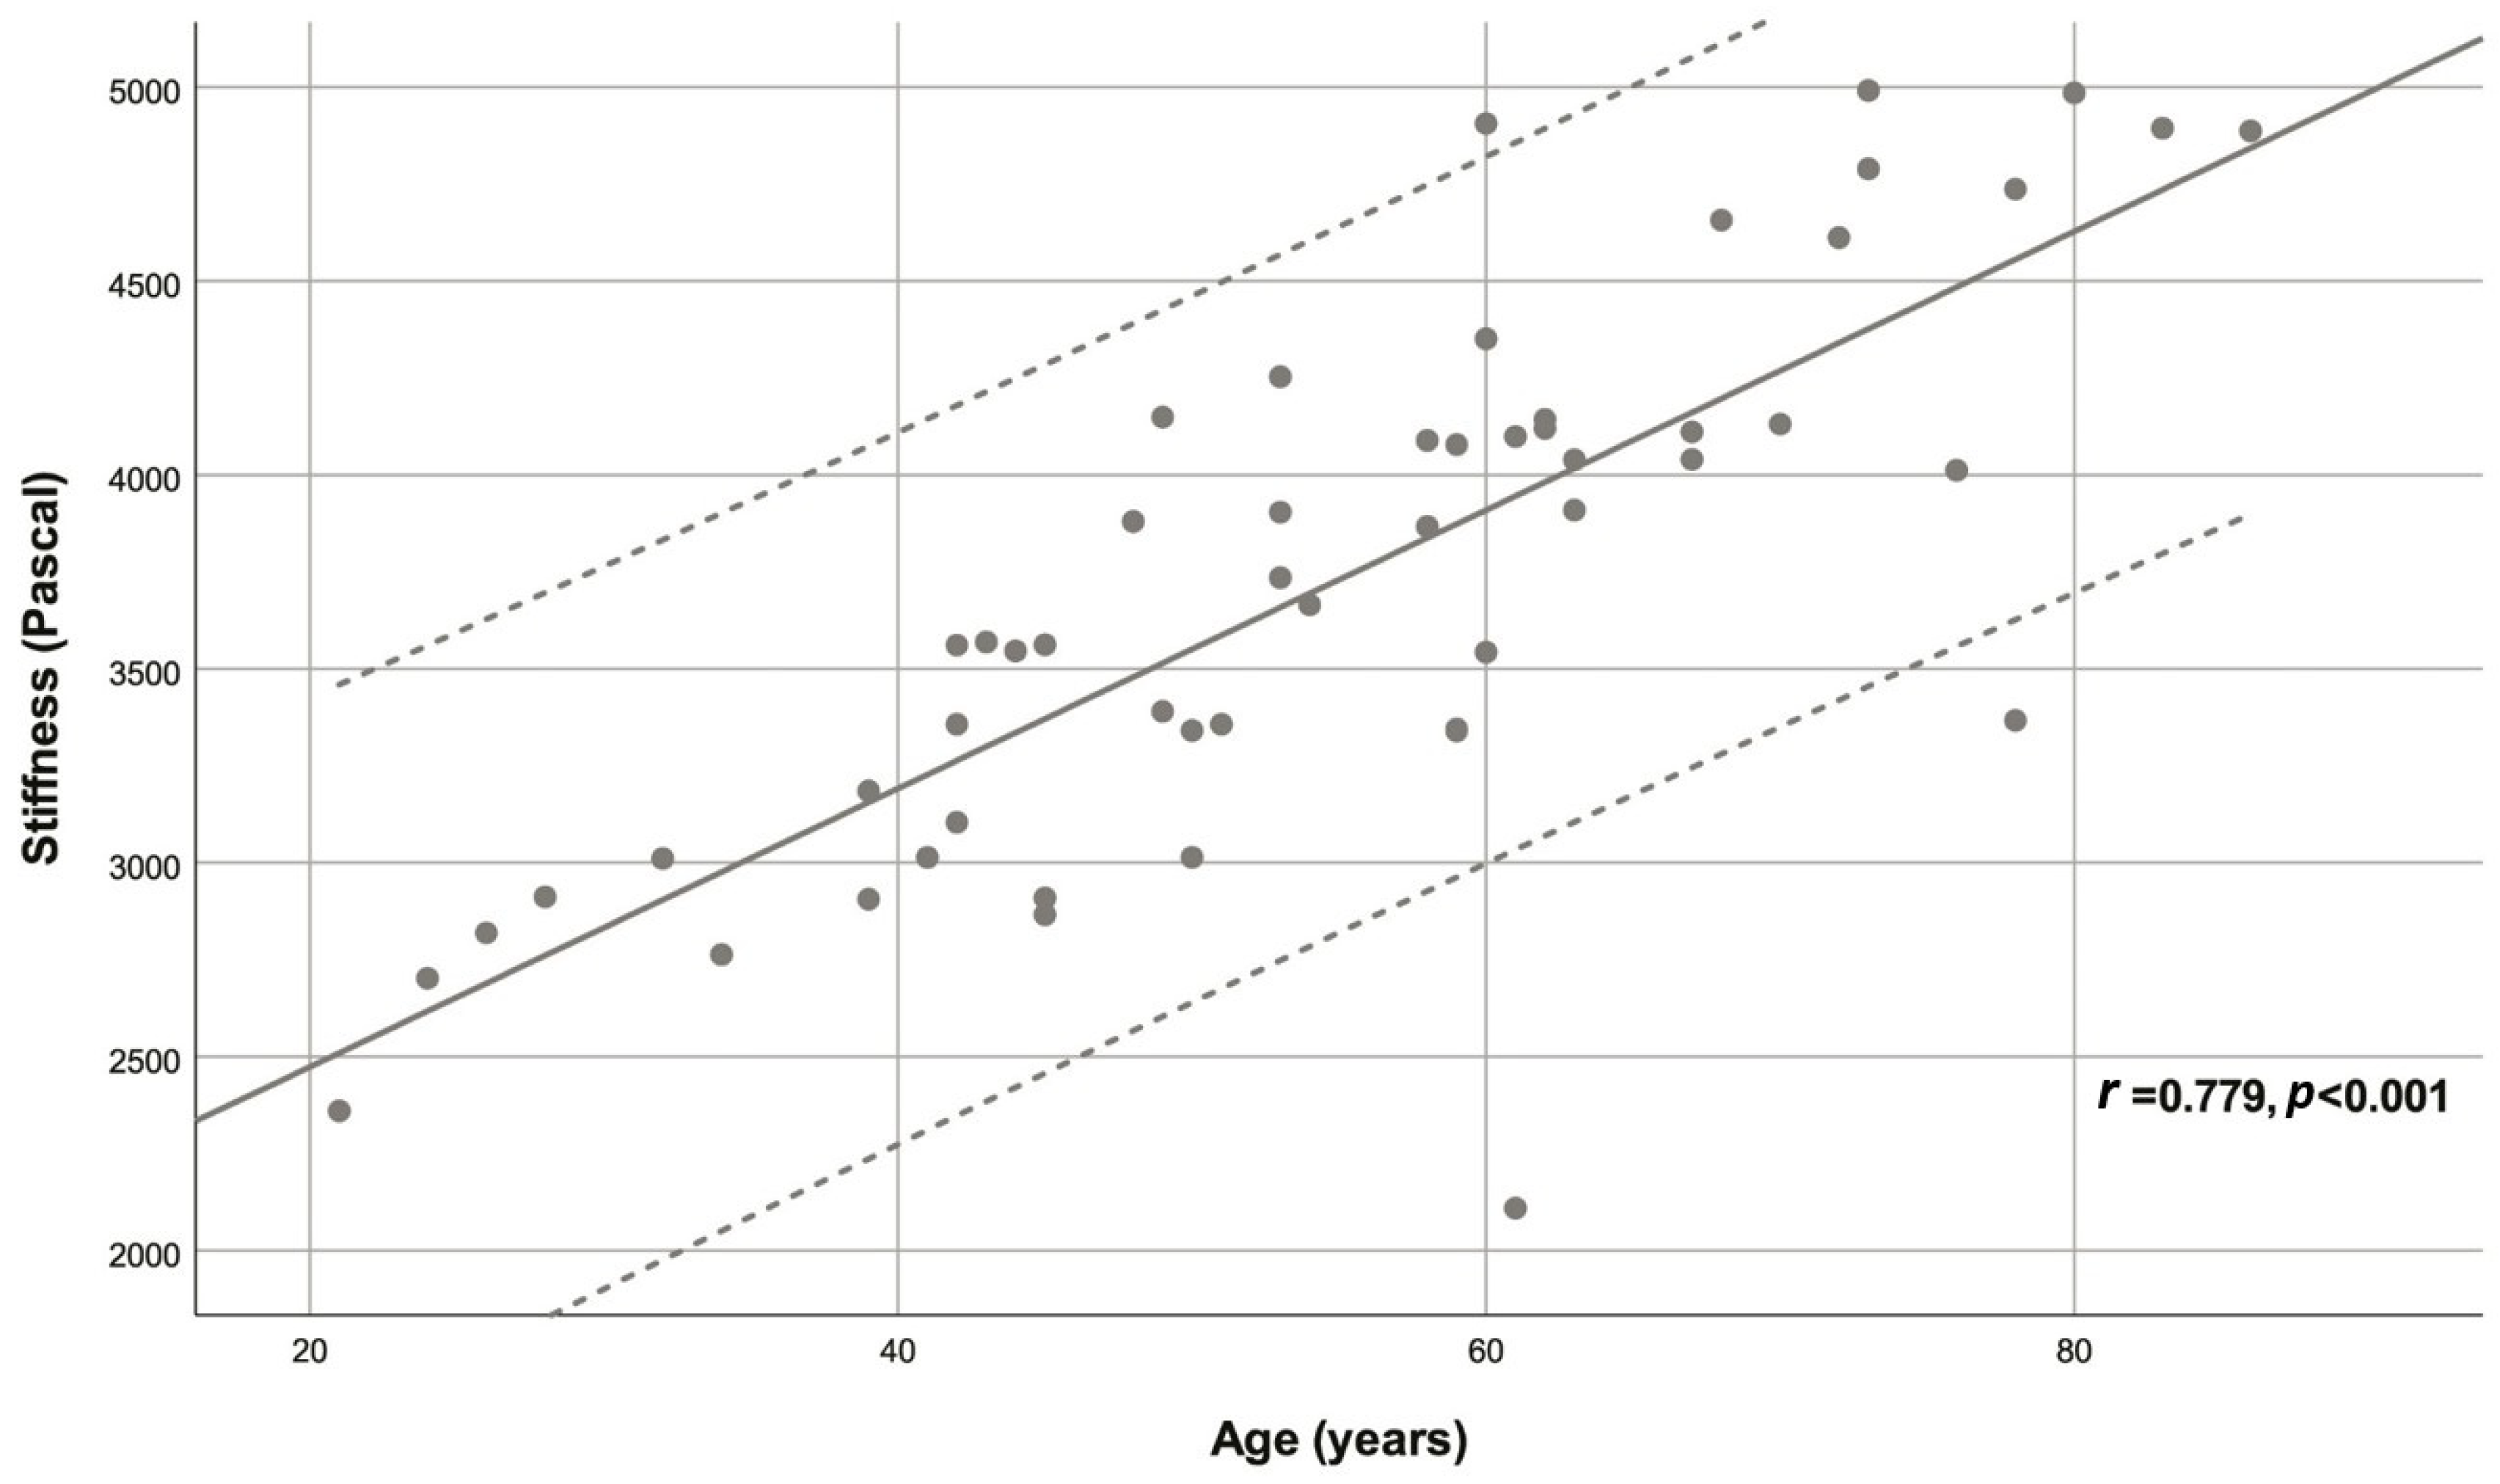
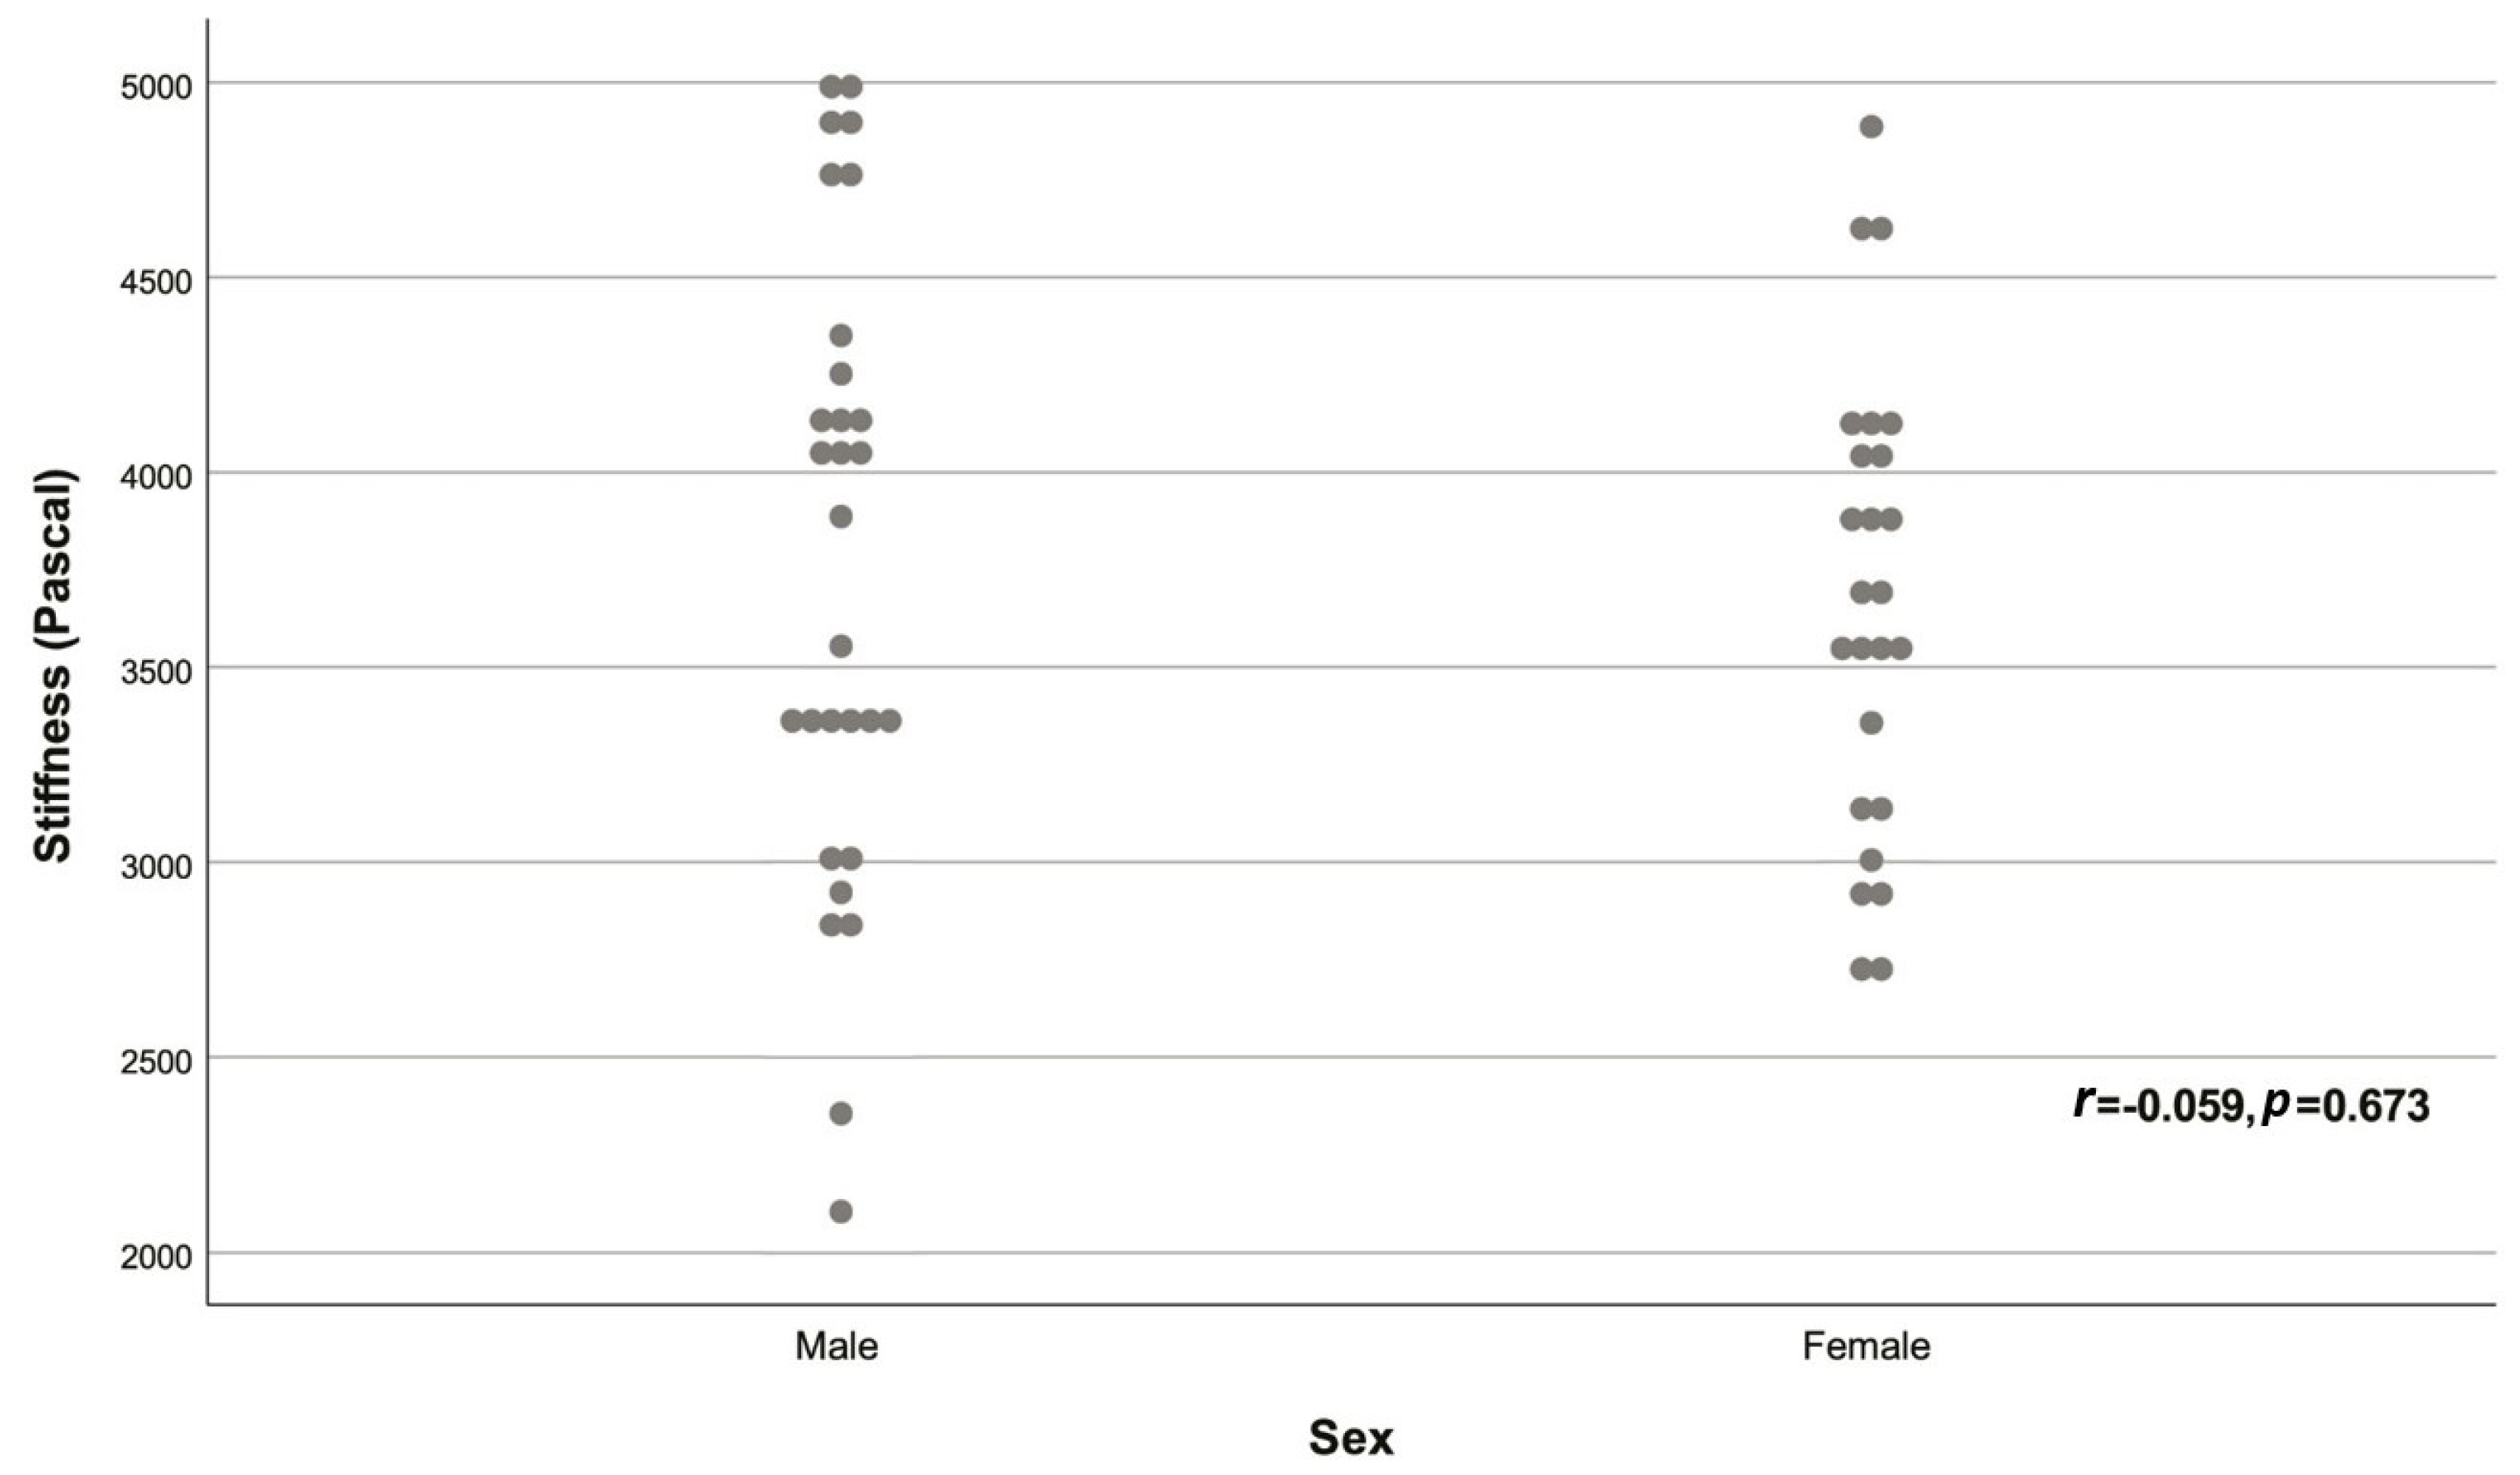
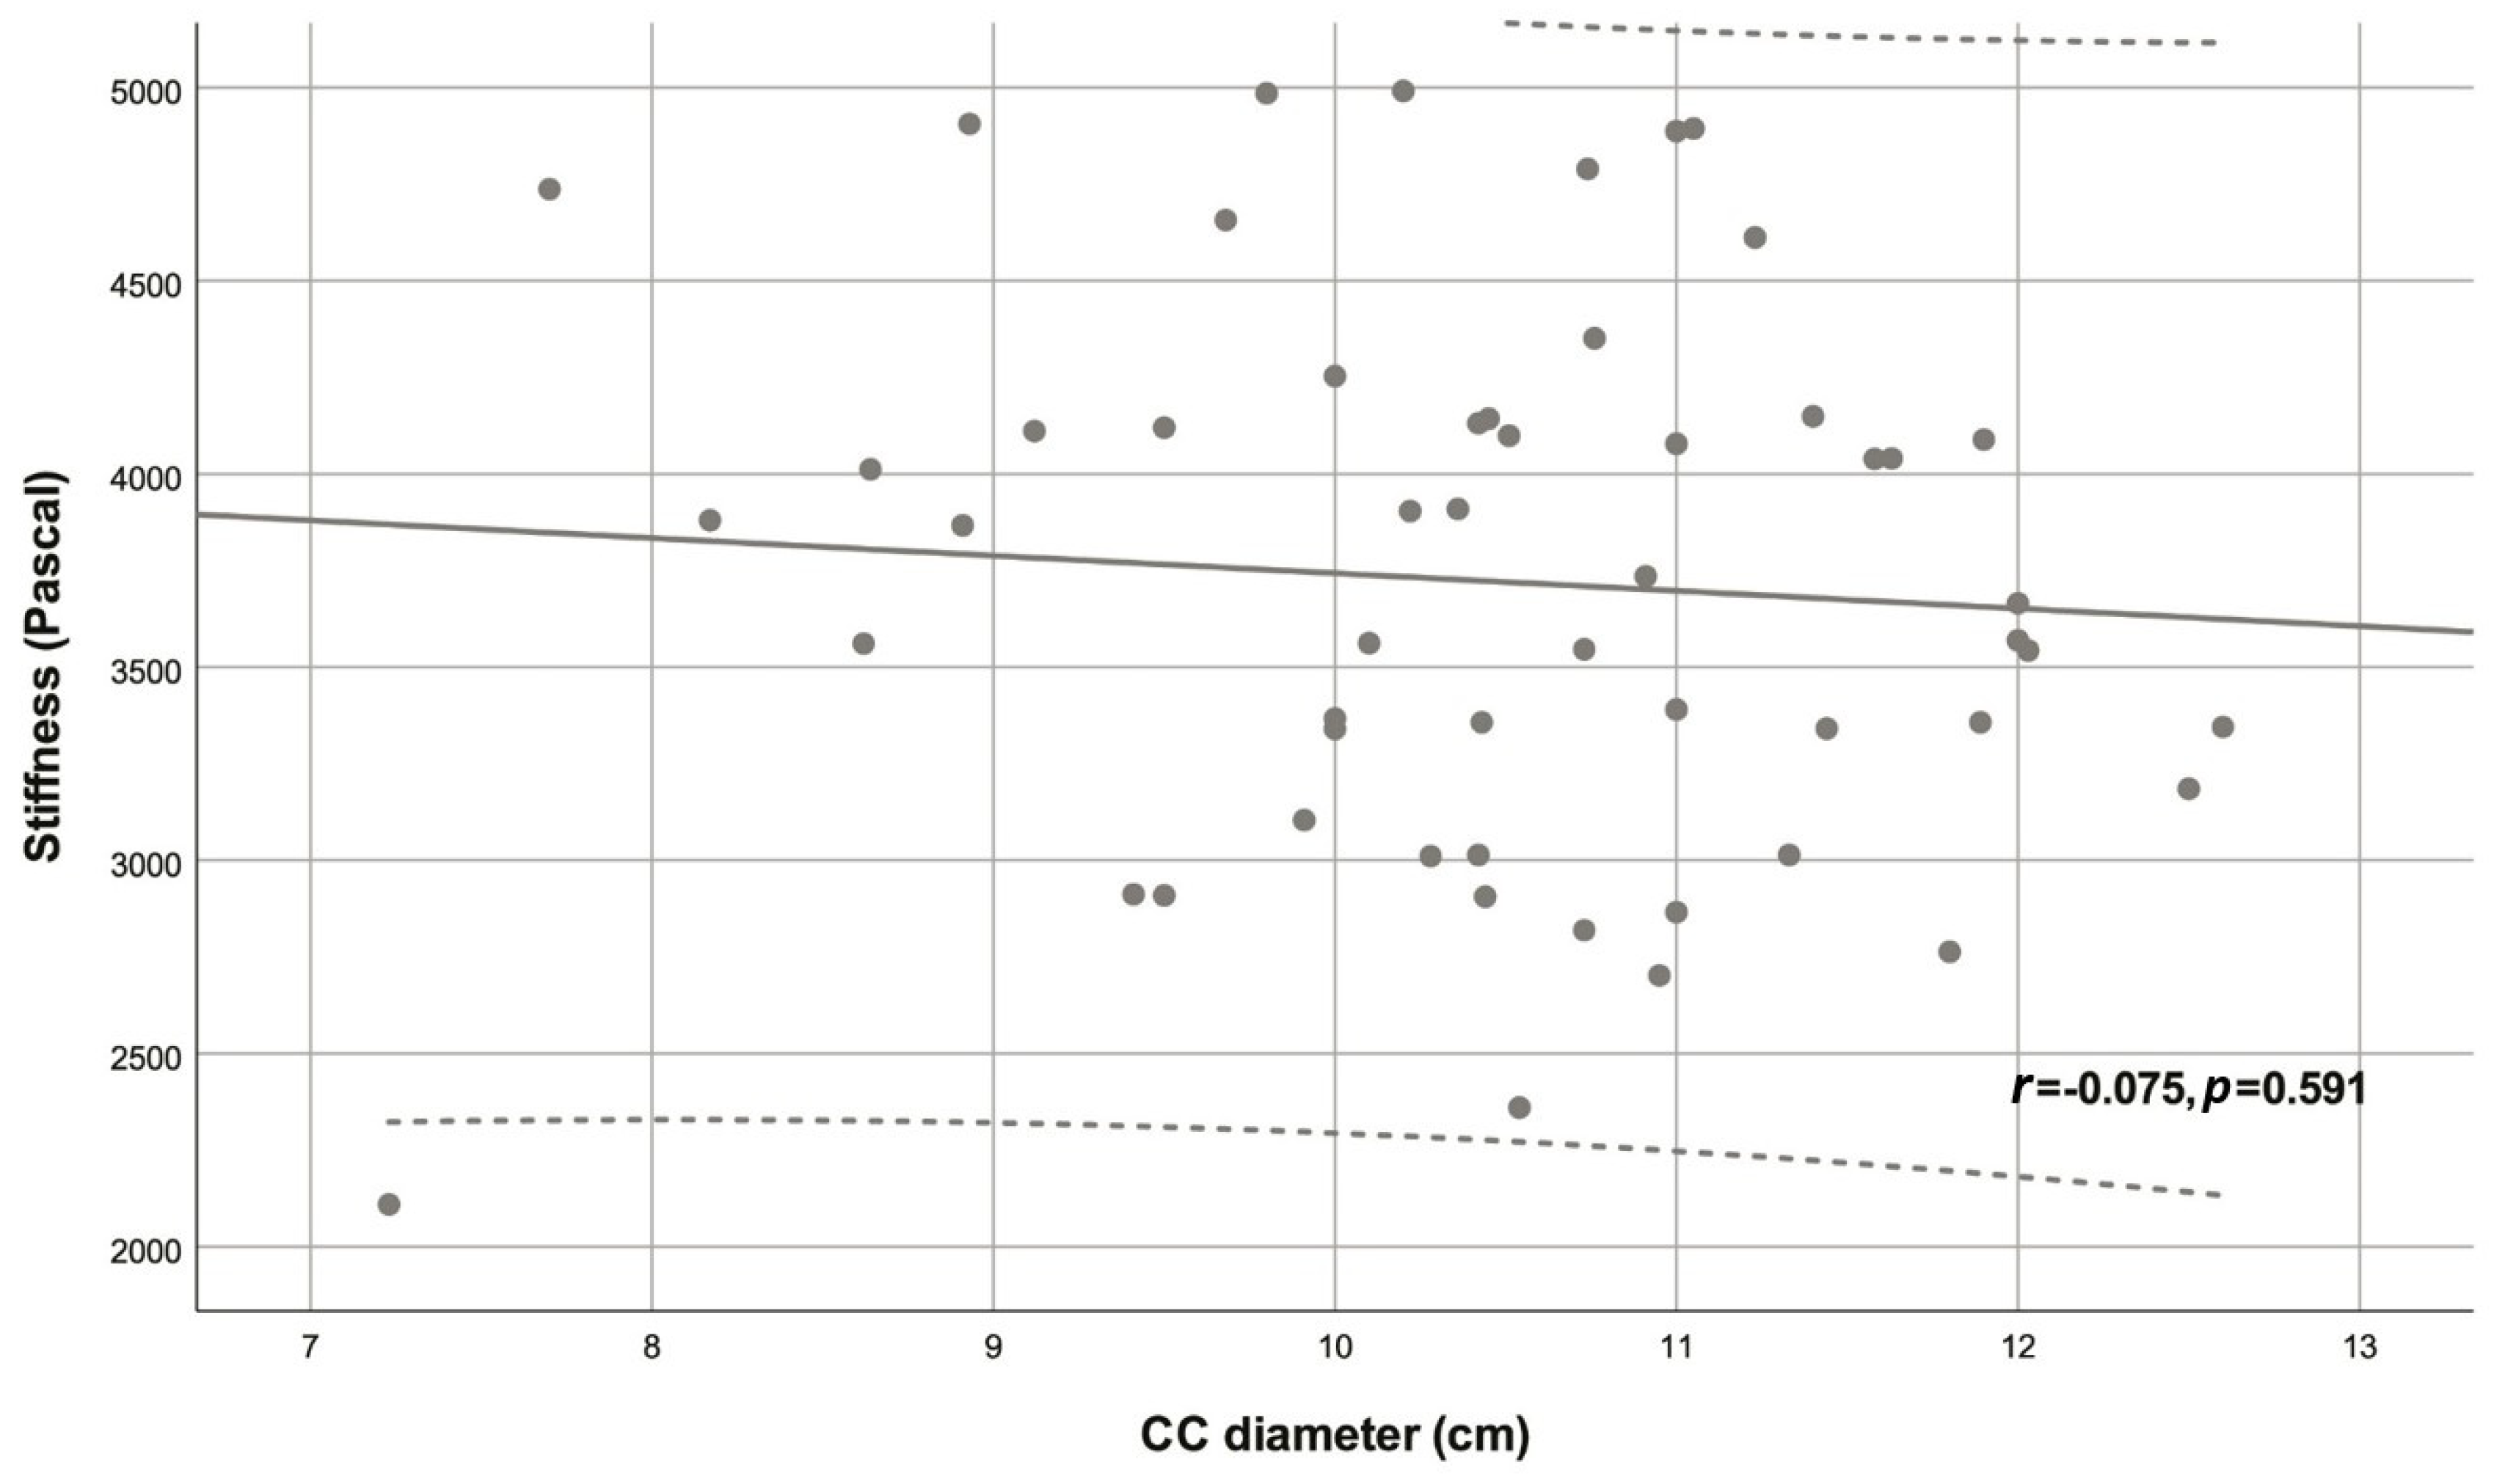
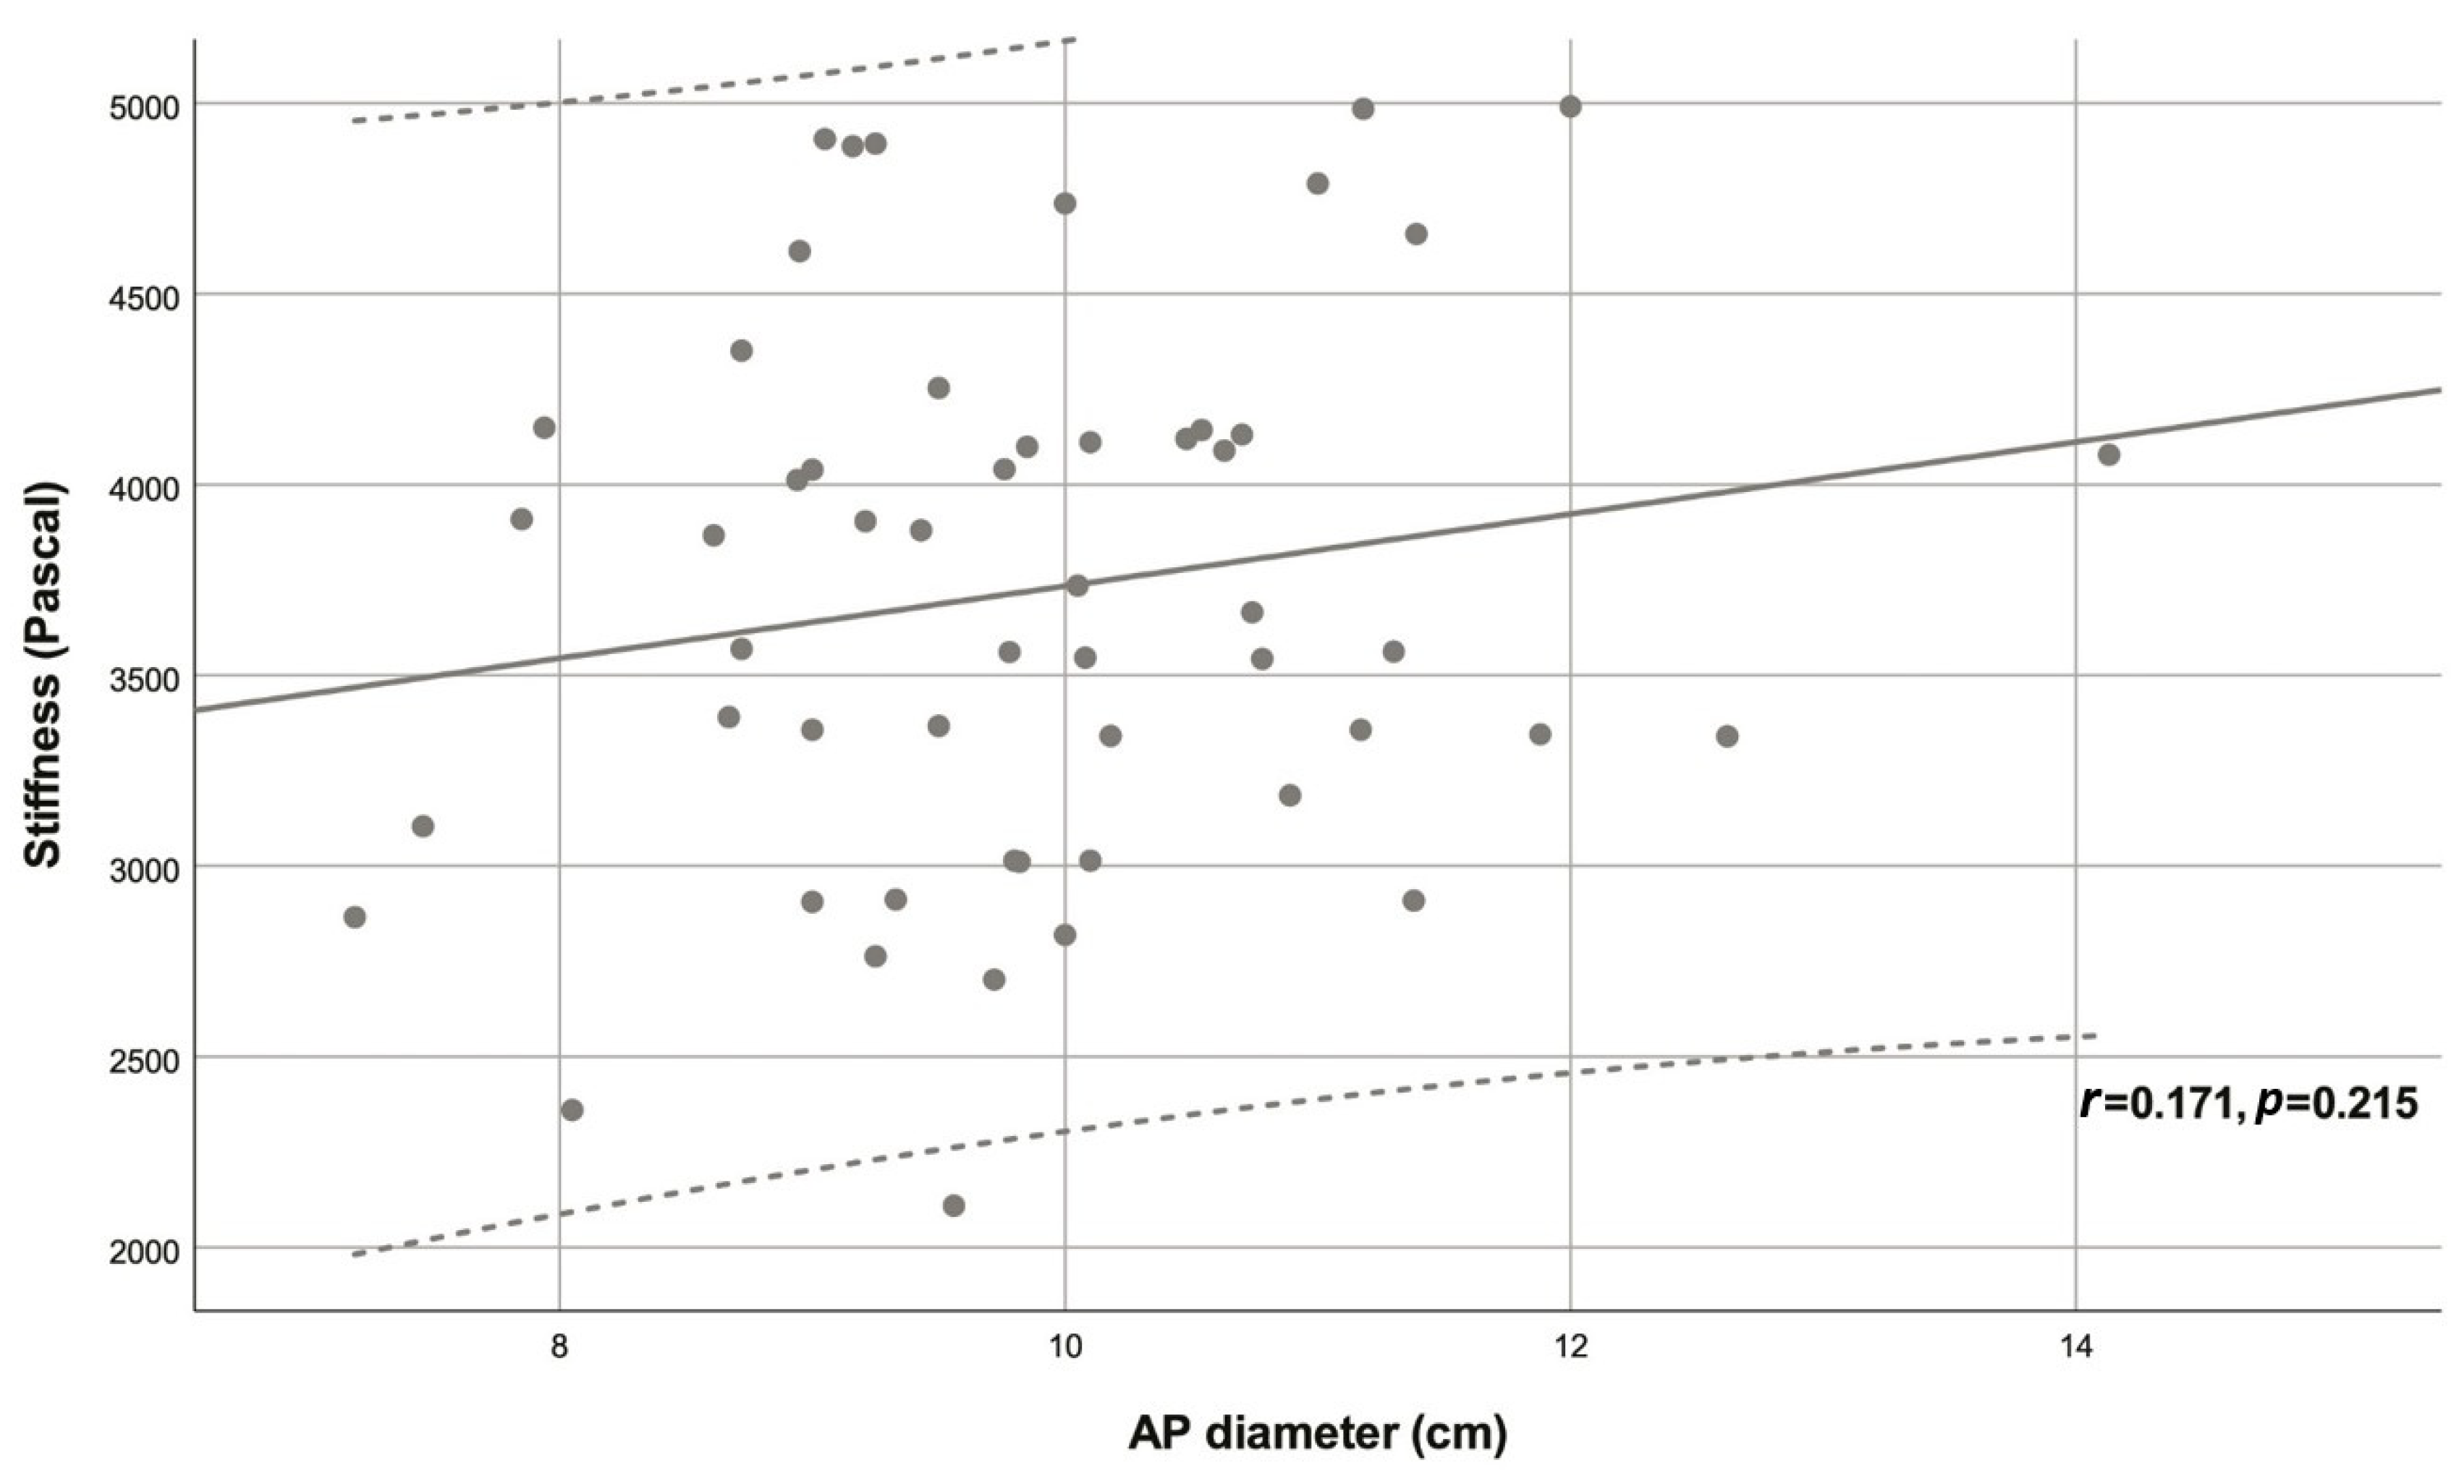
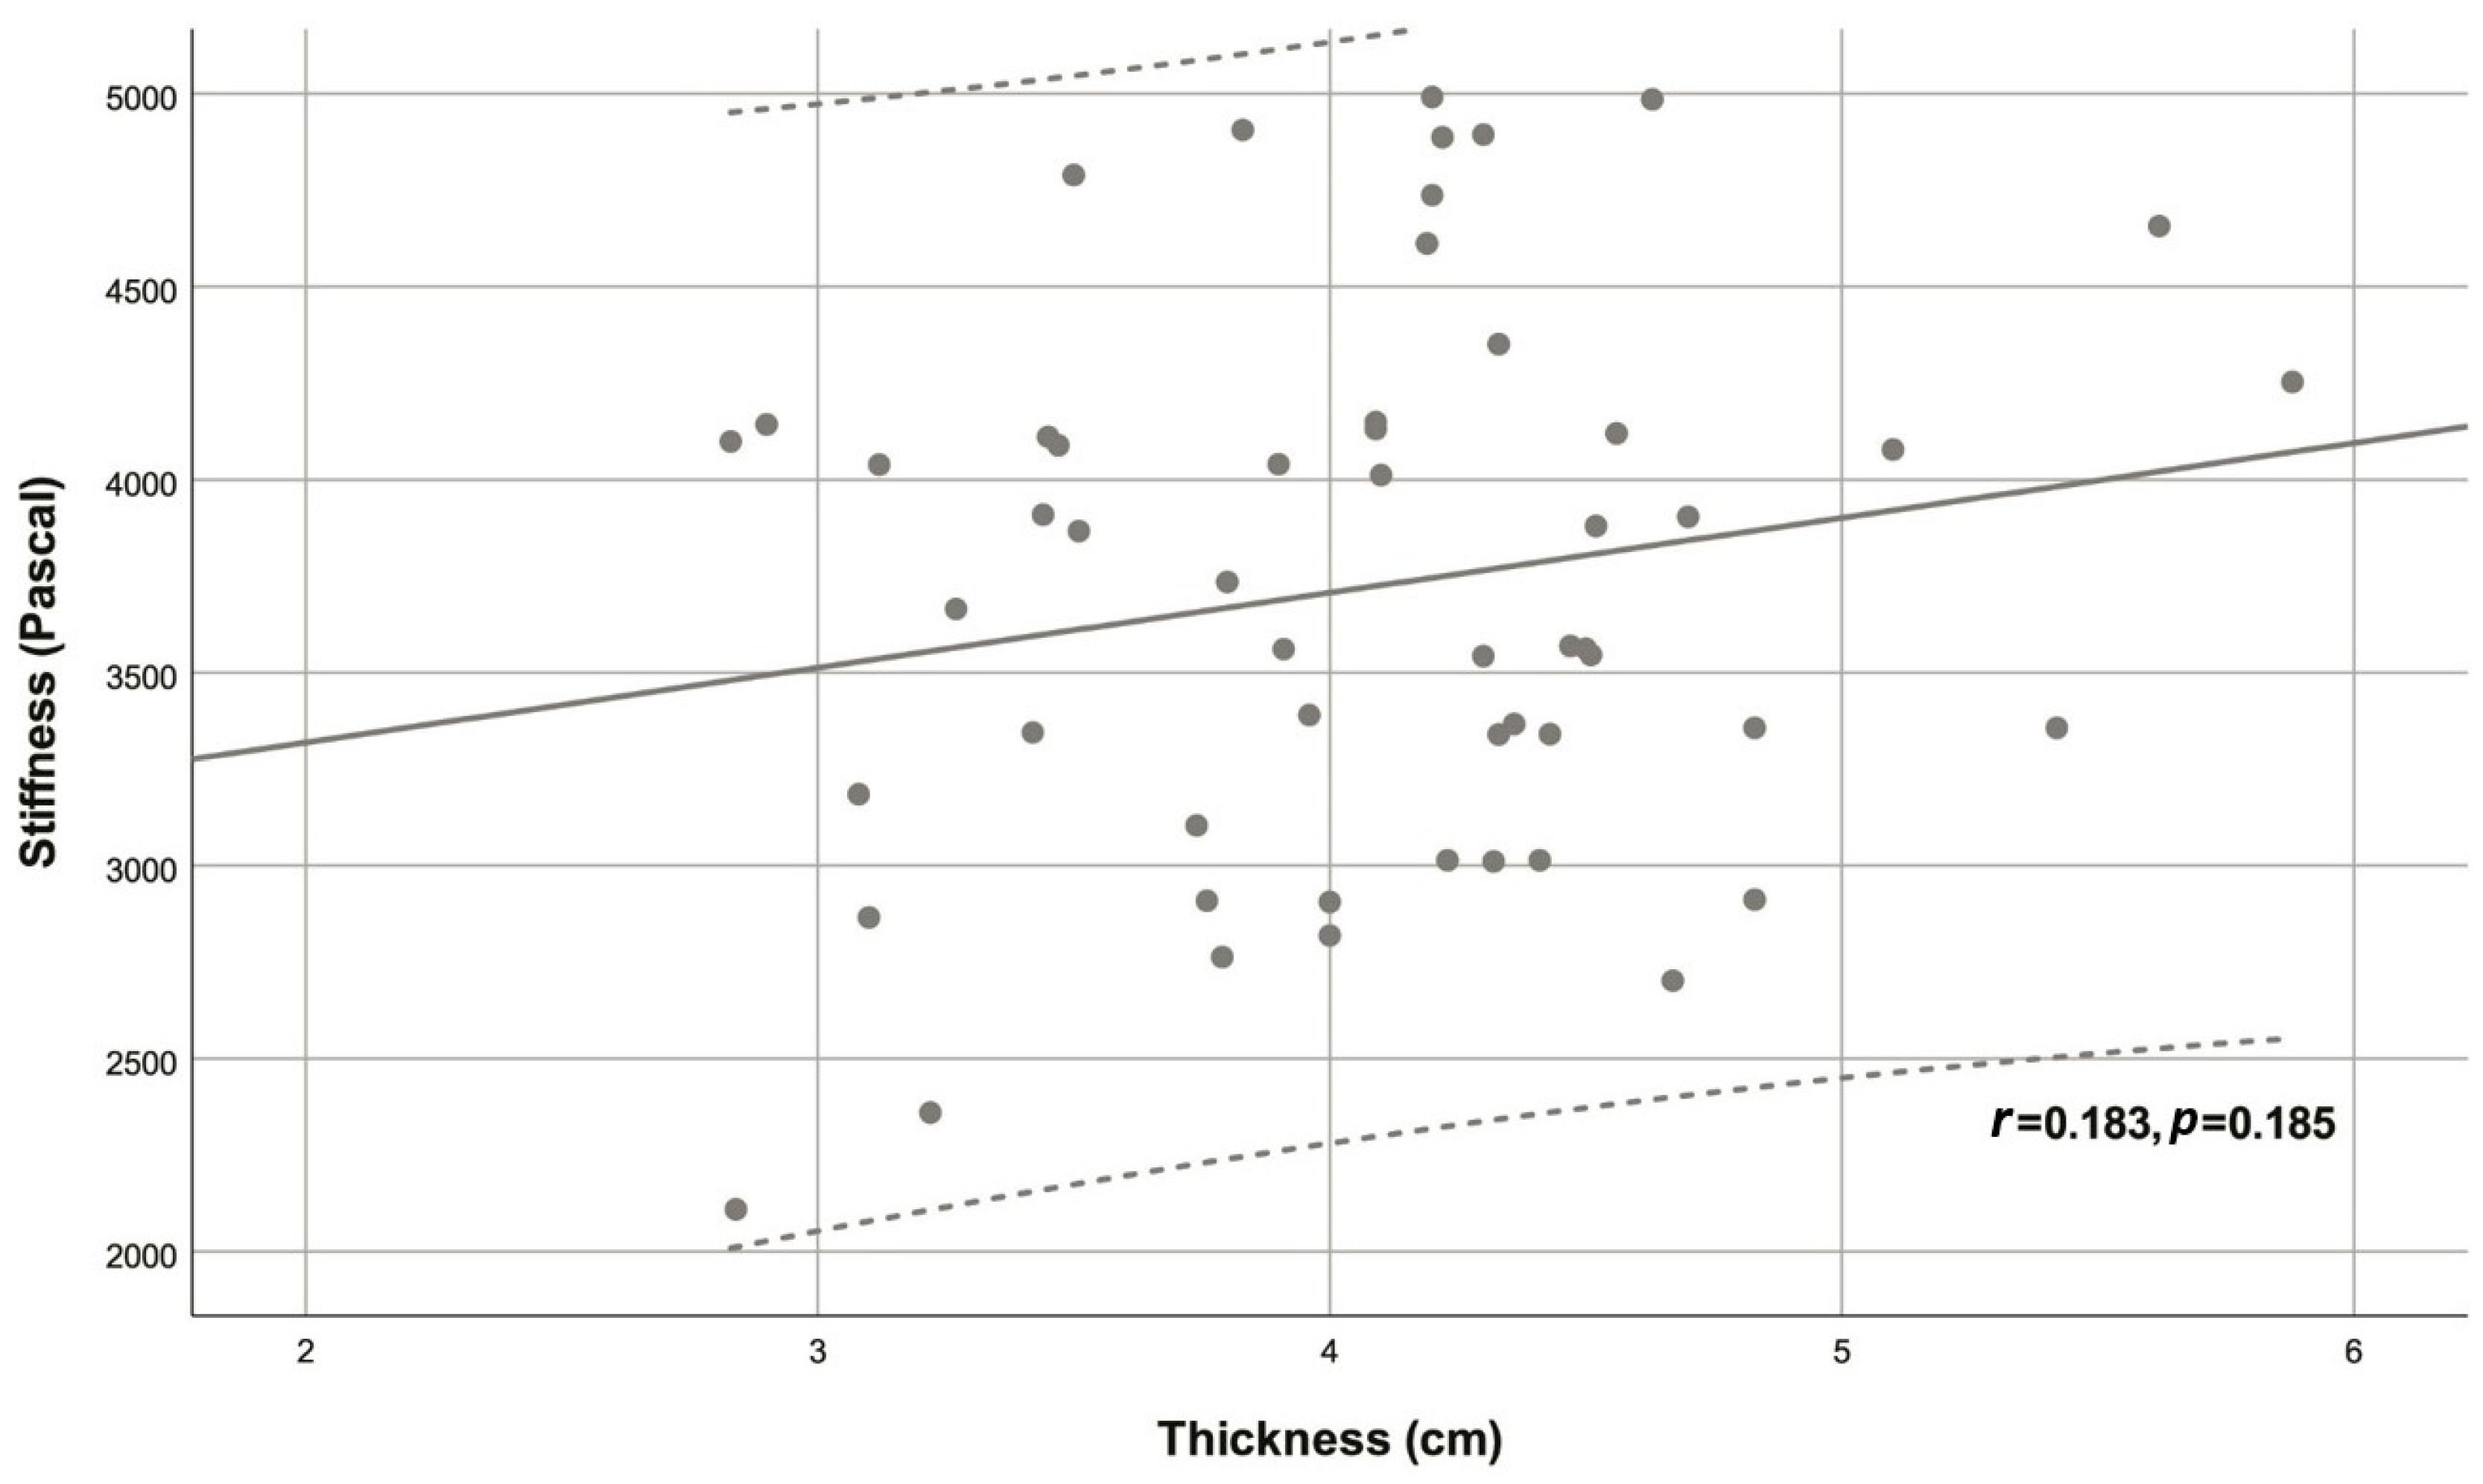
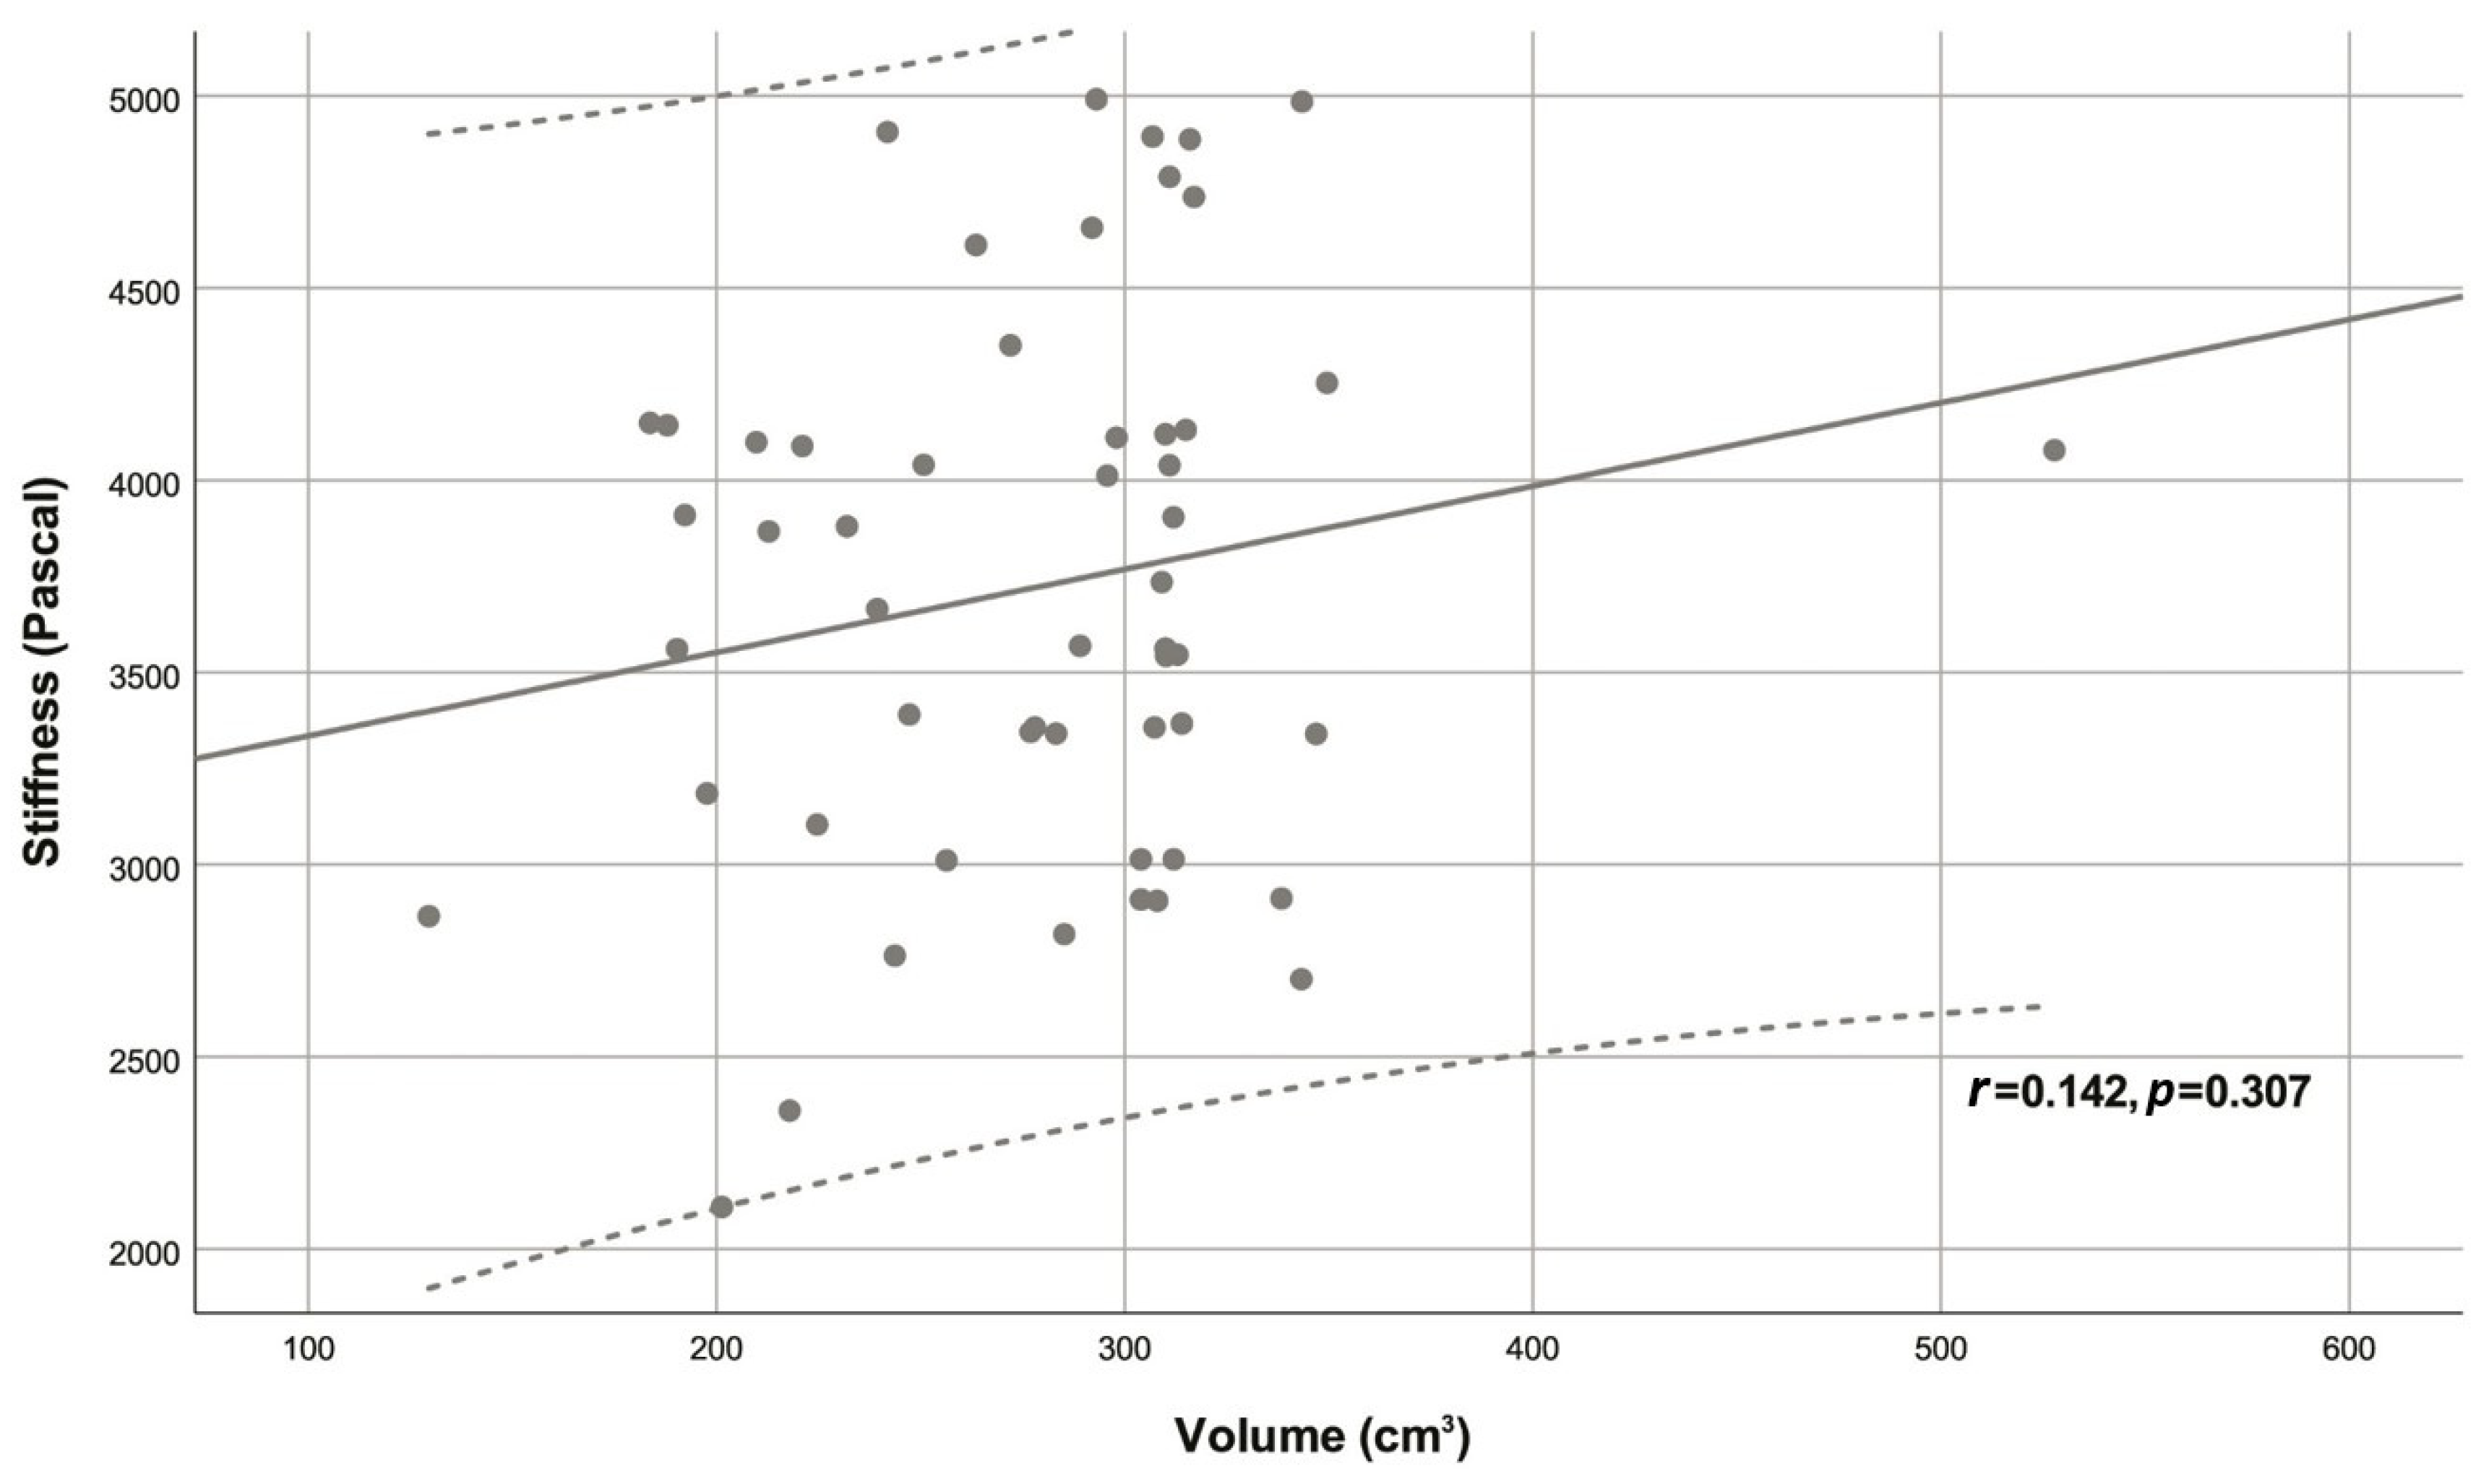
Twenty-nine male and 25 female subjects with a mean age of 54.78 ± 15.40 years were included in the study. The mean spleen cradiocaudal diameter was 10.46 ± 1.16 cm, anteroposterior diameter was 9.88 ± 1.29 cm, parenchyma thickness was 4.08 ± 0.67 cm, SS was 3721.94 ± 709.69 Pa and the median spleen volume was 292.54 (239.40 - 311.00) cm3. A significant and strong positive correlation was found between age and SS (r = 0.779, p<0.001) (Figure 2). However, SS did not have a significant relationship with sex (Figure 3), craniocaudal diameter (Figure 4), anteroposterior diameter (Figure 5), parenchymal thickness (Figure 6), or volume (Figure 7) (Table 1).
Figure 2. Scatter plot of stiffness and age.
Preprints 87951 g002
Figure 3. Scatter plot of stiffness and sex.
Preprints 87951 g003
Figure 4. Scatter plot of stiffness and CC diameter.
Preprints 87951 g004
Figure 5. Scatter plot of stiffness and AP diameter.
Preprints 87951 g005
Figure 6. Scatter plot of stiffness and thickness.
Preprints 87951 g006
Figure 7. Scatter plot of stiffness and volume.
Preprints 87951 g007
Table 1. Summary of variables and correlations with stiffness.
Variable Descriptive statistic r p
Age (years) 54.78 ± 15.40 0.779 <0.001
Sex
 Male 29 (53.70%) -0.059 0.673
 Female 25 (46.30%)
CC diameter (cm) 10.46 ± 1.16 -0.075 0.591
AP diameter (cm) 9.88 ± 1.29 0.171 0.215
Thickness (cm) 4.08 ± 0.67 0.183 0.185
Volume (cm3) 292.54 (239.40 - 311.00) 0.142 0.307
Stiffness (Pascal) 3721.94 ± 709.69 - -
Descriptive statistics are given as mean ± standard deviation for normally distributed continuous variables, as median (1st quartile - 3rd quartile) for non-normally distributed continuous variables and as frequency (percentage) for categorical variables. Abbreviations; AP: Anteroposterior, CC: Craniocaudal, r: Correlation coefficient for stiffness.

4. Discussion

In recent years, elastography techniques have played an increasingly prominent role in the evaluation of various diseases [25]. MRE, an MRI-based quantitative SWE method, has been demonstrated to be a promising modality for the evaluation of SS [25]; However, there is a lack of studies investigating sufficiently large healthy populations to identify the underlying factors that influence SS. Our study shows that age has a strong effect on SS, which could be valuable in the diagnostic or prognostic use of this measurement in various conditions. In a recent review that calculated aggregated and weighted values for diagnostic performance, the sensitivity, specificity, and area under curve values of MRE were reported to be 79%, 90%, and 92%, respectively [14]. Describing SS values in healthy populations can increase diagnostic accuracy and may prove critical in the design of studies, particularly in the selection of controls and determination of study group sizes. Few studies have identified factors affecting the success of SS measurement [34]. In the present study, the mean SS value measured by 3T MRE in healthy individuals was 3721.94 ± 709.69 Pa (3.7 ± 0.7 kPa). While a strong positive correlation was found between SS and age, there were no significant relationships with sex, craniocaudal and anteroposterior diameters, parenchyma thickness, and volume.
The predominant focus of studies exploring spleen elasticity has been on portal hypertension and esophageal varices [3,12,13,29]. In addition to the limited number of studies examining healthy populations, the literature shows that most of these studies have utilized ultrasonography-based measurements [2,10,21,35]. Comprehensive SS measurements by MRE in healthy populations have been reported very rarely [18]. As mentioned before, our results reveal a mean value of 3721.94 ± 709.69 Pa. In several studies reporting the results of their healthy controls, SS values were as follows: 3.6 ± 0.3 kPa [20], 3.67 ± 1.15 kPa [19], and 3.565 ± 586 Pa (driver on the right side), 4.255 ± 625 Pa (driver on the left side) [18]. These outcomes appear to be largely consistent with our findings. As a general consensus, it appears that SS results in healthy volunteers, including the present study, are lower than those reported in patients with chronic liver disease [3,12,14].
An important clinical implication of our study is that a strong positive correlation was detected between age and SS but not with sex and SS. Lee et al. investigated the relationship between age and SS in healthy children (measured by ARFI shear wave velocity). The ARFI values for spleen in all children demonstrated a positive correlation with age [35], similar to our results. Mannelli et al. conducted a similar study and although a positive correlation was found between age and spleen stiffness measured by 1.5T MRE, this relationship was not significant [18]. This might be associated with the fact that this study only included 16 healthy volunteers [18]. Another similar study utilized SWE to measure SS in healthy children and found that sex and age did not have any effect on SS [22]. Albayrak et al. used SWE and reported that SS did not differ according to sex and age [10]. Several other studies are also in agreement with these findings showing a lack of relationship between ultrasonography-measured SS and age and sex [2,21,36,37]. Despite these findings, the results of our study are of interest since it is the first study that included only healthy volunteers and was conducted using 3T MRE. The impact of age on SS may be associated with age-related morphological, histological and physiological changes that occur in the spleen [38]. The microscopic structure of the spleen may also change according to the stage of organ development, age, and immunological status of the individual [39]. Alex et al. examined the effects of age on human spleen histology in a postmortem study. They reported that capsule thickness, trabecular meshwork, and characteristics of white pulp and red pulp varied in different age groups [40]. Animal studies have also shown that changes occur in the spleen with aging, such as white pulp atrophy, reduction of the germinal center, decreased extramedullary hematopoiesis, and intracellular alterations [38,41,42,43,44]. Perhaps more importantly, age is confirmed to impact the cellular content of the spleen [41,45]. It is also notable that hepatic fibrosis is increased with age [46], which may impact splenic characteristics indirectly and this alteration could also be true for the spleen. In addition, spleen elasticity could be affected by vascular disease or degeneration since the spleen is characterized by extreme vascularity. Although our finding of an elevated trend in SS with age requires validation through studies involving larger populations, these outcomes underline the importance of considering age as a factor in the assessment, diagnosis, and staging of relevant conditions in which SS is examined.
Spleen elasticity can be affected by factors that depend on the measurement method chosen, spleen-related features, and patient-related factors. All ultrasound-based methods employed for SS measurement are influenced by the quantity of abdominal fat. This is because the efficacy of these techniques relies on the propagation of waves within the tissue [14]. In the current study, it was shown that SS was not affected by other splenic features including craniocaudal and anteroposterior diameter, parenchymal thickness, and volume, when measured with 3T MRE. Mannelli et al. found no significant association between SS and various other measures, including body mass index (BMI), mean arterial blood pressure, spleen volume, or liver stiffness in healthy volunteers [18]. Interestingly, they found a significant difference in SS values obtained using the two driver positions. SS measured with the driver on the left site was significantly higher than that measured with the driver on the right side [18]. In the study of Albayrak et al., no significant correlation was found between SS value and longitudinal spleen size, transverse spleen size, height, weight and BMI [10]. Pawluś et al. showed no relationship between SS value measured by SWE and spleen size [2]. Kassym et al. evaluated spleen elasticity of healthy subjects using ARFI and found no significant relation between SS and spleen size or obesity [21]. On the other hand, in a study measuring SS by MRE, a significant relationship was found between spleen volume and SS in patients with polycystic kidney disease –but not in healthy subjects and patients with post-Fontan hepatopathy [19]. Bhatia et al. conducted a prospective study investigating SS with SWE in healthy children, and reported that the mean SWE values in the two groups were associated with splenic length. They found higher SS values at greater splenic length [22]. In a retrospective analysis of factors influencing SS (measured via SWE) in adult patients, it was observed that patients with splenomegaly, elevated liver stiffness, and significant fibrosis had notably higher mean SS values compared to other individuals. In multivariable logistic regression analysis, abdominal wall thickness and longitudinal diameter of the spleen were identified as independent predictors of the success of SS measurement [34]. In another study, it was demonstrated that the spleen longitudinal diameter and spleen area were significantly lower in patients SS measurement failure with transient elastography while BMI was not different between groups, indicating that access to the spleen was the most important factor enabling accurate measurement [47]. Balakrishnan et al. demonstrated that the reproducibility of ARFI SWE-based SS measurement is influenced by splenomegaly. The data trend indicated that SS measurement had relatively better reproducibility when the spleen size exceeded 12 cm [48]. The reason for these conflicting results may be the selected measurement method and the selected patient population. Therefore, to clarify the effect of spleen-related features on SS, comprehensive studies with homogeneous and large populations (of patients or healthy subjects) should be conducted.
The limitations of the current study include the sample size and single-center design, which affects generalizability. However, increasing the sample size for expensive measurements is difficult, especially for the assessment of a healthy population. Additionally, very few studies have utilized 3T MRI; therefore, the methodology used for evaluation could require further optimization. However, despite examining liver stiffness, Manelli et al. demonstrated that 3T MRE measurements could be performed without modifying the approach used at 1.5T [49], and therefore, it is feasible to assume that SS measurements with 3T devices would not require major alterations in methodology. We could not perform anthropometric measurements on the participants; therefore, the effect of BMI on SS was not examined. However, apart from a few studies demonstrating the adverse effects of obesity (very high BMI) on measurements, various studies have shown that BMI has no effect on SS [5,10,21]. As the main purpose of this study was to assess healthy volunteers who had undergone MRE for various reasons, validation using other measurement methods could not be performed. Although previous studies have reported that intra- and inter-observer agreement rates are excellent in evaluating spleen elasticity with MRE [25,26,30], the consistency of measurements was not evaluated in this study, which could bias the results. Finally, no effort was made to standardize water intake before measurements, which is a potential factor that could impact the results as reported by Dittmann and colleagues [50].

5. Conclusions

Our data demonstrated a strong positive correlation between age and SS measured using 3T MRE. There was no significant relationship between SS and the other parameters examined in this study, including sex and various splenic measures. We believe that age should be considered when utilizing SS for the diagnosis, staging, or prognostication of relevant diseases or conditions, including portal hypertension and esophageal varices. Our results and the questions surrounding the impact of other factors should be confirmed by future studies preferably employing 3T MRE.

Author Contributions

Conceptualization, S.P. and L.K.; Methodology, S.P. and L.K.; Software, S.P. and L.K.; Validation, S.P. and L.K.; Formal analysis, investigation, data curation, S.P. and L.K.; Writing-original draft preparation, S.P. and L.K.; Writing-review and editing, S.P. and L.K.; Visualization, S.P. and L.K.; Supervision, S.P. and L.K.; Project administration and funding acquisition, S.P. and L.K. All authors have read and agreed to the published version of the manuscript.

Funding

This research received no external funding.

Institutional Review Board Statement

The study was approved by the Ethics Committee of Istanbul Nişantaşı University (Decision date: 14.08.2023, decision number: 2023/33). All procedures performed were in accordance with the Helsinki declaration and its later amendments.

Informed Consent Statement

Informed consent was obtained from all subjects involved in the study.

Data Availability Statement

Data can be shared upon request.

Conflicts of Interest

The authors declare no conflict of interest.

References

  1. Lewis S., M.; Williams, A.; Eisenbarth S., C. Structure and function of the immune system in the spleen. Sci Immunol. 2019, 4, eaau6085. [Google Scholar] [CrossRef]
  2. Pawluś, A.; Inglot M., S.; Szymańska, K.; Kaczorowski, K.; Markiewicz B., D.; Kaczorowska, A.; Gąsiorowski, J.; Szymczak, A.; Inglot, M.; Bladowska, J.; et al. Shear wave elastography of the spleen: evaluation of spleen stiffness in healthy volunteers. Abdom Radiol (NY). 2016, 41, 2169–2174. [Google Scholar] [CrossRef]
  3. Ma, X.; Wang, L.; Wu, H.; Feng, Y.; Han, X.; Bu, H.; Zhu, Q. Spleen Stiffness Is Superior to Liver Stiffness for Predicting Esophageal Varices in Chronic Liver Disease: A Meta-Analysis. PLoS One. 2016, 11, e0165786. [Google Scholar] [CrossRef]
  4. Manatsathit, W.; Samant, H.; Kapur, S.; Ingviya, T.; Esmadi, M.; Wijarnpreecha, K.; Mccashland, T. Accuracy of liver stiffness, spleen stiffness, and LS-spleen diameter to platelet ratio score in detection of esophageal varices: Systemic review and meta-analysis. J Gastroenterol Hepatol. 2018, 33, 1696–1706. [Google Scholar] [CrossRef] [PubMed]
  5. Marasco, G.; Dajti, E.; Ravaioli, F.; Alemanni L., V.; Capuano, F.; Gjini, K.; Colecchia, L.; Puppini, G.; Cusumano, C.; Renzulli, M.; et al. Spleen stiffness measurement for assessing the response to β-blockers therapy for high-risk esophageal varices patients. Hepatol Int. 2020, 14, 850–857. [Google Scholar] [CrossRef]
  6. Colecchia, A.; Colli, A.; Casazza, G.; Mandolesi, D.; Schiumerini, R.; Reggiani L., B.; Marasco, G.; Taddia, M.; Lisotti, A.; Mazzella, G.; et al. Spleen stiffness measurement can predict clinical complications in compensated HCV-related cirrhosis: a prospective study. J Hepatol. 2014, 60, 1158–1164. [Google Scholar] [CrossRef]
  7. Buechter, M.; Manka, P.; Theysohn J., M.; Reinboldt, M.; Canbay, A.; Kahraman, A. Spleen stiffness is positively correlated with HVPG and decreases significantly after TIPS implantation. Dig Liver Dis. 2018, 50, 54–60. [Google Scholar] [CrossRef]
  8. Ekinci, O.; Ozgokce, M.; Turko, E.; Merter, M. Spleen Stiffness Measurement by Using Shear-Wave Elastography as a Predictor of Progression to Secondary Myelofibrosis. Ultrasound Q. 2021, 37, 149–154. [Google Scholar] [CrossRef]
  9. Abraldes J., G.; Reverter, E.; Berzigotti, A. Spleen stiffness: toward a noninvasive portal sphygmomanometer? Hepatology. 2013, 57, 1278–1280. [Google Scholar] [CrossRef] [PubMed]
  10. Albayrak, E.; Server, S. The relationship of spleen stiffness value measured by shear wave elastography with age, gender, and spleen size in healthy volunteers. J Med Ultrason (2001). 2019, 46, 195–199. [Google Scholar] [CrossRef] [PubMed]
  11. Bolognesi, M.; Merkel, C.; Sacerdoti, D.; Nava, V.; Gatta, A. Role of spleen enlargement in cirrhosis with portal hypertension. Dig Liver Dis. 2002, 34, 144–150. [Google Scholar] [CrossRef]
  12. Fraquelli, M.; Giunta, M.; Pozzi, R.; Rigamonti, C.; Della Valle, S.; Massironi, S.; Conti C., B.; Aghemo, A.; Ronchi, G.; Iurlo, A.; et al. Feasibility and reproducibility of spleen transient elastography and its role in combination with liver transient elastography for predicting the severity of chronic viral hepatitis. J Viral Hepat. 2014, 21, 90–98. [Google Scholar] [CrossRef] [PubMed]
  13. Takuma, Y.; Nouso, K.; Morimoto, Y.; Tomokuni, J.; Sahara, A.; Toshikuni, N.; Takabatake, H.; Shimomura, H.; Doi, A.; Sakakibara, I.; et al. Measurement of spleen stiffness by acoustic radiation force impulse imaging identifies cirrhotic patients with esophageal varices. Gastroenterology. 2013, 144, 92–101.e102. [Google Scholar] [CrossRef]
  14. Singh, R.; Wilson M., P.; Katlariwala, P.; Murad M., H.; Mcinnes M. D., F.; Low, G. Accuracy of liver and spleen stiffness on magnetic resonance elastography for detecting portal hypertension: a systematic review and meta-analysis. Eur J Gastroenterol Hepatol. 2021, 32, 237–245. [Google Scholar] [CrossRef]
  15. Zykus, R.; Jonaitis, L.; Petrenkienė, V.; Pranculis, A.; Kupčinskas, L. Liver and spleen transient elastography predicts portal hypertension in patients with chronic liver disease: a prospective cohort study. BMC Gastroenterol. 2015, 15, 183. [Google Scholar] [CrossRef]
  16. Procopet, B.; Berzigotti, A.; Abraldes J., G.; Turon, F.; Hernandez-Gea, V.; García-Pagán J., C.; Bosch, J. Real-time shear-wave elastography: applicability, reliability and accuracy for clinically significant portal hypertension. J Hepatol. 2015, 62, 1068–1075. [Google Scholar] [CrossRef] [PubMed]
  17. Calvaruso, V.; Di Marco, V.; Bronte, F.; Licata, G.; Simone, F.; Butera, G.; Pecoraro, G.; Cabibbi, D.; Alessi, N.; Cammà C. J. J. O., H. Spleen stiffness correlates with portal hypertension and increases the accuracy of detection of esophageal varices in HCV cirrhosis. J Hepatol. 2010, S159–S160. [Google Scholar] [CrossRef]
  18. Mannelli, L.; Godfrey, E.; Joubert, I.; Patterson A., J.; Graves M., J.; Gallagher F., A.; Lomas D., J. MR elastography: Spleen stiffness measurements in healthy volunteers--preliminary experience. AJR Am J Roentgenol. 2010, 195, 387–392. [Google Scholar] [CrossRef]
  19. Serai S., D.; Elsingergy M., M.; Hartung E., A.; Otero H., J. Liver and spleen volume and stiffness in patients post-Fontan procedure and patients with ARPKD compared to normal controls. Clin Imaging. 2022, 89, 147–154. [Google Scholar] [CrossRef]
  20. Talwalkar J., A.; Yin, M.; Venkatesh, S.; Rossman P., J.; Grimm R., C.; Manduca, A.; Romano, A.; Kamath P., S.; Ehman R., L. Feasibility of in vivo MR elastographic splenic stiffness measurements in the assessment of portal hypertension. AJR Am J Roentgenol. 2009, 193, 122–127. [Google Scholar] [CrossRef]
  21. Kassym, L.; Nounou M., A.; Zhumadilova, Z.; Dajani A., I.; Barkibayeva, N.; Myssayev, A.; Rakhypbekov, T.; Abuhammour A., M. New combined parameter of liver and splenic stiffness as determined by elastography in healthy volunteers. Saudi J Gastroenterol. 2016, 22, 324–330. [Google Scholar] [CrossRef]
  22. Bhatia, A.; Bhatia, H.; Saxena A., K.; Lal S., B.; Sodhi K., S. Shear wave elastography of the spleen using elastography point quantification: stiffness values in healthy children. Abdom Radiol (NY). 2022, 47, 2128–2134. [Google Scholar] [CrossRef] [PubMed]
  23. Hirooka, M.; Ochi, H.; Koizumi, Y.; Kisaka, Y.; Abe, M.; Ikeda, Y.; Matsuura, B.; Hiasa, Y.; Onji, M. Splenic elasticity measured with real-time tissue elastography is a marker of portal hypertension. Radiology. 2011, 261, 960–968. [Google Scholar] [CrossRef]
  24. Tanaka, H.; Iijima, H.; Nishimura, J.; Takashima, T.; Ishii, A.; Sakai, Y.; Iwata, K.; Ikeda, N.; Iwata, Y.; Enomoto H., editors. Could spleen stiffness measurement using Virtual Touch tissue quantification be a good predictor of the presence of varices, including large esophageal varices? Hepatology. NJ USA: Wiley-Blackwell, 2012.
  25. Yasar T., K.; Wagner, M.; Bane, O.; Besa, C.; Babb J., S.; Kannengiesser, S.; Fung, M.; Ehman R., L.; Taouli, B. Interplatform reproducibility of liver and spleen stiffness measured with MR elastography. J Magn Reson Imaging. 2016, 43, 1064–1072. [Google Scholar] [CrossRef] [PubMed]
  26. Hines C., D.; Bley T., A.; Lindstrom M., J.; Reeder S., B. Repeatability of magnetic resonance elastography for quantification of hepatic stiffness. J Magn Reson Imaging. 2010, 31, 725–731. [Google Scholar] [CrossRef] [PubMed]
  27. Bota, S.; Herkner, H.; Sporea, I.; Salzl, P.; Sirli, R.; Neghina A., M.; Peck-Radosavljevic, M. Meta-analysis: ARFI elastography versus transient elastography for the evaluation of liver fibrosis. Liver Int. 2013, 33, 1138–1147. [Google Scholar] [CrossRef]
  28. Ferraioli, G.; Tinelli, C.; Lissandrin, R.; Zicchetti, M.; Bernuzzi, S.; Salvaneschi, L.; Filice, C. Ultrasound point shear wave elastography assessment of liver and spleen stiffness: effect of training on repeatability of measurements. Eur Radiol. 2014, 24, 1283–1289. [Google Scholar] [CrossRef]
  29. Singh, S.; Eaton J., E.; Murad M., H.; Tanaka, H.; Iijima, H.; Talwalkar J., A. Accuracy of spleen stiffness measurement in detection of esophageal varices in patients with chronic liver disease: systematic review and meta-analysis. Clin Gastroenterol Hepatol. 2014, 12, 935–945.e934. [Google Scholar] [CrossRef]
  30. Shire N., J.; Yin, M.; Chen, J.; Railkar R., A.; Fox-Bosetti, S.; Johnson S., M.; Beals C., R.; Dardzinski B., J.; Sanderson S., O.; Talwalkar J., A.; et al. Test-retest repeatability of MR elastography for noninvasive liver fibrosis assessment in hepatitis C. J Magn Reson Imaging. 2011, 34, 947–955. [Google Scholar] [CrossRef]
  31. Morisaka, H.; Motosugi, U.; Ichikawa, S.; Sano, K.; Ichikawa, T.; Enomoto, N. Association of splenic MR elastographic findings with gastroesophageal varices in patients with chronic liver disease. J Magn Reson Imaging. 2015, 41, 117–124. [Google Scholar] [CrossRef]
  32. Reiter, R.; Tzschätzsch, H.; Schwahofer, F.; Haas, M.; Bayerl, C.; Muche, M.; Klatt, D.; Majumdar, S.; Uyanik, M.; Hamm, B.; et al. Diagnostic performance of tomoelastography of the liver and spleen for staging hepatic fibrosis. Eur Radiol. 2020, 30, 1719–1729. [Google Scholar] [CrossRef] [PubMed]
  33. Wagner, M.; Hectors, S.; Bane, O.; Gordic, S.; Kennedy, P.; Besa, C.; Schiano T., D.; Thung, S.; Fischman, A.; Taouli, B. Noninvasive prediction of portal pressure with MR elastography and DCE-MRI of the liver and spleen: Preliminary results. J Magn Reson Imaging. 2018, 48, 1091–1103. [Google Scholar] [CrossRef] [PubMed]
  34. Cho Y., S.; Lim, S.; Kim, Y.; Sohn J., H.; Jeong J., Y. Spleen Stiffness Measurement Using 2-Dimensional Shear Wave Elastography: The Predictors of Measurability and the Normal Spleen Stiffness Value. J Ultrasound Med. 2019, 38, 423–431. [Google Scholar] [CrossRef] [PubMed]
  35. Lee M., J.; Kim M., J.; Han K., H.; Yoon C., S. Age-related changes in liver, kidney, and spleen stiffness in healthy children measured with acoustic radiation force impulse imaging. Eur J Radiol. 2013, 82, e290–294. [Google Scholar] [CrossRef] [PubMed]
  36. Arda, K.; Ciledag, N.; Aktas, E.; Aribas B., K.; Köse, K. Quantitative assessment of normal soft-tissue elasticity using shear-wave ultrasound elastography. AJR Am J Roentgenol. 2011, 197, 532–536. [Google Scholar] [CrossRef] [PubMed]
  37. Nowotny, F.; Schmidberger, J.; Schlingeloff, P.; Binzberger, A.; Kratzer, W. Comparison of point and two-dimensional shear wave elastography of the spleen in healthy subjects. World J Radiol. 2021, 13, 137–148. [Google Scholar] [CrossRef]
  38. Amin, B.; Bowser B., L.; Robinson R. a., S. Quantitative proteomics to study aging in rabbit spleen tissues. Exp Gerontol. 2022, 167, 111908. [Google Scholar] [CrossRef]
  39. Cesta M., F. Normal Structure, Function, and Histology of the Spleen. Toxicol Pathol. 2006, 34, 455–465. [Google Scholar] [CrossRef]
  40. Alex, L.; Rajan M., L.; Xavier, B.; Jacob, P.; Rani K., D.; Lakshmi G., V. Microscopic study of human spleen in different age groups. Int J Res Med Sci. 2015, 1701–1706. [Google Scholar] [CrossRef]
  41. Losco, P. Normal development, growth, and aging of the spleen. Pathology of the Aging Rat. 1992, 75–94. [Google Scholar]
  42. Hogenesch, H.; Hahn, F. The lymphoid organs: anatomy, development, and age-related changes. Pathobiology of the Aging Dog. 2001, 1, 127e135. [Google Scholar]
  43. Madden K., S.; Bellinger D., L.; Felten S., Y.; Snyder, E.; Maida M., E.; Felten D., L. Alterations in sympathetic innervation of thymus and spleen in aged mice. Mech Ageing Dev. 1997, 94, 165–175. [Google Scholar] [CrossRef]
  44. Slagboom P., E.; De Leeuw W., J.; Vijg, J. Messenger RNA levels and methylation patterns of GAPDH and beta-actin genes in rat liver, spleen and brain in relation to aging. Mech Ageing Dev. 1990, 53, 243–257. [Google Scholar] [CrossRef] [PubMed]
  45. Cheung H., T.; Nadakavukaren M., J. Age-dependent changes in the cellularity and ultrastructure of the spleen of Fischer F344 rats. Mech Ageing Dev. 1983, 22, 23–33. [Google Scholar] [CrossRef] [PubMed]
  46. Rifai, K.; Sebagh, M.; Karam, V.; Saliba, F.; Azoulay, D.; Adam, R.; Castaing, D.; Bismuth, H.; Reynès, M.; Samuel, D.; et al. Donor age influences 10-year liver graft histology independently of hepatitis C virus infection. J Hepatol. 2004, 41, 446–453. [Google Scholar] [CrossRef]
  47. Stefanescu, H.; Grigorescu, M.; Lupsor, M.; Procopet, B.; Maniu, A.; Badea, R. Spleen stiffness measurement using Fibroscan for the noninvasive assessment of esophageal varices in liver cirrhosis patients. J Gastroenterol Hepatol. 2011, 26, 164–170. [Google Scholar] [CrossRef]
  48. Balakrishnan, M.; Souza, F.; Muñoz, C.; Augustin, S.; Loo, N.; Deng, Y.; Ciarleglio, M.; Garcia-Tsao, G. Liver and Spleen Stiffness Measurements by Point Shear Wave Elastography via Acoustic Radiation Force Impulse: Intraobserver and Interobserver Variability and Predictors of Variability in a US Population. J Ultrasound Med. 2016, 35, 2373–2380. [Google Scholar] [CrossRef]
  49. Mannelli, L.; Godfrey, E.; Graves M., J.; Patterson A., J.; Beddy, P.; Bowden, D.; Joubert, I.; Priest A., N.; Lomas D., J. Magnetic resonance elastography: feasibility of liver stiffness measurements in healthy volunteers at 3T. Clin Radiol. 2012, 67, 258–262. [Google Scholar] [CrossRef]
  50. Dittmann, F.; Tzschätzsch, H.; Hirsch, S.; Barnhill, E.; Braun, J.; Sack, I.; Guo, J. Tomoelastography of the abdomen: Tissue mechanical properties of the liver, spleen, kidney, and pancreas from single MR elastography scans at different hydration states. Magn Reson Med. 2017, 78, 976–983. [Google Scholar] [CrossRef]
Disclaimer/Publisher’s Note: The statements, opinions and data contained in all publications are solely those of the individual author(s) and contributor(s) and not of MDPI and/or the editor(s). MDPI and/or the editor(s) disclaim responsibility for any injury to people or property resulting from any ideas, methods, instructions or products referred to in the content.
Copyright: This open access article is published under a Creative Commons CC BY 4.0 license, which permit the free download, distribution, and reuse, provided that the author and preprint are cited in any reuse.
Prerpints.org logo

Preprints.org is a free preprint server supported by MDPI in Basel, Switzerland.

Subscribe

© 2024 MDPI (Basel, Switzerland) unless otherwise stated