Preprint
Article

An Eccentricity Error Separation Method for Rotary Table Based on Phase Feature of Moiré Signal of Single Reading Head

Altmetrics

Downloads

65

Views

13

Comments

0

A peer-reviewed article of this preprint also exists.

Submitted:

17 October 2023

Posted:

17 October 2023

You are already at the latest version

Alerts
Abstract
In view of the limitations of the existing eccentricity error separation method of the rotary table, an eccentricity error separation method based on the phase feature of the moiré signal of single reading head is proposed herein. A grating pair transmission model is established based on the analysis of the principle of the rotary table, thereby the influence of eccentricity error on the phase feature of the moiré signal in the rotation course of the rotary table is clarified, and the corresponding model between the phase feature spectral components and the eccentricity error is established. The verification experiments of the proposed method are carried out based on the laboratory-made circuit system. After verifying the accuracy of the data acquisition of the laboratory-made circuit board, the verification experiments of the eccentricity error separation effect of the proposed method are carried out. The experimental data are compared with those of the traditional method and the results show that the error between the two methods is 2.34μm and the relative error is 2.3%.
Keywords: 
Subject: Engineering  -   Industrial and Manufacturing Engineering

1. Introduction

The rotary table plays a crucial role in the field of high-precision angle measurement. They can be broadly classified as mechanical, electromagnetic and photoelectric, with photoelectric rotary tables being the most widely used, offering the advantages of high accuracy[1], a wide measurement range and high immunity to interference. The photoelectric rotary table consists of a rotating shaft, a photoelectric reading head and an internal circular grating. During the rotation process, the relative movement of the grating pair produces changing moiré fringe, and the moiré signal corresponding to the displacement output by the photoelectric reading head[2]. There are quite a few factors affecting the accuracy of the rotary table[3], which can be roughly divided into inherent error and application-dependent error[4], of which the eccentricity error in application-dependent error is the most important factor affecting the accuracy of angle measurement[5,6,7], therefore separating the eccentricity error is of great value to ensure the accuracy of the rotary table.
The separation methods for the eccentricity error of the rotary table can be divided into two types[8,9,10,11]. One is based on the fundamental of circumferential closure property, external calibration devices are used to separate the eccentricity error components of the rotary table by calibrating the discrete positioning error curve of the entire circumference of the rotary table. Chen Xi-jun et al.[12] established the moiré fringe equation with eccentricity error, derived the equation of angle measurement error caused by eccentricity error, calibrated rotary table using a polyhedral prism, and fitted the angle measurement error equation of the rotary table and the eccentricity error of the rotary table. Mi Xiao-tao et al.[13] analyzed the relationship between the angular measurement results and the error caused by the eccentricity error, calibrated the discrete angular measurement error by polyhedral prism and autocollimator, fitted the angular measurement error function through the least-squares fitting method , and separated the eccentricity error of the circular grating. Zheng Da-teng, et al.[14] established the relationship model between the eccentricity error and the angle measurement error of AACMM (Articulated Arm Coordinate Measuring Machine), calibrated the angle measurement error with polyhedral prism, and fitted the compensation function of the angle measurement error and the eccentricity error with nonlinear least square method. Although this kind of methods have high accuracy in separating eccentricity error, it has high requirements for the operating environment and device accuracy, and there is a difficulty of cumbersome operating steps.
Another kind of methods are realized with various sensors to achieve eccentricity error separation in the rotary table[15,16,17]. Ai Cheng-guang et al.[18] proposed an eccentricity error separation model based on non-diametric dual reading heads, compared the phase difference of the moiré signals received by the dual reading heads and separated the eccentricity error and the eccentricity error direction of the circular grating in the platform by synthesizing the Lissajous graph of the signals. Feng Chao-peng et al.[19] developed a model for the eccentricity error of dual reading heads, derived a self-calibration equation for the eccentricity error parameters of a circular grating based on the dual reading heads, and solved for the eccentricity error parameters by experimentally self-calibrating the eccentricity error parameters of a circular grating with double reading heads installed diametrically opposite, thereby achieving the separation of the eccentricity error of a circular grating. A fast least square fitting method for calculating eccentricity error was proposed by Zhu San-ying et al.[20], who combined a laser displacement sensor with the proposed fast algorithm to accurately and quickly separate the eccentricity error of the device. Wang Ya-zhou et al.[21] proposed a grating eccentricity error detection system based on image-based angular displacement measurement and used two pairs of diameter image sensors to separate the grating eccentricity error. This kind of methods are relatively simple and fast, but multiple sensors are required and the internal structure of the rotary table often needs to be exposed.
Focus on the limitations of the two kinds of eccentricity error separation methods, a method for separating eccentricity error based on the signal of single reading head of the rotary table is proposed in this paper. By establishing grating pair transmission model, the influence of eccentricity error on the phase feature of the moiré signal in the rotation course of the rotary table is clarified, thereby a model for the relationship between the phase spectrum components and eccentricity error is established. The verification and comparison experiments of the eccentricity error separation method are carried out based on the laboratory-made circuit system, and the experimental results prove the effectiveness and accuracy of the proposed method.

2. Model of the proposed method

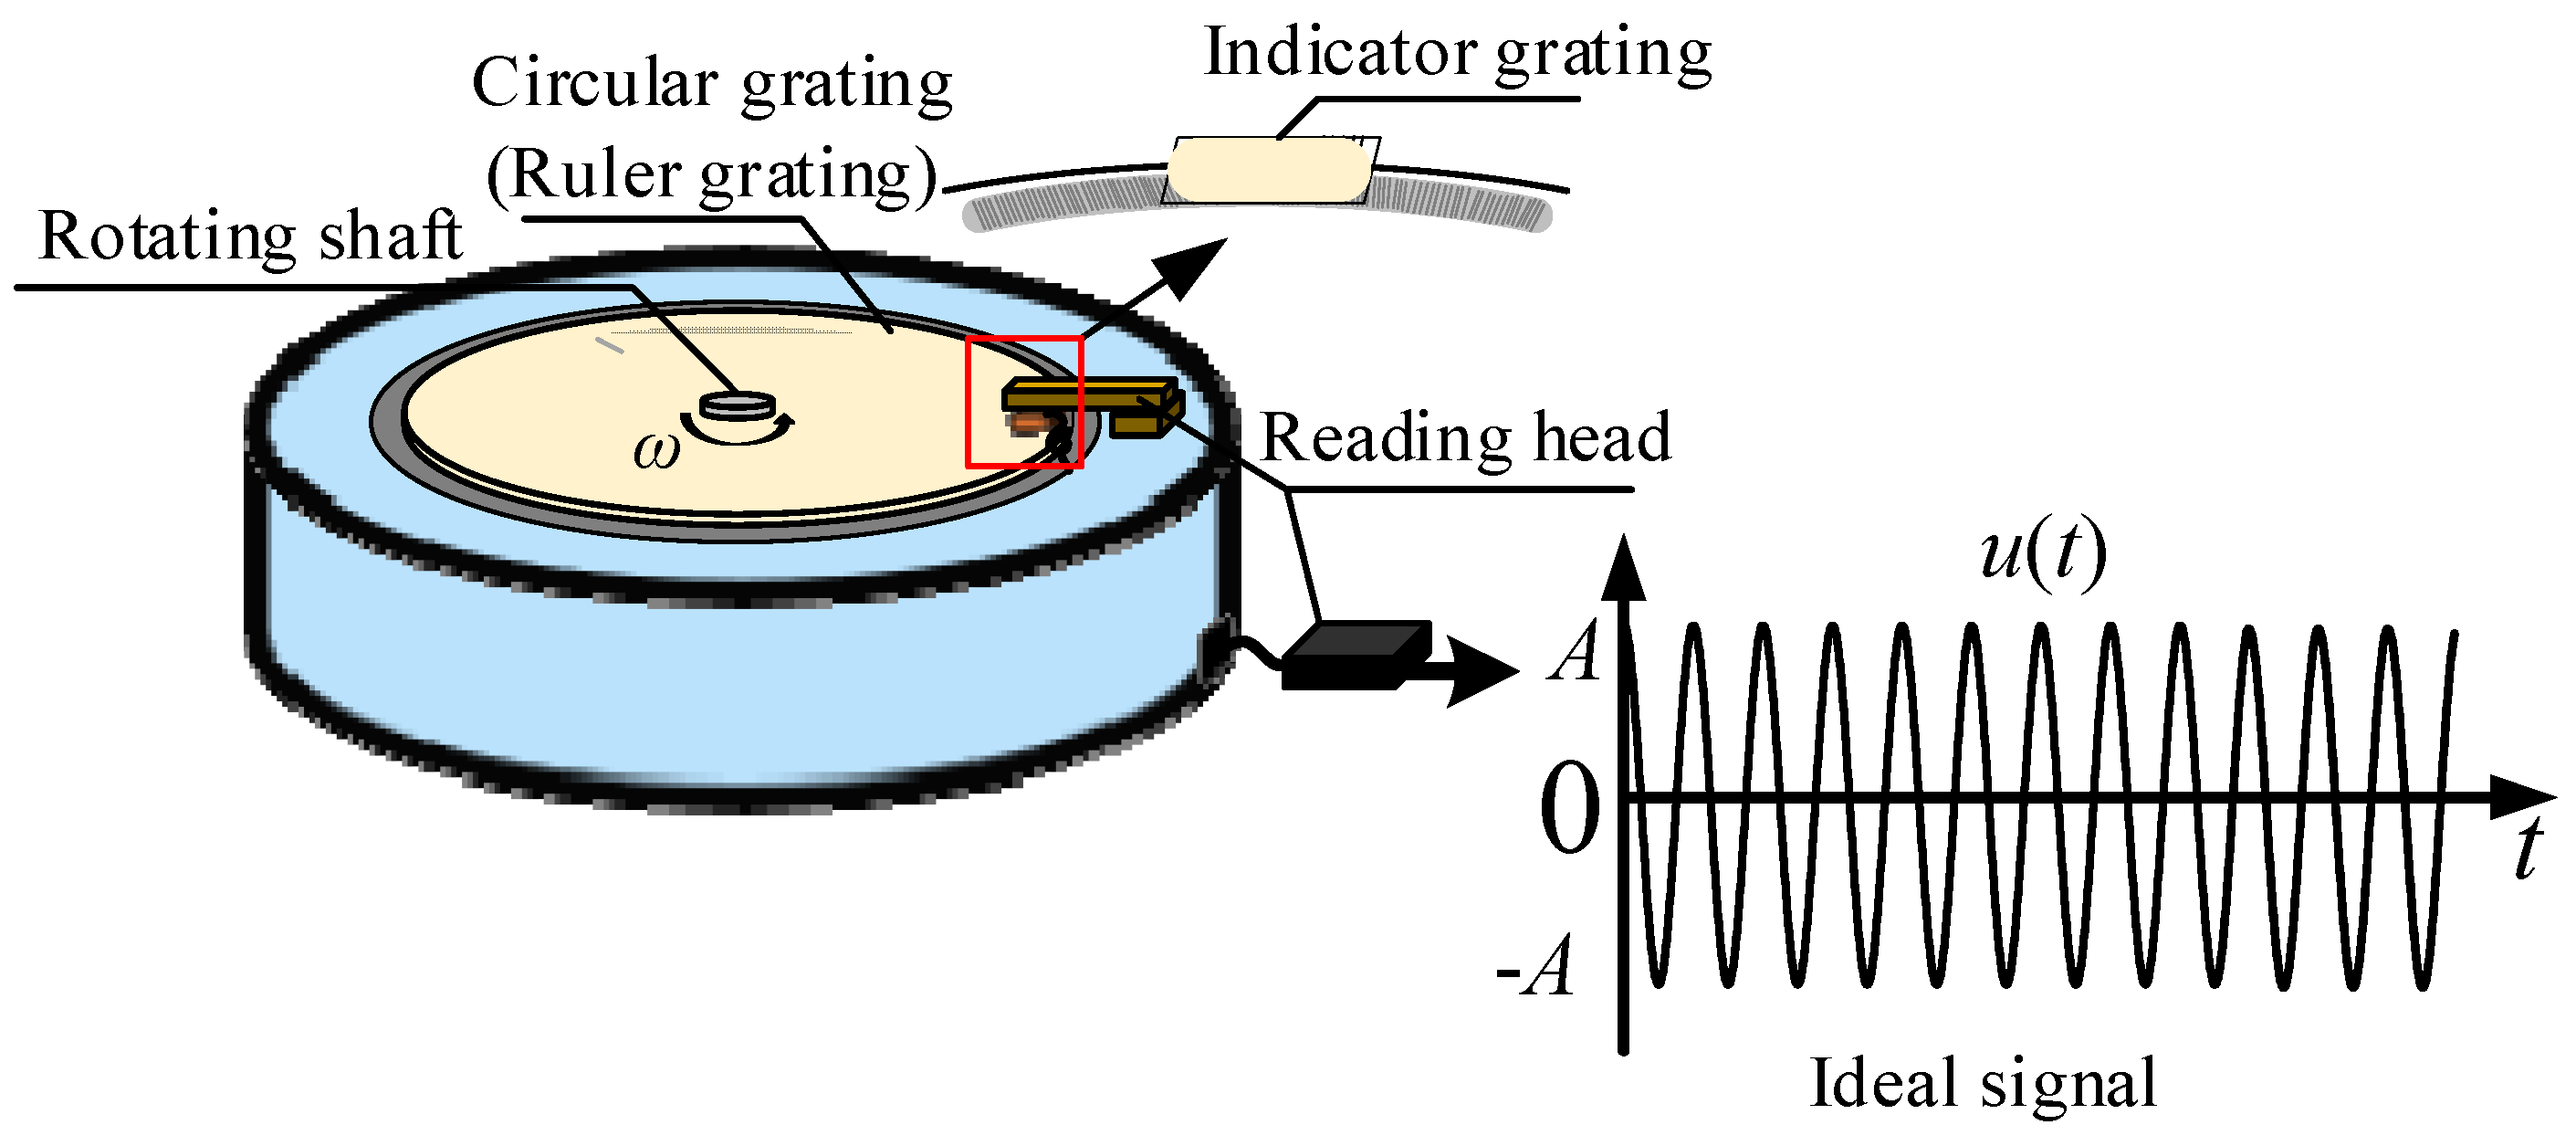
The photoelectric rotary table is mainly composed of a rotating shaft, an internal circular grating and a grating reading head. The internal grating in the reading head is the indicative grating and the circular grating is the scale grating. The two of them form the grating pair. The schematic of the structure of rotary table is shown in Figure 1.
As shown in Figure 1, when rotating at a constant speed ω, the output moiré signal, defined as u(t), is with constant frequency and amplitude. The period of u(t) corresponds to the indexing angle of the grating line.
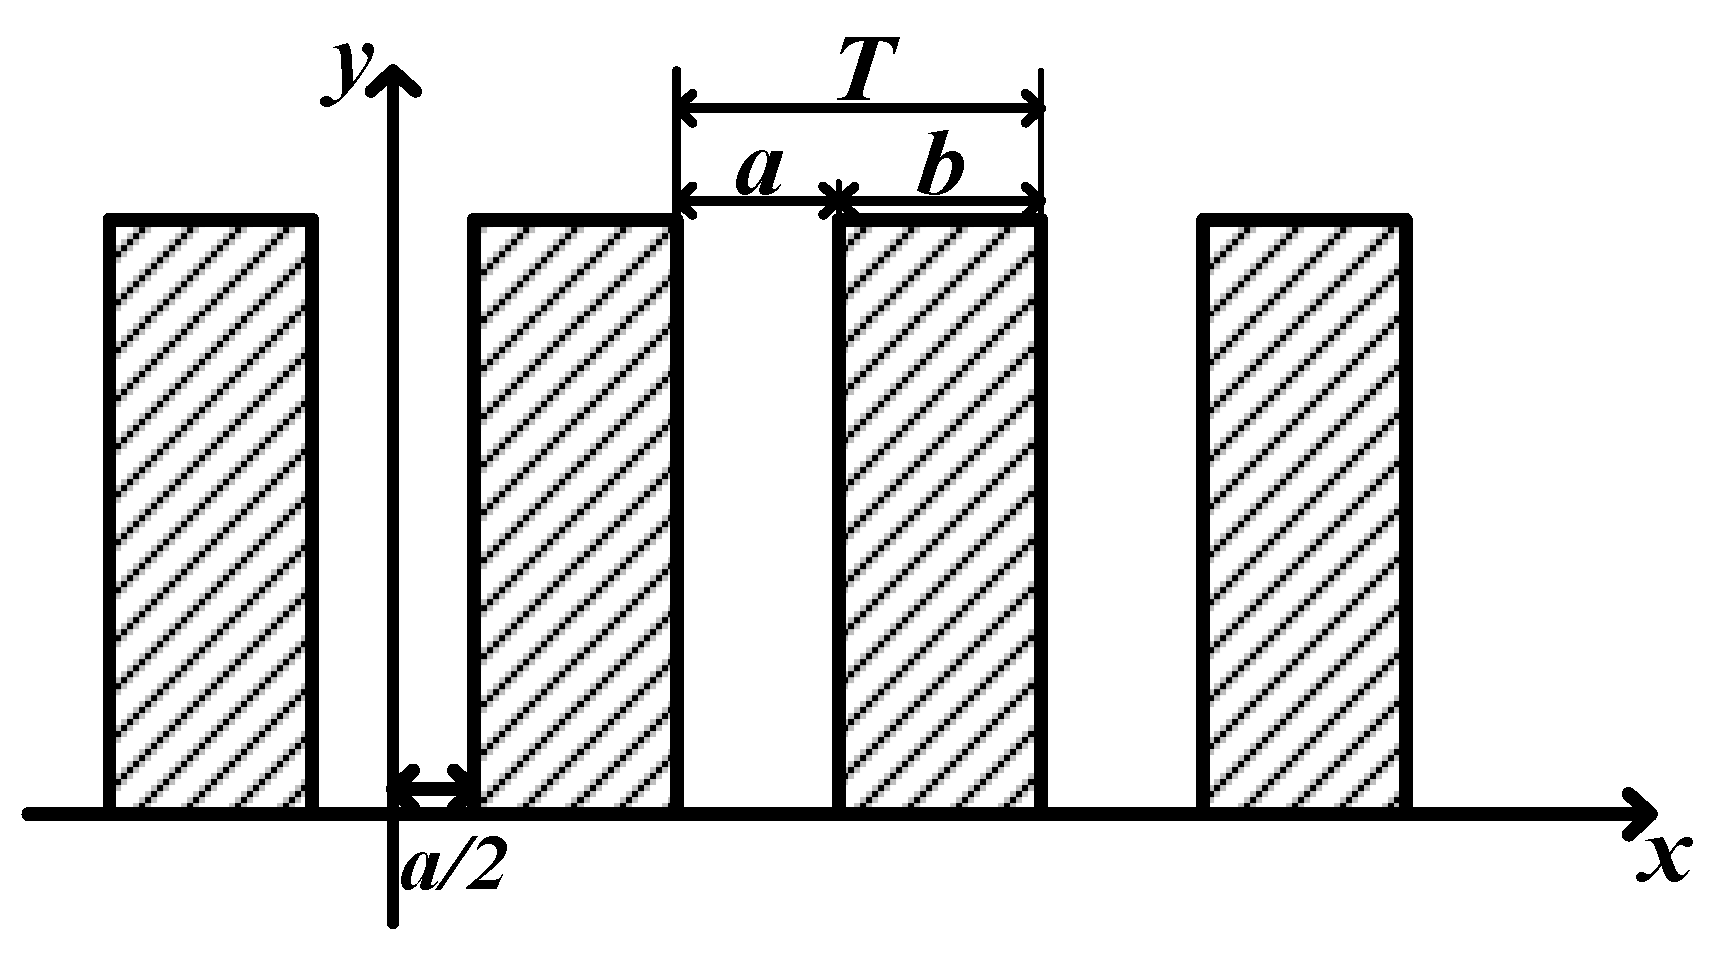
Due to the small receiving field of the reading head, usually at the millimeter level, the indicative grating and scale grating of the rotary table can both be regarded as a single rectangular grating as shown in Figure 2.
In the xoy plane where the grating lines are located, the x direction is the vertical grating line direction and the grating lines are evenly distributed. Setting the grating pitch is T, the length of the shading area is b and the light transmittance is zero while the length of the light-transmitting area is a and the light transmittance is equal to one. For the parallel light emitted from the reading head, grating transmission function L(x) can be described as
L ( x ) = 1 k T a 2 , k T + a 2 0 else
Extend the Fourier Series on L(x), and its complex form can be written as
L ( x ) = n = A n exp ( i 2 π n v x )
Where v is the spatial frequency of the grating and v=1/T. An is the Fourier coefficient and n=0,±1,±2,… . The expression of An is shown in equation (3).
A n = 1 T 0 d L 1 x exp i 2 π n x T d x = 1 π n sin π n a T = 1 π n sin π n β
Where β=a/T. The transmission functions of the scale grating and the indicative grating follow the above basic equation.
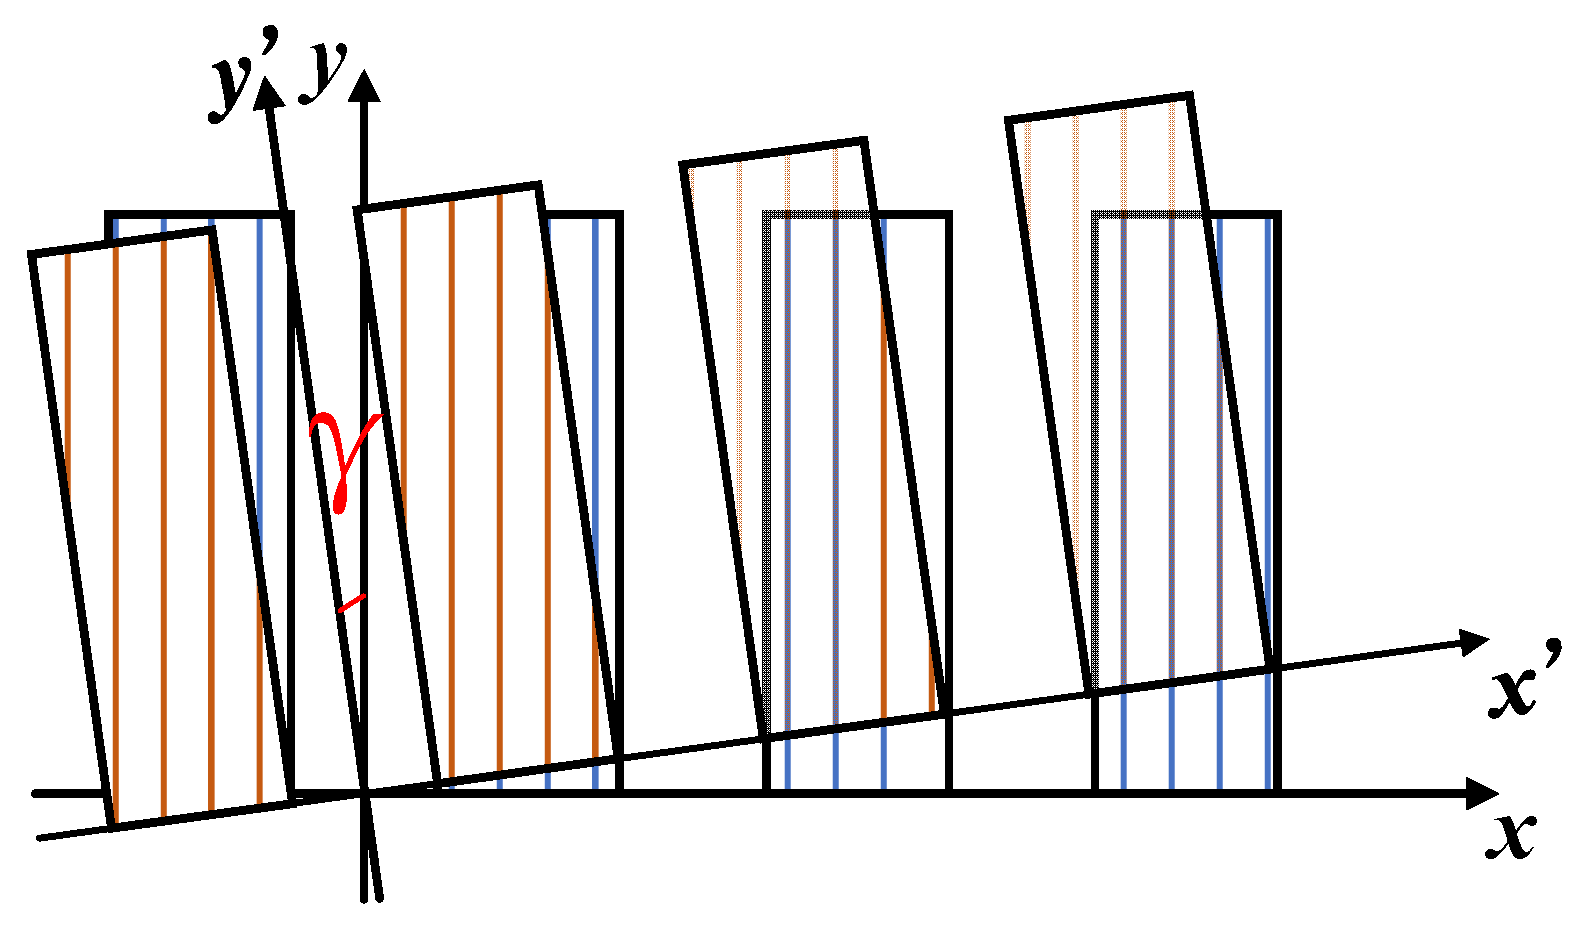
In the actual measurement process, the indicative grating and the scale grating are not completely overlapping, and there is a certain angle of γ. The schematic diagram of the relative position of the two gratings is shown in Figure 3.
When the indicative grating and the scale grating are superimposed, the indicative grating decomposes the incident light into plane wave arrays in different propagation directions, namely expands the incident light into the amplitude distribution of the cosine primitive. For the scale grating, the plane waves in each direction of the indicative grating are incident waves, that is to say the indicative grating decomposes the parallel light and the scale grating subsequently modulates the decomposed light field. The transmission functions of L1(x) and L2(x , y) of the two gratings can be expressed as
L 1 ( x ) = n = A n exp ( i 2 π n v 1 x ) L 2 ( x , , y ) = m = B m exp i 2 π m v 2 x cos γ + y sin γ
Where v1 and v2 are the spatial frequencies of the indicative grating and scale grating respectively. An and Bm are the Fourier Series of the two transmission functions, respectively. The transmission function M(x,y) of the moiré fringe composed of the scale grating and the indicative grating is
M ( x , y ) = L 1 ( x ) L 2 ( x , y ) = n = A n exp ( i 2 π n v 1 x ) m = B m exp i 2 π m v 2 x cos γ + y sin γ
equation (5) is the transmission function of the grating pair inside the rotary table under the ideal condition.
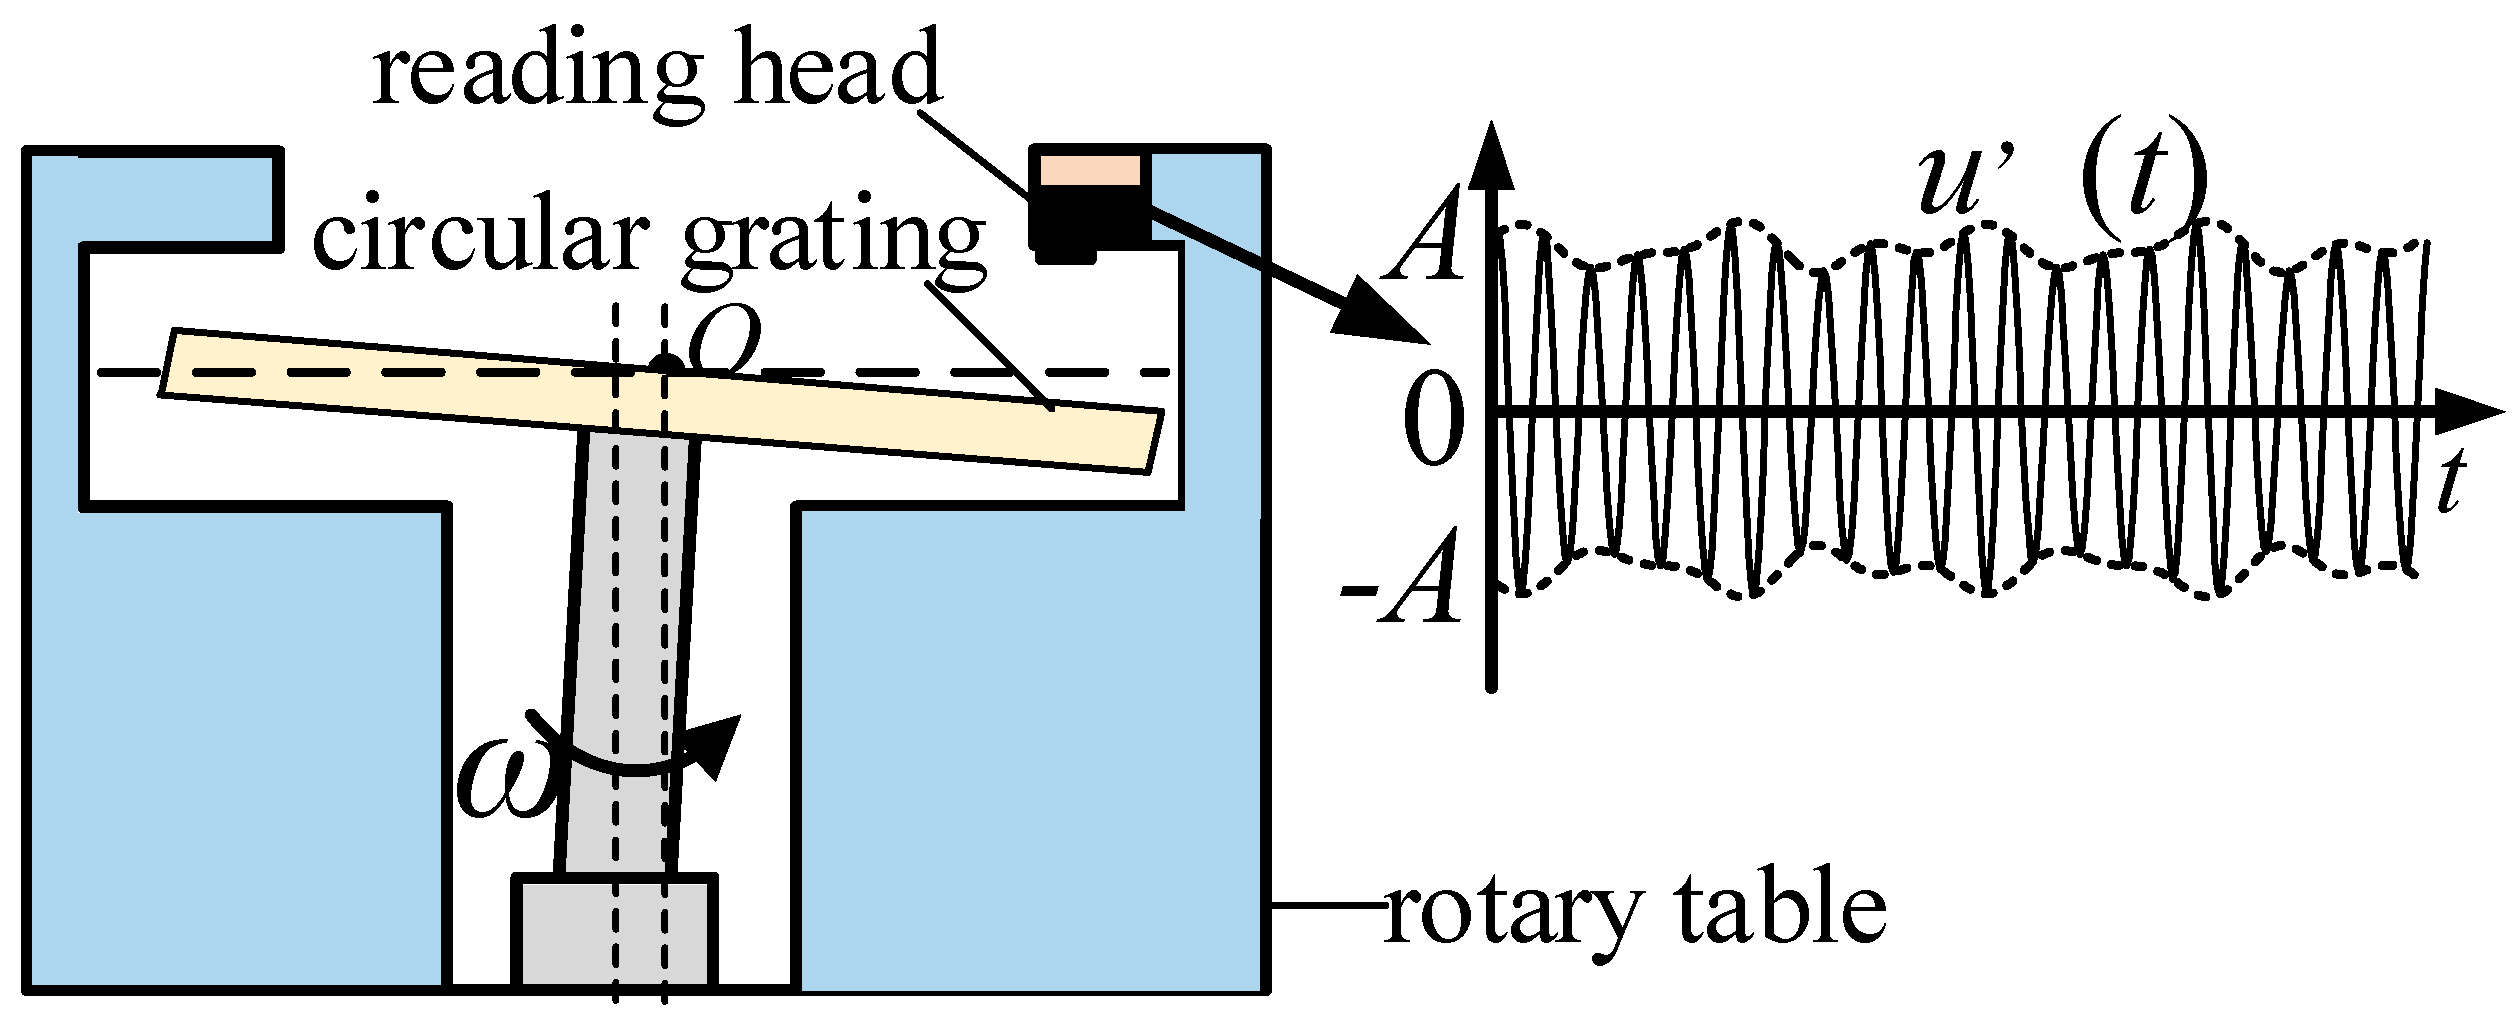
In actual working situation, the rotary table is affected by factors such as mechanical wear, installation errors, thereby the internal attitude will deviate. The actual structure of the internal section of the rotary table and the output moiré signal, which is defined as u’(t), are shown in Figure 4.
It can be seen from Figure 4 that due to the change of the internal attitude of the rotary table, the relative position of the indicative grating and the scale grating is displaced. The output light intensity of the incident light irradiated in the grating pair changes, subsequently the output moiré signal is different from the ideal moiré signal. The difference in amplitude and phase between the output moiré signal and the ideal moiré signal is collectively called the feature of moiré signal.
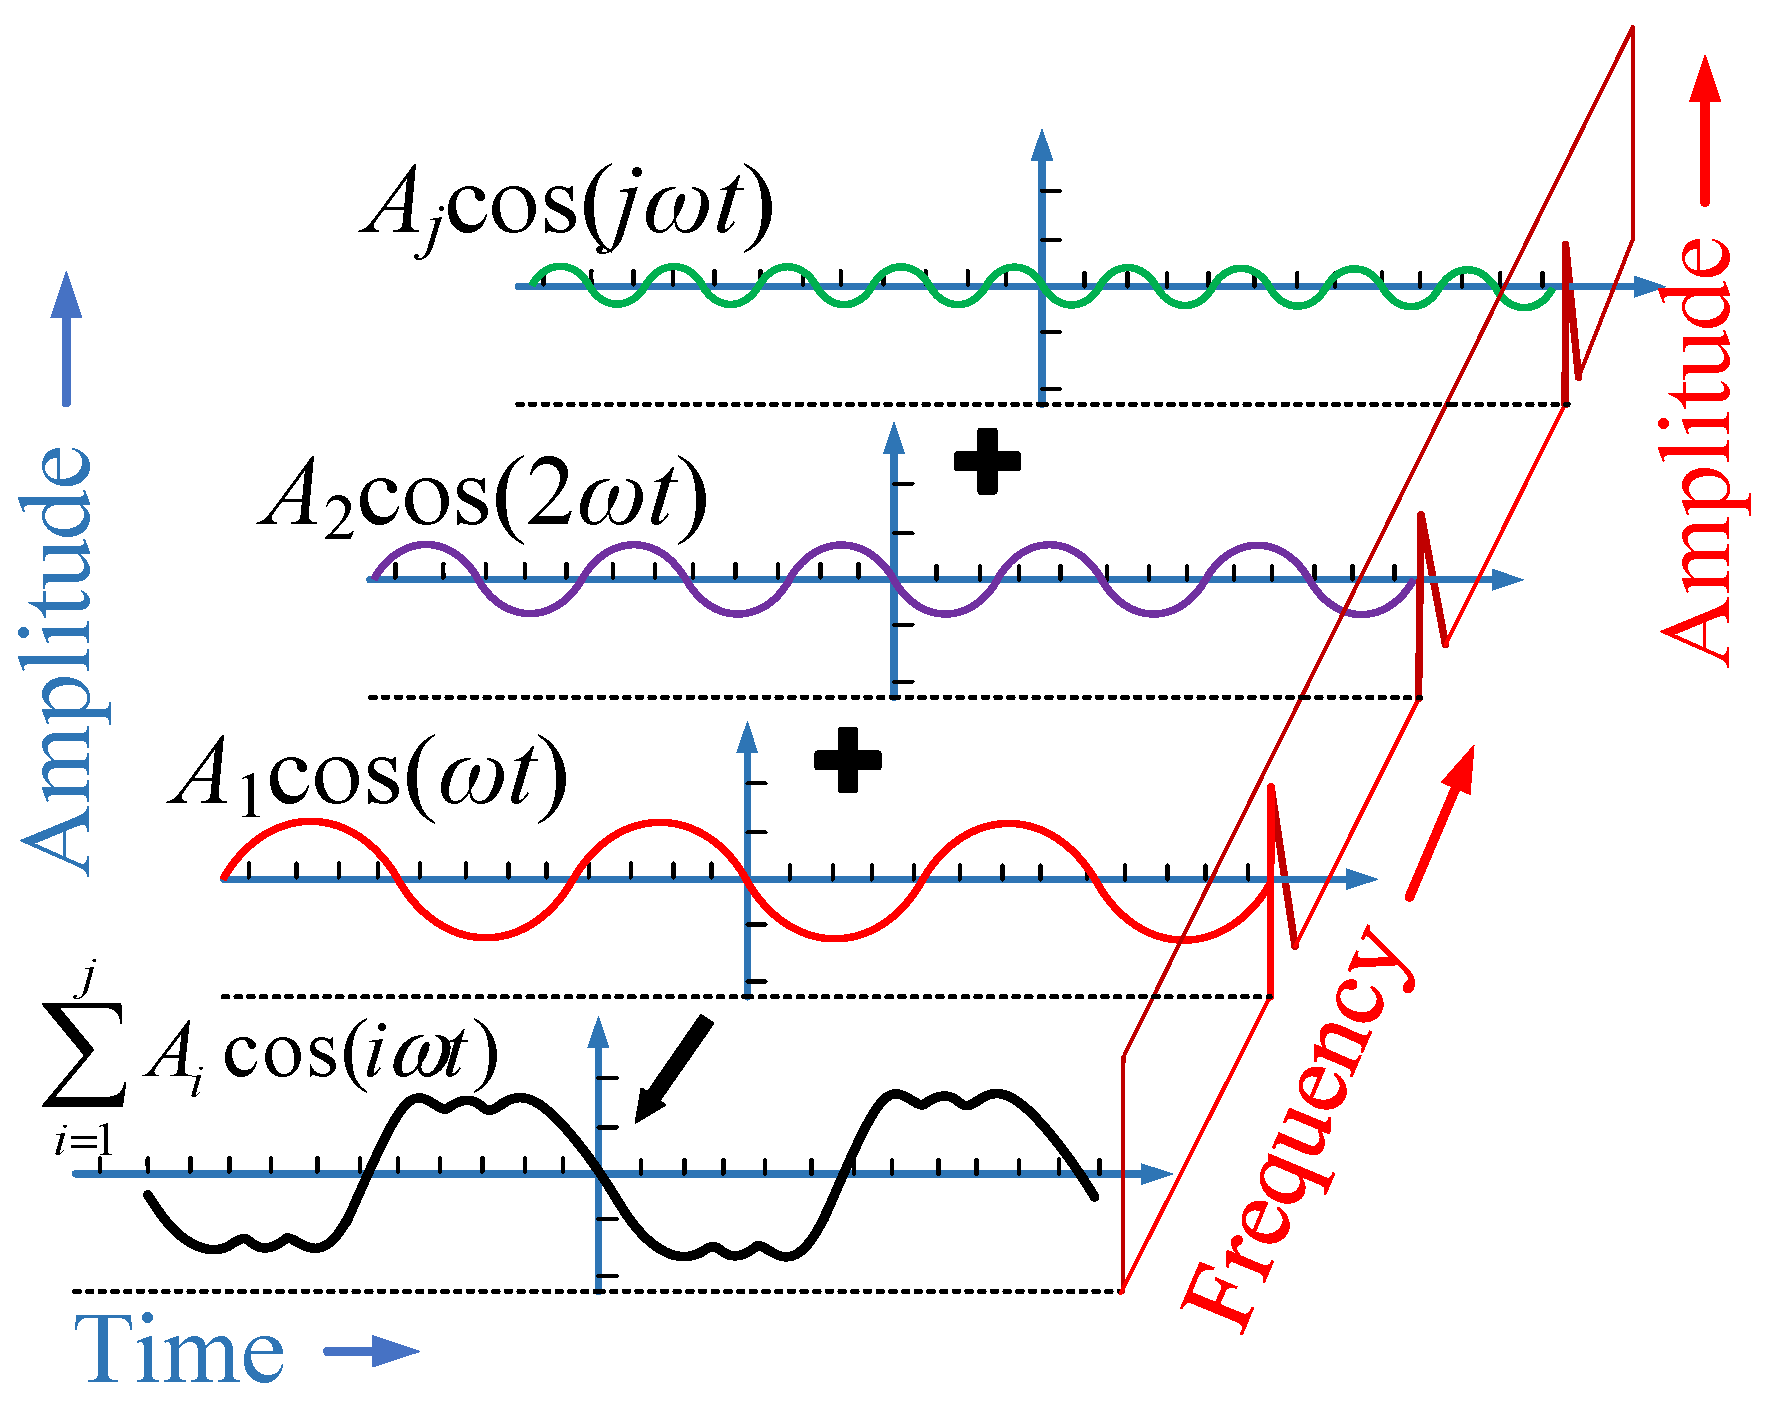
The phase feature of moiré signal, defined as φm(t), is used to realize the eccentricity error separation of the rotary table in this paper. Since the rotary table is affected by quite a few factors in the actual rotation, the φm(t) can be regarded as a composite waveform formed by the superposition and mixture of various frequency harmonics, as shown in Figure 5.
In this figure, Aicos(iωt), i=1,2…are the harmonic components of the feature of moiré signal caused by system error factors of the rotary table, where Ai are the amplitude of the harmonic and i is the order of the harmonic. The feature of moiré signal of the rotary table is formed by superposition and addition of harmonic components of each order. Since the period of the eccentricity error of the rotary table is 2π, the phase feature of moiré signal caused by eccentricity error, defined as φme(t), corresponds to the first-order component of φm(t), which accounts for the largest proportion in the feature of moiré signal, namely has the greatest influence on the amplitude and phase of the moiré signal.
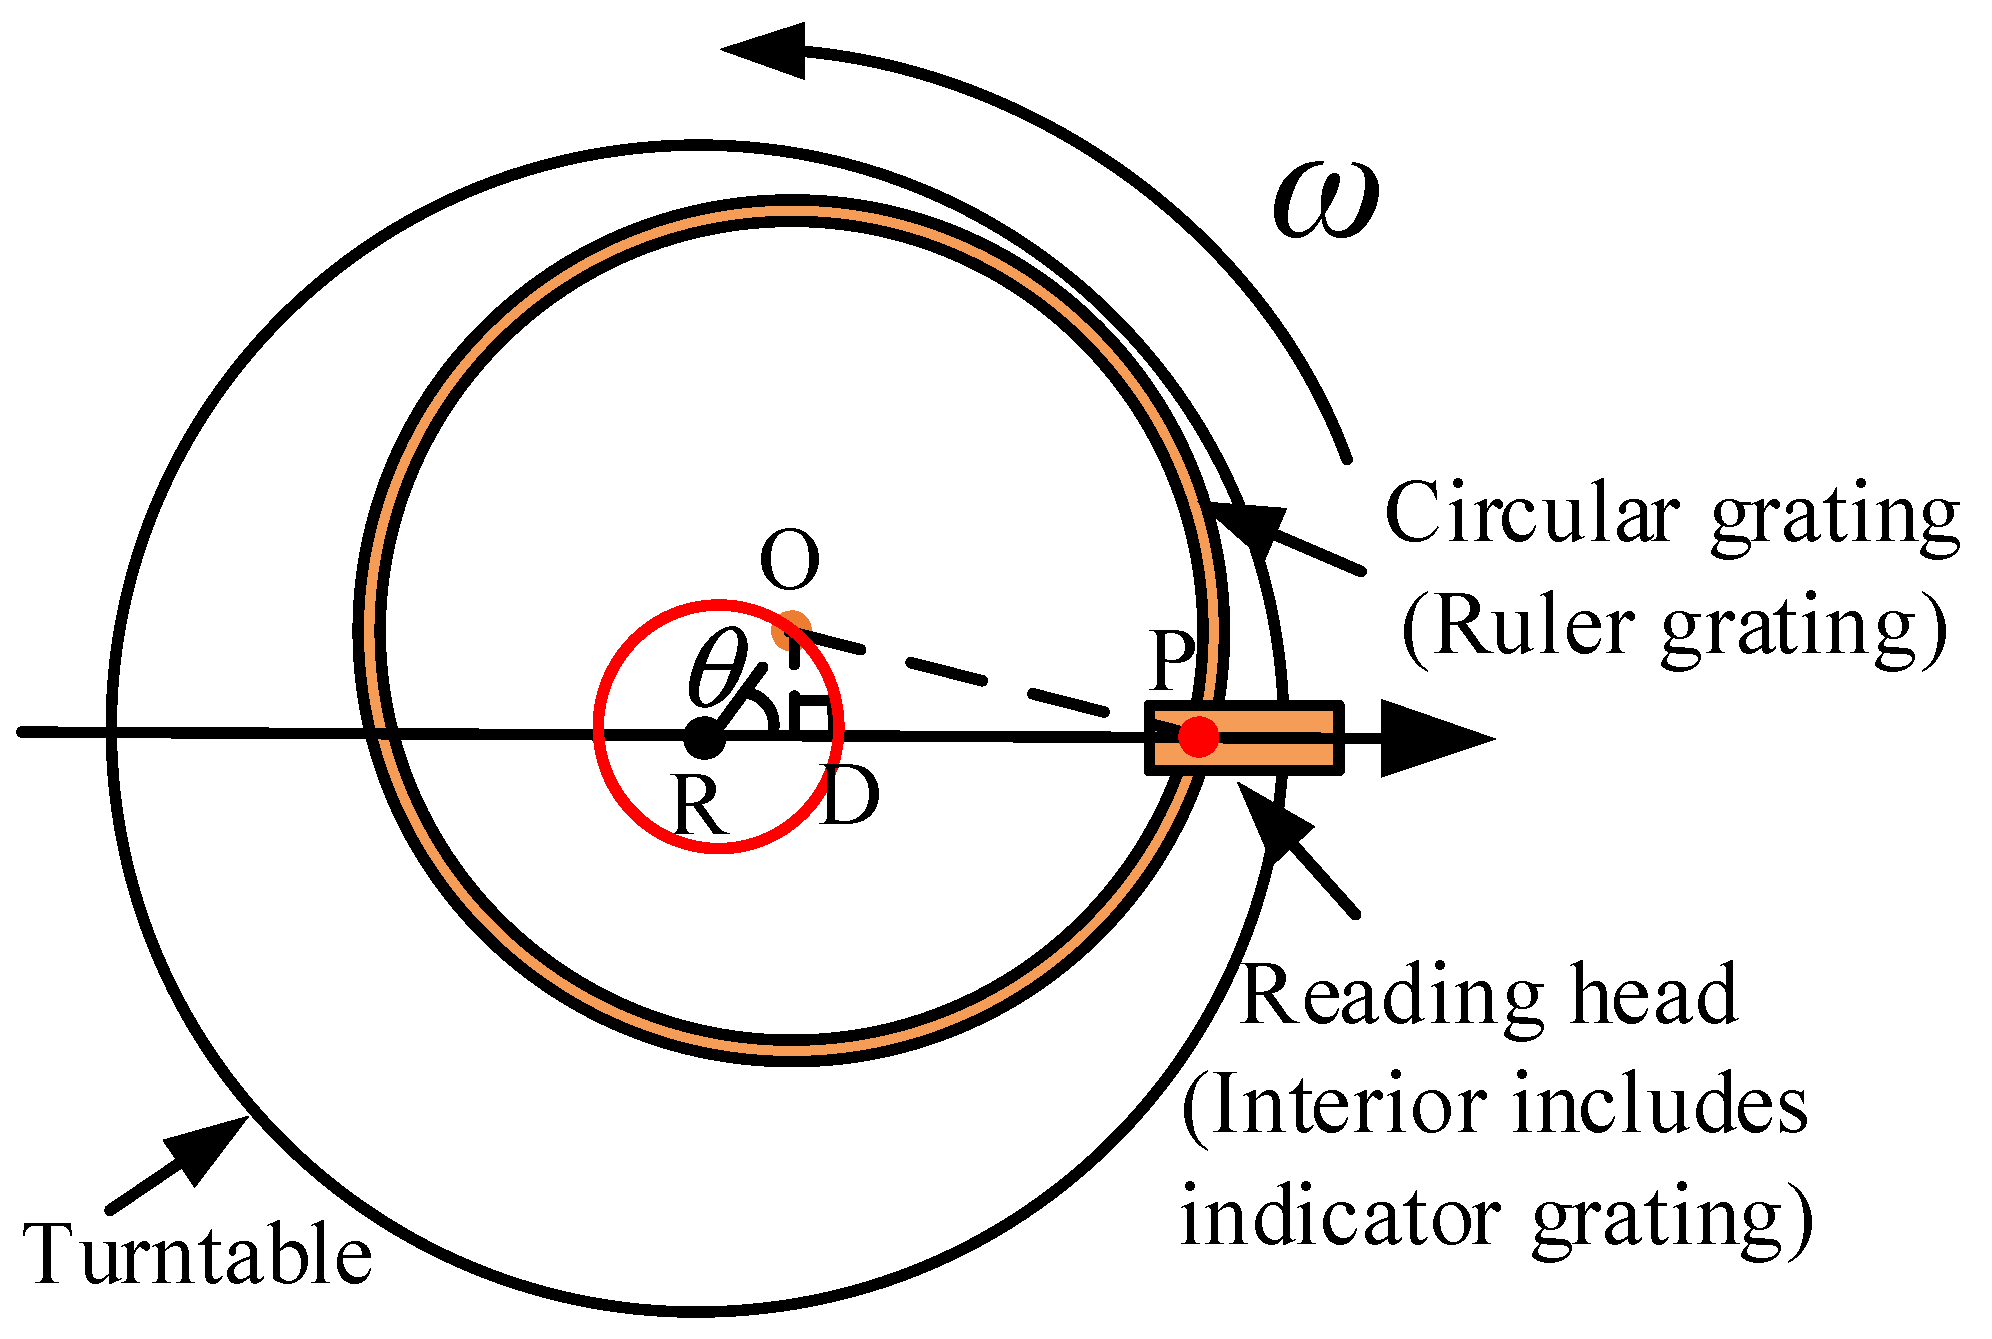
The schematic diagram of the displacement error of the rotary table affected by the eccentricity error is shown in Figure 6.
As shown in Figure 6, when the rotary table rotates at the speed of ω, due to the eccentricity error, defined as e, the grating rotation center, R, and the geometric center, O, do not coincide. A displacement error, defined as Le(θ), will be generated during the rotation of the grating with the rotary table.
Establish the x-axis from the grating rotation center, R, to the reading head as the positive direction. The intersection point between the outer side of marking line of the circular grating and the positive semi-axis of the x-axis is defined as P. Subsequently, OP is the radius of the grating, and the variation of RP with the angular position of the rotary table , θ, is defined as Le(θ), namely the displacement error of rotary table.
Since ODRP as well as RO and RD are in micron level in actual working conditions, it is thus clear that
cos O P D = D P O P 1
The Le(θ) can be described as
L e θ = R P O P R D = R O cos θ = e cos θ
Le(θ), which is introduced by eccentricity error of rotary table, will affects the transmission function of the grating pair of the rotary table. The transmission function of the scale grating affected by the eccentricity error, defined as L2’(x-x’(θ), y), can be expressed as
L 2 ( x x ( θ ) , y ) = m = B m exp i 2 π m v 2 ( x x ( θ ) ) cos γ + y sin γ
Where x’(θ) is the relative displacement of the two gratings, which is changing with θ, caused by the attitude error of the rotary table. At this time, the transmission function of the moiré fringe composed of the scale grating and the indicative grating, M(x,y), can be described as
M ( x , y ) = L 1 ( x ) L 2 ( x x ( θ ) , y ) = n = A n exp ( i 2 π n v 1 x ) m = B m exp i 2 π m v 2 ( x x ( θ ) ) cos γ + y sin γ
The moiré fringe consist of contents produced by the beat phenomenon between two gratings. The content of the largest spatial period in the light intensity distribution constitutes the fundamental wave of the moiré fringe, and the general expression of the largest period moiré fringe produced by the beat phenomenon is obtained by taking m= -n in equation (9).
V x = n v 1 n v 2 cos γ V y = n v 2 sin γ
In (10), Vx and Vy are the components of the spatial frequency of the light intensity function in the x-axis and y-axis directions respectively and both of them are constants. Defined the intensity of the parallel light emitted from the reading head as Ir, the outgoing light intensity generated by the light passing through the indicative grating and scale grating , defined as Ic(x-x’(θ), y), can be expressed as
I c x x ( θ ) , y m = n = I r M ( x , , y ) = I r β 1 β 2 + 2 I r n = 1 A n B n cos 2 π x V x + y V y + v 2 x ( θ ) cos γ
When the photoelectric conversion rate of the photoelectric receiver is k and the rotational speed of the rotary table is ω, the output moiré signal by the rotary table, u’(t), can be expressed as
u ( t ) = I c x x ( ω t ) , y m = n k = k I r β 1 β 2 + 2 k I r n = 1 A n B n cos 2 π x V x + y V y + v 2 x ( ω t ) cos γ
From (12), it can be seen that the rotary table is affected by the eccentricity error during the rotation process, and the introduced phase feature of moiré signal, φme(t), can be expressed as
ϕ m e ( t ) = 2 π v 2 e cos ( ω t ) cos γ
When the grating pitch is 20μm, the spatial frequency v2 of the scale grating in the rotary table is 1/20μm. In the actual working condition, the angle of γ between the indicative grating and the scale grating in the rotary table is insignificant, and the cosγ in (13) is approximately equal to one, so (13) can be simplified as
ϕ m e ( t ) = 2 π v 2 e cos ( ω t )
Since φme(t) is the first-order component of φm(t) in the frequency domain and the corresponding frequency-domain amplitude is A(1), according to (14), the relationship between the first-order amplitude, A(1), and the eccentricity error, e, is as follows
A ( 1 ) = ( ϕ m e ( t ) ) max = 2 π v 2 e
The expression of the eccentricity error of the rotary table is
e = A ( 1 ) 2 π v 2
Since v2 is the spatial frequency of the scale grating, which is a constant in a fixed rotary table, it can be seen that the eccentricity error of the rotary table is directly proportional to the first-order component of φm(t) in the frequency domain.
3. Results and Discussion

3.1. Verification of moiré Signal Data Acquisition

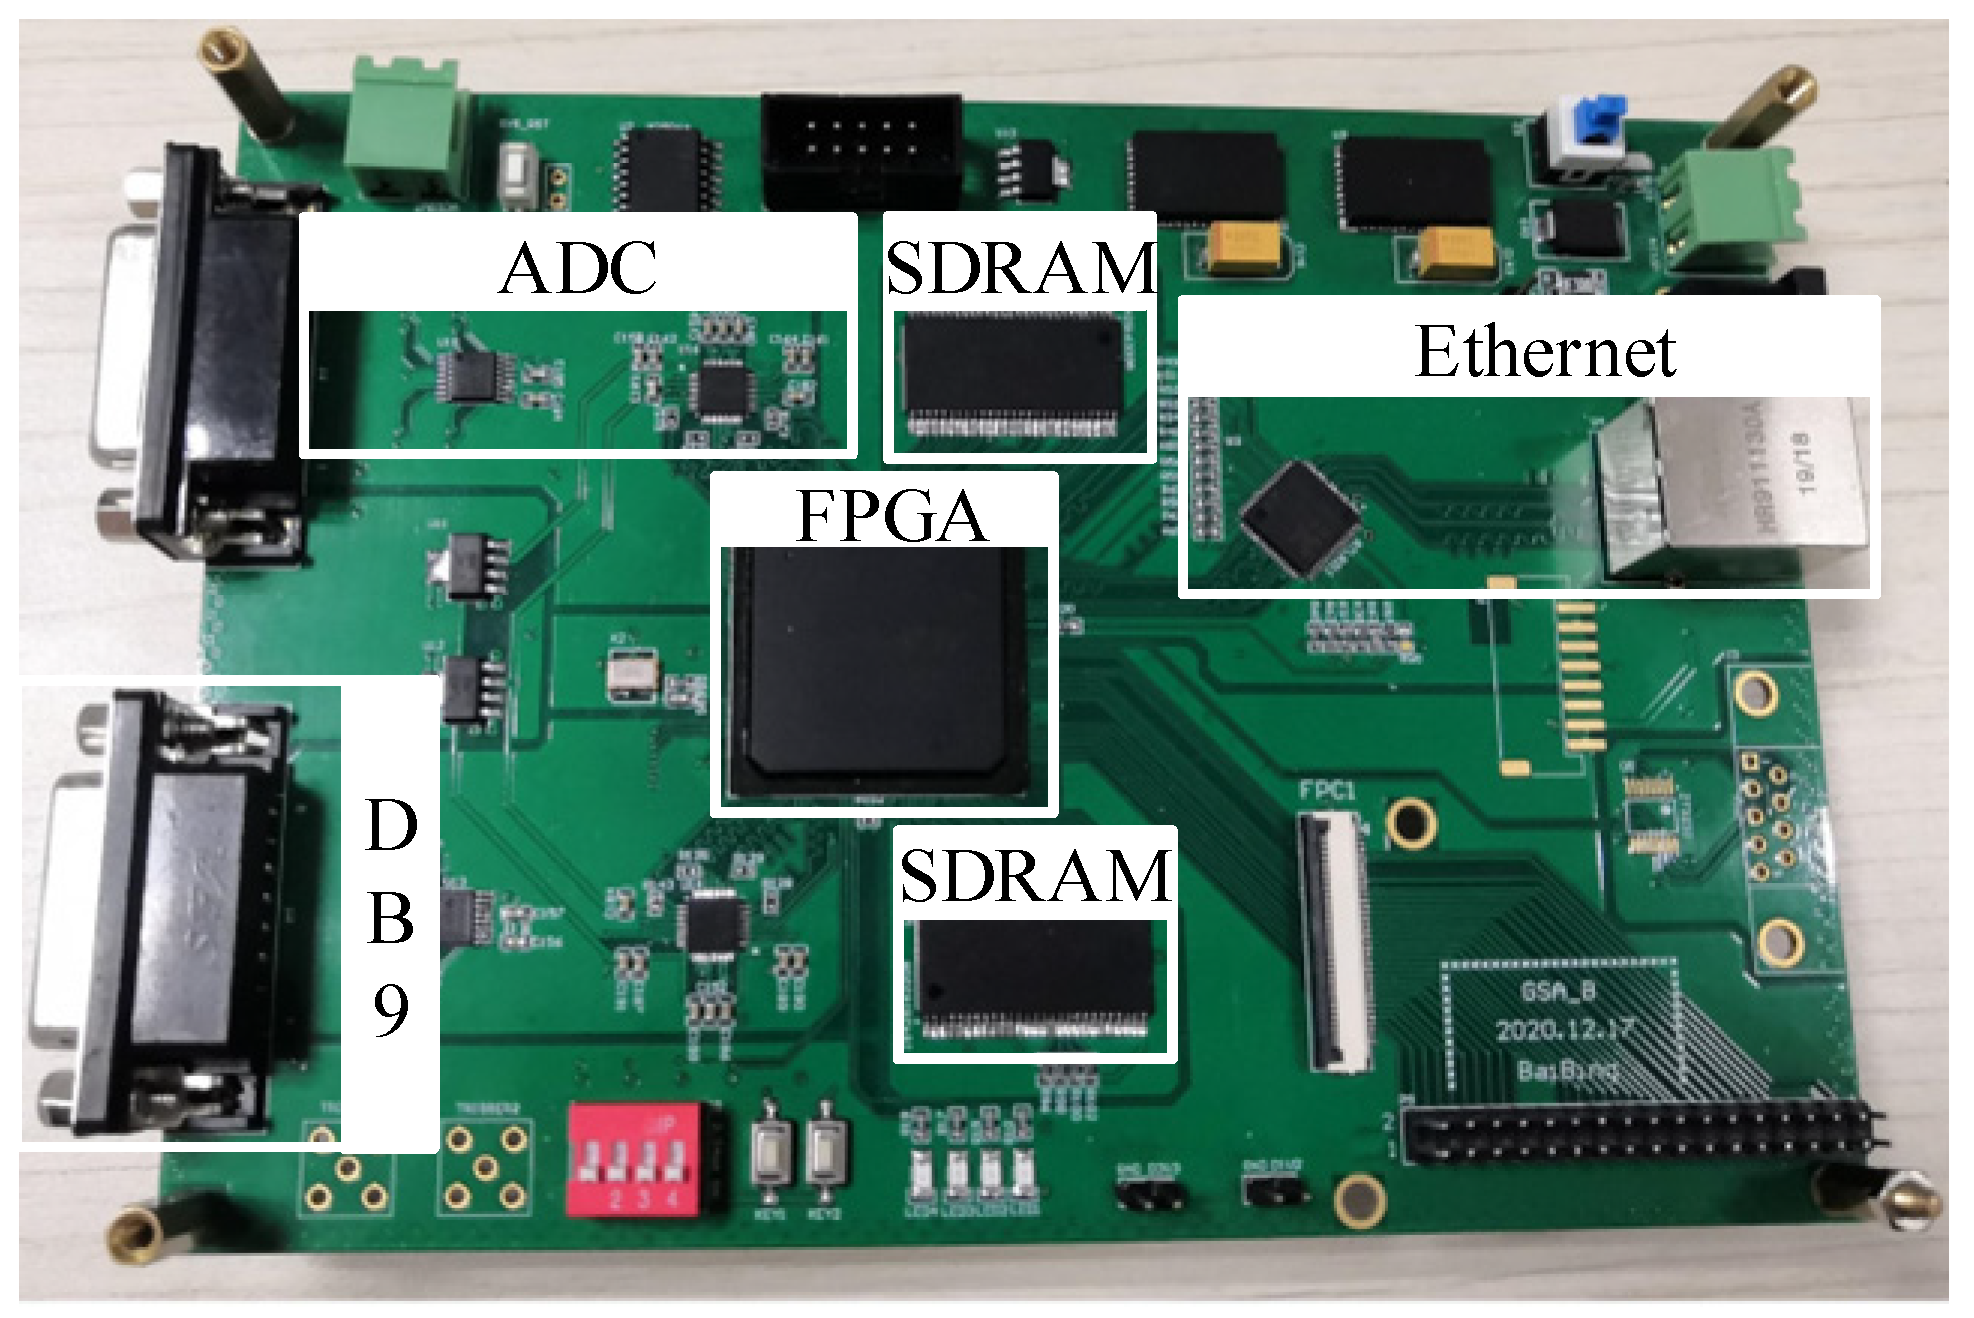
Since the separation method of eccentricity error is based on the moiré signal of the rotary table, the quality of the moiré signal collected by the hardware circuit is crucial to the separation result of eccentricity error. In this paper, the acquisition of full-circle moiré signal of the rotary table is realized by using a laboratory-made circuit board with FPGA named as GSA_B, which is shown in Figure 7.
As shown in Figure 7, GSA_B uses FPGA as the main chip, and the analog signal output by the reading head of the rotary table is connected through the DB9 interface, and is converted into digital data through high-speed ADC, then enters the FPGA to process. The data storage module realizes the data exchange between FPGA and SDRAM, and the processed full-circle moiré signal is transmitted to upper machine for analysis by Ethernet.
Verify the effectiveness and correctness of the acquisition of moiré signals with GSA_B. Collect the moiré signal of a single reading head of the rotary table in the rotation course of entire circumference. FFT analysis is performed on the collected moiré signal and the hardware acquisition function is verified by checking whether the main frequency of the signal matches the rotational speed of the rotary table.
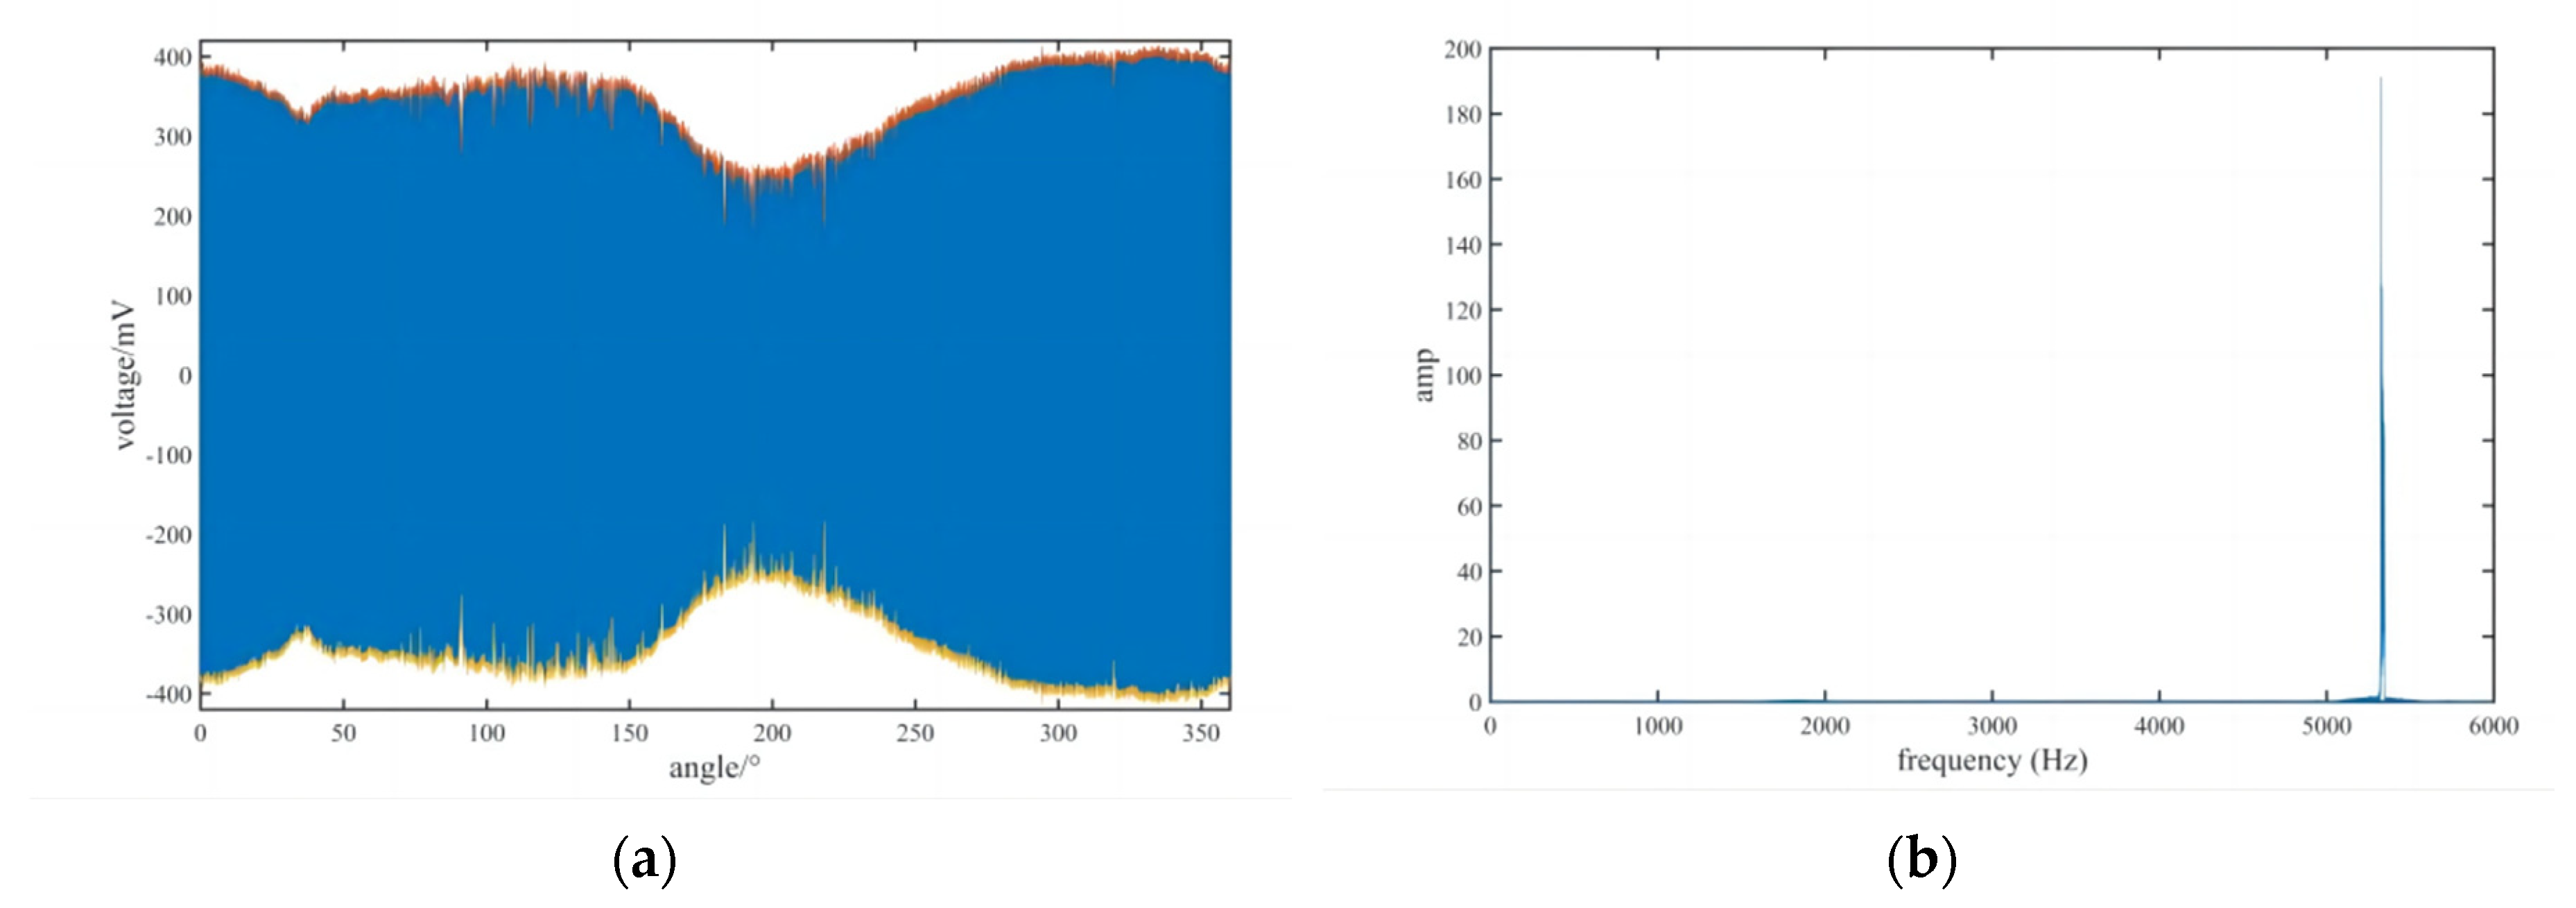
When the rotation rate of the rotary table is set to 120°/s, the time domain diagram and frequency domain diagram of the full-circle moiré signal are shown in Figure 8.
The collected discrete moiré signal of full-circle of single reading head by GSA_B, defined as u(θ). The displayed waveform in Figure 8(a) has removed the DC amount of the moiré signal and added the data envelopment analysis. It can be seen from that during the full circle rotation of the rotary table, the upper and lower envelopes of the moiré signal are smooth, and there is no loss or jump. Affected by various errors during the rotation of the rotary table, the moiré signal envelope presents fluctuations. The signal amplitude and phase of u(θ) in each cycle change, which proves the existence of the feature of moiré signal of the rotary table.
After FFT transformation, the schematic of frequency domain of the collected moiré signal is shown in Figure 8(b). The relationship between the moiré signal frequency, f, and the rotary table speed, ω, can be expressed as
f = 1 360 K ω = ω K 360
Where K is the number of circumferential lines on the grating disk and K=16384 in this experiment.
Substituting the set speed ω=120°/s of the rotary table into the (17), the reference frequency can be obtained as 5461Hz. It can be seen in Figure 8(b) that the main frequency of the full-circle moiré signal collected is around 5325Hz. The relative error with the reference value is about 2.5%. Since the rotary table cannot guarantee a completely uniform speed during the entire circle rotation process, it can be considered that the collected data are basically consistent with the set speed.

3.2. Validation of the effect of eccentricity error separation

In order to verify the feasibility and effectiveness of the separation method proposed in this paper for the eccentricity error, experiments with the proposed method and the traditional method using calibration devices were carried out on the same rotary table respectively, and the experimental results were compared.

3.2.1. Experiment of separation method with calibrated instrument

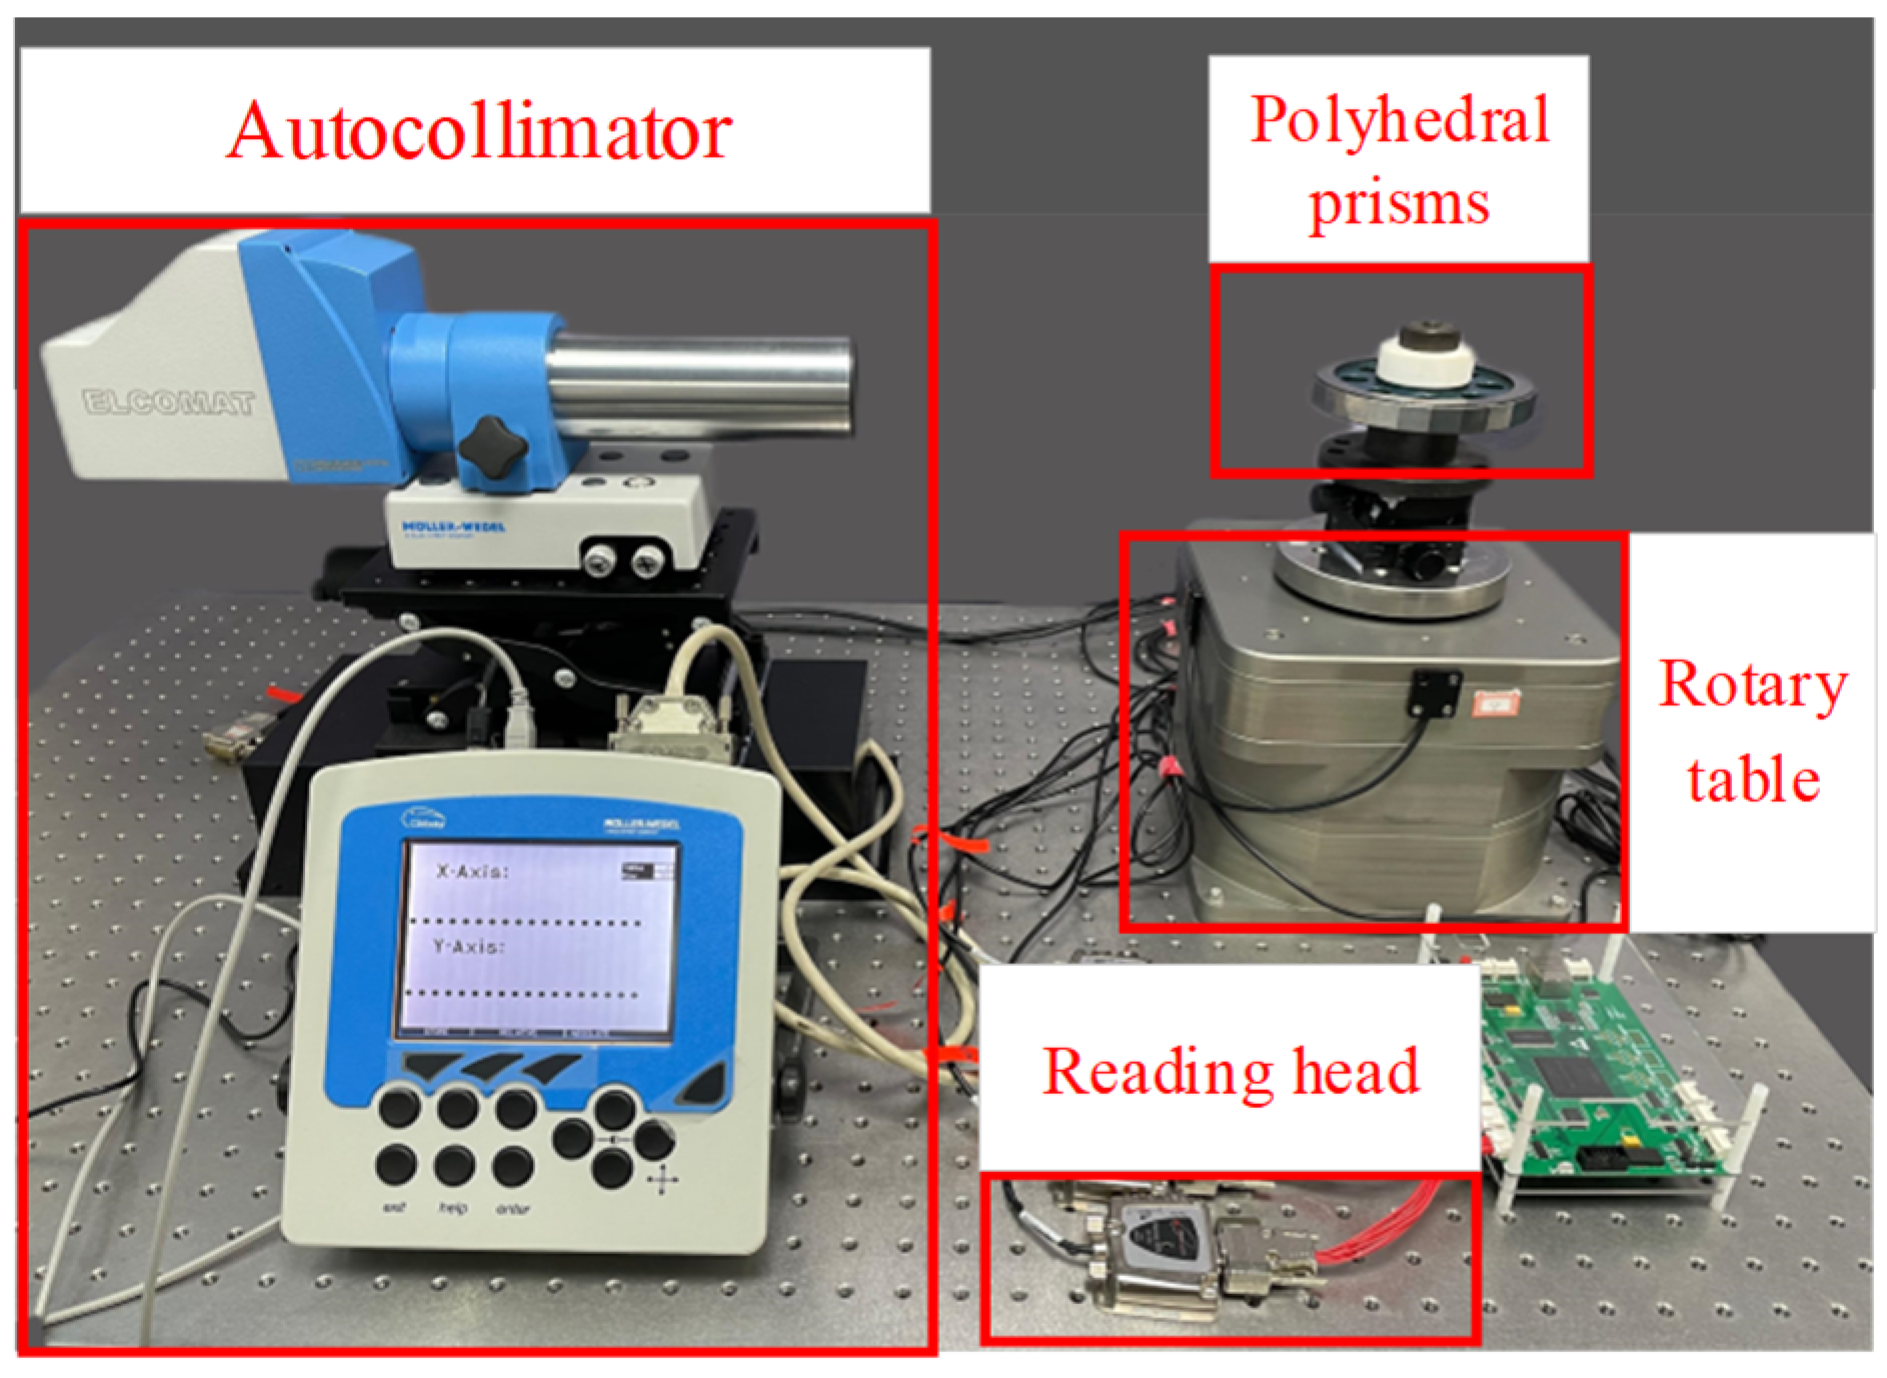
The traditional method of separating the eccentricity error of the rotary table by calibration devices is realized by using the autocollimator combined with the polyhedral prism to obtain the discrete numerical sequence of the positioning error of the rotary table at equal intervals. The eccentricity error of the rotary table is obtained by fitting the positioning error points. The main devices and their parameters used in the experiment are shown in Table 1.
The experimental setup for calibration using a polyhedral prism and an autocollimator is shown in Figure 9.
The entire circumference discrete positioning error array, P, obtained by the calibration setup is shown in Table 2.
As shown in the Table 2, within the entire circumference of the rotary table rotation, the positioning error of the rotary table, P, is unimodal.The maximum of positioning error, Pmax, and the minimum of positioning error, Pmin, only appear once. The equation for calculating the eccentricity error of the rotary table according to the peak value of P is
e = r sin P max sin θ 1 + r sin P min sin θ 2 / 2
Where θ1 is the corresponding rotary table rotation angle when the positioning error is Pmax while θ2 is the rotation angle corresponding to Pmin. r is the radius of the grating disk inside the rotary table and r=53.98mm in this experiment.
According to Table 2, Pmax=343.87″ while θ1=90° and Pmin= -415.50″ while θ2=270°. According to (18), the value of eccentricity error of the rotary table is 99.36 μm.

3.2.2. Experiment of the eccentricity error separation with proposed method

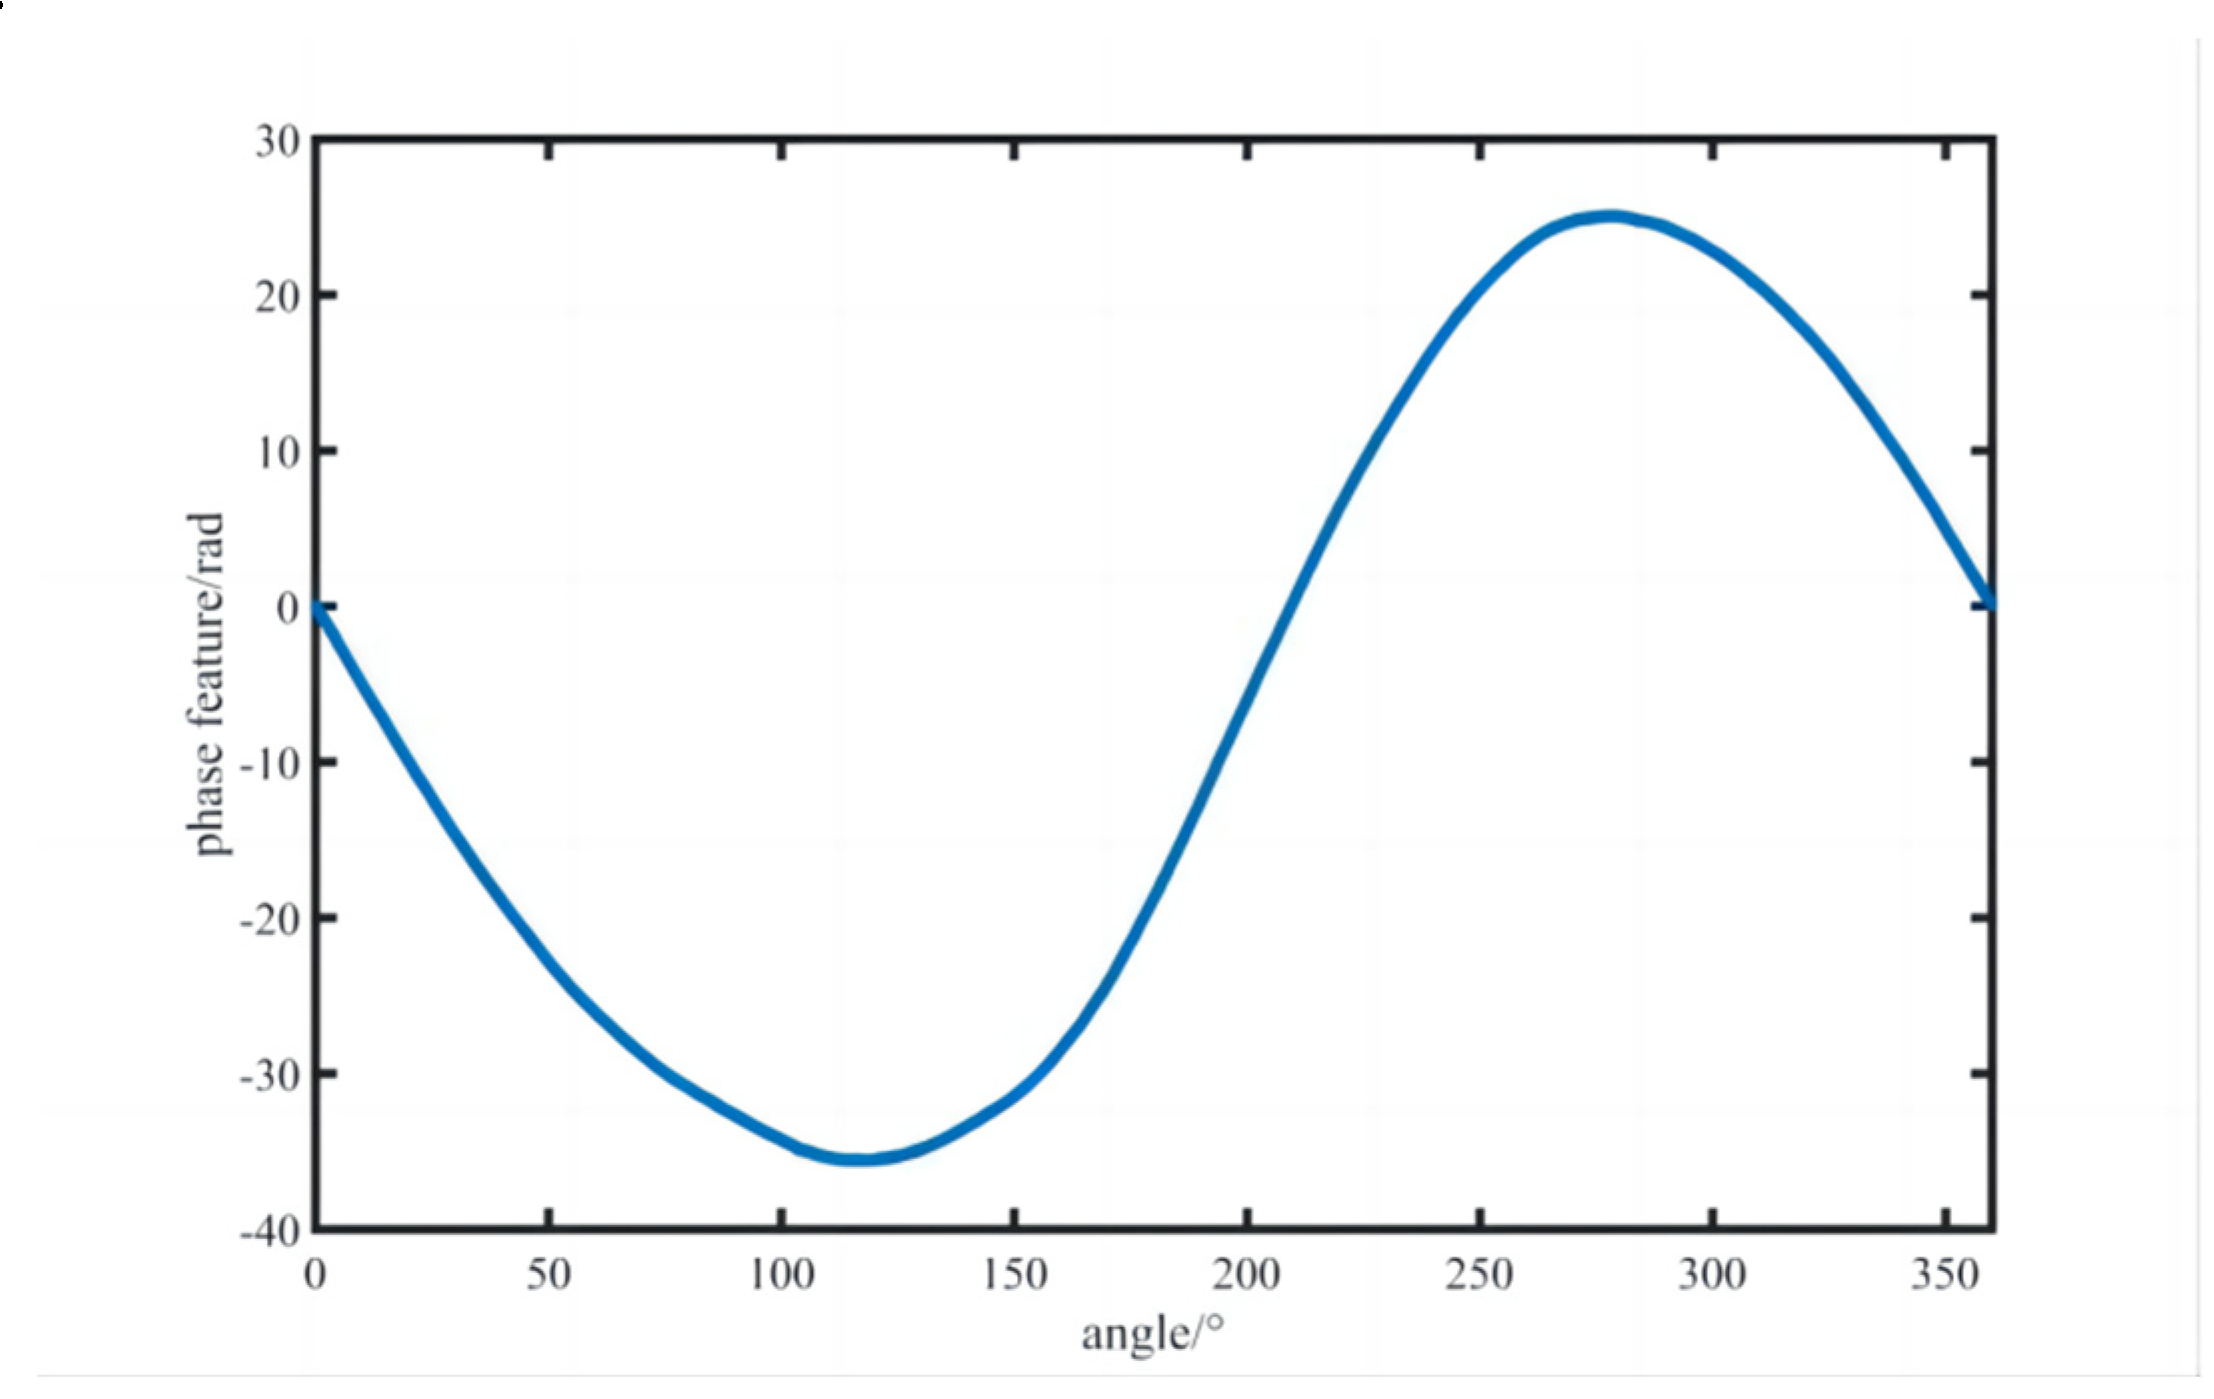
Experiment is performed using the same setup shown as Figure 9. The discrete full-circle moiré signal, u(θ), is collected. The phase of the ideal moiré signal is used as a reference to obtain the phase feature of u(θ), defined as φ(θ), through the phase difference processing of each sampling point, as shown in Figure 10.
It can be seen from Figure 10 that the phase error of the rotary table within the entire circumference is also unimodal. The phase difference fluctuates in the range of [-35.62rad, 25.12rad], which proves that the phase feature of the moiré signal is affected by the eccentricity error.
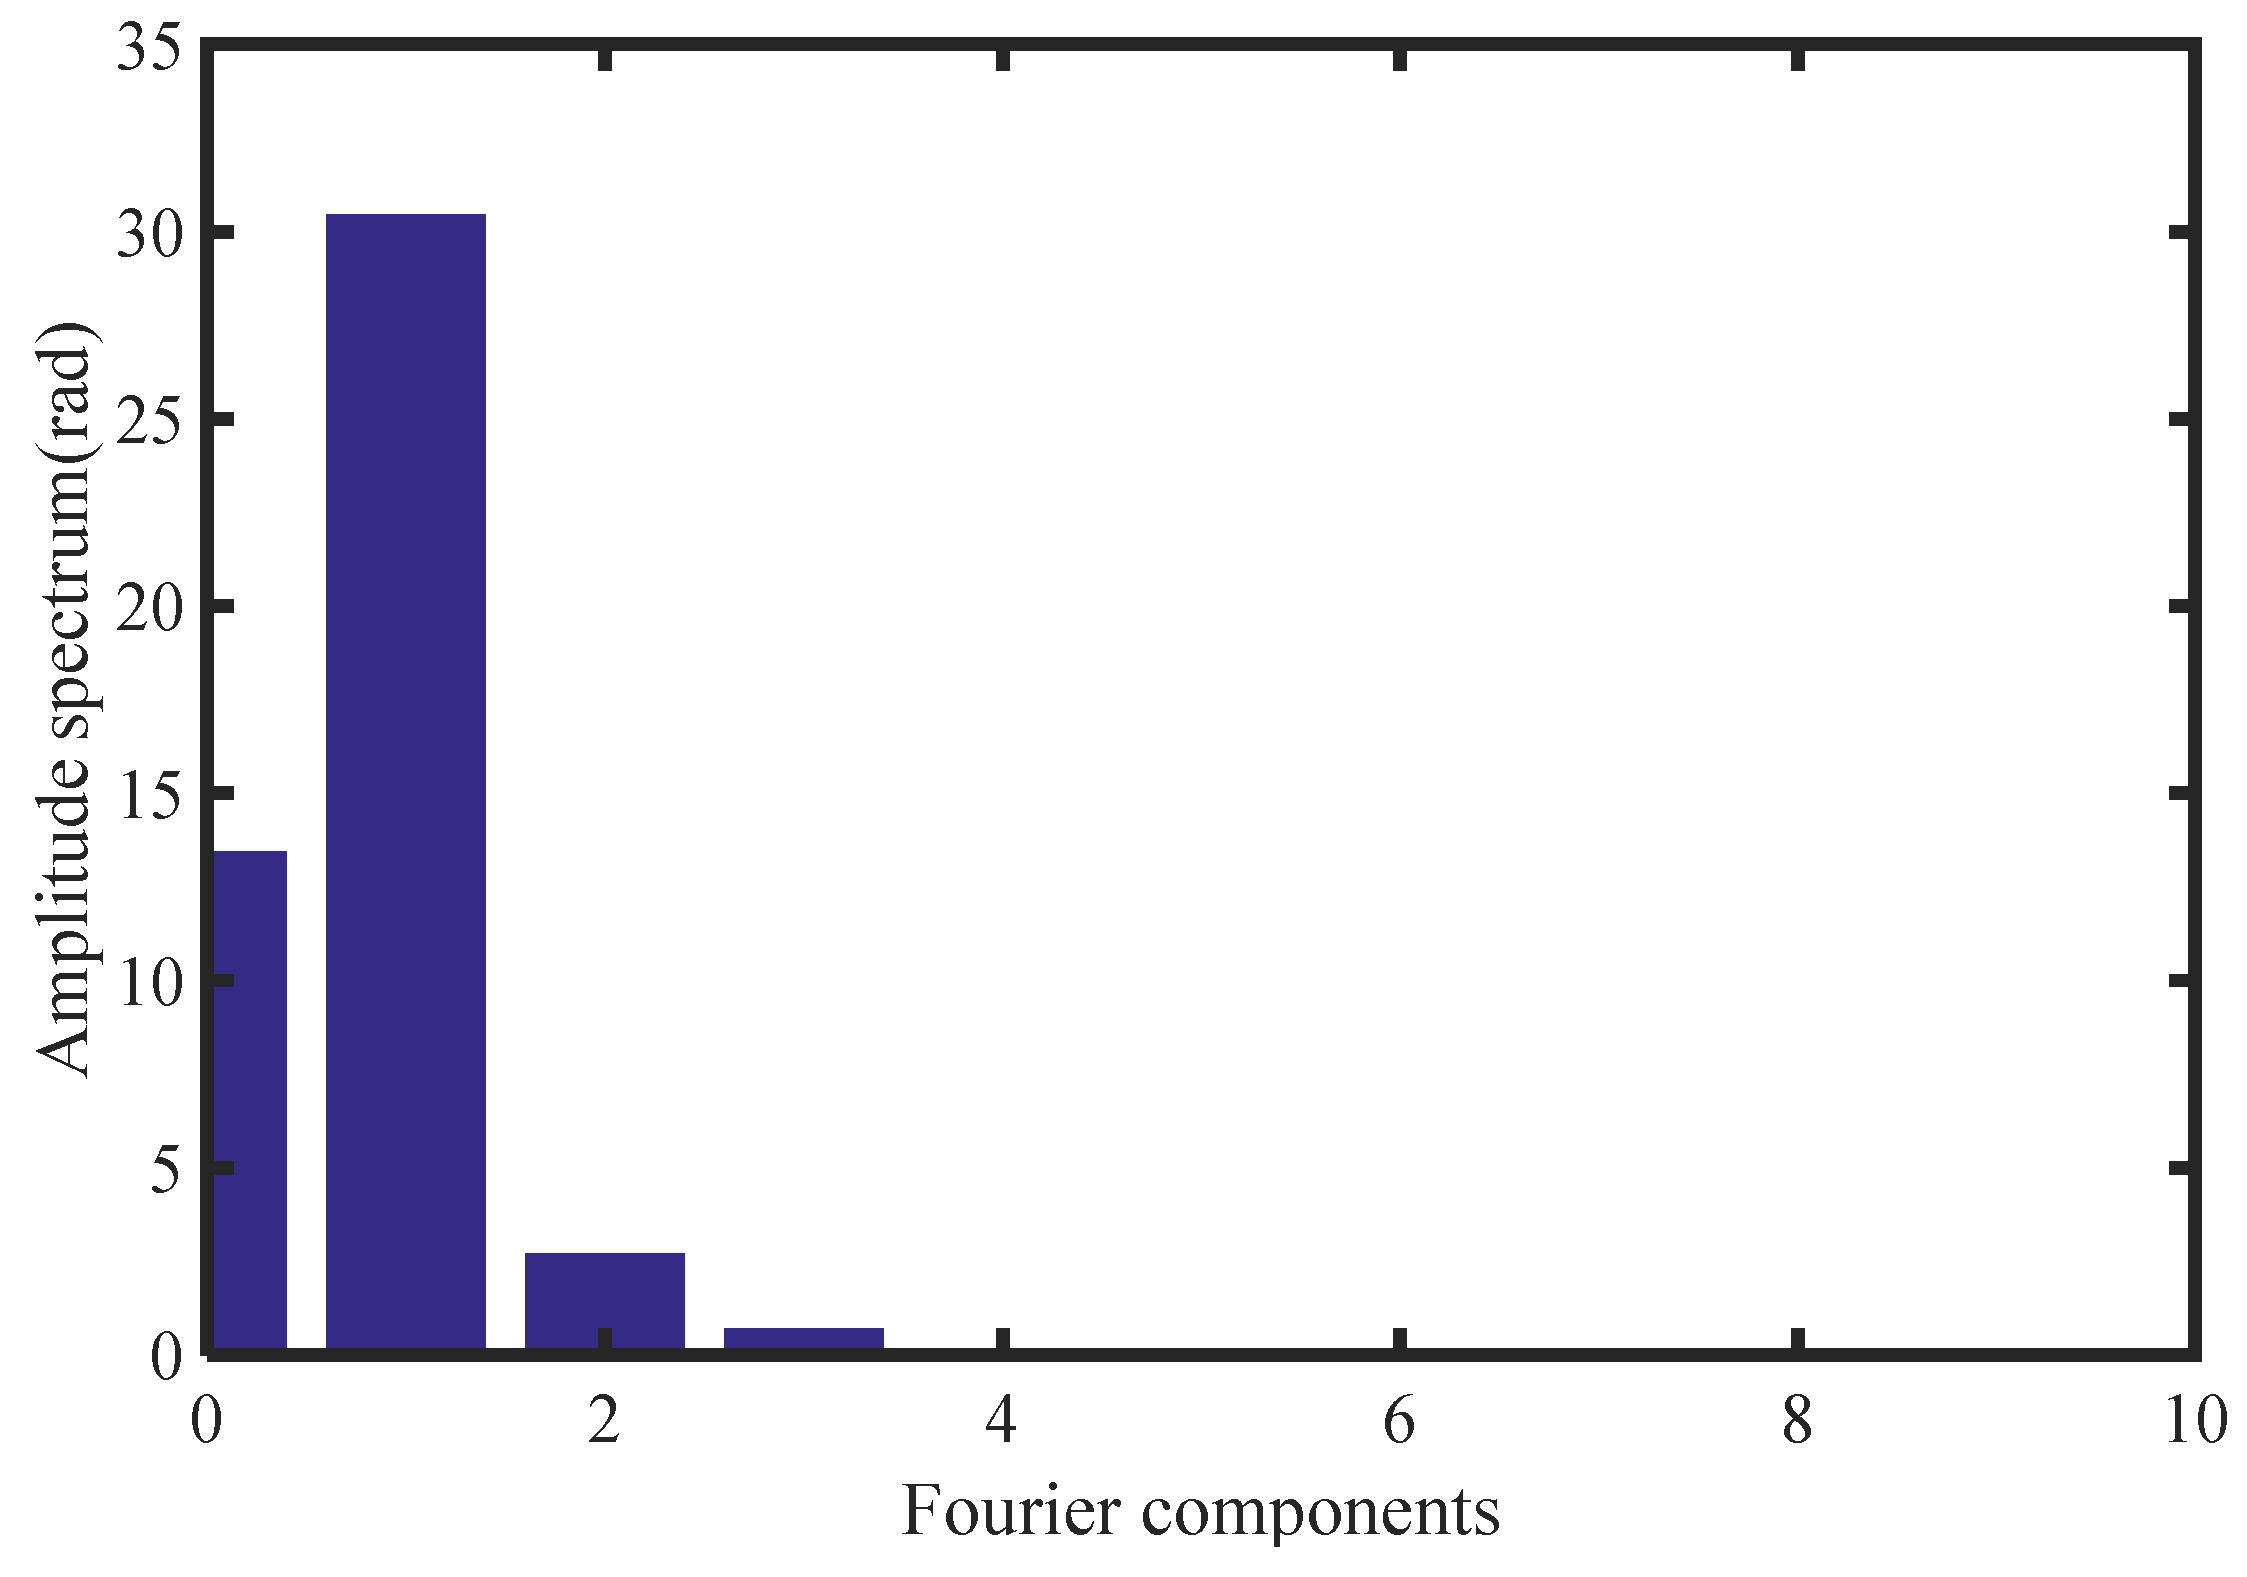
The FFT analysis is performed on φ(θ) and the transformation results in frequency domain is shown in Figure 11.
It can be seen that the A(1) of the rotary table affected by the eccentricity error is 30.48rad. Based on (16), the eccentricity error is 97.02μm.
It can be seen that the eccentricity error value separated with proposed method in this paper is consistent with that of traditional method using calibration devices. The values of eccentricity error separated by the two methods are 99.36μm and 97.02μm respectively. The difference of the two algorithms is 2.34μm and the relative error is 2.3%. So, this proposed method has the feasibility and data accuracy in the actual rotary table application.

4. Conclusions

A new method for separating the eccentricity error of rotary table based on the moiré signal of single reading head is proposed in this paper. By establishing a grating pair transmission model, the effect of the eccentricity error on the phase feature of moiré signal is clarified, and then an eccentricity error separation model based on the phase spectrum components is established. The validity and accuracy of the proposed method are demonstrated through the verification and comparison experiments. The results show that the proposed method can be used for eccentricity error separation without the use of external sensors and calibration devices, which provides a new method and new ideas for the detection of the working condition of the rotary table.

Author Contributions

Conceptualization, Y.H.; methodology, S.C.; software,C.M. and Y.Z.; validation, W.Z. and C.M.; formal analysis,Y.H., S.C. and W.Z.; investigation,Y.Z. and W.Z.; resources, Y.H. and W.Z; data curation, S.C.; writing-original draft preparation, Y.H.; writing-review and editing, W.Z.; visualization, Y.Z. and W.Z.; supervision, Z.X.; project administration, W.Z.; funding acquisition, Y.H. and W.Z.. All authors have read and agreed to the published version of the manuscript.

Funding

This research was funded by the National Natural Science Foundation of China(grant number 52175526), the research project of General Administration of Quality Supervision, Inspection and Quarantine of PRC (2016QK189).

Institutional Review Board Statement

Not applicable.

Informed Consent Statement

Not applicable.

Data Availability Statement

The data underlying the results presented in this study are not currently publicly available but may be obtained from the authors upon request.

Conflicts of Interest

The authors declare no conflict of interest.

References

  1. Tameh, TA.; Sawan, M.; Kashyap, R. Novel analog ratio-metric optical rotary encoder for avionic applications. IEEE Sens. J. 2016, 17, 6586-95. [CrossRef]
  2. Gao, X.; Li, Shu.; Ma, Q. Subdivided error correction method for photoelectric axis angular displacement encoder based on particle swarm optimization. IEEE Transactions on Instrumentation and Measurement. 2020, pp. 99. [CrossRef]
  3. Huang, Y.; Xue, Z.; Lin, H.; Wang, Y. Development of portable and real-time self-calibration angle encoder. Seventh International Symposium on Precision Mechanical Measurements. 99030F, Xia'men, China, 2016. [CrossRef]
  4. Gao, W.; Kim, S.W.; Bosse, H.; Haitjema, H.; Chen, Y.; Lu, X. Measurement technologies for precision positioning. CIRP Ann-Manuf. Technol. 2015, 64, 773-96. [CrossRef]
  5. Ellin, A.; Dolsak, G. The design and application of rotary encoders. Sens. Rev. 2008, 28, 150-158. [CrossRef]
  6. Hatiris, E.; Orton, PA.; Poliakoff, JF. Eccentricity error compensation models for an incremental motion encoder (IME). Proceedings of the 16th European Simulation Multiconference on Modelling and Simulation 2002, 2002, Thomas PD, Ed., pp. 328-331.
  7. Watanabe, T.; Fujimoto,H,; Nakayama, K.; Masuda, T. Automatic high-precision calibration system for angle encoder (II). SPIE’s 48th Annual Meeting. 2003. Kajitani M, Ed., pp. 400–409. [CrossRef]
  8. Li, X.; Ye, G.; Liu, H.; Ban, Y.; Shi, Y.; Yin, L. A novel optical rotary encoder with eccentricity self-detection ability. Rev. Sci. Instrum. 2007, 88, 115005. [CrossRef]
  9. Jia, H.; Yu, L.; Zhao, H.; Jiang, Yi. A New Method of Angle Measurement Error Analysis of Rotary Encoders. Applied Sciences. 2019, 9. [CrossRef]
  10. Li, Y.; Fan, K.; A novel method of angular positioning error analysis of rotary stages based on the Abbe principle. Proceedings of the Institution of Mechanical Engineers. 2018, 232. [CrossRef]
  11. Hu, Y.; Zhan, Y.; Han, L.; Hu, P.; Ye, B.; Yu, Y. An Angle Error Compensation Method Based on Harmonic Analysis for Integrated Joint Modules. Sensors. 2020, 20. [CrossRef]
  12. Chen, X.; Zeng, Q. Angle measurement error and compensation for decentration rotation of circular gratings. Journal of Harbin Institute of Technology. 2010, 17, 536-539.
  13. Mi, X.; Gao, S. Effect of eccentric of circular gratings on angular position accuracy of simulator. Changchun Univ. Sci. Technol. 2014, 37, 9-12.
  14. Zheng, D.; Yin, S.; Luo, Z.; Zhang, J.; Zhou, T. Measurement accuracy of articulated arm CMMs with circular grating eccentricity error. Meas. Sci. Technol. 2016, 27, 115011. [CrossRef]
  15. Ralf, D.; Alfred, L.; Michael, K.; Clemens, Elster. Capabilities and limitations of the self-calibration of angle encoders. Meas. Sci. Technol. 2014, 25, 055003. [CrossRef]
  16. Zhao, X.; Feng, R.; Wu, Y.; Yu, N.; Meng, X. A complementary filter-based all-parameters estimation for triaxis gyroscopes and optical angular encoders with intrinsic eccentricity. IEEE Sens. J. 2020, 21, 5060-5069. [CrossRef]
  17. Behrani, G.; Mony, A.; Sharma, NG. Modeling and validation of eccentricity effects in fine angle signals of high precision angular sensors. Sens. Actuator A-Phys. 2022, 345, 113774. [CrossRef]
  18. Ai, C.; Chu, M.; Sun, H.; Zhang, Y.; Ye, P. Eccentric testing of benchmark circular grating and compensation of angular error. Optics and Precision Engineering. 2012, 20, 2479-2484. [CrossRef]
  19. Feng, C.; Zhu, L.; Pan, Z. New self calibration method of circular grating eccentric parameters. Chin J. Sci. Instrum. 2016, 37, 2459-2464.
  20. Zhu, S.; Liu, Q.; Sun, P.; Wang, J. A Fast Calculation Method of Eccentricity of Rotary Parts Based on Least Squares. in 2019 IEEE International Conference on Mechatronics and Automation (ICMA). Tianjin, China, 2019. [CrossRef]
  21. Wang, Y.Z. et al., Grating eccentricity monitoring system for imagie-based angular displacement measurement. Optics and Precision Engineering.2020, 28, 1038-1045. [CrossRef]
Figure 1. Schematic of structure of the rotary table.
Preprints 87990 g001
Figure 2. Schematic of a single rectangular grating.
Preprints 87990 g002
Figure 3. Schematic of relative position of indicative grating and scale grating.
Preprints 87990 g003
Figure 4. Schematic of the rotary table in actual working condition.
Preprints 87990 g004
Figure 5. Schematic of φm(t).
Preprints 87990 g005
Figure 6. Schematic of the displacement error caused by the eccentricity error of the rotary table.
Preprints 87990 g006
Figure 7. Laboratory-made circuit board named as GSA_B.
Preprints 87990 g007
Figure 8. Schematic of moiré signal waveform of the whole circle.
Preprints 87990 g008
Figure 9. Photograph of experimental setup for calibration.
Preprints 87990 g009
Figure 10. Schematic of the phase feature of u(θ).
Preprints 87990 g010
Figure 11. Results of spectrum analysis of φ(θ).
Preprints 87990 g011
Table 1. Specifications of main instruments.
Instrument Model (manufacturer) Specification
Autocollimator ELCOMAT-3000
(MOLLER-WEDEL OPTICAL)
From -1000" to +1000",
Ui=0.25’’
Polyhedral prism 24-sided secondary polyhedral prism ±1"
rotary table Air-bearing rotary table Repeatability:0.3";
Accuracy±0.5"
Reading head Mercury’s sensor (MicroE system) Rotary: up to ± 2.1"
Table 2. Discrete positioning error on the entire circumference.
angle value/° angle measuring error /" angle value/° angle measuring error/"
15 93.81 195 -149.17
30 181.17 210 -245.19
45 251.37 225 -322.77
60 302.98 240 -379.90
75 332.05 255 -409.91
90 343.87 270 -415.50
105 335.13 285 -394.78
120 307.11 300 -347.20
135 264.42 315 -279.68
150 189.95 330 -193.81
165 84.61 345 -99.33
180 -35.76 360 -0.05
Disclaimer/Publisher’s Note: The statements, opinions and data contained in all publications are solely those of the individual author(s) and contributor(s) and not of MDPI and/or the editor(s). MDPI and/or the editor(s) disclaim responsibility for any injury to people or property resulting from any ideas, methods, instructions or products referred to in the content.
Copyright: This open access article is published under a Creative Commons CC BY 4.0 license, which permit the free download, distribution, and reuse, provided that the author and preprint are cited in any reuse.
Prerpints.org logo

Preprints.org is a free preprint server supported by MDPI in Basel, Switzerland.

Subscribe

© 2024 MDPI (Basel, Switzerland) unless otherwise stated