1. Introduction
In the event of a hypothetical accident in a pressurized water reactor (PWR), there is the potential for a substantial release of hydrogen gas. This hydrogen can result from the oxidation of metals, either present in the reactor containment's basement during the phase of molten corium interacting with concrete or within the corium recovery pool. The H
2-air mixture can create a flammable mixture, leading to an explosion hazard. Local ignition of this flammable mixture can give rise to slowly propagating flames. The occurrence of the acceleration of a subsonic flame or deflagration transitioning to detonation depends on the turbulence level, mixture composition, and geometry. Hydrogen combustion, including detonation, could pose a significant threat to the reactor building and the integrity of the containment vessel in the event of an accident at a nuclear power station. Detonation events generate temperature peaks, shock waves, large pressure gradients, and high-pressure pulses, all of which have the potential to cause severe damage to specific equipment, internal walls, and containment components [
1].
Some research in the field of detonation is focused on the fundamental problem of the deflagration-to-detonation transition (DDT) [
2,
3]. Nguyen et al. [
4] conducted a numerical examination of the impacts of the equivalence ratio of ethylene fuel-air on the onset of detonation. They proposed a relationship between the equivalence ratio and the flame speed as a function of mixture fraction, pressure, and temperature.
In recent years, numerous researchers have conducted studies focused on detonation, with hydrogen serving as a fuel source [
5,
6,
7,
8]. Dorofeev et al. [
9] analyzed the data from FA experiments in-depth. The data cover a wide range of tube scales and obstacle configurations, as well as mixture compositions. Temperatures and pressures were at normal and elevated levels. The suggested critical conditions for effective FA were presented in the form of correlations between the critical expansion ratio (
) and the dimensionless effective activation energy.
Considerable research effort has been dedicated to expediting the DDT process [
10,
11]. The placement of solid obstacles in the channel is a recognized method for reducing both the DDT distance and time. This is achieved by enhancing turbulence within the flow and increasing the interaction between the shock wave and the flame. Consequently, this approach enlarges the flame area and accelerates the release of the reaction heat rate. Ogawa et al. [
12] conducted a comprehensive study on FA and DDT within a stoichiometric H
2-air mixture using a two-dimensional array of obstacles and a flame is ignited at the center of the obstacle array and propagates outward in all directions. Notably, their research highlighted the significant influence of flame propagation direction on both FA rate and DDT run-up distance. Breitung et al. [
13] investigated the behavior of turbulent flames in H
2-air mixtures through a series of experimental studies. It was observed that within tubes featuring various obstacle arrangements, a clear distinction in flame behavior can be noted between slow, subsonic flames and fast-moving flames. Ciccarelli and Dorofeev [
14] provided an overview of the FA process and discussed the mechanism of flame propagation in obstructed and unobstructed tubes with uniform H
2-air mixtures. Porowski et al. [
15] employed the ddtFoam solver running on OpenFOAM and examined the impacts of obstacles on the onset of detonation in tubes with a stoichiometric H
2-air mixture. They noted that the ddtFoam solver had industrial safety applications. Their results showed that to obtain the shortest run-up distance, the flame needs a high blockage ratio (BR) with broad obstacle spacing or a lower BR with narrow gaps between subsequent rows of obstacles. Pinos and Ciccarelli [
16] found that staggered obstacles noticeably enhance the average flame speed in the quasi-detonation regime in comparison with inline obstacles. Xiao and Oran [
17] used numerical simulations to reveal the mechanism behind detonation transition in staggered obstacle arrays, demonstrating that it involves shock focusing at the flame. They also explored various obstacle shapes, such as circular, square, left triangular, and right triangular, and their distinct effects on FA and DDT [
18]. Additionally, Han et al. conducted experimental examinations of DDT in obstructed channels [
19]. They investigated mechanisms of FA in syngas-air in a closed tube. They also studied the effects of the distance of obstacles from the ignition source and hydrogen volume fractions on the pressure dynamics and FA. Their results showed that reducing the distance of obstacles from the ignition source affects the velocity and acceleration of the flame and maximizes overpressure. They described two processes contributing to FA: 1) the flame front is pushed by the unburned gas because its burns are delayed behind the flame front, and 2) the obstacles transition the laminar flame front to turbulent flame or intensify the turbulence rate. Baiwei et al. [
20] conducted a numerical study of the transition from a turbulent jet flame to detonation in an H
2-air pre-mixed gas within a pipeline. The results revealed that the proportion of heat losses within the total heat release continuously increased before the flame crossed obstacles. However, as the flame advanced through the obstacles, it steadily decreased.
When hydrogen is released into an air-filled duct, specific behaviors occur. Hydrogen tends to rise to the top of the duct, creating an initially stratified mixture. This inhomogeneity results from the interplay between diffusion forces and buoyancy. Consequently, the mixture initially establishes a vertical concentration gradient, with hydrogen concentration being higher toward the top of the duct. Over time, this concentration gradient evens out, and the mixture becomes more uniform on a global scale. In the case of a large volume, like a reactor containment, this process can extend over several hours before achieving a fully uniform state. Despite this realistic scenario, research on the combustion of mixtures with non-uniform concentrations has been relatively limited. Given that an initially non-uniform fuel distribution more accurately represents the initial state of the H
2-air mixture in an accident scenario [
21], it is crucial to consider this factor in safety-related combustion studies. Ishii and Kojima [
22] focused on detonation propagation in mixtures with vertical concentration gradients in a horizontal tube. Their results demonstrated that the local deflection angle increases with an increase in the local concentration gradient. Bleyer et al. [
23] investigated flame propagation with a vertical hydrogen gradient in a vertical tube. Their results demonstrated that the flame propagates in the upward direction, away from the igniter, into a gradually richer or leaner mixture depending on the concentration gradient. Also, they showed that the concentration at the ignition source has a significant influence on the flame development. Song et al. [
24] conducted numerical investigations into self-sustaining detonation modes within heterogeneous hydrogen-oxygen mixtures. They observed that concentration gradients played a pivotal role in alternating between multi-head and single-head detonation modes. Saied et al. [
25] investigated DDT in uniform and stratified mixtures with 15% and 30% hydrogen concentrations. They found that in the lean mixture (15% hydrogen), DDT occurred only in stratified conditions. They also showed that reducing obstacle spacing caused DDT to happen earlier in time and space. Luan et al. [
26] performed numerical simulations of 2D rotating detonations. They discovered that the wave number progressively increased with higher equivalent ratios in stratified environments. Jiang et al. [
27] examined the impact of concentration gradients on detonation and re-initiation behavior within oxygen-containing mixed gases in bifurcation ducts. Their study revealed that in mixtures with concentration gradients, the second reflection plays a crucial role in successfully re-initiating detonation. This is in contrast to the uniform mixture. Saied et al. [
28] conducted a numerical investigation into the effect of hydrogen mixture inhomogeneity on the mechanisms underlying the DDT. Their study identified three distinct mechanisms of DDT within a rich stratified mixture at a 35% concentration. In the first regime, the creation of a robust Mach stem among the obstacles results in the direct initiation of detonation in the vicinity of the triple point. In the second regime, reflected shock waves from the obstacles serve as the necessary conditions for DDT. In the third regime, neither the Mach stem nor the reflected shock waves play a substantial role in the onset of detonation.
In recent years, there has been extensive experimental research on FA and DDT. However, detonation is a very complex phenomenon with a microsecond time-scale, and investigating the details of its occurrence requires advanced and costly techniques. Therefore, numerical simulation of this phenomenon, as a suitable and accurate tool, can minimize the need for experimental tests. On the other hand, many of the related studies have focused on the structure of gas detonation, often overlooking the concentration on FA and DDT phenomena. In the last few years, much research has been dedicated to understanding the factors affecting DDT and how to control it. Accurate calculations necessitate more realistic models and appropriate numerical methods. As such, this research has focused on stratified mixtures for more realistic modeling and more detailed investigations. The low density of hydrogen makes it prone to forming non-uniform concentrations when mixed with air in a combustion chamber. This non-uniformity significantly impacts both FA and DDT processes. Therefore, it is essential to conduct research aimed at understanding how jet flames influence FA and DDT processes within stratified H2-air premixed gases.
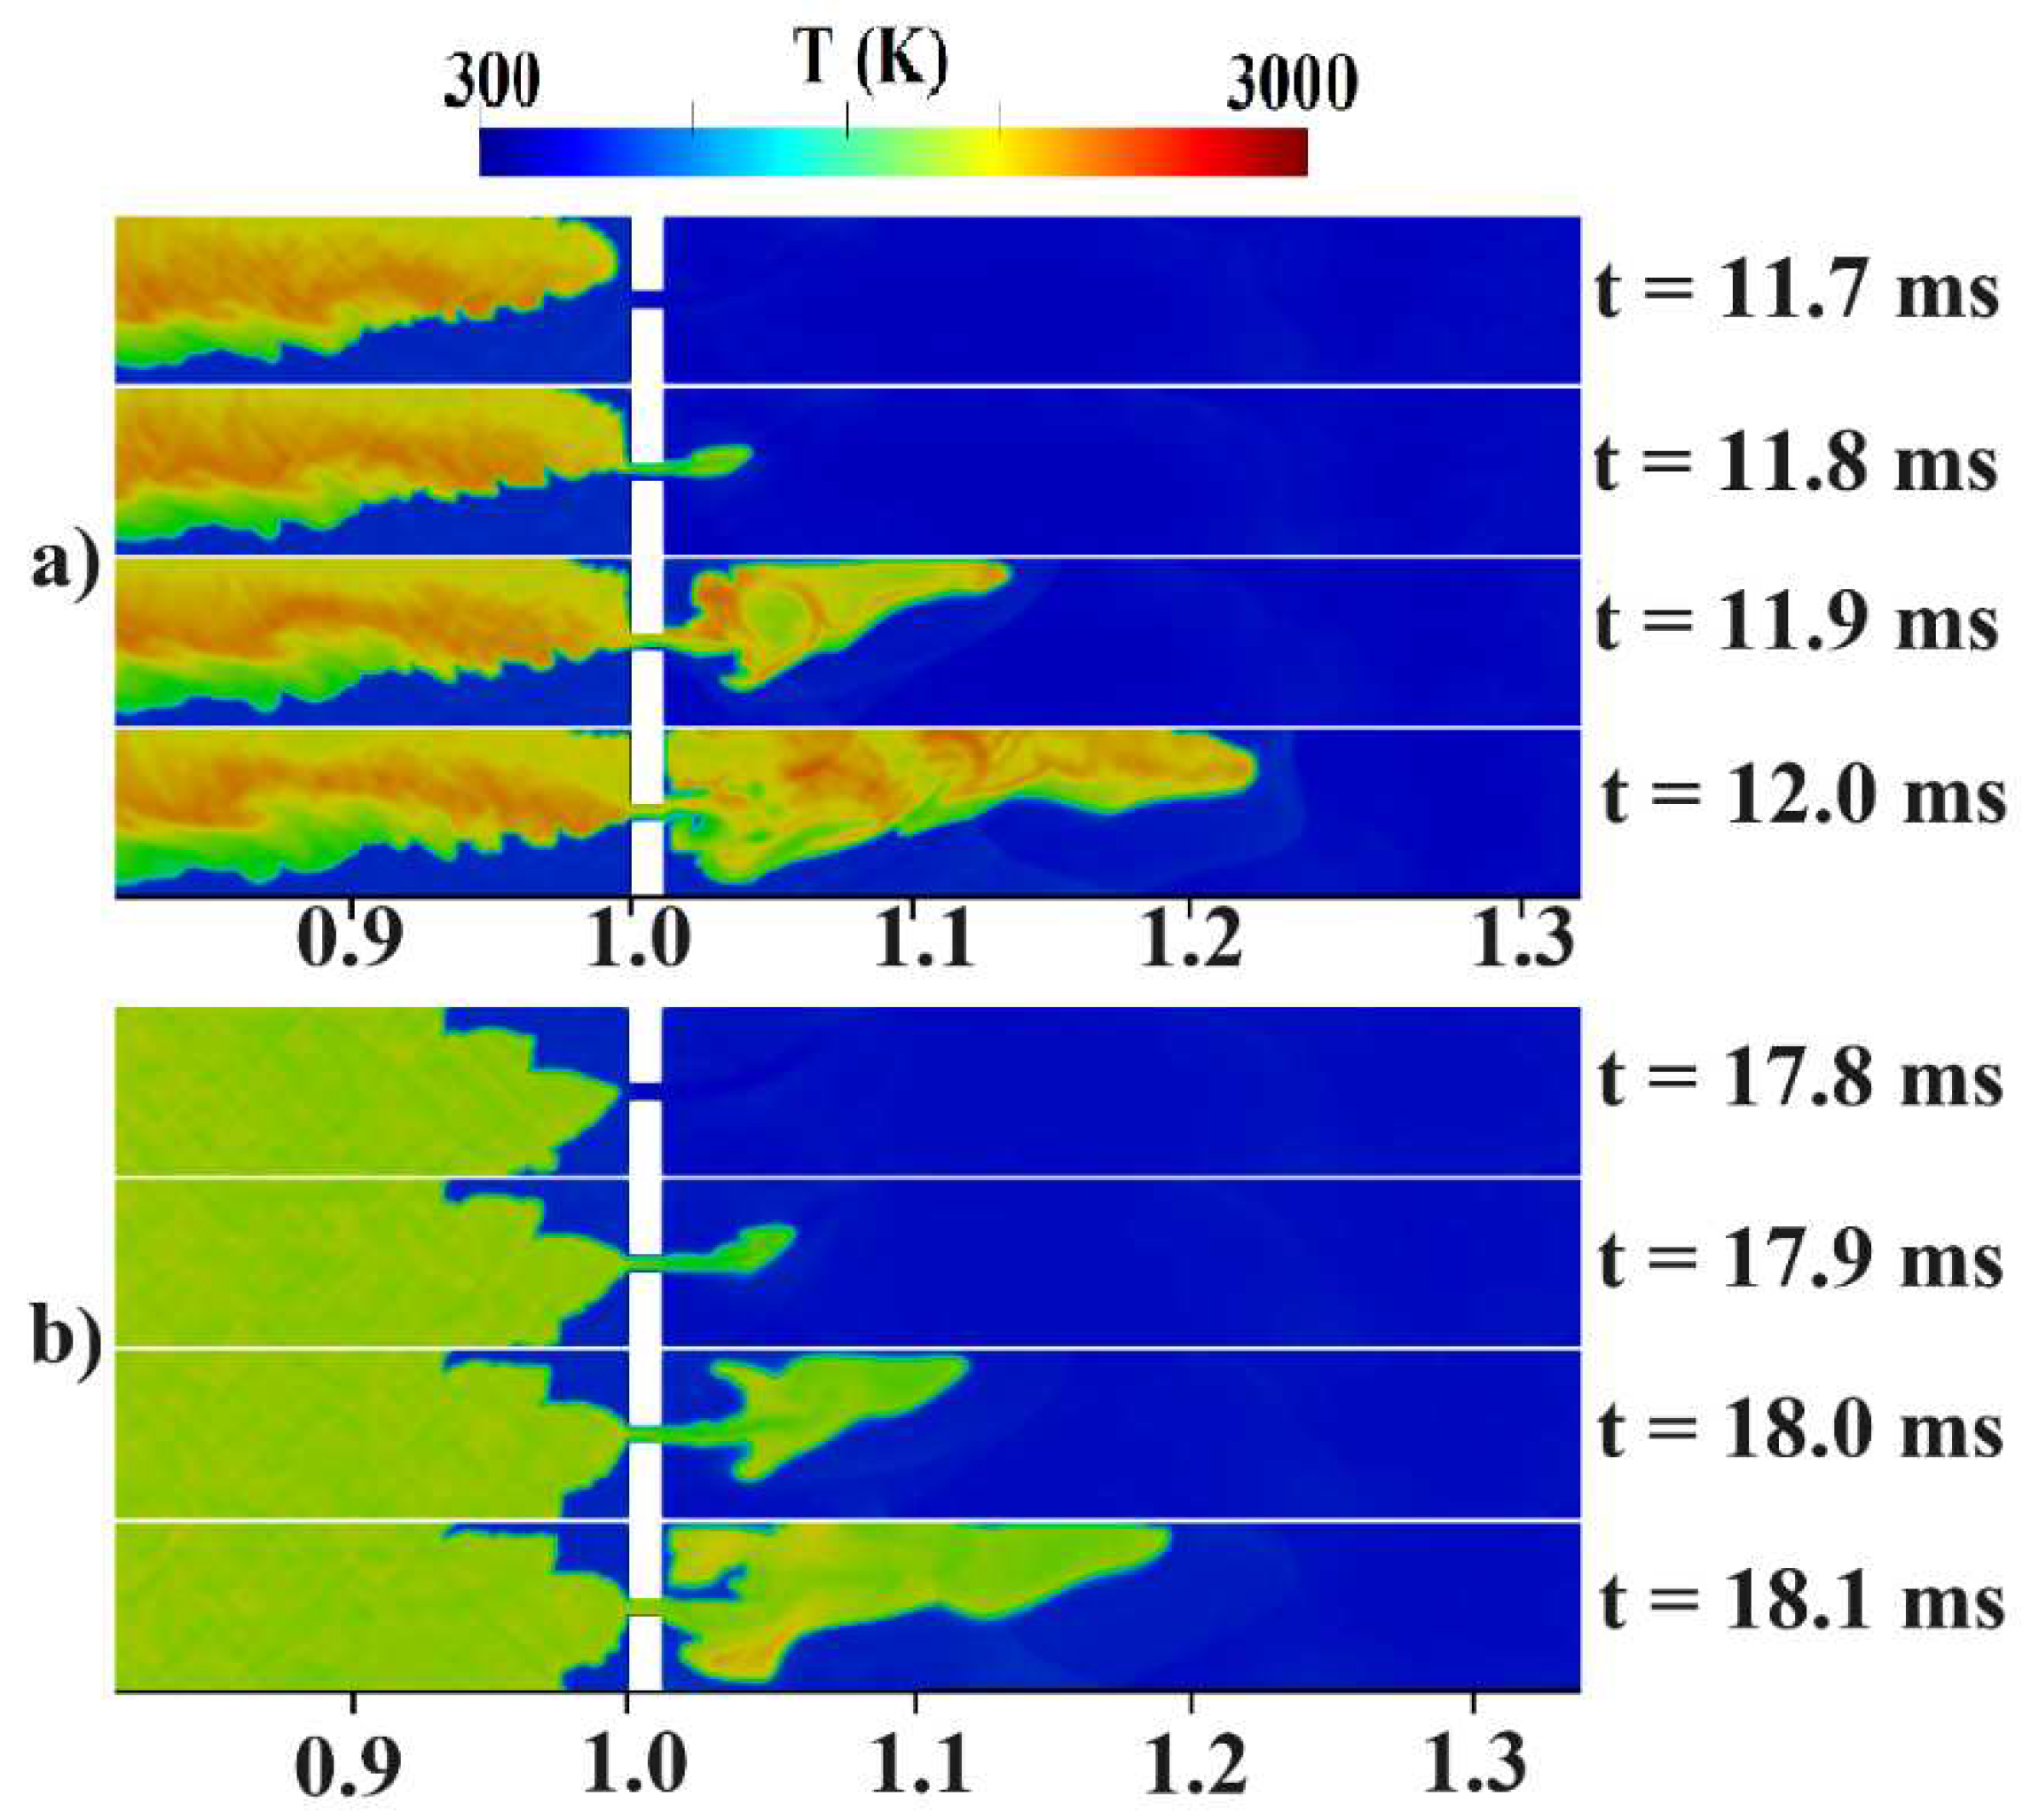
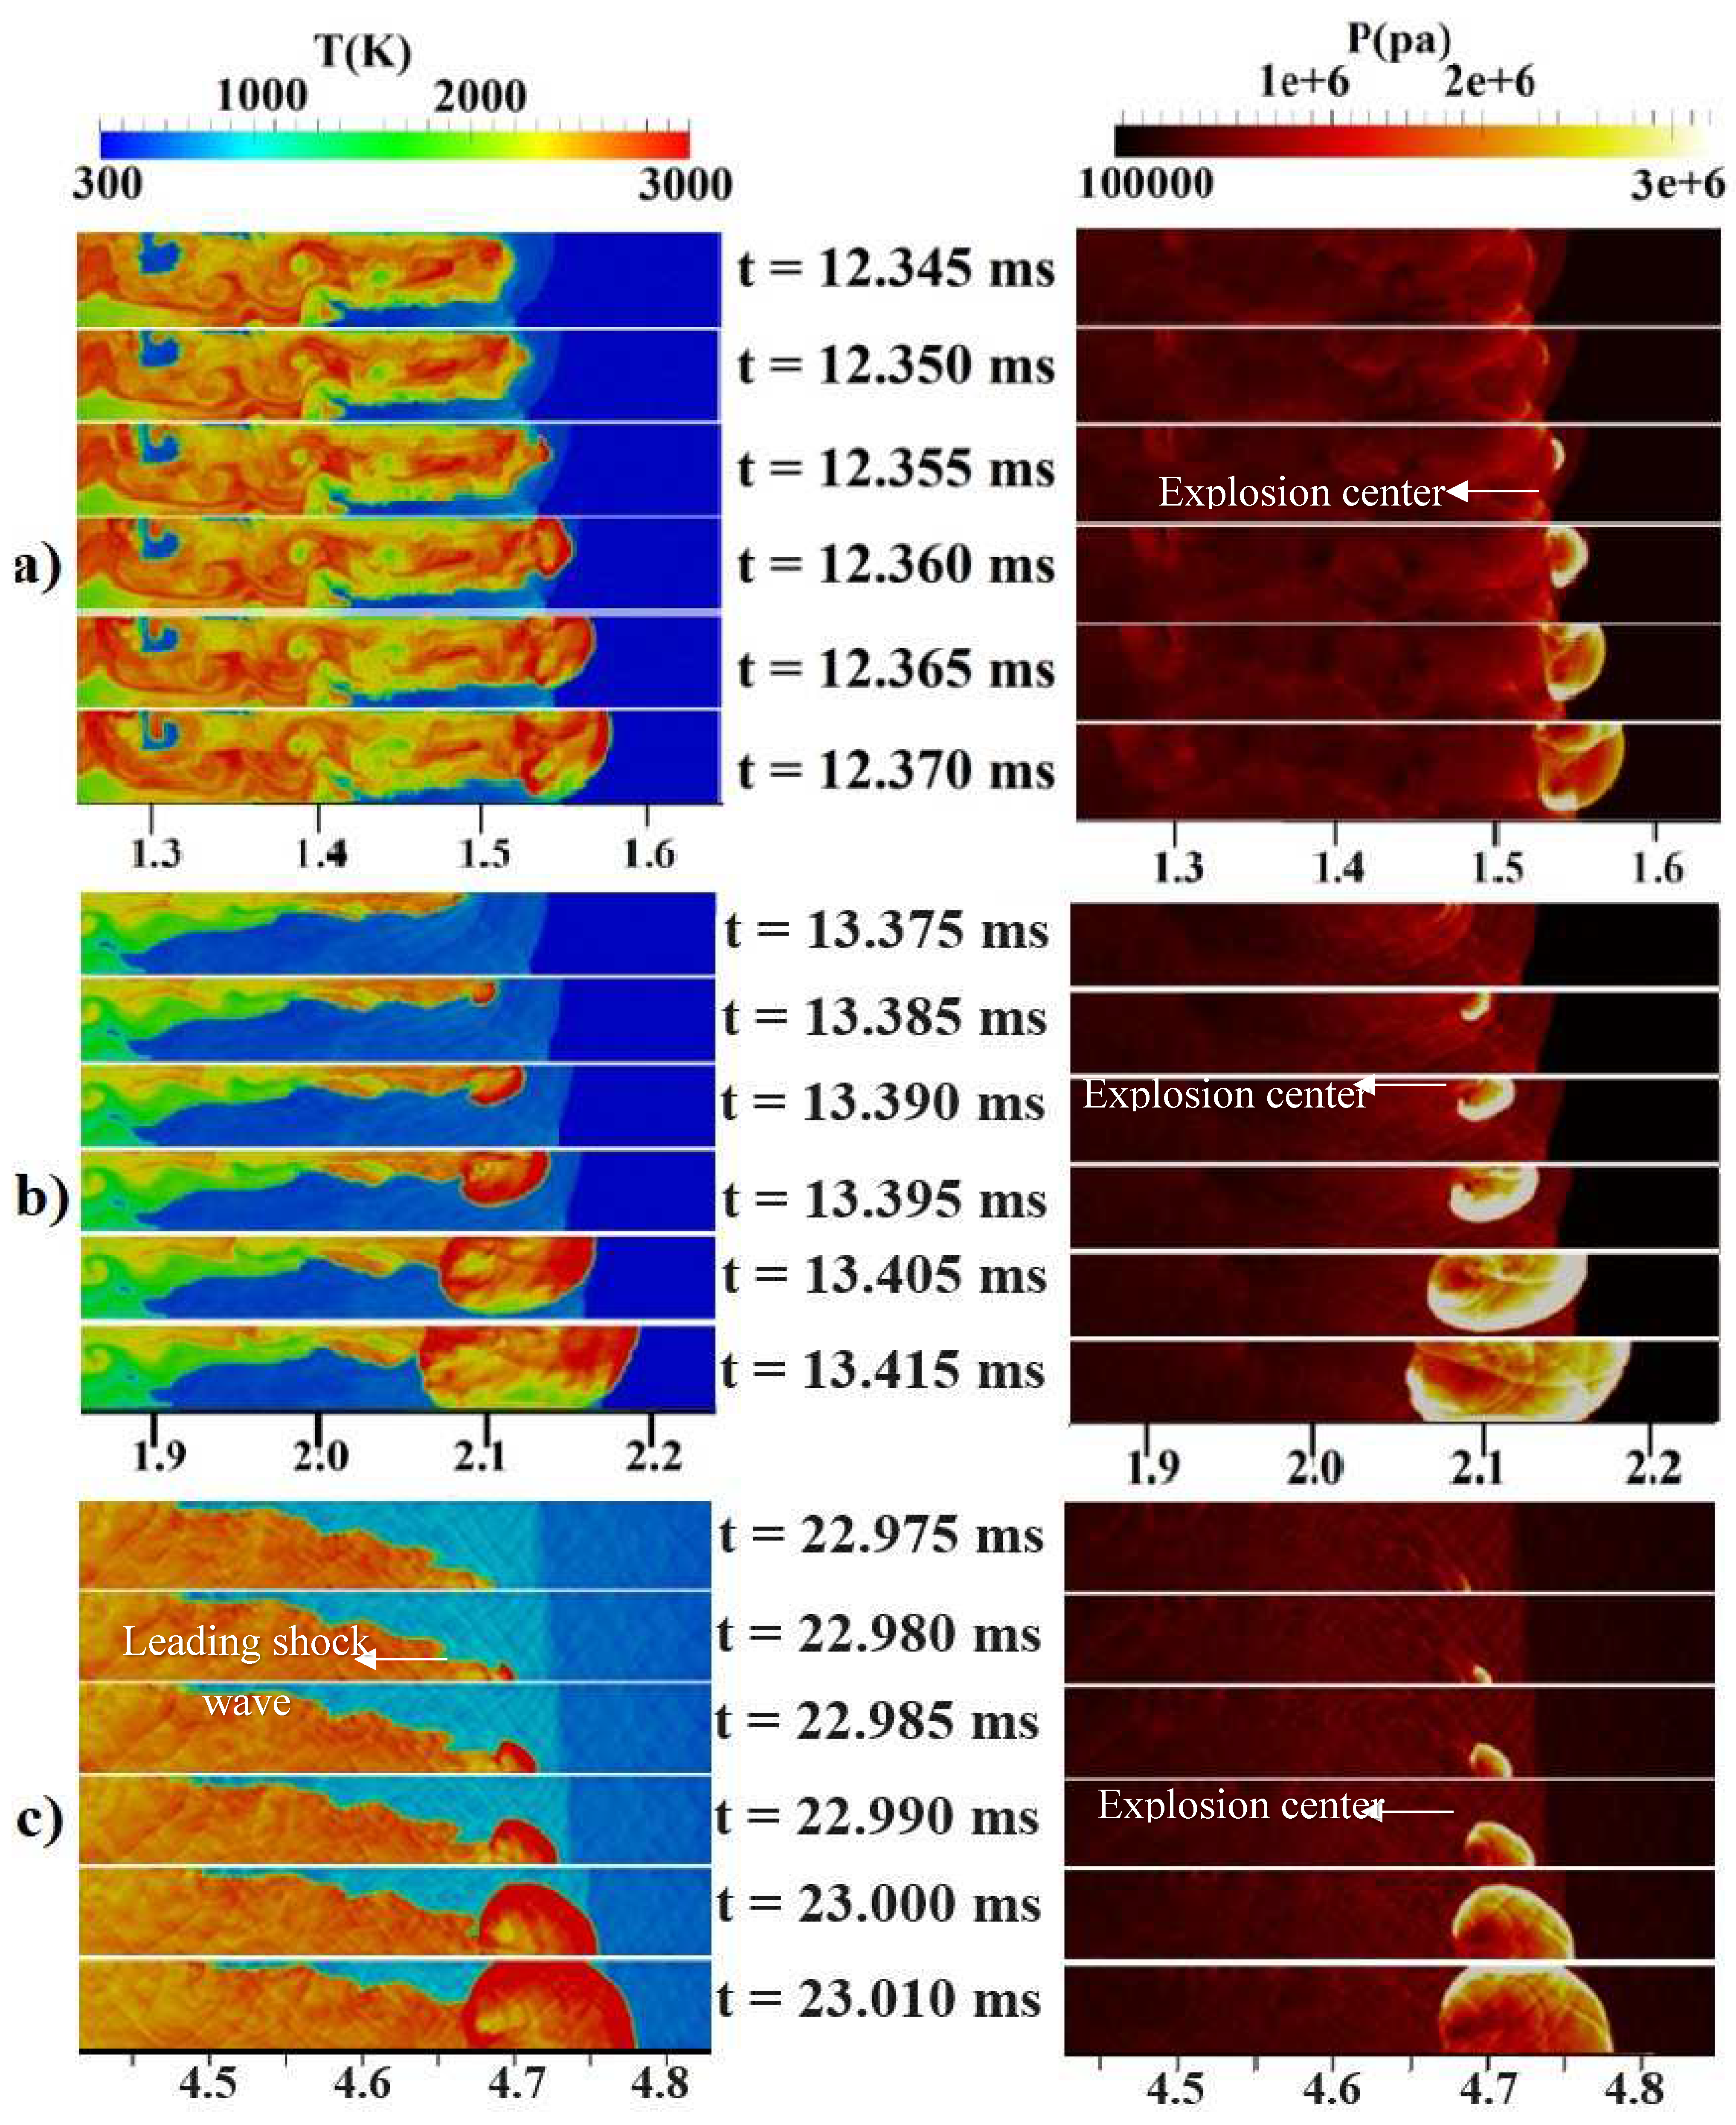
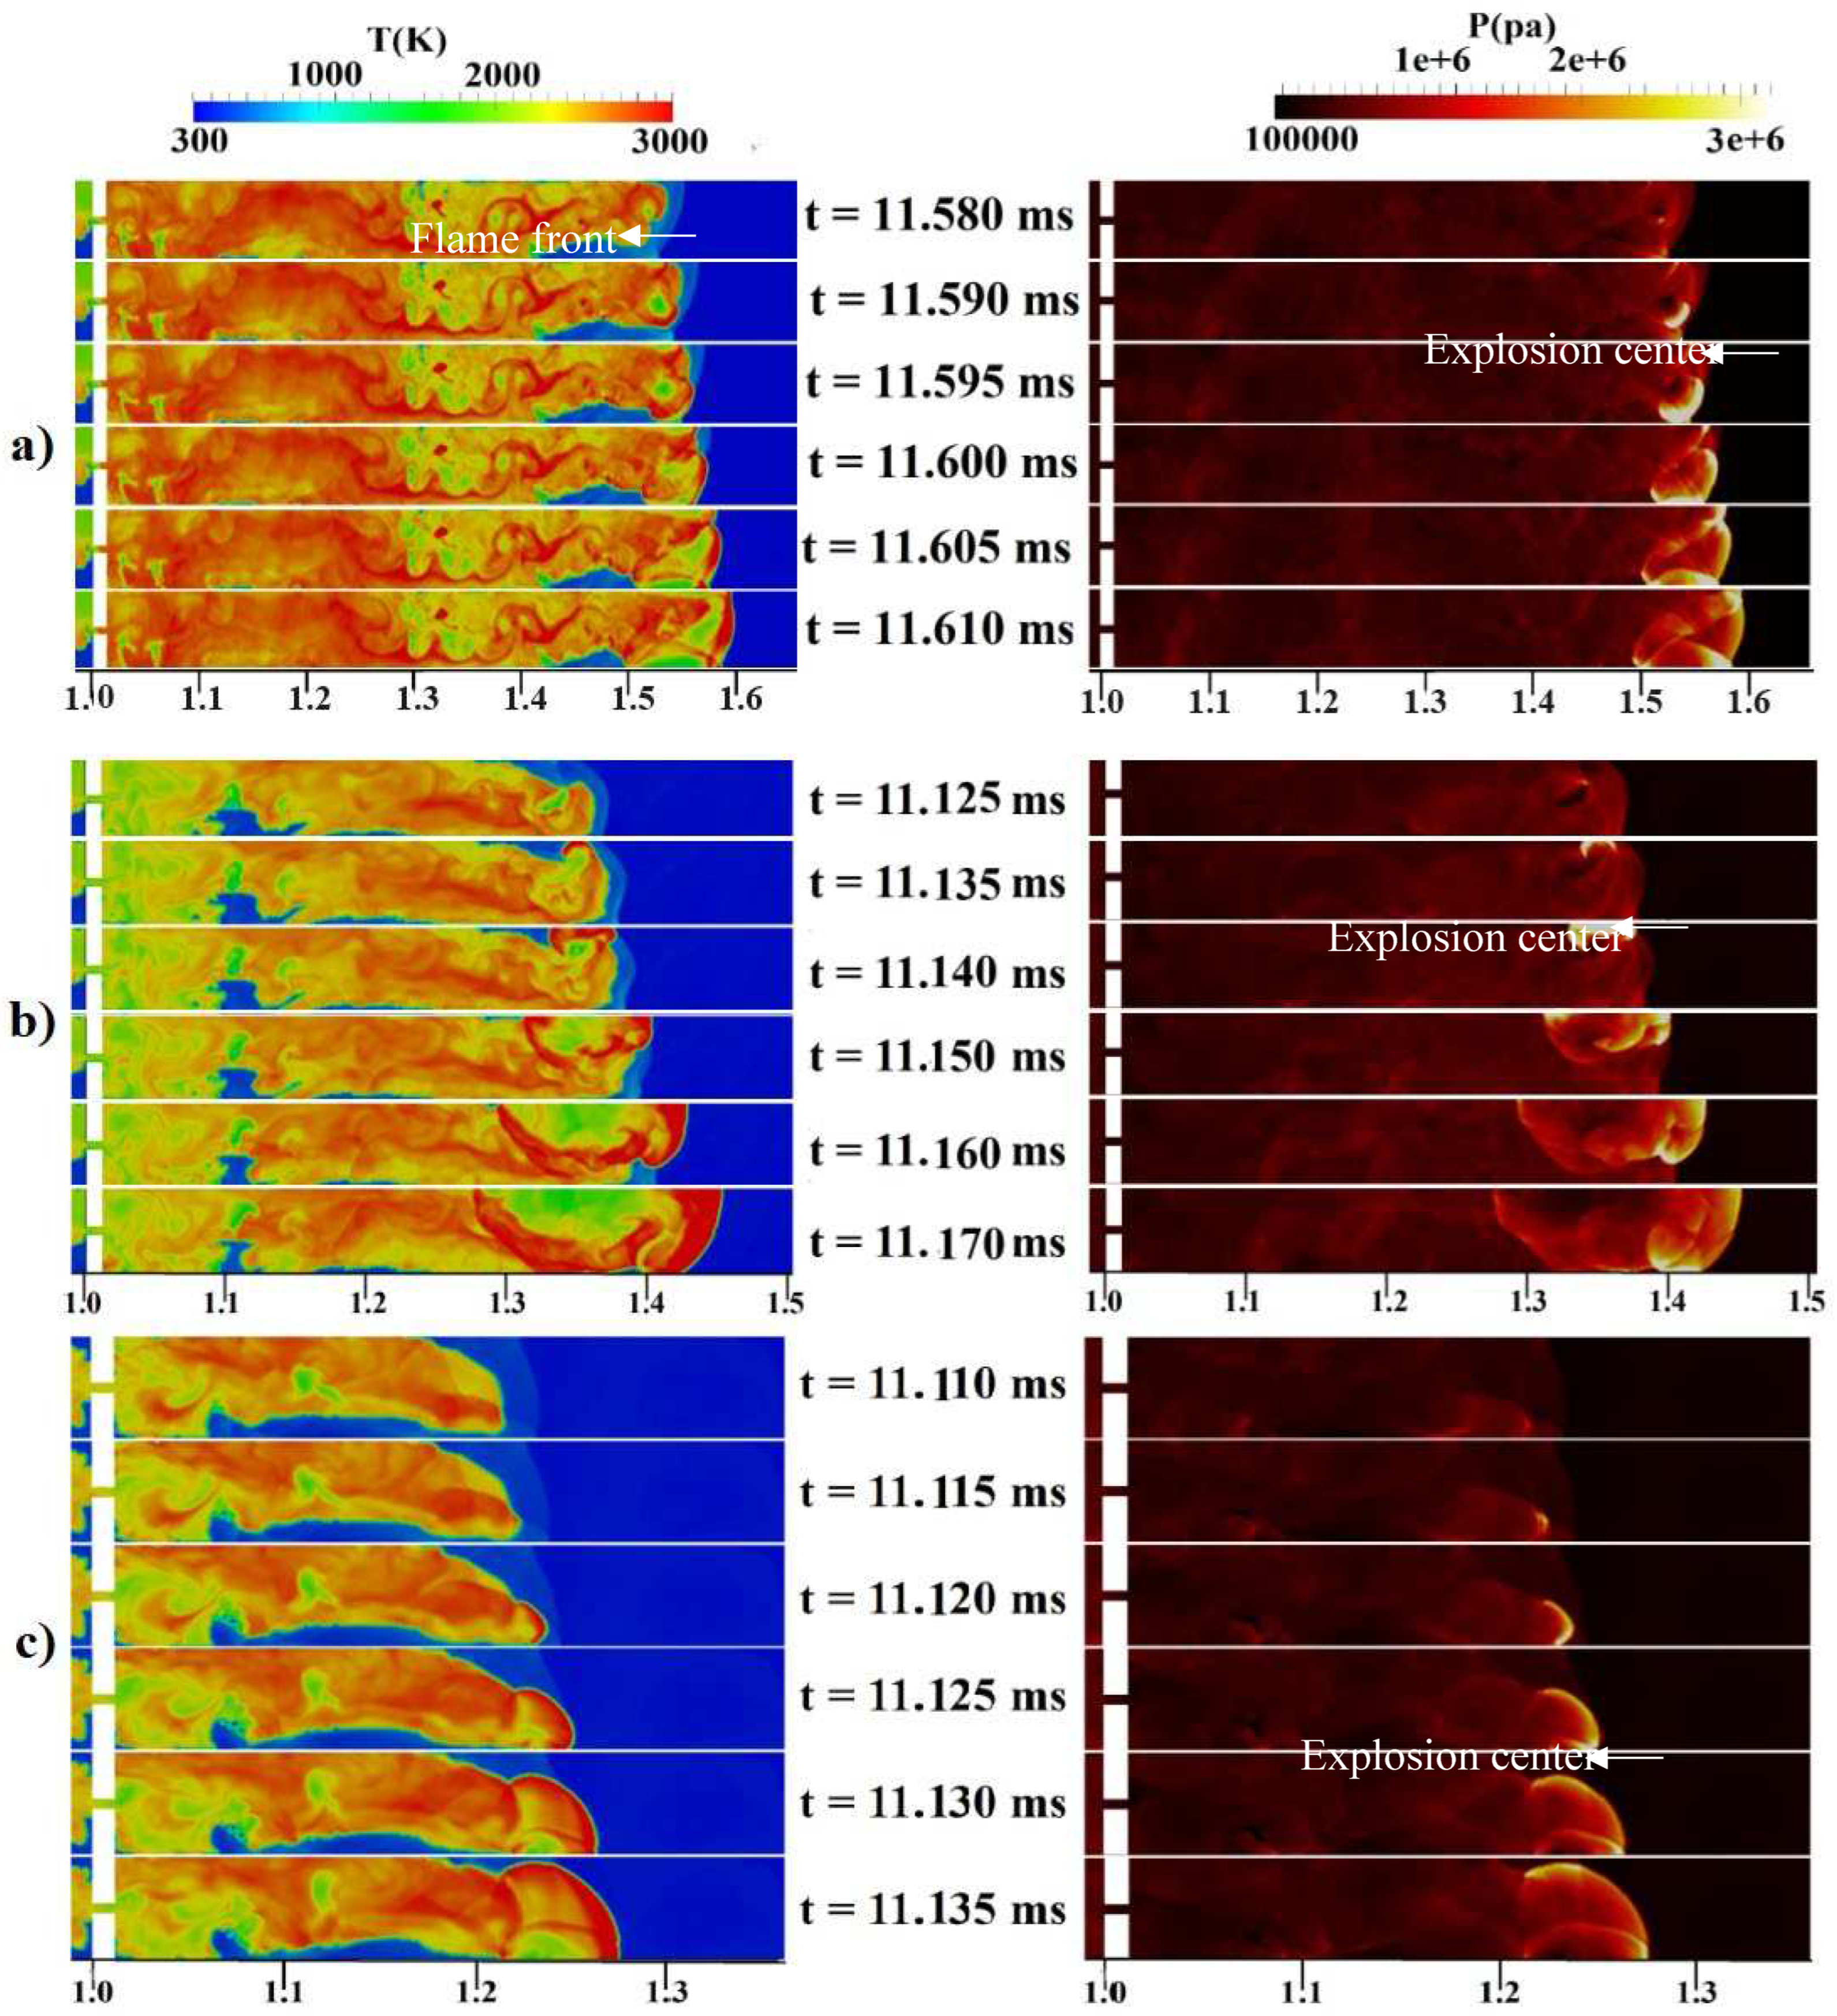
This research has focused on the numerical 2D investigation of the propagation, acceleration, and the transition from a turbulent jet flame to detonation. The flame acceleration process comprises both an initial and a final stage. In the first stage, the flame begins accelerating after the reactions commence, reaching the sound velocity (in reactive materials). In the final stage, the process initiates with the formation of strong pressure waves in front of the flame. As the flame continues to accelerate, its speed approaches the velocity of sound in the combustion products, resulting in a choked flame. Several lines of evidence showed that this choked flame speed can be reached in a turbulent flame where hot spots are formed within the channel, ultimately leading to DDT. This research has employed numerical simulations to explore the mechanisms influencing flame acceleration in both the initial and final stages and has also discussed the interaction between combustion and turbulence. Also, this study focuses on evaluating the influence of diffusion time, delving into factors that have received less attention in previous research on the transition from a turbulent jet flame to detonation. Through numerical simulations of gas detonation, we have examined how diffusion time affects the fundamental processes responsible for the transition from a turbulent jet flame to detonation.
3. Numerical Method
In the present numerical simulation, the ddtFoam solver [
31] was used to simulate FA and DDT in the H
2-air mixture. The primary objective was to compute the macroscopic properties of shock propagation and the characteristics of the flame. DDT is a complex gas dynamic phenomenon that involves flame-turbulence interaction and flame instabilities. It is virtually impossible to resolve all microscopic details of the flow in industry-scale geometries with current resources and capabilities. Moreover, not all microscopic-scale phenomena are necessary for simulating macroscopic DDT events. In the current study, a coarse grid size was employed. Using under-resolved grids serves two purposes: it enables computational scalability for larger domains and facilitates the study of FA and DDT within a limited timeframe. To simulate flame propagation in large three-dimensional geometries without resolving the microstructure of the flow within the Computational Fluid Dynamics (CFD) cell, a combination of the PISO solver and the ddtFoam solver [
32] was employed. The PISO solver is well-suited for Mach numbers less than 0.3, while the ddtFoam solver is activated when the Mach number exceeds 0.3. This combined approach serves as a foundation for studying FA and the initiation of detonation processes.
In the current study, the Unsteady Reynolds-Averaged Navier-Stokes (URANS) modeling approach was chosen. This selection was used by its computational efficiency, which permits the use of a comparatively larger mesh size. Additionally, URANS modeling offers reasonably accurate estimations of macroscopic parameters, making it a suitable option for the research objectives. The ddtFoam is a solver to simulate the partial-premixed combustion flows with the two-equation model of 𝑘−𝜔 𝑆𝑆𝑇. The combustion model in this solver is the two-equation model of c-Ξ Weller, which is one type of Flamelet model. Here, c indicates the mass fraction of products (the indication of the reaction progress), and Ξ represents the flame surface wrinkle. Instead of solving separate transport equations for individual chemical species reactions, a unified transport equation was created and resolved for the variable c. The auto-ignition delay time (τ
ign) was devoted using Arrhenius equations, relying on the comprehensive reaction scheme described by O'Conaire et al. [
29]. The mixture composition is explained by the mixture fraction (𝑓
H), which indicates the hydrogen amount that would be found if the cell were completely unburned. To avoid repetitive recalculations of local ignition delay times, a table of τ
ign based on temperature (T), pressure (P), and mixture fraction (𝑓
H) was generated using Cantera [
33]. Throughout the numerical solutions, for each computational cell, the local ignition delay time was determined by searching this tabulated data. In this solver, an additional energy equation was solved for the unburned mixture. By solving this equation and obtaining the enthalpy of other unburned gases, the thermodynamic properties of these gases, such as temperature, density, and dynamic viscosity were calculable.
In the ddtFoam solver, the detonation process involving DDT and the effects of auto-ignition are described by the detonative source term (
) in the transport equation of the reaction progress variable. If a gas mixture ignites spontaneously without any ignition source, auto-ignition has occurred. The mixture composition, pressure (P), and local temperature (T) control the auto-ignition delay. In this solver, a sub-model is used, which raises the accuracy of the auto-ignition model in the coarse grids. This sub-model is presented, because the auto-ignition can occur due to shock-induced heating. Providing that the model predicts the auto-ignition based on average pressure and temperature, incorrect results can be obtained. The transition to detonation was modeled using the auto-ignition source term as follows:
In the above equation, ∆𝑡 indicates the present time step, H indicates the Heaviside function, and 𝜏 is a dimensionless variable expressing the auto-ignition process [
32]:
The mixture is ignited when the ignition variable 𝜏 reaches unity. Nevertheless, when the ignition delay time has not yet passed (𝑡 < 𝑡ign), there is no effect on the properties of flow. The local ignition delay time is a function of local pressure 𝑝, local temperature 𝑇, and mixture composition. This ignition delay time of a mixture is calculated using lookup tables, obtained from isochoric explosion calculations, which are calculated using a detailed reaction mechanism and Cantera.
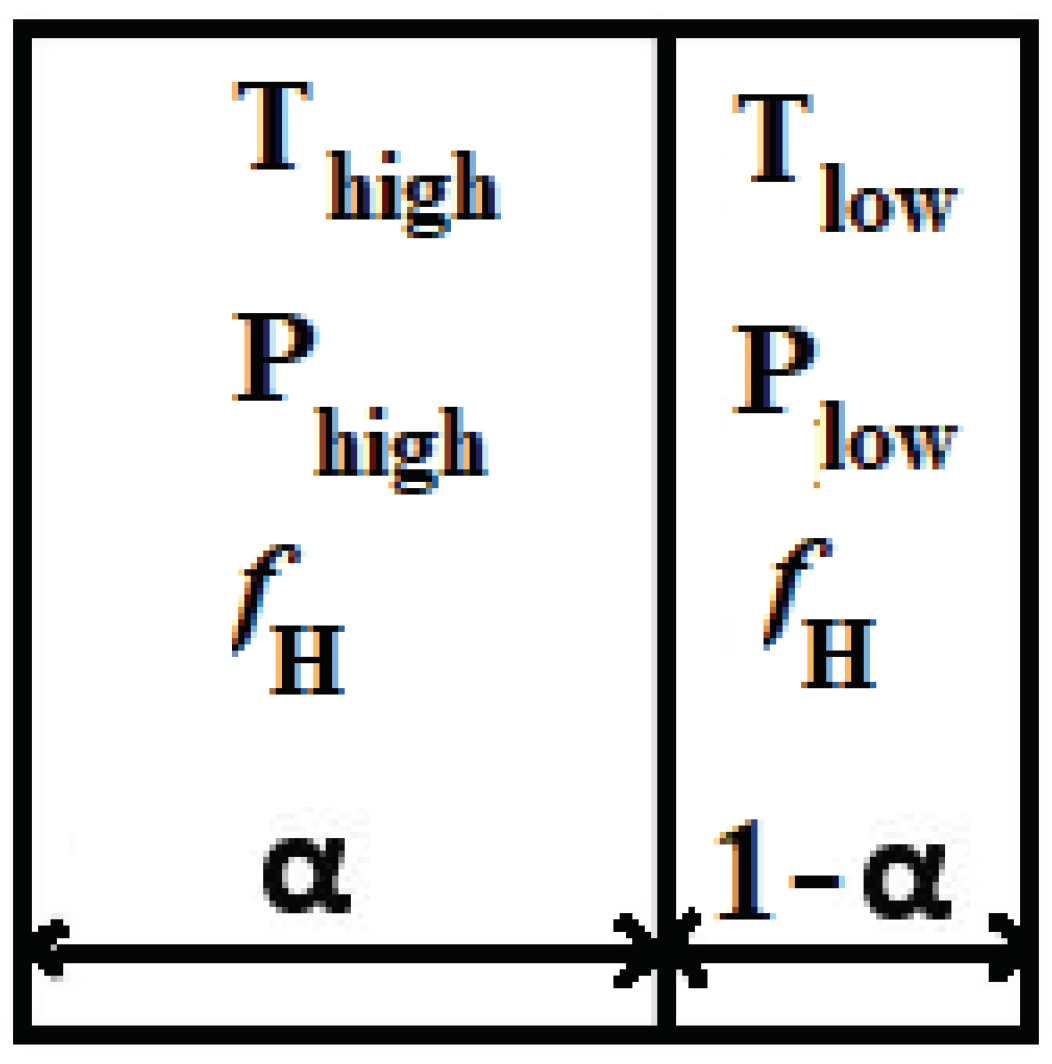
The average temperature may be adequate to initiate auto-ignition, but the shock responsible for temperature increase might not have fully traversed the entire computational cell. As a result, the computational cell can split into two segments, one with a volume fraction α and the other with a volume fraction of 1-α (as illustrated in
Figure 1). In one segment, the temperature and pressure are denoted as
and
, while in the other segment, they are represented as
and
, respectively. These values are calculated based on the properties of the surrounding computational cells. The mean pressure within the computational cell is denoted as
, and the volume fraction is determined using the following equation.
The values
and
can be computed using dynamic shock relations for an ideal gas with a specific heat ratio represented by 𝛾 [
34]. This model enables the distinct calculation of the ignition delay time across the shock within the computational cell and is applicable to the entire computational domain, even in regions where no shock is present.
In every grid cell, the process of auto-ignition is assessed individually on both sides of the discontinuity. By solving transport equations for 𝜏
high and 𝜏
low, mixing and transport consequences are accounted.
If 𝜏 = 1 (the critical value) is reached on one side of the discontinuity (i.e., 𝜏
high = 1 or 𝜏
low = 1), only the corresponding volume fraction of a computational cell is ignited. Therefore, the source term of auto-ignition will be calculated as shown [
35]:
In the above equation, ∆𝑡 indicates the current time step and H indicates the Heaviside function.
The Heaviside function triggers solely the part of the computational cell in which the local ignition delay time has passed, gained by weighting the volumetric source term by the volume fraction of either 𝛼 or 1−𝛼.
In computational simulations, it's crucial to use a grid resolution of 30-50 grid points within the flame thickness region to accurately capture the propagation of the flame. However, this finer resolution can significantly increase computational costs. To address this challenge, the ddtFoam solver has been specifically designed for simulating accidental explosions in nuclear plants. It employs a volume fraction method within each cell to determine the auto-ignition delay time, delivering satisfactorily accurate solutions even on coarser grids. The ddtFoam solver is versatile and can be effectively applied to problems involving detonation diffraction and various time-dependent extreme combustion scenarios. It offers the advantage of providing relatively quick results while maintaining an acceptable level of accuracy, making it a valuable tool for analysis and design purposes. The material properties were chosen from the Chemkin database through look-up tables. The Sutherland correlation was utilized to evaluate the molecular transport coefficients. The problem was a transient mode and was solved with the explicit Euler scheme for time discretization. In spatial discretization for the diffusion terms, second-order schemes were used to obtain higher accuracy. Tolerance of 10-6 was set for all solution algorithms, the value set for the time step size was 2*10-5, which was also the initial size of the time step.
3.1. Characteristics of Combustion Geometry
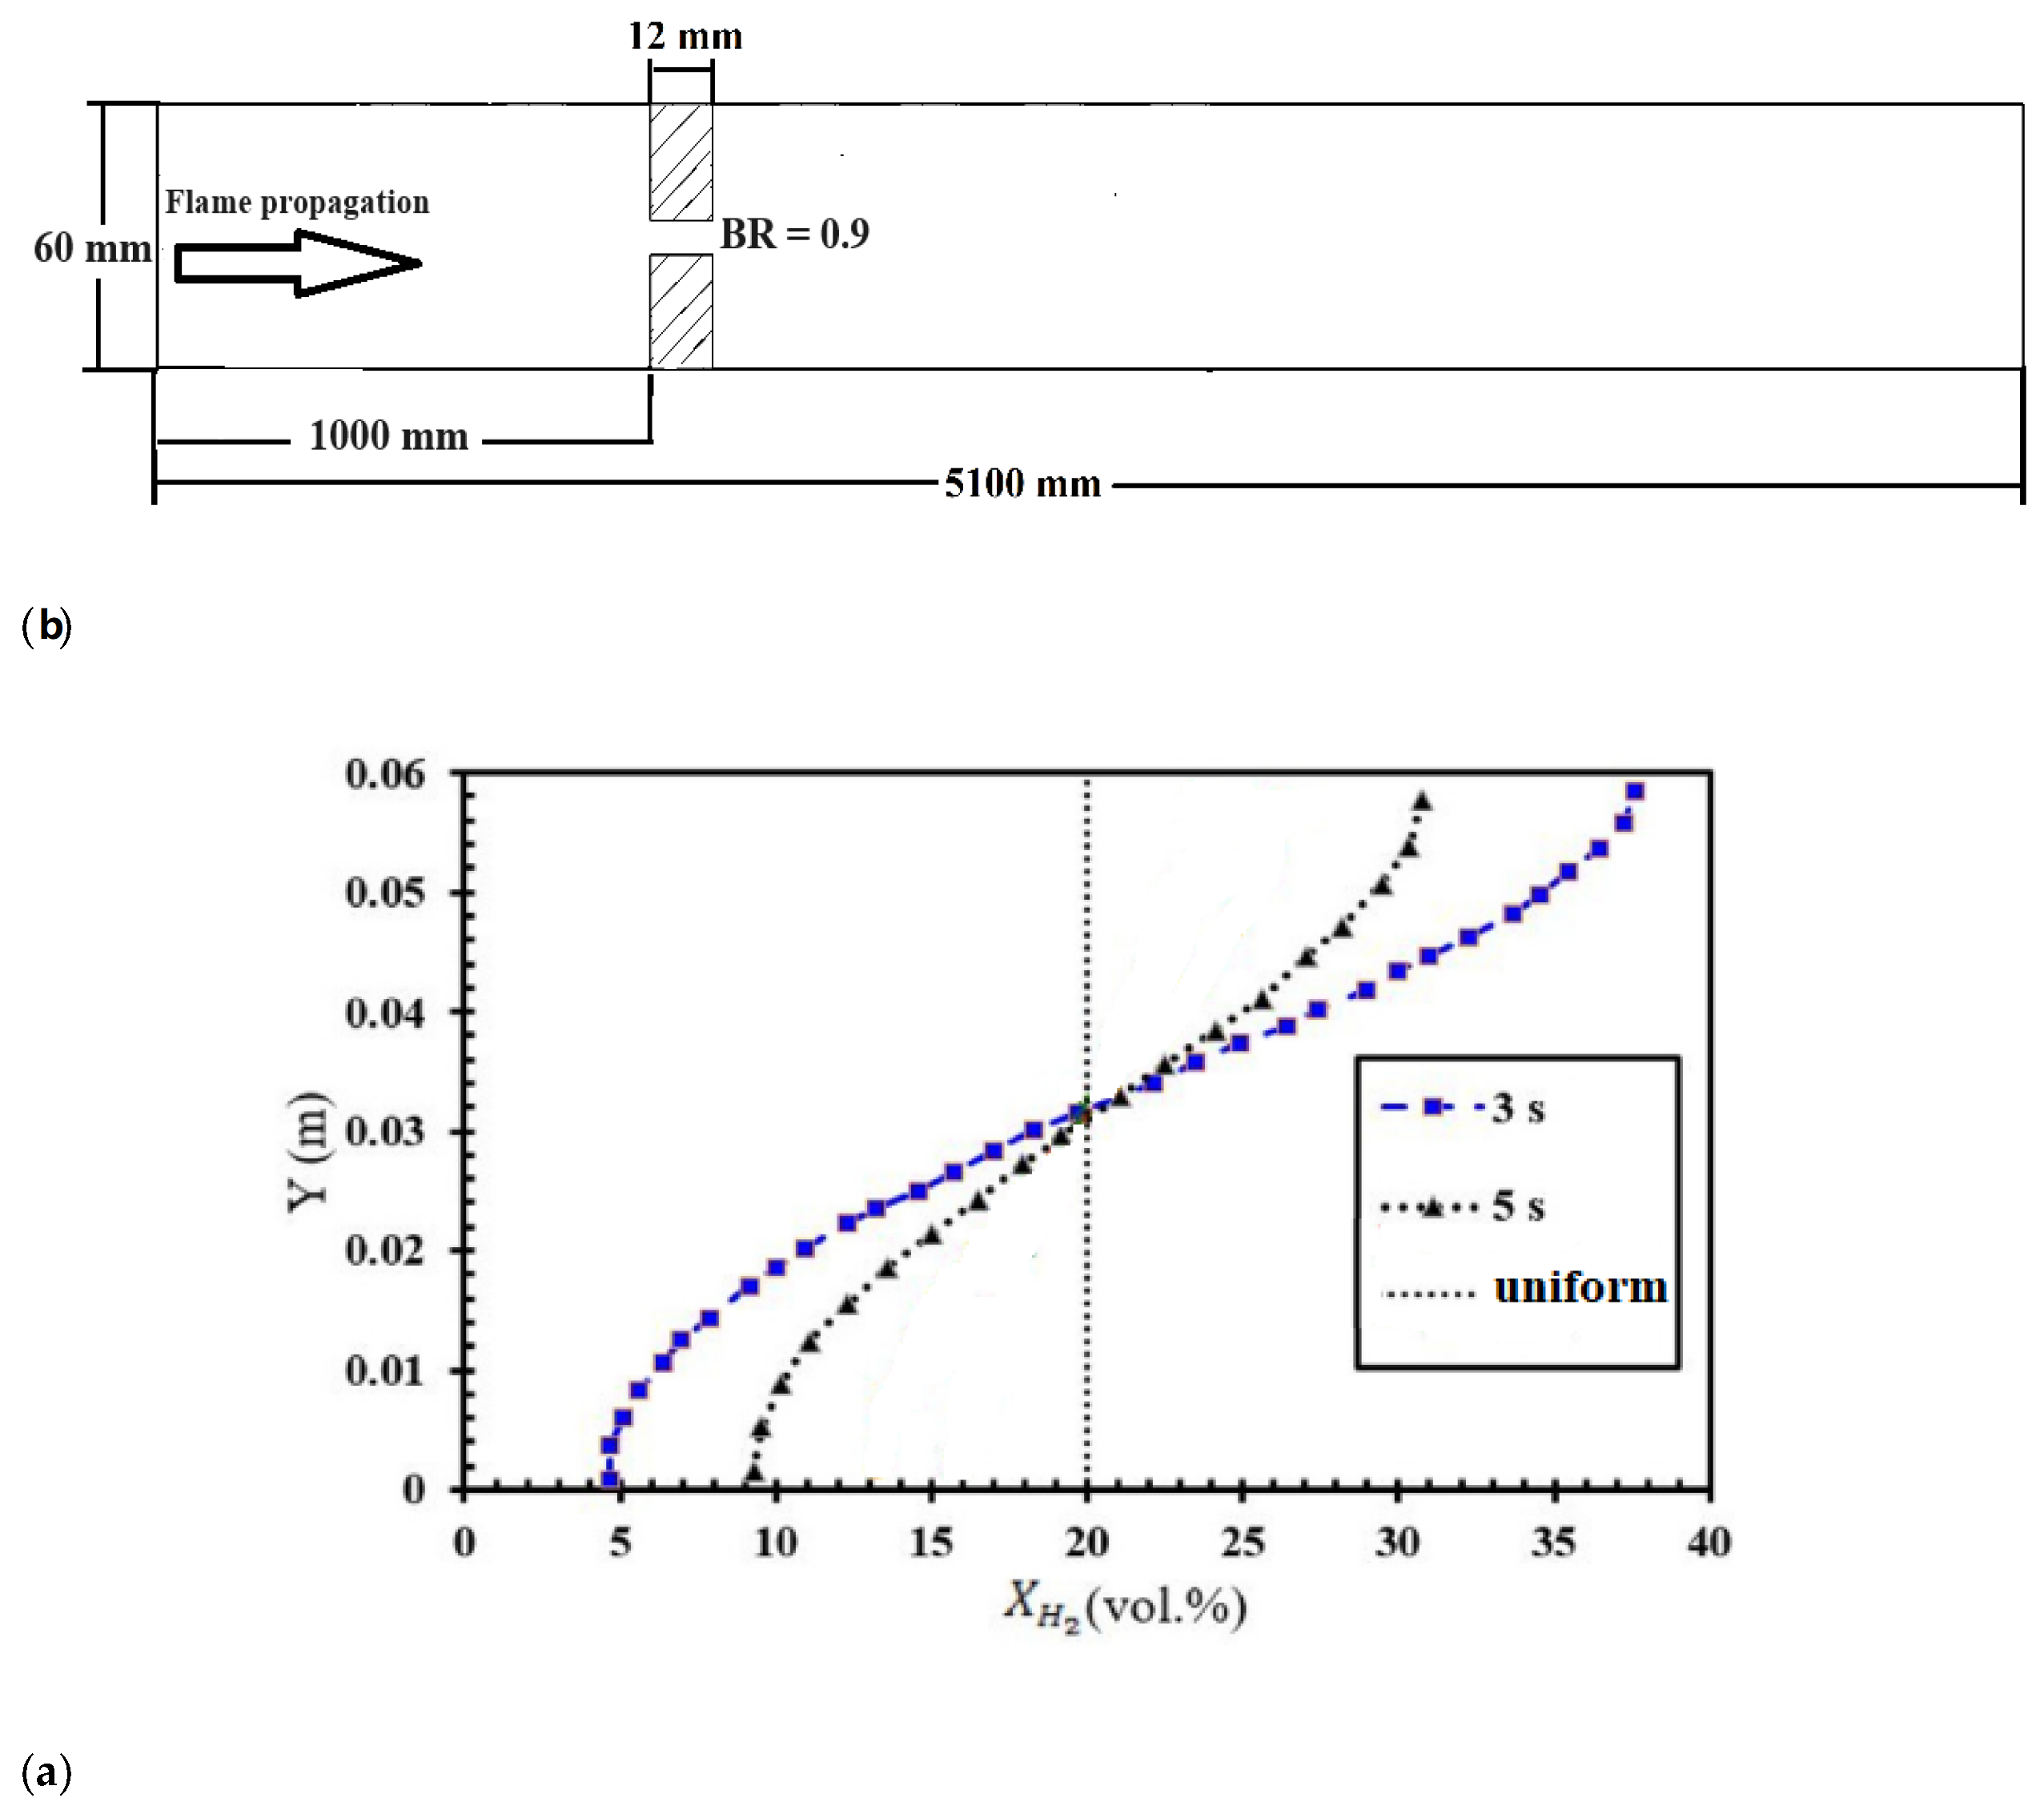
The numerical investigation of FA in stratified mixtures was carried out within a closed duct measuring 5.1 meters in length (
Figure 2a). The duct had a rectangular cross-section with a height of 60 mm and a width of 300 mm. Inside the duct, a turbulence-inducing obstacle was installed. In this particular configuration, the blockage ratio was set at 0.9, and the obstacle was positioned at a distance of 1 meter from the ignition source, which was mounted on one of the end plates of the tube. Notably, the dimensions of this duct are identical to those of the Gravent facility [
36]; however, the Gravent facility features seven obstacles. All cases were conducted with an H
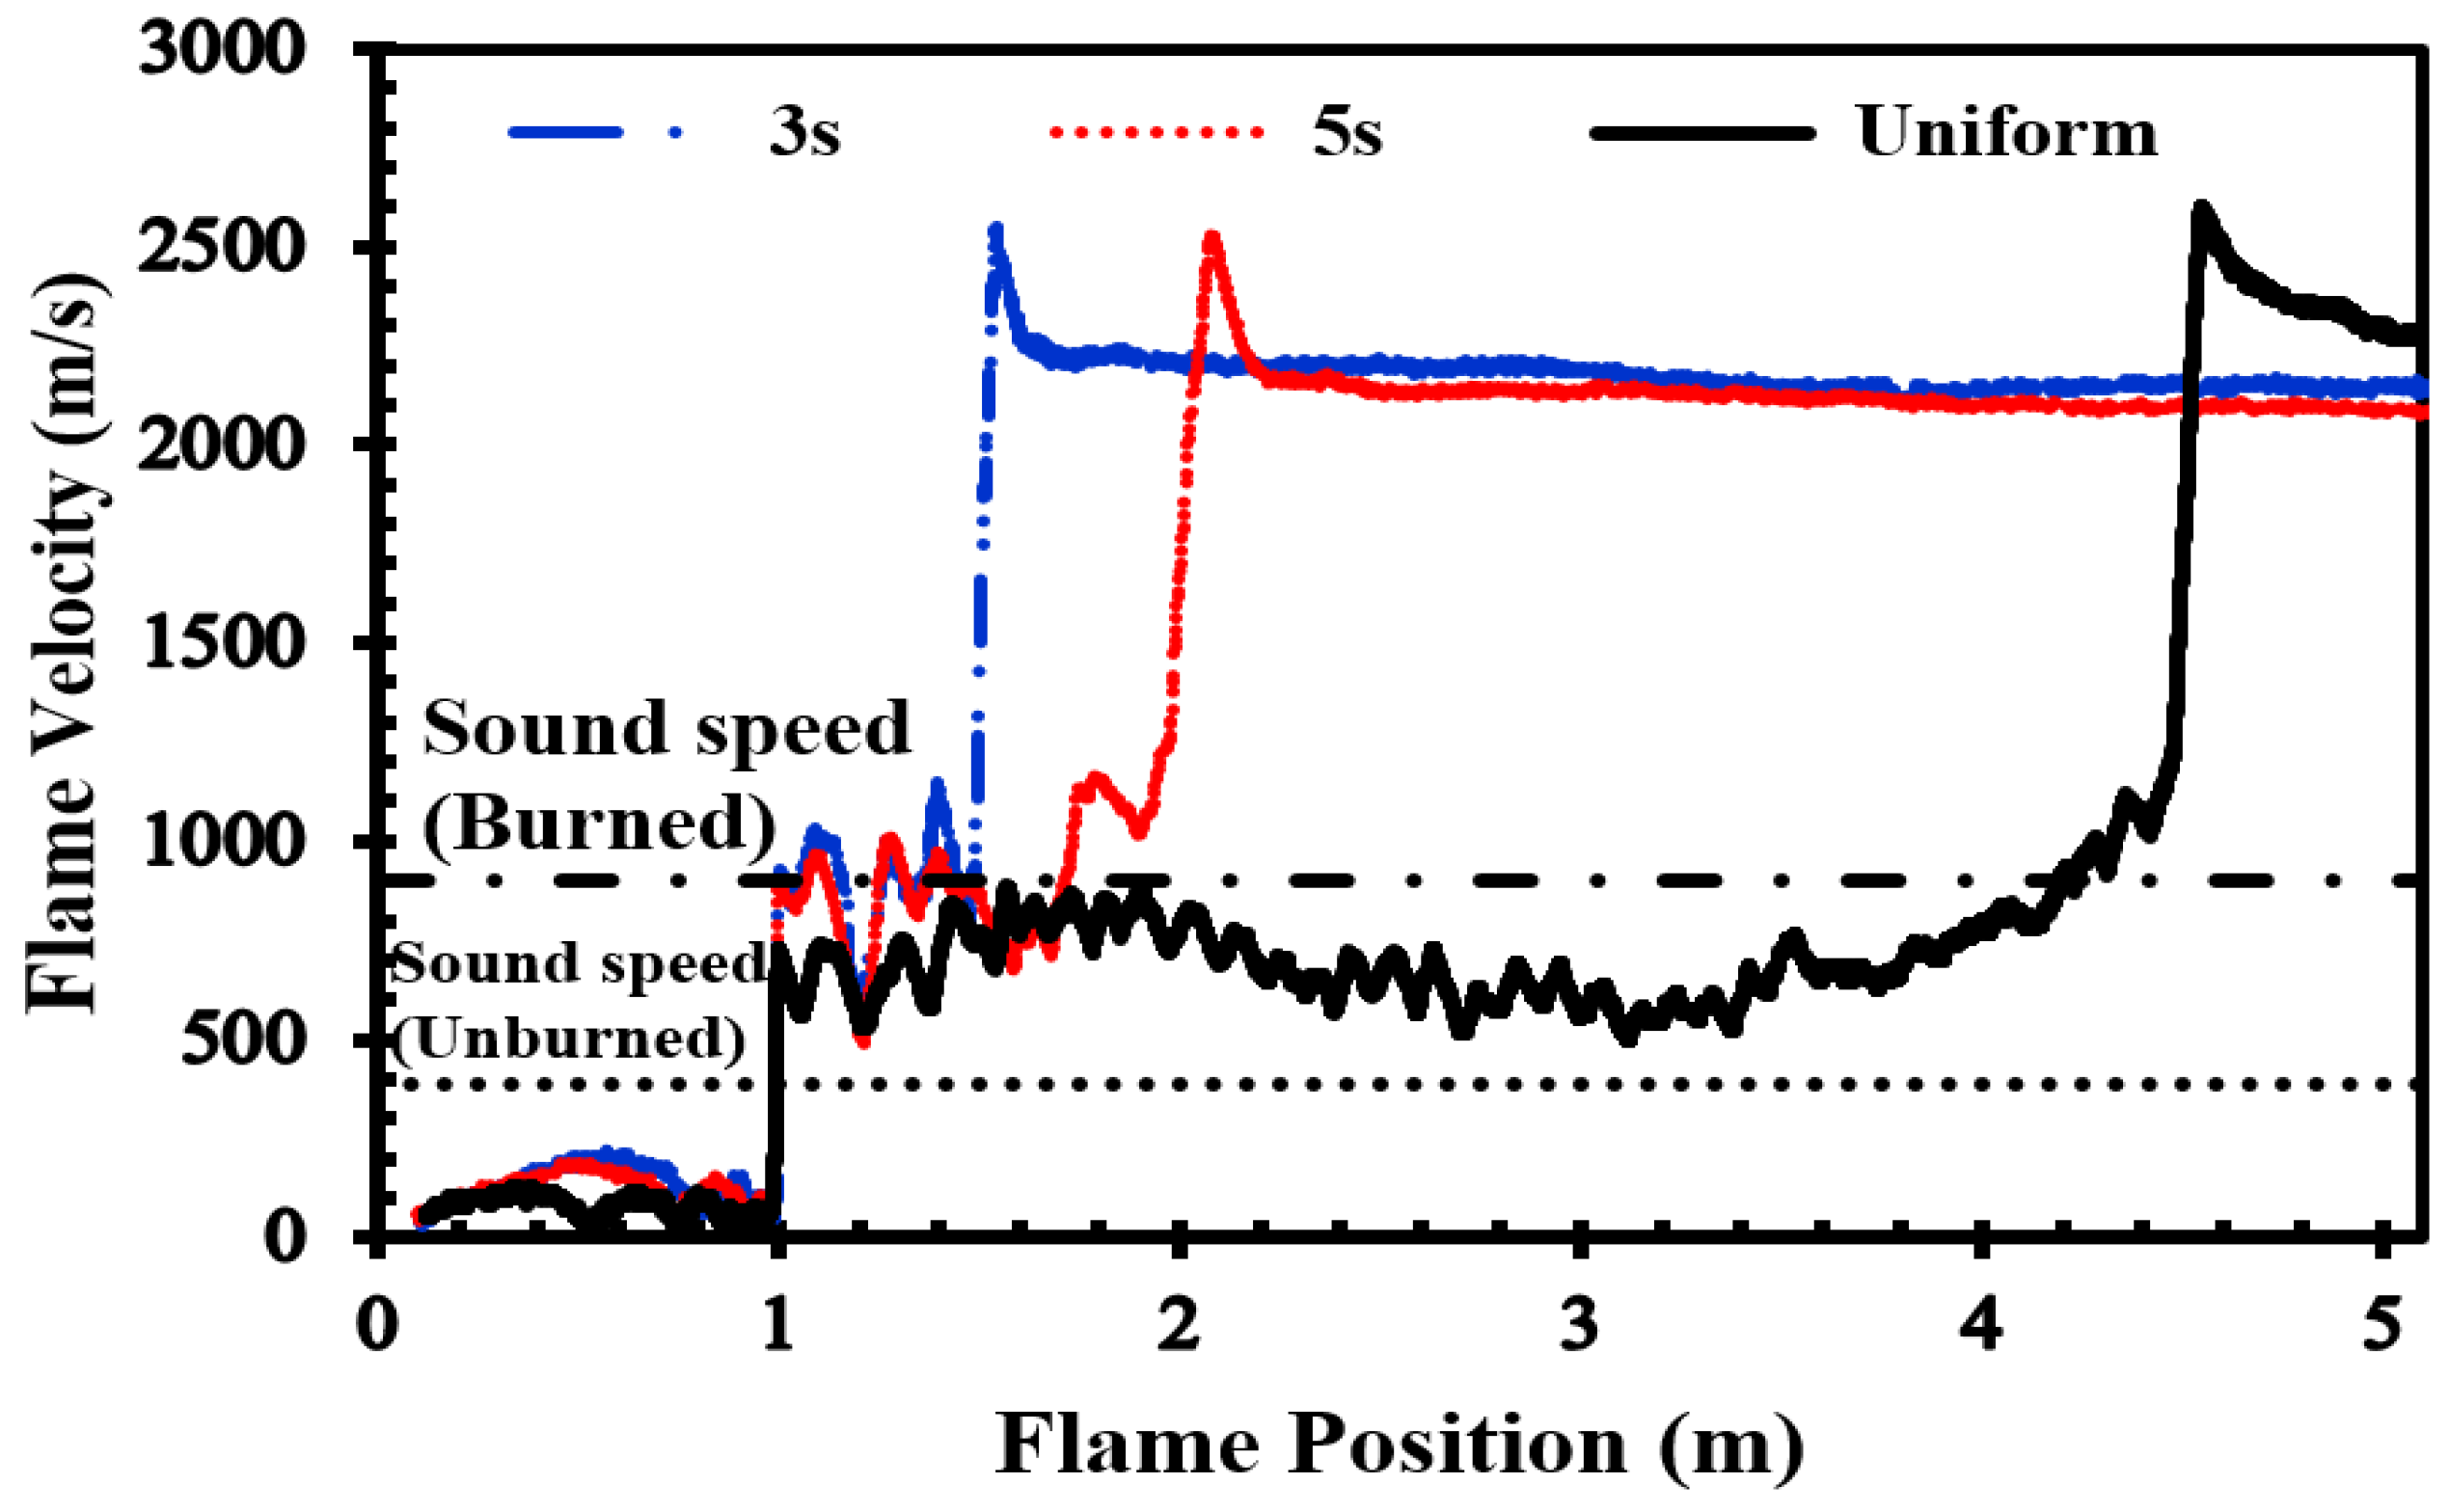
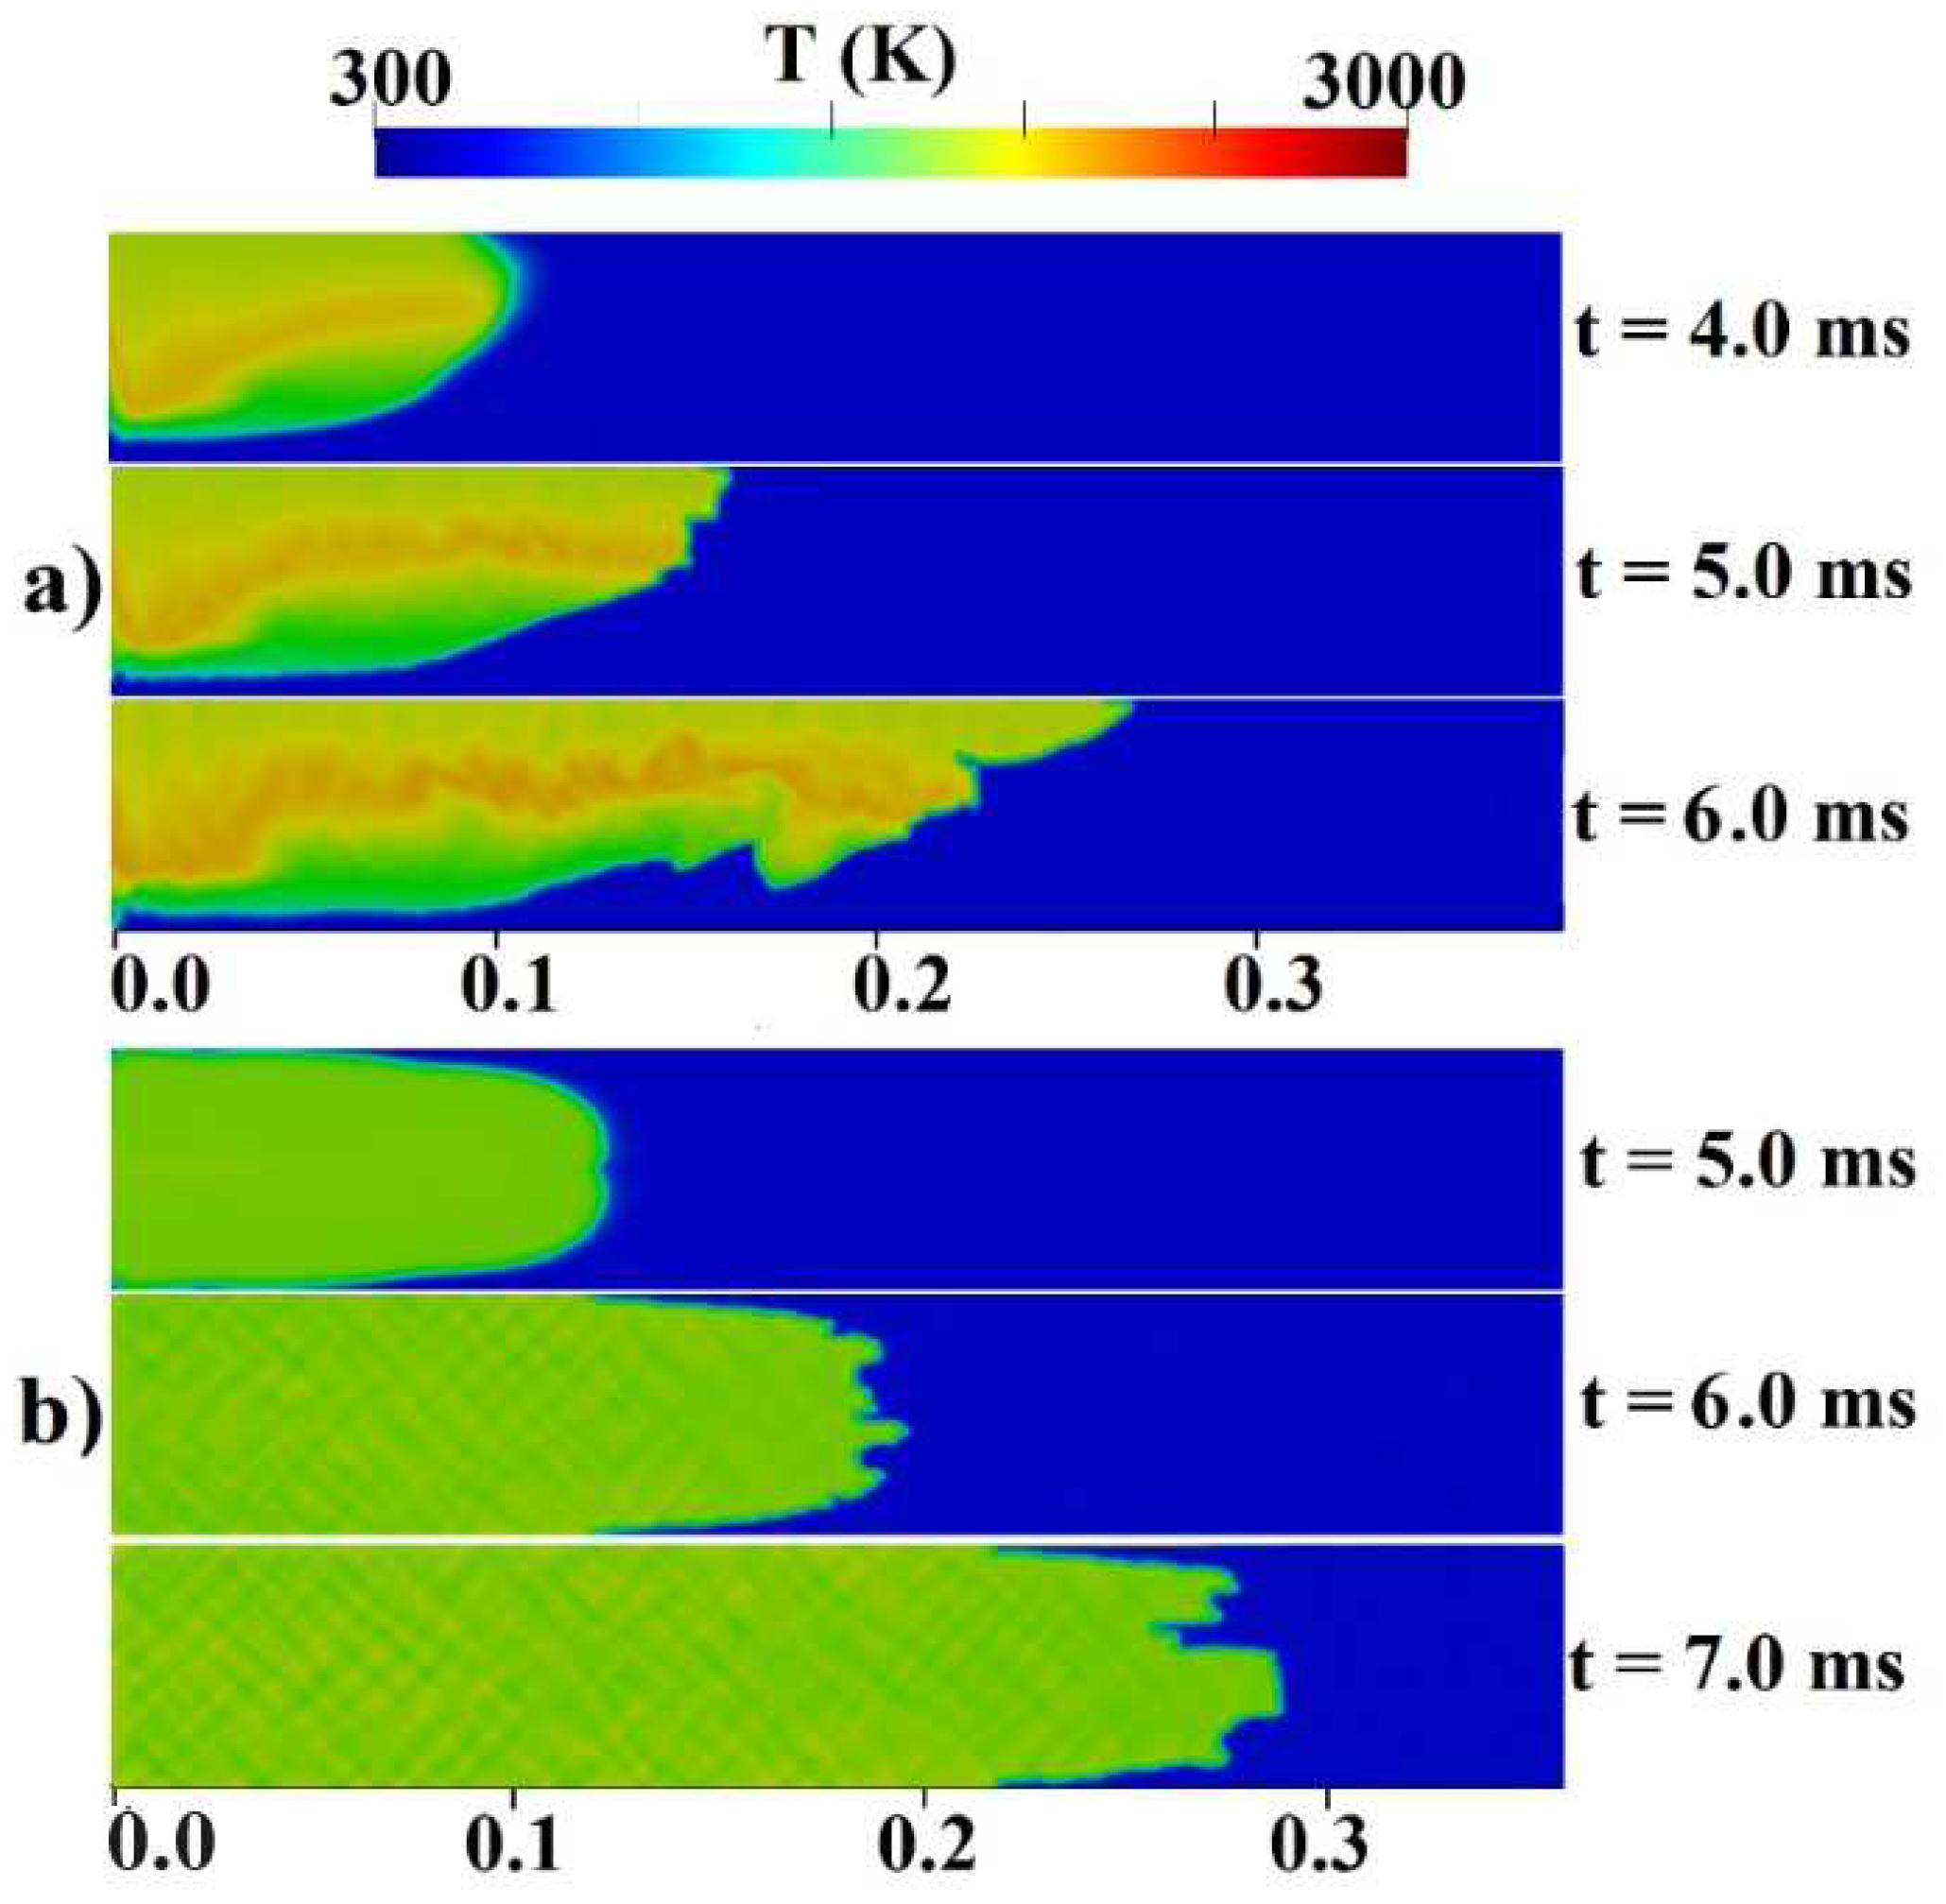
2-air mixture at an initial pressure of 1 atm and an initial temperature of 293 K. The vertical concentration gradient achieved depends on the diffusion time, which is defined as the time between the end of hydrogen injection and ignition. Gradients with a predetermined slope can be created by regulating the diffusion time (t
d) between H
2 injection and ignition.
Figure 2b provides an initial visualization of concentration gradients.
3.2. Mesh Sensitivity Analysis
To assess the sensitivity of the results to grid size, we generated three different computational grids in the GraVent facility [
36] (
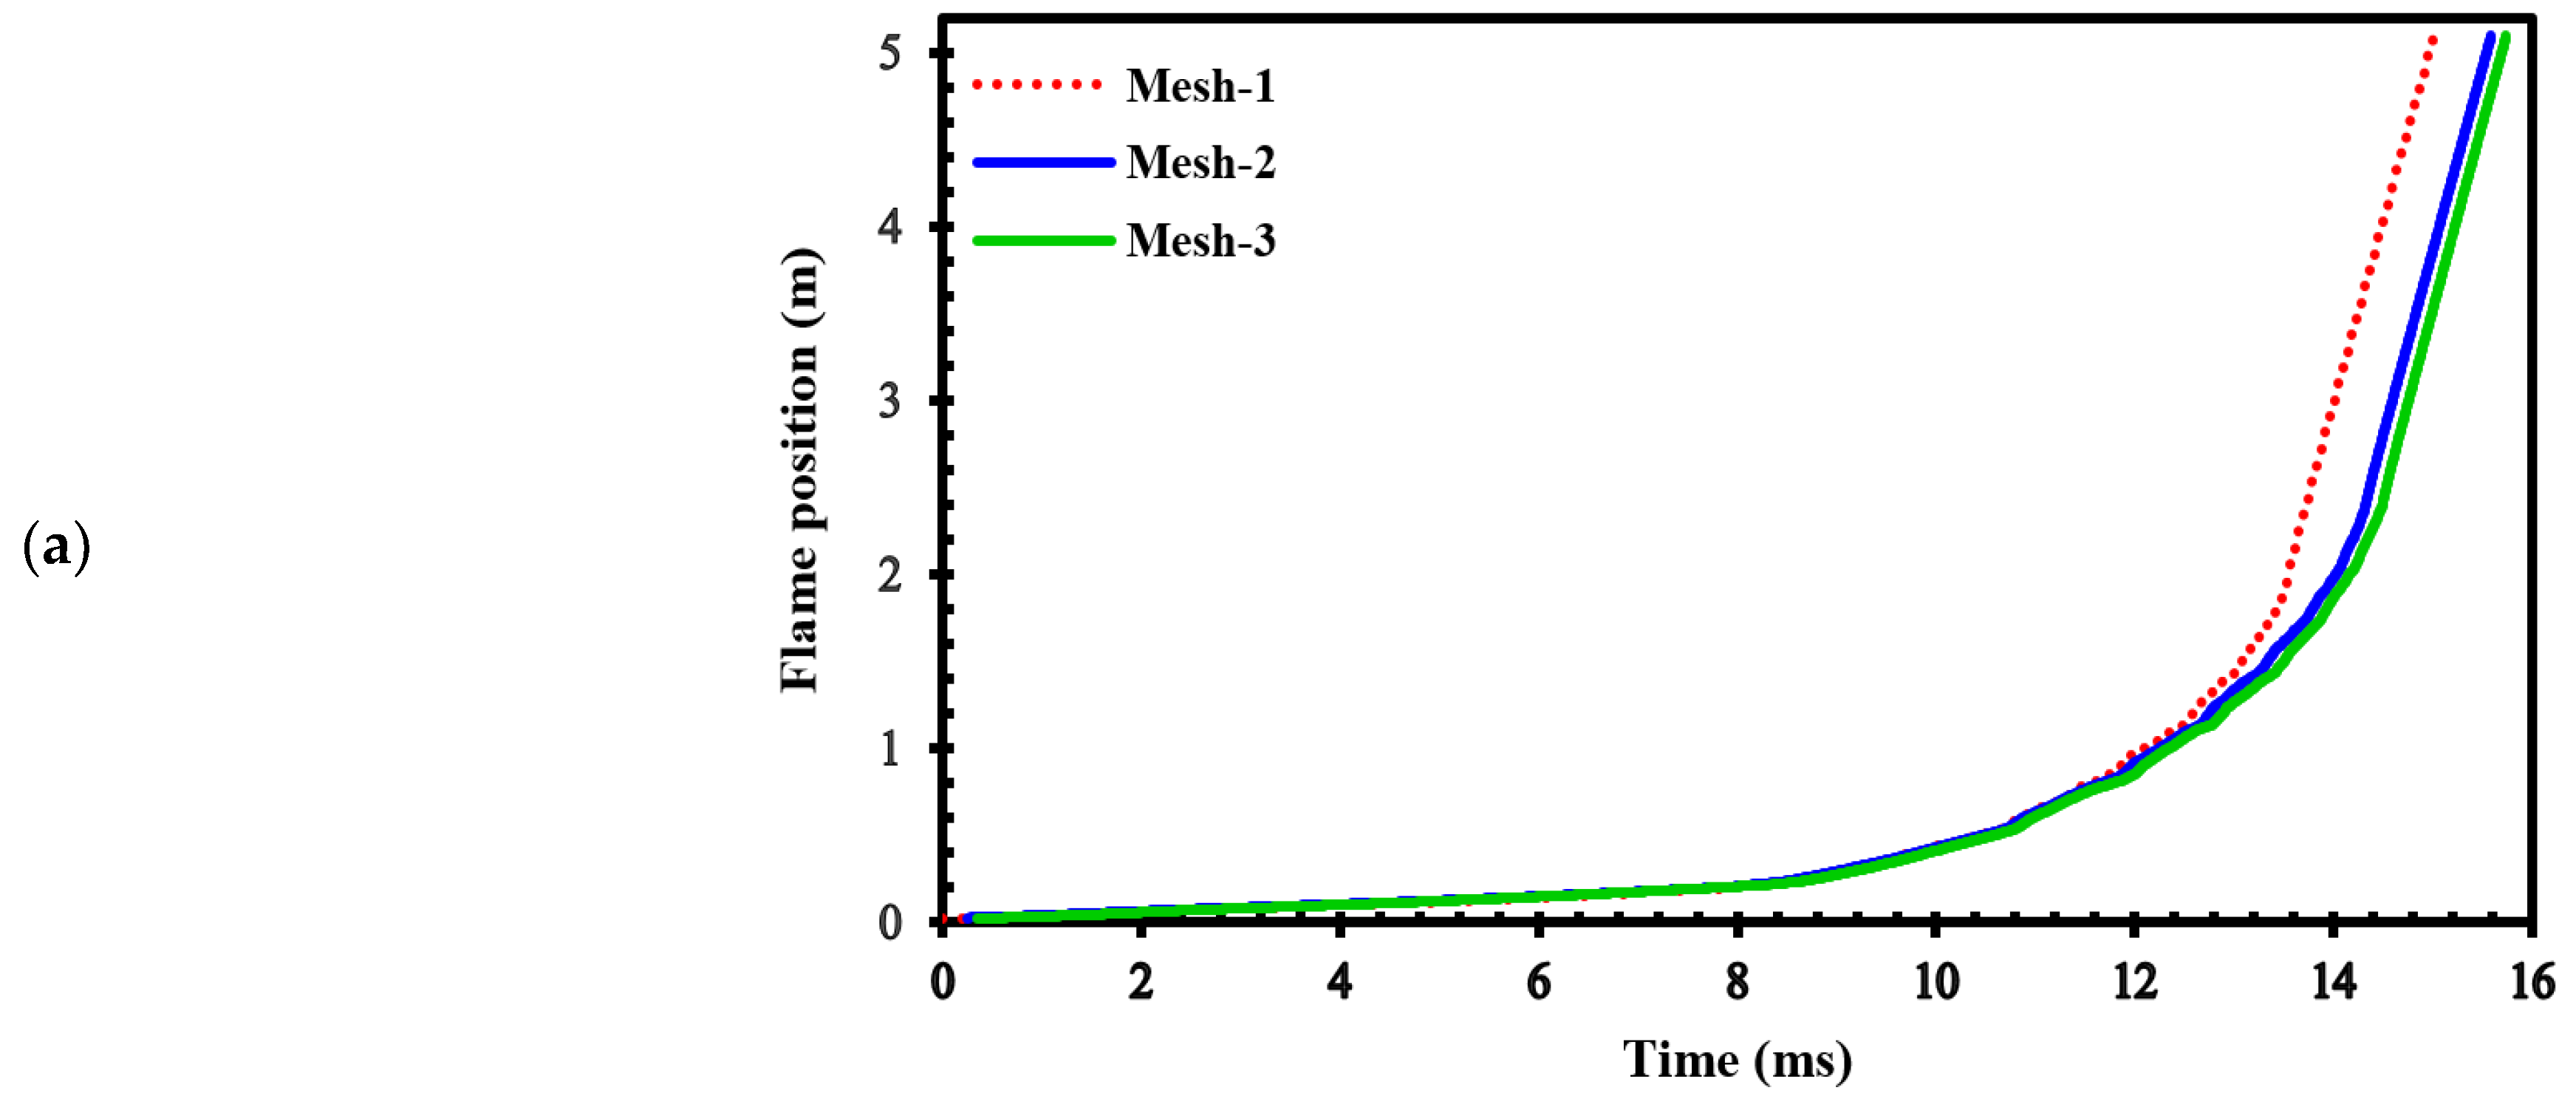
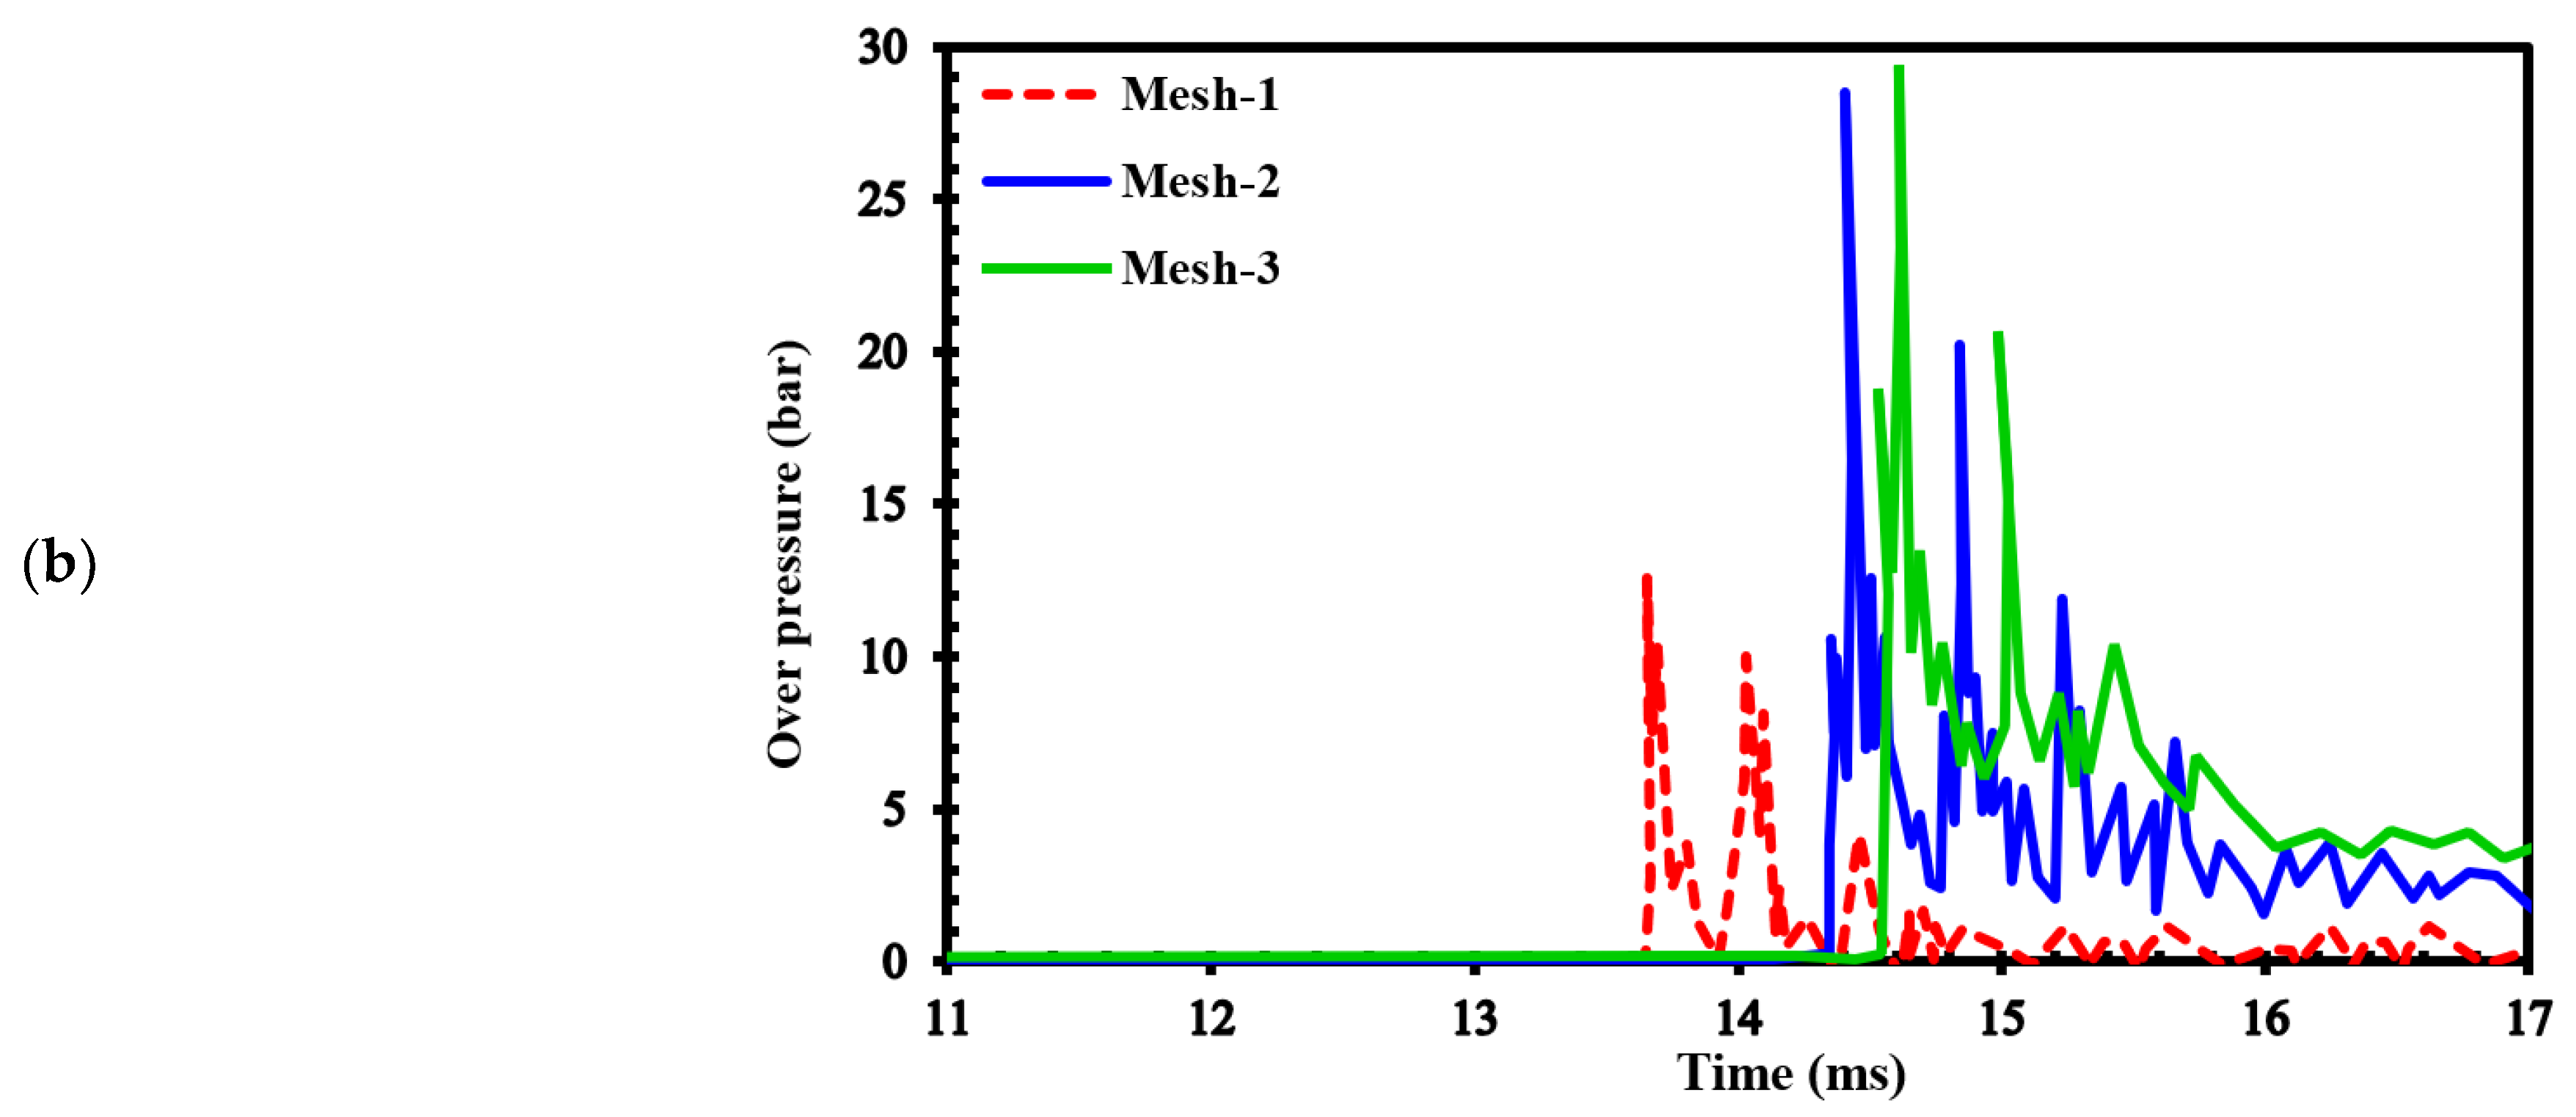
Figure 3) with cell sizes of 4 mm (mesh-1), 1 mm (mesh-2), and 0.5 mm (mesh-3).
Figure 4.a demonstrates the effects of different grids on the position of the flame front at different times. In
Figure 4b, the channel pressure history recorded at x = 2.4 m over time for these three grids are shown. These simulations were conducted using a stratified mixture of 20% hydrogen with diffusion time of 3 seconds. Notably, our analysis revealed no significant differences between cell sizes of 1 mm (mesh-2) and 0.5 mm (mesh-3).
To validate our current simulations, we compared our numerical results with the experimental observations conducted by Boeck et al. [
36] and those obtained by Karanam et al. [
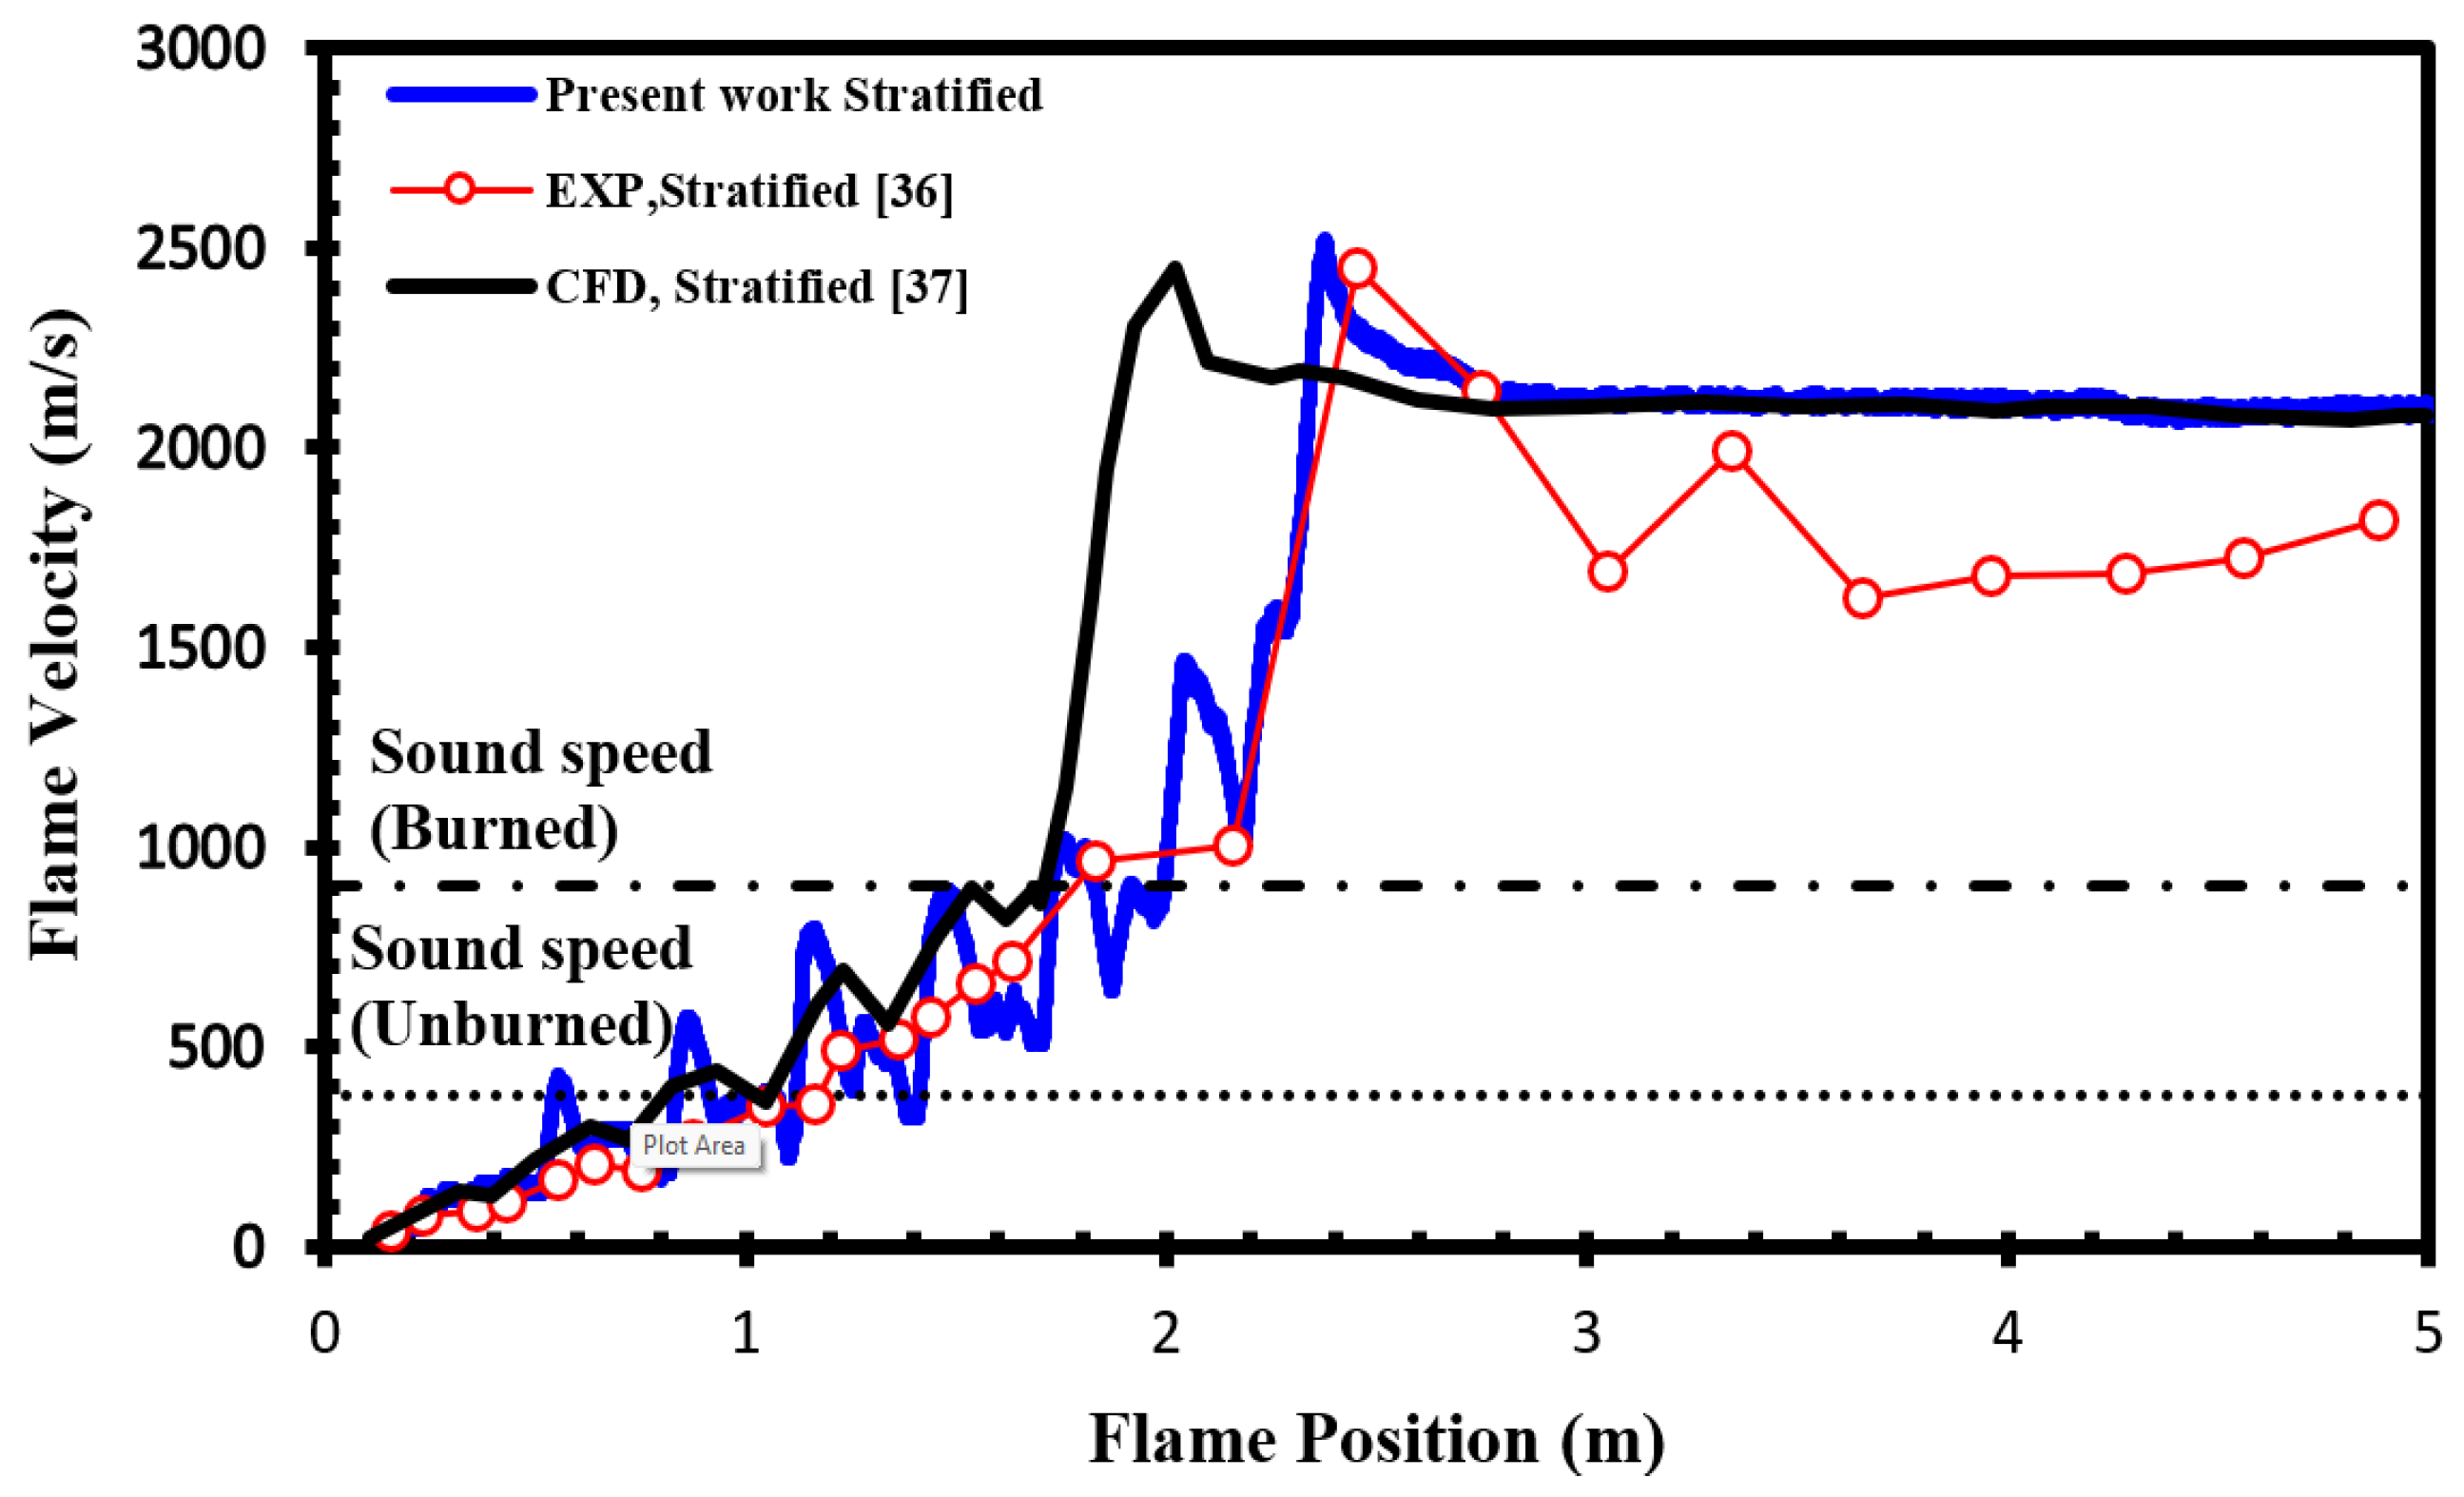
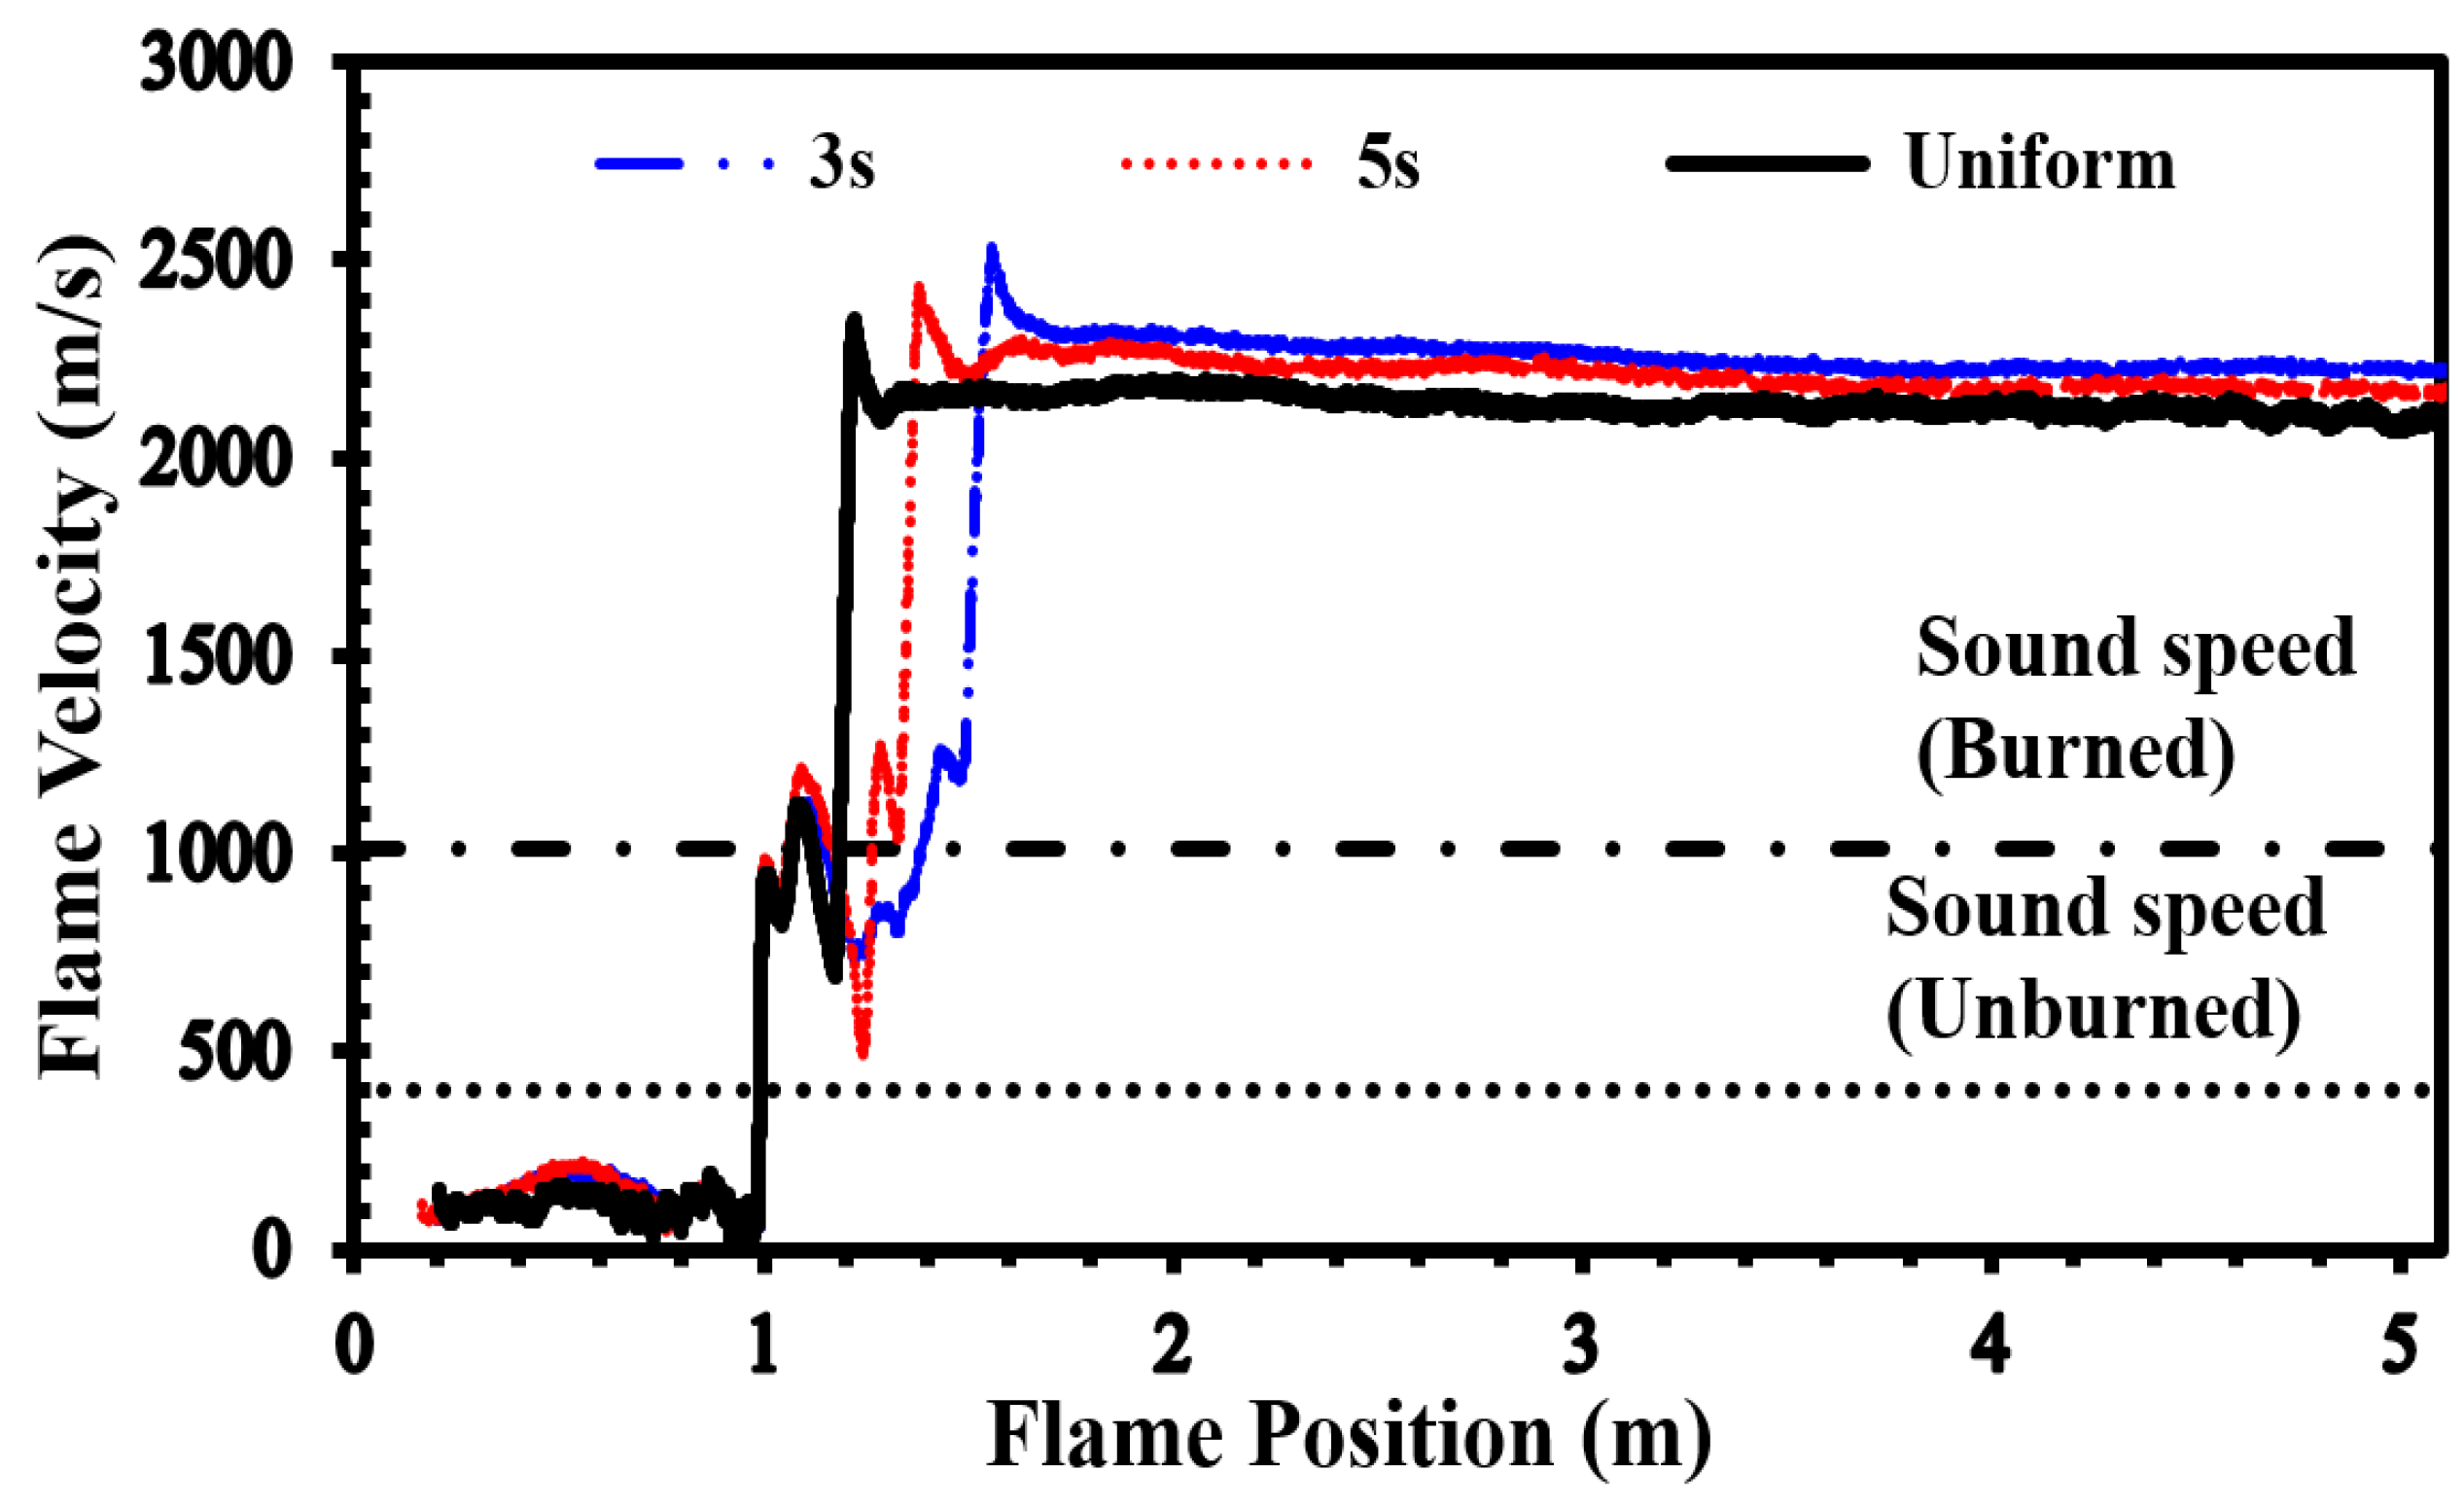
37] in the GraVent facility. The flame velocity, featuring a diffusion time of 3 seconds and an average hydrogen concentration of 20%, is depicted in
Figure 5. This graph demonstrates a strong agreement between the experimental observations and our simulation results, confirming the capability of our solver to accurately reproduce properties such as turbulent and laminar flame velocities, as well as the speed of unsteady detonation propagation in stratified mixtures.
3.3. Numerical Validation
In our simulations, we used a uniform structured grid within a 2D computational domain. The smallest cell size was set to 1 mm, following a similar methodology as the simulations carried out in the previous section and as described in the work by Saeid et al. [
28]. No-slip and adiabatic boundary conditions were imposed on the walls of the channel, and the spark zone was represented as a hot spherical region with a radius (R) of 25.4 mm, where the reaction progress variable reached 1, and the temperature reached 2440 K. Due to the absence of any existing simulation or experimental results for the channel shown in
Figure 2, we examined the channel depicted in
Figure 2 in its unobstructed state to validate the accuracy of our current simulations.
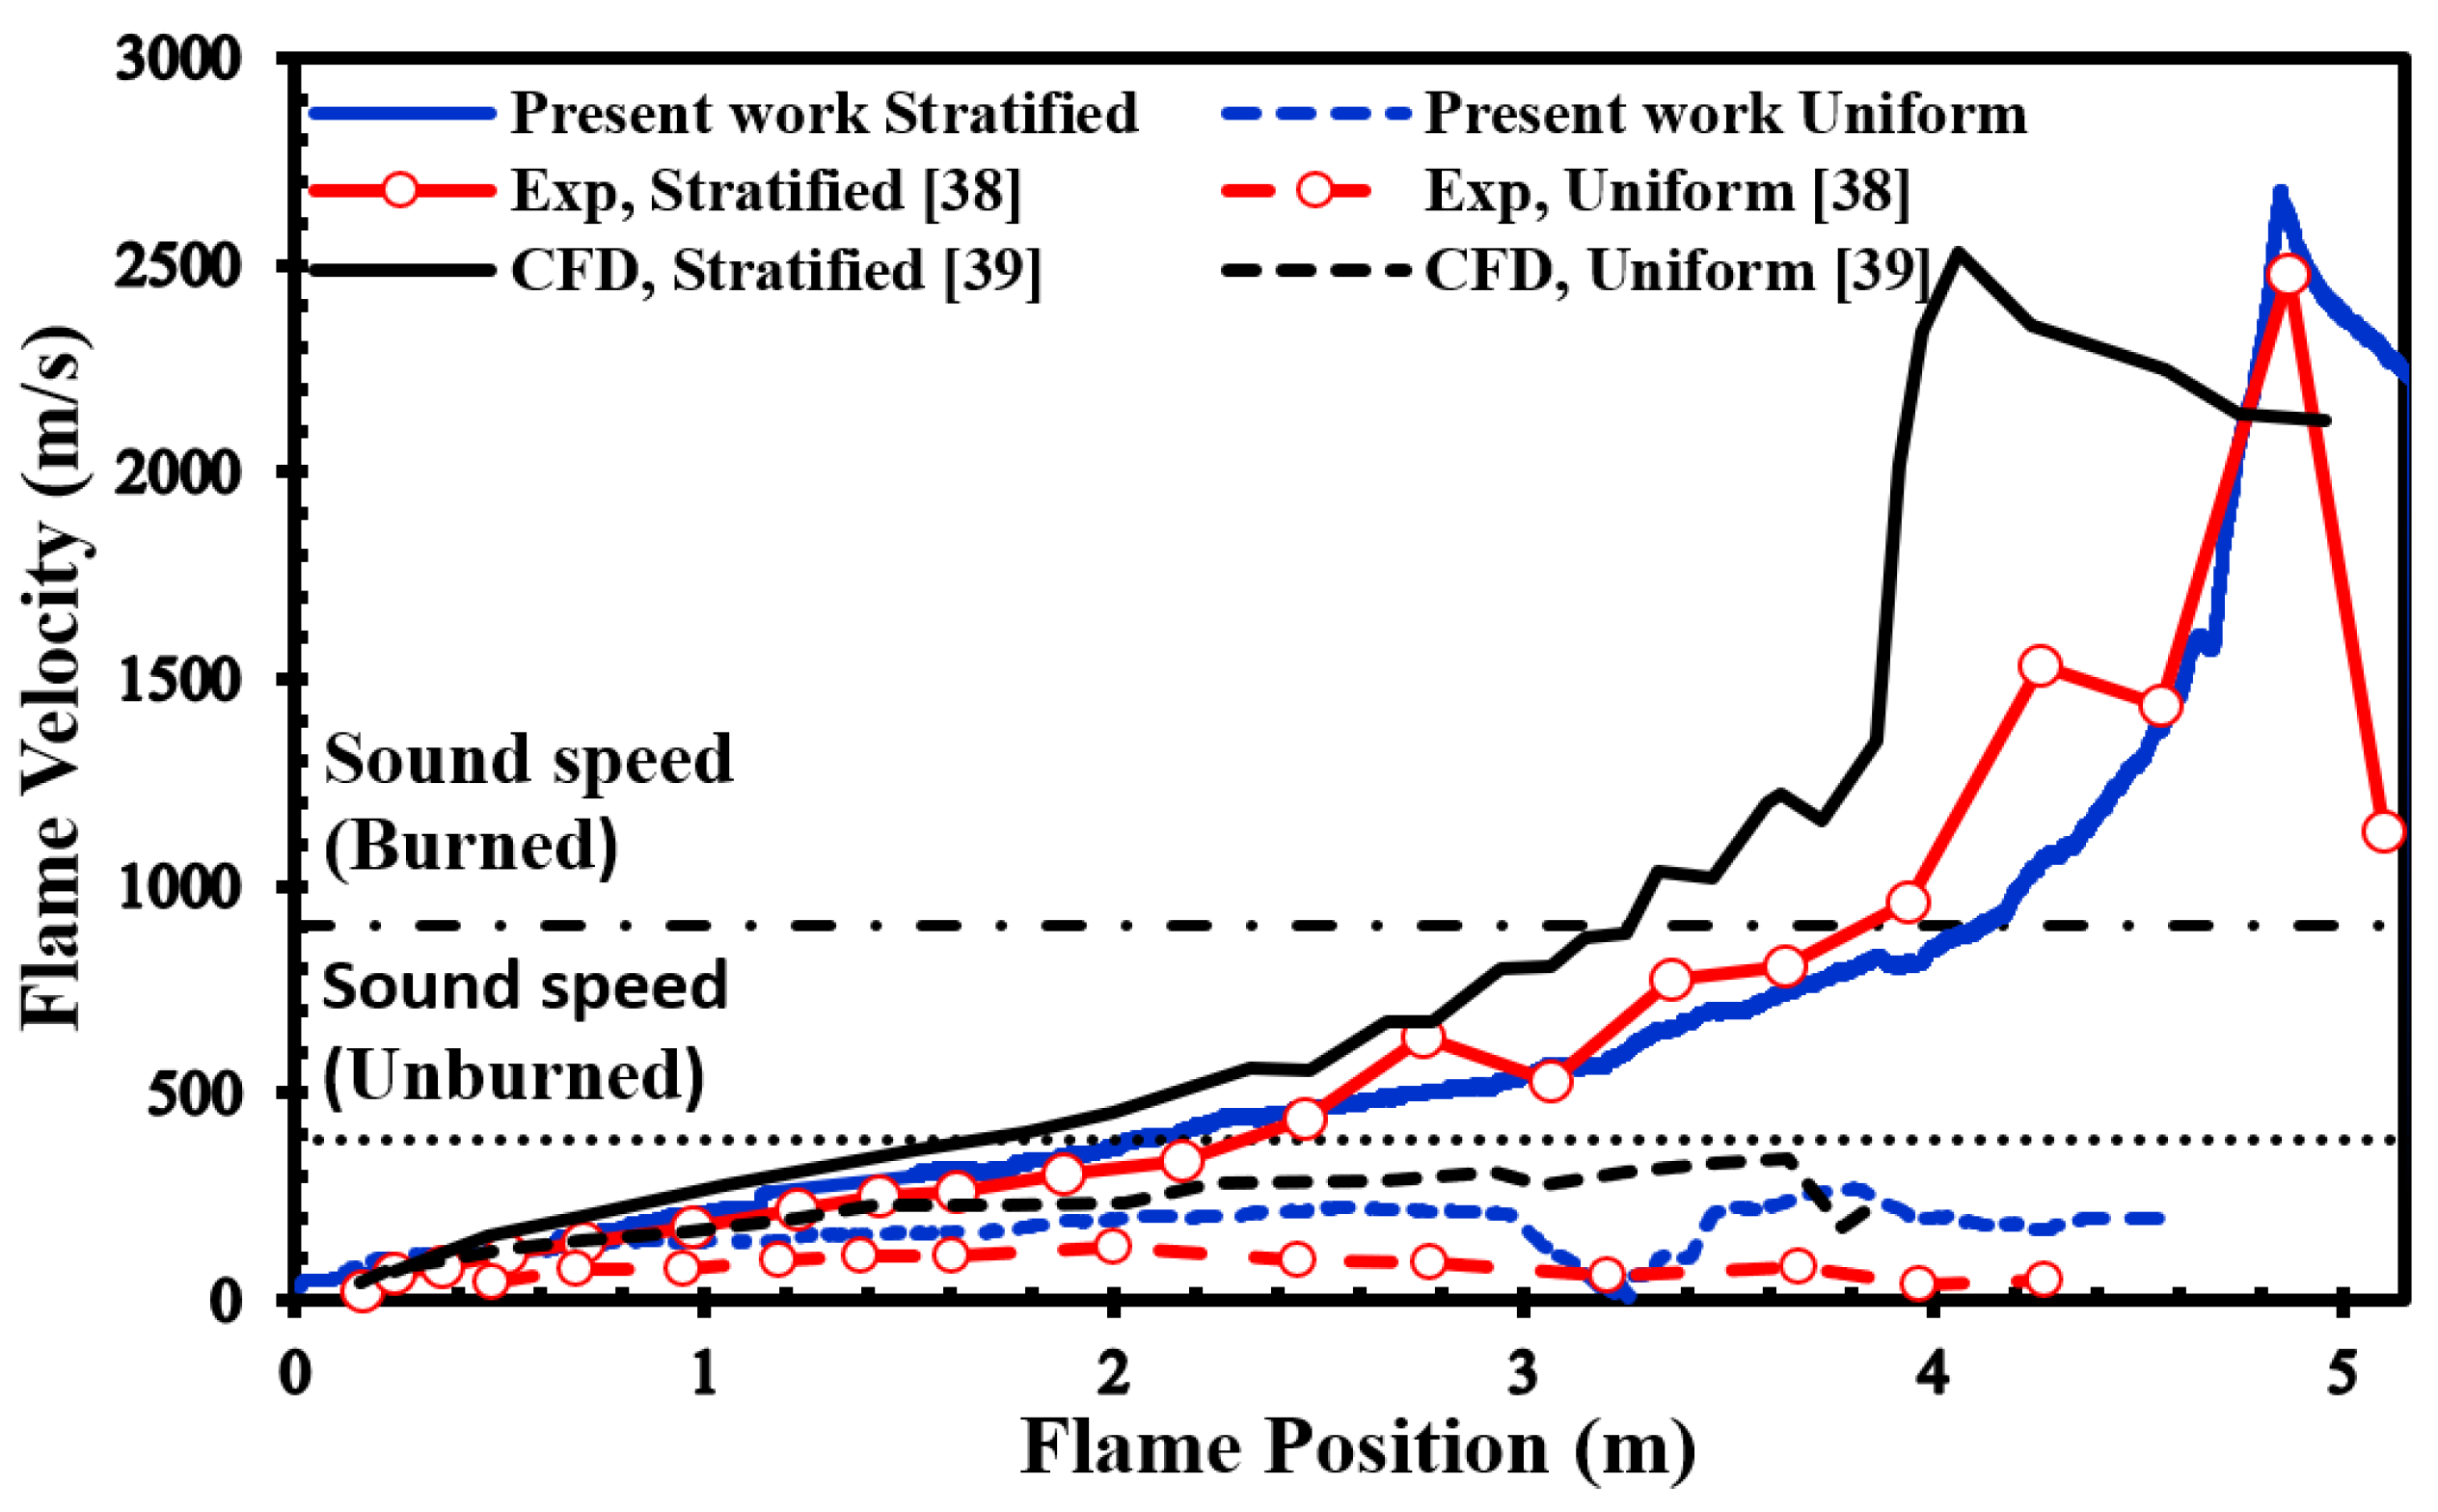
Figure 6 presents a comparison between our simulation results and the experimental data provided by Boeck et al. [
38]. Clearly, our numerical simulations closely match the overall trend observed in the experimental data. Furthermore, when we compare our results to those presented by Karanam et al. [
39], it becomes evident that our calculated results are in strong agreement with their outcomes. This collective evidence underscores the satisfactory performance of our model, yielding qualitatively acceptable results for simulating both deflagration and DDT phenomena.
Author Contributions
Conceptualization, M.h.S.S., J.K., S.E. and C.B.O.; methodology, J.K., S.E. and C.B.O.; software, M.h.S.S.; validation, M.h.S.S., J.K., S.E. and C.B.O.; formal analysis, J.K., S.E. and C.B.O.; investigation, M.h.S.S.; resources, J.K., S.E. and C.B.O.; data curation, J.K., S.E. and C.B.O.; writing—original draft preparation, M.h.S.S.; writing—review and editing, M.h.S.S., J.K., S.E. and C.B.O.; supervision, J.K., S.E. and C.B.O.; project administration, C.B.O.; funding acquisition, C.B.O. All authors have read and agreed to the published version of the manuscript.
