Preprint
Article

MethylRAD-Seq Technology Reveals DNA Methylation Charac-Teristics of Apostichopus japonicus of Different Ages

Altmetrics

Downloads

82

Views

35

Comments

0

A peer-reviewed article of this preprint also exists.

Submitted:

16 October 2023

Posted:

18 October 2023

You are already at the latest version

Alerts
Abstract
The A. japonicus industry has expanded significantly, but no research has focused on how to de-termine the age of A. japonicus during farming. Correctly estimating the age of A. japonicus can provide a decision-making basis for the breeding process, and data for the protection of A. japonicus aquatic germplasm resources. DNA methylation levels in the body wall of Apostichopus japonicus at 4 months, 1 year, 2 years, and 3 years old were determined by MethylRAD-Seq, and differentially methylated genes related to age were screened. The results of the study found that 441 and 966 differentially methylated genes were detected at CCGG and CCWGG sites, respectively. As-partate aminotransferase, succinate semialdehyde dehydrogenase, isocitrate dehydrogenase, the histone H2AX, heat shock protein Hsp90, aminopeptidase N, cell division cycle CDC6, Ras GTPase activating protein (RasGAP), slit guidance ligand slit 1, integrin linked kinase ILK, mechanistic target of rapamycin kinase Mtor, protein kinase A Pka, and autophagy-related 3 atg3 these genes may play key roles in the growth and aging process of A. japonicus. This study provided data for identifying the age of A. japonicus.
Keywords: 
Subject: Biology and Life Sciences  -   Agricultural Science and Agronomy

1. Introduction

Apostichopus japonicus, which belongs to the family Stichopodidae (class Holothuroidea; phylum Echinodermata), has significant economic and medicinal value [1]. The Fisheries Administration of the Ministry of Agriculture and Rural Affairs data show that the total production of A. japonicus in China increased from 197,000 tonnes in 2020 to 223,000 tonnes in 2021 [2]. The A. japonicus industry in China has expanded significantly, but no research has focused on how to determine the age of A. japonicus during farming. Correctly estimating the age of A. japonicus can provide a decision-making basis for the breeding process, assist in identifying developmental stages and breeding time, evaluate population resources, analyze population dynamics, and provide data for the protection of A. japonicus aquatic germplasm resources.
The age and variety of A. japonicus can often be determined by observing the appearance, gonad development, and bone fragments. Zhang et al. examined the varieties and shapes of bone fragments in A. japonicus at different ages and discovered that the proportion of bone fragments in the same tissue of A. japonicus was different at different ages [3]. Wang et al. observed the table shape of A. japonicus at different months old and discovered that the number of table holes in the chassis tended to decrease with age, and the outer margin of the table shape degenerated from uneven to smooth [4].
In fish, Venney et al. demonstrated that in Oncorhynchus tshawytscha, changes in DNA methylation were associated with genes, tissues, and age, and showed that decreases in DNA methylation with age and tissue-specific methylation patterns varied [5]. Anastasiadi et al. amplified 48 CpG sites from four genes in muscle samples of Dicentrarchus labrax for which the age was accurately determined by targeting the sodium bisulfite sequences. They then applied penalized regression to predict age and constructed a fish epigenetic clock [6]. Methylation is a significant epigenetic modification of eukaryotic genomic DNA, and it plays crucial roles in biological processes such as gene expression, embryonic development, cell differentiation, and gene imprinting [7,8]. High-throughput sequencing has been widely used in studies of aquatic animal development [9], disease [10], and age [11]. Using an optimized unique set of 26 CpG sites and a Daniorerio age prediction model based on DNA methylation, Mcgaughey et al. developed a multiplex PCR assay with a mean median absolute error rate of 3.2 weeks for age prediction [12]. Montesanto et al. determined an epigenetic clock of Chelonia mydas with a median absolute error of 2.1 years based on DNA methylation levels at 18 CpG sites [13]. De Paoli-Iseppi et al. used DNA methylation biomarkers to estimate the age of Ardenna tenuirostris and identified seven CpG sites where the DNA methylation levels correlated with age. Ages estimated using models constructed based on these correlations had an average difference of 2.8 years from known ages [14]. Although age prediction based on DNA methylation levels is a swiftly developing field of epigenetics, no studies using DNA methylation levels to determine the age of A. japonicus have been reported so far.
To gain a deeper understanding of differences between the DNA methylation levels of A. japonicus at different ages, we used MethylRAD-Seq to screen and identify differentially methylated genes, and Gene Ontology (GO) and Kyoto Encyclopedia of Genes and Genomes (KEGG) enrichment analysis to determine the functional relationships between these genes. Our results will provide a theoretical foundation for biological research and age determination of A. japonicus.

2. Materials and Methods

2.1. Experimental materials

Healthy 3-year-old (weight: 175.59 ± 34.38g) (A), 2-year-old (weight: 42.51 ± 19.33g) (B), 1-year-old (body weight: 5.19 ± 6.26g) (C), and 4-month-old (body weight: 1.72 ± 1.13g) (D)A. japonicus were cultivated at a key laboratory in March 2019, March 2020, March 2021, and December 2021 were collected. It grows in the same place: a 600L aquaculture pond with water that is 14 ± 1.5°C and has a salinity of 30 ± 1 and a pH of 7.0. The experiment will begin in March 2022. Six A. japonicus were picked randomly from each group, the body wall was removed, and the A. japonicus were snap-frozen in liquid nitrogen, and kept at -80°C.

2.2. Reagent preparation

The synthesized primers and linker dry powder were centrifuged at high speed at room temperature, suspended, and mixed with water to make a concentration of 100 Storage solution for µM. Prepare a linker working solution at a concentration of 5 µM and a primer at a concentration of 10 µM before the experiment, and store the above storage and working fluid are stored at − 20 ° C for later use.10% (wt/vol) APS (Sigma-Aldrich, cat. no. A3678) Take 1 g of APS and dissolve in a small amount of water for bandwidth evaluation to 10 ml. The solution can be stored at -20 ° C for 3-6Month.1% (wt/vol) agarose gel, weigh 0.4 g agarose, and dissolve in 40 ml 1x TAE buffer (Sigma-Aldrich, cat. no. T8280), heat until agarose is finished completely, wait for the solution to cool down to about 60 ° C, add 4 µl SYBR Safe DNA dye, shake well and pour in prior insertionPut it in the glue tank of a good comb at room temperature and use it after the glue solidifies. The agarose glue must be used and prepared now.8% (wt/vol) polyacrylamide gel, take 5.4 ml acrylamide (29:1), 4 ml 5x TBE (Sigma-Aldrich, cat. no. T3913), 280 µl 10% (Wt/vol) APS, 10 µl TEMED, 10.6 ml pure water, shake and mix, then pour into a pre-clamped rubber plate and insertGood comb, leave it at room temperature for at least 1 hour before use, 8% polyacrylamide gel must be used now.

2.3. MethylRAD experimental process

(1)
The enzyme digestion reaction system was as follows, a control group was set, and the reaction was performed at 37 ° C for 4 h.
(2)
5 µl of each control group and enzyme digestion group were detected by 1% (wt/vol) agarose gel electrophoresis, 100 V electrophoresis for 10 - 15 min, The effect of digestion was observed under ultraviolet light.
(3)
The linking reaction system is as follows, and the reaction conditions are: 4 ℃ connection for 6-8 h.
(4)
The PCR reaction system and conditions is as follows.
(5)
20 µl PCR product and 1 µl 100-bp DNA ladder were examined by electrophoresis with 8% polyacrylamide gel at 400V Swimming 35 mins
(6)
After electrophoresis, SYBR Safe DNA dye was used for 3 min to observe the brightness of the target band (100 bp).
(7)
Cut the desired strip and put it into a 1.5ml centrifuge tube, grind the glue with a grinding rod, add 30-40µl of pure water, and let it stand at 4°C 6-12 h.
(8)
PCR introduces the Barcode sequence and the PCR reaction system is as follows
(9)
Purify PCR products with QIAquick PCR Purification Kit, elute with 15 µl of pure water, and then determine with QubitQuantity. In general, the ideal concentration of purified products is 10 - 30 ng/µl.
(10)
If multiple libraries have been built, the libraries with different barcode numbers can be mixed according to the amount of sent measurement data, and finally mixed. The combined library concentration is more suitable at 5 - 10 ng/µl.
(11)
The mixed libraries were sequenced using the Illumina Novaseq PE150 sequencing platform.
Table 1. Enzyme digestion system
ingredient Volume (μl/single sample; digestion group) Volume (μl/single sample; control group)
DNA (1-200ng/μL) 1 1
10×cut smart buffer 1.5 1.5
30×Enzyme 0.5 0.5
activotor
FspEI (5U/μl) 0.8 0
Pure water 11.2 12
Total 15 15
Table 2. Enzyme digestion system and reaction conditions
ingredient Volume (μl/single sample)
enzyme digestion product 10
10× T4 ligase buffer 1
10 m M ATP 1
Adaptor 1 (5µM) 0.8
Adaptor 2 (5µM)l 0.8
T4 DNA ligase (400 U/µl) 2
Pure water 5.4
Total 20
Table 3. PCR reaction system and conditions
ingredient Volume (μl/single sample) Reaction conditions
Linked product 7 98℃ ,5s;
5×HF buffer 4 60℃ ,20s
10 Mm dNTP 0.6 72℃ ,10s
Primer 1 (10 µM ) 0.4 20 cycle
Primer 2 (10 µM ) 0.4
Phusion high-fidelity DNA polymerase (2 U/µl) 0.2
Pure water 7.4
Total 20
Table 4. PCR reaction system and conditions
ingredient Volume (μl) Reaction conditions
Linked product 6 98℃ ,5s;
5×HF buffer 4 60℃ ,20s
10 Mm dNTP 0.6 72℃ ,10s
10 μM Primer3 0.2 6 cycle
10 μM Index Primer 0.2
Phusion high-fidelity DNA polymerase (2 U/µl) 0.2
Pure water 8.8
Total 20
Table 5. Adaptors and primers used for MethylRAD library preparation.
Adaptors and primers Sequence (5’ to 3’)
Adap-1 sens ACACTCTTTCCCTACACGACGCTCTTCCGATCT
Adap-1 antisense NNNNAGATCGGAAGAGC(AminoC6)
Adap-2 sense GTGACTGGAGTTCAGACGTGTGCTCTTCCGATCT
Adap-2 antisense NNNNAGATCGGAAGAGC(AminoC6)
Primers
Primer1 ACACTCTTTCCCTACACGACGCT
Primer2 GTGACTGGAGTTCAGACGTGTGCT
Primer3 AATGATACGGCGACCACCGAGATCTACACTCTTTCCCTACACGACGCT
Index primer CAAGCAGAAGACGGCATACGAGATXXXXXXGTGACTGGAGTTCAGACGTGT

2.4. Data analysis process

(1)
Check the raw data obtained from sequencing for quality. If there are more than 15% low-quality bases or sequences with too many N bases in the acquired reads, they must be removed.
(2)
Align Enzyme Reads to the reference genome using the bowtie2(version 2.3.4.1) software (parameter settings: -M = 4, –v = 2, –r = 0) to identify reliable methylation sites;
(3)
Utilise SNPeff software (version: 4.1) to extract the UTR region based on the annotation information, followed by Bedtools software to determine the distribution of methylation sites in various gene elements in the sample [15,16];
(4)
Using the DESeq software, calculate the difference p value and difference multiple (Log2FC) of each site between the groups, combine the sequencing depth of each site in each sample, and compare the methylation levels between the two groups;
(5)
Screen the genes for which the difference between groups is p≦0.05 and |log2FC|>1 and organize their methylation level and annotation data;
(6)
GO and KEGG enrichment analysis of differential genes

3. Results

3.1. MethylRAD-Seq data and identification of A. japonicus DNA methylation sites

We performed MethylRAD-Seq of genomic DNA extracted from the body wall tissue of A. japonicus at 4 months, 1 year, 2 years, and 3 years old. We used a total of 12 tissue samples (3 samples from each of the age groups) and obtained a total of 280,422,936 reads; 130,276,536 (46.4%) of them were high-quality reads. The three samples of 3-year-old A. japonicus yielded 75,848,311 reads; 36,771,351 (48.48%) of them were high-quality reads. The three samples of 2-year-old A. japonicus yielded 62,579,986 reads; 32,326,130 (51.66%) of them were high-quality reads. The three samples of 1-year-old A. japonicus yielded 65,336,130 reads; 30,392,328 (46.52%) of them were high-quality reads. The three samples of 4-month-old A. japonicus yielded 76,656,509 reads; 30,786,727 (40.16%) of them were high-quality reads. See Table 6 for details. Identification and analysis of methylation sites of the enzyme-produced DNA fragments from the 12 tissue samples showed that the proportion of CCGG-type methylation sites was substantially higher than that of CCWGG-type methylation sites. The average numbers of CCGG methylation sites for the 3-, 2-, 1-year, and 4-month-old A. japonicus were 70,357, 80,375, 79,065, and 82,131, respectively. The average numbers of CCWGG methylation sites for the 3-, 2-, 1-year, and 4-month-old A. japonicus were 7,755, 11,379, 11,524, and 11,833, respectively.

3.2. Identification of differentially methylated genes

Genes were considered to be differentially methylated between the age groups when the p-value was ≤0.05 and the absolute value of log2fold change was >1. In the 3-year vs. 2-year comparison, we identified 209 (99 up-regulated, 110 down-regulated) and 120 (62 up-regulated, 58 down-regulated) differentially methylated genes at the CCGG and CCWGG sites, respectively. In the 3-year vs 1 year comparison, we identified 289 (160 up-regulated, 129 down-regulated) and 178 (96 up-regulated, 82 down-regulated) differentially methylated genes at the CCGG and CCWGG sites, respectively. In the 3-year vs 4 months comparison, we identified 304 (179 up-regulated, 125 down-regulated) and 134 (74 up-regulated, 60 down-regulated) differentially methylated genes at the CCGG and CCWGG sites, respectively. In the 2-year vs 1 year comparison, we identified 218 (117 up-regulated, 101 down-regulated) and 180 (91 up-regulated, 89 down-regulated) differentially methylated genes at the CCGG and CCWGG sites, respectively. In the 2-year vs 4 months comparison, we identified 225 (113 up-regulated, 112 down-regulated) and 196 (107 up-regulated, 89 down-regulated) differentially methylated genes at the CCGG and CCWGG sites, respectively. In the 1-year vs 4 months comparison, we identified 196 (86 up-regulated, 110 down-regulated) and 158 (75 up-regulated, 83 down-regulated) differentially methylated genes at the CCGG and CCWGG sites, respectively. The specific quantity and changes of these comparisons are shown in Figure 1. At the CCGG sites, the highest number of differentially methylated genes (304) was found in the 3 years vs 4 months comparison, and the lowest number (196) was found in the 1 year vs 4 months comparison. At the CCWGG sites, the highest number of differentially methylated genes (196) was found in the 2 year vs 4 months comparison, and the lowest number (120) was found in the 3 years vs 2 years comparison.

3.3. GO enrichment analysis of differentially methylated genes

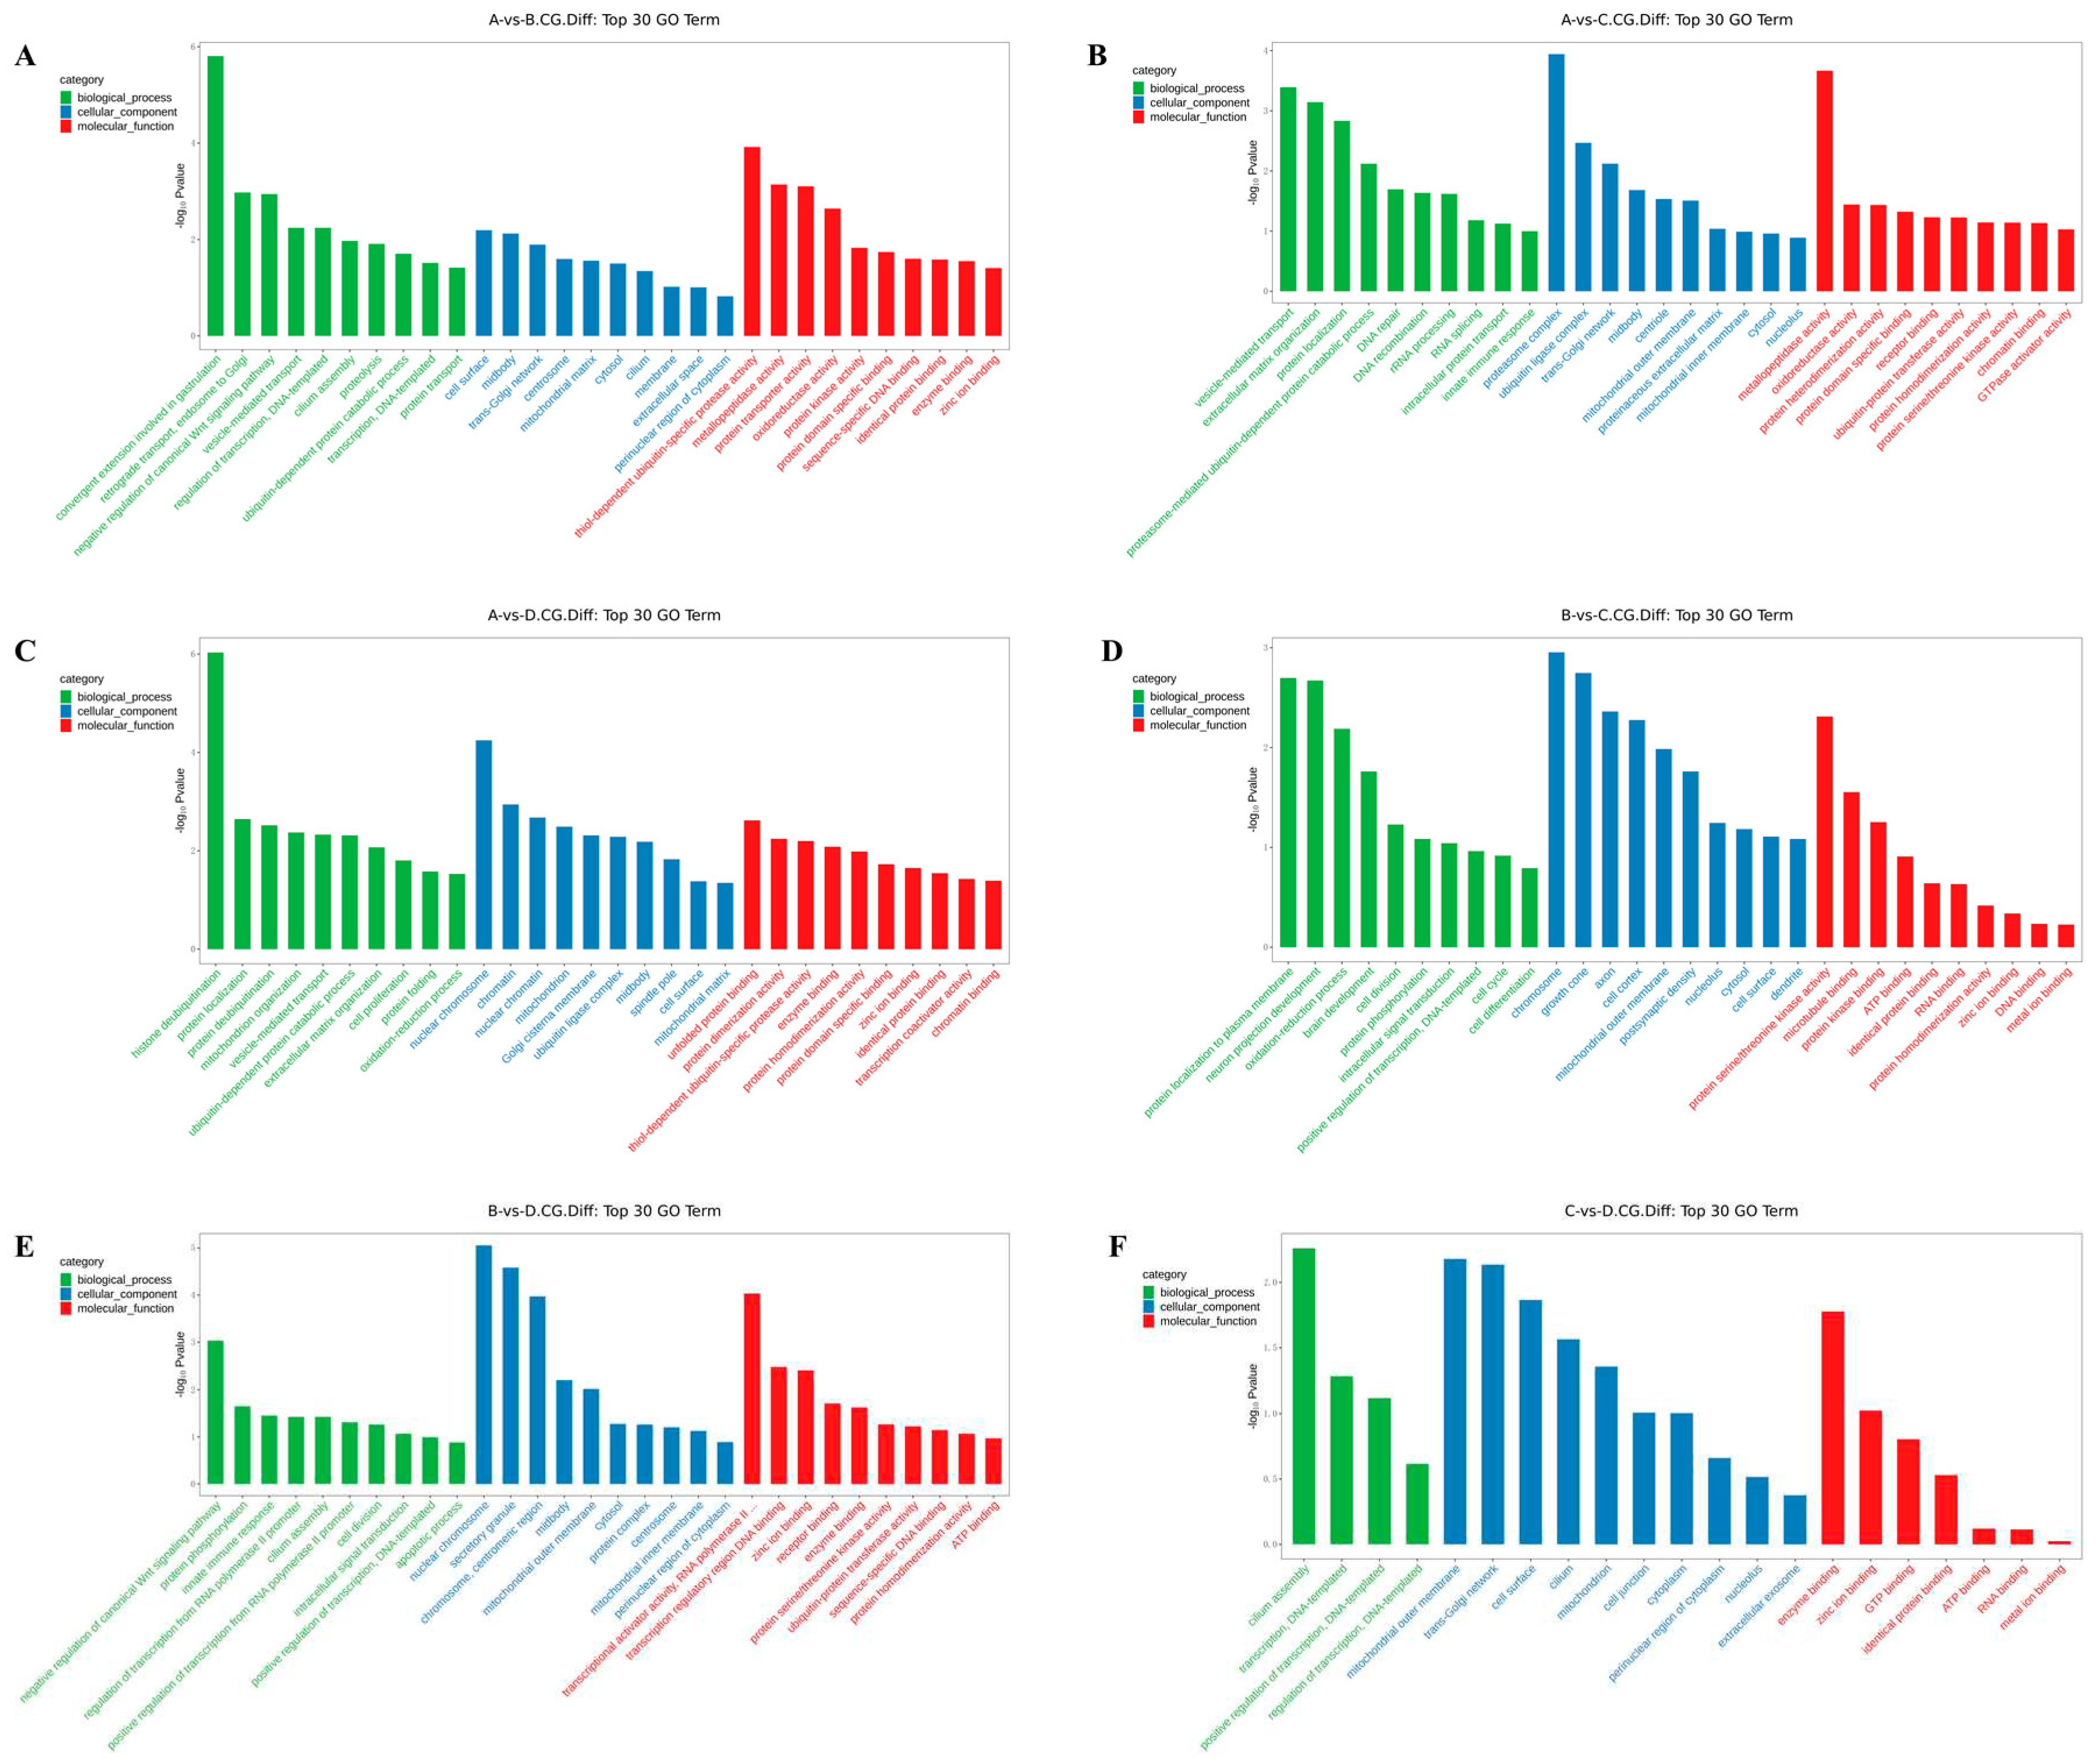
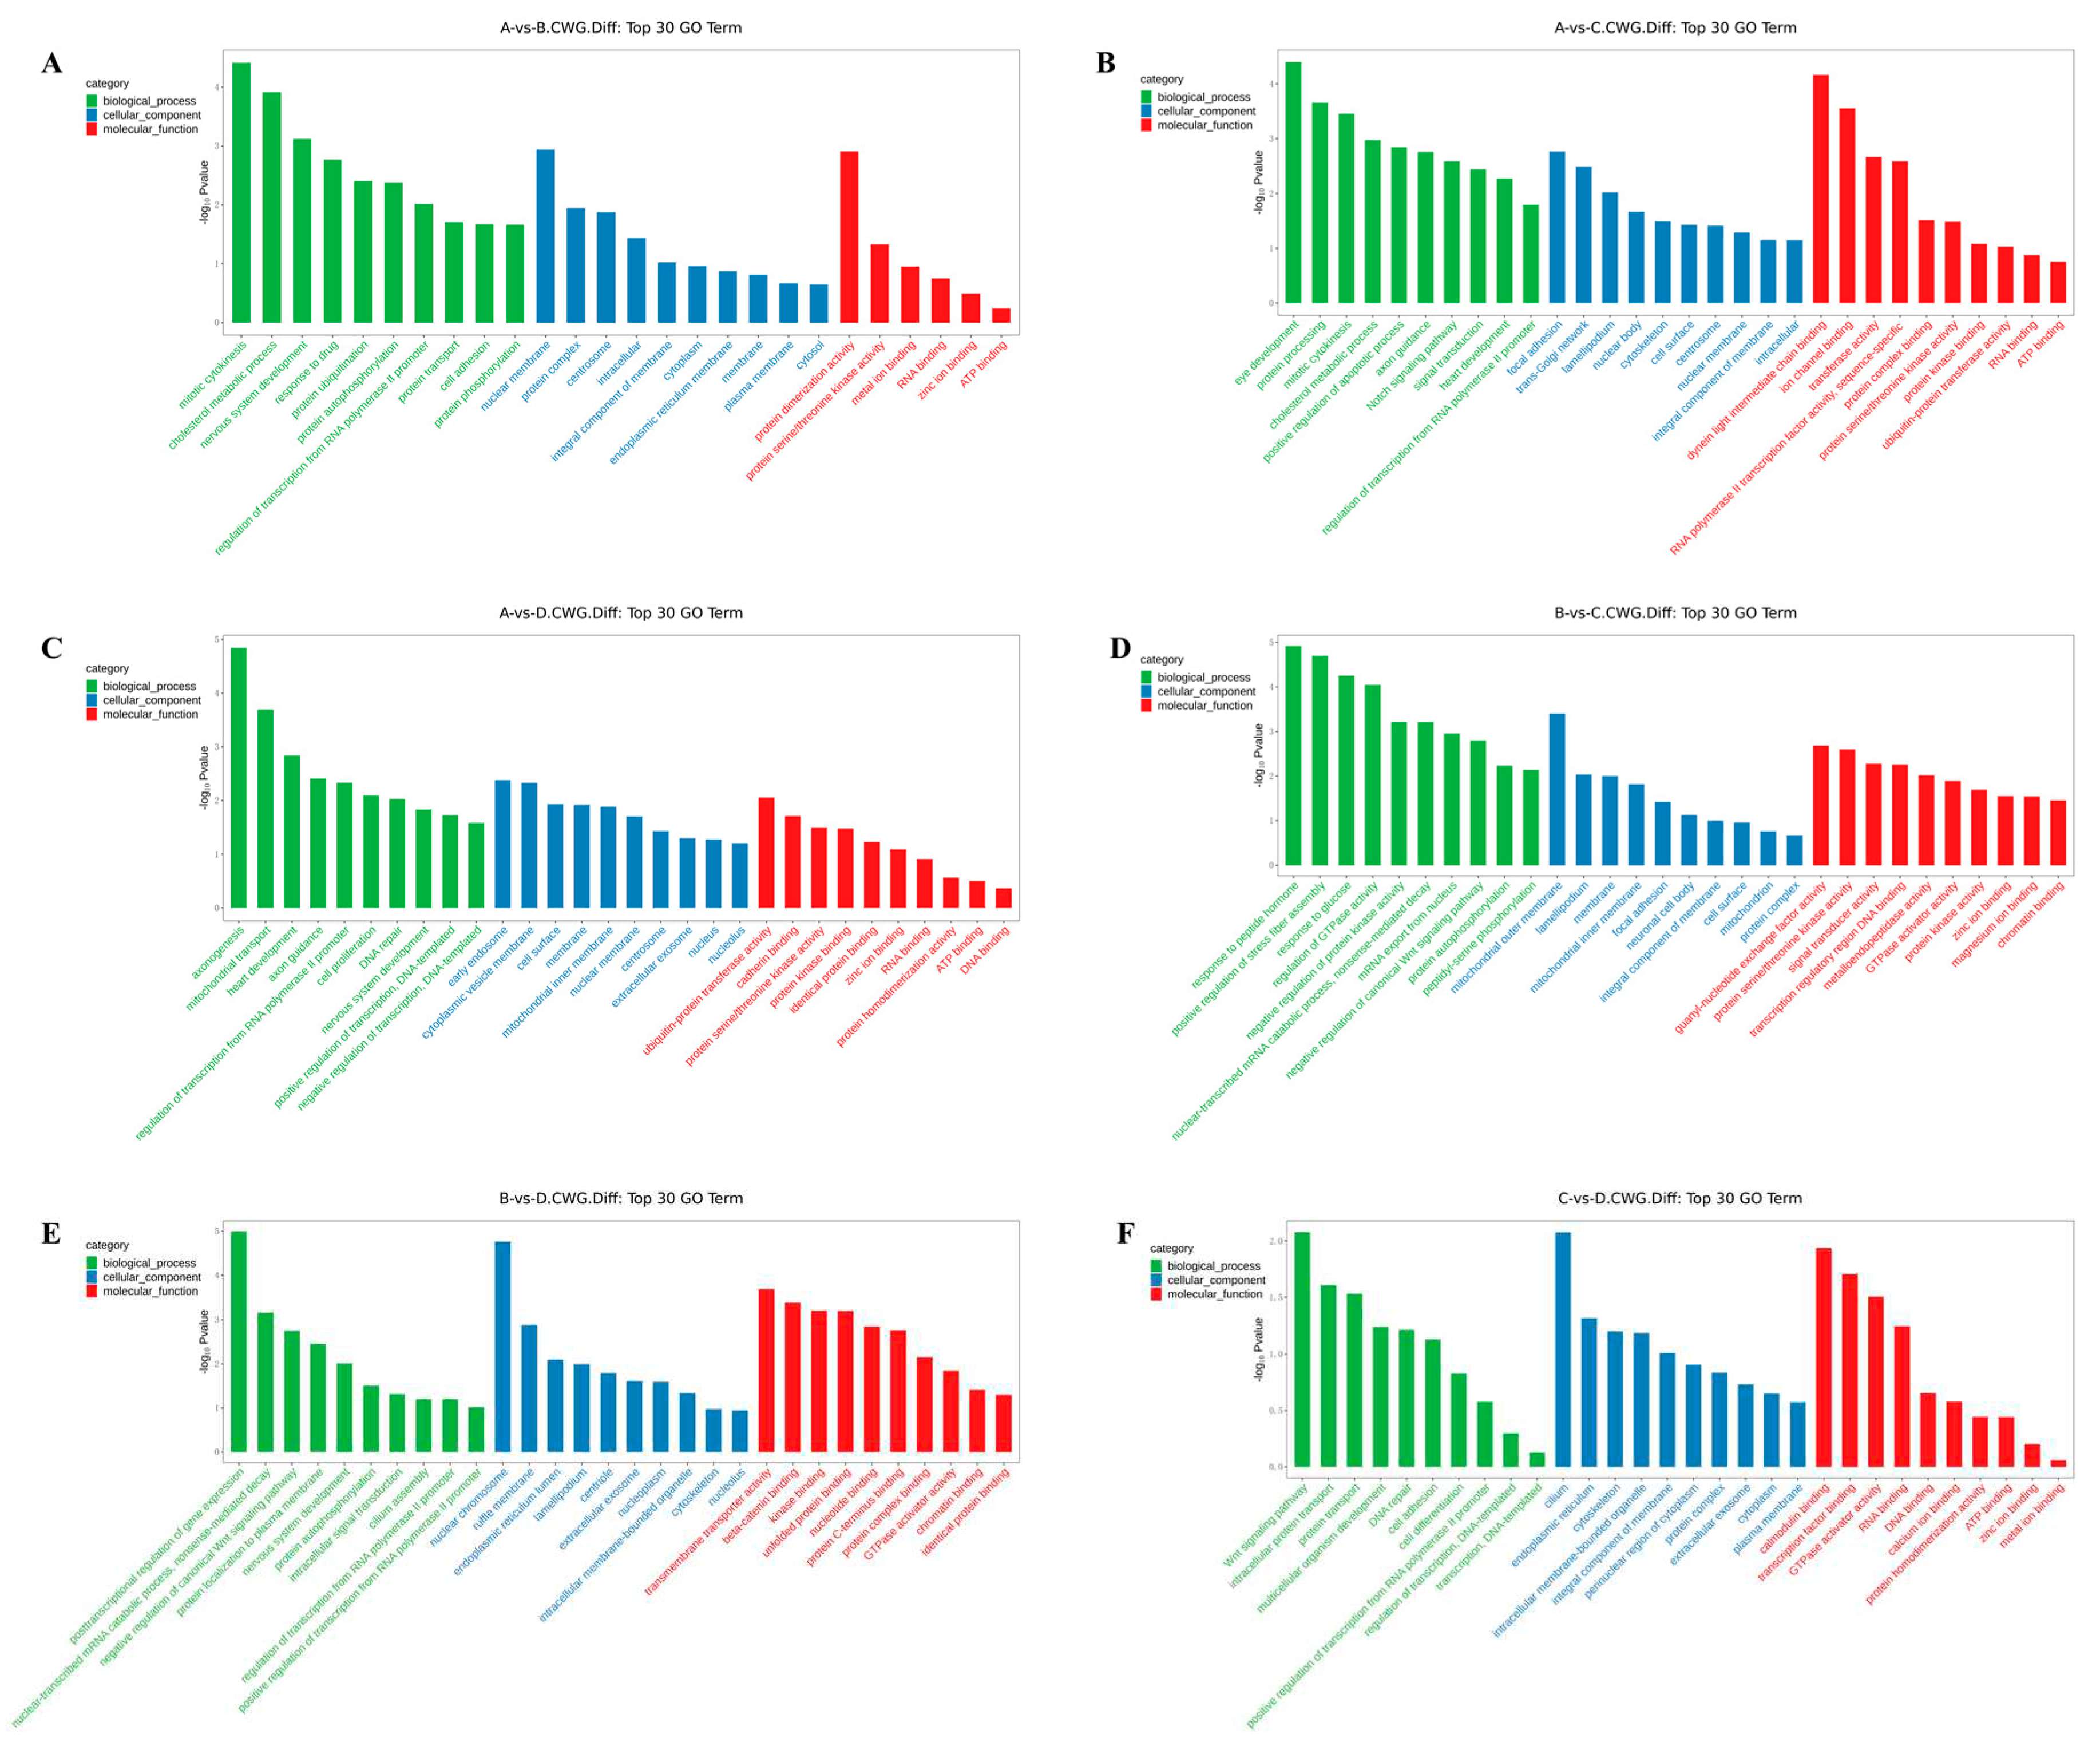
The differentially methylated genes identified in each of the comparisons were annotated with GO terms under the three main categories, biological process (BP), cellular component (CC), and molecular function (MF). The top ten enriched terms under each of the categories are displayed as bar charts (Figure 2 and Supplementary Document 1).
In the 3 years vs 2 years comparison, the differential methylation genes at CCGG sites were significantly enriched in the BP terms convergence extension and retrograde transport of gastrulation, endosome to Golgi, and negative regulation of typical Wnt signaling pathways; the CC terms cell surface, midsole, and trans-Golgi network; and the MF terms thiol-dependent ubiquitin-specific protease activity, metalloproteinase activity, and protein transporter activity. The differential methylation genes at CCWGG sites were significantly enriched in the BP terms mitotic cell division, cholesterol metabolism, and nervous system development; the CC terms nuclear membranes, protein complexes, and centrosomes; and the MF terms protein dimerization activity, protein serine/threonine kinase activity, and metal ion binding. The results are shown in Figure 2 and Figure 3A.
In the 3 years vs 1 year comparison, the differentially methylated genes at CCGG sites were significantly enriched in the BP terms vesicle-mediated transport, extracellular matrix organization, and protein localization; the CC terms proteasome complex, ubiquitin ligase complex, and trans-Golgi network; and the MF terms metalloproteinase activity, oxidoreductase activity, and protein heterodimerization activity. The differential methylation genes at CCWGG sites were significantly enriched in the BP terms eye development, protein processing, and mitotic cell division; the CC terms adhesion, trans-Golgi network, and plate-like pods; and the MF terms dynein light intermediate chain binding, ion channel binding, and transferase activity. The results are shown in Figure 2 and Figure 3B.
In the 3 years vs 4 months comparison, the differentially methylated genes at CCGG sites were significantly enriched in the BP terms histone deubiquitination, protein localization, and protein deubiquitination; the CC terms nuclear chromosomes, chromatin, and nuclear chromatin; and the MF terms unfolded protein binding, protein dimerization activity, and thiol-dependent ubiquitin-specific protease activity. The differentially methylated genes at CCWGG sites were significantly enriched in the BP terms axonogenesis, mitochondrial transport, and cardiac development; the CC terms early endosomes, cytoplasmic vesicle membranes, and cell surfaces; and the MF terms ubiquitin-protein transferase activity, cadherin binding, and protein serine/threonine kinase activity. The results are shown in Figure 2 and Figure 3C.
In the 2 years vs 1 year comparison, the differentially methylated genes at CCGG sites were significantly enriched in the BP terms protein localization to plasma membrane, nerve cell projection development, and redox process; the CC terms chromosomes, growth cones, and axons; and the MF terms protein serine/threonine kinase activity, microtubule binding, and protein kinase binding. The differentially methylated genes at CCWGG sites were significantly enriched in the BP terms response to peptide hormones, forward regulation of stress fiber assembly, and response to glucose; the CC terms outer mitochondrial membrane, plate-shaped pods, and membranes; and the MF terms ornithine-nucleotide exchange factor activity, protein serine/threonine kinase activity, and signal sensor activity. The results are shown in Figure 2 and Figure 3D.
In the 2 years vs 4 months comparison, the differentially methylated genes at CCGG sites were significantly enriched in the BP terms negative regulation of typical Wnt signaling pathways, protein phosphorylation, and innate immune response; the CC terms nuclear chromosomes, secretory granules, chromosomes, and centromere regions; and the MF terms transcriptional activation activity, RNA polymerase II, transcriptional regulatory region sequence-specific DNA binding, transcription regulatory region DNA junction, and zinc ion binding. The differentially methylated genes at CCWGG sites were significantly enriched in the BP terms post-transcriptional regulation of gene expression, nuclear transcription mRNA catabolism, senseless-mediated decay, and negative regulation of the typical Wnt signaling pathway; the CC terms nuclear chromosomes, ruffle membranes, and endoplasmic reticulum cavity; and the MF terms transmembrane transporter activity, β-catenin binding, and kinase binding. The results are shown in Figure 2 and Figure 3E.
In the 1 year vs 4 months comparison, the differentially methylated genes at CCGG sites were significantly enriched in the BP terms cilia components, transcription, DNA templating, forward regulation of transcription, and DNA templating; the CC terms mitochondrial outer membrane, transGolgi network, and cell surface; and the MF terms enzyme binding, zinc ion binding, and GTP binding. The differentially methylated genes at CCWGG sites were significantly enriched in the BP terms ciliary components, transcription, DNA templating, forward regulation of transcription, and DNA templating; the CC terms cilia, endoplasmic reticulum, and cytoskeleton; and the MF terms calmodulin binding, transcription factor binding, and GTPase activator activity.
These results show that differentially methylated genes were involved in various essential biological processes, including negative regulation of the typical Wnt signaling pathway, protein localization, and mitotic cell division, as well as with various cellular components, including trans-Golgi network, centrosome, nuclear chromosome, mitochondrial outer membrane, cell surface, and plate viburnum. The differentially methylated genes were also involved in multiple molecular functions, including thiol-dependent ubiquitin-specific protease activity, metalloprotease activity, protein dimerization activity, protein serine/threonine kinase activity, and zinc ion binding. The results are shown in Figure 2 and Figure 3F.

3.4. KEGG enrichment analysis of differentially methylated genes

The differentially methylated genes identified in each of the comparisons were annotated with KEGG pathways.
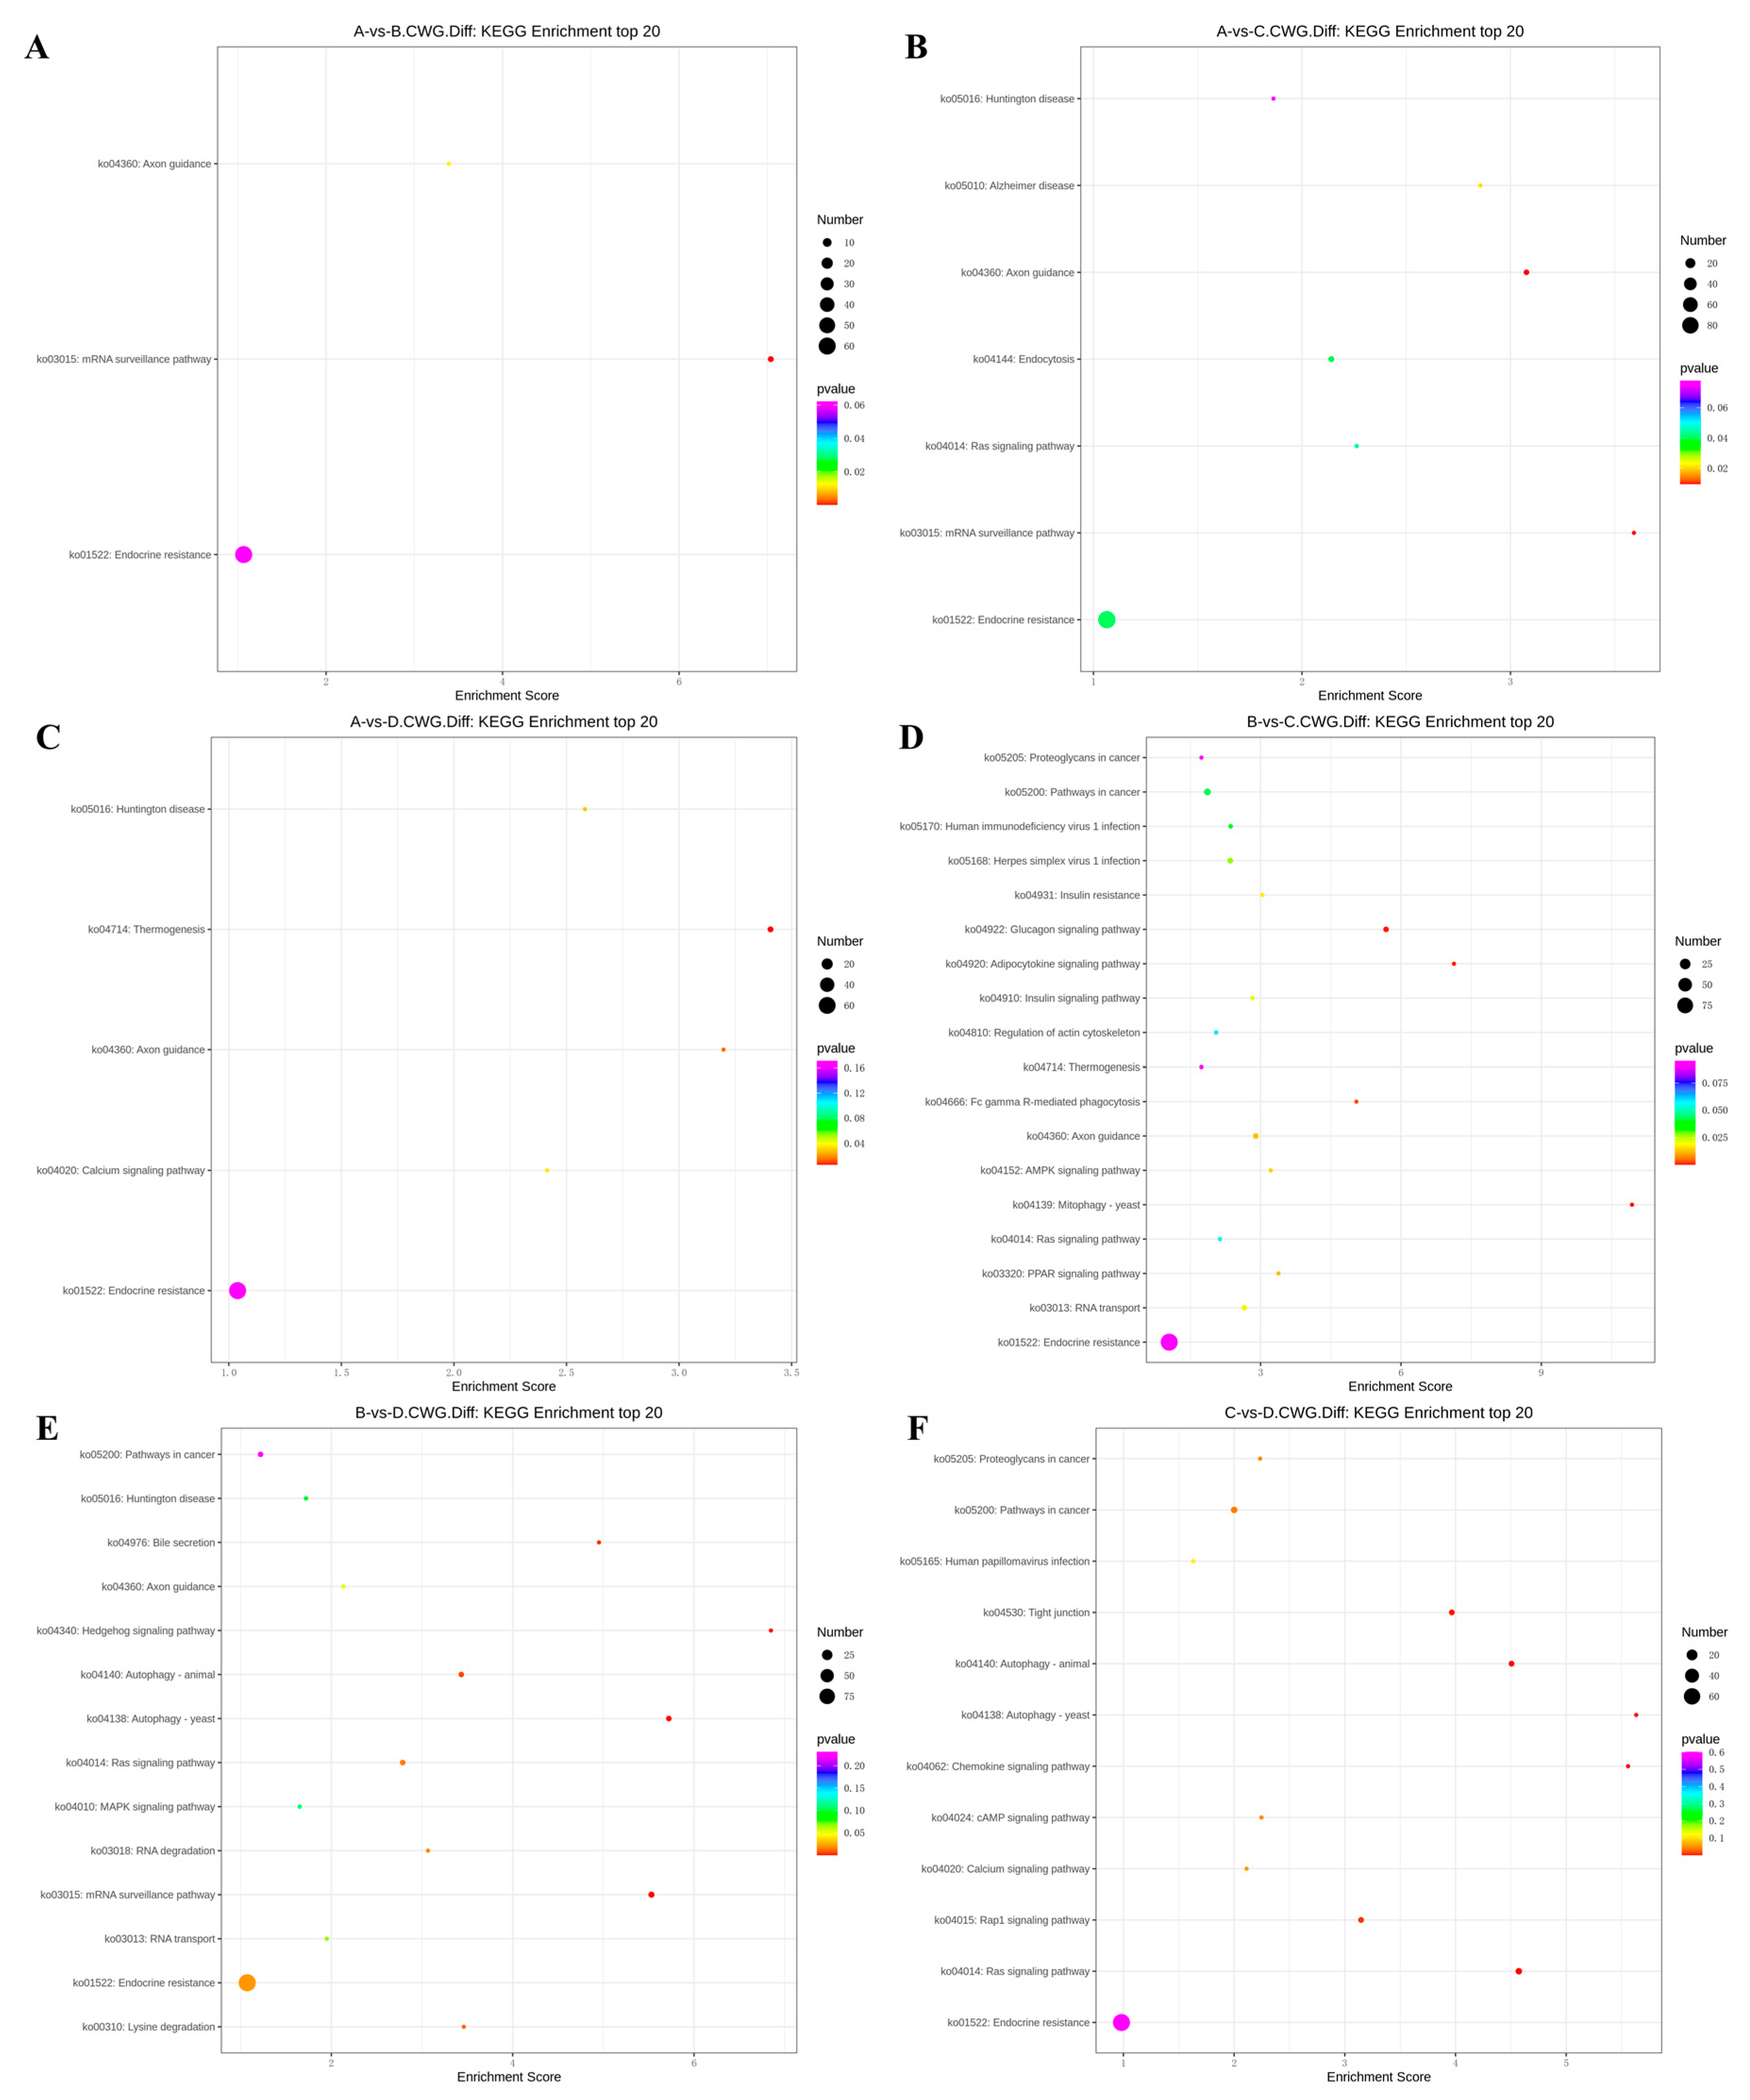
In the 3 years vs 2 years comparison, the differentially methylated genes at CCGG sites were significantly enriched in alanine, aspartate, and glutamic acid metabolism, platinum resistance, fluid shear stress, and atherosclerosis; up-regulated genes were significantly enriched in alanine, aspartate, and glutamic acid metabolism and endocrine resistance pathways, whereas down-regulated genes were significantly enriched in AMPK signaling pathway, liver cancer, endocrine resistance. In the alanine, aspartate, and glutamic acid metabolic pathway, aspartate aminotransferase and δ-1-pyrroline-5-carboxylate dehydrogenase were up-regulated. The differentially methylated genes at CCWGG sites were significantly enriched in mRNA monitoring, axon guidance, and endocrine resistance; up-regulated genes were significantly enriched in mRNA monitoring pathway and endocrine resistance, whereas down-regulated genes were significantly enriched in endocrine resistance pathways (Figure 3). In the mRNA monitoring pathway, FIP1, SYMPK, and smg1 were up-regulated, and smg6 was down-regulated. In the axon guidance pathway, the Ras GTPase activating protein gene rasgap and limk were down-regulated, and slit guidance ligand slit1 was up-regulated. The results are shown in Figure 4 and Figure 5A.
In the 3 years vs 1 year comparison, the differentially methylated genes at CCGG sites were significantly enriched in proteasome, lysosome, and inositol phosphate metabolism; up-regulated genes were significantly enriched in lysosome, thermogenesis, and endocrine resistance, whereas down-regulated genes were significantly enriched in inositol phosphate metabolism and endocrine resistance. In the lysosomal pathway, histone, SGSH, and GNPT were up-regulated, and MPR and AP.4 were down-regulated. In the inositol phosphate metabolism pathway, phosphatidylinositol 4,5-diphosphate 3-kinase catalyzes the down-regulation of subunit β isoform and inositol-3-phosphate synthase 1-A. The differentially methylated genes at CCWGG sites were significantly enriched in axon guidance, mRNA monitoring, and Alzheimer’s disease; up-regulated genes were significantly enriched in mRNA monitoring pathways and endocrine resistance, whereas down-regulated genes were significantly enriched in Alzheimer’s disease, endocytosis, and endocrine resistance. In the mRNA monitoring pathway, FIP1, SYMPK, and smg1 were up-regulated. In the axon guidance pathway, rasgap and integrin-linked kinase ILK were down-regulated, and slit1 and slit2 were up-regulated. In the Alzheimer’s disease pathway, ncstn, aphl-1, and cxv were down-regulated. In the Endocrine resistance pathway, ILK is down-regulated. The results are shown in Figure 4 and Figure 5B.
In the 3 years vs 4 months comparison, the differentially methylated genes at CCGG sites were significantly enriched in tyrosine metabolism, necrotizing apoptosis, and alanine, aspartic acid, and glutamic acid metabolism; up-regulated genes were significantly enriched in necrotizing apoptosis, alanine, aspartic acid, and glutamic acid metabolism, and human T-cell leukemia virus 1 infection, whereas down-regulated genes were significantly enriched in glutathione metabolism, non-alcoholic fatty liver disease, purine metabolism. In the alanine, aspartic acid, and glutamic acid metabolism pathway, the genes encoding aspartate aminotransferase, succinate-semialdehyde dehydrogenase, and amide phosphate ribosyltransferase were up-regulated. In the necrotizing apoptosis pathway, ANT, PYGL, heat shock protein HSP90, DRP1, and ESCRT-III were up-regulated, and the histone H2AX was down-regulated. In the glutathione metabolic pathway, the aminopeptidase N (pepn) and the isocitrate dehydrogenase genes were down-regulated. The differentially methylated genes at CCWGG sites were significantly enriched in thermogenesis, axon guidance, and Huntington’s disease. The most enriched pathway was the secretory resistance pathway with a total of 62 differentially methylated genes; among them, up-regulated genes were significantly enriched in endocrine resistance pathways, whereas down-regulated genes were significantly enriched in endocrine resistance pathways. In the endocrine resistance pathway, the protein kinase gene Pka was down-regulated. In the axonal guidance pathway, RGS3 and ROBO1 were down-regulated and slit1 was up-regulated. The results are shown in Figure 4 and Figure 5C.
In the 2 years vs 1 year comparison, the differentially methylated genes at CCGG sites were significantly enriched in meiosis-yeast, fatty acid degradation, and cell cycle-yeast; up-regulated genes were significantly enriched in Epstein-Barr virus infection, peroxisome, and endocrine resistance, whereas down-regulated genes were significantly enriched in meiosis-yeast, cell cycle, and endocrine resistance. In the meiosis-yeast pathway, GLC7, IN1, and cell division control CDC6 were down-regulated. The differentially methylated genes at CCWGG sites were significantly enriched in mitochondrial autophagy-yeast, glucagon signaling pathway, and adipocytokine signaling pathway. The most enriched pathway was the endocrine resistance pathway with a total of 92 differentially methylated genes; among them, up-regulated genes were significantly enriched in the glucagon signaling pathway, axon guidance, and cancer pathways, whereas down-regulated genes were significantly enriched in endocrine resistance and cancer pathways. In the axon guidance pathway, limk and ptch1 were up-regulated. In the endocrine resistance pathway, the mechanistic target of rapamycin kinase gene mtor and ILK was down-regulated was down-regulated. In the glucagon signaling pathway, sik2, cpt1, and phk were up-regulated, and gys was down-regulated. The results are shown in Figure 4 and Figure 5D.
In the 2 years vs 4 months comparison, the differentially methylated genes at CCGG sites were significantly enriched in alanine, aspartate, and glutamic acid metabolism, glutathione metabolism, and meiosis-yeast; up-regulated genes were significantly enriched in alanine, and endocrine resistance, whereas down-regulated genes were significantly enriched in glutathione metabolism, meiosis-yeast, and ribonucleic acid transport. In alanine, aspartate, and glutamic acid metabolic pathways, the genes encoding aspartame synthase and hypothetical protein BSL78_23121 were down-regulated, and the genes encoding isoaspartic acid peptidase/L-asparaginase-like, succinate-semialdehyde dehydrogenase, and 4-aminobutyrate aminotransferase were up-regulated. Pepn and the isocitrate dehydrogenase gene were down-regulated in the glutathione metabolic pathway. GLC7, IN1, and CDC6 were down-regulated in the meiosis-yeast pathway. The differentially methylated genes at CCWGG sites were significantly enriched in mRNA monitoring pathways, autophagy-yeast, and hedgehog signaling pathways. The most enriched pathway was the endocrine resistance pathway with a total of 96 differentially methylated genes; among them, up-regulated genes were significantly enriched in RNA degradation, axon guidance, and Ras signaling pathways, whereas down-regulated genes were significantly enriched in autophagy-yeast, autophagy-animal, and mRNA monitoring pathways. In the mRNA monitoring pathway, CPSF6/7 and SYMPK were down-regulated, and smg1 and smg6 were up-regulated. In the axonal guidance pathway, Ras GTPase activating protein rasgap, limk, and ptch1 were up-regulated. In the autophagy-yeast pathway, Pka, and the autophagy-related genes atg2, and atg3 were down-regulated, and e1f2α was up-regulated. In the Ras signaling pathway, rasgap, rlip76, and ra1bp1 were up-regulated. In the autophagy-animal pathway, atg2, Pka, atg3, and e1f2α were down-regulated. The results are shown in Figure 4 and Figure 5E.
In the 1 year vs 4 months comparison, the differentially methylated genes at CCGG sites were significantly enriched in glutathione metabolism, propionic acid metabolism, and valine, leucine, and isoleucine degradation; up-regulated genes were significantly enriched in propionic acid metabolism and endocrine resistance, whereas down-regulated genes were significantly enriched in glutathione metabolism, apoptosis, and herpes simplex virus 1 infection. In the glutathione metabolism pathway, pepn and the gene encoding 6-phosphogluconate dehydrogenase were down-regulated. In the propionic acid metabolic pathway, the genes encoding malonyl-CoA decarboxylase, 4-aminobutyrate aminotransferase, and acetyl-CoA synthetase were up-regulated. The differentially methylated genes at CCWGG sites were significantly enriched in the Ras signaling pathway, autophagy-animal, and autophagy-yeast. The most enriched pathway was the endocrine resistance pathway with a total of 67 differentially methylated genes; among them, up-regulated genes were significantly enriched in cancer pathways and endocrine resistance, whereas down-regulated genes were significantly enriched in autoph-agy-yeast, chemokine signaling pathway, and autophagy-animal pathway. In the cancer pathway, aml1, aml1-eto, aml-evi1, dapk, and ecm were up-regulated, and ra1 were down-regulated. In the autophagy-yeast pathway, atg2 was down-regulated, and e1f2α was up-regulated. In the Ras signaling pathway, tiam1, and ra1 were down-regulated, and rasgap and plcε were up-regulated. In the autophagy-animal pathway, atg2, and e1f2α were down-regulated, and dapk was up-regulated. In the chemokine signaling pathway, Pka was down-regulated. The results are shown in Figure 4 and Figure 5F.

4. Discussion

In this study, we used the MethylRAD-Seq method to identify differentially methylated genes of A. japonicus at four ages. By pairwise comparison and GO and KEGG functional enrichment analyses, differentially methylated genes and their regulatory trends in A. japonicus at the four ages were identified. See Supplementary 1 for details. The results provide information that can be used to determine the age of A. japonicus. We found that there were significantly more CCGG-type than CCWGG-type methylation sites. The DNA methylation of A. japonicus at different ages occurred mainly in gene regions. These results suggest that DNA methylation associated with the age of A. japonicus may play a role in regulating gene expression.
Sharma et al. (1987) studied the regulatory effect of hydrocortisone on the aspartate aminotransferase isoenzymes in rat liver and discovered that the aspartate aminotransferase content of liver increased with the age of the rats after the rats reached a certain age. [17] The up-regulation of the aspartate aminotransferase gene in A. japonicus may be related to the transamination in mitochondria that allows A. japonicus to grow and remain stable. Cathepsin b-like proteases promote aging by translocating from lysosomes to the cytoplasm and nucleus, causing oxidative stress in the cell, and contributing to the degradation of anti-aging factors [18,19]. Age-related increases in cathepsin b-like proteases may contribute to the aging of A. japonicus. Sun et al. discovered that the positive reactions of γ-aminobutyric acid and neurofilament protein were stronger in the retina of old cats than they were in young cats, and the number of positive immune response cells increased significantly [20]. The degradation of γ-aminobutyric acid leads to the formation of succinic semialdehyde as a relatively unstable intermediate [21]. The up-regulation of the succinate-semialdehyde dehydrogenase gene in A. japonicus may be caused by the accumulation of γ-aminobutyric acid with age, resulting in the accumulation of its degradation products. Al-Zghoul et al. studied heat stress in broiler chickens and discovered that the expression of Hsp90 and Hsp60 was associated with the acquisition of long-term enhanced heat tolerance [22]. Bansal et al. found that decreased intracellular Hsp90 concentrations increased mammalian cell mortality at elevated temperatures [23]. Boehm et al. showed that basal Hsp90 protein levels decreased with age in equine articular chondrocytes, but when Hsp90 mRNA expression was measured in equine articular chondrocytes from post-pubertal animals, a brief and significant increase in expression was observed with the same sample size after puberty [24]. The up-regulation trend of Hsp90 in A. japonicus may be attributable to oxidative stress and disparity in sample size. Johanna et al. discovered that the DNA damage and repair marker γ-H2AX concentration decreased with age [25]. The down-regulation trend of H2AX in A. japonicus may be because of DNA damage causing gene dysregulation during aging. Miska et al. discovered that between days 9 and 20 of incubation, Pepn was highly expressed in Gallus gallus; however, its expression peaked on day 15 and decreased substantially from days 17 to 20, which is consistent with our findings in A. japonicus [26]. Yadav et al. discovered that NAD- and mitochondrial NADP-isocitrate dehydrogenase activity increased in male rats until adulthood and then decreased, whereas brain NADP-isocitrate dehydrogenase activity decreased progressively with age [27]. This result is consistent with the finding that, in A. japonicus, isocitrate dehydrogenase is most active in synthesis during development, providing 2-oxoglutarate that is then converted to glutamate, and supplying a large amount of this amino acid and thereby maintaining the energy required to be active in adulthood and decreasing thereafter[27]. Markopoulos et al. discovered that the levels of proteins with cell cycle effects, such as Cdc6, were drastically decreased This pattern was also observed in A. japonicus [28]. The activity of the lipogenic enzyme 6-phosphogluconate dehydrogenase decreased with age in adipose tissue [29], which is consistent with our findings in A. japonicus.
RasGAP proteins, which are members of the Ras family, regulate glutamate receptor synaptic targets to maintain synaptic plasticity [30]. Ras GTPase is essential for the proliferation, function, and development of many cell types [31]35. Srivastav et al. discovered that the expression of RasGAP-positive cells in mice decreased with age [32]. RasGAP typically increased in A. japonicus during adolescence and then decreased, which may be related to the decline in cell proliferation during maturity. Ethell, Morita, and Yoshida's et al. showed that multiple axon guidance molecules modulate dendritic morphology and spine growth [33,34,35]. Slit1 may be involved in the growth of A. japonicus spine, implying that slit1 may be associated with A. japonicus age on the other hand. El-Hoss et al. discovered that mouse osteoblasts cultured from primary osteoblasts deficient in ILK had elevated levels of cytoplasmic αNAC and increased mineralization [36]. The number of pores in bone slices of A. japonicus decreased with age, and ILK may be implicated in this process. Mtor (target of rapamycin) signaling influences longevity and senescence [37]. Senescence is highly regulated by the activity of TOR, an evolutionarily conserved protein kinase that regulates growth, proliferation, and cellular metabolism in response to nutrients, growth factors, and stress (Erdogan et al., 2016) [38]. With age, skeletal muscle mass naturally and gradually decreases [39]. Mtor may inhibit the development of skeletal muscle in A. japonicus by participating in the endocrine resistance pathway, thereby altering the number of bone fragments with cavities. The aging process is dependent on the effect of PKA down-regulation on the BKCa channels in the middle cerebral artery, which may compromise the structure and function of PKA [40]. Down-regulation of PKA in A. japonicus may result in senescence. In their study, Liu et al. found that BMP9 expression was elevated in the hepatocytes of the liver for aged mice, whereas ATG3 and ATG7 expression was reduced [41]. The trend of atg3 down-regulation in A. japonicus may be related to the inhibition of autophagic flux by BMP9.

5. Conclusions

In this study, we used MethylRAD-Seq to analyze the DNA methylation of body wall tissue of A. japonicus at different ages. Aspartate aminotransferase, succinate-semialdehyde dehydrogenase, isocitrate dehydrogenase, H2AX, Hsp90, Pepn, CDC6, Rasgap, slit1, ILK, Mtor, Pka, and atg3 were screened out as differentially methylated genes associated with age and aging. Therefore, we hypothesized that the DNA methylation levels and genetic patterns of A. japonicus changed during the development process. Future methylation analyses of gonads, respiratory trees, longitudinal muscles, and other tissues of A. japonicus will be conducted to provide a theoretical basis for the age judgment of A. japonicus.

Supplementary Materials

The following supporting information can be downloaded at the website of this paper posted on Preprints.org. Supplementary 1 Related Differential Methylation Gene Annotation Information.

Author Contributions

Xinyu Yang designed the experiments and wrote the manuscript. Xinyu Yang, Jinyuan Zhang, Qi Ye and HaoRan Xiao performed the experiments. Hao Wang, Wenpei Wang, and Yongjie Wang participate in the survey. Lingshu Han, Luo Wang and Jun Ding made suggestions and revisions. Jun Ding designed and supervised the experiments.

Funding

This research was funded by the Central Government Subsidy Project for Liaoning Fisheries (2023, for Jun Ding) and the High-Level Talent Support Grant for Innovation in Dalian (2020RD03, for Jun Ding). The Central Guidance on Local Science and Technology Development Fund of Liaoning Province (2023 for Luo Wang).

Institutional Review Board Statement

Since Apostichopus japonicus are invertebrates, ethical review, and approval were waived for this study. The content of this article does not involve human or animal research in the institutional review board statement.

Acknowledgments

Thanks to the authors for their contributions and funding.

Conflicts of Interest

The authors declare no conflict of interest.

References

  1. Liao, Y.L.; Zoology of China: Echinoderma: A. japonicuss.M. Science Press, 1997.
  2. Fisheries Administration of the Ministry of Agriculture and Rural Affairs; National Fisheries Technology Promotion Station; Chinese Fisheries Society. 2022 China Fisheries Statistical Yearbook.M. Beijing: China Agricultural Press, 2022:6.
  3. Zhang, L.H.; Ding, J.; Han, Z.H.; Chang, Y.Q.; Song, J.; Tian, Y.; Bai, X.Q.; Ding, W.J. Study on the species and morphology of imitation A. japonicus bone fragments. J. Marine Science.2015, 39 (4): 8-14. [CrossRef]
  4. Wang. J.J.; Liao, M.J.; Wang, Y.G.; Li, B.; Rong, X.J.; Ge, J.L.; Liu, Q.B.; Fan, R.Y. Study on the variation law of the species and structure of imitation A. japonicus bone fragments with age. J. Scientific Fish Farming.2023, (3): 73-75. [CrossRef]
  5. Montesanto, A. D; Aquila, P.; Lagani, V.; Paparazzo, E.; Passarino, G. A New Robust Epigenetic Model for Forensic Age Prediction. J. Journal of forensic sciences. 2020,65(5):1424-1431. [CrossRef]
  6. Anastasiadi, D; Piferrer, F.A clockwork fish: Age prediction using DNA methylation-based biomarkers in the European seabass. J.Molecular ecology resources.2020,20(2):387—397. [CrossRef]
  7. Zhang, L.; Jia, F.; Zhang, G.L.; Zeng, L.; Yi, Y.J.; Wang, J.S. Research progress of plant DNA methylation. J. Anhui Agricultural Sciences. 2012, (6): 3218-3221. [CrossRef]
  8. Lin, Z.K.; Xie, F.; Luo, J.Y.; Chen, T.; Xi, Q.Y.; Zhang, Y.L.; Sun, J.J. Methylation analysis of whole genome DNA of longissimus dorsi muscle in Lantang pigs and Everwhite pigs. J. Journal of Northwest A & F University (Natural Science Edition),.2023,51 (6): 1-10,17. [CrossRef]
  9. Wei, S.; Xie, L.L.; Zhu, H.; Zhang, Q.J.; Shen, Y.B.; Xu, X.Y.; Li, J.L. Differential methylation analysis of Asian grass carp populations.J. Chinese Journal of Fisheries. 2023, 47 (3): 99-111. [CrossRef]
  10. Wang, C.S.; Huang, X.D.; Cui, X.Y.; Ni, P.; Ye, S.G.; Wang, H.; Gao, D.X.; Lei, W. Effects of Vibrio harvei infection on DNA methylation of IL-6 gene of red-fin pufferfish.J. Journal of Dalian Ocean University.2022, 37 (2): 221-226. [CrossRef]
  11. Zhang, Y.L.; Zhou, C.J. DNA methylation and fish age.J. Henan Fisheries. 2021 (6): 20-23.
  12. Mcgaughey, D. M.; Abaan, H. O.; Miller, R. M.; Kropp, P. A.; Brody, L. C. Genomics of cpg methylation in developing and developed zebrafish. G3 (Bethesda, Md.) (5).2014. [CrossRef]
  13. Montesanto, A. D; Aquila, P.; Lagani, V.; Paparazzo, E.; Passarino, G. A New Robust Epigenetic Model for Forensic Age Prediction. J. Journal of forensic sciences. 2020,65(5):1424-1431. [CrossRef]
  14. De paoli-iseppi, R.; Deagle, B.E.; Polanowski, A.M.; McMahon, C.R.; Dickinson, J.L.; Hindell, Ma.A.; Jarman, S.N. Age estimation in a long-lived seabird (Ardenna tenuirostris) using DNA methylation-based biomarkers. J.Nature reviews Cancer. 2019,19(2):411-425. [CrossRef]
  15. Cingolani, P.; Platts, A.; Wang, L.L.; Coon, M.; Nguyen, T.; Wang, L.; Land, S.J.; Lu, X.; Ruden, D.M. A program for annotating and predicting the effects of single nucleotide polymorphisms, SnpEff: SNPs in the genome of Drosophila melanogaster strain w1118; iso-2; iso-3. J. Fly.2012,6(2):80-92. [CrossRef]
  16. Quinlan, A.R.; Hall, I.M. BEDTools: a flexible suite of utilities for comparing genomic features. J. Bioinformatics.2010,26(6):841-842. [CrossRef]
  17. Sharma, R.; Patnaik, S.K. Regulation of aspartate aminotransferase isoenzymes by hydrocortisone in the liver of aging rats. Archives of Gerontology & Geriatrics, (1).1987.27-32. [CrossRef]
  18. Ni, J.J.; Wu, Z.; Stoka, V.; Meng, J.; Hayashi, Y.; Peters, C.; Qing, H.; Turk, V.; Nakanishi, H. Increased expression and altered subcellular distribution of cathepsin B in microglia induce cognitive impairment through oxidative stress and inflammatory response in mice. J. Aging Cell.2019,18(1): n/a-n/a. [CrossRef]
  19. Meng J, Liu YC, Xie Z, Qing H, Lei P, Ni JJ. Nucleus distribution of cathepsin B in senescent microglia promotes brain aging through degradation of sirtuins. Neurobiol Aging, 2020, 96: 255–2.
  20. Sun, Q.Y.; Zhang, C.Z.; Mei, B.; Luo, X.; Zhu, Z.M.; Hua, T.M. Age-related retinal γ-aminobutyric acid and neurofilament protein expression in cats. Journal of Anatomy. 2005, 28(5), 4. [Google Scholar]
  21. Shu, J.B.; Jiang, S.Z.; Meng, Y.T. Research progress of succinic semialdehyde dehydrogenase deficiency. Continuing Medical Education. 2014, 28(10), 5. [Google Scholar]
  22. Al-Zghoul, M.B.; Ismail, Z.B.; Dalab, A.S.; Al-Ramadan, A.; Althnaian, T.A.; Al-ramadan, S.Y.; Ali, A.M.; Albokhadaim, I.F.; Al Busadah, K.A.; Eljarah, A.; Jawasreh, K.I.; Hannon, K.M. Hsp90, Hsp60 and HSF-1 genes expression in muscle, heart and brain of thermally manipulated broiler chicken. J. Research in Veterinary Science. 2015, 99105–111. [Google Scholar] [CrossRef]
  23. Bansal, G.S.; Norton, P.M.; Latchman, D.S. The 90-kDa heat shock protein protects mammalian cells from thermal stress but not from viral infection. Experimental Cell Research. 1991,195.2. [CrossRef]
  24. Boehm, A.K.; Seth, M.; Mayr, K.G.; Fortier, LA. Hsp90 mediates insulin-like growth factor 1 and interleukin-1beta signaling in an age-dependent manner in equine articular chondrocytes. Arthritis and rheumatism. 2007, 56.7.
  25. Johanna, S.S.; Bernard, R. Effects of Aging and Oxidative Stress on Spermatozoa of Superoxide-Dismutase 1- and Catalase-Null Mice1. Biology of Reproduction. 2016, 95.3.
  26. Miska, K.B.; Fetterer, R.H.; Wong, E.A. The mRNA expression of amino acid transporters, aminopeptidase N, and the di- and tri-peptide transporter PepT1 in the embryo of the domesticated chicken (Gallus gallus) shows developmental regulation. J. Poultry Science.2014,93(9):2262-2270. [CrossRef]
  27. Singh Yadav, R.N.; Singh, S.N. Regulation of NAD- and NADP-linked isocitrate dehydrogenase by hydrocortisone in the brain and liver of male rats of various ages." Biochimica et Biophysica Acta (BBA) - General Subjects. 1980, 633.3. [CrossRef]
  28. Markopoulos, G.S.; Roupakia, E.; Tokamani, M.; Vartholomatos, G.; Tzavaras, T.; Hatziapostolou, M.; Fackelmayer, F.O.; Sandaltzopoulos, R.; Polytarchou, C.; Kolettas, E. Senescence-associated microRNAs target cell cycle regulatory genes in normal human lung fibroblasts. J. Experimental Gerontology. 2017, 96110–122. [Google Scholar] [CrossRef] [PubMed]
  29. Pankiewicz, A.; Sledzinski, T.; Nogalska, A.; Swierczynski, J. Tissue specific, sex and age--related differences in the 6-phosphogluconate dehydrogenase gene expression. The international journal of biochemistry & cell biology. 2003,35(2), 235–245. [CrossRef]
  30. Kim, J.H.; Lee, H.K.; Takamiya, K.; Huganir, R.L. The role of synaptic GTPase-activating protein in neuronal development and synaptic plasticity. The Journal of neuroscience: the official journal of the Society for Neuroscience. 2003,23(4), 1119–1124. [CrossRef]
  31. Saito, S.; Kawamura, T.; Higuchi, M.; Kobayashi, T.; Yoshita-Takahashi, M.; Yamazaki, M.; Abe, M.; Sakimura, K.; Kanda, Y.; Kawamura, H.; Jiang, S.; Naito, M.; Yoshizaki, T.; Takahashi, M.; Fujii, M. RASAL3, a novel hematopoietic RasGAP protein, regulates the number and functions of NKT cells. European journal of immunology. 2015, 45(5), 1512–1523. [Google Scholar] [CrossRef] [PubMed]
  32. Srivastava, K.; Tripathi, R.; Mishra, R. Age-dependent alterations in expression and co-localization of Pax6 and Ras-GAP in brain of aging mice. Journal of chemical neuroanatomy. 2018, 92, 25–34. [Google Scholar] [CrossRef] [PubMed]
  33. Ethell, I. M.; Irie, F.; Kalo, M.S.; Couchman, J.R.; Pasquale, E.B.; Yamaguchi, Y. EphB/syndecan-2 signaling in dendritic spine morphogenesis. Neuron. 2001, 31(6), 1001–1013. [Google Scholar] [CrossRef] [PubMed]
  34. Morita, A.; Yamashita, N.; Sasaki, Y.; Uchida, Y.; Nakajima, O.; Nakamura, F.; Yagi, T.; Taniguchi, M.; Usui, H.; Katoh-Semba, R.; Takei, K.; Goshima, Y. Regulation of dendritic branching and spine maturation by semaphorin3A-Fyn signaling. The Journal of neuroscience: the official journal of the Society for Neuroscience.2006,26(11), 2971–2980. [CrossRef]
  35. Yoshida, J.; Kubo, T.; Yamashita, T. Inhibition of branching and spine maturation by repulsive guidance molecule in cultured cortical neurons. Biochemical and biophysical research communications. 2008, 72(4), 725–729. [Google Scholar] [CrossRef] [PubMed]
  36. El-Hoss, J.; Arabian, A.; Dedhar, S.; St-Arnaud, R. Inactivation of the integrin-linked kinase (ILK) in osteoblasts increases mineralization. Gene. 2014, 533(1), 246–252. [Google Scholar] [CrossRef] [PubMed]
  37. Weichhart, T. mTOR as Regulator of Lifespan, Aging, and Cellular Senescence: A Mini-Review. Gerontology. 2018, 64(2), 127–134. [Google Scholar] [CrossRef] [PubMed]
  38. Erdogan, C. S.; Hansen, B. W.; Vang, O. Are invertebrates relevant models in ageing research? Focus on the effects of rapamycin on TOR. Mechanisms of ageing and development. 2016, 153, 22–29. [Google Scholar] [CrossRef] [PubMed]
  39. Zacharewicz, E.; Della Gatta, P.; Reynolds, J.; Garnham, A.; Crowley, T.; Russell, A.P.; Lamon, S. Identification of microRNAs linked to regulators of muscle protein synthesis and regeneration in young and old skeletal muscle. PloS one. 2014, 9(12), e114009. [Google Scholar] [CrossRef] [PubMed]
  40. Li, N.; Shi, R.; Ye, Y.; Zhang, Y.; Zhang, Y.; Wang, Z.; Gu, Y.; Yin, Y.; Chen, D.; Tang, J. Aging-Induced Down-Regulation of PKA/BKCa Pathway in Rat Cerebral Arteries. Physiological research. 2022, 71(6), 811–823. [Google Scholar] [CrossRef] [PubMed]
  41. Liu, R.; Xu, W.; Zhu, H.; Dong, Z.; Dong, H.; Yin, S. Aging aggravates acetaminophen-induced acute liver injury and inflammation through inordinate C/EBPα-BMP9 crosstalk. Cell & bioscience. 2023,13(1), 61. [CrossRef]
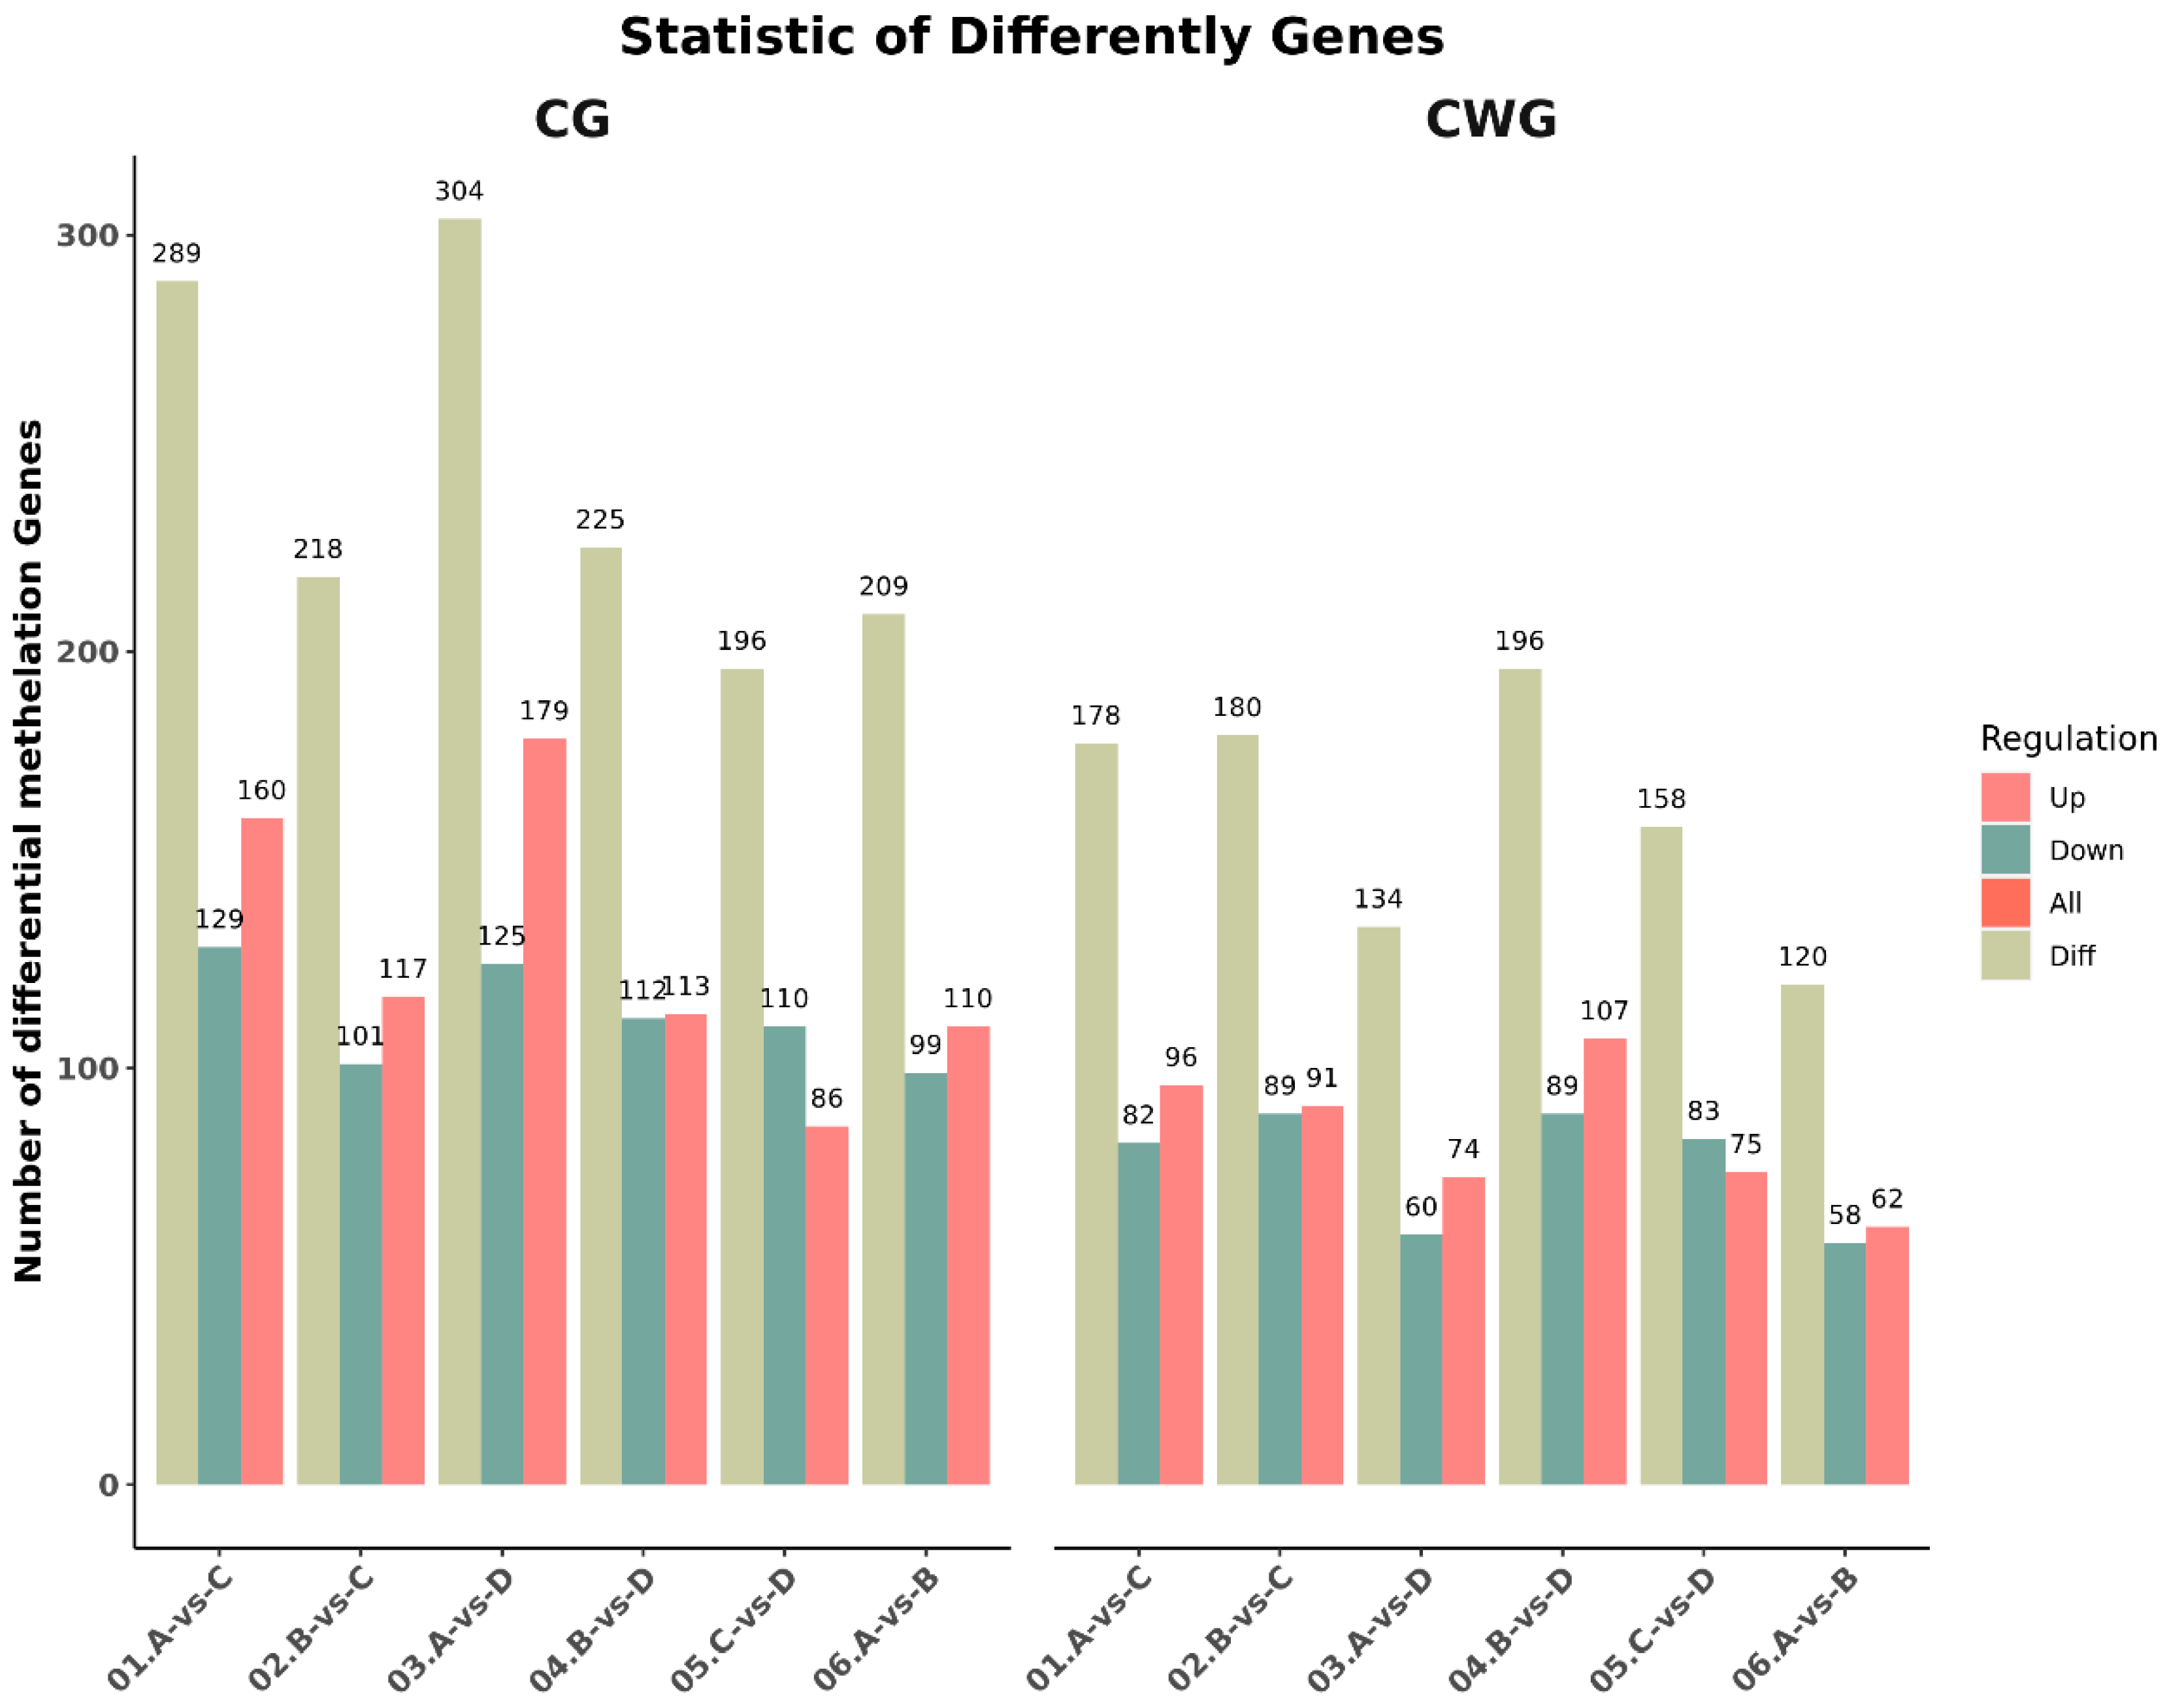
Figure 1. Statistical histogram of differential methylation genes between groups (3-year-old(A), 2-year-old (B), 1-year-old(C), 4-month-old (D) ).01:3-year-oldVS 1-year-old;02:2-year-oldVS 1-year-old;03:3-year-old VS 4-month-old;04:2-year-oldVS 4-month-old;05:1-year-oldVS 4-month-old;06:3-year-oldVS 2-year-old.)
Preprints 87950 g001
Figure 2. Histogram of differentially methylated gene GO functional classification: CCGG. (A) A VS B; (B) A VS C; (C) A VS D; (D) B VS C; (E) B VS D; (F) C VS D. (3-year-old(A), 2-year-old (B), 1-year-old(C), 4-month-old (D).)
Preprints 87950 g002
Figure 3. Histogram of differentially methylated gene GO functional classification: CCWGG. (A) A VS B; (B) A VS C; (C) A VS D; (D) B VS C; (E) B VS D; (F) C VS D.(3-year-old(A), 2-year-old (B), 1-year-old(C), 4-month-old (D).)
Preprints 87950 g003
Figure 4. KEGG top20 bubble chart of differentially methylated genes at CCGG sites. (A) A VS B; (B) A VS C; (C) A VS D; (D) B VS C; (E) B VS D; (F) C VS D.(3-year-old(A), 2-year-old (B), 1-year-old(C), 4-month-old (D).)
Preprints 87950 g004
Figure 5. KEGG top20 bubble chart of differentially methylated genes at CCWGG sites. (A) A VS B; (B) A VS C; (C) A VS D; (D) B VS C; (E) B VS D; (F) C VS D.(3-year-old(A), 2-year-old (B), 1-year-old(C), 4-month-old (D).)
Preprints 87950 g005
Table 6. Statistical table of data volume change Statistics of sequencing data of MethylRAD library
Sample Raw_Reads Clean_Reads Percent
A 75848311 36771351 48.48%
B 62579986 32326130 51.66%
C 65336130 30392328 46.52%
D 76656509 30786727 40.16%
Note :3-year-old(A), 2-year-old (B), 1-year-old(C), 4-month-old (D)
Disclaimer/Publisher’s Note: The statements, opinions and data contained in all publications are solely those of the individual author(s) and contributor(s) and not of MDPI and/or the editor(s). MDPI and/or the editor(s) disclaim responsibility for any injury to people or property resulting from any ideas, methods, instructions or products referred to in the content.
Copyright: This open access article is published under a Creative Commons CC BY 4.0 license, which permit the free download, distribution, and reuse, provided that the author and preprint are cited in any reuse.
Prerpints.org logo

Preprints.org is a free preprint server supported by MDPI in Basel, Switzerland.

Subscribe

© 2024 MDPI (Basel, Switzerland) unless otherwise stated