Preprint
Technical Note

Combining Complementarity and Binding Energetics in Protein Interactions: EnCPdock—A Practical Manual

Altmetrics

Downloads

140

Views

60

Comments

0

A peer-reviewed article of this preprint also exists.

This version is not peer-reviewed

Submitted:

17 October 2023

Posted:

18 October 2023

You are already at the latest version

Alerts
Abstract
The combined efect of shape and electrostatic complementarities (Sc, EC) at the interface of the interacting protein partners (PPI) serves as the physical basis for such associations and is a strong detterminant of their binding energetics. EnCPdock (https://www.scinetmol.in/EnCPdock/) presents a comprehensive web-platform for the direct conjoint comparative analyses of complementarity and binding energetics in PPIs. It elegantly interlinks the dual nature of local (Sc) and non-local complementarity (EC) in PPIs using the Complementarity Plot. It further derives an AI-based ∆Gbinding with a prediction accuracy comparable to the state-of-the-art. This book-chapter presents a practical manual to conceptualize and implement EnCPdock with its various features and functionalities, collectively having the potential to serve as a valuable protein engineering tool in the design of novel protein interfaces.
Keywords: 
Subject: Biology and Life Sciences  -   Biophysics

1. Introduction.

Design of novel therapeutic agents and the engineering of proteins with desired functionalities are interconnected forefronts of modern biomedical research. In one hand, understanding the thermodynamics and kinetics of protein-protein interactions is essential in identifying and validating potential drug targets [1], while on the other hand, protein-protein binding energetics plays a pivotal role in rational protein engineering, interface design and modulation of protein-protein interactions [2]. Apart from the applications, the interaction between protein complexes is also crucial for deciphering their roles in cellular processes, disease mechanisms and signal transduction pathways [3]. A significant portion of the data concerning protein-protein binding energetics is encoded within the structural features of protein complexes [4]. The three-dimensional arrangement of proteins within these complexes reveals critical insights into the nature and specificity of their interactions, offering a rich source of information for understanding the energetic basis of their associations [5].
The interplay between protein-protein binding energetics and the structural characteristics of protein-protein interaction (PPI) complexes has been elucidated with numerous computational approaches. Within the realm of molecular dynamics simulations, a prominent technique extensively employed is the physical effective energy function (PEEF). PEEF relies on theoretically derived interparticle forces that encompass all atoms within a given structure of protein complexes [6,7]. The parameters of PEEF are typically obtained from small molecule crystal and solvation data, as well as ab initio calculations [8,9]. However, due to the absence of parameterization from actual protein structures, the PEEF approach encountered challenges in accurately identifying native protein folds [7]. More specifically, as the physical effective energy function (PEEF) is derived from atomic models, it frequently exhibits a rugged energy surface that lacks a smooth descent when approaching the native state [10].
A statistical effective energy function (SEEF) addresses the limitations of PEEF by utilizing parameterization from a database of known protein structures to extract statistics related to pair contacts and surface area burial [11,12]. This enables the determination of ’pseudo-potentials’ for protein structures or protein-protein interactions. SEEF offers advantages over PEEF, including a smoother energy landscape and reduced sensitivity to small perturbations [12]. Moreover, its statistical nature allows for the inclusion of all known and potential physical effects, enhancing its robustness [13]. However, SEEF may exhibit a lower discriminatory power due to this very robustness [14].
Among other methodologies, a widely employed approach involves combining molecular mechanics energy (MM) with solvation free energy and configurational entropy [15]. The molecular mechanics energy incorporates bond, angle, dihedral, electrostatic, and van der Waals energy in the gas phase. Conformational entropy is typically computed from normal-mode analysis based on a set of conformational snapshots obtained from molecular dynamics simulations. Solvation free energy, on the other hand, is determined by calculating the change in free energy associated with transferring a molecule from an ideal gas to a solvent at a specific pressure and temperature [16]. This process considers alterations in solvent accessible surface area and electrostatic interactions between the solute and solvent. The electrostatics part can be determined using either the Generalized-Born (GB) model [17] or through solving the finite difference Poisson-Boltzman (PB) equation [18], which leads to the MM/PBSA and MM/GBSA approaches, respectively. Although both methods share the entropic, solvent accessible surface area, and molecular mechanics components, their treatment of electrostatics differs based on the charge model, force field, radius parameter in the continuum solvent model, and solvent dielectric constant. Generally, MM/PBSA outperforms MM/GBSA in predicting protein-protein binding free energies [15]. However, it is crucial to note that MM/PBSA’s sensitivity to the dielectric constant of the solute necessitates careful calibration based on the charge distribution of the binding interface in PPI complexes [15].
The utilization of artificial intelligence to predict protein-protein binding affinities is a recent development. Many approaches focus on determining the changes in binding free energy resulting from one or multiple mutations in PPI complexes. For instance, mmCSM-PPI [19], Geo-PPI [20], TopNetTree [21], and PPI-affinity [22] employ extra-tree, gradient-boosting trees, and support vector machine algorithms to achieve a Pearson’s correlation coefficients (r) of 0.75, 0.52, 0.79, and 0.78, respectively, between predicted and experimental data (ΔΔG) for the SKEMPI 2.0 database [23], thereby predicting changes in binding affinity upon mutations. In the study conducted by Romero-Molina et al., the PPI-affinity method demonstrated a general applicability for predicting the binding free energy of diverse PPI complexes [22]. The PPI affinity method achieved an r-value of 0.62 between experimental and predicted binding free energies for a training dataset comprising 833 PPI complexes (Test set 1). However, the r-value dropped to 0.50 when evaluated on a separate hold-out test dataset consisting of 90 PPI complexes (Test set 2) [22]. Furthermore, the performance of PPI-affinity was compared with other previously available methods to predict the protein-protein binding affinity on both Test set 1 and Test set 2. PRODIGY, another method which employs an SEEF approach, exhibited an r-value of 0.74 on Test set 1 (on which it was trained), but its performance declined with an r-value of 0.31 on Test set 2, indicating potential overfitting towards the benchmark dataset [24]. Additionally, DFIRE [25], CP_PIE [26], and ISLAND [27] displayed r-values of 0.10, -0.10, and 0.27, respectively, on the hold-out dataset (Test set 2). It is noteworthy that, all of these available methods utilize a SEEF in predicting the protein-protein binding-affinity.
On the other hand, EnCPdock [28], trained on a dataset comprising 3200 PPI complexes with binding free energies calculated using FoldX [29], employed a support vector regression approach. Cross-validation of EnCPdock yielded a maximum correlation (rmax) value of 0.745 between the target function (ΔGFoldX_norm) and the predicted output (ΔGEnCPdock_norm), with a corresponding maximum balanced accuracy (BACC) score of 0.833. Furthermore, EnCPdock’s performance was evaluated on two independent datasets, namely the Affinity benchmark dataset and the ‘SKEMPI + PROXiMATE–merged’ datasets, comprising 106 and 236 binary complexes, respectively. It achieved correlation coefficients of 0.45 and 0.52, respectively, between the predicted ΔGEnCPdock_norm and the actual binding free energies for these datasets. Furthermore, EnCPdock offers more than just an AI-predicted ΔGbinding; it also provides essential information such as electrostatic and surface complementarities (Sc, EC), surface area estimates, and other high-level structural descriptors used as input feature vectors. Additionally, EnCPdock delivers a binary PPI complex mapping in the Complementarity Plot (CP) (https://en.wikipedia.org/wiki/Complementarity_plot) [30] and generates interactive molecular graphics of the atomic contact network at the interface, along with a contact map for further analysis.
This comprehensive platform facilitates the direct visualization and analysis of specific native interactions (contacts) contributing to binding, offering insights into their stability or transience across a library of mutants. EnCPdock further furnishes individual feature trends and relative probability estimates (Prfmax) of the obtained feature-scores, providing a valuable tool for targeted protein interface design and aiding researchers in identifying structural defects, irregularities, and sub-optimality for subsequent redesign. Combining its wide array of features and applications, EnCPdock stands out as a unique online tool that will undoubtedly benefit structural biologists and researchers across related disciplines. Its capabilities offer valuable support in studying protein interactions and facilitating the design of dockable peptides, making it an invaluable resource for the scientific community.

2. Materials.

EnCPdock was developed utilizing several external programs for various tasks. The ’sc’ program, a part of the CCP4 package [31] was employed to quantify the shape complementarity at protein-protein interfaces – measured by directly implementing the original shape correlation statistic (Sc) formulated by Lawrence and Colman [32]. Sc was designed based on the cumulative alignment of the nearest neighboring dot surface points (unit normal vectors) of the interacting molecular (Connolly) surfaces [33] at protein – protein interfaces (binary complexes). On the other hand, the electrostatic complementarity (EC) function measures the complementarity of surface electrostatic potential at the protein – protein interacting surfaces, arising from the distribution of atomic partial charges across the whole molecular complex. For this purpose, the same molecular (Connolly) surfaces were constructed utilizing EDTSurf [34] (at 20 dots / Å2) and the surface electrostatic potentials on these dot surface points were computed by iteratively solving the Poisson – Boltzmann equation by the finite difference method of DelPhi [35] implementing its smoothed Gaussian dielectric function [36]. EC was then computed as the negetive correlation of appropriately chosen troughs of surface electrostatic potential values – as detailed in its original and adapted formulations [30,37].
To map a PPI complex based on its {Sc, EC} values (treated as an ordered pair), EnCPdock utilized the docking scoring version (CPdock [38]) of the two-dimensional Complementarity Plot (CP) [30]. The Complementarity Plot (CP) serves as a visual aid to validate the structural accuracy of atomic models, applicable to both folded globular proteins [30,39] and protein-protein interfaces [28,38,40]. The CPdock version of the plot represents shape complementarity (Sc) and electrostatic complementarity (EC) of the protein-protein complex attained at their interface on the X-axis, Y-axis respectively. For training, EnCPdock implemented a support vector regression machine with a radial basis function kernel, distributed as SVMlight [41]. The binding free energy (∆Gbinding) of the PPI complexes in the training and test datasets was determined using the standalone version (v.4) of FoldX (http://foldxsuite.crg.eu/) [42] which follows a "fragment-based strategy" utilizing fragment libraries similar to the "fragment assembly simulated annealing" technique for protein structure prediction [14,43]. Atoms that underwent a net change (non-zero) in solvent-accessible surface area (ASA) upon binding were identified as atoms at the protein-protein interface, wherein the ∆ASA was calculated by NACCESS [44] with a probe size of 1.4 Å, representing the hydrodynamic radius of water.

3. Methods.

3.1. Input Feature vectors.

EnCPdock’s training involves the use of thirteen input feature vectors, which serve as high-level, fine-grained structural descriptors for the overall protein complex or the protein-protein interface. These thirteen structural features employed in building EnCPdock can be broadly categorized into four groups. The first group comprises complementarity descriptors (Sc, EC), followed by accessibility descriptors (nBSA, nBSAp, nBSAnp, fracI) in the second group. The third group encompasses interfacial contact network descriptors (Ld, ACI, slopedd, Yinterdd, CCpdd), while the fourth group consists of size descriptors (logN, logasp). The definitions of each of these features are as follows.

3.1.1. Complementarity descriptors.

First and foremost, the parameter Sc, known as shape (or surface) complementarity [32], assesses the extent of topographical correlation (or, conjointness) between the molecular surfaces of two proteins at their interface. The interface is defined as the region where both proteins interact, remaining shielded from the solvent. When the Sc value is 1, it signifies that the molecular surfaces mesh precisely, indicating a strong (perfect) correlation. Conversely, a Sc value of 0 indicates that the surfaces of interest are not at all topographically correlated while a negative Sc is indicative of anti-correlation, often resulting from short contacts. Sc is calculated using the following formula,
S a , b = n a . n b e w . d a b 2 ; S c = m e a d i a n { S }
- where n a and n b are two unit normal normal vectors (outwardly and inwardly oriented respectively) corresponding to two nearest neighboring dot surface points taken orderedly (target → neighbor), located at dot surface points a and b on the two interacting surfaces, while d a b is the distance between the two points. The specified parameter (S(a,b)) is computed for every nearest neighboring ordered pair of points (a,b) located on the interacting surfaces contributed by the two partner proteins, while w is a scaling constant, traditionally set to 0.5 [32]. The ultimate shape complementarity value (for a specified target → neighbor pair of interacting surfaces) is determined as the median of this distribution for its left-skewness. The semi-empirical correlation statistic (Sc) is so designed that the effect of the short range van der Waals forces are precisely captured in a threshold dependent manner (S(a,b)~0 at dab~3.5 Å2 even for perfectly aligned unit normal vectors: na.nb=1), by and large, accounting only for the relative alignment of the unit normal vectors originating from the proximal nearest neighboring points [32,45].
Complementarity at macro-molecular (e.g., protein) interfaces dueals well beyond the local shape effects (captured by Sc) wherein the non-local complementarity is electrostatic in nature. To that end, electrostatic complementarity (EC) is yet another crucial feature which measures the extent of anti-corrrelation in surface electrostatic potentials at the two interacting surfaces arising from the distribution of atomic partial charges across the whole molecular complex [37]. A positive value of EC (trending to +1) indicates a good match (anti-correlation) in surface elctrostatic potentials between the two interacting surfaces, indicating strong complementarity. Conversely, a negative value of EC (trending to -1) suggests a similar (and hence not complementary) surface electrostatic potentials of the two partners at their interface. Mathematically, EC is taken as the negative of the Pearson’s correlation of corresponding surface electrostatic potentials [28,37], represented by the following expression,
E C = i = 1 N φ i φ ¯ φ i φ ¯ i = 1 N φ i φ ¯ 2 i = 1 N φ i φ ¯ 2
- where φ i is the potential realized on the ith interfacial dot surface point due to its own atoms and φ i , due to the atoms of the partner (protein) molecule, φ ¯ and φ ¯ are the mean potentials of φ i i= 1, 2, ..., N, and φ i i= 1, 2, ..., N respectively (for a given interfacial surface consisting of a total of N dot surface points).
Both Sc and EC are thus correlation functions having similar trends, identical ranges [–1, 1], and, are not necessarily reciprocative in nature. Hence, in both cases, the correlations are computed twice (once by taking each interacting surface as the target and its partner as the neighbor) followed by taking their arithmatic mean [32,37].

3.1.2. Accessibility descriptors.

Upon the formation of a protein complex, certain regions of the molecular surfaces from both partner proteins become less accessible to the solvent due to their interaction. To quantify this change in solvent accessible surface area, we employ the concept of normalized buried surface area (nBSA) using the following formula,
n B S A = i = 1 A Δ A S A i + i = 1 B Δ A S A i i = 1 A + B Δ A S A i
Here, i = 1 A Δ A S A i and i = 1 B Δ A S A i represent the net change in solvent accessible surface area (SASA) for all the atoms of protein A and B, respectively, before and after the complex formation. The resulting value is then normalized by the total change in solvent accessible surface area that occurs when partners A and B form the complex. During the computation of nBSA, the alteration in solvent accessible surface area (ΔASA(i)) is taken into account for all types of atoms. However, to determine the distinct contributions from polar and non-polar atoms, we separately calculate the changes in solvent accessible surface area for each group, which are termed nBSAp and nBSAnp respectively.
Another significant accessibility-based feature in the context of protein-protein interactions is fracI. This feature can be defined as the ratio of number of interfacial residues to the total number of residues contributed by both interacting protein partners (as follows).
f r a c I = N i n t r e s N t o t
Here, N i n t r e s represents the number of interfacial residues, while N t o t corresponds to the total number of residues within the protein-protein complex.

3.1.3. Interfacial contact network descriptors.

In addition to the complementarity and accessibility-based features, there are also network-based features. When a receptor and a ligand form a complex, it results in a contact interaction between the interfacial residues contributed by both partners at their interface. The criteria for residues being in contact with each other involve having any non-hydrogen atom from one residue within a distance of 4Å from that of another residue. Residues are connected with a link if they are contributed by the two interacting partners and are in contact with each other. By observing the contact map, one can visualize the interactions between residues from the two interacting protein partners. A crucial factor concerning the contact network of a PPI complex is the link density (Ld). This parameter is defined as the ratio of the actual number of contacts between the receptor and the ligand to the theoritical maximum number of contacts that can occur between them. To elaborate, if the receptor and the ligand have N1 and N2 interfacial residues in physical contact with one or more residues from their partner molecules, and Nicnt is the count of inter-chain inter-residue contacts formed at the receptor-ligand interface, then Ld can be expressed as follows,
L d = N i c n t N 1 × N 2
It is to be noted that by definition, the PPI contact networks would be bi-partitie. While, link density (Ld) provides insight into the overall number of contacts formed among the maximum possible contacts, the Average Contact Intensity (ACI) (defined by the following expression) assesses the average strength of contact interactions for each inter-residue inter-chain link formed at the interface. To calculate the average strength, the number of interatomic (inter-residue, inter-chain) contacts atcon(i) formed by each (ith) link were we summed up and divided by the total number of interfacial links (Nicnt) formed in the bi-partite PPI network.
A C I = i N i c n t a t c o n i N i c n t
It is worth noting that when the receptor and the ligand have N1 and N2 interfacial residues in physical contact with one or more residues from their partner molecules, the resulting adjacency matrix will consist of N1xN2 elements. If two residues, i from the receptor and j from the ligand, actually form a contact, the (i, j)-th element of the adjacency matrix will be 1; otherwise, it will be 0. In brief, the adjacency matrix provides a visual representation of which residues from the receptor form contact with specific residues from the ligand. If a particular residue (or node) from the receptor establishes contact with n residues from the ligand individually, then the degree (or connectivity) of that specific residue or node from the receptor will be n. When we plot the frequencies converted to a log scale (Y-axis) against the degrees converted to a log scale (X-axis), a degree distribution graph for a PPI complex is obtained. According to the power law, this degree distribution profile can be represented by a straight line, characterized by a specific slope (slopedd) and a specific intercept (Yinterdd). These two parameters, slopedd and Yinterdd, hold significance to interpret the patterns in the degree distribution graph for PPI complexes. To obtain the expected y-value (Yexp; logarithmic frequency value) for each observed x-value (logarithm of degree for each node), we use the relation provided below.
Y e x p = s l o p e d d X o b s + Y i n t e r d d
The corresponding observed ordinate (Yobs) is also obtained. The Pearson’s correlation coefficient between Yexp and Yobs, termed as CCpdd, serves as an interesting feature in understanding the degree distribution profile of protein contact networks. The CCpdd can be calculated using the following formula,
C C p d d = c o v Y e x p , Y o b s σ Y e x p σ Y o b s
Here, c o v Y e x p , Y o b s represents the covariance between parameters Yexp and Yobs, while, σ Y e x p and σ Y o b s are variance of the expected and observed ordinate.

3.1.4. Size descriptors.

Two distinct features were constructed based on the chain lengths of the interacting protein partners. The molecule with the longer chain is referred to as the receptor, while the one with the shorter chain is designated as the ligand. If the chain length of the receptor is represented by lenR and that of the ligand molecule by lenL, the logarithm of their combined length is denoted as logN, and the logarithm of their length ratio is termed as logasp (analogous to an aspect ratio). These two parameters, calculated using the following formulas, together, takes into account the relative and absolute sizes (in terms of chain length – which could in turn be interpreated as molecular mass) of the molecular complex.
l o g N = l o g 10 l e n R + l e n L
l o g a s p = l o g 10 l e n R l e n L

3.2. Training and Performance.

EnCPdock was trained on a dataset comprising 3200 binary PPI complexes with high resolution (better than or equal to 2Å) crystal structures, curated from the RCSB PDB [46] database. The details of the curation can be found in the original EnCPdock paper [28]. The free-energy of binding (ΔGbinding) for each complex was calculated using the standalone version (v.4) of FoldX [29]. Importantly, the ΔGbinding value was normalized by the number of interfacial residues in each case. Input feature vectors were computed for these PPI complexes using a combination of external (as detailed above) and in-built programs written in FORTRAN90, PERL (v5.26.1), PYTHON3.6 along with BASH scripts – as per requirement. With the FoldX-derived and normalized ΔGbinding value (taken as the target function) and the thirteen input feature vectors, EnCPdock was trained using the radial basis function kernel of the SVMlight module, with ten-fold cross-validation to predict normalized ΔGbinding for each PPI complex in the database. A maximum correlation of r=0.745 was obtained between the predicted ΔGbinding and FoldX derived ΔGbinding during cross validation, and the 90 models1 that exhibited correlation of r=0.745, were further utilized in the independent validation.
The independent validation was performed on three independent datasets with experimentally determined binding free energy: an affinity benchmark dataset [47,48] containing 106 PPI complexes and another dataset combining PROXiMATE [49] and SKEMPI [23], consisting of 236 PPI complexes. The binding free energy for each complex in these datasets was predicted using the 90 models, and the median of the 90 predicted values was taken as the predicted binding free energy from EnCPdock. The correlation coefficients for the predicted binding free energy and the experimental binding free energy (obtained from the database) were found to be 0.48 and 0.63 for the affinity benchmark and ‘SKEMPI + PROXiMATE–merged’ datasets, respectively. These correlation coefficients in predicting ΔGbinding are comparable to other state-of-the-art methods for predicting binding free energy (as detailed in the original EnCPdock paper [28]). In addition to the binding free energy, EnCPdock provides other valuable information about the binding and interface properties of the PPI complex – to be discussed in subsequent sections.

3.3. Output Features.

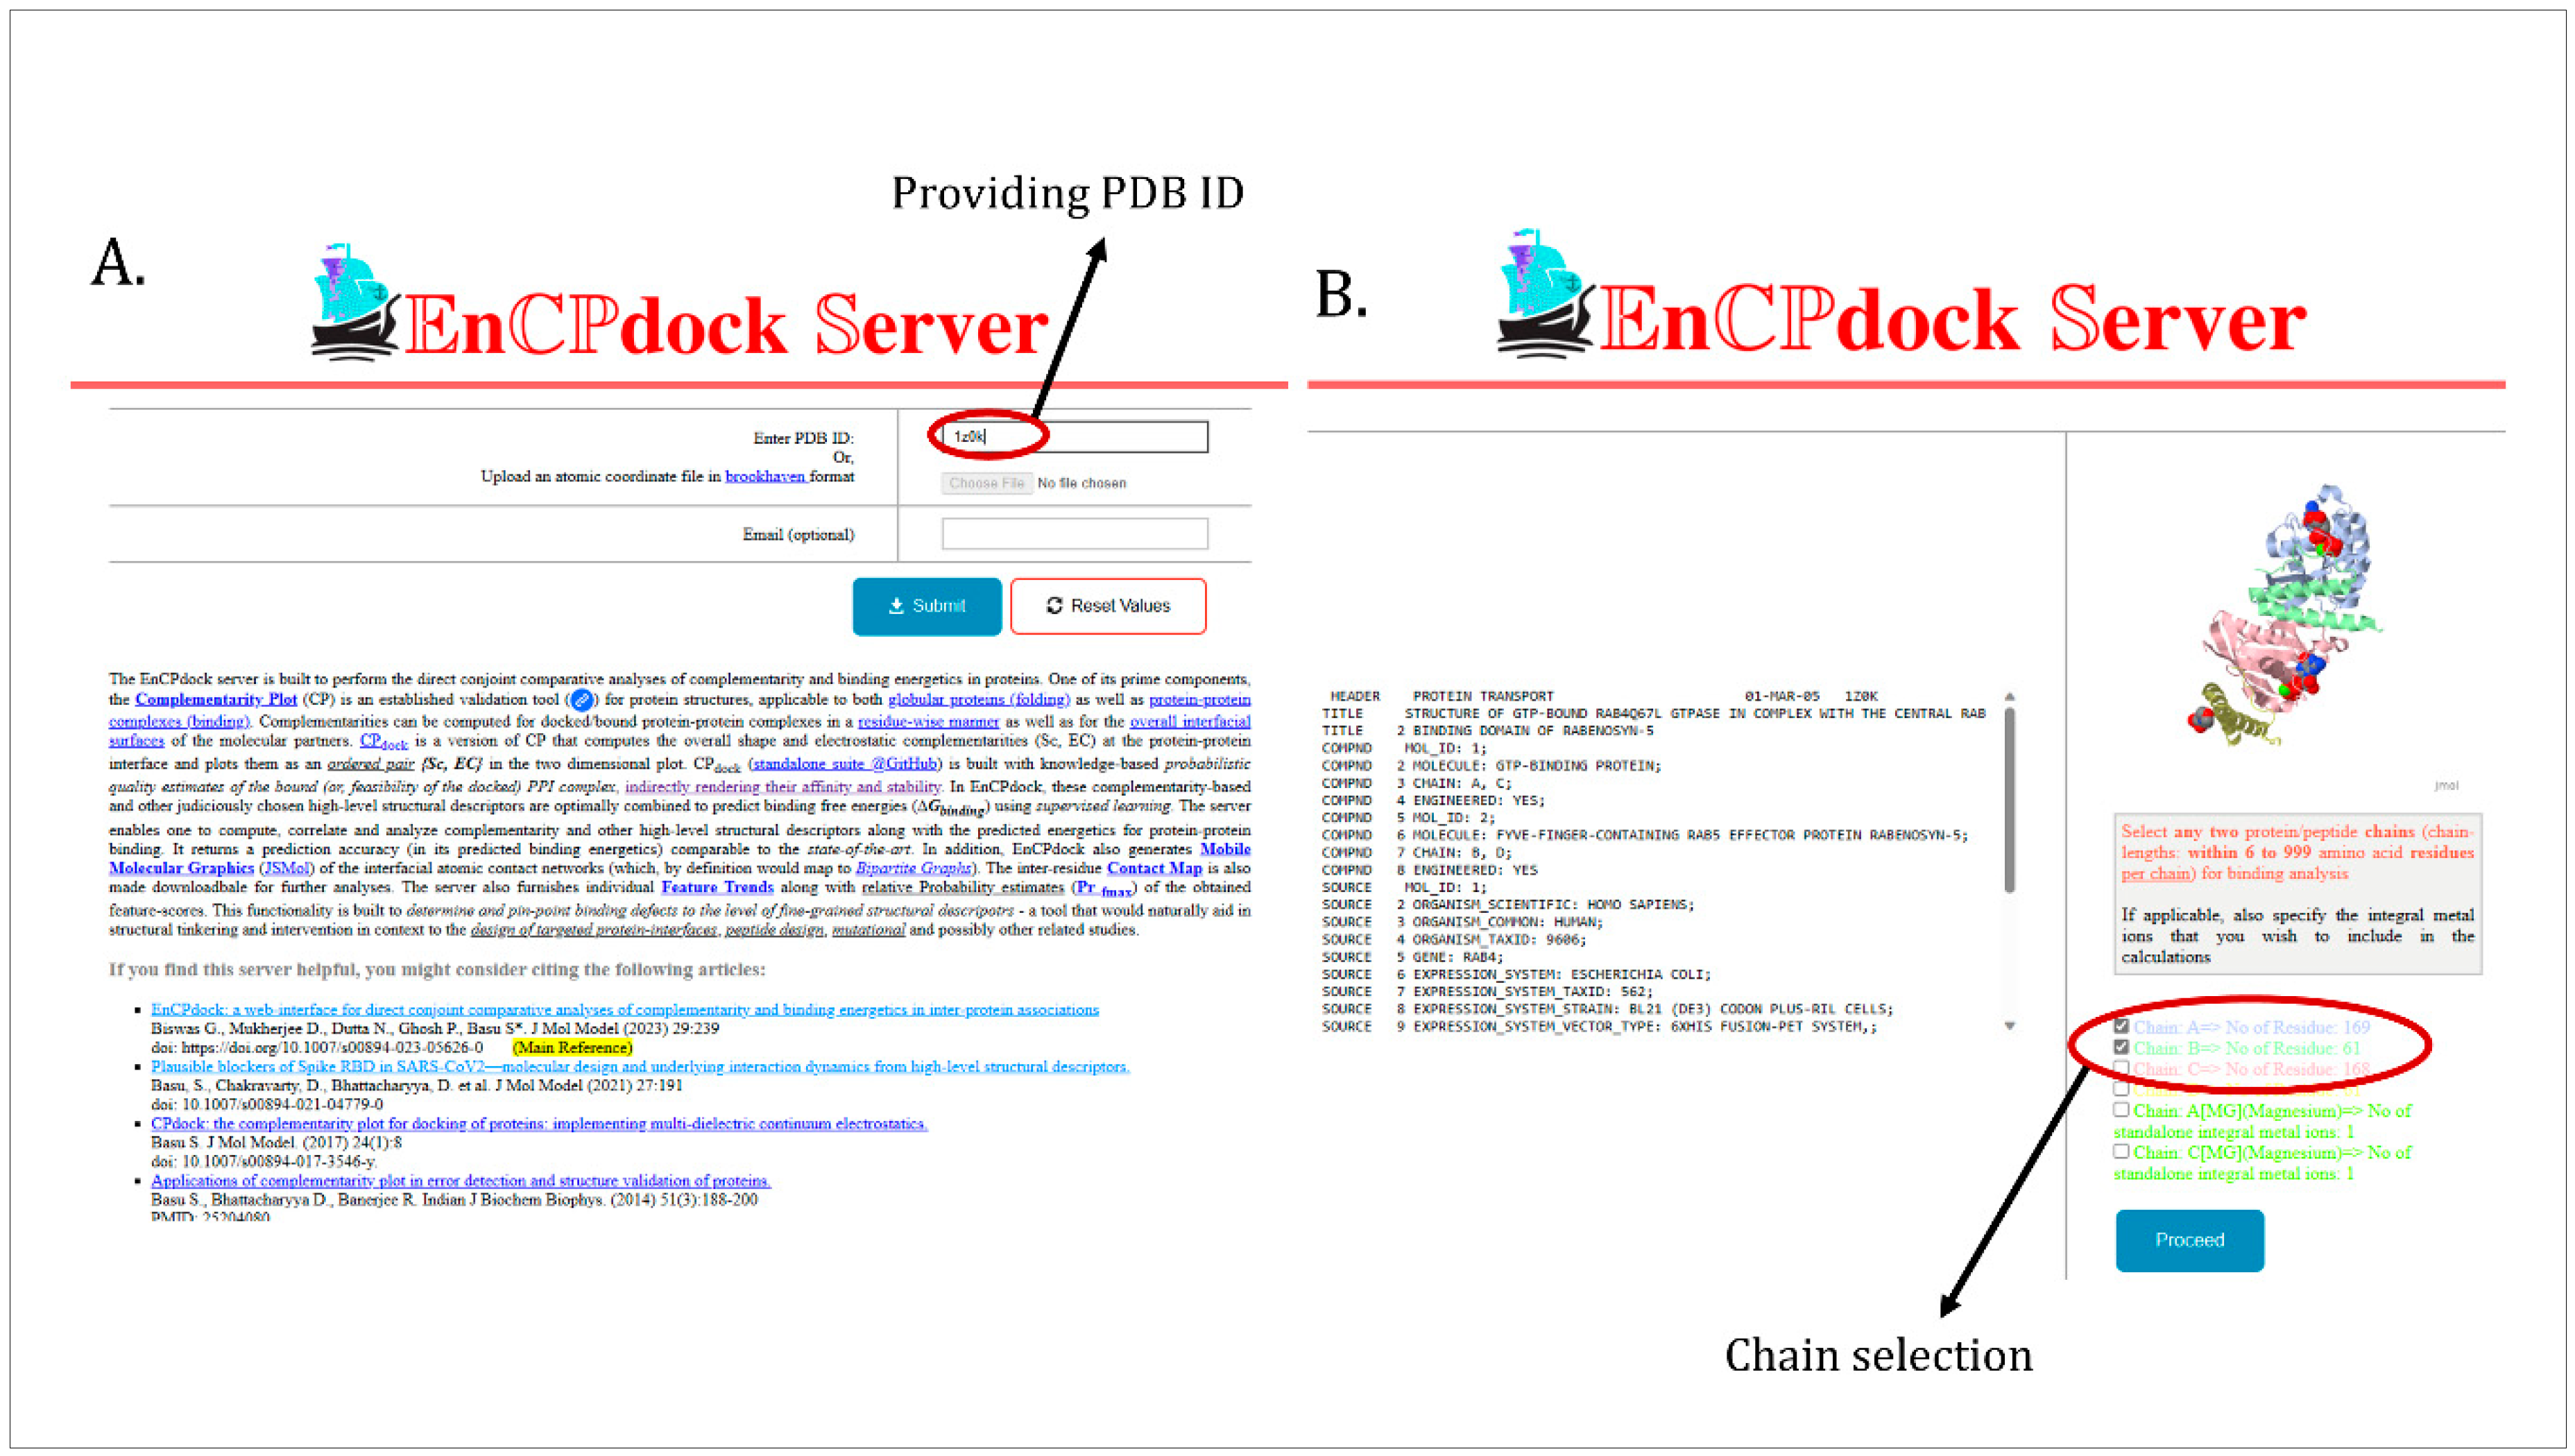
The EnCPdock server serves as a user-friendly web-interface, available at https://scinetmol.in/EnCPdock/, designed for the comprehensive analysis of complementarity and binding energetics in protein associations. To utilize the EnCPdock server, one must first obtain a PDB structure of a binary PPI complex. Users have the option to fetch experimental structures (of protein-protein/peptide complexes) directly from the RCSB PDB database (Figure 1A) by providing their 4-letter PDB Ids or alternatively upload their own coordinate file(s) writen in the brookhaven (PDB) format (https://www.ebi.ac.uk/thornton-srv/software/PROCHECK/manual/manappb.html). As the provided PPI complex might consist of multiple chains, it becomes essential to carefully select the chain names as they are identified in the provided PDB file (Figure 1B). We recommend users to view the structure in any molecular viewer to accurately identify the correct chains and provide this information to the EnCPdock server at the next step. Upon providing all the necessary information, the EnCPdock server will process the data, which may take some time (~1-2 min at an average). Subsequently, the server will furnish its analysis of the given PPI complex in four distinct panels. In the forthcoming section, we will delve into each of the four panels separately, illustrated with an example PPI complex.
Figure 1. Workflow for utilizing the EnCPdock server. A. Fetching or uplodaing input coordinate file(s). for the desired protein complex. B. Selection of a pair of chains (binary interaction) from the complex.
Preprints 87984 g001

3.3.1. Scores and Plots.

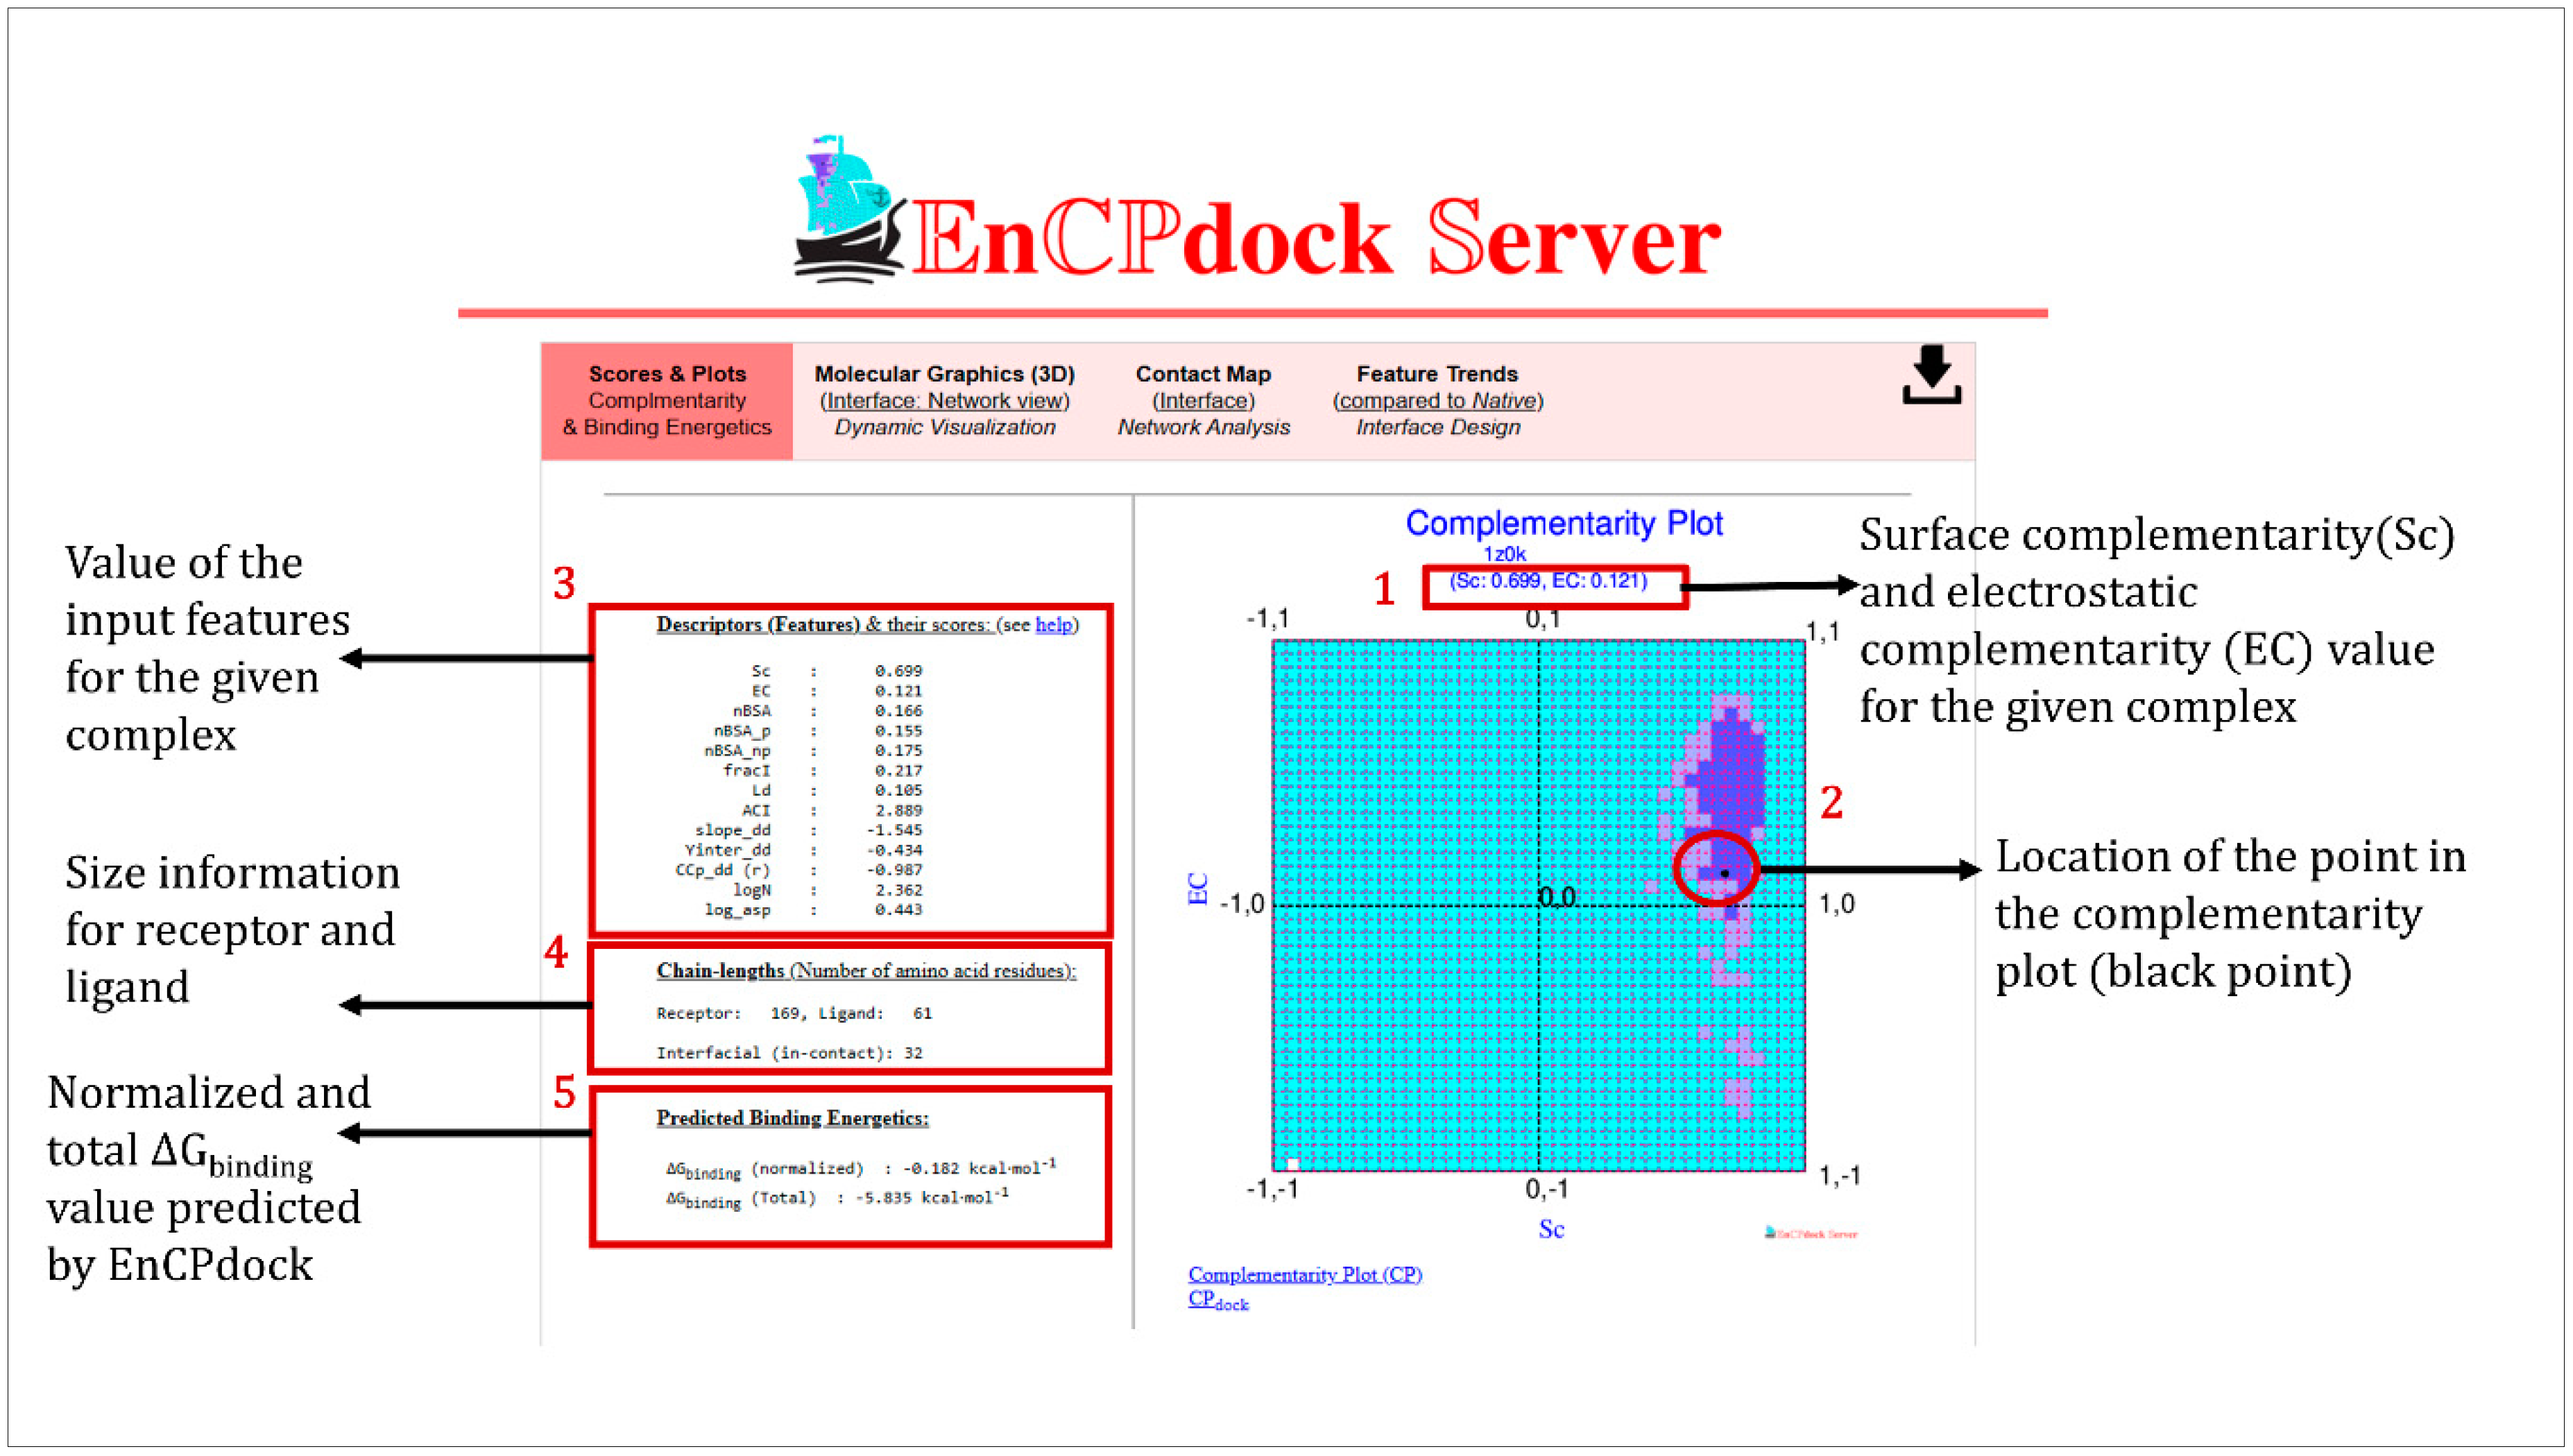
The default first panel in the EnCPdock server provides essential insights into the complementarity and binding energetics of the given PPI complex. On the right-hand side of this panel, users can find the Sc and EC values hit by the specified complex (Figure 2, item 1) along with the scores obtained for the other input feature vectors. Additionally, the mapping (location) of the query structure on the Complementarity Plot (CPdock) is presented (Figure 2, item 2). CPdock [38] is constructed based on a probabilistic representation of preferred amino acid side-chain orientations, delineated into three regions on the plot: ’probable,’ ’less probable,’ and ’improbable.’ These regions are color-coded with ‘purple’, ‘mauve’, and ‘sky-blue’ respectively [39]. For the provided example PPI complex (PDB ID: 1Z0K), a Sc value of 0.699 is indicated, which is considered very good while the EC value of 0.119 is characterized as moderate since (both Sc, EC ranges from -1 to +1). Notably, the location of the given PPI complex on CPdock is depicted as a black point, positioned in the ’probable’ region of the plot. This placement suggests a favorable structural configuration in terms of complementarity (local and non-local – combined) for the provided complex.
Figure 2. Overview of EnCPdock analysis regarding complementarity and binding energetics for a PPI complex. 1. The server provides the values of Sc and EC for the given PPI complex, 2. The location of the query PPI complex is indicated in the complementarity plot, 3. The server presents the calculated values of all input feature vectors for the given complex, 4. Information regarding chain lengths and the number of interfacial residues is included, 5. The normalized and total binding free energy predicted by EnCPdock for the given PPI complex is also provided.
Preprints 87984 g002
Further, on the left-hand side of this default first panel, users can find the values of the thirteen input feature vectors tabulated (Figure 2, item 3), encompassing various categories such as complementarity-based, surface area-based, degree distribution profile-based, and length-based features. For instance, in the given example (PDB ID: 1Z0K), the attained nBSA value is 0.166, indicating approximately 16.6% decrease of solvent-accessible surface area upon binding (complexation). Likewise, the nBSAp and nBSAnp values (0.155, 0.175 respectively) imply the fraction of polar and non-polar surface getting buried upon complexation. Furthermore, the fracI value of 0.217 signifies that around 21.7% of the total residues from both chain A and chain B are interfacial residues. Among the network parameters, the link density (Ld) value of 0.105 indicates that 10.5% of all possible contacts between the interfacial residues of the two interacting chains have actually formed in the query PPI complex. Additionally, the average contact intensity (ACI) value of 2.889 reveals that, on average, ~3 interatomic contacts had formed for each inter-residue inter-chain link in the given PPI complex.
Moreover, from the degree distribution profile of the PPI complex, the obtained values for slopedd and Yinterdd are -1.545 and -0.545 for the given PPI complex respectively. Together the slope and the Y-intercept of the degree distribution profile reflects the extent of scale-freeness [50] of networks (i.e., preferential attachments of new nodes to already existing high-degree nodes in a network) suggestive of hub-like nodes (attractant) in the network. Specifically, a negative slopedd of arround this magnitude (~1.6) signatures for approaching scal-freeness in power-law (degree) distributions (i.e., γ ~ 2-3 in Y=k.X). This may be practically relevant for targeted interface design. Using these slopedd and Yinterdd values, one can determine an expected ordinate (Yexp) for each observed abscissa (Xobs) and thereby a goodness of fit (CCpdd; -0.987 for the given complex) between the expected and the observed ordinates (Yexp, Yobs). Furthermore, the logN and logasp values are found to be 2.362 and 0.443, respectively, providing additional insights into the absolute and comparative size of the binding partners in the given PPI complex. From this, the intuitive shape of the binding partners (analogous to an aspect ratio) and the complex can be guessed. Additionally, the ‘Scores and Plots’ panel also directly returns the individual chain lengths of the receptor and the ligand and the number of interfacial residues (item 4, Figure 2). Finally, EnCPdock provides the normalized and total ΔGbinding values (-0.182 & -5.835 kcal.mole-1 for the given complex) – the later of which can simply be obtained by multiplying the former with the total number of interfacial residues (item 5, Figure 2).

3.1.2. Molecular graphics, contact maps, and feature trends:
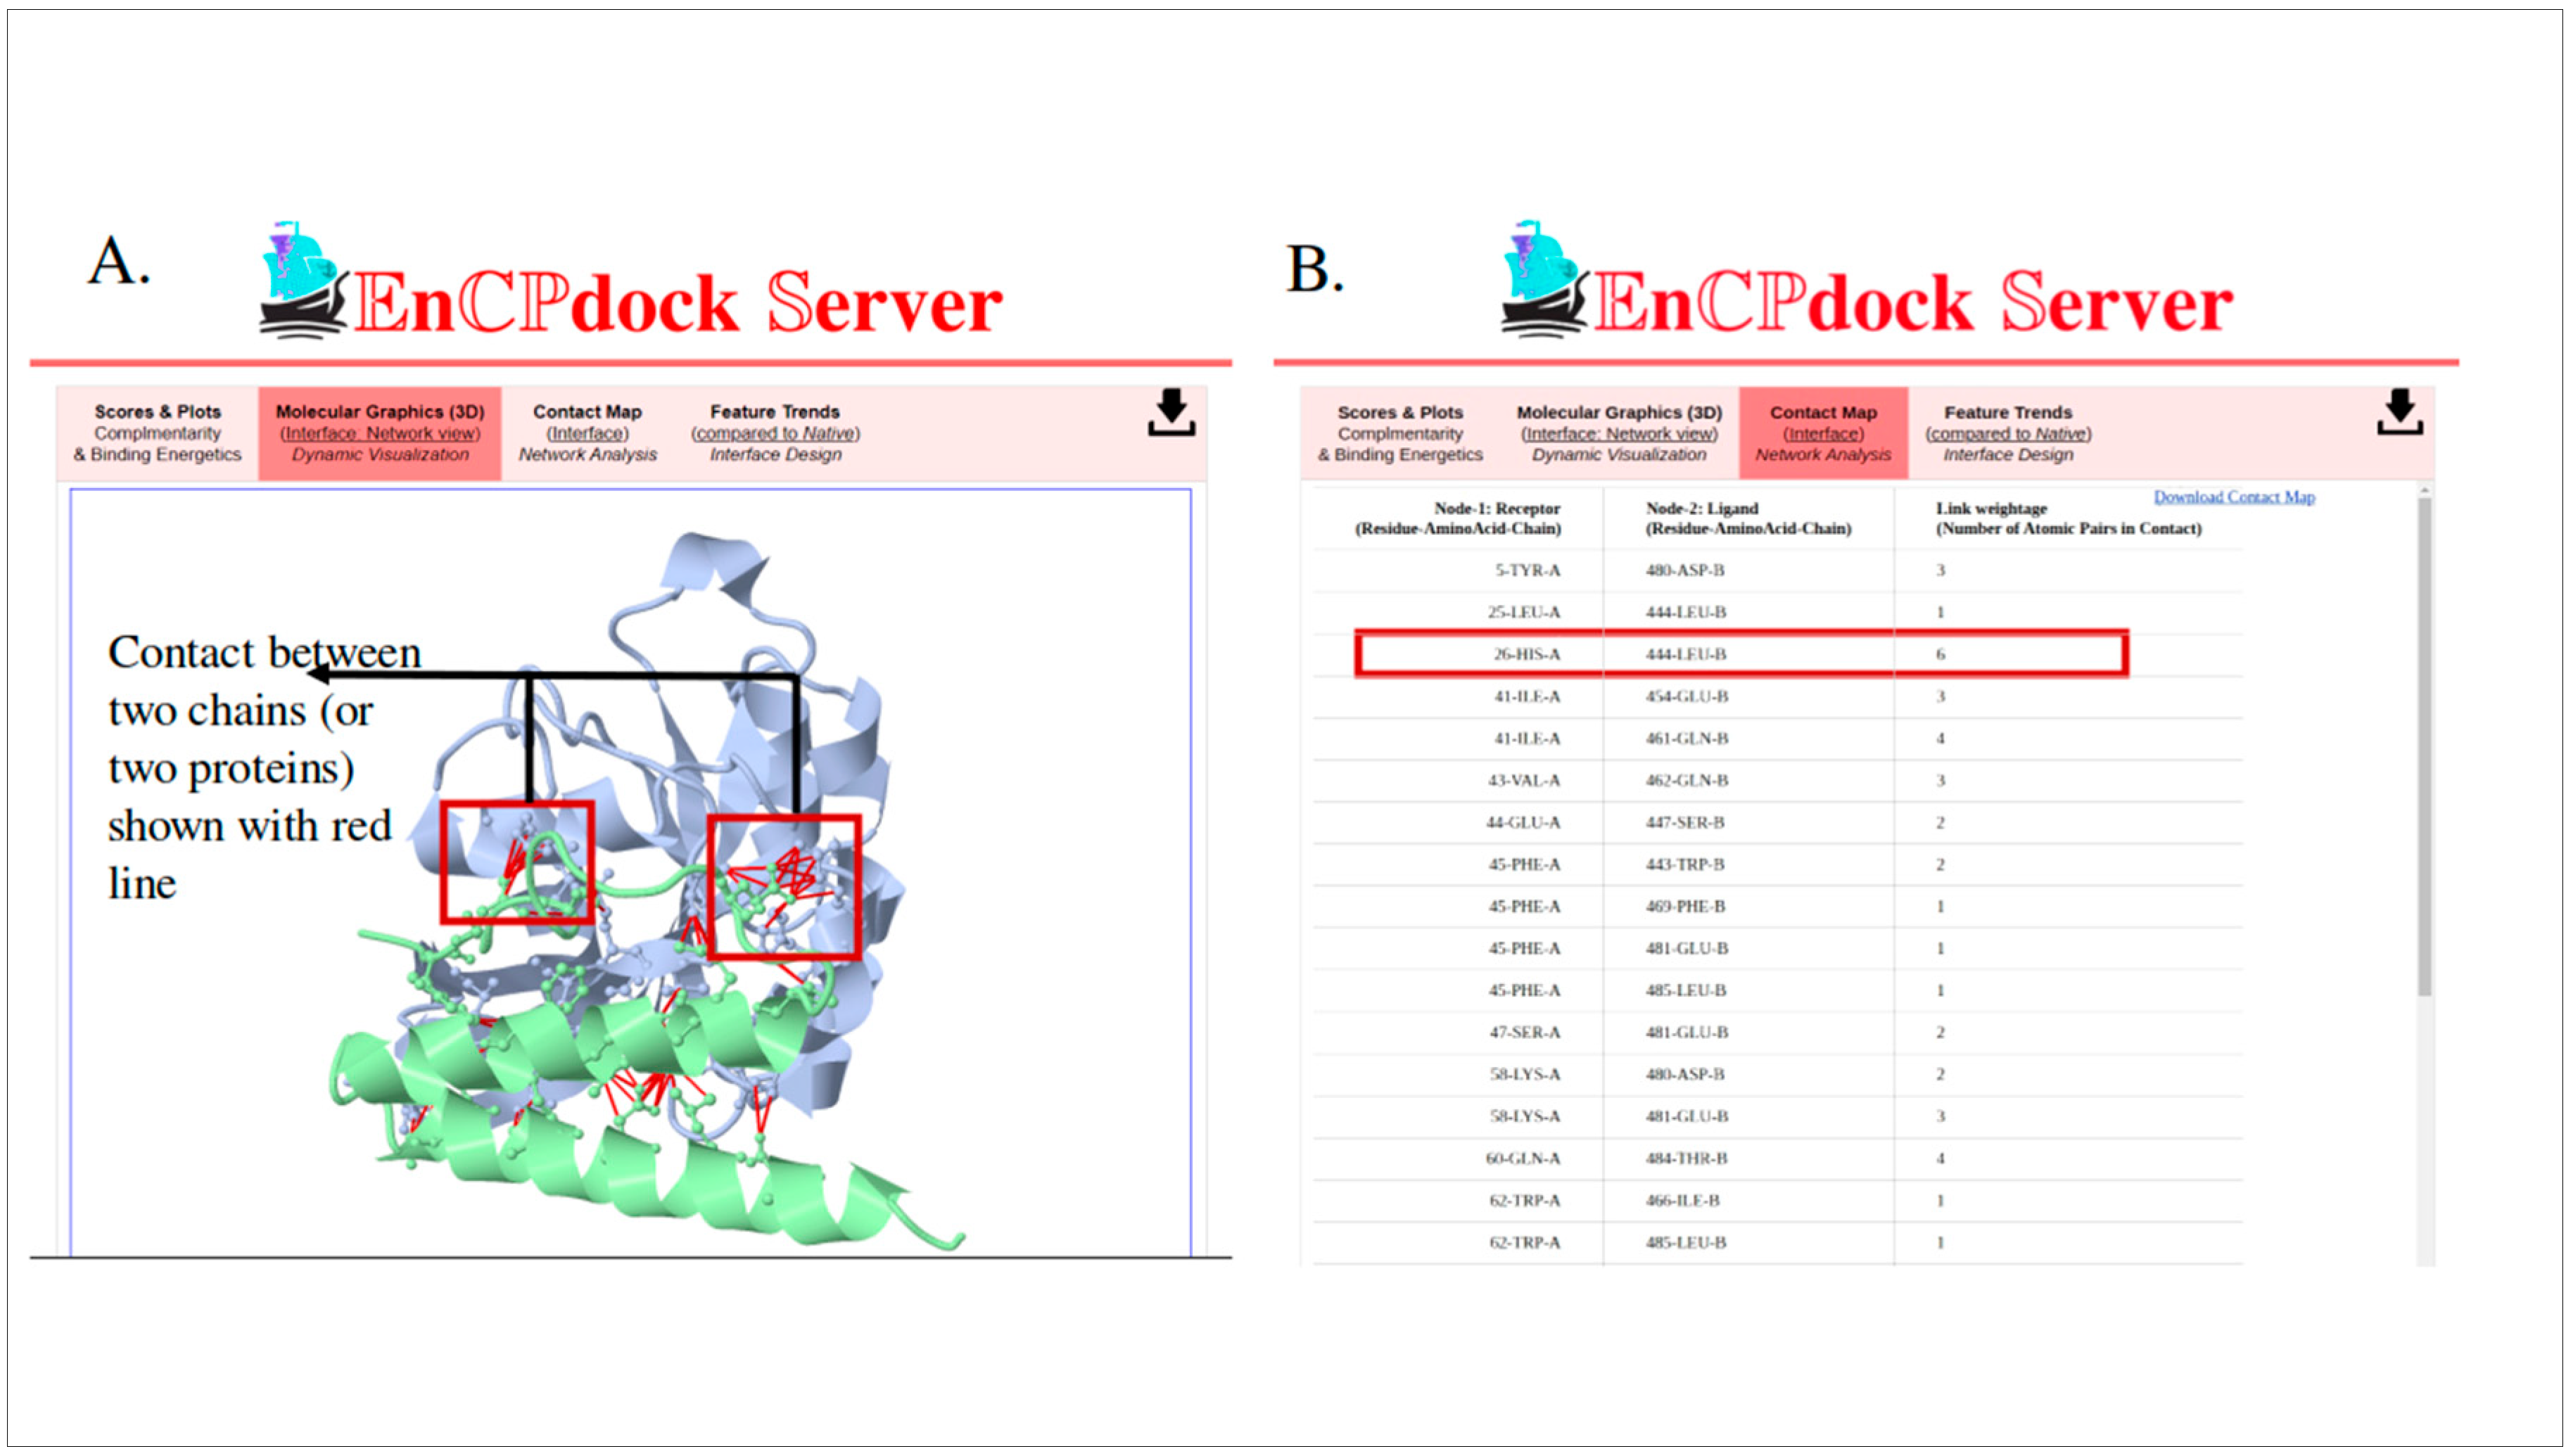
In the second panel dedicated to molecular graphics, one can interactively explore the interaction between the two partners using JSmol. Both chains can be displayed in different colors, with protein chains shown in a cartoon representation and interface residues represented with ball and stick models. The visualization includes red lines connecting atoms in contact with each other (Figure 3A). The structure is easily rotatable and can be oriented for optimal viewing. To obtain high-resolution still images of specific orientations of the complex, one may right-click on the window and follow the options: File > Export > Export PNG image.
Figure 3. Visualization of Protein Surface Interaction and Contact Map. A. Two interacting protein molecules are depicted in different colors. The interfacial residues are represented with ball and stick models, and interatomic inter-chain links between residues are shown in red lines, B. The contact map is presented in a tabulated form. The first and second columns display the nodes (in <‘residue number’–‘residue type’–‘chain ID’> format) coming from the first and second chains (alphanumerically sorted) respectively that are in contact (i.e., connected by a link). The third column indicates the total number of interatomic contacts (i.e., contact intensity) for each inter-residue inter-chain (i.e., interfacial) link.
Preprints 87984 g003
The contact map panel illustrates interactions between residues from the interacting protein partners (Figure 3B). In the marked portion of the figure, one can observe that six atoms from residue number 26 in chain A (receptor) interact with any heavy atoms from residue number 444 in chain B (ligand). Notably, residue 26 in chain A is histidine, while residue 444 in chain B is lysine. The right-most column indicates the total number of atomic pairs in contact with each other from the given two residues (Figure 3B). Adjacency matrices can then be derived from the contact map for subsequent network analyses.
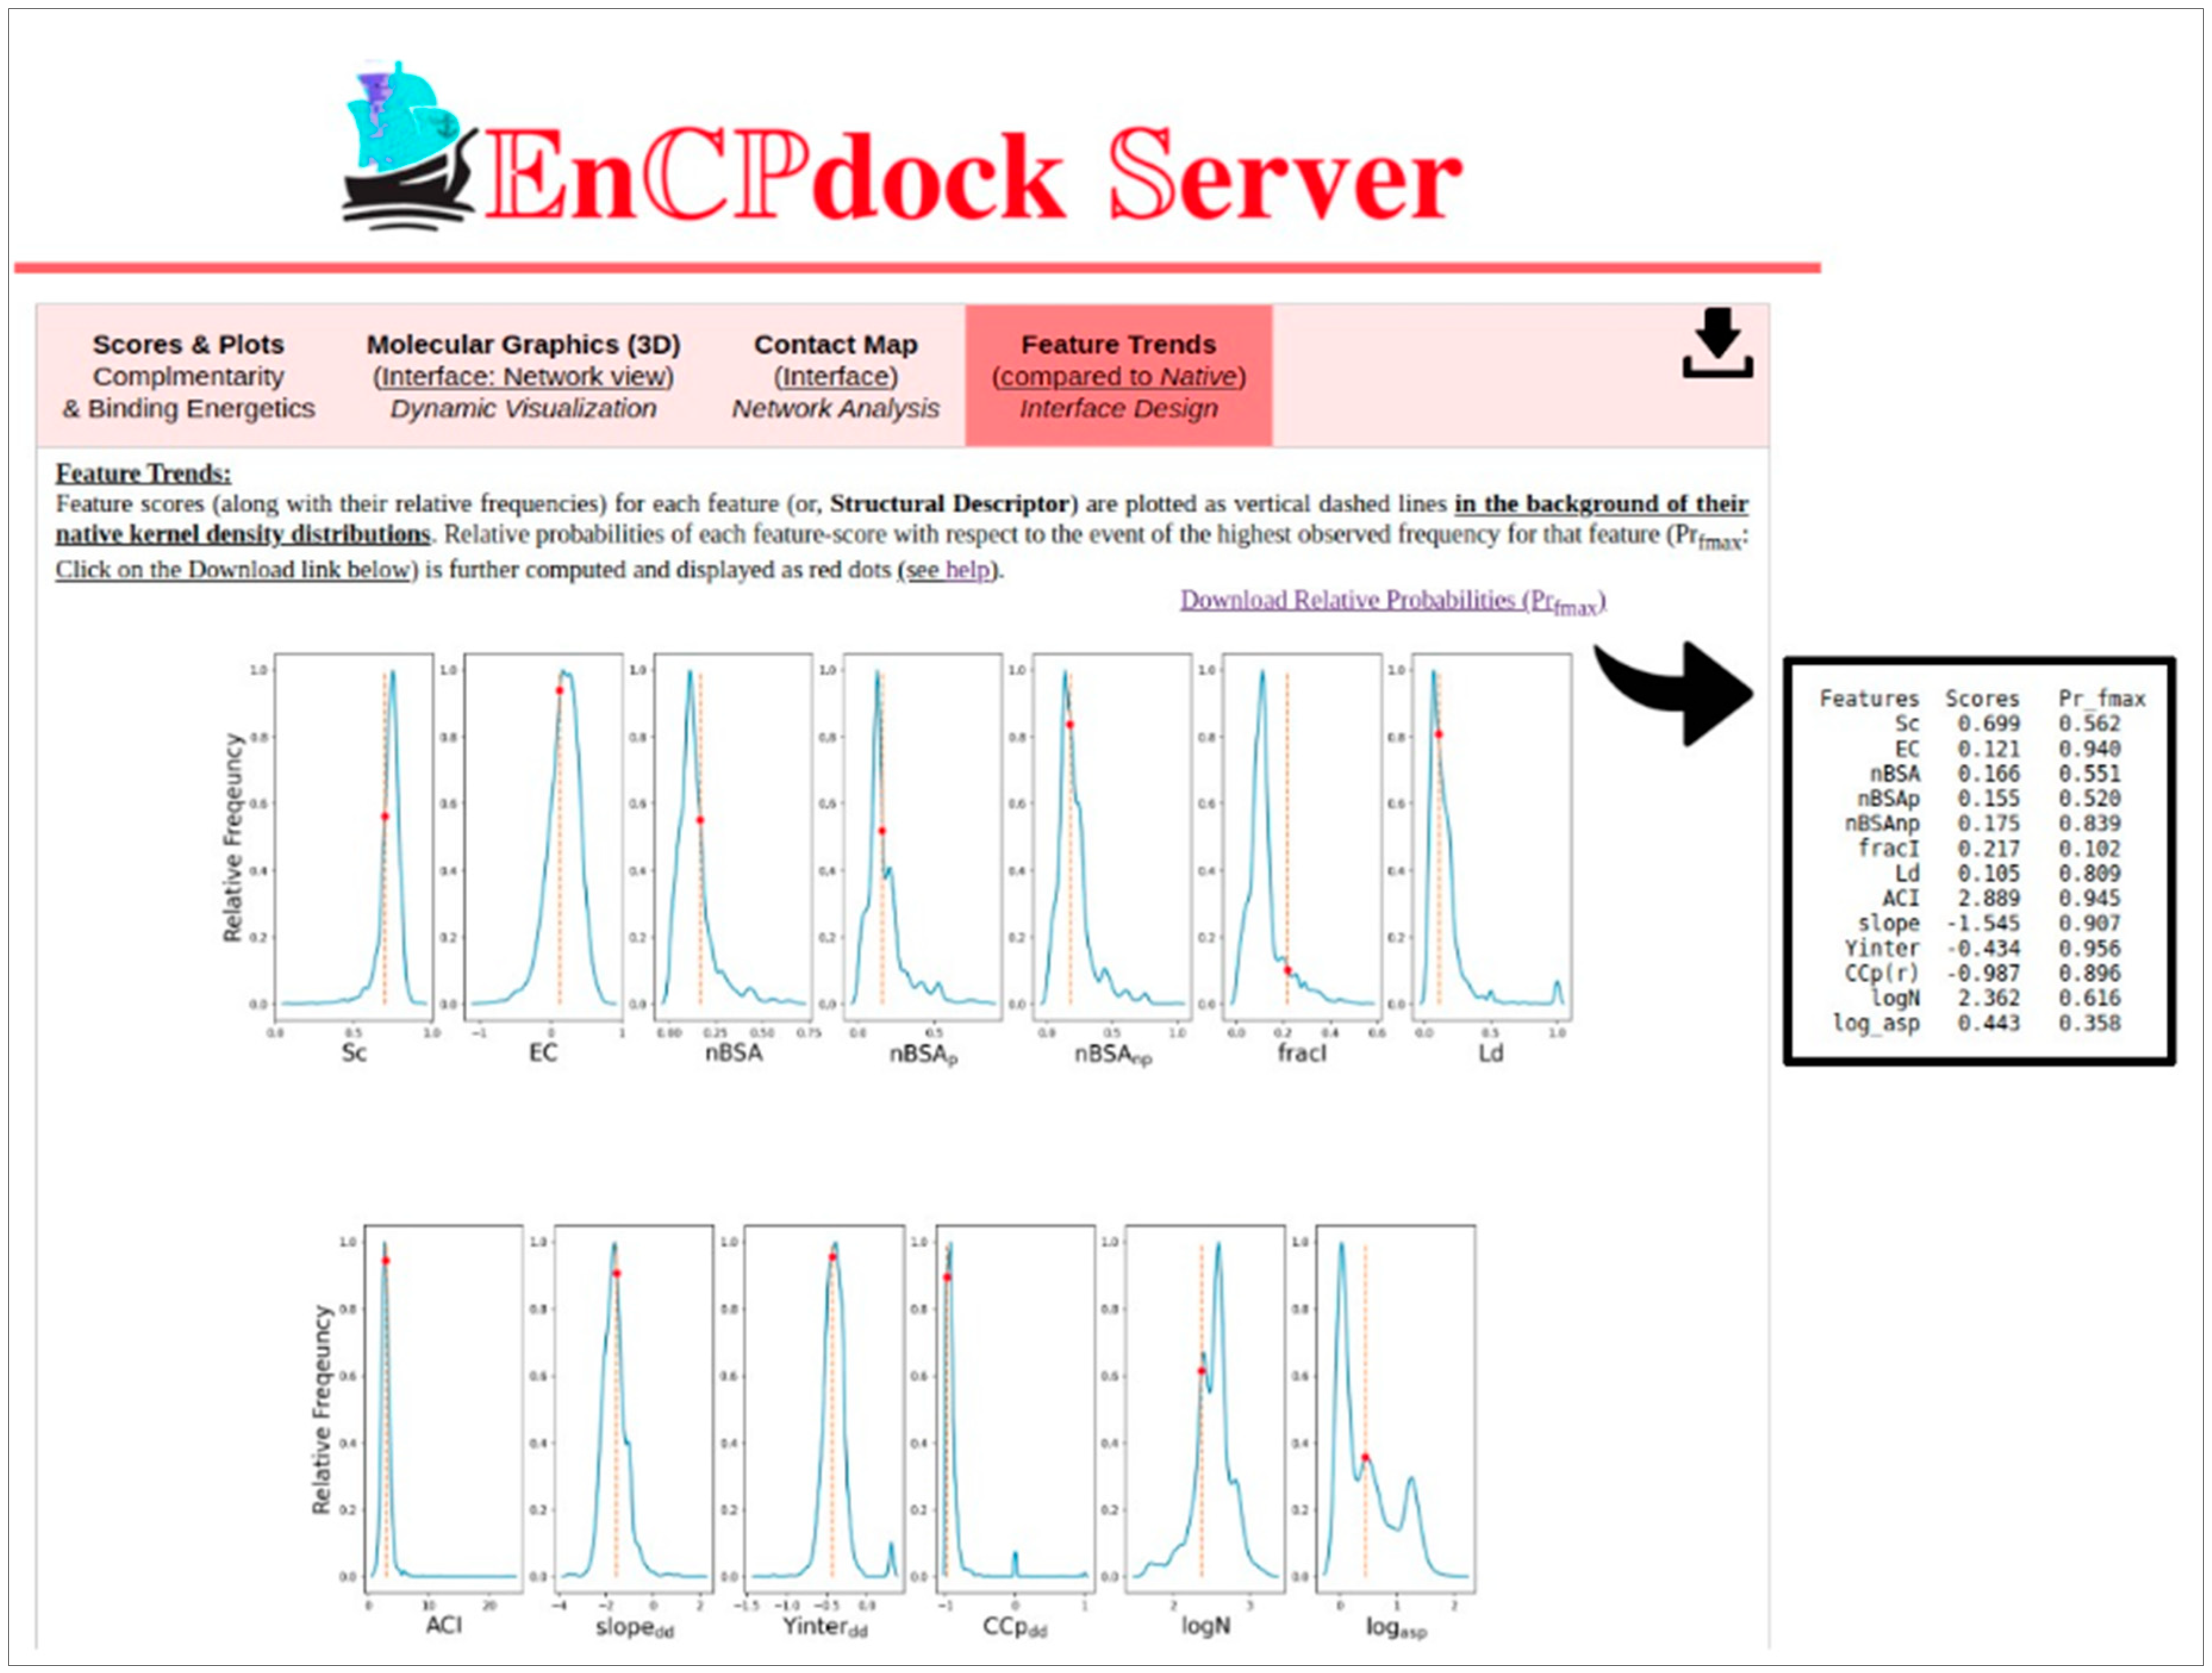
The fourth panel (Figure 4) showcases the Feature trends for each high-level structural descriptor utilized as input feature vectors during EnCPdock training. It presents their respective native kernel density distributions and calculates the relative probabilities of each feature-score in relation to the event with the highest observed frequency for that specific feature (Prfmax). These relative probability estimates provide insights into whether an input PPI complex is categorized as regular or terminal cases based on the acquired feature-scores for each descriptor. This functionality is purposely designed to facilitate various tasks such as structural tinkering, intervention, targeted design of protein interfaces, mutational studies, and peptide design.
Figure 4. Relative probability estimates for input feature vectors in the given PPI complex. The red point represents the relative probability estimate for the thirteen input feature vectors in the given PPI complex. The corresponding value on the x-axis is indicated by an orange line extending from the point to the x-axis. The background depicts the relative probability density distribution for the same thirteen features in the training dataset.
Preprints 87984 g004
Moreover, a download button is conveniently placed on the top right tab bar, allowing users to easily download the entire OUTPUT folder (zipped) for local analyses and local visualization purposes.

4. Conclusion.

In conclusion, EnCPdock was developed with the primary aim of creating an extensive web interface for conducting comprehensive comparative analyses of physicochemically relevant high-level structural descriptors, with a particular focus on complementarity, and the binding energetics of interacting protein partners. With this broad objective in mind, the current version of the web server provides detailed interface properties of binary PPI complexes, encompassing complementarity and other high-level structural features. Additionally, it offers predictive capabilities for the free energies of binding, including both average interfacial contribution and total values, derived from atomic coordinates. Furthermore, the web server allows users to generate mobile molecular graphics using JSmol, enabling them to explore the interfacial atomic contact network and access the contact map of the interface. Moreover, users have the opportunity to analyze trends of individual features (Sc, Ld etc.) against their native (kernel density) distributions. This analytical capability proves to be beneficial for structural tinkering and intervention, applicable to the comparison of docked poses and the interface design of targeted complexes. For demosntrative case studies presenting specific applications of EnCPdock (for example, in probing peptide binding specifcity, mutational efects) the readers are requested to read the original EnCPdock paper [28]. In summary, EnCPdock presents itself as a powerful tool in the field of structural bioinformatics, empowering researchers to conduct in-depth investigations into protein-protein/peptide interactions and their associated binding energetics. Its user-friendly interface, comprehensive analyses, and visualization options make it a valuable asset for advancing our understanding of protein interactions and supporting various applications, including drug discovery and protein interface engineering efforts.
Top 9 sets hitting the same highest correlation of r=0.745 × 10 models for the ten-fold cross validation (for each set)

References

  1. Feng Y, Wang Q, Wang T (2017) Drug Target Protein-Protein Interaction Networks: A Systematic Perspective. BioMed Res Int 2017:1–13. https://doi.org/10.1155/2017/1289259. [CrossRef]
  2. Sable R, Jois S (2015) Surfing the Protein-Protein Interaction Surface Using Docking Methods: Application to the Design of PPI Inhibitors. Molecules 20:11569–11603. https://doi.org/10.3390/molecules200611569. [CrossRef]
  3. Keskin O, Gursoy A, Ma B, Nussinov R (2008) Principles of Protein−Protein Interactions: What are the Preferred Ways For Proteins To Interact? Chem Rev 108:1225–1244. https://doi.org/10.1021/cr040409x. [CrossRef]
  4. Zhang QC, Petrey D, Deng L, et al (2012) Structure-based prediction of protein–protein interactions on a genome-wide scale. Nature 490:556–560. https://doi.org/10.1038/nature11503. [CrossRef]
  5. Bryant P, Pozzati G, Elofsson A (2022) Improved prediction of protein-protein interactions using AlphaFold2. Nat Commun 13:1265. https://doi.org/10.1038/s41467-022-28865-w. [CrossRef]
  6. Lazaridis T (2000) Effective energy functions for protein structure prediction. Curr Opin Struct Biol 10:139–145. https://doi.org/10.1016/S0959-440X(00)00063-4. [CrossRef]
  7. Lazaridis T, Karplus M (1997) “New view” of protein folding reconciled with the old through multiple unfolding simulations. Science 278:1928–1931. https://doi.org/10.1126/science.278.5345.1928. [CrossRef]
  8. MacKerell ADJr, Bashford D, Bellott M, et al (1998) All-Atom Empirical Potential for Molecular Modeling and Dynamics Studies of Proteins. J Phys Chem B 102:3586–3616. https://doi.org/10.1021/jp973084f. [CrossRef]
  9. Brooks BR, Bruccoleri RE, Olafson BD, et al (1983) CHARMM: A program for macromolecular energy, minimization, and dynamics calculations. J Comput Chem 4:187–217. https://doi.org/10.1002/jcc.540040211. [CrossRef]
  10. Lazaridis T, Karplus M (1999) Discrimination of the native from misfolded protein models with an energy function including implicit solvation. J Mol Biol 288:477–487. https://doi.org/10.1006/jmbi.1999.2685. [CrossRef]
  11. Sippl MJ (1995) Knowledge-based potentials for proteins. Curr Opin Struct Biol 5:229–235. https://doi.org/10.1016/0959-440x(95)80081-6. [CrossRef]
  12. Simons KT, Ruczinski I, Kooperberg C, et al (1999) Improved recognition of native-like protein structures using a combination of sequence-dependent and sequence-independent features of proteins. Proteins 34:82–95. https://doi.org/10.1002/(sici)1097-0134(19990101)34:1<82::aid-prot7>3.0.co;2-a. [CrossRef]
  13. Thomas PD, Dill KA (1996) Statistical potentials extracted from protein structures: how accurate are they? J Mol Biol 257:457–469. https://doi.org/10.1006/jmbi.1996.0175. [CrossRef]
  14. Simons KT, Kooperberg C, Huang E, Baker D (1997) Assembly of protein tertiary structures from fragments with similar local sequences using simulated annealing and Bayesian scoring functions. J Mol Biol 268:209–225. https://doi.org/10.1006/jmbi.1997.0959. [CrossRef]
  15. Chen F, Liu H, Sun H, et al (2016) Assessing the performance of the MM/PBSA and MM/GBSA methods. 6. Capability to predict protein-protein binding free energies and re-rank binding poses generated by protein-protein docking. Phys Chem Chem Phys 18:22129–22139. https://doi.org/10.1039/c6cp03670h. [CrossRef]
  16. Duarte Ramos Matos G, Kyu DY, Loeffler HH, et al (2017) Approaches for Calculating Solvation Free Energies and Enthalpies Demonstrated with an Update of the FreeSolv Database. J Chem Eng Data 62:1559–1569. https://doi.org/10.1021/acs.jced.7b00104. [CrossRef]
  17. Gohlke H, Case DA (2004) Converging free energy estimates: MM-PB(GB)SA studies on the protein-protein complex Ras-Raf. J Comput Chem 25:238–250. https://doi.org/10.1002/jcc.10379. [CrossRef]
  18. Brown SP, Muchmore SW (2006) High-throughput calculation of protein-ligand binding affinities: modification and adaptation of the MM-PBSA protocol to enterprise grid computing. J Chem Inf Model 46:999–1005. https://doi.org/10.1021/ci050488t. [CrossRef]
  19. Rodrigues CHM, Pires DEV, Ascher DB (2021) mmCSM-PPI: predicting the effects of multiple point mutations on protein–protein interactions. Nucleic Acids Res 49:W417–W424. https://doi.org/10.1093/nar/gkab273. [CrossRef]
  20. Liu X, Luo Y, Li P, et al (2021) Deep geometric representations for modeling effects of mutations on protein-protein binding affinity. PLOS Comput Biol 17:e1009284. https://doi.org/10.1371/journal.pcbi.1009284. [CrossRef]
  21. Wang M, Cang Z, Wei G-W (2020) A topology-based network tree for the prediction of protein–protein binding affinity changes following mutation. Nat Mach Intell 2:116–123. https://doi.org/10.1038/s42256-020-0149-6. [CrossRef]
  22. Romero-Molina S, Ruiz-Blanco YB, Mieres-Perez J, et al (2022) PPI-Affinity: A Web Tool for the Prediction and Optimization of Protein–Peptide and Protein–Protein Binding Affinity. J Proteome Res 21:1829–1841. https://doi.org/10.1021/acs.jproteome.2c00020. [CrossRef]
  23. Jankauskaite J, Jiménez-García B, Dapkunas J, et al (2019) SKEMPI 2.0: an updated benchmark of changes in protein-protein binding energy, kinetics and thermodynamics upon mutation. Bioinforma Oxf Engl 35:462–469. https://doi.org/10.1093/bioinformatics/bty635. [CrossRef]
  24. Xue LC, Rodrigues JP, Kastritis PL, et al (2016) PRODIGY: a web server for predicting the binding affinity of protein-protein complexes. Bioinforma Oxf Engl 32:3676–3678. https://doi.org/10.1093/bioinformatics/btw514. [CrossRef]
  25. Liu S, Zhang C, Zhou H, Zhou Y (2004) A physical reference state unifies the structure-derived potential of mean force for protein folding and binding. Proteins Struct Funct Bioinforma 56:93–101. https://doi.org/10.1002/prot.20019. [CrossRef]
  26. Ravikant DVS, Elber R (2010) PIE-efficient filters and coarse grained potentials for unbound protein-protein docking. Proteins 78:400–419. https://doi.org/10.1002/prot.22550. [CrossRef]
  27. Abbasi WA, Yaseen A, Hassan FU, et al (2020) ISLAND: in-silico proteins binding affinity prediction using sequence information. BioData Min 13:20. https://doi.org/10.1186/s13040-020-00231-w. [CrossRef]
  28. Biswas G, Mukherjee D, Dutta N, et al (2023) EnCPdock: a web-interface for direct conjoint comparative analyses of complementarity and binding energetics in inter-protein associations. J Mol Model 29:239. https://doi.org/10.1007/s00894-023-05626-0. [CrossRef]
  29. Blanco JD, Radusky L, Climente-González H, Serrano L (2018) FoldX accurate structural protein-DNA binding prediction using PADA1 (Protein Assisted DNA Assembly 1). Nucleic Acids Res 46:3852–3863. https://doi.org/10.1093/nar/gky228. [CrossRef]
  30. Basu S, Bhattacharyya D, Banerjee R (2012) Self-complementarity within proteins: Bridging the gap between binding and folding. Biophys J 102:2605–2614. https://doi.org/10.1016/j.bpj.2012.04.029. [CrossRef]
  31. Winn MD, Ballard CC, Cowtan KD, et al (2011) Overview of the CCP4 suite and current developments. Acta Crystallogr D Biol Crystallogr 67:. https://doi.org/10.1107/S0907444910045749. [CrossRef]
  32. Lawrence MC, Colman PM (1993) Shape complementarity at protein/protein interfaces. J Mol Biol 234:946–950. https://doi.org/10.1002/bip.360340711. [CrossRef]
  33. Connolly ML (1983) Analytical molecular surface calculation. J Appl Crystallogr 16:548–558. https://doi.org/10.1107/S0021889883010985. [CrossRef]
  34. Xu D, Zhang Y (2009) Generating triangulated macromolecular surfaces by euclidean distance transform. PLoS ONE 4:. https://doi.org/10.1371/ journal.pone.0008140. [CrossRef]
  35. Li L, Li C, Sarkar S, et al (2012) DelPhi: a comprehensive suite for DelPhi software and associated resources. BMC Biophys 5:. https://doi.org/10.1186/2046-1682-5-9. [CrossRef]
  36. Li L, Li C, Zhang Z, Alexov E (2013) On the Dielectric “Constant” of Proteins: Smooth Dielectric Function for Macromolecular Modeling and Its Implementation in DelPhi. J Chem Theory Comput 9:2126–2136. https://doi.org/10.1021/ct400065j. [CrossRef]
  37. McCoy AJ, Chandana Epa V, Colman PM (1997) Electrostatic complementarity at protein/protein interfaces. J Mol Biol 268:570–584. https://doi.org/10.1006/jmbi.1997.0987. [CrossRef]
  38. Basu S (2017) CPdock: the complementarity plot for docking of proteins: implementing multi-dielectric continuum electrostatics. J Mol Model 24:8. https://doi.org/10.1007/s00894-017-3546-y. [CrossRef]
  39. Basu S, Bhattacharyya D, Banerjee R (2014) Applications of complementarity plot in error detection and structure validation of proteins. Indian J Biochem Biophys 51:188–200.
  40. Basu S, Chakravarty D, Bhattacharyya D, et al (2021) Plausible blockers of Spike RBD in SARS-CoV2—molecular design and underlying interaction dynamics from high-level structural descriptors. J Mol Model 27:191. https://doi.org/10.1007/s00894-021-04779-0. [CrossRef]
  41. Joachims T (2002) Learning to Classify Text Using Support Vector Machines.
  42. Schymkowitz J, Borg J, Stricher F, et al (2005) The FoldX web server: An online force field. Nucleic Acids Res 33:382–388. https://doi.org/10.1093/nar/gki387. [CrossRef]
  43. Kandathil SM, Garza-Fabre M, Handl J, Lovell SC (2018) Improved fragment-based protein structure prediction by redesign of search heuristics. Sci Rep 8:13694. https://doi.org/10.1038/s41598-018-31891-8. [CrossRef]
  44. Hubbard SSJ, Thornton JJM (1993) “NACCESS”, computer program. Dep. Biochem. Mol. Biol. Univ. Coll. Lond.
  45. Banerjee R, Sen M, Bhattacharya D, Saha P (2003) The jigsaw puzzle model: search for conformational specificity in protein interiors. J Mol Biol 333:211–226. [CrossRef]
  46. Berman HM, Westbrook J, Feng Z, et al (2000) The Protein Data Bank. Nucleic Acids Res 28:235–242. https://doi.org/10.1093/nar/28.1.235. [CrossRef]
  47. Kastritis PL, Moal IH, Hwang H, et al (2011) A structure-based benchmark for protein–protein binding affinity. Protein Sci 20:482–491. https://doi.org/10.1002/pro.580. [CrossRef]
  48. Vreven T, Moal IH, Vangone A, et al (2015) Updates to the Integrated Protein–Protein Interaction Benchmarks: Docking Benchmark Version 5 and Affinity Benchmark Version 2. J Mol Biol 427:3031–3041. https://doi.org/10.1016/j.jmb.2015.07.016. [CrossRef]
  49. Jemimah S, Yugandhar K, Michael Gromiha M (2017) PROXiMATE: a database of mutant protein–protein complex thermodynamics and kinetics. Bioinformatics 33:2787–2788. https://doi.org/10.1093/bioinformatics/btx312. [CrossRef]
  50. Choromański K, Matuszak M, Miȩkisz J (2013) Scale-Free Graph with Preferential Attachment and Evolving Internal Vertex Structure. J Stat Phys 151:1175–1183. https://doi.org/10.1007/s10955-013-0749-1. [CrossRef]
Disclaimer/Publisher’s Note: The statements, opinions and data contained in all publications are solely those of the individual author(s) and contributor(s) and not of MDPI and/or the editor(s). MDPI and/or the editor(s) disclaim responsibility for any injury to people or property resulting from any ideas, methods, instructions or products referred to in the content.
Copyright: This open access article is published under a Creative Commons CC BY 4.0 license, which permit the free download, distribution, and reuse, provided that the author and preprint are cited in any reuse.
Prerpints.org logo

Preprints.org is a free preprint server supported by MDPI in Basel, Switzerland.

Subscribe

© 2024 MDPI (Basel, Switzerland) unless otherwise stated