Preprint
Article

Major Recurrent Depression in Middle-Aged Adults: Symptoms and Life Themes in a Latent Semantic Indexing Approach

Altmetrics

Downloads

176

Views

73

Comments

1

Submitted:

18 October 2023

Posted:

20 October 2023

You are already at the latest version

Alerts
Abstract
The work analyses the way in which symptoms and life themes manifest in middle-aged adults diagnosed with major recurrent depression. Specifically, the relationships between symptoms, life themes, and life themes - symptoms have been analyzed. For this purpose, Spearman correlation, and the methods of Latent Semantic Indexing (LSI) were used. Seven symptoms and twenty-six life themes were identified in the patients analyzed as well as similarities of symptoms/life themes (at patient level), the ranking of the importance of symptoms on each life theme (at the level of the group of patients), the rankings of the similarities of life themes in relation to different symptoms or various groups of symptoms (at the level of the group of patients), and dysfunctional cycles of symptoms and life themes (at patient level). The findings only refer to the patients analyzed. Although our findings cannot be generalized, there is a possibility that some of them may also be encountered in other patients. However, the design of the work can be used to initiate other similar studies.
Keywords: 
Subject: Social Sciences  -   Psychology

1. Introduction

Clinical depression is undoubtedly experienced as a life experience. Life as we perceive it is a chronology of life events/ moments that are subject to interpretations. Interpretations generate mood states. The fact that at least the initial moment of a person’s life cannot be influenced, postponed, canceled or retold suggests that life as a whole must be accepted. In exogenous depression, the functionality of the individual is affected by non-acceptance of life events/experiences with a traumatizing effect.
Major depressive disorder (MDD) is defined as a mental disorder [1] or as a mood disorder [2]. To be diagnosed with MDD, according to the Diagnostic and Statistical Manual of Mental Disorders, 5th edition (DSM-5) an individual must have five of the following symptoms: persistently low or depressed mood, anhedonia, feelings of guilt or worthlessness, lack of energy, poor concentration, appetite changes, psychomotor retardation or agitation, sleep disturbances, suicidal thoughts. One of the five symptoms must be depressed mood or anhedonia [3].
The prevalence of depression in different age groups has reached alarming levels. A recent study shows that 34% of adolescents aged 10-19 years are at risk of developing clinical depression [4]. Another meta-analysis involving 72.878 older adults demonstrated that 28.4% of them screened positive for depression [5]. The association of MDD with morbidity and mortality [6] makes these values even more worrying.
The clearest and most visible effects of MDD, interpreted as associations, are dysfunctions and abnormalities at the level of the brain. Recent studies have shown that these abnormalities are due to the impairment of complex neuroregulatory systems and neuronal circuits [3,7,8,9,10,11]. Other studies highlight the connection between chemical imbalance in the brain and mood disorders [12,13].
How does MDD manifest at mental level? An important characteristic of MDD is reduced emotional reactivity to sad contexts [14]. Self-compassion is often used as an adaptive emotion regulation strategy, especially by patients with high levels of depressed mood [15]. High levels of suppression of positive or negative emotions are associated with MDD symptoms [16]. The posibility of emotional regulation in MDD medicated patients is preserved, depending on the severity of the symptoms [17].
Other psychiatric comorbidities of MDD are: dystimia, anxiety disorders, agoraphobia, social phobia, obsessive-compulsive disorder, generalized anxiety disorder, stress disorder, alcohol dependence, psychotic disorder, antisocial personality, suicidal risk [18,19,20,21].
The factors that favorise the onset of MDD are those that engage significant consumption of psychological resources, distancing the individual from his/her own universe of ideals, psychological experiences, and skills (UIPS), where he/she functions best. The specialized literature suggests the presence of four categories of contributing factors [22,23,24,25,26]:
  • severe interaction environments;
  • lack of interaction environments;
  • illnesses;
  • psychological vulnerability and fragility.
The key role in interpreting the interaction environment and internal stimuli, in managing an altered UIPS as well as in the consumption of psychological resources is played by a structure that we call the interpreter of the person.
Exogenous depression, is typically amplified by experiencing and validating feelings of lack of ideals or rejection. While the human body and mind shape our offer of life and experiences, the interaction environment either integrates or rejects this offer. On the other hand, a period of life devoid of specific experiences, especially during childhood, can later be reclaimed and generate behaviours and attitudes rejected by the interaction environment. Additionally, individuals who assume non-specific roles can exhibit behaviours also rejected by others.
The lives of the patients diagnosed with major depression (MD) are primarily affected by experiencing predominant states of sadness and anxiety. We consider that the persistence of anxiety can be explained by the inability of patients to maintain UIPS intact. What can we say about the state of sadness? The functionality of the human body and mind is energetically conditioned. A functional mind processes and compares internal and/or external stimuli using a dispositional background ensured by the feeling of usefulness and by a network of ideals. Why is a functional network of ideals important? Firstly, such a network ensures a coherent behavioural perspective oriented towards achieving the principal ideal. Essentially, a functional network of ideals assures a genuine anchoring of the person’s present in the future. Secondly, the network of ideals sustains the feeling of usefulness and functions as a genuine energy battery. At the same time, the presence of the feeling of usefulness conditions the existence of the network of ideals. The entire dispositional background is an essential energy resource that ensures the normal functioning of the mind.
The network of ideals remains functional as long as the principal ideal remains active. The deactivation of the central ideal as a result of a traumatic event leads to the collapse of the entire network of ideals, which implies:
  • difficult functioning of the person in the absence of an adequate dispositional background;
  • a dramatic annulment of the person’s future perspective.
In the absence of the capacity of the other ideals to transform into a central ideal, the only solution for the normal functioning of the mind remains the maintenance of the activation of the old network of ideals. This way, the present amputated from the future perspective is continuously compared to an unaltered past that perpetuates the experiencing of sadness.
A life affected by depression must have a purpose. The purpose can either focus on the individual and/or on the interaction environment. In our opinion, depression is a life test in which the ability to accept reality and to change one’s attitude is tested.
Major depression experienced by middle-aged adults is often a treatment-resistant depression. Treatment resistance is determined not only by the deficiencies recorded at the level of the biological construct but also by the life history marked by losses, stress, and traumas, which deplete the psychological resources of the patient. Generally, the mature adult age is the age when one begins to experience health deterioration [27,28], painful separations, social isolation [22,29,30], the reclaiming of a wasted past, the specific effects of inadequate manifestations of childhood traumas [31,32,33,34], and so on.
The behaviour of a middle - aged adult diagnosed with major recurrent depression is determined by dysfunctional beliefs that cause the activation of certain life themes and the manifestation of specific symptoms. The profound fixation of these beliefs causes the stabilization of both life themes and symptoms experienced in illness. Moreover, one of the reasons we focused our attention on middle-aged adults is that, in these cases, the symptoms and life themes are clear and characterized by their stability and persistence over time. Understanding the relationships between symptoms and life themes can aid the psychotherapeutic process in relativizing these beliefs.
What do we aim for? As mentioned above, symptoms and life themes are relatively stable in major recurrent depression diagnosed in middle-aged adults. They have a specific pattern of manifestation for each patient (Pi). In our opinion, these patterns should highlight:
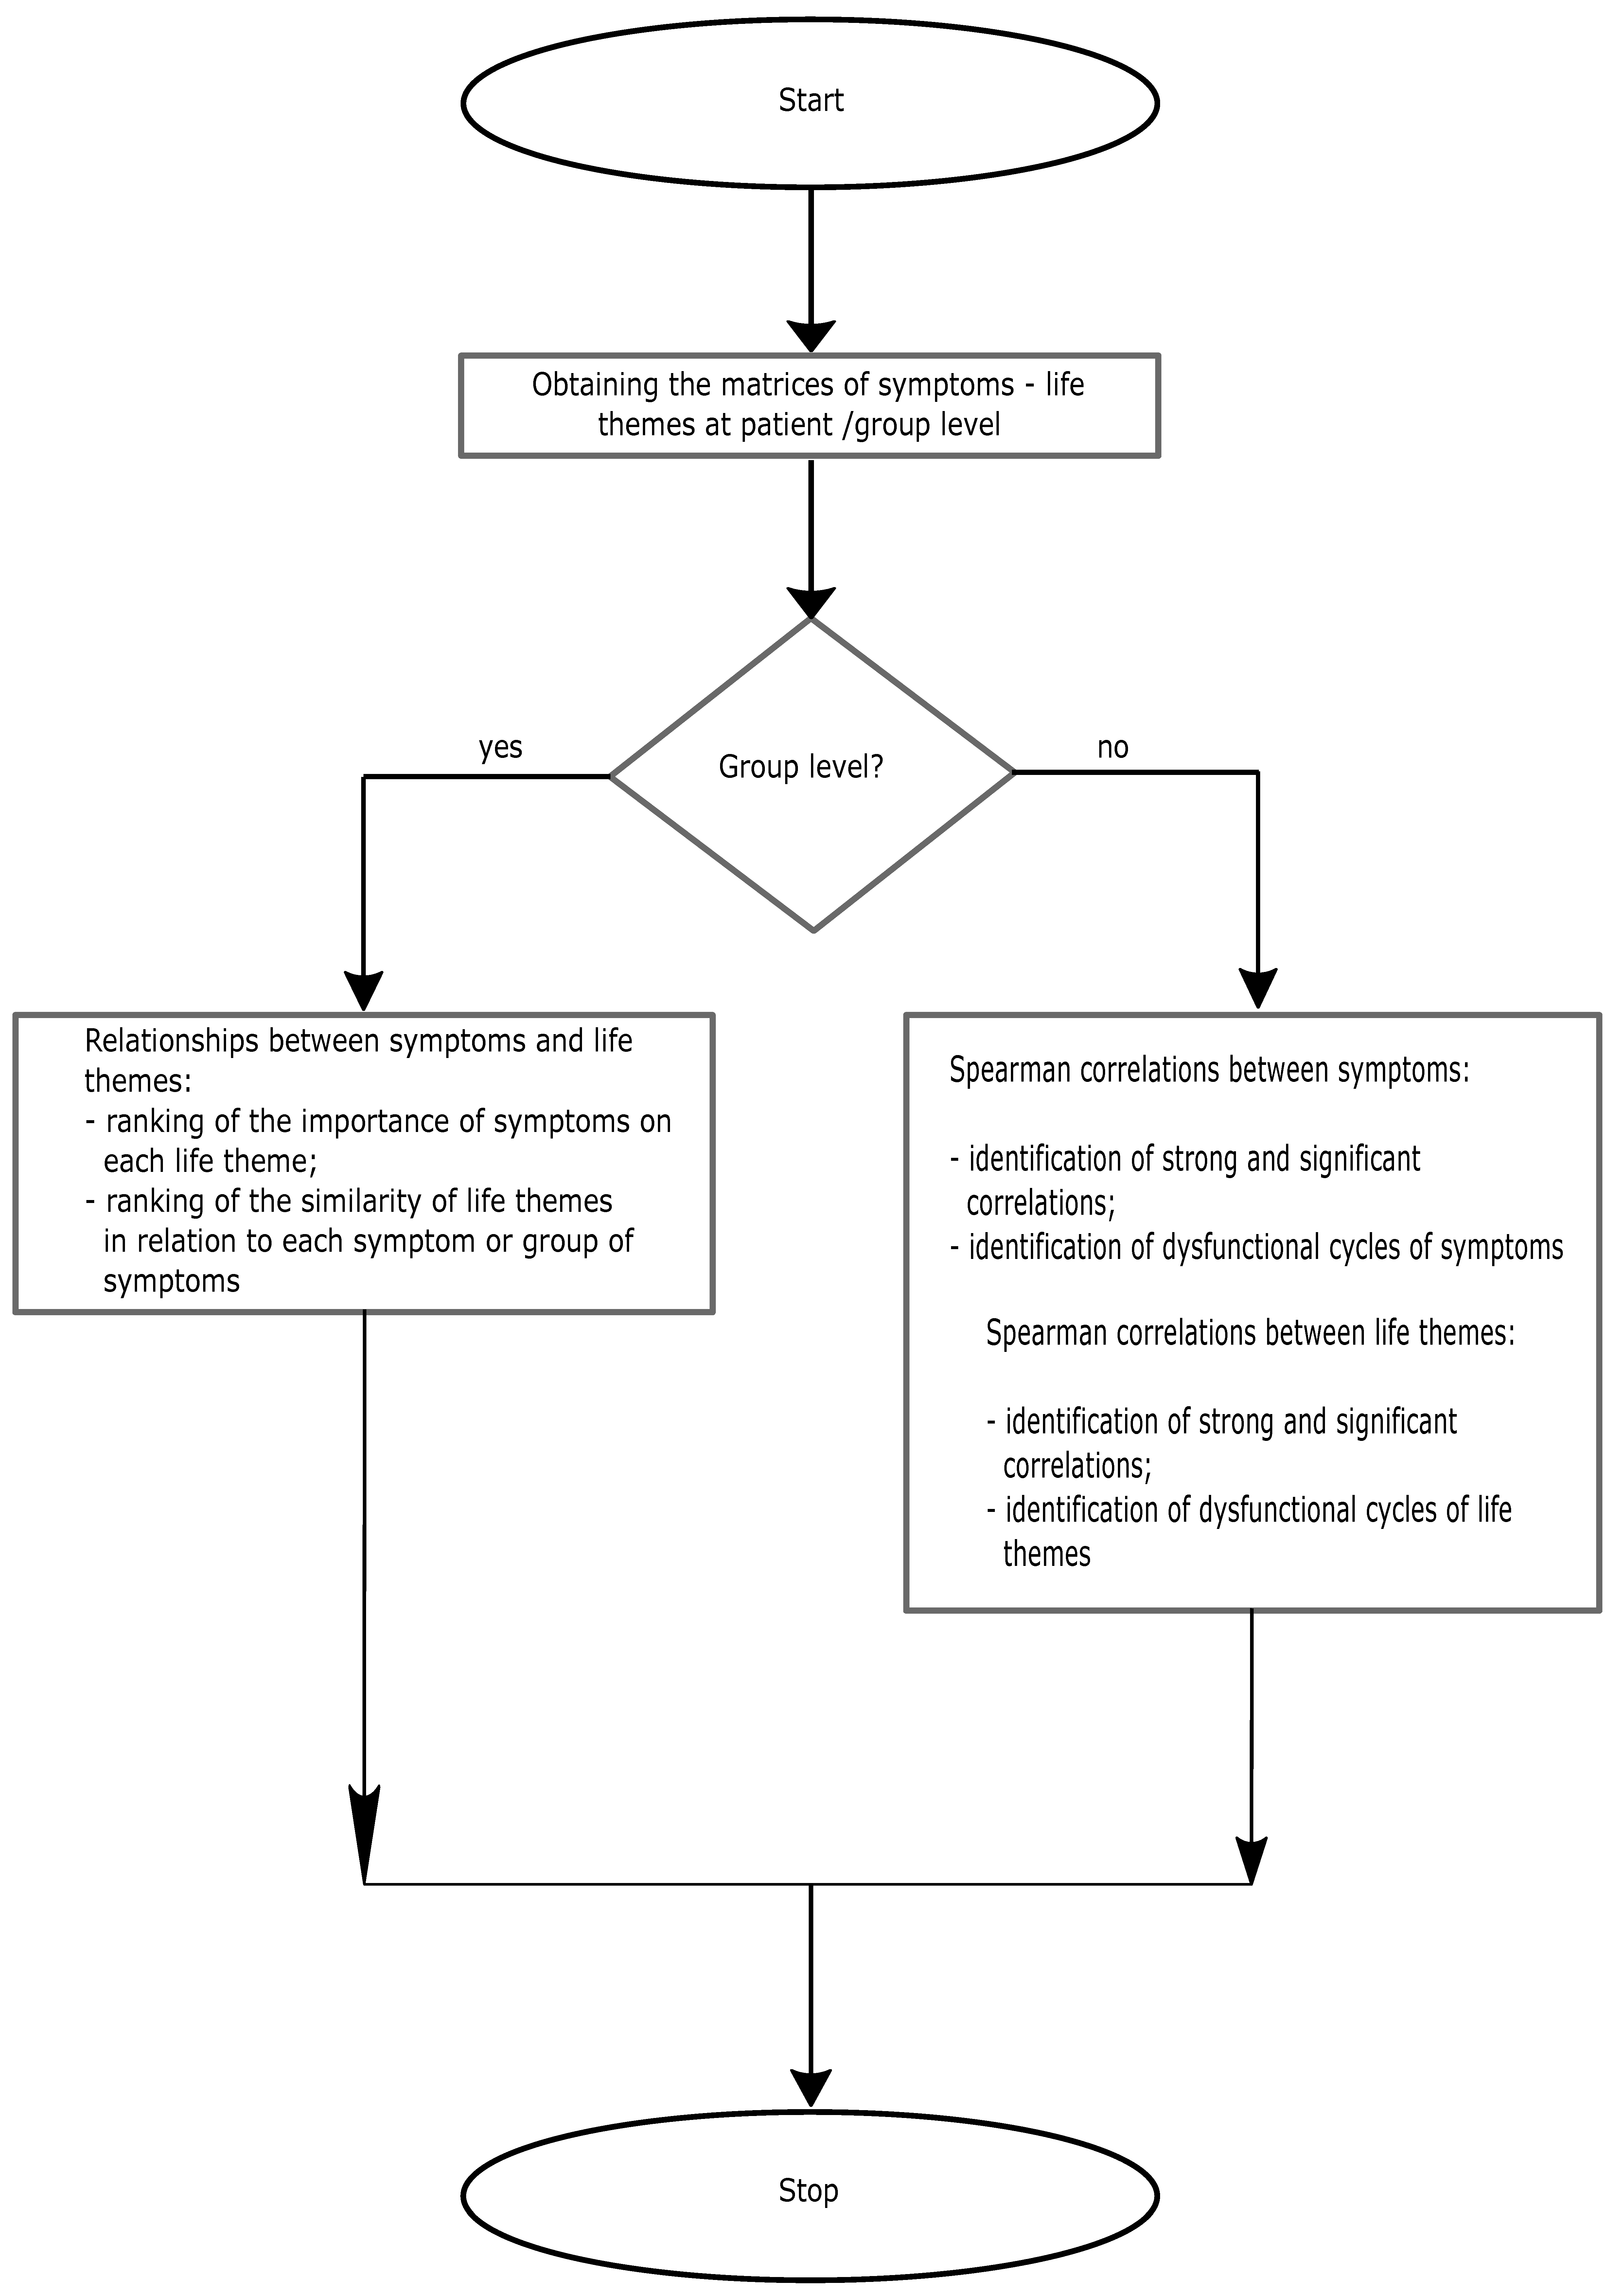
  • the relationships between symptoms and life themes, starting with identifying symptoms and life themes and continuing with the ranking of the importance of symptoms on each life theme. At the level of the group of patients, this analysis can be achieved by aggregating the symptoms and life themes identified in each patient. Thus, at this level, we could have a clear picture of the representation of each life theme by the most relevant symptom. Another analysis, relevant at the level of the group of patients, is the ranking of the similarities of life themes in relation to different symptoms or groups of symptoms. Here, the relevance of the information provided by this ranking is truly important. The association, not in a statistical sense, of the dysfunctional symptom with the most similar life theme indicates the most dysfunctional symptom - life theme pair. The best combination should be sought between a symptom and the most dissimilar life theme. We consider this information useful for group psychotherapies.
  • associations, statistically treated, both between symptoms and between life themes. The analysis of these associations is relevant when it is conducted at patient level. These associations must be analyzed in close connection with the similarities/ dissimilarities of the symptoms/life themes. For example, strong and significant positive associations between dissimilar symptoms can indicate the presence of syndromes.
    Using the concept of transitivity from mathematics (if A & B and B & C, then A & C), we can identify dysfunctional cycles of symptoms/life themes. These cycles signal simultaneous and multiple associations between symptoms or between life themes.
In conclusion, our research is an exploratory one, aimed at evaluating the aspects presented in Figure 1.
Figure 1. Block diagram of the research
Preprints 88084 g001

2. Materials and methods

2.1. Participants

The research was conducted at a Psychiatric Hospital in ROMANIA. The Ethics Committee of Lucian Blaga University of Sibiu approved the research and use of data for research purposes (decision no. 27 dated 2023, May 10). All the patients selected for our research were individually informed about how the research would be conducted and gave their informed consent for the anonymous use of data for scientific purposes.
The selection of patients was made by consulting medical records and applying the inclusion and exclusion criteria presented below:
Inclusion criteria
  • Socio-demographic subchapter:
− age between 40-60 years;
− males and females.
  • Procedural subchapter:
− ability to understand and sign the informed consent;
− fluency in the investigator’s language;
− availability of a contact person.
  • Diagnostic subchapter:
− Recurrent MD diagnostic with at least three episodes of relapse;
− IQ score greater than or equal to 90;
− requiring increased medical attention.
Exclusion criteria
  • Demographic subchapter:
− family members are not included in the research team.
  • Medical/psychiatric subchapter:
− poorly controlled medical conditions that may interfere with the assessment;
− no history of seizures;
− no diagnosis of substance abuse/dependence in the last six months, excluding nicotine;
− a disorder that can be induced by a substance;
− imminent risk of self-harm or harm to others;
− unstable mental status under medication.
− exclusion of other types of diagnoses that may involve depressive episodes.
Initially, twenty-four patients with a diagnosis of major recurrent depression who met the inclusion criteria were selected. The application of exclusion criteria led to the elimination of two patients with unstable mental status under medication, six patients with a history of seizures and five patients diagnosed with alcohol dependence in the last six months. Thus, eleven patients having the average age of 47.73 years (SD=3.55;range=39-50 years) were selected. 72.7% were females having the average age of 48.13 years (SD=3.83; range =39-50 years), while 27.3% were males having the average age of 46.67 years (SD=3.05; range=44-50 years). 63.64% were married, 9.1% were unmarried and 27.26% were divorced. 27.3% were employed and 72.7% were retired due to illness. All patients completed high school education.

2.2. Research design

2.2.1. Type and subtype of research

Our research is quantitative, non-experimental, exploratory, retrospective and descriptive.

2.2.2. Research questions

The questions that the research aims to answer are:
  • What symptoms and life themes are present in middle-aged adults diagnosed with major recurrent depression?
  • What relationships are there between symptoms and life themes?
  • What patterns of association manifest both between symptoms and between life themes, and what are the significances of these patterns?
To address these questions, we conducted the data collection procedure presented below.

2.2.3. Data collection procedure

To identify the symptoms and life themes, we asked each patient to concisely present, within a maximum of one page, the happiest, unhappiest and some daily events. What was the premise of this request?
The absence of future perspective experienced in MD, engages the patient in a costly strategy of comparing an unfavourable present with an unaffected past by this absence. The reason behind such a strategy may lie in the need to sustain a state of seeking answers that justify and enable the acceptance of the traumatic event. In our opinion, the mood of patients is maintained by the comparison between the unhappiness and happiness themes, as well as by the presence of a daily theme encompassing activities, concerns and so on, necessary for managing the current psychological state.
At every moment in life, every person experiences a combination of psychological states. However, he/she is only aware of one of these states, probably the most relevant one. In the approach presented below, we have attempted to obtain relevant symptoms from the patients using their reports.
The happiest, unhappiest and daily events presented by each patient have been grouped into the theme of happiness, the theme of unhappiness, and the theme of everyday life. Each of the three themes was divided into life subthemes. Each life subtheme (Ti) was divided into groups of meaningful words. Each group was described based on the symptom that the patient experienced at the time of the request. For this purpose, each patient was asked to select one of the following symptoms (Sis): anxiety, trust, apathy, zest for life, fury, tranquility, regret, gratitude, low self-esteem, high self-esteem, fatigue, euphoria, sadness, happiness. Previously, all these symptoms were explained to the patients. To ensure that the patient accurately chose Si, we asked him to justify his choice.
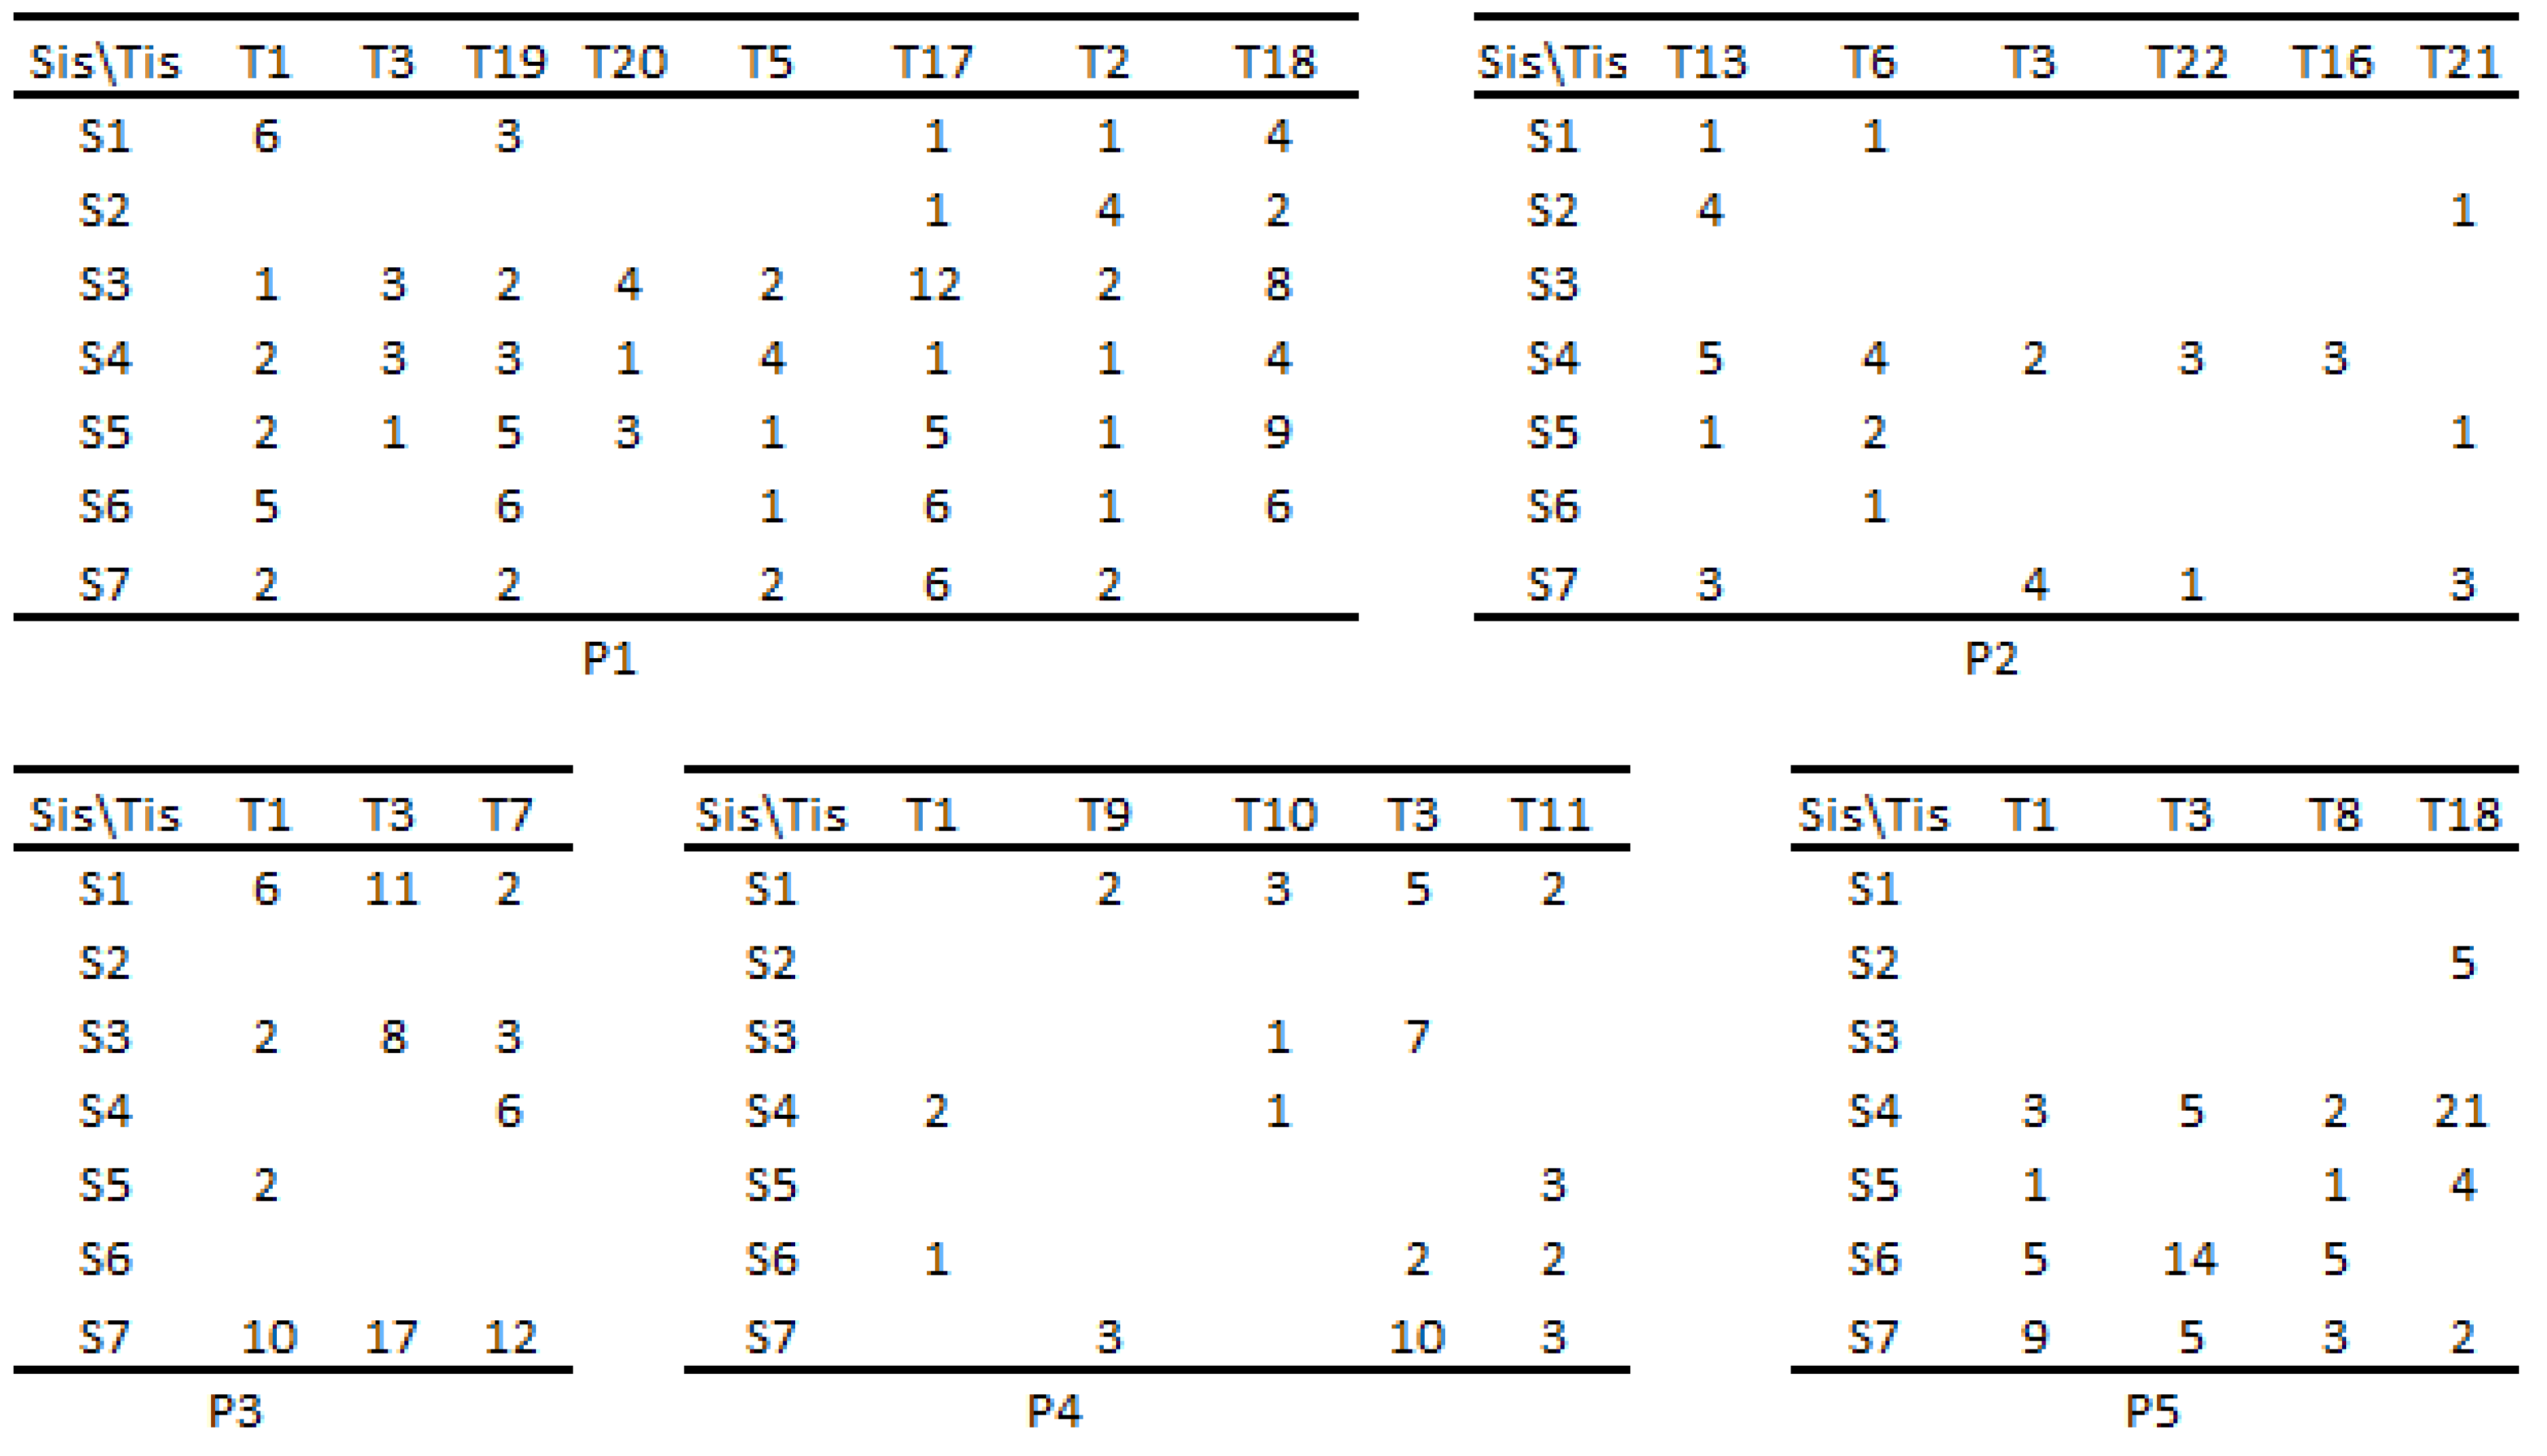
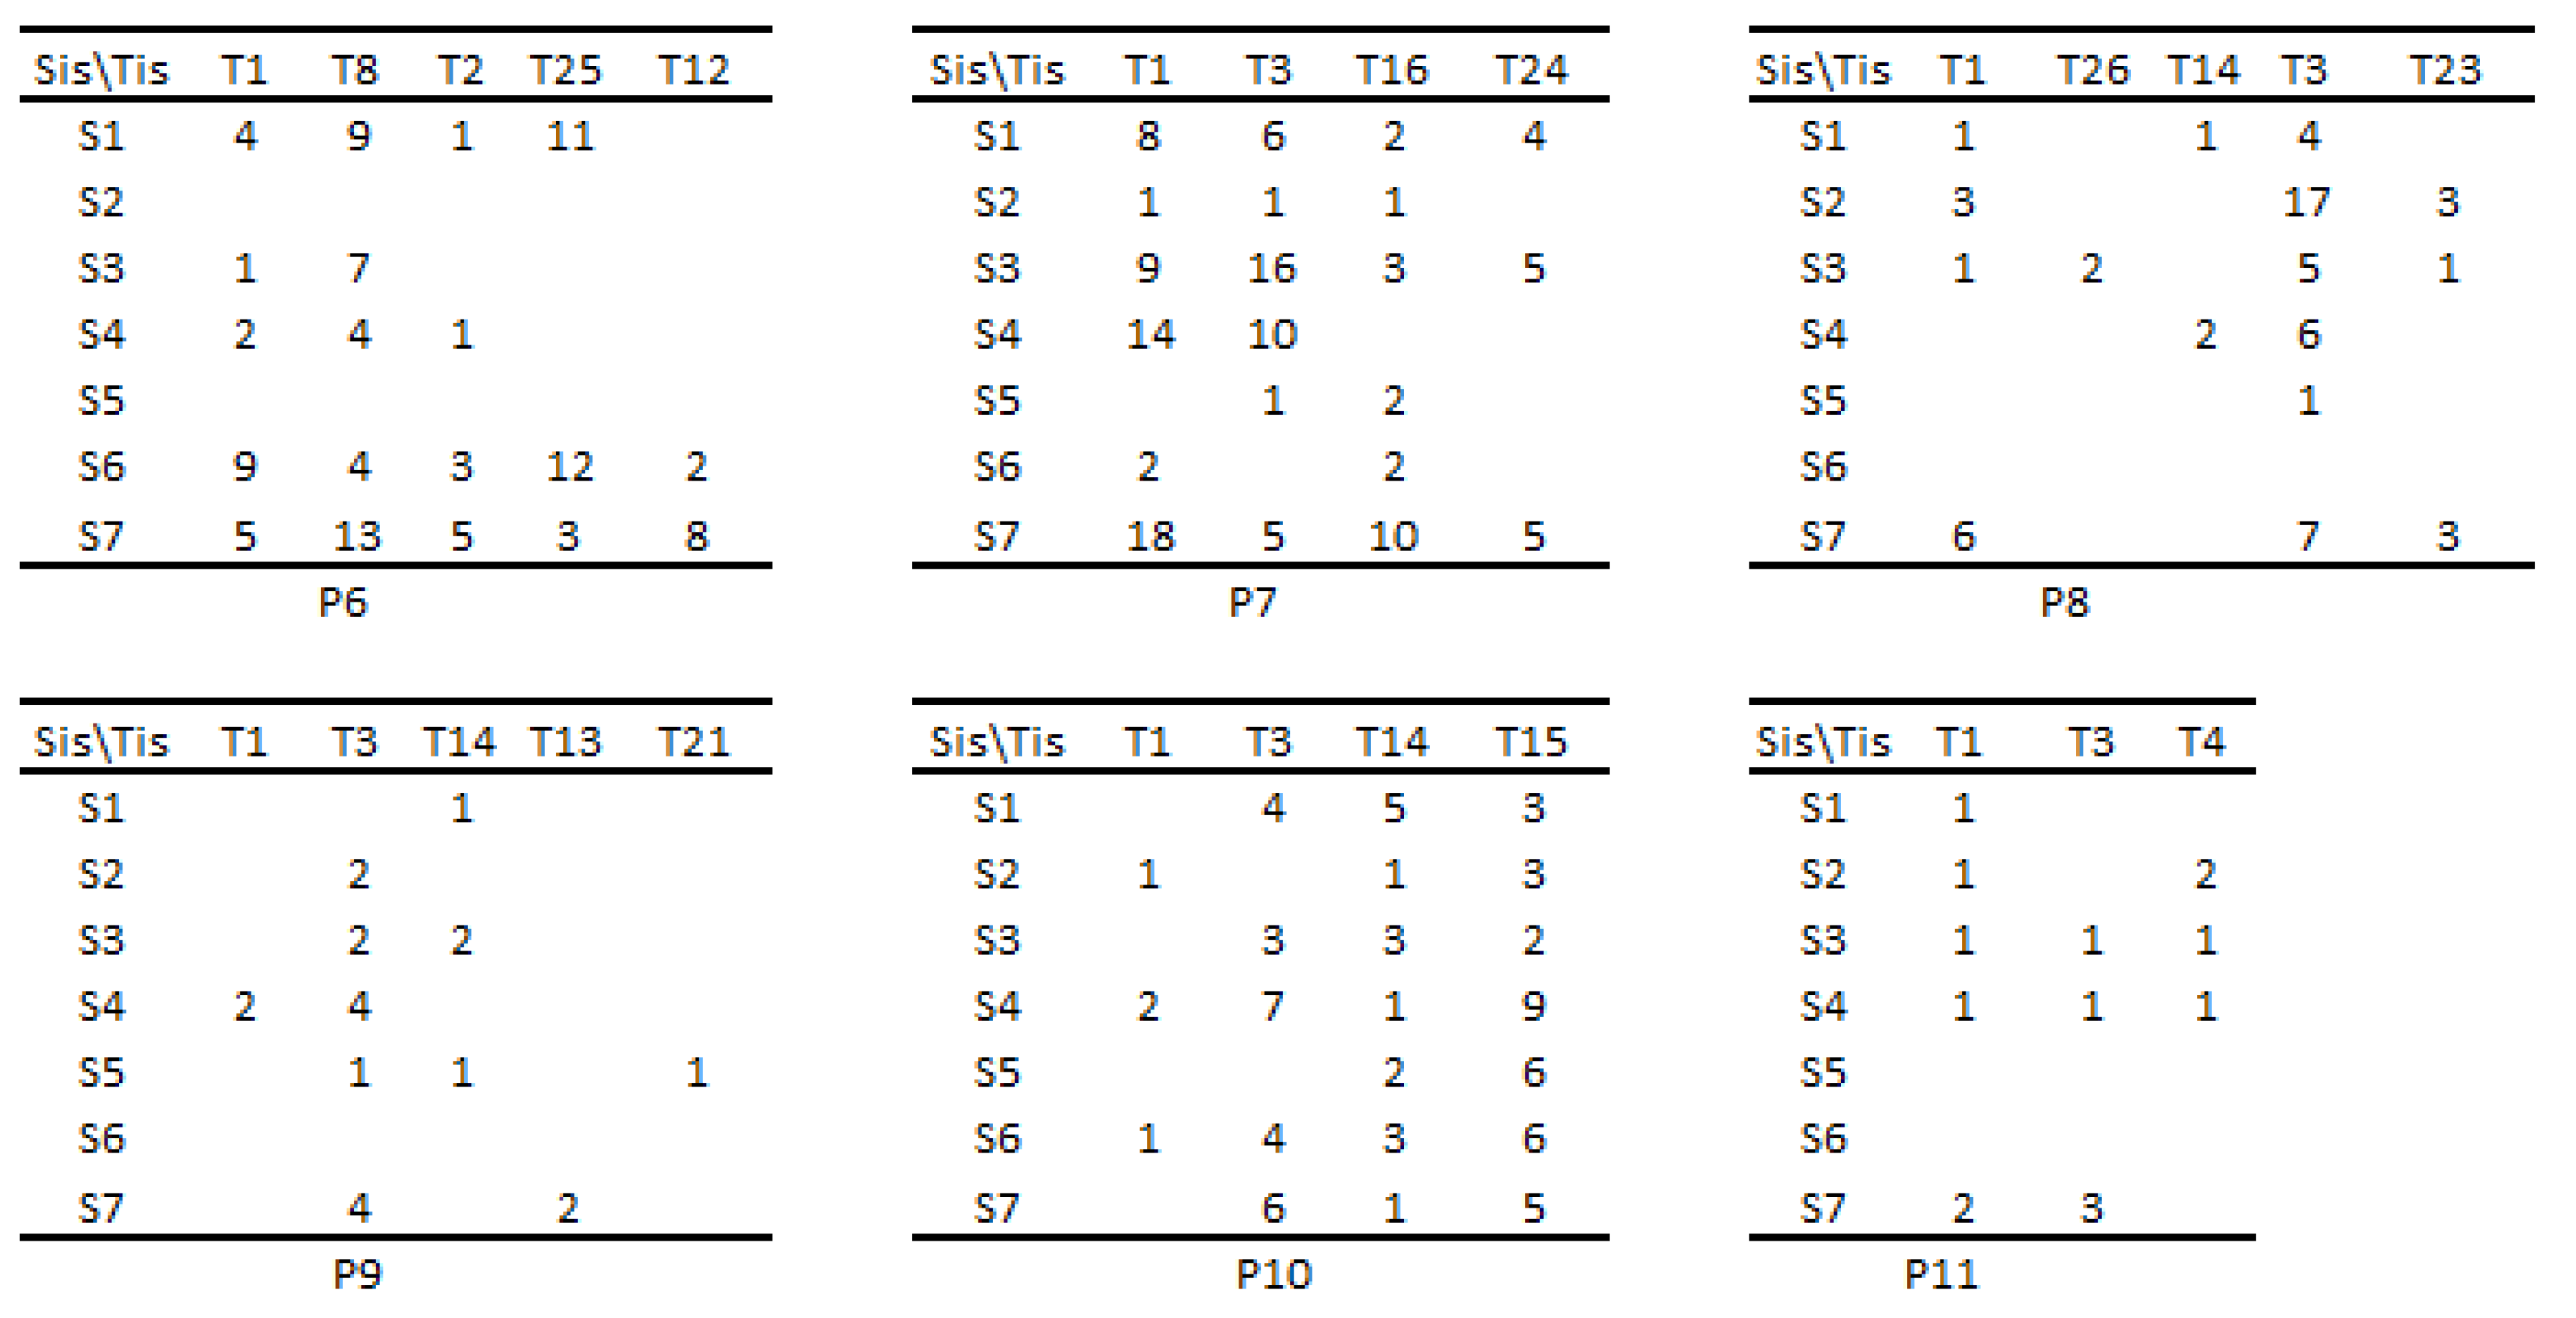
Thus, for each patient, we obtained the matrices presented in Figure A1Figure A2. By aggregating the eleven matrices, we obtained the matrix of Sis and Tis at the level of the group of patients (see Table 4).

2.2.4. Data processing methods

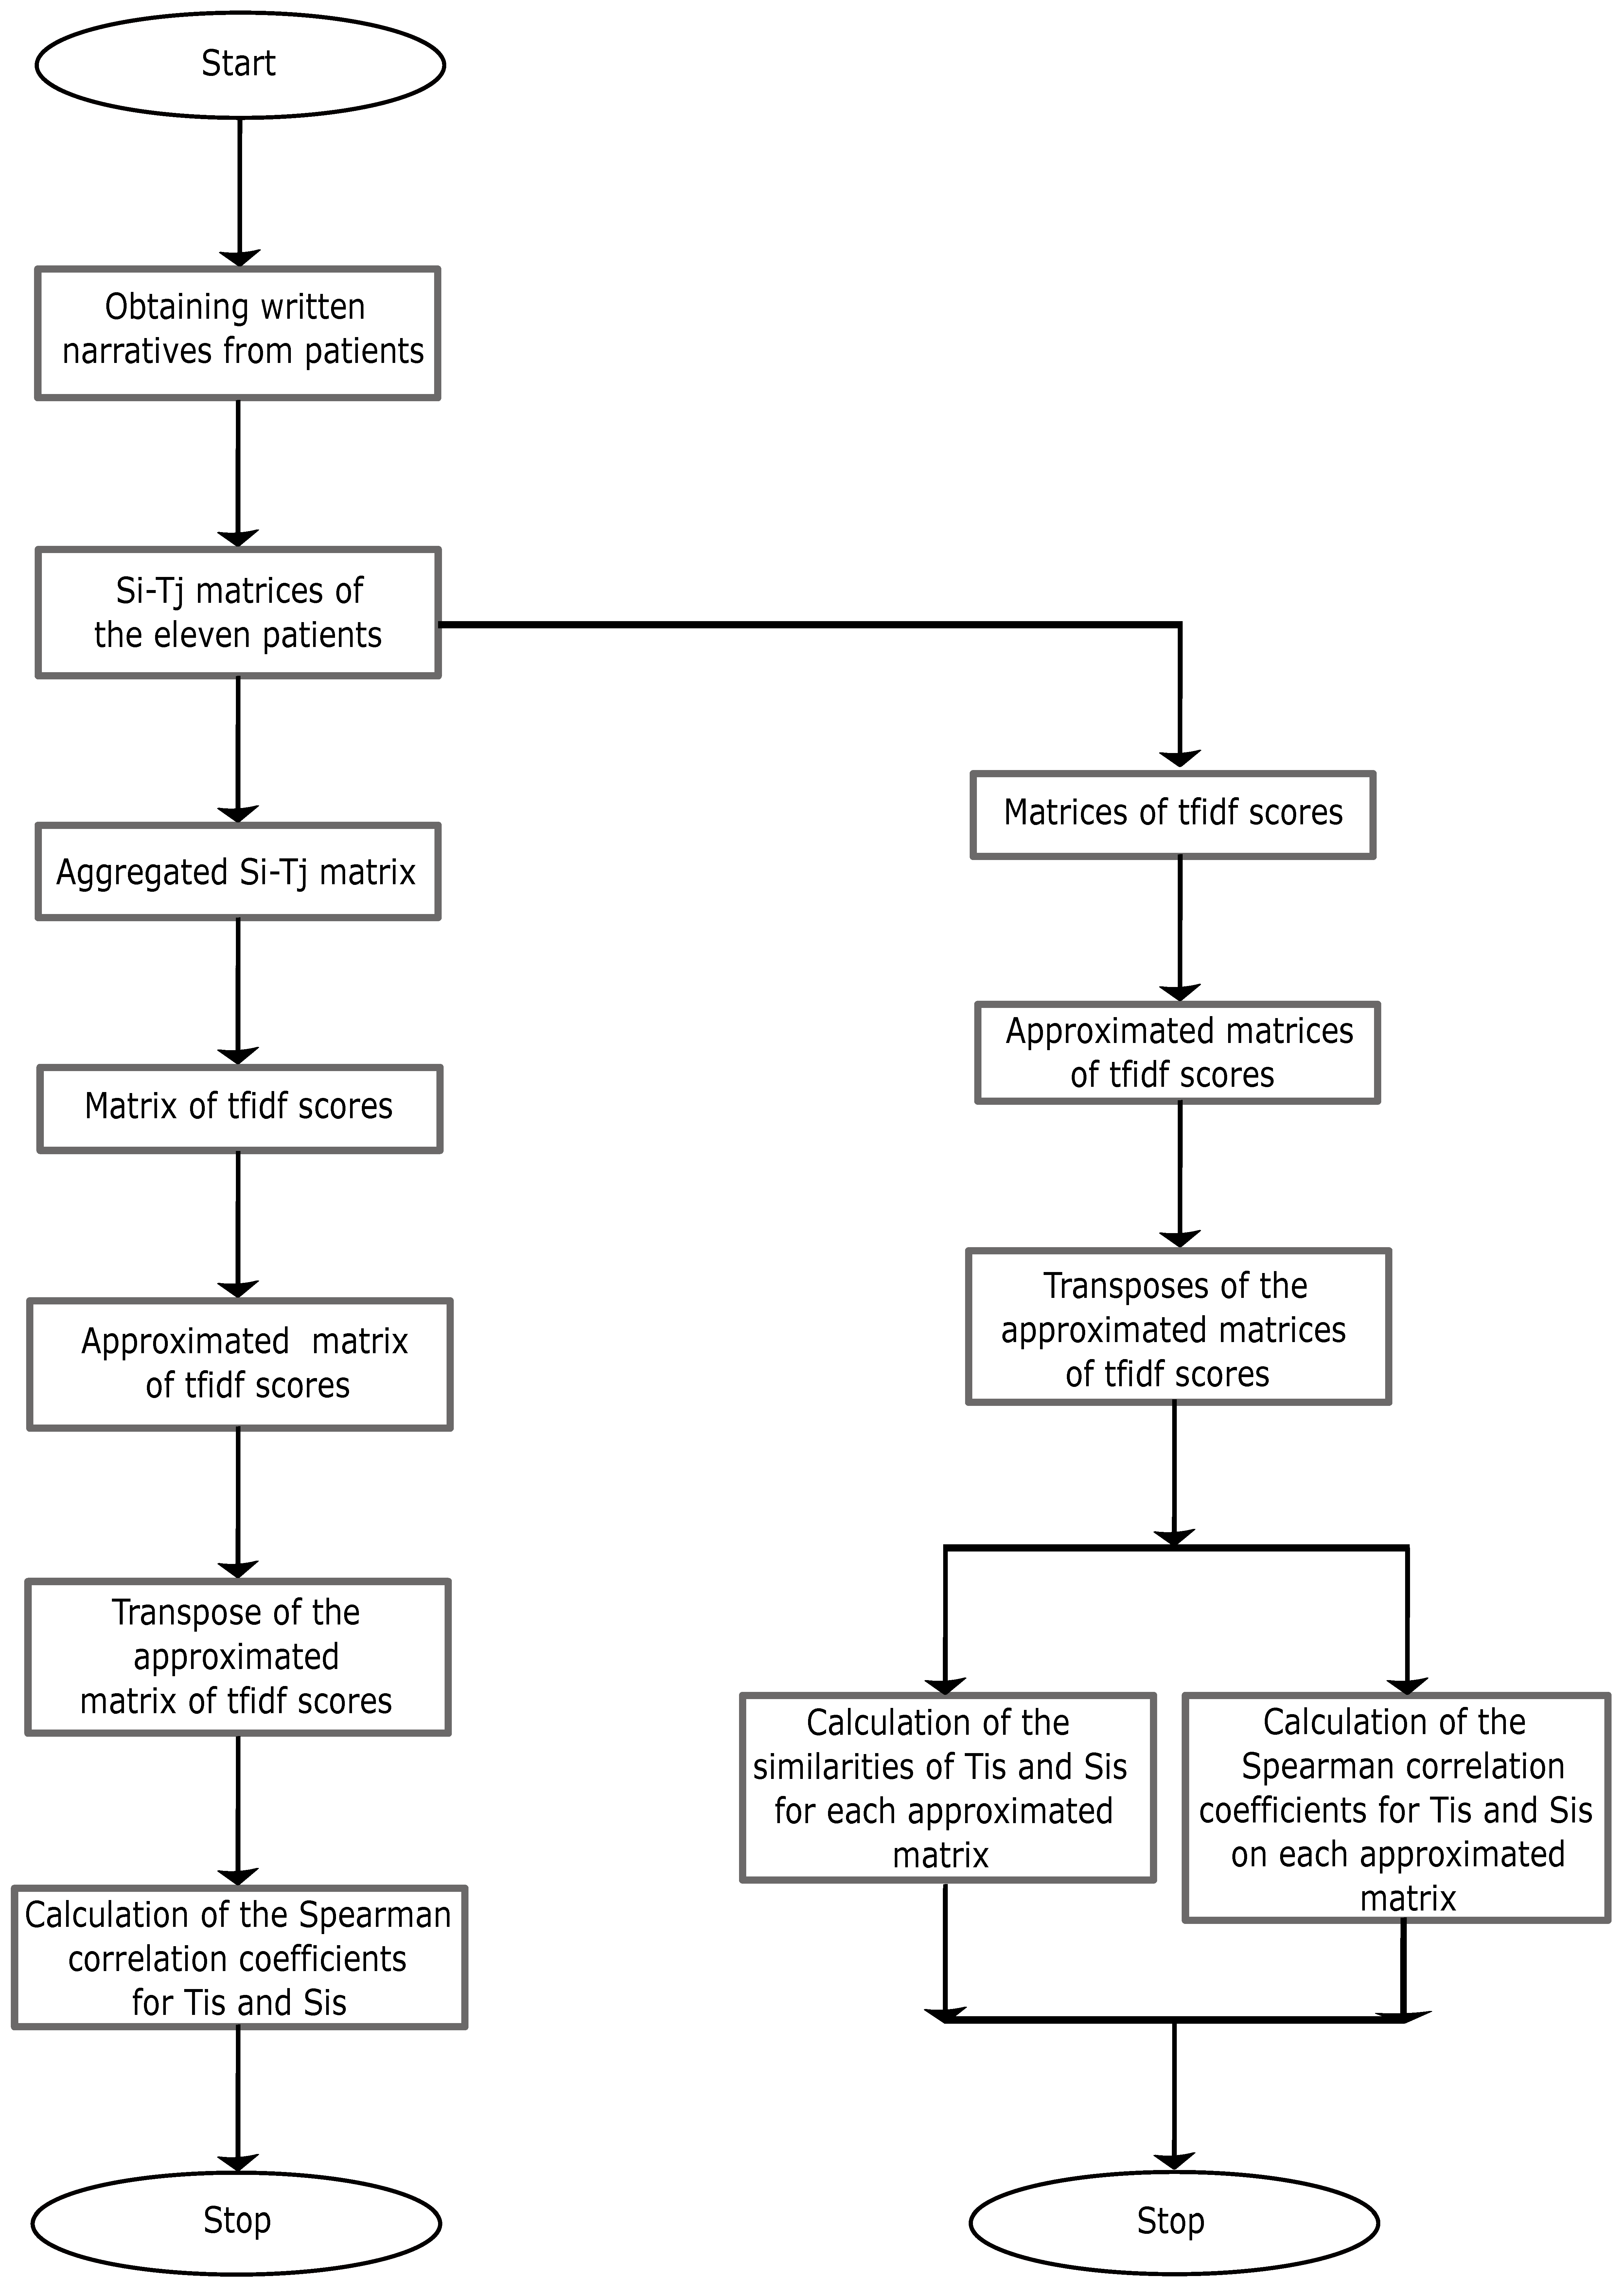
To identify and analyze the relationships between Sis and Tis, as well as the patterns of association of Sis and Tis recorded at both group and patient levels, Spearman correlation and latent semantic indexing (LSI) technique were used.
LSI is a frequently used method in the analysis of relationships between words (rows) and the documents that contain them (columns). LSI uses the method of singular value decomposition (SVD) to reduce the number of rows, identifying irrelevant words, without altering the similarity structure between documents [35]. Applying this method allows for the identification of the structure and importance of words in each document, the assessment of similarities between words, documents, the assessment of the similarities between documents and selected keywords, the identification of hidden correlations between words and between documents, and so on.
Thus, in the context of the work, the matrices that have been processed using LSI are shown in Table 4 and Figure A1-Figure A2. These matrices describe the distributions of Sis (rows) along Tis (columns), and have been processed to obtain the importance of each Si in each Tj (the matrix of tfidf (term frequency-inverse document frequency) scores), the approximated matrices of the matrices of tfidf scores, the matrices of similarity of Sis and Tis, and the correlation matrices of Sis and Tis. Some of these calculations are performed at both group and patient levels. All these results are interpreted and discussed in section 3 and 4.
The block diagram of the research calculations is presented in Figure 2.
Figure 2. Block diagram of research calculations
Preprints 88084 g002
Some of the mathematical preliminaries used in LSI are presented in appendix A1. Calculations were done in Matlab. The formulas and MATLAB commands used to obtain the aforementioned results are:
Formulas:
t f i d f ( i , j ) = ( 1 + l o g 2 ( f ( i , j ) ) × ( l o g 2 ( N / d f ( i ) ) ) [36], where tfidf(i,j) is the tfidf score of the score positioned at row i and column j, f(i,j) is the frequency of Si in Tj, N is the number of Tis, df(i) is the number of occurences of Si in all Tj;
cosine similarity( C , D )= C · D | C | | D | for cosine similarity calculation between the vectors C and D , -1≤cosine similarity( C , D ) 1 . To calculate the similarities of Tis and Sis, we wrote and ran a computer program;
ρ = 1 6 d i 2 n 3 n , where ρ is Spearman correlation coefficient between two vectors, d i is the difference between two ranks and n is the number of observations, -1 ρ 1.
MATLAB commands:
< [ U , S , V ] = s v d ( A ) > for the singular value decomposition of the matrix A;
To identify k relevant symptoms, we used the following set of Matlab commands:
From i = 1 k σ i 2 i = 1 N σ i 2 0 , 9 we get k, where σ i are singular values of the matrix A;
< P = i n v ( S k ) × U k T > , where S k = S ( 1 : k , 1 : k ) , U k T = t r a n s p o s e ( U ( : , 1 : k ) ) ;
< b a r ( X , P ( l , : ) ) > we extract from line l, with 1 l k , the symptom with the highest absolute value;
< B = U ( : , 1 : k ) × S ( 1 : k , 1 : k ) × V T ( 1 : k , : ) > used to obtain the approximation of the matrix A by reducing its dimensionality (to k rows);
To represent Tis in the semantic space {S6,S2,S5}, we used the command
< S ( 1 : 3 , 1 : 3 ) × V ( 1 : 3 , 1 : 26 ) T > .
To obtain the ranking of the similarities of Tis in relation to Si or groups of Sis, we used the following MATLAB command set:
First of all we establish the criterion, for example S6, based on which we rank Tis. Then,
< q s 6 = [ 0 , 0 , 0 , 0 , 0 , ( 1 + l o g 2 ( 1 ) ) · ( l o g ( 2 ( N / d f ( 6 ) ) ) , 0 ] >
< q S 6 = P × t r a n s p o s e ( q s 6 ) >
< E = i n v ( S ( 1 : k , 1 : k ) ) × t r a n s p o s e ( U k ) × t f i d f >
< s i m s 6 = d o t ( t r a n s p o s e ( q S 6 ) , E ) >
< n o r m k f a c t o r s = [ n o r m ( E ( : , 1 ) ) , . . . . , n o r m ( E ( : , 26 ) ) ] >
< s i m S 6 = s i m s 6 . / ( n o r m ( q S 6 ) · n o r m k f a c t o r s ) >
To calculate the Spearman correlations between Tis we used the command
< c o r r ( C , T y p e , S p e a r m a n ) > , where C is the approximated matrix of the matrix of tfidf scores. To calculate the Spearman correlations between Sis, we used the command < c o r r ( t r a n s p o s e ( C ) , T y p e , S p e a r m a n ) > .

3. Results

The results, which will be presented in this section, aim to capture the specific features of the illness through Sis and Tis, both at group and patient levels. These can be useful for both group and individual psychotherapies. The connections between the research questions and results are presented in Table 1.
Table 1. Aligning the results with the research questions
Research question Results
What symptoms and life themes are present in middle-aged adults diagnosed with major recurrent depression? Si-Tj matrix (at the level of each patient and at the level of the group of patients)
What relationships are there between Sis and Tis? matrix of tfidf scores (at the level of the group of patients); approximation of the matrix of tfidf scores (at the level of the group of patients), ranking of the importance of Sis on each Tj (at the level of the group of patients); rankings of the similarity of Tis in relation to Si or groups of Sis (at the level of the group of patients)
What patterns of association manifest both between Sis and between Tis, and what significance do these patterns hold? cosine similarities at both between Tis and between Sis (at patient level); Spearman correlations of Tis and Sis (patient/ group level)

3.1. Symptoms and life themes/subthemes

Out of the fourteen Sis proposed for selection to describe the meaning of the groups of words that covered the themes of happiness, unhappiness and everyday life, the patients have only selected seven: anxiety, apathy, fury, regret, low self-esteem, fatigue, sadness. This is a severe homogenization of their life histories in terms of morbid experiences. The procedure described in section 2.2.3 led to twenty six Tis and seven Sis, which were coded in Table 2:
Table 2. Coding of Sis and Tis
Sis Code Tis Code
Anxiety S1 Personal achievement T1
Apathy S2 Achievement of others T2
Fury S3 Personal loss T3
Regret S4 Loss of others T4
Low self-esteem S5 Devaluation of places T5
Fatigue S6 Failure T6
Sadness S7 Escape from failure T7
Danger T8
Personal chance T9
Child’s chance T10
Getting close to loved ones T11
Away from loved ones T12
Communication T13
Suffering T14
Childhood T15
Meditation T16
Regret of own existence T17
Care T18
Meaning of places T19
Center of attention T20
Utility T21
Help T22
Envy T23
Attachment T24
New T25
Humiliation T26
Belonging of Tis to life themes is presented in Table 3.
Table 3. Belonging of Tis to life themes
Tis Happiness theme Unhappiness theme Daily theme
T1 x
T2 x x
T3 x x
T4 x
T5 x
T6 x
T7 x
T8 x
T9 x
T10 x
T11 x
T12 x
T13 x x
T14 x
T15 x
T16 x
T17 x
T18 x
T19 x
T20 x
T21 x
T22 x
T23 x
T24 x
T25 x
T26 x x

3.2. Matrix of Sis and Tis at the level of the group of patients

The synthesis of the information regarding the Tis of the eleven patients led to the matrix presented in Table 4, where the numbers in the matrix indicate how many times Si has been mentioned in Tj.
The most common Si, in terms of occurrences in all Tj is S7 (21 out of 26 possible occurrences). S7 is followed by S1, S3 and S4 (18 out of 26 possible occurrences), S5 (16 out of 26 possible occurrences), S6 (15 out of 26 possible occurrences) and S2 (12 out of 26 possible occurrences).
T3 is the most mentioned in S1, S2, S3, S4 and S7, T1 is the most mentioned in S6, and T18 is the most mentioned in S5.
Table 4. Si − Tj matrix.
S/T T1 T2 T3 T4 T5 T6 T7 T8 T9 T10 T11 T12 T13 T14 T15 T16 T17 T18 T19 T20 T21 T22 T23 T24 T25 T26
S1 26 2 30 1 2 9 2 3 2 1 7 3 2 1 4 3 4 11
S2 6 4 20 2 4 1 3 1 1 7 1 3
S3 15 2 45 1 2 3 7 1 5 2 3 12 8 2 4 1 5 2
S4 28 2 38 1 4 4 6 6 1 5 3 9 3 1 25 3 1 3
S5 5 1 4 1 2 1 3 1 3 6 2 5 13 5 3 2
S6 23 4 20 1 1 9 2 2 3 6 2 6 6 6 12
S7 52 7 61 2 12 16 3 3 8 5 1 5 10 6 2 2 3 1 3 5 3

3.3. Matrix of the importance of Sis on each Tj at the level of the group of patients

The matrix of the importance of each Si on each Tj is presented in Table 5. The zero scores correspond to the cells in Table 4 where Sis are not reported. The other scores within the matrix were calculated using the formula of tfidf scores presented in section 2.2.4. Let us compare the importance of S1 and S7 in T1. How can we explain the fact that S1 is more important than S7 despite the higher frequency of S7? The answer lies in the number of occurrences of S1 in all Tis (df(1)), which is lower than the number of occurrences of S7 in all Tis (df(7)). tfidf scores are significantly influenced by df(i). The lower the df(i), the higher the tfidf scores, and vice versa. A Si occurring in all Tis becomes irrelevant, even though it indicates a constant presence. A Ti is important by what sets it apart from other Tis. We cannot differentiate Tis based on omnipresent Sis.
Table 5. Matrix of tfidf scores.
S/T T1 T2 T3 T4 T5 T6 T7 T8 T9 T10 T11 T12 T13 T14 T15 T16 T17 T18 T19 T20 T21 T22 T23 T24 T25 T26
S1 3.02 1.06 3.13 0 0 0.53 1.06 2.21 1.06 1.37 1.06 0 0.53 2.02 1.37 1.06 0.53 1.59 1.37 0 0 0 0 1.59 2.37 0
S2 4.00 3.35 5.94 2.23 0 0 0 0 0 0 0 0 3.35 1.12 2.88 1.12 1.12 4.25 0 0 1.12 0 2.88 0 0 0
S3 2.60 1.06 3.44 0.53 1.06 0 1.37 2.02 0 0.53 0 0 0 1.76 1.06 1.37 2.43 2.12 1.06 1.59 0 0 0.53 1.76 0 1.06
S4 3.08 1.06 3.31 0.53 1.59 1.59 1.90 1.90 0 0.53 0 0 1.76 1.37 2.21 1.37 0.53 2.99 1.37 0.53 0 1.37 0 0 0 0
S5 2.33 0.70 2.10 0 0.70 1.40 0 0.70 0 0 1.81 0 0.70 1.81 2.51 1.40 2.33 3.29 2.33 1.81 1.40 0 0 0 0 0
S6 4.38 2.38 4.22 0 0.79 0.79 0 3.31 0 0 1.59 1.59 0 2.05 2.84 1.59 2.84 2.84 2.84 0 0 0 0 0 3.64 0
S7 2.06 1.17 2.14 0 0.62 0 1.41 1.54 0.80 0 0.80 1.23 1.02 0.31 1.02 1.33 1.10 0.62 0.62 0 0.80 0.31 0.80 1.02 0.80 0
In the following we will present the ranking of the importance of Sis for each Tj (at group level). For this purpose we applied methods specific to LSI. The key element of the LSI method is to reduce the dimensionality of the matrix presented in Table 5. Dimensionality reduction can be achieved by reducing Sis considered irrelevant.
Thus, S6, S2, and S5 have been identified as the most relevant (important) symptoms (see Appendix B, Table A1). The other four Sis were considered irrelevant.
The approximation of the matrix of tfidf scores, (see Table 6 and section 2.2.4), by reducing dimensionality enables:
− transformation of Si−Tj matrix into a dense one;
− ranking of the similarity of Tis in relation to Si or groups of Sis.
The approximation matrices of tfidf scores are computed similarly for each patient.
Table 6. Approximation of the matrix of tfidf scores.
S/T T1 T2 T3 T4 T5 T6 T7 T8 T9 T10 T11 T12 T13 T14 T15 T16 T17 T18 T19 T20 T21 T22 T23 T24 T25 T26
S1 2.96 1.49 3.02 0.04 0.40 0.31 0.65 2.33 0.47 0.45 0.89 0.86 0.26 1.40 1.52 1.12 1.38 1.49 1.47 −0.12 −0.02 0.05 0.18 0.78 2.34 0.07
S2 4.04 3.25 6.00 2.21 0.23 0.07 0.49 0.22 0.09 0.10 −0.19 0.01 3.50 1.05 2.79 1.22 0.91 4.12 −0.10 −0.02 1.02 0.25 2.83 0.17 −0.18 0.03
S3 2.68 1.12 2.84 0.25 0.80 0.83 0.69 1.57 0.09 0.27 0.84 0.28 0.68 1.53 1.91 1.25 1.69 2.49 1.61 0.87 0.45 0.26 0.20 0.43 0.72 0.18
S4 2.87 1.35 3.29 0.57 0.85 0.88 0.69 1.24 0.00 0.21 0.71 0.11 1.17 1.54 2.18 1.32 1.71 3.02 1.47 1.02 0.66 0.32 0.56 0.32 0.22 0.19
S5 2.40 0.59 2.38 0.14 1.24 1.40 0.78 1.25 −0.19 0.16 1.00 −0.12 0.63 1.78 2.19 1.43 2.13 3.17 2.07 1.83 0.77 0.44 −0.16 0.22 −0.39 0.30
S6 4.44 2.01 4.40 −0.06 0.84 0.75 1.06 3.54 0.60 0.67 1.50 1.18 0.28 2.31 2.46 1.82 2.37 2.55 2.54 0.25 0.07 0.15 0.03 1.13 3.22 0.16
S7 2.07 1.18 2.32 0.26 0.24 0.17 0.41 1.31 0.27 0.26 0.47 0.48 0.53 0.88 1.13 0.74 0.85 1.26 0.79 −0.09 0.09 0.05 0.42 0.45 1.30 0.04
It is easy to see that the matrix presented in Table 6 is a dense one as it contains non-zero elements. The approximated matrix was obtained as a product of three matrices U(:,1:3)×S(1:3,1:3)× V T (1:3,1:26). A simpler way to obtain the prediction for the null elements in the matrix of tfidf scores can be achieved by calculating the matrix PT=S(1:3,1:3)× V T (1:3,1:26). For example, the prediction of the element (3,6) in Table 5 is obtained by multiplying U(3,:)×PT(:,6). The ranking of the importance of Sis for each Ti is presented in Table 7. The negative values in this table correspond to the positions inTable 5 where Sis are null. At the same time, the representation of Tis in the space {S6,S2,S5} (see Appendix F, Table A6) maintains the same similarity structure as that of the columns in Table 6. This can be easily verified by calculating the cosine similarities of each pair of columns from the two tables.
Table 7. Ranking of the importance of Sis on each Ti.
Si T1 Si T2 Si T3 Si T4 Si T5 Si T6 Si T7 Si T8 Si T9 Si T10 Si T11 Si T12 Si T13 Si T14 Si T15 Si T16 Si T17 Si T18 Si T19 Si T20 Si T21 Si T22 Si T23 Si T24 Si T25 Si T26
S6 4,44 S2 3,25 S2 5,98 S2 2,21 S5 1,24 S5 1,40 S6 1,06 S6 3,54 S6 0,60 S6 0,67 S6 1,50 S6 1,18 S2 3,50 S6 2,31 S2 2,79 S6 1,82 S6 2,37 S2 4,12 S6 2,54 S5 1,83 S2 1,02 S5 0,44 S2 2,83 S6 1,13 S6 3,22 S5 0,30
S2 4,04 S6 2,01 S6 4,40 S4 0,57 S4 0,85 S4 0,88 S5 0,78 S1 2,33 S1 0,47 S1 0,45 S5 1,00 S1 0,86 S4 1,17 S5 1,78 S6 2,46 S5 1,43 S5 2,13 S5 3,17 S5 2,07 S4 1,02 S5 0,77 S4 0,32 S4 0,56 S1 0,78 S1 2,34 S4 0,19
S1 2,96 S1 1,49 S4 3,29 S7 0,26 S6 0,84 S3 0,83 S4 0,69 S3 1,57 S7 0,27 S3 0,27 S1 0,89 S7 0,48 S3 0,68 S4 1,54 S5 2,19 S4 1,32 S4 1,71 S4 3,02 S3 1,61 S3 0,87 S4 0,66 S3 0,26 S7 0,42 S7 0,45 S7 1,30 S3 0,18
S4 2,87 S4 1,35 S1 3,02 S3 0,25 S3 0,80 S6 0,75 S3 0,69 S7 1,31 S3 0,09 S7 0,26 S3 0,84 S3 0,28 S5 0,63 S3 1,53 S4 2,18 S3 1,25 S3 1,69 S6 2,55 S1 1,47 S6 0,25 S3 0,45 S2 0,25 S3 0,20 S3 0,43 S3 0,72 S6 0,16
S3 2,68 S7 1,18 S3 2,84 S5 0,14 S1 0,40 S1 0,31 S1 0,65 S5 1,25 S2 0,09 S4 0,21 S4 0,71 S4 0,11 S7 0,53 S1 1,40 S3 1,91 S2 1,22 S1 1,38 S3 2,49 S4 1,47 S2 −0,03 S7 0,09 S6 0,15 S1 0,18 S4 0,32 S4 0,22 S1 0,07
S5 2,40 S3 1,12 S5 2,38 S1 0,04 S7 0,24 S7 0,17 S2 0,49 S4 1,24 S4 0,00 S5 0,16 S7 0,47 S2 0,01 S6 0,28 S2 1,05 S1 1,52 S1 1,12 S2 0,91 S1 1,49 S7 0,79 S7 −0,09 S6 0,07 S7 0,05 S6 0,03 S5 0,22 S2 -0,18 S7 0,04
S7 2,07 S5 0,59 S7 2,32 S6 −0,06 S2 0,23 S2 0,07 S7 0,41 S2 0,22 S5 −0,19 S2 0,10 S2 −0,19 S5 −0,12 S1 0,26 S7 0,88 S7 1,14 S7 0,74 S7 0,85 S7 1,26 S2 −0,10 S1 −0,12 S1 −0,02 S1 0,05 S5 −0,16 S2 0,17 S5 −0,39 S2 0,03

3.4. Rankings of the similarity of Tis in relation to Si or groups of Sis

What is the order of the representativeness of Tis in relation to different Sis or combined Sis? Here representativeness carries the meaning of similarity. The rankings of the similarity of Tis in relation to Sis are presented in the Table 8. These rankings were obtained running the MATLAB commands presented in section 2.2.4.
We notice the highest similarity between S3 and T26. Most rankings at position 26 are recorded by T9.
The most important information is contained in the first and last row of this table. The meanings of this information will be presented and analyzed in the next section.
Table 8. Ranking of the similarities of Tis in relation to Si or groups of Sis (at the group level)
S1 S2 S3 S4 S5 S6 S7 S6 & S2 & S5 S3 & S4
T9 0,995965 T23 0,997317 T26 1 T22 0,995868 T20 0,998118 T25 0,989812 T9 0,979403 T13 0,934609 T20 0,989967
T12 0,989301 T4 0,976134 T6 0,999526 T20 0,967097 T26 0,956404 T12 0,98605 T12 0,913588 T4 0,875648 T22 0,984999
T25 0,986681 T13 0,934132 T5 0,994631 T26 0,913931 T6 0,952207 T24 0,978246 T25 0,902476 T3 0,817813 T26 0,97177
T24 0,906217 T2 0,767802 T20 0,971152 T6 0,902173 T22 0,949452 T10 0,962763 T24 0,788894 T23 0,786502 T6 0,964726
T10 0,869069 T3 0,635008 T22 0,921905 T5 0,880936 T5 0,921315 T9 0,924983 T10 0,739049 T18 0,785911 T5 0,950225
T8 0,729452 T21 0,30098 T17 0,870824 T21 0,872964 T21 0,722328 T8 0,892486 T2 0,669705 T15 0,728096 T21 0,778942
T2 0,463941 T18 0,245362 T19 0,794533 T18 0,797319 T17 0,690371 T11 0,487735 T8 0,548356 T21 0,699693 T17 0,767766
T1 0,432782 T1 0,236144 T14 0,753133 T17 0,660874 T18 0,625357 T1 0,455215 T1 0,479856 T2 0,694564 T18 0,750468
T3 0,285165 T15 0,151052 T16 0,71321 T15 0,632086 T19 0,597251 T7 0,316326 T3 0,453271 T1 0,568066 T16 0,636571
T11 0,206558 T9 0,029564 T7 0,708054 T16 0,55462 T14 0,531676 T19 0,294482 T23 0,289191 T22 0,366768 T19 0,635026
T7 0,076089 T12 −0,1715 T18 0,651499 T14 0,521548 T16 0,504182 T2 0,2775 T4 0,047194 T16 0,335539 T14 0,634932
T14 0,014867 T22 −0,19133 T11 0,648323 T19 0,490337 T7 0,474782 T14 0,262896 T13 -0,03904 T7 0,119083 T15 0,630444
T23 0,001208 T25 −0,2017 T21 0,616317 T7 0,468473 T15 0,472042 T3 0,18745 T11 -0,03982 T14 0,114088 T7 0,584223
T19 0,000436 T16 −0,28939 T15 0,597075 T11 0,293451 T11 0,419888 T16 0,169977 T7 -0,0743 T20 0,083479 T11 0,456171
T16 −0,03674 T24 −0,31264 T8 0,105508 T13 0,148896 T13 −0,1088 T17 0,105764 T16 -0,13094 T17 0,065587 T1 0,00915
T17 −0,16352 T10 −0,35753 T1 0,056145 T4 0,014567 T1 −0,17451 T15 −0,15481 T14 −0,13941 T5 0,051444 T13 −0,00596
T4 −0,2398 T20 −0,44278 T10 −0,13426 T1 −0,02681 T8 −0,17868 T5 −0,25879 T15 −0,21727 T26 0,045041 T8 −0,11063
T15 −0,256 T7 −0,477 T3 −0,17007 T3 −0,07686 T4 −0,23521 T23 −0,2641 T19 −0,23342 T6 0,016236 T3 −0,1196
T13 −0,31425 T14 −0,4962 T13 −0,21002 T23 −0,23559 T3 −0,30243 T6 −0,32499 T17 −0,33277 T9 −0,2266 T4 −0,1462
T5 −0,52419 T8 −0,54308 T24 −0,21378 T8 −0,27027 T10 −0,41221 T26 −0,34582 T18 −0,48631 T19 −0,2438 T10 −0,33477
T18 −0,56193 T26 −0,54479 T4 −0,35111 T2 −0,41256 T23 −0,47337 T4 −0,47378 T5 −0,68033 T10 −0,26647 T23 −0,38391
T6 −0,5871 T5 −0,56032 T25 −0,46952 T10 −0,47416 T24 −0,48386 T18 −0,48788 T6 −0,74364 T24 −0,27246 T24 −0,40987
T26 −0,60325 T17 −0,56636 T12 −0,48064 T24 −0,54309 T2 −0,62526 T13 −0,51547 T26 −0,75211 T12 −0,32332 T2 −0,47475
T20 −0,77315 T6 −0,57027 T2 −0,53331 T25 −0,76103 T25 −0,69395 T20 −0,55154 T21 −0,7559 T8 −0,32931 T25 −0,64921
T22 −0,80095 T19 −0,78278 T23 −0,56063 T12 −0,76391 T12 −0,70564 T22 −0,62654 T22 −0,84262 T11 −0,34843 T12 −0,65578
T21 −0,85934 T11 −0,8104 T9 −0,65504 T9 −0,86634 T9 −0,84296 T21 −0,82827 T20 −0,88651 T25 −0,3544 T9 −0,79215

3.5. Cosine similarities of Sis and Tis (at patient level)

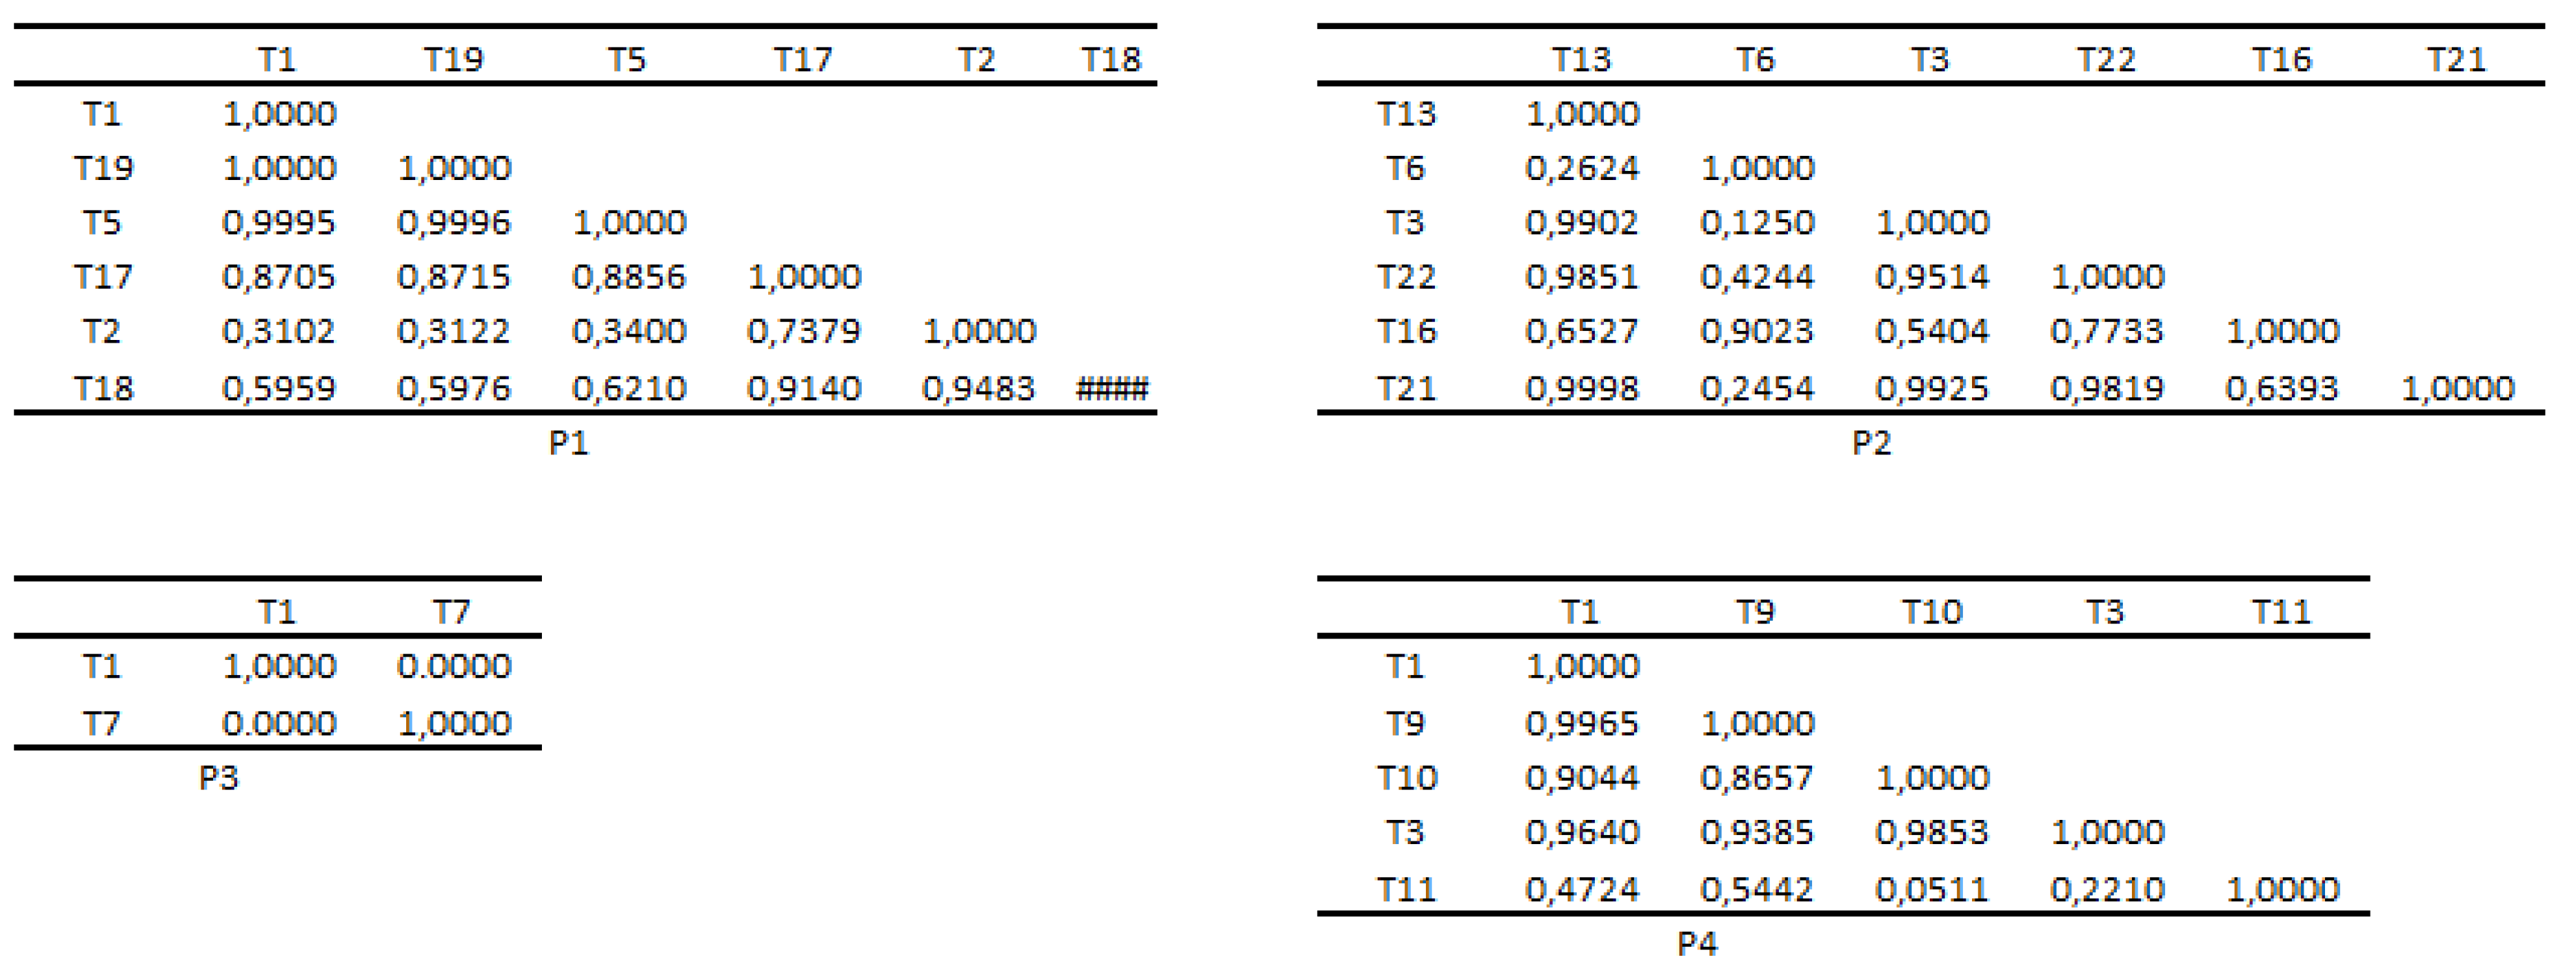
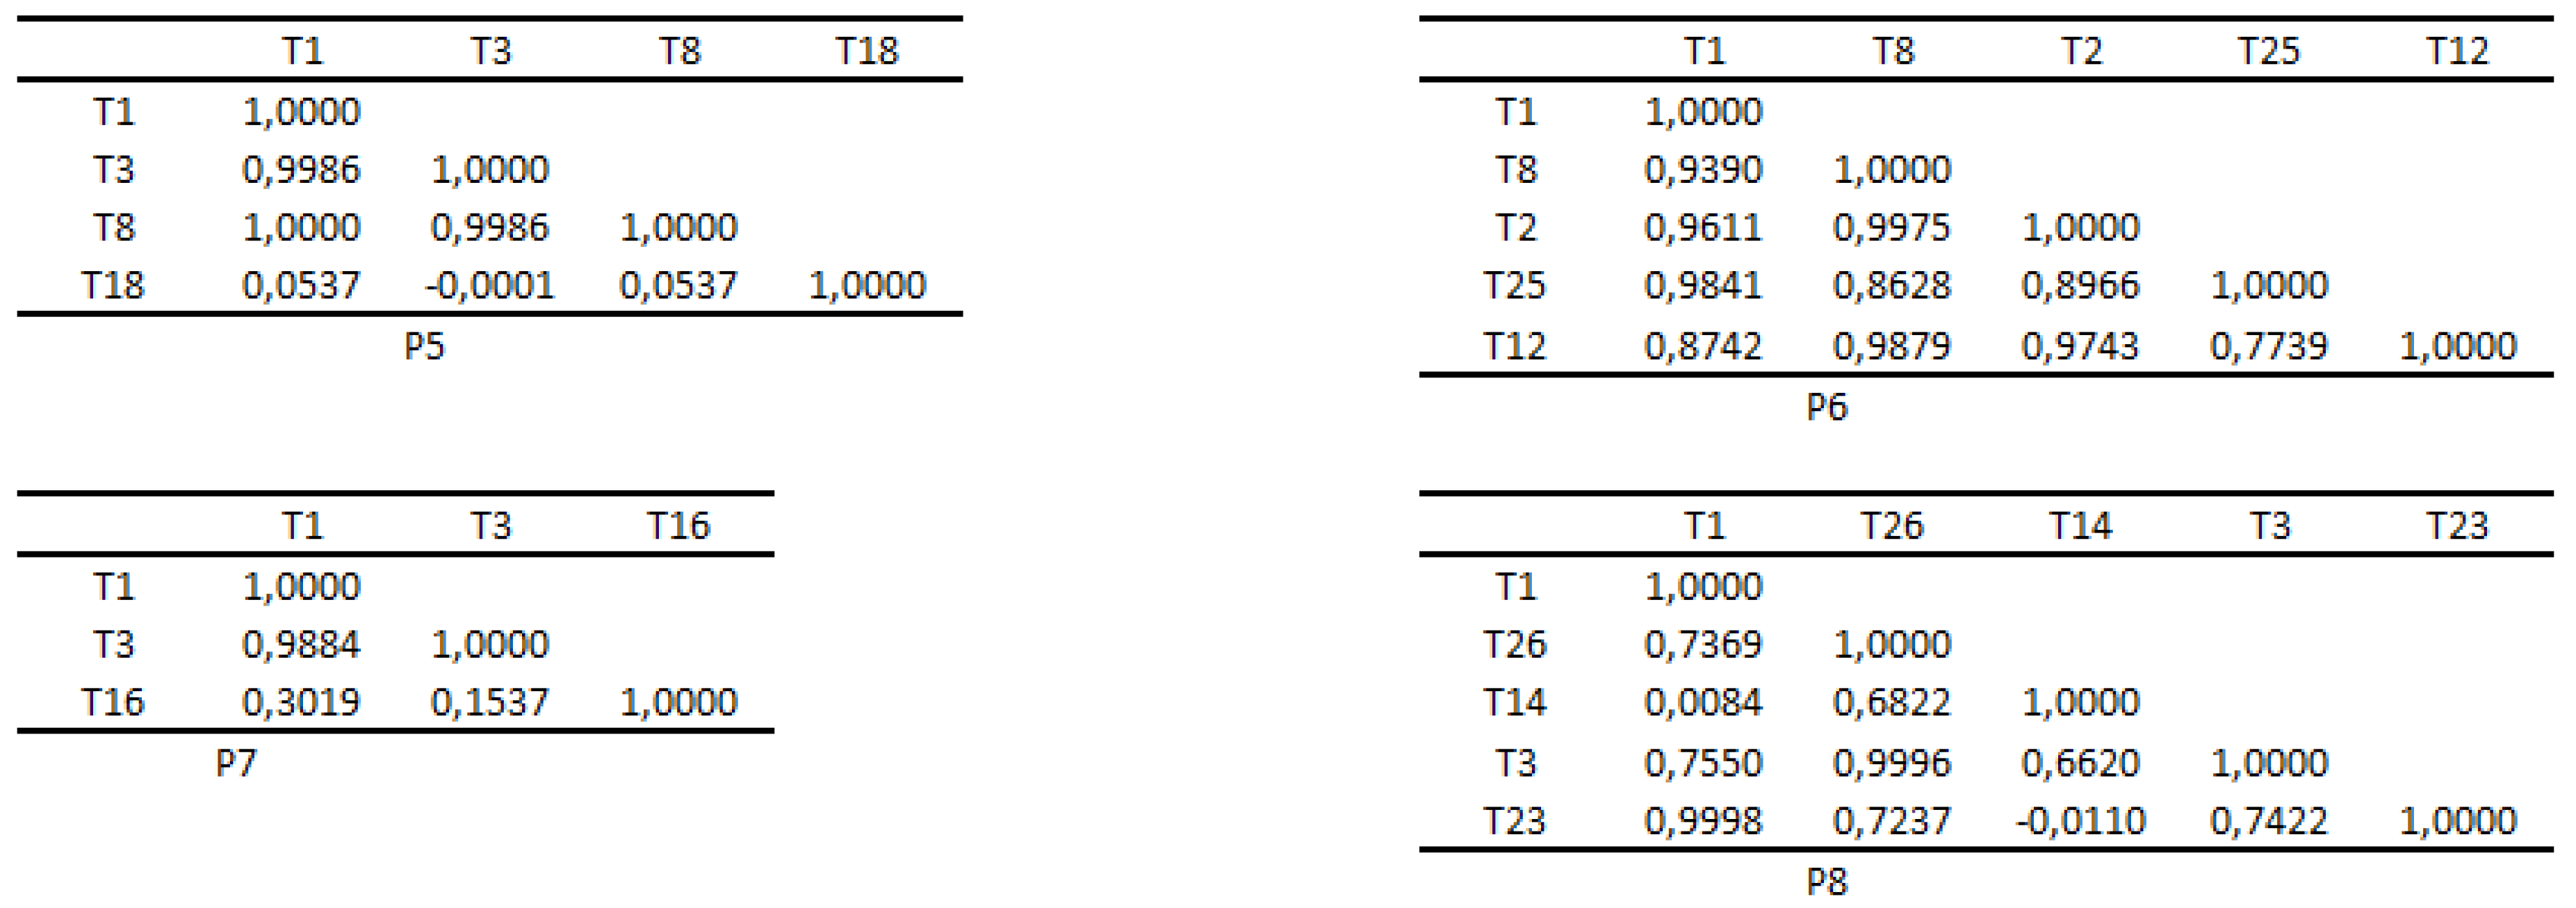
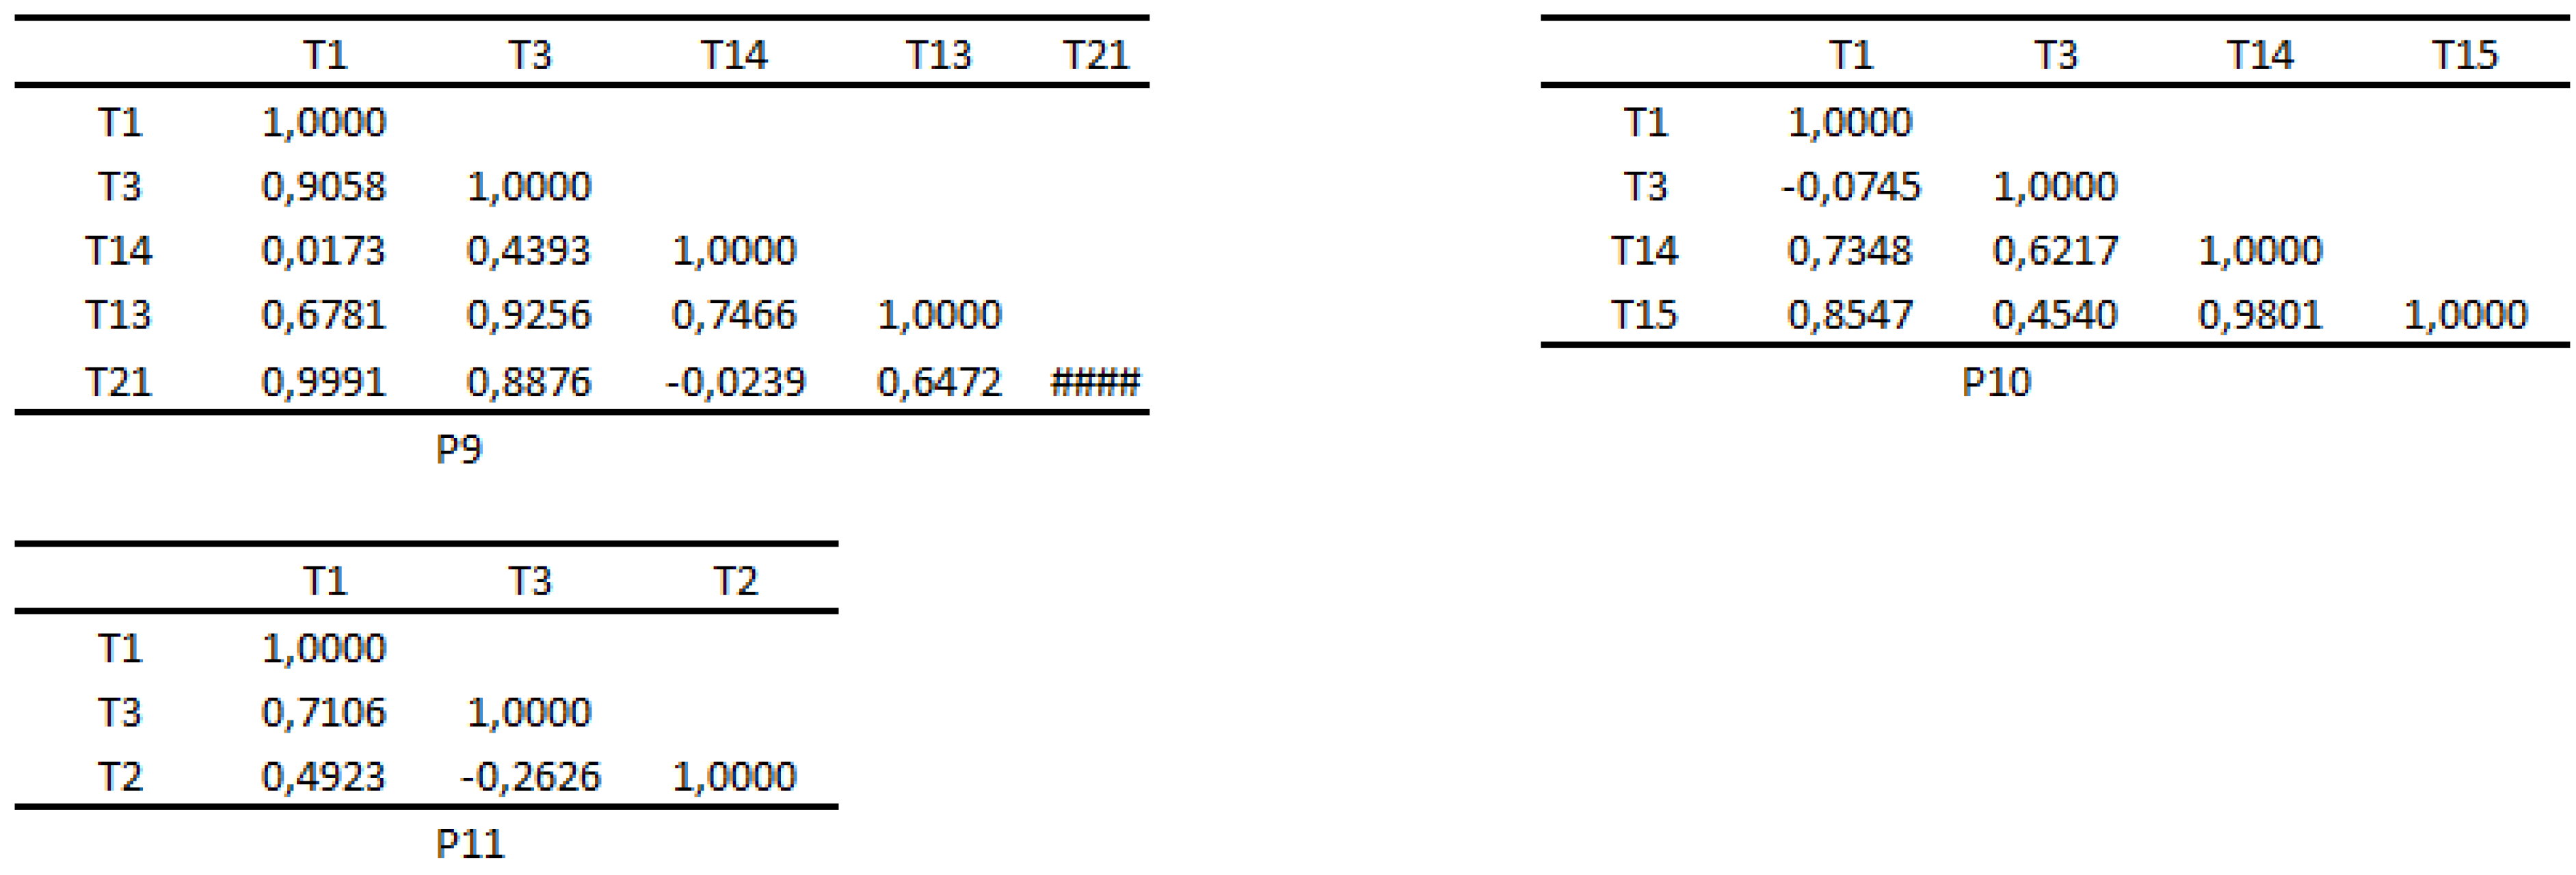
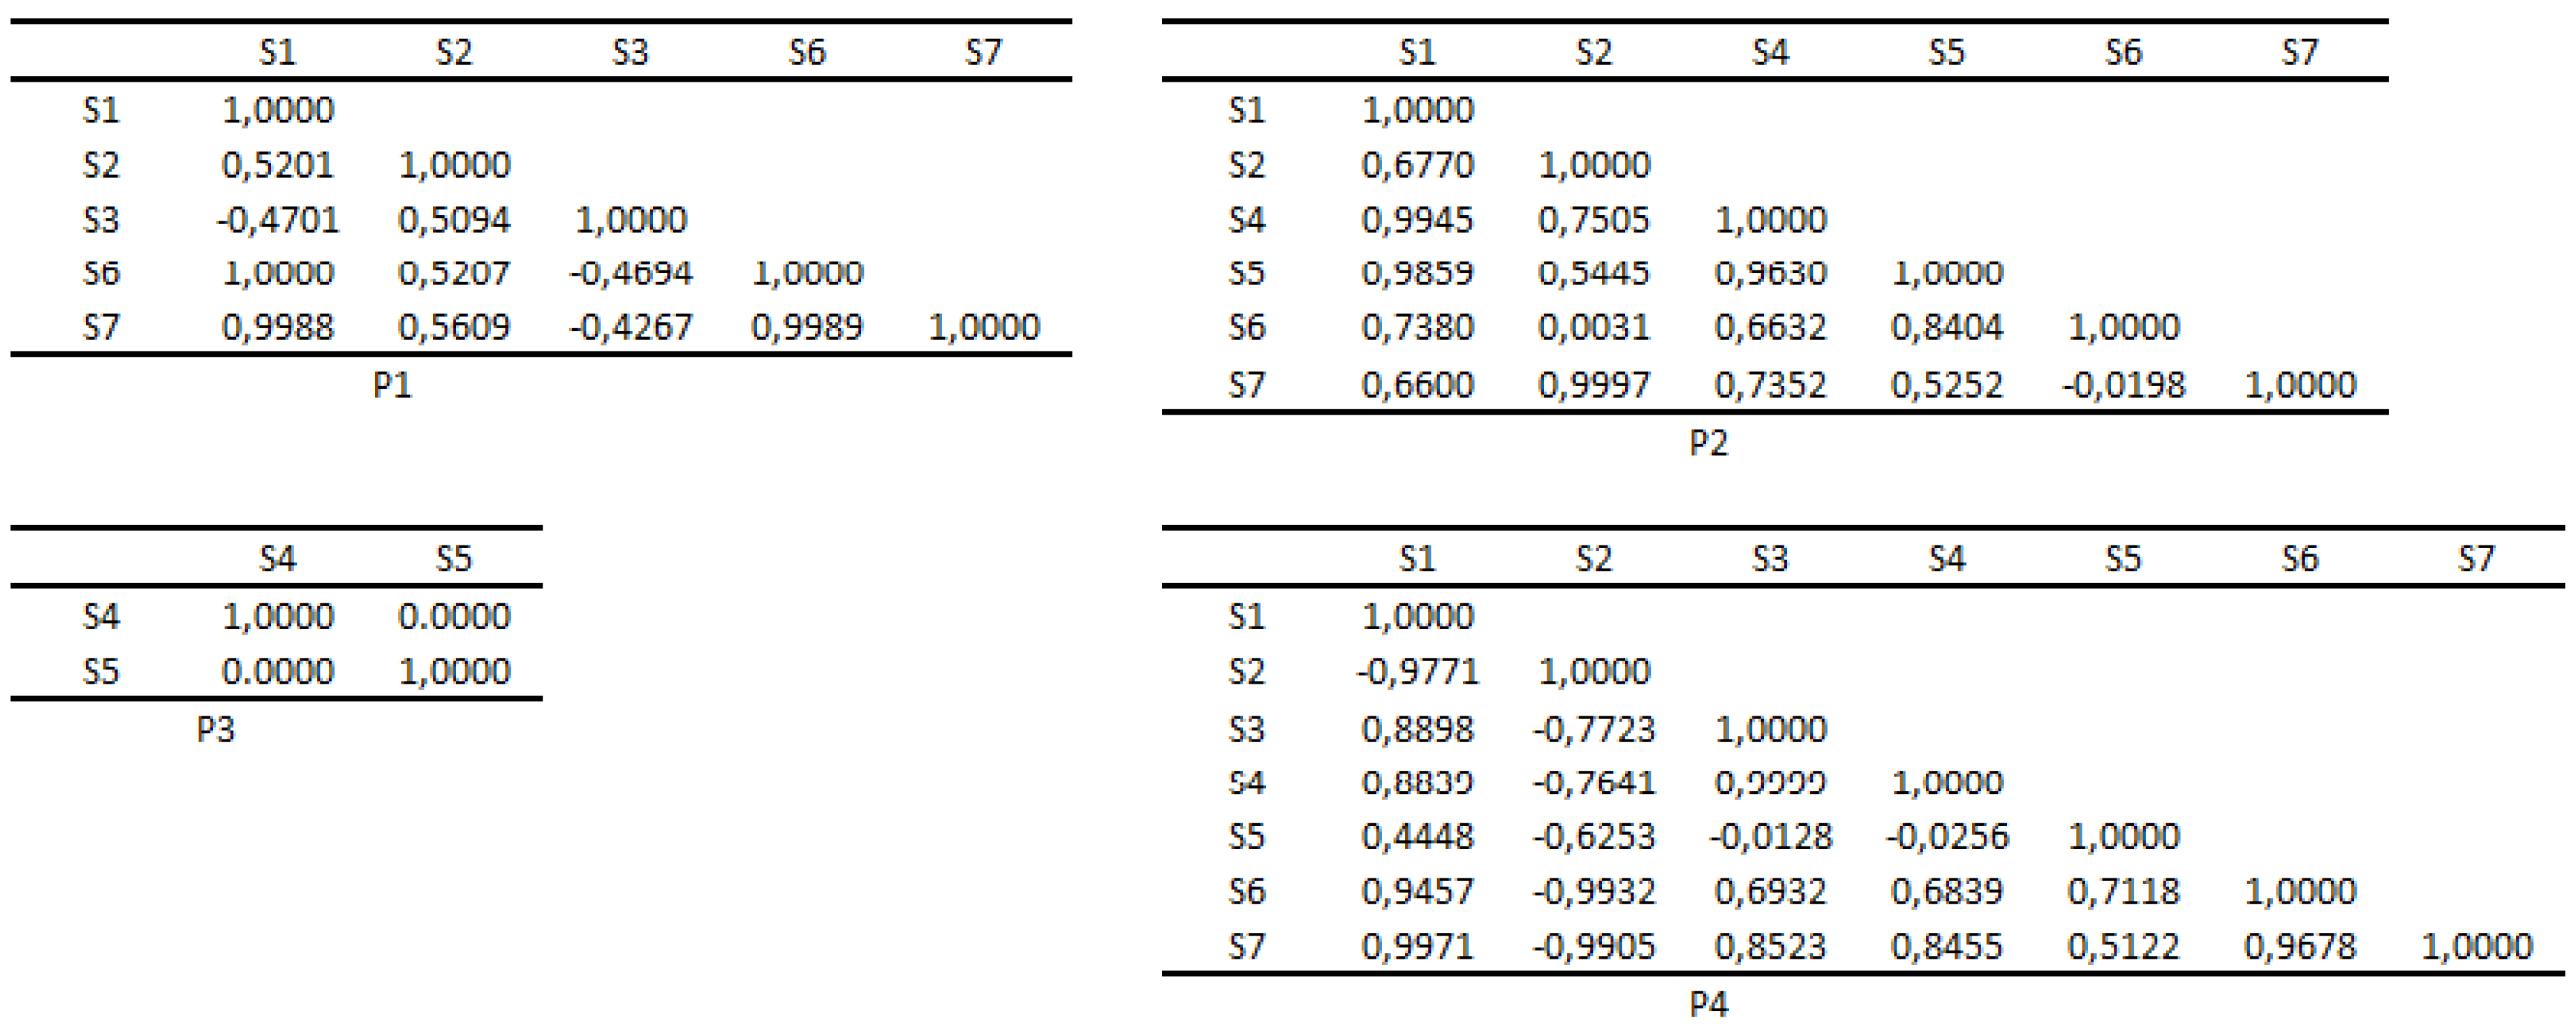
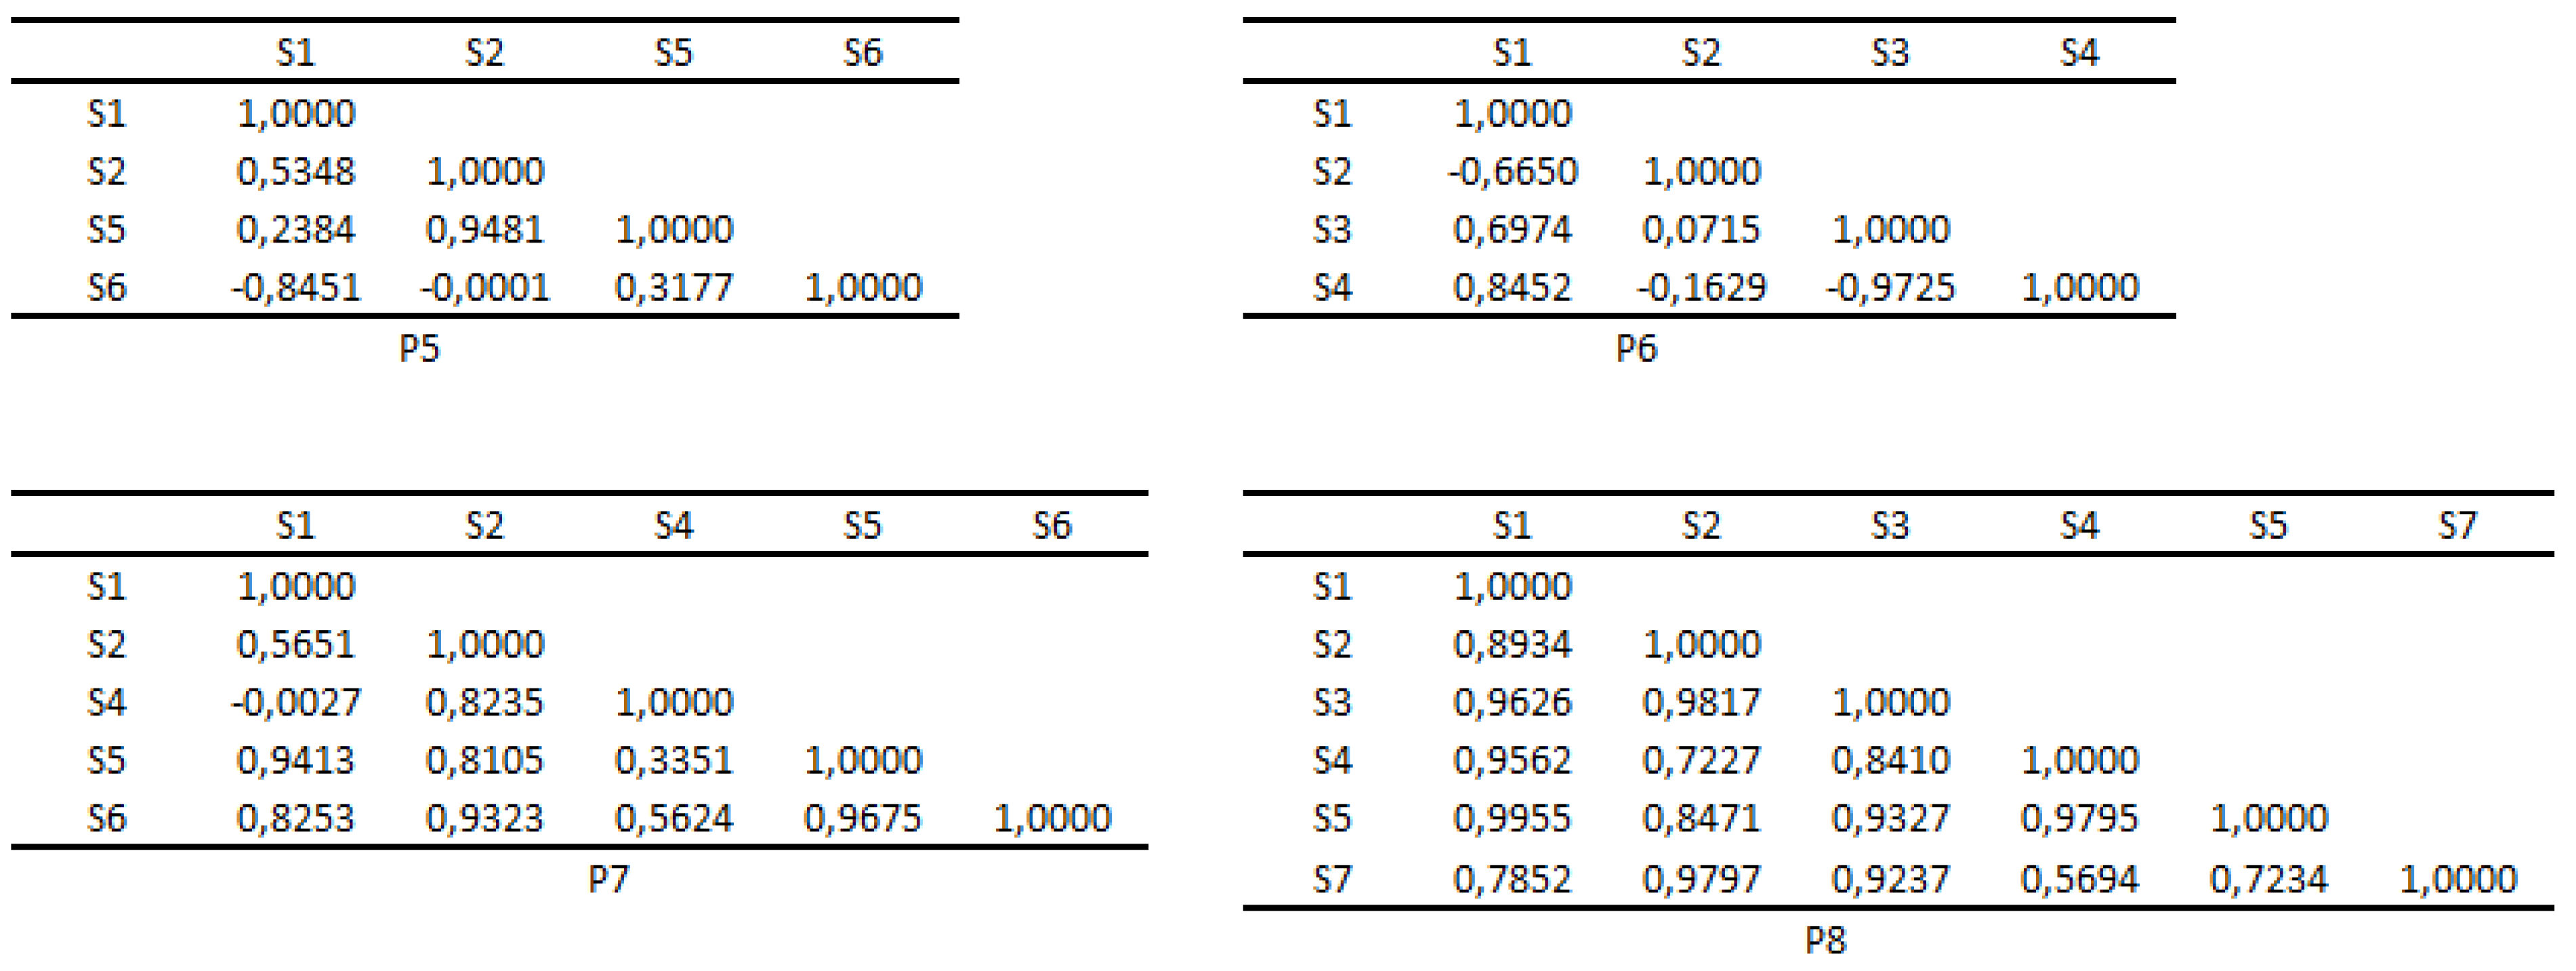
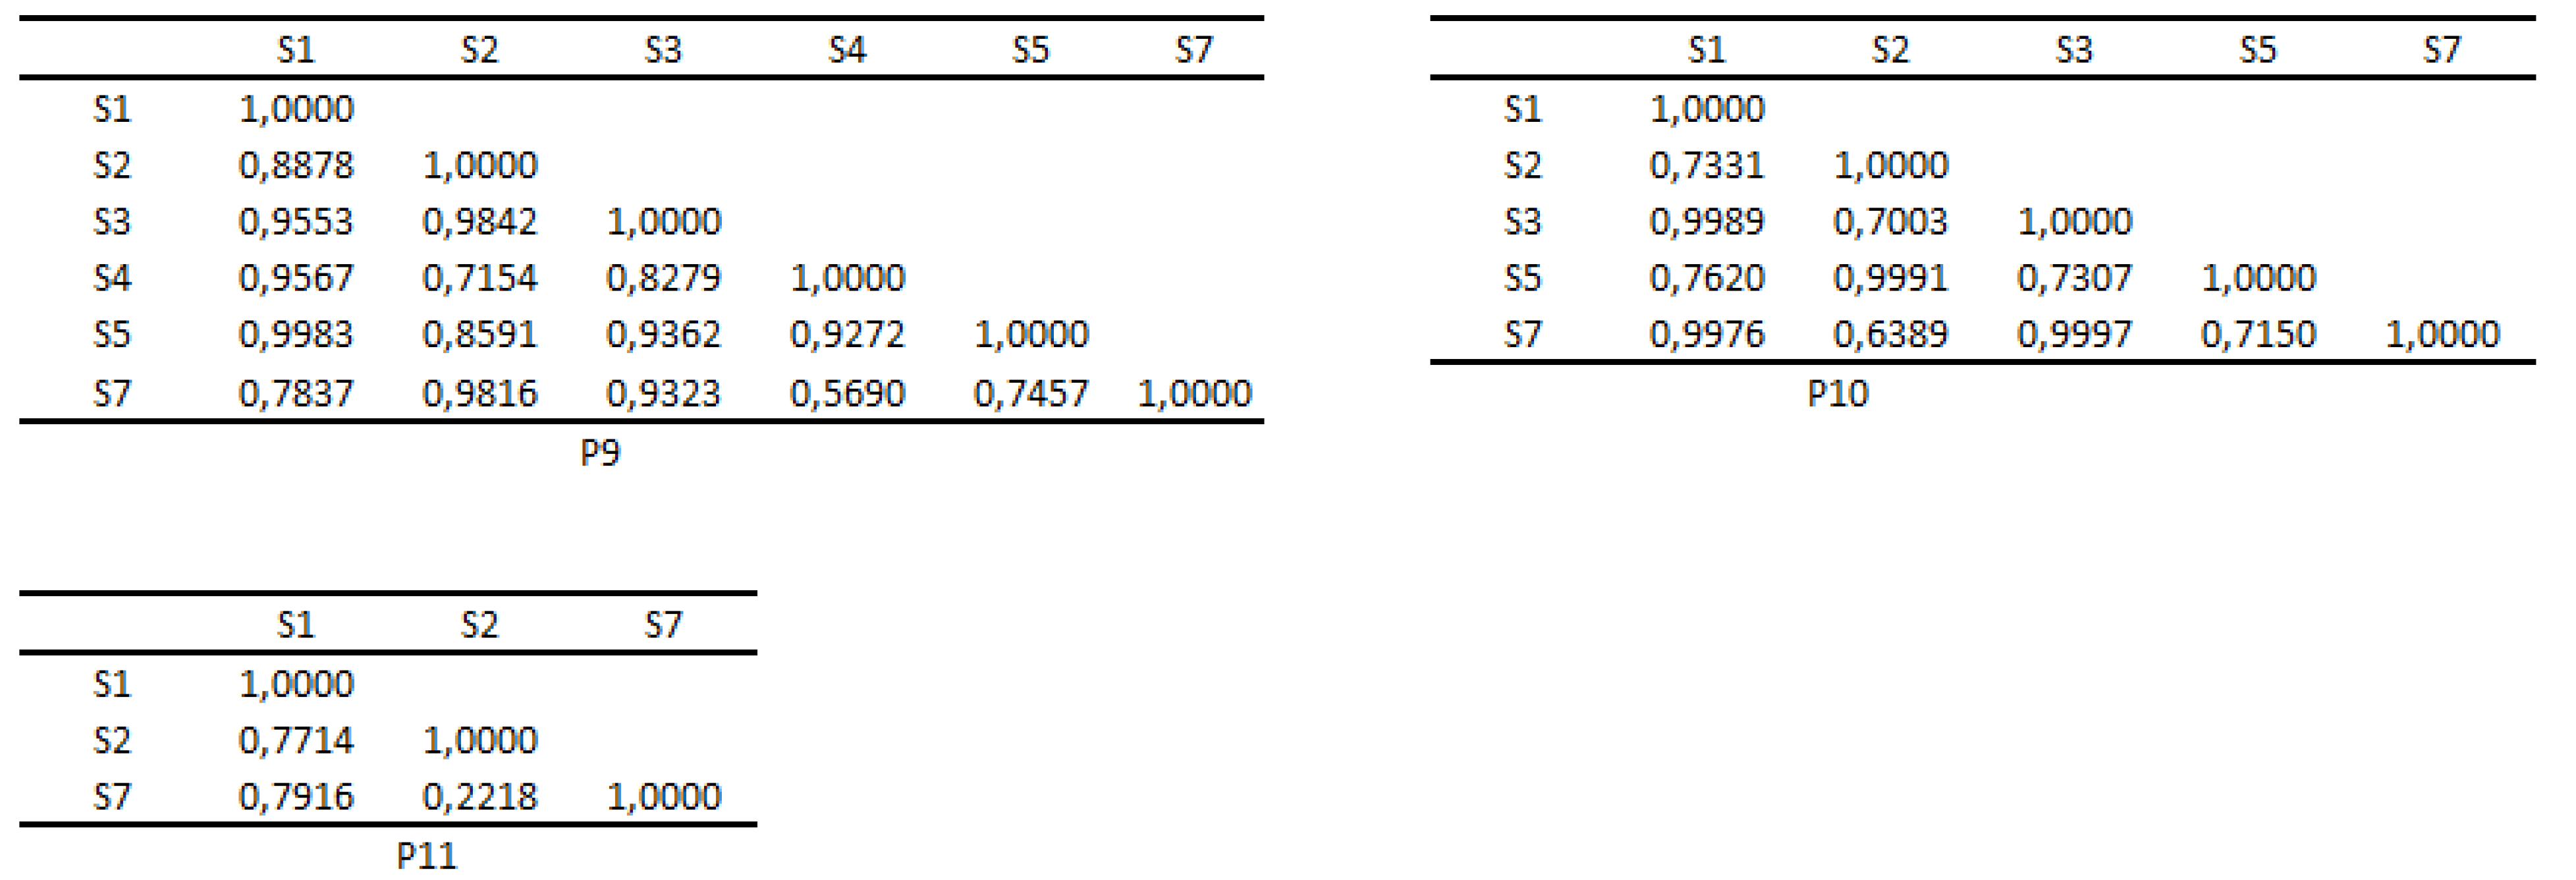
At patient level, cosine similarities recorded both between Sis and between Tis are presented in Figure A3-Figure A8. As for the similarities between Sis, most negative similarities (dissimilarities) are recorded at P4. Also P4 records the highest dissimilarity between S2 and S6. These dissimilarities need to be analyzed together with the correlations between the same Sis to see if the dissimilar Sis are significantly associated or not. This aspect is the subject of discussions presented in the following section.
All Tis are similar with four exceptions. This finding may suggest the presence of a significant background of suffering that leads to similar representations of Tis in the semantic space.

3.6. Spearman correlations of Tis and Sis (at patient/group level)

At the level of the group of patients, Spearman correlations presented in Table A2 highlighted interesting aspects. Out of the 325 correlations between Tis, 118 strong correlations were identified ( ρ >0.8), 64 of these being higher than 0.9. At the same time, 126 correlations are significant (p<0.05). All 325 correlations refer to both Tis that belong to the same life theme and Tis that do not belong to the same life theme. All correlations between Sis (see Table A4) are significant except S1−S5, S5−S6, S5−S7. Out of the 21 Spearman correlations, 8 correlations have ρ >0.8, and 6 of these ones have ρ >0.9.
At pacient level, significant Spearman correlations of Sis and Tis are presented in Table 9Table 10.
Table 9. Significant Spearman correlations between Tis
Patient Correlation ρ p-value
1 T1-T19 1,0000 0,0008
T1-T5 0,7818 0,0468
T5-T19 0,7818 0,0468
T5-T17 0,9636 0,0032
T17-T18 0,7818 0,0492
T2-T18 0,9636 0,0040
2 T3-T13 0,9643 0,0028
T13-T22 1,0000 0,0004
T13-T21 0,9643 0,0028
T6-T16 0,9286 0,0067
T22-T21 0,9643 0,0028
T3-T22 0,9643 0,0028
T3-T21 1,0000 0,0004
4 T1-T9 0,9643 0,0028
T1-T10 0,7857 0,0480
T1-T3 0,7857 0,0480
T3-T10 1,0000 0,0004
5 T1-T8 1,0000 0,0024
6 T1-T8 0,8846 0,0119
7 T1-T3 0,8545 0,0222
8 T3-T26 0,9643 0,0028
9 T1-T21 0,9643 0,0028
T3-T13 0,8929 0,0123
10 T14-T15 0,9636 0,0040
Table 10. Significant Spearman correlations between Sis
Patient Correlation ρ p-value
1 S1-S6 1,0000 0,0001
S1-S7 1,0000 0,0001
S2-S3 0,7831 0,0264
S6-S7 1,0000 0,0001
2 S1-S4 0,9429 0,0167
S1-S5 1,0000 0,0028
S2-S7 1,0000 0,0028
S4-S5 0,9429 0,0167
4 S1-S2 −1,0000 0,0167
S1-S7 1,0000 0,0167
S2-S7 −1,0000 0,0167
S3-S4 1,0000 0,0167
8 S1-S5 1,0000 0,0167
S2-S3 1,0000 0,0167
9 S1-S5 1,0000 0,0167
S2-S3 1,0000 0,0167

4. Discussion

The life of an individual is unique, just as the lives of patients affected by clinical depression are. The uniqueness of life in exogenous depression is subjectively determined by perceived vulnerabilities, the experiencing and anticipation of the feelings of loss and rejection, and the interpretations given to an unfavorable backdrop of reality. From an objective standpoint, the experiencing of clinical depression is determined by changes occurring at neuronal level and transformations that generate symptoms (cellular activity− proto-emotions− emotions−symptoms).
Every moment in life is filled with psychological experiences, which suggests the presence of associations between symptoms and life themes [43,44]. The greater the degree of psychological impairment, the greater the stability and persistence of these associations.
Dysfunctional life themes significantly impact the life of depressed patients. These themes are the subject of a rich specialized literature [37,38,39]. On a subjective level, patients with clinical depression experience widespread feelings of unhappiness. This generalization may be due to the intrusion of life themes related to unhappiness into the space of happiness [40,41,42].
The analysis of Tis and life themes on the group of investigated patients presents interesting aspects. Thus, unusual presence of Tis in happiness, unhappiness, or daily theme suggests:
− inadequate presence of T3 and T6 in happiness theme that suggests the expansion of unhappiness into the space of happiness;
− inadequate presence of T11 and T17 in unhappiness theme that suggests the expansion of nostalgia into the space of happiness and alteration of the meaning of life themes through the severe expansion of existential anxiety;
− inadequate presence of T12 and T21 in daily theme that suggests the alteration of the meaning of daily themes through the severe expansion of existential anxiety;
− presence of T4 in daily theme that suggests the expansion of the obsession of loss into the daily space of reflection;
− presence of T5 in happiness theme that suggests dissapointment;
− presence of T7 in unhappiness theme that signals the obsession with failure;
− presence of T16 in daily theme that signals the need for self awareness;
− presence of T25 in daily theme that suggests the need to escape from everyday life;
− presence of T26 in unhappiness and daily themes that signals the humiliation obsession.
At the level of the group of patients, the most invoked symptom is sadness, followed by anxiety, regret, fury, low self-esteem, apathy, and fatigue. The specialized literature confirms this hierarchy for sadness and anxiety [45,46,47]. On the other hand, the twenty six Tis can be most easily discriminated in relation to S6, S2, and S5. S6 is the most important symptom in 13 out of the 26 Tis (T1, T7, T8, T9, T10, T11, T12, T14, T16, T17, T19, T24, T25), S2 is the most important symptom in 8 out of the 26 Tis (T2, T3, T4, T13, T15, T18, T21, T23), and S5 is the most important symptom in 5 out of the 26 Tis (T5, T6, T20, T22, T26). For this reason, the base of representation for the twenty six Tis is given by S6, S2, and S5. The semantic space is defined by this representation base.
Let us analyze the importance of the most frequently mentioned symptoms, S7 and S1. The lowest tfidf scores are recorded for S7 in T1, T3, T7, T14, T15, T16, T17, and T18. These scores are a direct consequence of the presence of symptom S7 in 21 out of the 26 Tis and the low frequencies recorded in Tis (except for T1, T2, T3, T7, T8, T12, and T16, where S7 records high frequencies). Although we would expect S1 to precede S7 in terms of the lowest tfidf scores, this is not the case. This effect is due to the distribution of scores recorded by S1 across Tis. The lowest score for S1 is recorded in T13. The high frequencies recorded by S1 in T3, T1, T8, and T25 result in high tfidf scores.
Although S2 is invoked in only 12 Tis, the low frequencies recorded throughout the Tis make this symptom the least important for 8 Tis.
The cosine similarities presented in Table 8 are a direct consequence of the representations of Sis and Tis in the semantic space. Naturally, the highest number of similarities with Tis (18) is recorded by S6 & S2 & S5. Following closely are S3 and S4 with the same number of similarities (16). The highest similarity was recorded between S3 and T26. This is due to their identical representations in the semantic space. Since Sis represents morbid experiences, the similarities presented in the table indicate dysfunctional pairs (Si,Tis) at the level of the group of patients. The table also highlights the presence of dissimilarities, for example between S3 and T9. We consider that the information provided by the table could be useful in symptom-focused group psychotherapy that should only take into account the dissimilar pairs (Sis,Tis). The effects of the similar pairs (Si,Tis) manifest in the perpetuation and accentuation of dysfunctional symptoms.
At the level of the group of patients, the premise of the simultaneous activation of happiness, unhappiness, and daily themes was tested by identifying strong and significant positive associations between Tis that belong to the three life themes. The correlations presented below confirmed this premise. There are many more such correlations in Table A2.
T1−T2, ρ =1.0000, p=0.0004; T2−T12, ρ =0.8214, p=0.0341; T1−T12, ρ =0.8214, p=0.0341; T2−T16, ρ =1.0000, p=0.0004; T1−T16, ρ =1,0000 p=0.0004; T2−T21, ρ =1.0000, p=0.0004; T1−T21, ρ =1.0000, p=0.0004; T2−T24, ρ =0.9643, p=0.0028; T1−T24, ρ =0.9643, p=0.0028; T2−T25, ρ =0.8929, p=0.0123; T1−T25, ρ =0.8929, p=0.0123; T1−T3, ρ =0.8571, p=0.0238; T3−T21, ρ =0.8571, p=0.0238; T3−T16, ρ =0.8571, p=0.0238; T1−T7, ρ =1.0000, p=0.0004; T7−T12, ρ =0.8214, p=0.0341; T7−T16, ρ =1.0000, p=0.0004; T7−T21, ρ =1.0000, p=0.0004; T7−T24, ρ =0.9643, p=0.0028; T7−T25, ρ =0.8929, p=0.0123; T1−T8, ρ =1.0000, p=0.0004;
T8−T12, ρ =0.8214, p=0.0341; T8−T16, ρ =1.0000, p=0.0004; T8−T21, ρ =1.0000, p=0.0004; T8−T24, ρ =0.9643, p=0.0028; T8−T25, ρ =0.8929, p=0.0123
Other strong and significant correlations highlight associations between life subthemes within the same theme. Also, this table signals the presence of weak and negative correlations.
What can we say about the premise of the simultaneous activations of Tis at patient level? The Table 9Table 10 indicate the following aspects:
  • for P1, the following significant associations were identified: T1 - T19, similarity=1.0000, ρ =1.0000 and p=0.0008; T1 - T5, similarity=0.9995, ρ =0.7818 and p=0.0468; T19 - T5, similarity=0.9996, ρ =0.7818 and p=0.0468; T5 - T17, similarity=0.8856, ρ =0.9636 and p=0.0032; T17 - T18, similarity=0.9140, ρ =0.7818 and p=0.0492; T2 - T18, similarity=0.9483, ρ =0.9636 and p=0.004. All these associations suggest a high probability of the manifestation of the dysfunctional subthematic cycle T1 - T19 - T5.
  • for P2, the following significant associations were identified: T13 - T3, similarity=0.9902, ρ =0.9643 and p=0.0028; T13 - T22, similarity=0.9851, ρ =1.0000 and p=0.0004; T13 - T21, similarity=0.9998, ρ =0.9643 and p=0.0028; T6 - T16, similarity=0.9023, ρ =0.9286 and p=0.0067; T3 - T22, similarity=0.9514, ρ =0.9643 and p=0.0028; T3 - T21, similarity=0.9925, ρ =1.0000 and p=0.0004; T22 - T21, similarity=0.9819, ρ =0.9643 and p=0.0028. These associations suggest a high probability of the manifestation of the dysfunctional subthematic cycles, T3 - T13 - T21 and T3 - T13 - T21 - T22. Additionally, these cycles associate the happiness, unhappiness, and daily themes.
  • for P4, the absence of the daily life theme suggests his inability to escape suffering through everyday life, which signifies a severe impairment due to illness. Significant subtheme associations are: T1 - T9, similarity=0.9965, ρ =0.9643 and p=0.0028; T1 - T10, similarity=0.9044, ρ =0.7857 and p=0.0480; T1 - T3, similarity=0.9640, ρ =0.7857 and p=0.0480; T10 - T3, similarity=0.9853, ρ =1.0000 and p=0.0004. The results indicate a high probability of the manifestation of the dysfunctional subthematic cycle T1-T3-T10.
  • for P5, a significant association T1 - T8, similarity=1.0000, ρ =1.0000 and p=0.0024 was identified.
  • for P6, a significant association T1 - T8, similarity=0.9390, ρ =0.8846 and p=0.0119 was identified.
  • for P7, a significant association T1 - T3, similarity=0.9884, ρ =0.8545 and p=0.0222 was identified.
  • for P8, a significant association T3 - T26, similarity=0.9996, ρ =0.9643 and p=0.0028 was identified.
  • for P9, two significant associations T1 - T21, similarity=0.9991, ρ =0.9643 and p=0.0028; T3-T13, similarity=0.9256, ρ =0.8929 and p=0.0123 were identified.
  • for P10, a significant association T14 - T15, similarity=0.9801, ρ =0.9636 and p=0.004 was identified..
  • for P3 and P11, no significant associations were found.
In conclusion, at patient level, the possibility of simultaneous associations of more than two Tis, and also of the themes of happiness, unhappiness and everyday life is confirmed. Additionally, there are no significant positive associations between dissimilar Tis.
At patient level, the combined analysis of similarities and correlations between Sis yields the following conclusions:
  • for P1, there are four significant correlations: S1-S6, similarity=1.0000, ρ =1.0000, p=0.0001; S1-S7, similarity=0.9988, ρ =1.0000, p=0.0001; S6-S7, similarity=0.9989,
    ρ =1.0000, p=0.0001; S2-S3, similarity=0.5094, ρ =0.7831, p=0.0264. These data indicate a very high probability of the manifestation of the dysfunctional symptomatic cycle S1-S6-S7.
  • for P2, there are four significant correlations: S1-S4, similarity=0.9945, ρ =0.9429, p=0.0167; S1-S5, similarity=0.9859, ρ =1.0000, p=0.0028; S4-S5, similarity=0.963, ρ =0.9429, p=0.0167; S2-S7, similarity=0.9997, ρ =1.0000, p=0.0028. These data indicate a very high probability of the manifestation of the dysfunctional symptomatic cycle S1-S4-S5. Additionally, with a high probability, the patient simultaneously experiences S2 and S3.
  • for P4, there are four significant correlations: S1-S2, disimilarity=−0.9771, ρ =−1.0000, p=0.0167; S1-S7, similarity=0.9971, ρ =1.0000, p=0.0167; S2-S7, disimilarity=−0.9905, ρ =−1.0000, p=0.0167; S3-S4, similarity=0.9999, ρ =1.0000, p=0.0167. These data indicate, with a high probability, the patient’s tendency to experience S7 in a pure (undistorted) manner and in combination with S1. Additionally, the patient shows a tendency to experience S2 in a pure manner, and to experience S3 and S4 in a combined manner.
  • for P8, there are two significant correlations: S1-S5, similarity=0.9955, ρ =1.0000, p=0.0167; S2-S3, similarity=0.9817, ρ =1.0000, p=0.0167. These data indicate, with a very high probability, the simultaneous experiencing of S1 and S5, as well as of S2 and S3.
  • for P9, there are two significant correlations: S1-S5, similarity=0.9983, ρ =1.0000, p=0.0167; S2-S3, similarity=0.9842, ρ =1.0000, p=0.0167. These data indicate, with a very high probability, the simultaneous experiencing of S1 and S5, as well as of S2 and S3.
  • for P3, P5, P6, P10 and P11 there are no significant correlations.
To summarise, at the level of Sis and the analyzed patients, we can conclude that there are no significant positive associations between dissimilar Sis. Additionally, there is a possibility of the manifestation of dysfunctional symptomatic cycles, as well as the pure (undistorted) and combined experiencing of Sis.
Clearly, a larger number of patients yields greater consistency to the findings. Our intention was to describe, through a computational approach, the specific manner of manifestation of the relationship between symptoms and life themes at the level of patient/group of patients. We consider that our findings can be useful in the patient psychotherapy. In the long run, our concerns aim to assess the specific effect of the associations of dissimilarities on the quality of the life of patients, and to identify patterns of heightened or diluted experience as a result of these associations.
5. Conclusions

The paper applies algebraic techniques to identify the relationships between symptoms and life themes. The novel aspects introduced by our research pertain to the assessment of the similarity of symptoms and life themes, the ranking of the importance of simptoms on each life theme, the rankings of the similarity of life themes in relation to symptoms, and the combined analysis of similarities/disimilarities - correlations recorded both at the level of life themes and symptoms. Our research design can be followed in initiating new studies on other population categories affected by major recurrent depression or on other disorders.

Author Contributions

“Conceptualization, A.G.S., C.M.S. and I.M.; methodology, A.G.S.; validation, A.G.S., C.M.S. and I.M.; formal analysis, A.G.S.; investigation, C.M.S.; writing—original draft preparation, C.M.S.; writing—review and editing, C.M.S. All authors have read and agreed to the published version of the manuscript.”

Funding

This research received no external funding.

Institutional Review Board Statement

The research was conducted in accordance with the Declaration of Helsinki, and approved by the Ethics Committee in Scientific Research of Lucian Blaga University of Sibiu, Romania. Protocol code: 27 and date of approval: 2023 may 10.

Informed Consent Statement

Informed consent was obtained from all subjects involved in the study.

Data Availability Statement

The data of this research, excepting the ones provided by the patients are available from the corresponding author.

Conflicts of Interest

The authors declare no conflict of interest.

Abbreviations

The following abbreviations are used in this manuscript:
MD Major depression
MDD Major depressive disorder
PI Personal’s interpreter
Pi Patient i
Si Symptom i
Ti Life subtheme i
UIPS Universe of ideals, psychological experiences, and skills

Appendix A.

Appendix A.1. Mathematical preliminaries for latent semantic analysis

Definition A1. 
[48] The dot product of two n-component real vectors is the linear combination of their components or
u · v = u 1 v 1 + . . . + u n v n
.
Definition A2. 
[49] Vectors v and u are mutually orthogonal iff v T u = 0 .
Definition A3. 
The vectors v and u are orthonormal if:
a) they are orthogonal;
b) their norms are equal to one.
Definition A4. 
[48] The length of a vector v R n is the square root of the sum of the squares of its components. | v | = v 1 2 + . . . + v n 2
Definition A5. 
[50] Cosine similarity between two nonzero vectors u , v R n is c o s θ = u · v | u | | v | .
Definition A6. 
[48] The angle between two nonzero vectors u , v R n is θ=arccos u · v | u | | v | .
Theorem A1. 
For any u , v R n , | u · v | | u | | v | .
Definition A7. 
[51] [52] A sparse matrix is a matrix in which most of the elements are zero.
Definition A8. 
[51] [52] A dense matrix is a matrix in which most of the elements are nonzero.
Definition A9. 
[53] Let M be an n×n matrix and let x C n be a nonzero vector for which M x = λ x for some scalar λ. Then x is called an eigenvector and λ is called an eigenvalue of the matrix M.
Proposition A1. 
[53] Eigenvectors are shrunk, stretched or reflected vectors upon multiplication by a matrix.
Definition A10. 
A matrix with orthonormal columns is an orthonormal matrix.
Theorem A2. 
[49] If A is a real m×n matrix then there are orthogonal matrices U=[ u 1 ... u m ]∈ R m × m , V=[ v 1 ... v n ]∈ R n × n such that U T A V = = d i a g ( σ 1 , . . . , σ p ) R m × n where p = m i n ( m , n ) and σ 1 . . . σ p 0 . Equivalently A = U V T .
U V T is the singular value decomposition of A. The singular values of A are σ i = λ i where λ i is the eigenvalue i of A T A . The matrix ∑ is a diagonal one.
Proposition A2. 
Let A be a matrix, with the singular values σ i , i=1,...,r and k<r. Then A k = U k k V k T is an approximation of A by keeping of k largest singular values such that i = 1 k σ i 2 i = 1 r σ i 2 0.9 .

Appendix B. Extracting relevant Sis by using LSI

To extract the relevant Sis, we calculated the matrix P = i n v S ( 1 : 3 , 1 : 3 ) × U ( : , 1 : 3 ) T (see Table A1). The relevant Sis are those placed in cells with the highest absolute value on each row. The results are presented below.
Table A1. Matrix P
Table A1. Matrix P
S1 S2 S3 S4 S5 S6 S7
−0,0168 −0,0248 −0,0171 −0,0186 −0,0171 −0,0259 −0,0119
−0,0434 0,1245 −0,0157 0,0094 −0,0152 −0,0727 −0,0105
0,0809 0,0521 −0,0508 −0,0706 −0,1722 0,0710 0,0529

Appendix C. The matrices Si-Tj for each patient

Figure A1. Si-Tj matrices for patients 1-5
Preprints 88084 g0a1
Figure A2. Si-Tj matrices for patients 6-11
Preprints 88084 g0a2

Appendix D. Matrices of the similarities of Sis and Tis for each patient

Figure A3. Matrices of the similarities of Tis for patients 1-4
Preprints 88084 g0a3
Figure A4. Matrices of the similarities of Tis for patients 5-8
Preprints 88084 g0a4
Figure A5. Matrices of the similarities of Tis for patients 9-11
Preprints 88084 g0a5
Figure A6. Matrices of the similarities of Sis for patients 1-4
Preprints 88084 g0a6
Figure A7. Matrices of the similarities of Sis for patients 5-8
Preprints 88084 g0a7
Figure A8. Matrices of the similarities of Sis for patients 9-11
Preprints 88084 g0a8

Appendix E. Correlation matrices of Tis and Sis at the level of the group of patients

Table A2. Spearman correlations between Tis at the level of the group of patients
T1 T2 T3 T4 T5 T6 T7 T8 T9 T10 T11 T12 T13 T14 T15 T16 T17 T18 T19 T20 T21 T22 T23 T24 T25 T26
T1 1,000
T2 1,000 1,000
T3 0,857 0,857 1,000
T4 −0,464 −0,464 −0,107 1,000
T5 0,214 0,214 0,571 0,607 1,000
T6 −0,464 −0,464 −0,107 1,000 0,607 1,000
T7 1,000 1,000 0,857 −0,464 0,214 −0,464 1,000
T8 1,000 1,000 0,857 −0,464 0,214 −0,464 1,000 1,000
T9 0,821 0,821 0,536 −0,821 −0,321 −0,821 0,821 0,821 1,000
T10 0,857 0,857 1,000 −0,107 0,571 −0,107 0,857 0,857 0,536 1,000
T11 1,000 1,000 0,857 −0,464 0,214 −0,464 1,000 1,000 0,821 0,857 1,000
T12 0,821 0,821 0,536 −0,821 −0,321 −0,821 0,821 0,821 1,000 0,536 0,821 1,000
T13 0,750 0,750 0,964 0,107 0,643 0,107 0,750 0,750 0,357 0,964 0,750 0,357 1,000
T14 0,714 0,714 0,929 0,143 0,714 0,143 0,714 0,714 0,286 0,929 0,714 0,286 0,964 1,000
T15 0,214 0,214 0,571 0,607 1,000 0,607 0,214 0,214 −0,321 0,571 0,214 −0,321 0,643 0,714 1,000
T16 1,000 1,000 0,857 −0,464 0,214 −0,464 1,000 1,000 0,821 0,857 1,000 0,821 0,750 0,714 0,214 1,000
T17 0,857 0,857 1,000 −0,107 0,571 −0,107 0,857 0,857 0,536 1,000 0,857 0,536 0,964 0,929 0,571 0,857 1,000
T18 −0,464 −0,464 −0,107 1,000 0,607 1,000 −0,464 −0,464 −0,821 −0,107 −0,464 −0,821 0,107 0,143 0,607 −0,464 −0,107 1,000
T19 0,536 0,536 0,750 0,429 0,893 0,429 0,536 0,536 −0,036 0,750 0,536 −0,036 0,821 0,857 0,893 0,536 0,750 0,429 1,000
T20 −0,464 −0,464 −0,107 1,000 0,607 1,000 −0,464 −0,464 −0,821 −0,107 −0,464 −0,821 0,107 0,143 0,607 −0,464 −0,107 1,000 0,354 1,000
T21 1,000 1,000 0,857 −0,464 0,214 −0,464 1,000 1,000 0,821 0,857 1,000 0,821 0,750 0,714 0,214 1,000 0,857 −0,464 0,236 0,302 1,000
T22 −0,286 −0,286 0,143 0,893 0,857 0,893 −0,286 −0,286 −0,714 0,143 −0,286 −0,714 0,286 0,357 0,857 −0,286 0,143 0,893 0,167 0,012 0,556 1,000
T23 0,964 0,964 0,750 −0,607 0,000 −0,607 0,964 0,964 0,929 0,750 0,964 0,929 0,607 0,536 0,000 0,964 0,750 −0,607 0,498 0,167 0,003 0,302 1,000
T24 0,964 0,964 0,750 −0,607 0,000 −0,607 0,964 0,964 0,929 0,750 0,964 0,929 0,607 0,536 0,000 0,964 0,750 −0,607 0,498 0,167 0,003 0,302 0,000 1,000
T25 0,893 0,893 0,679 −0,714 −0,179 −0,714 0,893 0,893 0,964 0,679 0,893 0,964 0,536 0,429 −0,179 0,893 0,679 −0,714 0,783 0,088 0,012 0,167 0,003 0,003 1,000
T26 0,214 0,214 0,571 0,607 1,000 0,607 0,214 0,214 −0,321 0,571 0,214 −0,321 0,643 0,714 1,000 0,214 0,571 0,607 0,012 0,167 0,662 0,024 1,000 1,000 0,713 1,000
Table A3. p-values for Spearman correlations between Tis at the level of the group of patients
T1 T2 T3 T4 T5 T6 T7 T8 T9 T10 T11 T12 T13 T14 T15 T16 T17 T18 T19 T20 T21 T22 T23 T24 T25 T26
T1 1,000
T2 0,000 1,000
T3 0,024 0,024 1,000
T4 0,302 0,302 0,840 1,000
T5 0,662 0,662 0,200 0,167 1,000
T6 0,302 0,302 0,840 0,000 0,167 1,000
T7 0,000 0,000 0,024 0,302 0,662 0,302 1,000
T8 0,000 0,000 0,024 0,302 0,662 0,302 0,000 1,000
T9 0,034 0,034 0,236 0,034 0,498 0,034 0,034 0,034 1,000
T10 0,024 0,024 0,000 0,840 0,200 0,840 0,024 0,024 0,236 1,000
T11 0,000 0,000 0,024 0,302 0,662 0,302 0,000 0,000 0,034 0,024 1,000
T12 0,034 0,034 0,236 0,034 0,498 0,034 0,034 0,034 0,000 0,236 0,034 1,000
T13 0,066 0,066 0,003 0,840 0,139 0,840 0,066 0,066 0,444 0,003 0,066 0,444 1,000
T14 0,088 0,088 0,007 0,783 0,088 0,783 0,088 0,088 0,556 0,007 0,088 0,556 0,003 1,000
T15 0,662 0,662 0,200 0,167 0,000 0,167 0,662 0,662 0,498 0,200 0,662 0,498 0,139 0,088 1,000
T16 0,000 0,000 0,024 0,302 0,662 0,302 0,000 0,000 0,034 0,024 0,000 0,034 0,066 0,088 0,662 1,000
T17 0,024 0,024 0,000 0,840 0,200 0,840 0,024 0,024 0,236 0,000 0,024 0,236 0,003 0,007 0,200 0,024 1,000
T18 0,302 0,302 0,840 0,000 0,167 0,000 0,302 0,302 0,034 0,840 0,302 0,034 0,840 0,783 0,167 0,302 0,840 1,000
T19 0,236 0,236 0,066 0,354 0,012 0,354 0,236 0,236 0,963 0,066 0,236 0,963 0,034 0,024 0,012 0,236 0,066 0,354 1,000
T20 0,302 0,302 0,840 0,000 0,167 0,000 0,302 0,302 0,034 0,840 0,302 0,034 0,840 0,783 0,167 0,302 0,840 0,000 0,354 1,0000
T21 0,000 0,000 0,024 0,302 0,662 0,302 0,000 0,000 0,034 0,024 0,000 0,034 0,066 0,088 0,662 0,000 0,024 0,302 0,236 0,3024 1,0000
T22 0,556 0,556 0,783 0,012 0,024 0,012 0,556 0,556 0,088 0,783 0,556 0,088 0,556 0,444 0,024 0,556 0,783 0,012 0,167 0,0123 0,5560 1,0000
T23 0,003 0,003 0,066 0,167 1,000 0,167 0,003 0,003 0,007 0,066 0,003 0,007 0,167 0,236 1,000 0,003 0,066 0,167 0,498 0,1667 0,0028 0,3024 1,0000
T24 0,003 0,003 0,066 0,167 1,000 0,167 0,003 0,003 0,007 0,066 0,003 0,007 0,167 0,236 1,000 0,003 0,066 0,167 0,498 0,1667 0,0028 0,3024 0,0004 1,0000
T25 0,012 0,012 0,110 0,088 0,713 0,088 0,012 0,012 0,003 0,110 0,012 0,003 0,236 0,354 0,713 0,012 0,110 0,088 0,783 T25 0,0881 0,0123 0,1667 0,0028 0,0028 1,0000
T26 0,662 0,662 0,200 0,167 0,000 0,167 0,662 0,662 0,498 0,200 0,662 0,498 0,139 0,088 0,000 0,662 0,200 0,167 0,012 0,1667 0,6615 0,0238 1,0000 1,0000 0,7131 1,0000
Table A4. Spearman correlations between Sis at the level of the group of patients
S1 S2 S3 S4 S5 S6 S7
S1 1,0000
S2 0,6376 1,0000
S3 0,8462 0,9323 1,0000
S4 0,6109 0,9979 0,9193 1,0000
S5 0,0462 0,7169 0,4995 0,7422 1,0000
S6 0,9774 0,7258 0,9029 0,7046 0,1768 1,0000
S7 0,9521 0,4926 0,7101 0,4653 -0,1091 0,8879 1,0000
Table A5. p-values for Spearman correlations between Sis at the level of the group of patients
S1 S2 S3 S4 S5 S6 S7
S1 1,0000
S2 0,0006 1,0000
S3 0,0000 0,0000 1,0000
S4 0,0012 0,0000 0,0000 1,0000
S5 0,8228 0,0001 0,0102 0,0000 1,0000
S6 0,0000 0,0000 0,0000 0,0001 0,3860 1,0000
S7 0,0000 0,0114 0,0001 0,0176 0,5945 0,0000 1,0000

Appendix F. Representations of Tis in the semantic space {S6,S2,S5}

Table A6. Representations of Tis in the semantic space {S6,S2,S5}
T1 T2 T3 T4 T5 T6 T7 T8 T9 T10 T11 T12 T13 T14 T15 T16 T17 T18 T19 T20 T21 T22 T23 T24 T25 T26
S6 −8,3625 −4,4039 −9,5582 −1,4451 −1,7057 −1,6161 −1,8211 −4,3428 −0,5322 −0,8172 −1,9333 −1,0863 −2,8981 −3,9884 −5,5002 −3,4130 −4,1753 −7,0310 −3,6481 −1,3226 −1,1887 −0,5692 −1,7526 −1,3440 −2,7922 −0,3525
S2 −0,1345 1,1001 1,4353 1,7964 −0,5001 −0,5692 −0,4216 −2,4675 −0,3557 −0,4111 −1,2905 −0,8395 2,5456 −0,9374 0,3152 −0,4337 −1,1184 1,2536 −2,0403 −0,3103 0,7155 0,0633 2,2410 −0,7027 −2,4571 −0,1088
S5 0,5282 1,0377 0,8791 0,2221 −0,8491 −1,0912 −0,1856 0,5925 0,5494 0,1999 −0,3048 0,7635 0,1128 −0,4915 −0,5370 −0,3456 −0,8586 −1,2938 −0,8828 −1,8451 −0,6049 −0,3456 0,7095 0,4013 2,1110 −0,2311

References

  1. Organization, W.H.; et al. The ICD-10 classification of mental and behavioural disorders: clinical descriptions and diagnostic guidelines; World Health Organization, 1992.
  2. Uher, R.; Payne, J.L.; Pavlova, B.; Perlis, R.H. Major depressive disorder in DSM-5: Implications for clinical practice and research of changes from DSM-IV. Depression and anxiety 2014, 31, 459–471. [Google Scholar] [CrossRef] [PubMed]
  3. Bains, N.; Abdijadid, S. Major depressive disorder. In StatPearls [Internet]; StatPearls Publishing, Treasure Island, FL, USA, 2020.
  4. Shorey, S.; Ng, E.D.; Wong, C.H. Global prevalence of depression and elevated depressive symptoms among adolescents: A systematic review and meta-analysis. British Journal of Clinical Psychology 2022, 61, 287–305. [Google Scholar] [CrossRef] [PubMed]
  5. Hu, T.; Zhao, X.; Wu, M.; Li, Z.; Luo, L.; Yang, C.; Yang, F. Prevalence of depression in older adults: A systematic review and meta-analysis. Psychiatry research, 1145. [Google Scholar]
  6. Papakostas, G.I.; Fava, M. Predictors, moderators, and mediators (correlates) of treatment outcome in major depressive disorder. Dialogues in Clinical Neuroscience 2022, 10(4), 439–451. [Google Scholar] [CrossRef] [PubMed]
  7. Kim, I.B.; Park, S.C. The entorhinal cortex and adult neurogenesis in major depression. International Journal of Molecular Sciences 2021, 22, 11725. [Google Scholar] [CrossRef] [PubMed]
  8. Beauregard, M.; Paquette, V.; Le, J.; et al. Dysfunction in the neural circuitry of emotional self-regulation in major depressive disorder. Neuroreport 2006, 17, 843–846. [Google Scholar] [CrossRef] [PubMed]
  9. Ressler, K.J.; Mayberg, H.S. Targeting abnormal neural circuits in mood and anxiety disorders: from the laboratory to the clinic. Nature neuroscience 2007, 10, 1116–1124. [Google Scholar] [CrossRef] [PubMed]
  10. Drevets, W.C.; Videen, T.O.; Price, J.L.; Preskorn, S.H.; Carmichael, S.T.; Raichle, M.E. A functional anatomical study of unipolar depression. Journal of Neuroscience 1992, 12, 3628–3641. [Google Scholar] [CrossRef]
  11. Goldapple, K.; Segal, Z.; Garson, C.; Lau, M.; Bieling, P.; Kennedy, S.; Mayberg, H. Modulation of cortical-limbic pathways in major depression: treatment-specific effects of cognitive behavior therapy. Archives of general psychiatry 2004, 61, 34–41. [Google Scholar] [CrossRef]
  12. Jiang, Y.; Zou, D.; Li, Y.; Gu, S.; Dong, J.; Ma, X.; Xu, S.; Wang, F.; Huang, J.H. Monoamine neurotransmitters control basic emotions and affect major depressive disorders. Pharmaceuticals 2022, 15, 1203. [Google Scholar] [CrossRef]
  13. Truong, V.; Cheng, P.Z.; Lee, H.C.; Lane, T.J.; Hsu, T.Y.; Duncan, N.W. Occipital gamma-aminobutyric acid and glutamate-glutamine alterations in major depressive disorder: An mrs study and meta-analysis. Psychiatry Research: Neuroimaging 2021, 308, 111238. [Google Scholar] [CrossRef]
  14. Rottenberg, J. Mood and emotion in major depression. Current Directions in Psychological Science 2005, 14, 167–170. [Google Scholar] [CrossRef]
  15. Diedrich, A.; Grant, M.; Hofmann, S.G.; Hiller, W.; Berking, M. Self-compassion as an emotion regulation strategy in major depressive disorder. Behaviour research and therapy 2014, 58, 43–51. [Google Scholar] [CrossRef] [PubMed]
  16. Beblo, T.; Fernando, S.; Klocke, S.; Griepenstroh, J.; Aschenbrenner, S.; Driessen, M. Increased suppression of negative and positive emotions in major depression. Journal of affective disorders 2012, 141, 474–479. [Google Scholar] [CrossRef]
  17. Erk, S.; Mikschl, A.; Stier, S.; Ciaramidaro, A.; Gapp, V.; Weber, B.; Walter, H. Acute and sustained effects of cognitive emotion regulation in major depression. Journal of Neuroscience 2010, 30, 15726–15734. [Google Scholar] [CrossRef] [PubMed]
  18. Thaipisuttikul, P.; Ittasakul, P.; Waleeprakhon, P.; Wisajun, P.; Jullagate, S. Psychiatric comorbidities in patients with major depressive disorder. Neuropsychiatric disease and treatment, 2097. [Google Scholar]
  19. Jeronimus, B.F. , Chapter 7; Kunnen, E.S., de Ruiter, N.M.P., Jeronimus, B.F., van der Gaag, M.A.; Rutledge Psychology: London, UK, 2019; pp. 1–32.depression. In Psychosocial development in adolescence. Insights from the dynamic system approach, Chapter 7; Kunnen, E.S., de Ruiter, N.M.P., Jeronimus, B.F., van der Gaag, M.A., Eds.; Rutledge Psychology: London, UK, 2019; Rutledge Psychology: London, UK, 2019; pp. 1–32. [Google Scholar]
  20. Tiller, J.W. Depression and anxiety. The Medical Journal of Australia 2013, 199, S28–S31. [Google Scholar] [CrossRef] [PubMed]
  21. Hammen, C. Stress and depression. Annu. Rev. Clin. Psychol. 2005, 1, 293–319. [Google Scholar] [CrossRef] [PubMed]
  22. Osler, L. “An illness of isolation, a disease of disconnection”: Depression and the erosion of we-experiences. Frontiers in Psychology 2022, 13, 928186. [Google Scholar] [CrossRef] [PubMed]
  23. Hutten, E.; Jongen, E.M.; Hajema, K.; Ruiter, R.A.; Hamers, F.; Bos, A.E. Risk factors of loneliness across the life span. Journal of Social and Personal Relationships 2022, 39, 1482–1507. [Google Scholar] [CrossRef]
  24. Groen, R.N.; Ryan, O.; Wigman, J.T.; Riese, H.; Penninx, B.W.; Giltay, E.J.; Wichers, M.; Hartman, C.A. Comorbidity between depression and anxiety: assessing the role of bridge mental states in dynamic psychological networks. BMC medicine 2020, 18, 1–17. [Google Scholar] [CrossRef]
  25. Cox, W.T.; Abramson, L.Y.; Devine, P.G.; Hollon, S.D. Stereotypes, prejudice, and depression: The integrated perspective. Perspectives on Psychological Science 2012, 7, 427–449. [Google Scholar] [CrossRef]
  26. Ross, S.; Agrawal, M.; Griffiths, R.; Grob, C.; Berger, A.; Henningfield, J. Psychedelic-assisted psychotherapy to treat psychiatric and existential distress in life-threatening medical illnesses and palliative care. Neuropharmacology, 1091. [Google Scholar]
  27. Franco, S.; Hoertel, N.; Peyre, H.; Rodríguez-Fernández, J.M.; Limosin, F.; Blanco, C. Age at onset of major depression and adulthood cardiovascular risk. Psychiatry research 2015, 225, 736–738. [Google Scholar] [CrossRef] [PubMed]
  28. Karel, M.J. Aging and depression: Vulnerability and stress across adulthood. Clinical Psychology Review 1997, 17, 847–879. [Google Scholar] [CrossRef] [PubMed]
  29. Matthews, T.; Danese, A.; Wertz, J.; Odgers, C.L.; Ambler, A.; Moffitt, T.E.; Arseneault, L. Social isolation, loneliness and depression in young adulthood: a behavioural genetic analysis. Social psychiatry and psychiatric epidemiology 2016, 51, 339–348. [Google Scholar] [CrossRef] [PubMed]
  30. National Academies of Sciences, E. ; Medicine.; et al. Social isolation and loneliness in older adults: Opportunities for the health care system, 2020. [Google Scholar]
  31. Bernet, C.Z.; Stein, M.B. Relationship of childhood maltreatment to the onset and course of major depression in adulthood. Depression and anxiety 1999, 9, 169–174. [Google Scholar] [CrossRef]
  32. Reinherz, H.Z.; Giaconia, R.M.; Hauf, A.M.C.; Wasserman, M.S.; Silverman, A.B. Major depression in the transition to adulthood: risks and impairments. Journal of abnormal psychology 1999, 108, 500–510. [Google Scholar] [CrossRef] [PubMed]
  33. Hammen, C.L.; Bistricky, S.L.; Ingram, R.E. Vulnerability to depression in adulthood. Guilford Press, New-York, NY, 10012, USA, 2010.
  34. Brière, F.N.; Rohde, P.; Seeley, J.R.; Klein, D.; Lewinsohn, P.M. Comorbidity between major depression and alcohol use disorder from adolescence to adulthood. Comprehensive psychiatry 2014, 55, 526–533. [Google Scholar] [CrossRef] [PubMed]
  35. Dumais, S.T. Latent semantic analysis. Annual Review of Information Science and Technology (ARIST) 2004, 38, 189–230. [Google Scholar] [CrossRef]
  36. Patel, S.; Bhatt, N.; Shah, C. Query expansion for effective retrieval from microblog. In Proceedings of the 2017 International Conference on Computing Methodologies and Communication (ICCMC). IEEE; 2017; pp. 394–397. [Google Scholar] [CrossRef]
  37. Rosado-Solomon, E.H.; Koopmann, J.; Lee, W.; Cronin, M.A. Mental Health and Mental Illness in Organizations: A Review, Comparison, and Extension. Academy of Management Annals 2023, 17, 751–797. [Google Scholar] [CrossRef]
  38. Thomsen, D.K.; Holm, T.; Jensen, R.; Lind, M.; Pedersen, A.M. Storying mental illness and personal recovery; Cambridge University Press, New York, NY, 10006, USA, 2023.
  39. Udupa, N.S.; Twenge, J.M.; McAllister, C.; Joiner, T.E. Increases in poor mental health, mental distress, and depression symptoms among US adults, 1993–2020. Journal of Mood and Anxiety Disorders 2023, 2, 100013. [Google Scholar] [CrossRef]
  40. Mizrahi Lakan, S.; Millgram, Y.; Tamir, M. Desired sadness, happiness, fear and calmness in depression: The potential roles of valence and arousal. Emotion 2023, 23, 1130. [Google Scholar] [CrossRef]
  41. Carricarte Naranjo, C.; Sánchez Luaces, C.; Pedroso Ibáñez, I.; Machado, A.; Sahli, H.; Bobes, M.A. Beyond shallow feelings of complex affect: Non-motor correlates of subjective emotional experience in Parkinson’s disease. Plos one 2023, 18, e0281959. [Google Scholar] [CrossRef] [PubMed]
  42. Mahmoudpour, A.; Ferdousi Kejani, K.; Karami, M.; Toosi, M.; Ahmadboukani, S. Cognitive flexibility and emotional self-regulation of the elderly with Empty nest syndrome: Benefits of acceptance and commitment therapy. Health Science Reports 2023, 6, e1397. [Google Scholar] [CrossRef] [PubMed]
  43. Pedersen, A.M.; Straarup, K.N.; Thomsen, D.K. “My life disappeared in illness”: bipolar disorder and themes in narrative identity. Memory 2022, 30, 857–868. [Google Scholar] [CrossRef] [PubMed]
  44. Grohé, J.; Gellert, P.; Kessler, E.M. Experiences of Home-living Vulnerable Older Adults with Clinical Depression during the COVID-19 Pandemic: A Qualitative Study. Clinical Gerontologist.
  45. Mouchet-Mages, S.; Baylé, F.J. Sadness as an integral part of depression. Dialogues in clinical neuroscience.
  46. Garvey, M.; Cook, B.; Noyes Jr, R. Comparison of major depressive patients with a predominantly sad versus anxious mood. Journal of affective disorders 1989, 17, 183–187. [Google Scholar] [CrossRef]
  47. Paykel, E.S. Basic concepts of depression. Dialogues in clinical neuroscience 2022, 10(3), 279–289. [Google Scholar] [CrossRef]
  48. COOL4ed.calstate.edu. Available online: https://dspace.calstate.edu/bitstream/handle/10211.3/206402/LINEAR ALGEBRA.pdf?sequence=1 (accessed on 09/04/2023).
  49. Orthogonal matrices and the singular value decomposition. Available online: https://courses.cs.duke.edu/fall13/cps274/notes/svd.pdf (accessed on 09/04/2023).
  50. cs.ait.ac.th. Available online: https://www.cs.ait.ac.th/ mdailey/cvreadings/Tomasi-Mathematical.pdf (accessed on 13/04/2023).
  51. Yan, D.; Wu, T.; Liu, Y.; Gao, Y. An efficient sparse-dense matrix multiplication on a multicore system. In Proceedings of the 2017 IEEE 17th International Conference on Communication Technology (ICCT). IEEE; 2017; pp. 1880–1883. [Google Scholar]
  52. Strang, G. Linear algebra and its applications.; Thomson, Brooks/Cole, Belmont, CA, USA, 2006.
  53. bluebox.creighton.edu. Available online: https://bluebox.creighton.edu/demo/modules/en-saylor/content/www.saylor.org/site/wp-content/uploads/2012/02/linear-algebra-kuttler-1-30-11-otc.pdf (accessed on 09/04/2023).
Disclaimer/Publisher’s Note: The statements, opinions and data contained in all publications are solely those of the individual author(s) and contributor(s) and not of MDPI and/or the editor(s). MDPI and/or the editor(s) disclaim responsibility for any injury to people or property resulting from any ideas, methods, instructions or products referred to in the content.
Copyright: This open access article is published under a Creative Commons CC BY 4.0 license, which permit the free download, distribution, and reuse, provided that the author and preprint are cited in any reuse.
Prerpints.org logo

Preprints.org is a free preprint server supported by MDPI in Basel, Switzerland.

Subscribe

© 2024 MDPI (Basel, Switzerland) unless otherwise stated