1. Introduction
The Middle Jurassic carbonates are extensively distributed worldwide and contain significant commercial hydrocarbon resources. It is estimated that approximately 60% of the global oil reserves and 40% of its gas reserves are held in carbonate deposits, with the Middle East holding 70% of oil and 90% of gas reserves in carbonate formations [
1,
2]. Similarly, Pakistan has considerable potential in carbonate deposits in the Indus Basin and Baluchistan Basin [
3]. However, carbonates are challenging in petroleum exploration and production due to their complex reservoir heterogeneity, diagenesis, and post-depositional environment factors [
4,
5]. Understanding these factors is crucial for assessing the reservoir potential. The reservoir quality of carbonates is influenced by initial depositional features and subsequent diagenetic modifications [
6,
7]. The depositional environment influencing formation characteristics, and diagenesis affecting reservoir quality through post-depositional processes [
8,
9]. Numerous physio-chemical and biological changes during rock development alter micro-pore structure, leading to complex reservoir heterogeneity [
10,
11]. The fundamental factors influencing carbonate reservoir quality include mineralogy, rock textures, and depositional settings, all of which outline the digenetic alterations that occur. The main diagenetic processes that affecting carbonate reservoir quality encompasses include dolomitization, micritization, dissolution, compaction, cementation, and fracturing [12-14]. These processes alter reservoir characteristics in response to periodic facies variations in marine carbonates due to changes in depositional environment [
15]. Therefore, a comprehensive understanding of these diagenetic and depositional factors is essential for effectively characterizing and developing carbonate reservoirs for hydrocarbon exploration and production.
Variations in petrophysical, pore-morphological, and mineralogical parameters within carbonate reservoirs are heavily influenced by a combination of factors, including the depositional environment, diagenetic processes, overburden stress, and tectonic activities. These factors collectively transform carbonate rocks into highly heterogeneous and challenging materials for their analysis, measurement, and interpretation [
16,
17]. Among these factors, overburden stress plays a particularly significant role in shaping pore morphology, pore geometry and over all petrophysical properties of the reservoir. In carbonate formations, the impact of pore sensitivity becomes even more pronounced when compared to clastic sand stones. This heightened sensitivity is due to their complex lithofacies and diagenetic processes, which tend to affect reservoir quality and recovery efficiency [
18,
19]. Stress sensitivity is often overlooked during reservoir characterization leading to severe complexities in interpretation, estimation, modeling and development. Measurements made under stress sensitivity are essential for accurately and effectively estimating reservoir parameters [
20].
The Chiltan limestone is recognized as a prolific hydrocarbon producing formation within the Indus Basin, ranging from late Triassic to Pleistocene ages and forming a marine carbonate sequence in the Mughal Kot area [
21,
22]. Since its initial discovery in 1959, the Chiltan formation has served as a gas producing reservoir for various exploration and production companies. The formation comprises a wide range of carbonate units, varying from thin to thick-bedded, and includes irregular coarse grained, bioclastic and intraclastic limestones, that all indicative of deposition in shallow to marginal marine environments. The presence of age-diagnostic species of macro-nano fossils in this succession contribute significantly to severe diagenetic impacts on its reservoir potential [
23,
24]. The complexity of the reservoir is associated with its variable lithological composition, mineral content, pore space, conductivity, facies, and textures. These factors collectively pose challenges in recovery and increase exploration risks [
25]. In the existing literature, there have been limited studies on the outcrop of the Chiltan Limestone, primarily focused on sedimentological and paleontological analyses. These studies aim to understand the diagenetic processes and depositional conditions of the formation, which can affects its reservoir quality [
1]. However, these outcrop-based investigations provide insufficient information for effective reservoir quality management. Therefore, a comprehensive reservoir characterization and analysis are necessary to understand the diagenetic impacts on reservoir quality and improve recovery efficiency.
In this study, the Chiltan carbonate core samples have been utilized for the first time to conduct an integrated reservoir characterization. The primary objective of this research is to examine the impacts of diagenesis, depositional environment and overburden stress on reservoir quality using various methods like thin section petrography, mineralogy assessment, plug porosity, and gas permeability measurements under various overburden stress conditions. The study serves to address the key issues and challenges related to carbonate reservoir measurement and interpretation resulting from diagenesis. Ultimately, this research could lead to lower the risks associate with reservoir management and contribute to improve the productivity of indigenous resources.
1.1. Geological Settings of Study Area
The Lower Indus Basin is divided into central and southern basins by the Sukkur Rift Zone. The research region is situated in the eastern portion of Jacobabad-Khairpur High in an NNE-SSW orientation. Geographically, the area is primarily comprised of rocks from the Mesozoic age succession, with thick Jurassic sequences with a few outcrops of Triassic occurrences [
26]. Despite the presence of shallow marine Eocene rocks; this region also exposes some of the oldest rocks, including those from the Triassic age (Wulgai formation) and Paleocene age (Dunghan Limestone). The Dunghan Limestone is deposited on the eastern side of the Jacobabad Khairpur High. Above the Cretaceous series, directly overlying the Middle Jurassic Chiltan formation, which showing well-known unconformity at the K-T boundary formed during collovian time throughout the Indus Basin [
27,
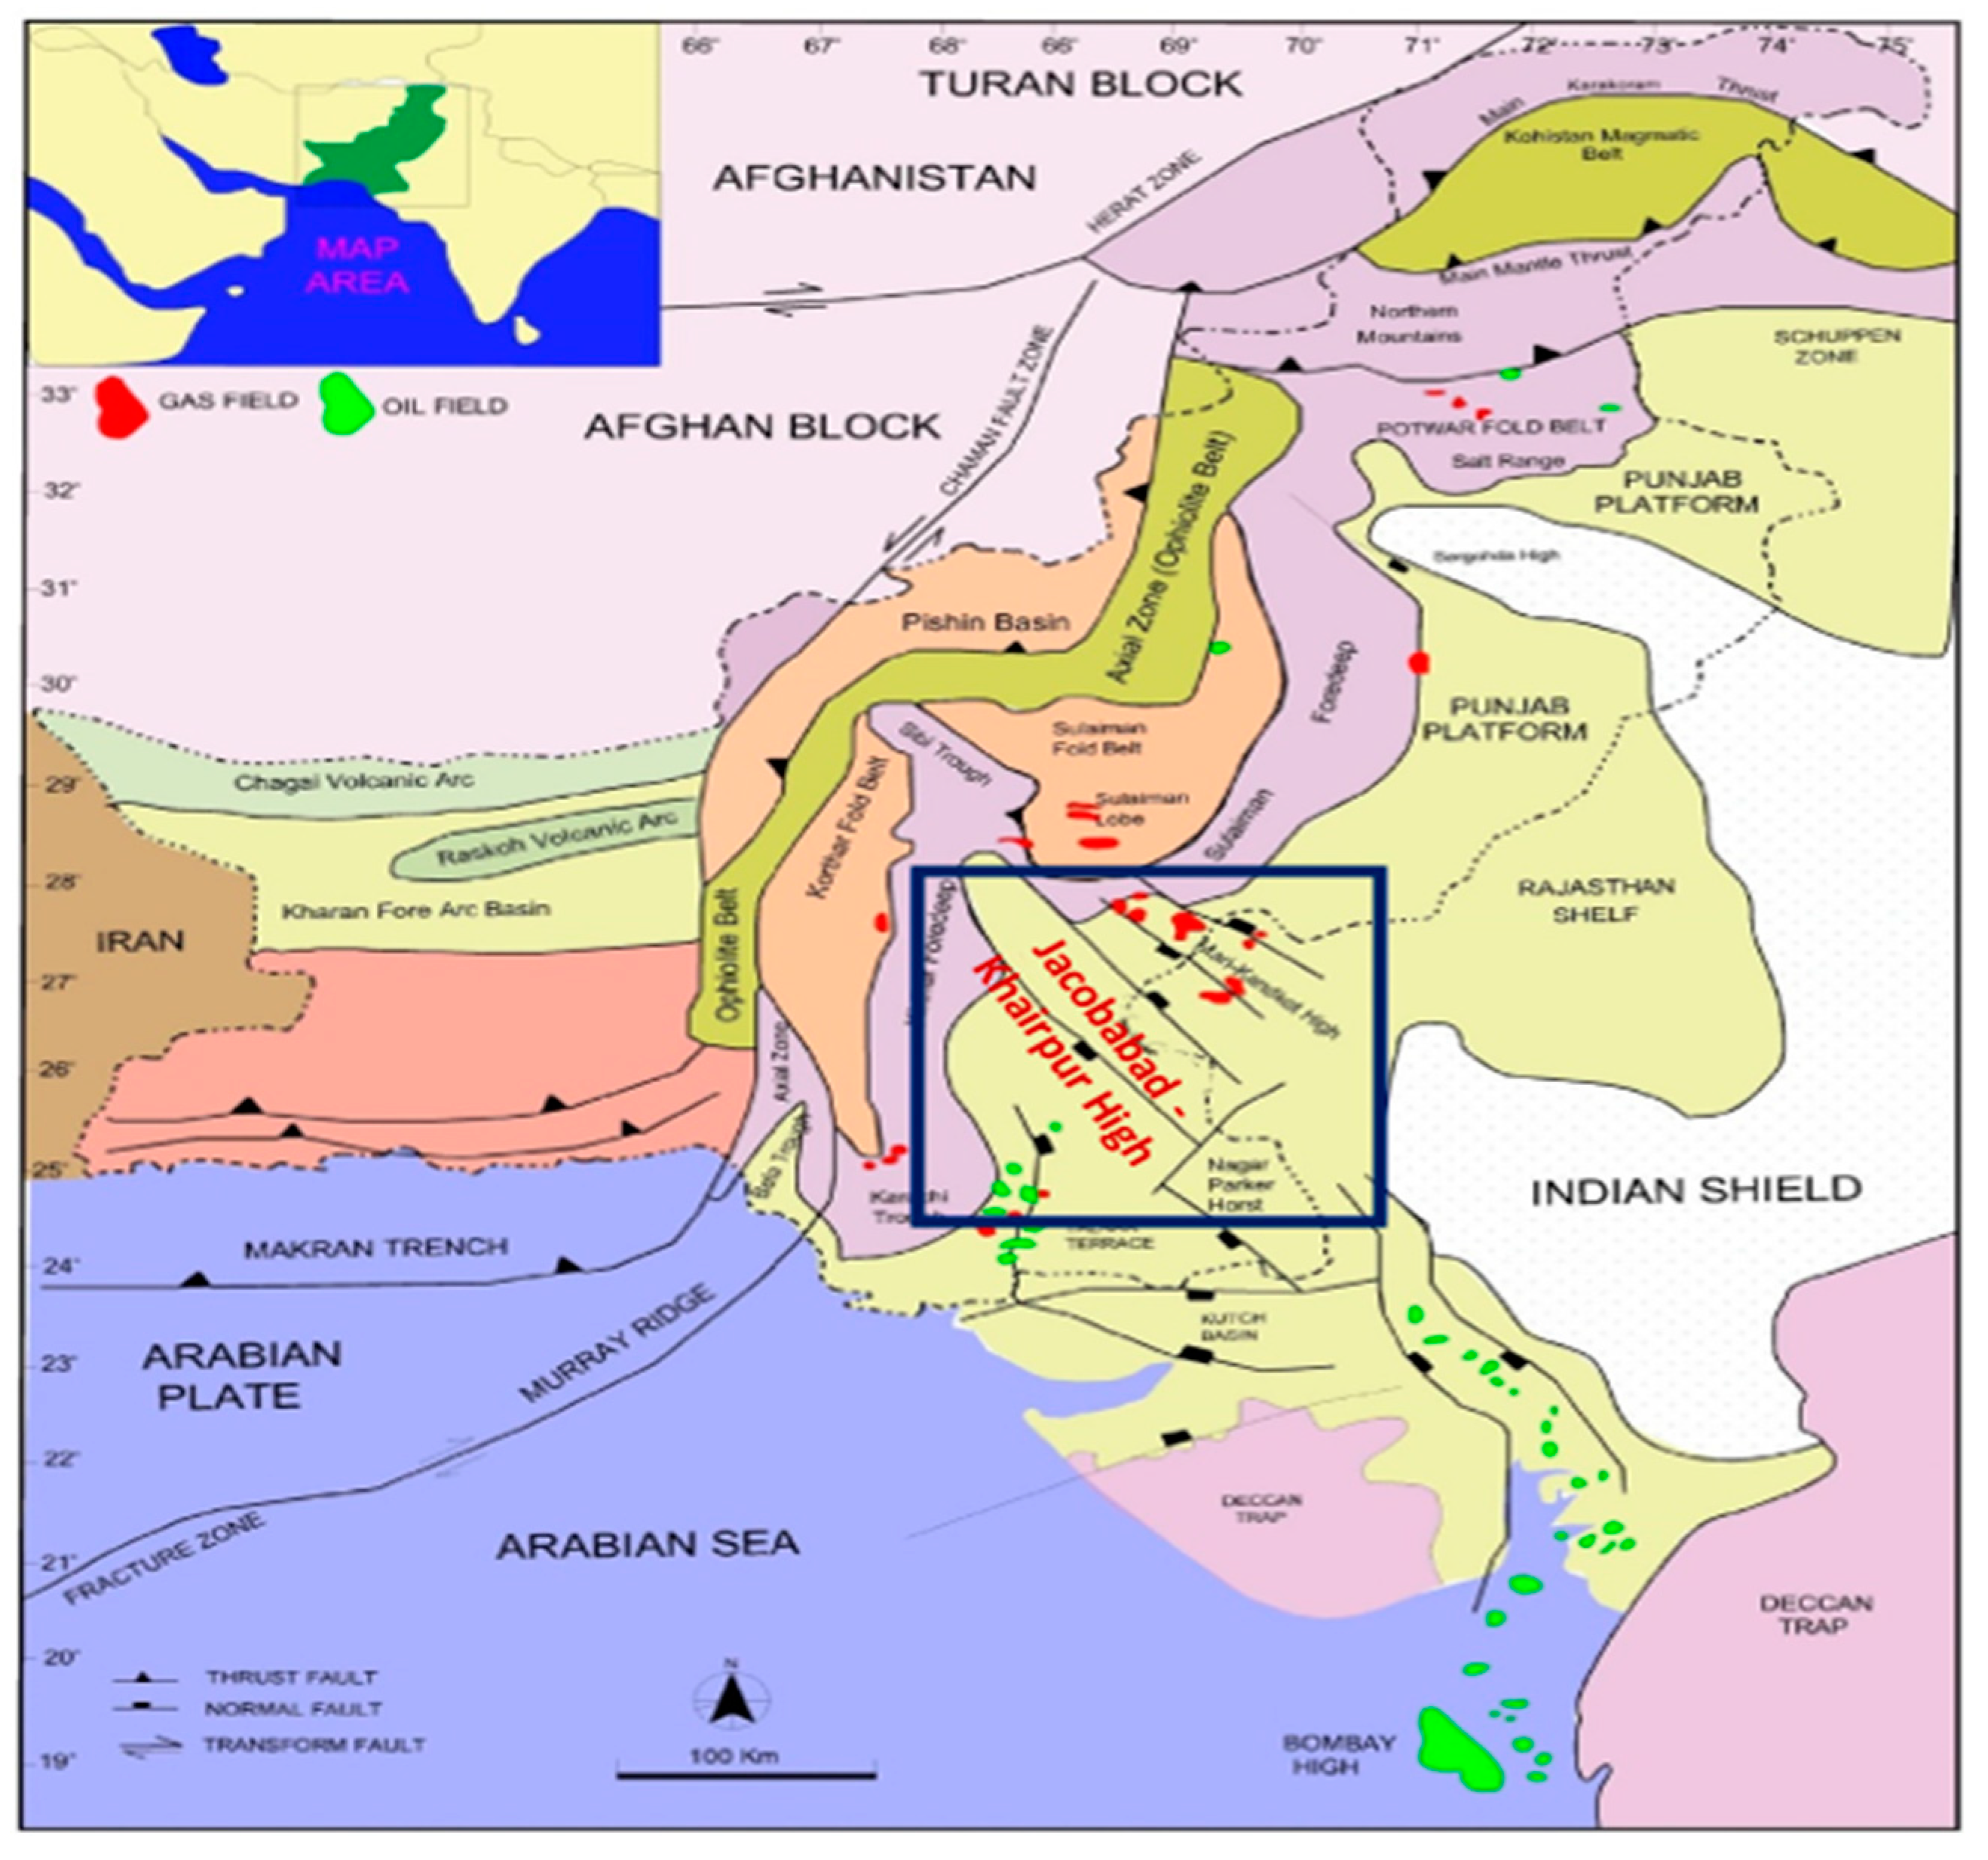
28]. Beyond the Cretaceous, the Paleocene Ranikot formation existed, and the sequence continued up to modern alluvium. According to data correlations and assumed thickness, the earlier Cretaceous and Middle Jurassic Chiltan formation are also present. The effects of collisional tectonics are limited to northern parts of Pakistan, with the Central Indus Basin largely unaffected. The surrounding regions underwent rifting during the Mesozoic succession, resulting in the formation of the Khairpur-Jacobabad High as depicted in
Figure 1. Interestingly, the carbonate platform environment remained stable despite tectonic activity, that effectively producing subaqueous islands [
29]. Chiltan Limestone is regarded as shelf carbonate sequence of Middle Jurassic age, characterized by thick layers of oolitic beds, including reefal development in the upper section. The Early Cretaceous interval includes pelagic Parh Limestone, Mughal Kot Formation and Pab sandstone followed by the Sembar shale, as well as Lower and Upper Goru sands in the lower part. The Eocene rocks overly the Paleocene sequence, while Oligocene Nari Formation sediments were deposited on top of the Eocene sequence. Additionally, the Siwaliks spread over the Indo-Pakistan Plate with unconformable contact [
30,
31]. The Chiltan Limestone and sands of Goru formations represent potential hydrocarbon resources in the region, with reservoirs ranging from shallow to deeper levels of Jurassic and Cretaceous age [
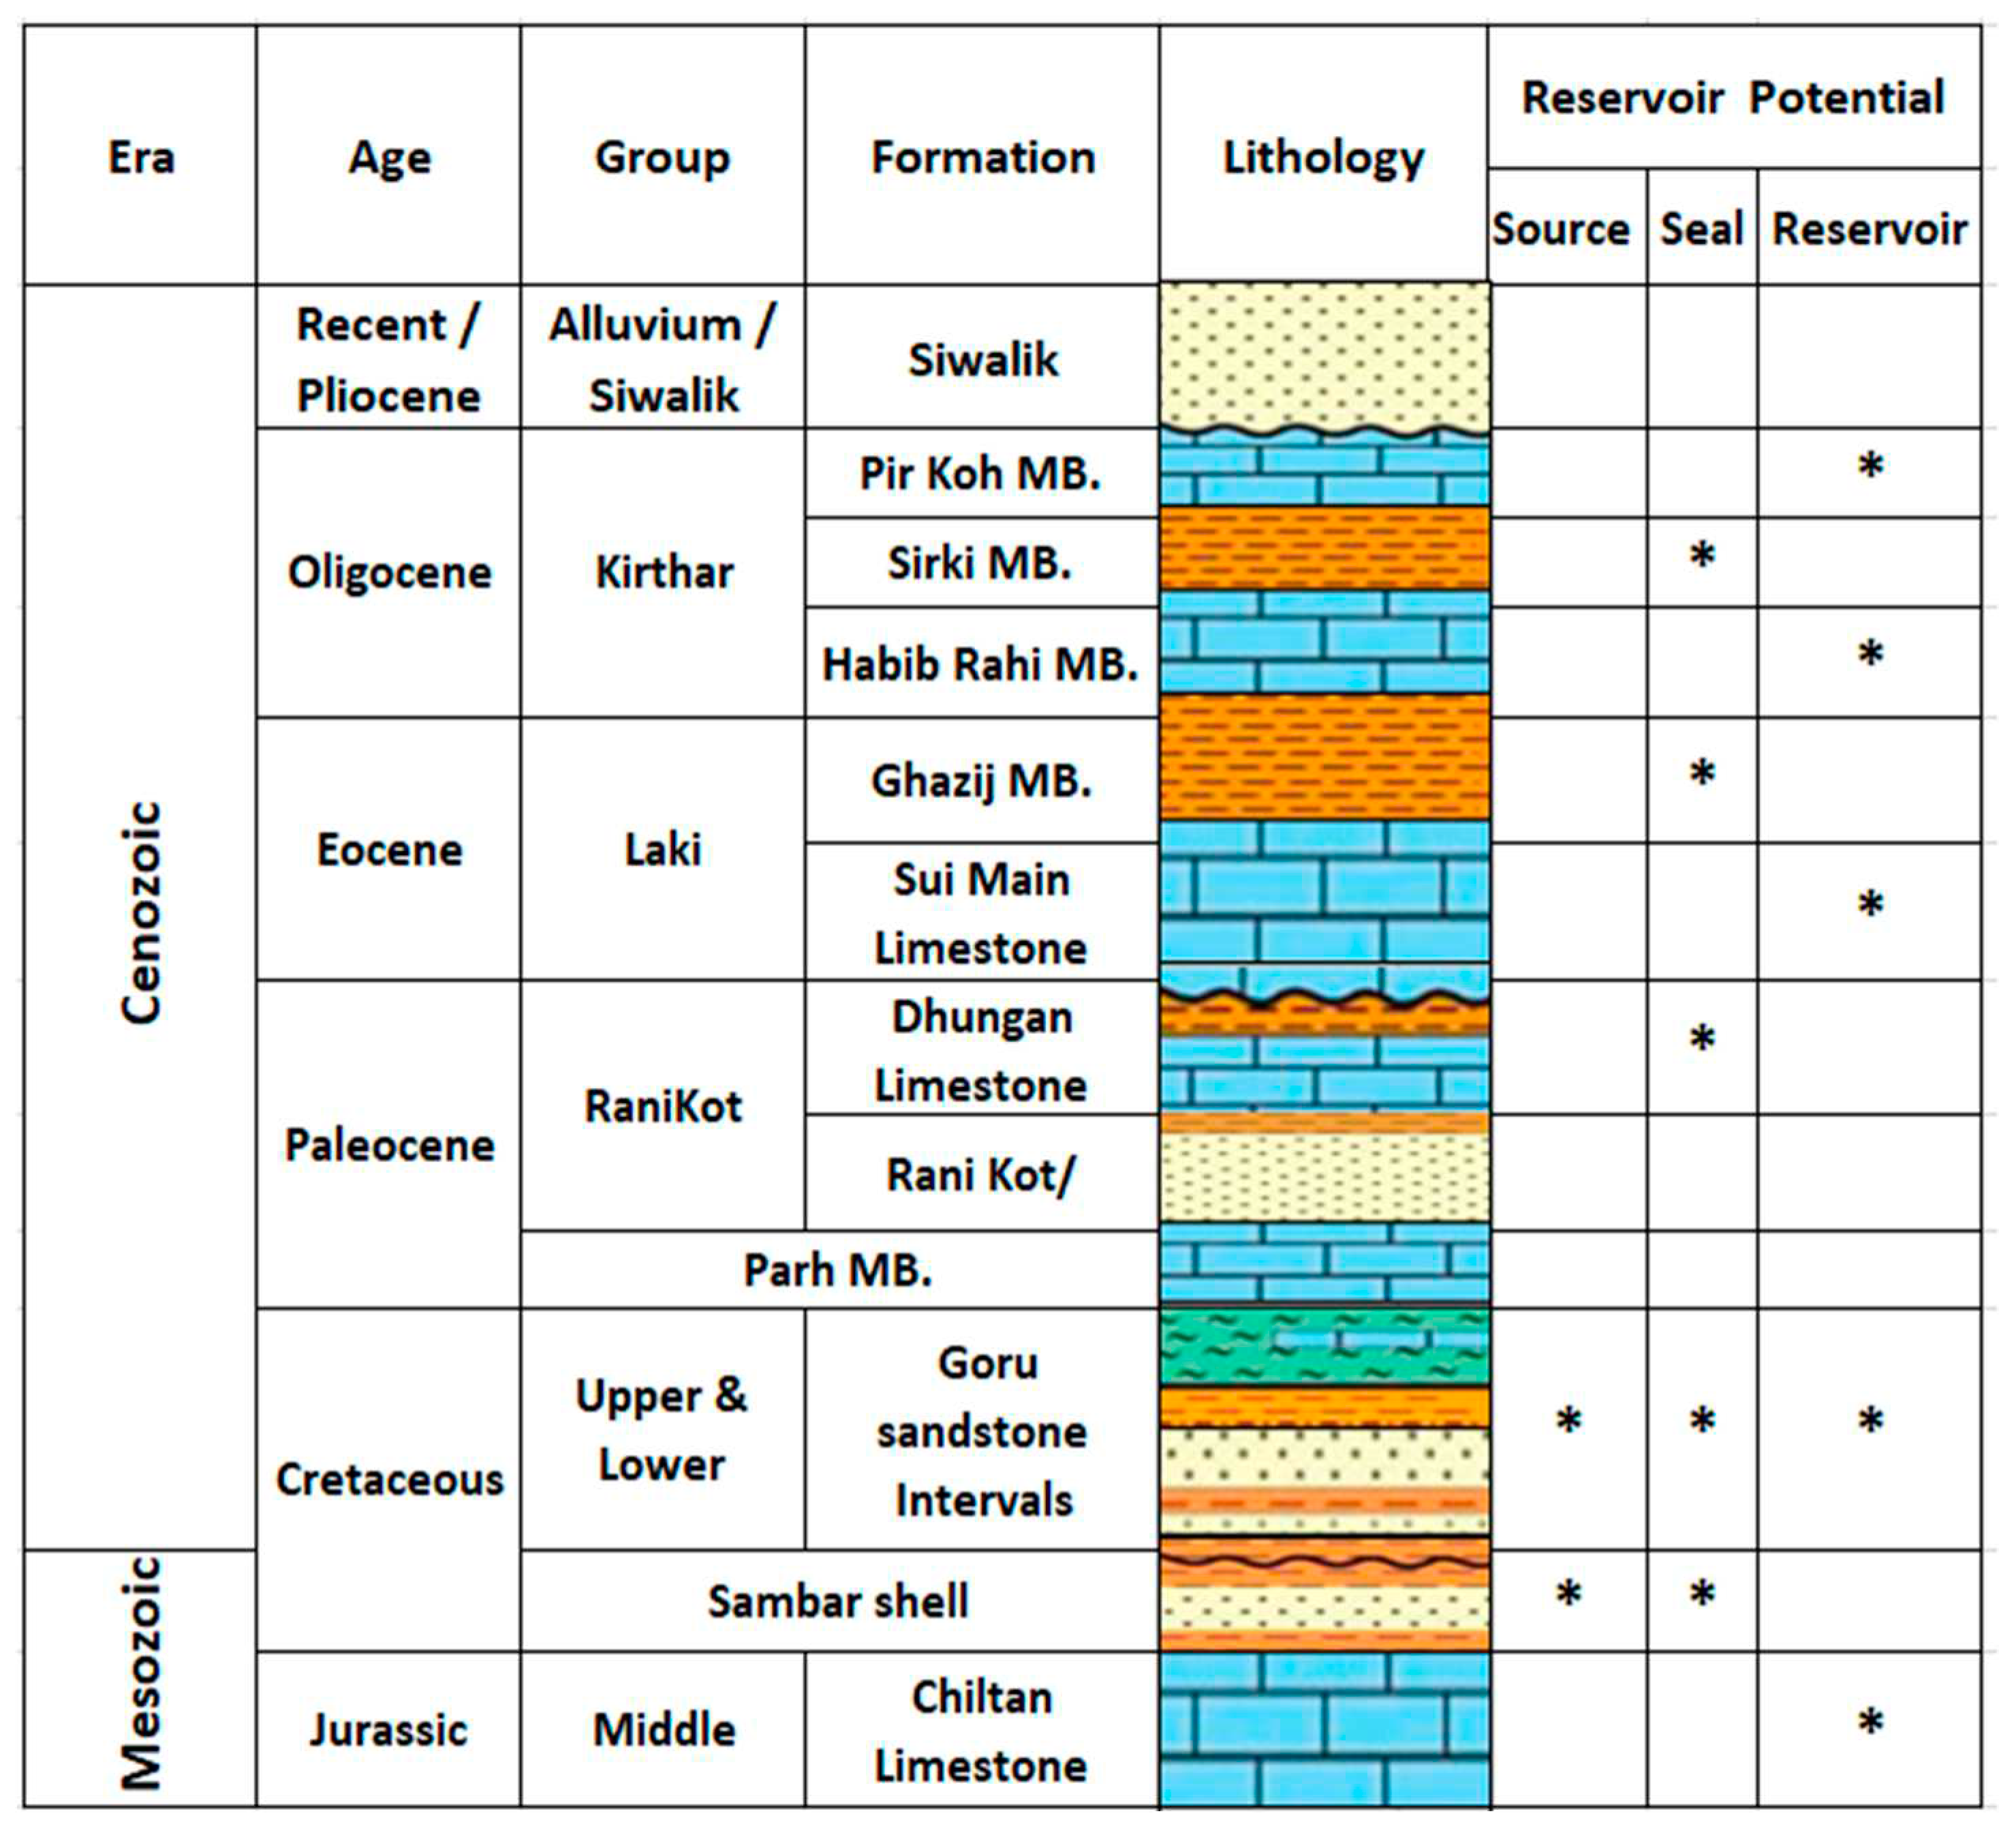
31]. The intraformational and overlying shales act as seals, with anticline traps in the existing stratigraphic play. According to borehole data from exploration and production (E&P) companies, the stratigraphic column of the Southern Indus Basin spans from Triassic to modern alluvium as depicted in
Figure 2.
2. Materials and Methods
2.1. Materials and Preparation of core samples
The long cylindrical reservoir cores from the Middle Jurassic Chiltan Limestone formation were collected from subsurface core database Petcorelab, Hydrocarbon Development Institute of Pakistan, (HDIP) Islamabad, Pakistan. The selected core samples were prepared through various core slabbing and core plugging procedures to create core plugs of the desired size. After labelling and tagging the samples, several core preparation techniques were employed for a comprehensive laboratory-scale investigation. The cylindrical core plugs, measuring 4.5cm in length and 2.5cm in diameter were prepared. A Standard procedure was followed to create 0.028mm polished, blue dyed stained thin sections and 3x3x2 mm cubical sample chips with carbon coatings for SEM-EDS analysis.
2.2. Characterization methods
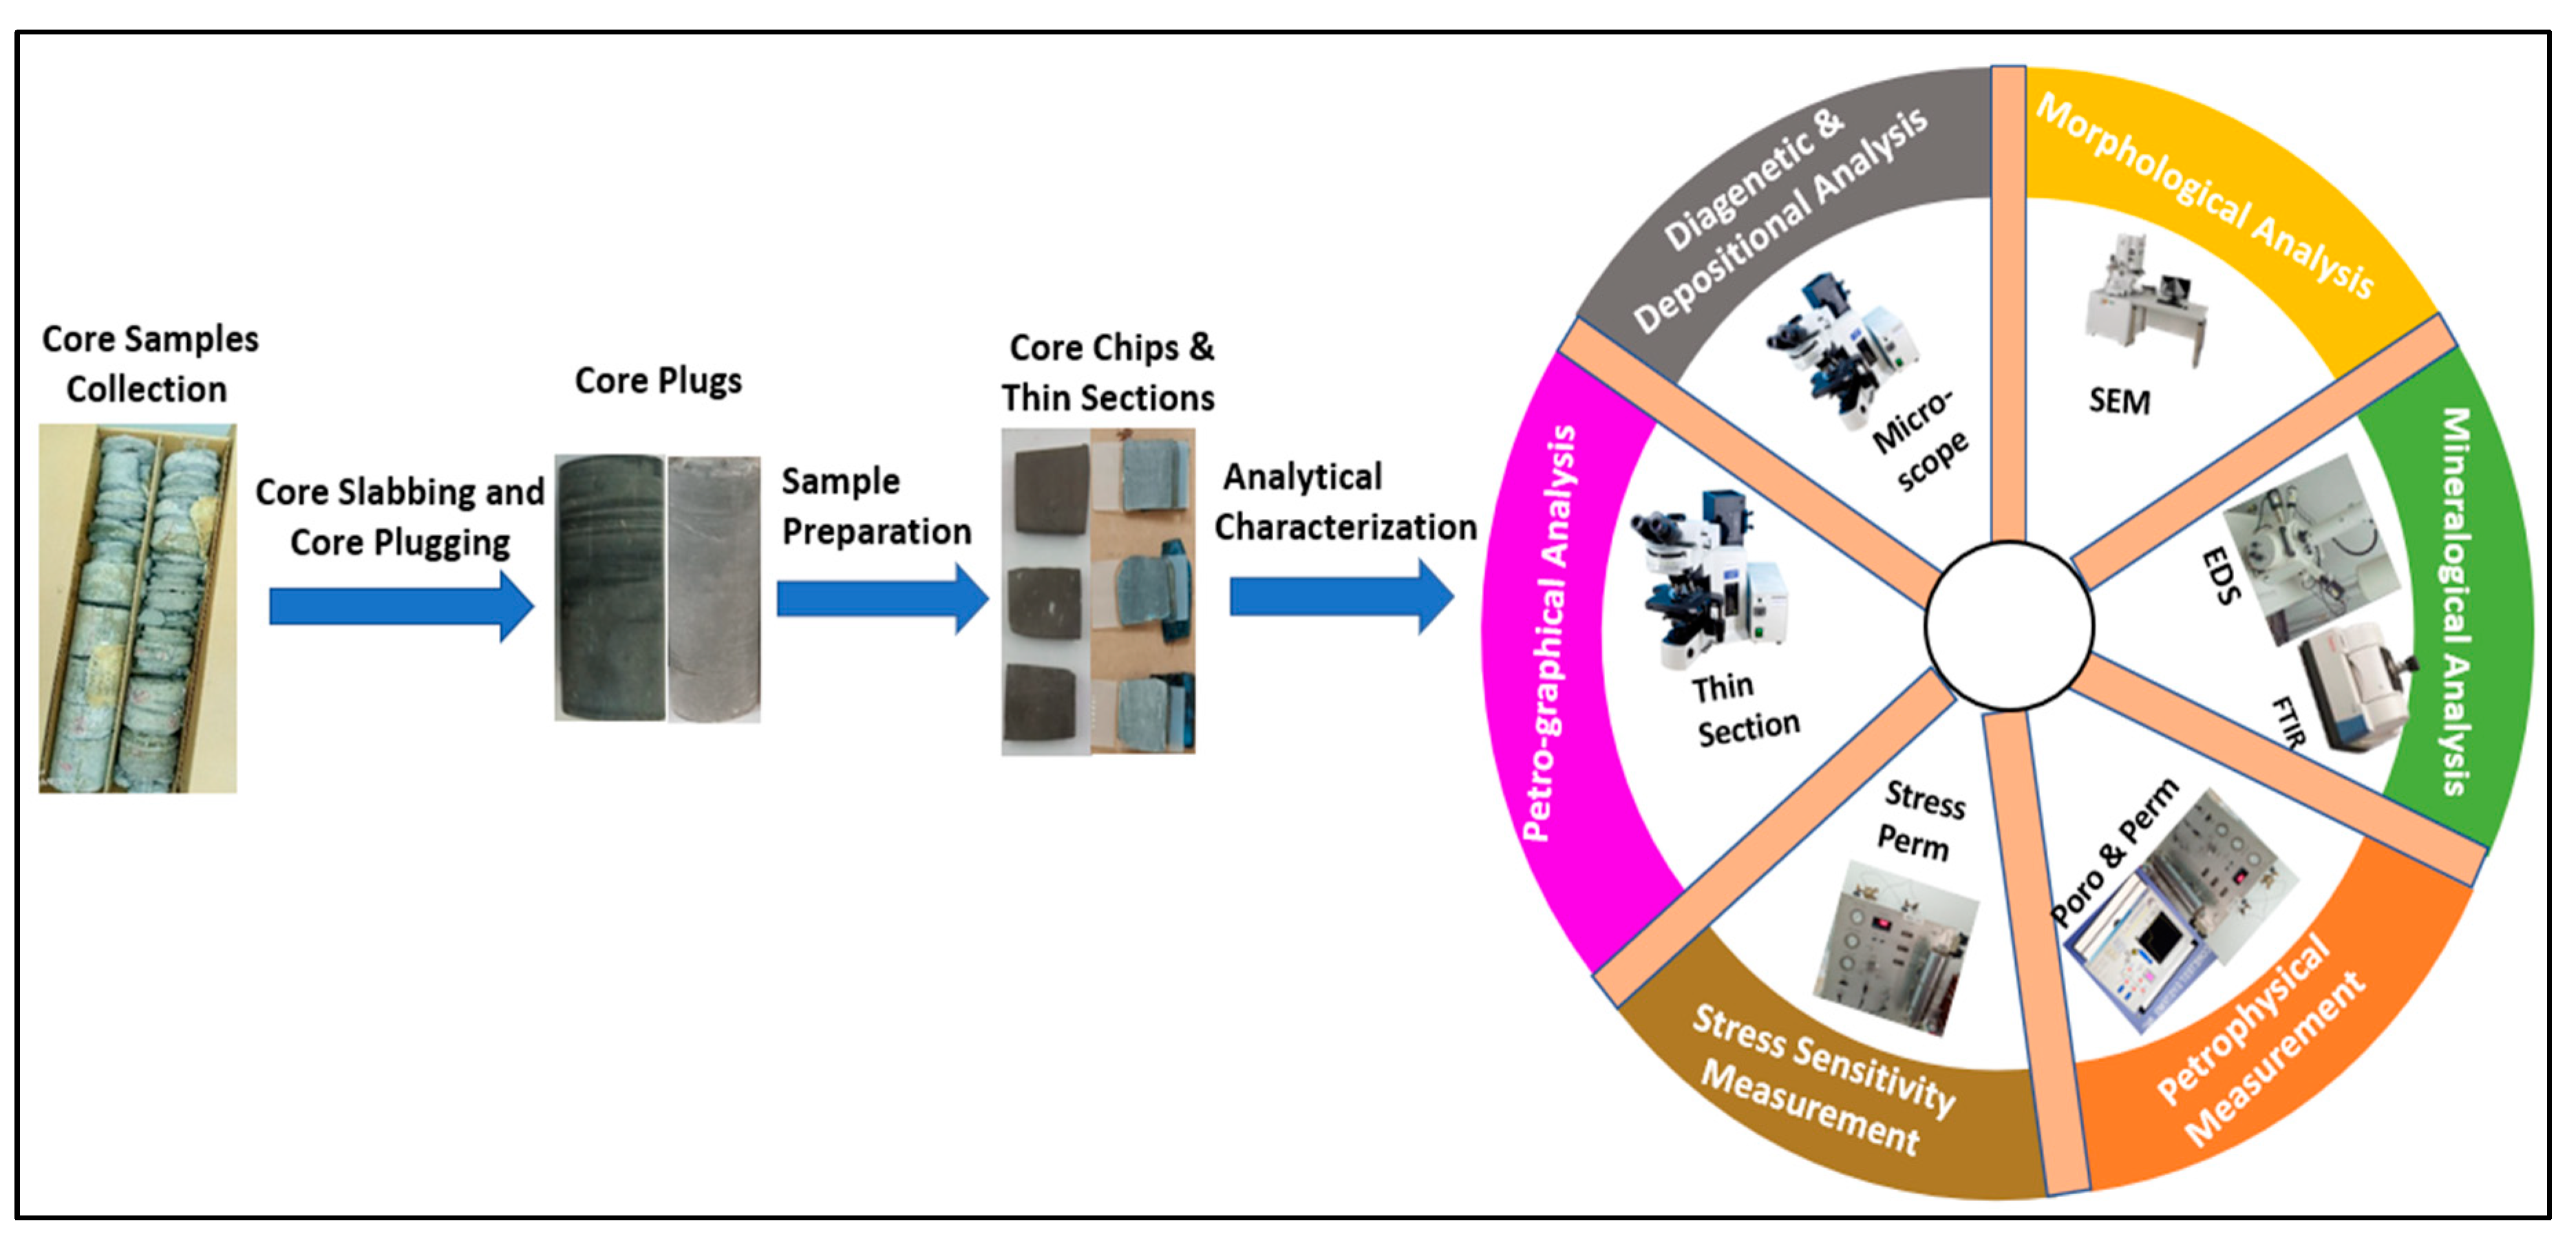
The core samples of Chiltan carbonate formation were characterized through various techniques. The experimental workflow chart, with each specific procedure illustrated in
Figure 3. This figure provides a visual representation of the entire experimental process of all undertaken procedures.
2.3. Petrographic and SEM analysis
The prepared thin sections were examined using a Polarized BX-51 microscope. To capture typical microphotographs of the obtained microfacies, a digital sight DS-U3 Nikon camera was attached to the microscope. Dunham's classification system was employed for petrographic analysis of the thin sections. Mineralogy, microstructure, and diagenetic interactions of the samples were examined through scanning electron microscopy (SEM) using a JEOL- JSM-6590LV, with a field emission Japan Compact SEM imaging interface software connected to a QUANTAX system for Energy Dispersive X-ray microanalysis (EDS analysis).
2.4. FTIR analysis
Fourier Transformed Infrared spectroscopy (FTIR) was conducted to confirm the carbonate mineralogy and identify any changes in mineral composition. The analysis was performed using a portable infrared spectrometer, ALPHA, by Bruker, Optik GmbH in Ettlingen, Germany.
2.5. Petrophysical measurements
Porosity measurements of selected core plugs were determined using the Coretest helium expansion PHI-220 porosity. Additionally, gas permeability and stress sensitivity assessments were carried out using the GP-12-2631 Temco permeameter under both ambient and various net stress conditions, with calculations based on Darcy equation [
32].
In this context, the core length is symbolized by L, cross-sectional area is denoted by A, µg represents gas viscosity, P1 stands for the pressure across the core length (upstream pressure), and P2 represents downstream pressure. The flow rate Qb is directly related to gas permeability kg.
2.6. Determination of klinkenberg permeability and stress sensitivity.
Steady-state gas permeability tests were conducted on 06 core samples at varying mean pore pressures to analyze the influence of gas slippage in heterogeneous carbonates. Nitrogen gas was injected into the core samples at different inlet pressures of 0.35, 0.52, 0.66, 0.82 and 1.02 atm, respectively, to determine gas permeability using
Equation (1) of Darcy law, while keeping the pressure drop constant at 0.25atm. The Klinkenberg permeability expressed by following equation. [
33].
Here,
b represents the Klinkenberg constant, also known as gas slippage factor and
k∞ denotes the Klinkenberg or absolute permeability. The gas slippage factor,
b was determined using following equation [
34].
Where
C is a constant of the order of 1, dependent on pore throat geometry and
λ represents free path length of gas molecules and calculated using given below equation [
35].
Here,
R is the gas constant,
M is the molar mass of gas, and
T refers to absolute temperature. The influence of the Klinkenberg constant on pore throat structure was determined by the absolute permeability
k∞ and expressed by following equation [
36].
In the pore throat relation between Klinkenberg permeability k
∞ and measured permeability
kg, a represents the slope, and
b represents the intercept. Stress sensitivity was also conducted to assess the impact of stress on carbonate rock permeability and pore throat structure at various stress conditions. The net stress is described by below given equation. [
18].
Where
nk represents the stress coefficient, which is assumed as 1 for effective stress calculation without significant error. The coefficient value is typically greater than 1 for conventional rocks and less than 1 for rocks rich in clay content [
37]. To analyze the combined effect of net confining stress and slippage factor at different pore pressures on slippage parameters, a model Equation was employed as follows.
Where γ denotes the stress exponent, and k∞ is corrected or absolute Klingenberg permeability.
3. Results and Discussion
The primary objective of this research was to undertake a thorough and integrated analysis of the Chiltan carbonate reservoir, aiming to explore the influence of diagenesis, depositional settings, and overburden stress on its potential reservoir quality. The characterization of reservoir involved thin section petrography, SEM, EDS, plug porosity and gas permeability, as well as stress sensitivity, all aimed at gaining a comprehensive understanding of reservoir heterogeneity and its impact on reservoir performance. The results of each analysis are detailed subsequently as follows.
3.1. Microfacies Analysis and Petrographic Description
Based on thin section petrographic investigations, three distinct microfacies were identified and categorized as follows: intraclastic packestone (MF1), bioclastic pelliodal packestone (MF2), and bioclastic ooidal grainstone (MF3), all indicative of shoal and lagoon environment.
MF1 is characterized by dark gray limestone displaying an intraclastic packestone texture. It consists of fine grained to medium size particles embedded with calcite, micrite cement and various bioclasts such as intraclasts, peloids, ooids, and pellets. Several diagenetic features, including induced calcite fractures, and tectonic fractures were observed in these microfacies. MF2 exhibits a light-pale gray bioclstic pelliodal packestone composed of fine to medium sized particles surrounded by variety of micro-nano fossils, including pelliods, bioclasts, algae, and gastropods. Common diagenetic shifts associated with a shoal environment include cementation, micritization and neo-morphism, which were observed in these microfacies. MF3 is characterized by mild gray bioclastic grainstone containing euhedral to anhedral Ferron dolomite crystals. It features an accumulation of various micro-nano fossils, such as bioclasts, milliods, bivalves, echinoderms, and branchiopods. Digenetic features observed in these microfacies include intense micritization, cementation and induced calcite fractures.
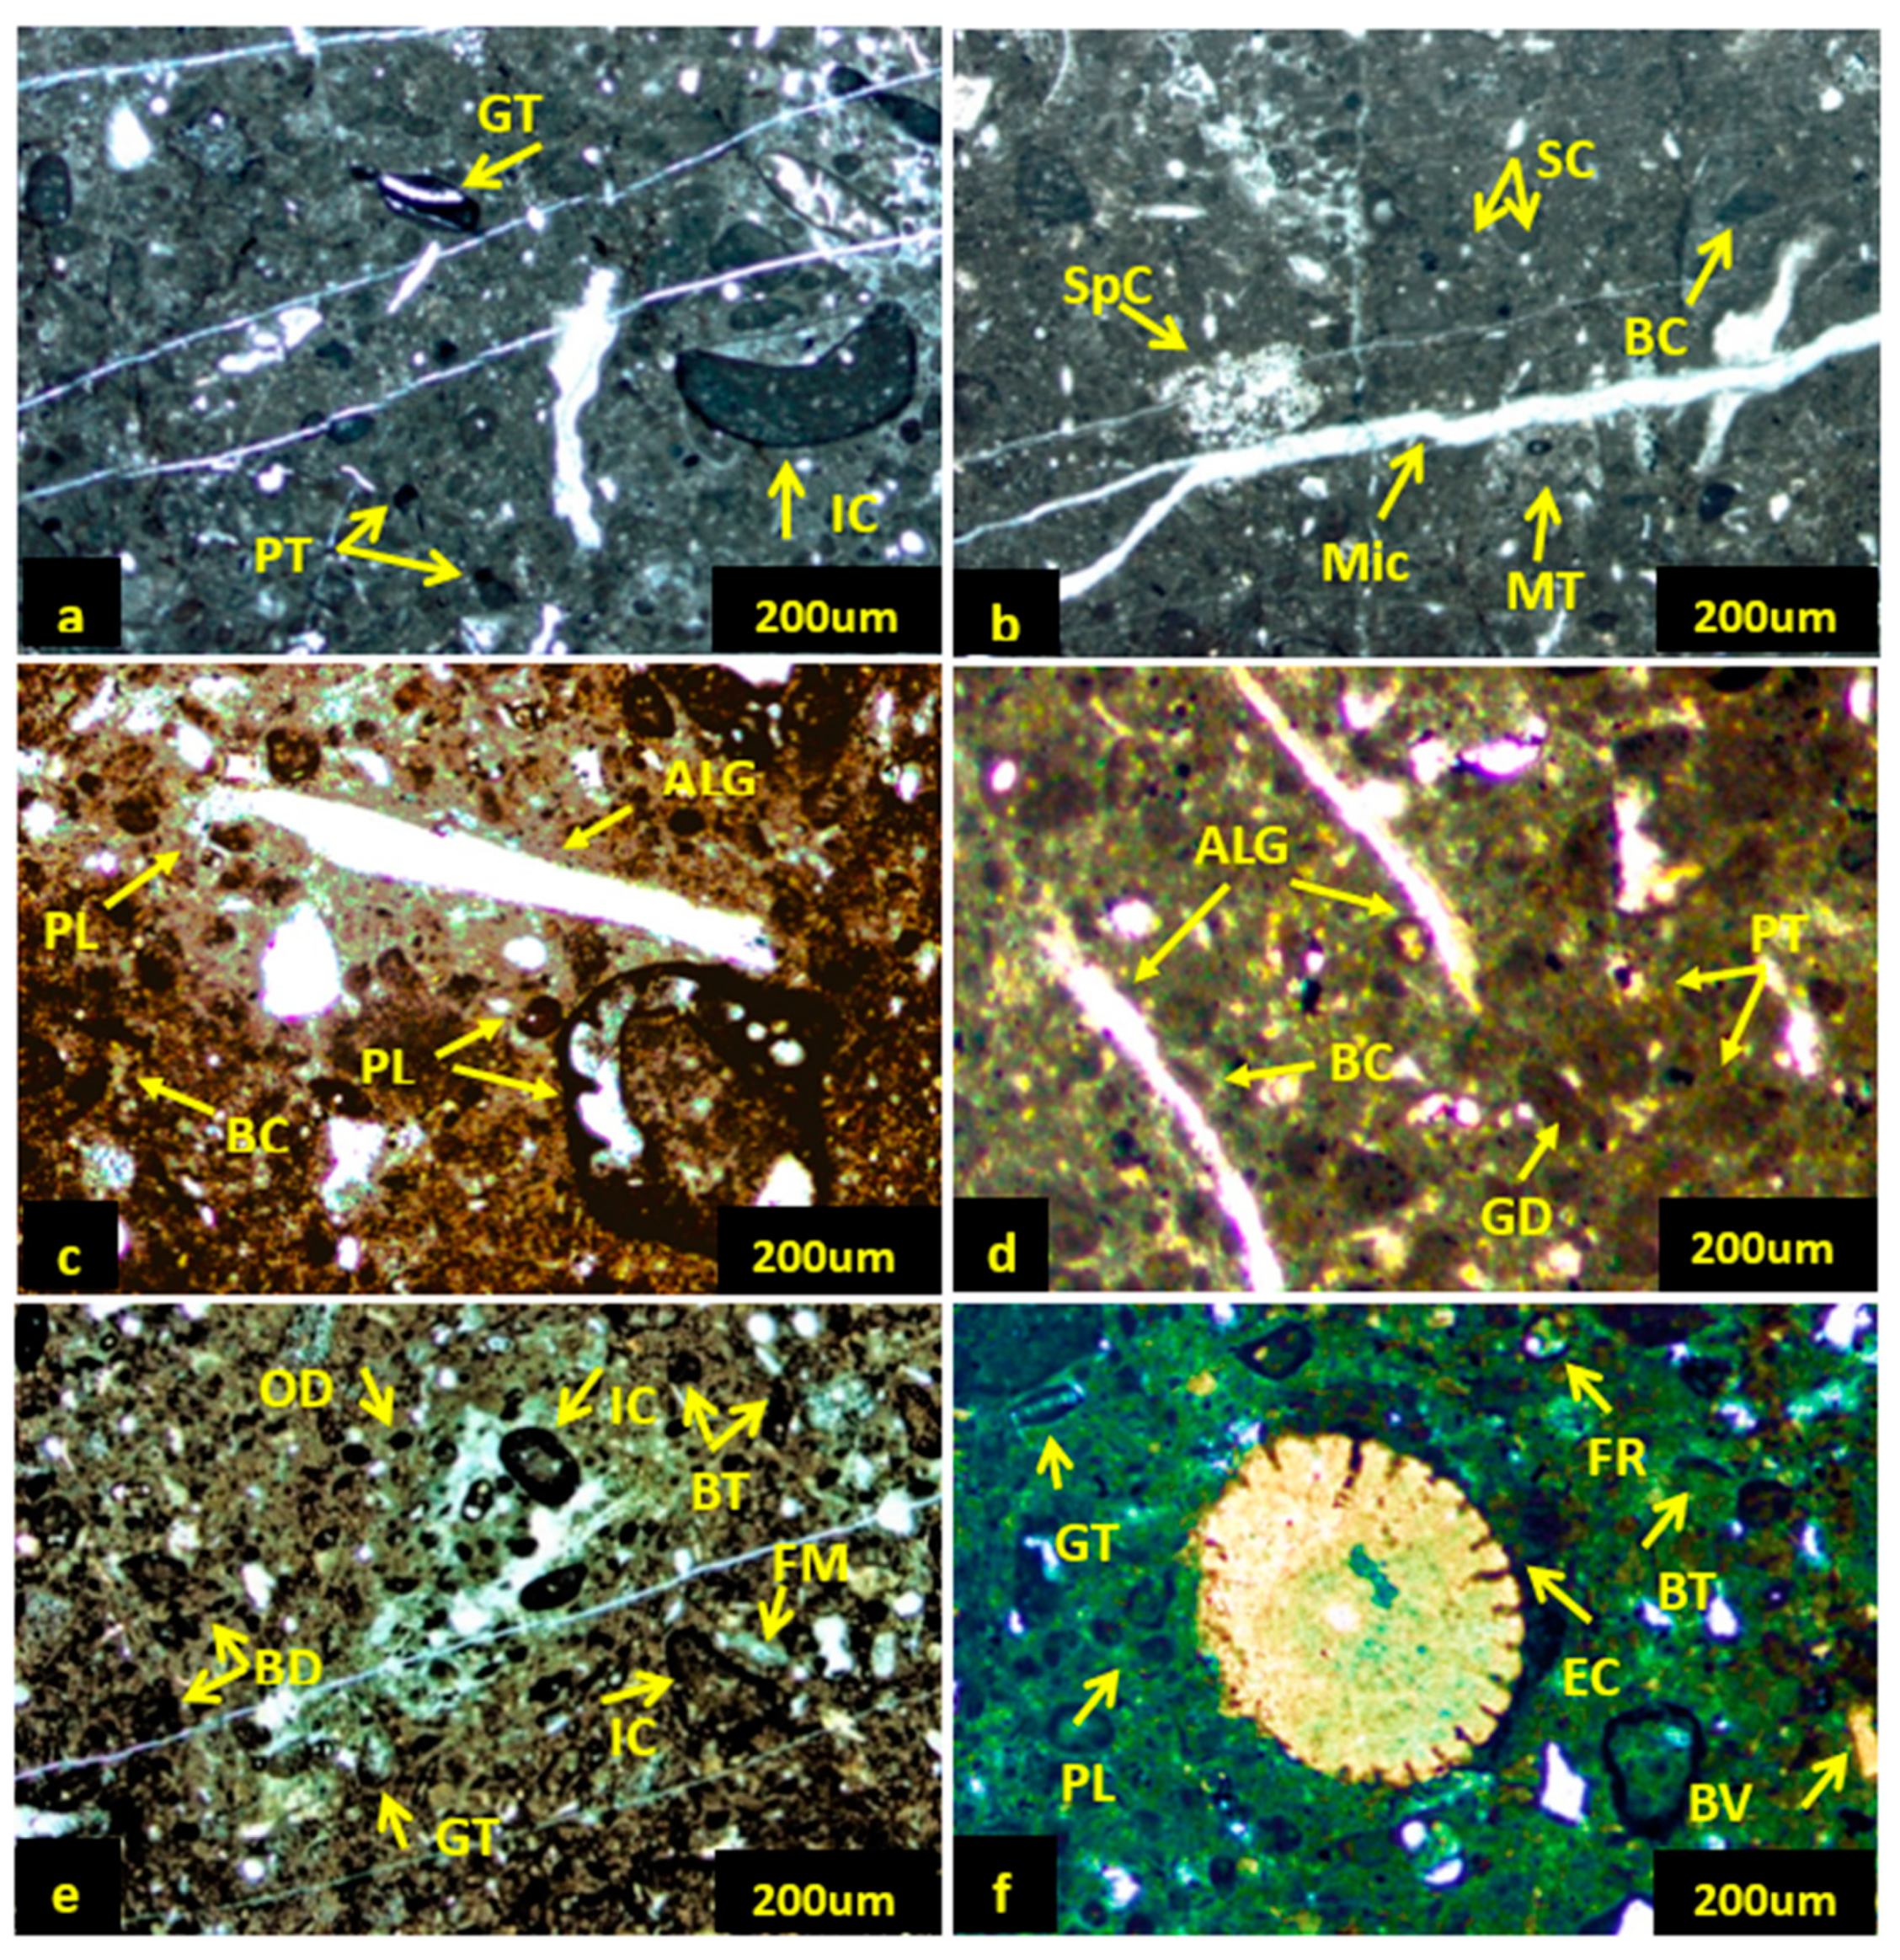
In petrography, the analysis revealed that the samples predominantly consist of limestone composition with some dolomite crystals as seen in
Figure 4. Thin section analysis further unveiled that the examined core samples exhibit three distinct microfacies characterized by packestone and grainstone textures, ranging in color from dark grey to light brownish. These microfacies contain various bioclasts and intraclasts with diverse allochems. Visual estimates indicate that calcite, micrite, spar cement matrix and ferruginous clay content make up approximately 60-65% of microfacies in both packestones. In contrast, around 30-35% of the relative average allochems consists of intraclasts, bioclasts (bivalves and gastropods), and pallets in MF1, as shown in
Figure 4(a & b). MF2, on the other hand, is predominantly composed of pelliods, bioclasts, algae, gastropods, and echinoderms, each with distinct ratios observed in
Figure 4(c &d). The analysis also revealed vuggy, or solution and fracture porosity was ranging from to 2-5%, as depicted in
Figure 4(a &d). Additionally, the unusual presence of siliciclastic quartz, appearing as rounded fine grained particles randomly arranged, as noted in
Figure 4(a & d). In MF3 grainstone microfacies, visual estimates suggest that approximately 25-30% is comprised of cement with some ferron dolomite crystals, while 60-65% consist of allochems as observed in microphotographs. Various undifferentiated bioclasts, miliolid, foraminifers, echinoids, peloids, intraclasts, and ooids were identified in the analysis, as displayed in
Figure 4(e & f). Additionally, minute traces of silici-clastic quartz were also observed in all three microfacies, as shown in
Figure 4. The petrographic details of observed microfacies are provided in
Table 1.
The petrography and microfacies analysis of thin sections have illuminated the key diagenetic features and microstructure present in the examined microfacies. The microfacies were categorized using Dunham classification to identify grain size, cement type and matrices. Semi -quantitative data regarding carbonate constituents in the percentages were calculated using visual estimation charts developed by Baccelle and Bosellini [
38]. The examination highly revealed bio-mineralized by-products indicative of shallow marine environment, including fossils fragments, carbonate sediments and surrounding cement muds. The predominance of micrite cement suggests a relatively quiet depositional environment, while the bivalves and gastropods points to limited water conditions observed in both microfacies [
39,
40]. The presence of bioclasts such as bivalve shells and other skeletal fragments indicates a moderately saline shallow marine environment. Intraclasts, bioclasts, cement, and ooids on the other hand, are indicative of high-tide conditions near seashore [
41]. Allochems were found to be micritized in the observed microfacies, with some partially micritized rims particularly in case of bivalves. This suggests the reworking of low grains in high-energy environments.
3.2. Diagenesis and Identified Features
Diagenesis begins early during the interaction of sediment with water, although many diagenetic processes occur after deposition. Diagenesis exerts a significant impact on petrophysical properties, leading to an increase in reservoir heterogeneity. This complexity results in a reduction in porosity, permeability and micropore structure, which eventually affecting the reservoir quality [
32,
42]. Through petrography and SEM analyses, considerable diagenetic development was observed, characterized by stronger grain contacts and alteration of primary sedimentary features. These features include well-sorted fine-grained sediments and diversified clay minerals, which typically form tight reservoirs with low porosity and low permeability [
42,
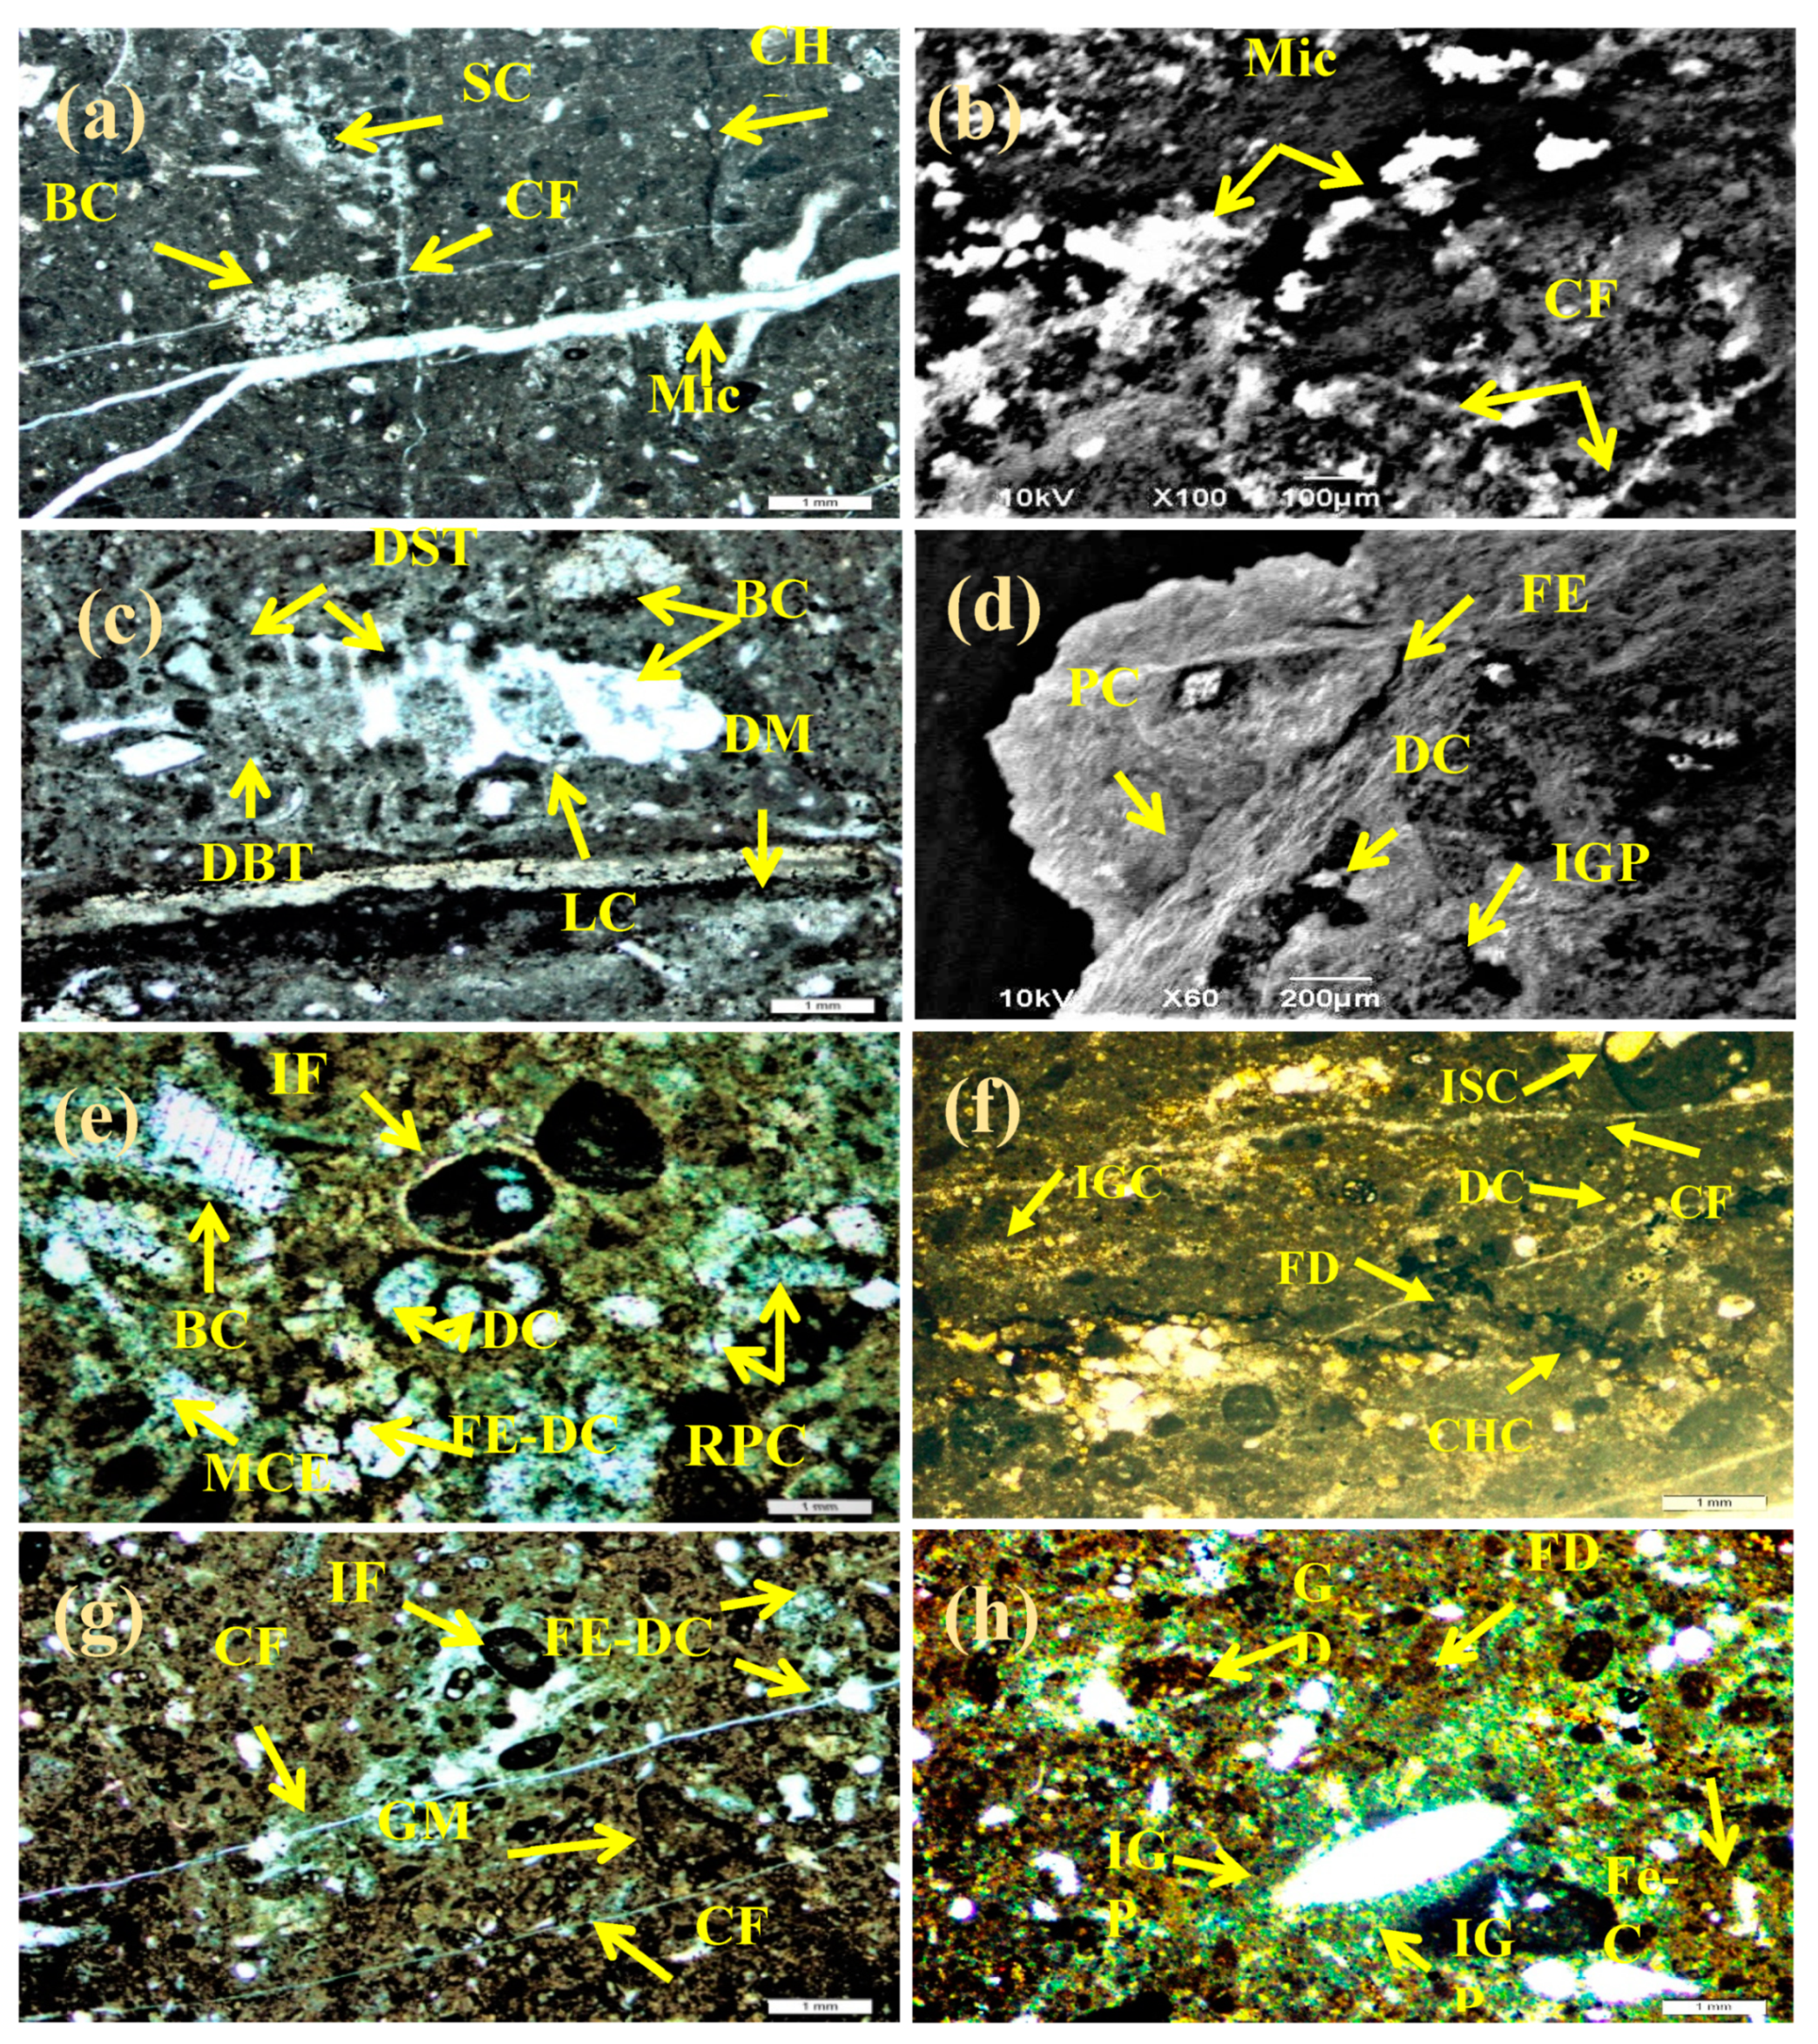
43]. This research identified several diagenetic processes that modify the configuration of carbonate rocks over time, including micritization, cementation, compaction, dissolution, and dolomitizations. Different diagenetic processes with identified features through bio-stratigraphy analysis are discussed as under:
3.2.1. Micritization
Micritization was observed as an early diagenetic event that adversely affects the reservoir quality by altering the intrinsic characteristics of skeletal grains and microbial activity. Microscopic degradation of bioclasts was found to be highly significant in the examined samples, potentially creating a depositional micrite matrix, as depicted in
Figure 5a. SEM imaging further confirmed that micrite underwent recrystallization, leading to the formation of microcrystalline calcite, as shown in
Figure 5b
. The micritization of allochems primarily occurs in shallow waters due to activity of algae boring (endolithic) organisms, which ultimately leads to the generation of peloids [
39,
44].
3.2.2. Dissolution
Dissolution or leaching of metastable bioclasts, because of circulation of the meteoric fluids, was frequently observed in petrography and SEM analysis, as shown in
Figure 5(c & d). During dissolution, the micrite matrix disintegrates first, primarily during early marine and meteoric diagenesis due to methane exaltation resulting from algal decomposition [
45]. This type of dissolution is common in packestone microfacies found in lagoons environment. Later stages of dissolution involve disintegration of dolomite grains, stylolitization, cementation and enlargement of fracture as observed in
Figure 5(c & d). This dissolution follows the early diagenetic phase of burial diagenesis. Carbonate cement precipitates in the pores of allochems under strong shoal conditions. The retention of organic matter is limited by the constant refilling of pore spaces by oceanic water. Thus, disintegration of cement during early diagenesis cannot be attributed to the decomposing of organic materials. [
39].
3.2.3. Cementation
Calcite cementation was frequently observed in the analysis, along with a small amount of ferroan-dolomite cement, blocky cement, isopach fibrous and drusy mosaic cement, as shown in
Figure 5. The pore-filling calcite cement was found between the fossils, creating granular and drusy mosaic cement, as identified in
Figure 5(e & g). Dolomite cement crystals were also found with defined shapes, ranging from euhedral to anhedral in packestone-grainstone microfacies. Isopachous fibrous cement is an initial stage cement that precipitated around the bioclasts and intraclasts, gradually encasing the fossils over time, as identified in
Figure 5(e & g). This cement type formed in a marine diagenetic environment with high content of calcium carbonate and low clastic influx [
7,
46]. Blocky cement was frequently found in grainstone microfacies and precipitated in three distinct phases; intergranular, intraskeletal molds and fractures, as observed in
Figure 5(e & f). The paragenetic sequence of cementation involves precipitation between allochems, grains dissolution and fractures through fossils, indicating its recent development.
3.2.4. Compaction
Two types of compactions have been observed in the examined samples. Mechanical compaction, caused by microscopic fractures in deep burial diagenesis is evident, with fractures slashing through allochems and calcite filling in open fractures, as observed in
Figure 5(f & g). Physical compaction resulted from grain contacts, breaking, and deformation induced by sediment overburden. The presence of stylolites and matrix supported rocks serves as indicators of chemical compaction, as shown in
Figure 5(a & f). Mechanical compaction may result from overburden stress, while chemical changes are sensitive to factors such as temperature, pressure and water volume in pore spaces [
47].
3.2.5. Neomorphism
Several neomorphic processes were observed during the analysis, including the replacement and recrystallization of bioclasts and the microscopic matrix. Neomorphism became progressively evident because of partial to total recrystallization of skeletal components. Calcite with high magnesium content accumulates in fossil bioclasts under meteoric to burial conditions and replaces the bioclasts with a crystalline form in a systematic manner, as observed in
Figure 5(c, g, h).
3.2.6. Dolomitization
Dolomite crystals were observed in the garinstone microfacies of the Chiltan formation. These dolomite crystals were found to be fine to medium grained and displayed subhedral to rhombohedral shapes, indicating their sequential evolution under ambient fluid chemistry, as seen in
Figure 5(e & f). The dolomite crystals in this form are composed of ferroan material, as revealed by SEM and EDS analysis. Additionally, some ankerite crystals were found within the dolomite rhombs, suggesting that when magnesium is replaced by iron, dolomite first becomes ferroan dolomite and then ankerite, as shown in
Figure 5e. Mg ions are released from clays associate with carbonates to form ferroan dolomite during early-stage burial diagenesis, and over time Fe ions gradually replace the Mg ions, as indicated by the EDS patterns.
3.3. Depositional Environment and Diagenetic history reconstruction
The depositional environment of the Chiltan formation is classified on various identified facies and their depositional settings. The Chiltan Formation is interpreted to have been deposited approximately 17 million years ago (Ma). The numerical ages are distributed, and the relative sea level interpreted the second order rise cycle over the long term, characterized by composite transgressive tract systems. In the short term, it exhibits two episodes of third-order cycles of rising and falling sea level, while the Haq curve comprises three episodes [
48]. The absence of a single event in the Chiltan formation may be due to the local tectonic activity. The Chiltan formation exhibits a complex diagenetic history, marked by several diagenetic settings and events that have taken place and altered the primary sedimentary structures. This diagenetic history suggests the presence of both high-energy tidal shoal and low energy wave lagoons inner shelf settings. The presence of ooids and peloids is indicative of wave-disturbed, shallow water, and high energy conditions. Sand shoals/barrier and grainstone facies separate the open marine from the restricted-marine environment, with several effects of early marine to meteoric diagenesis [
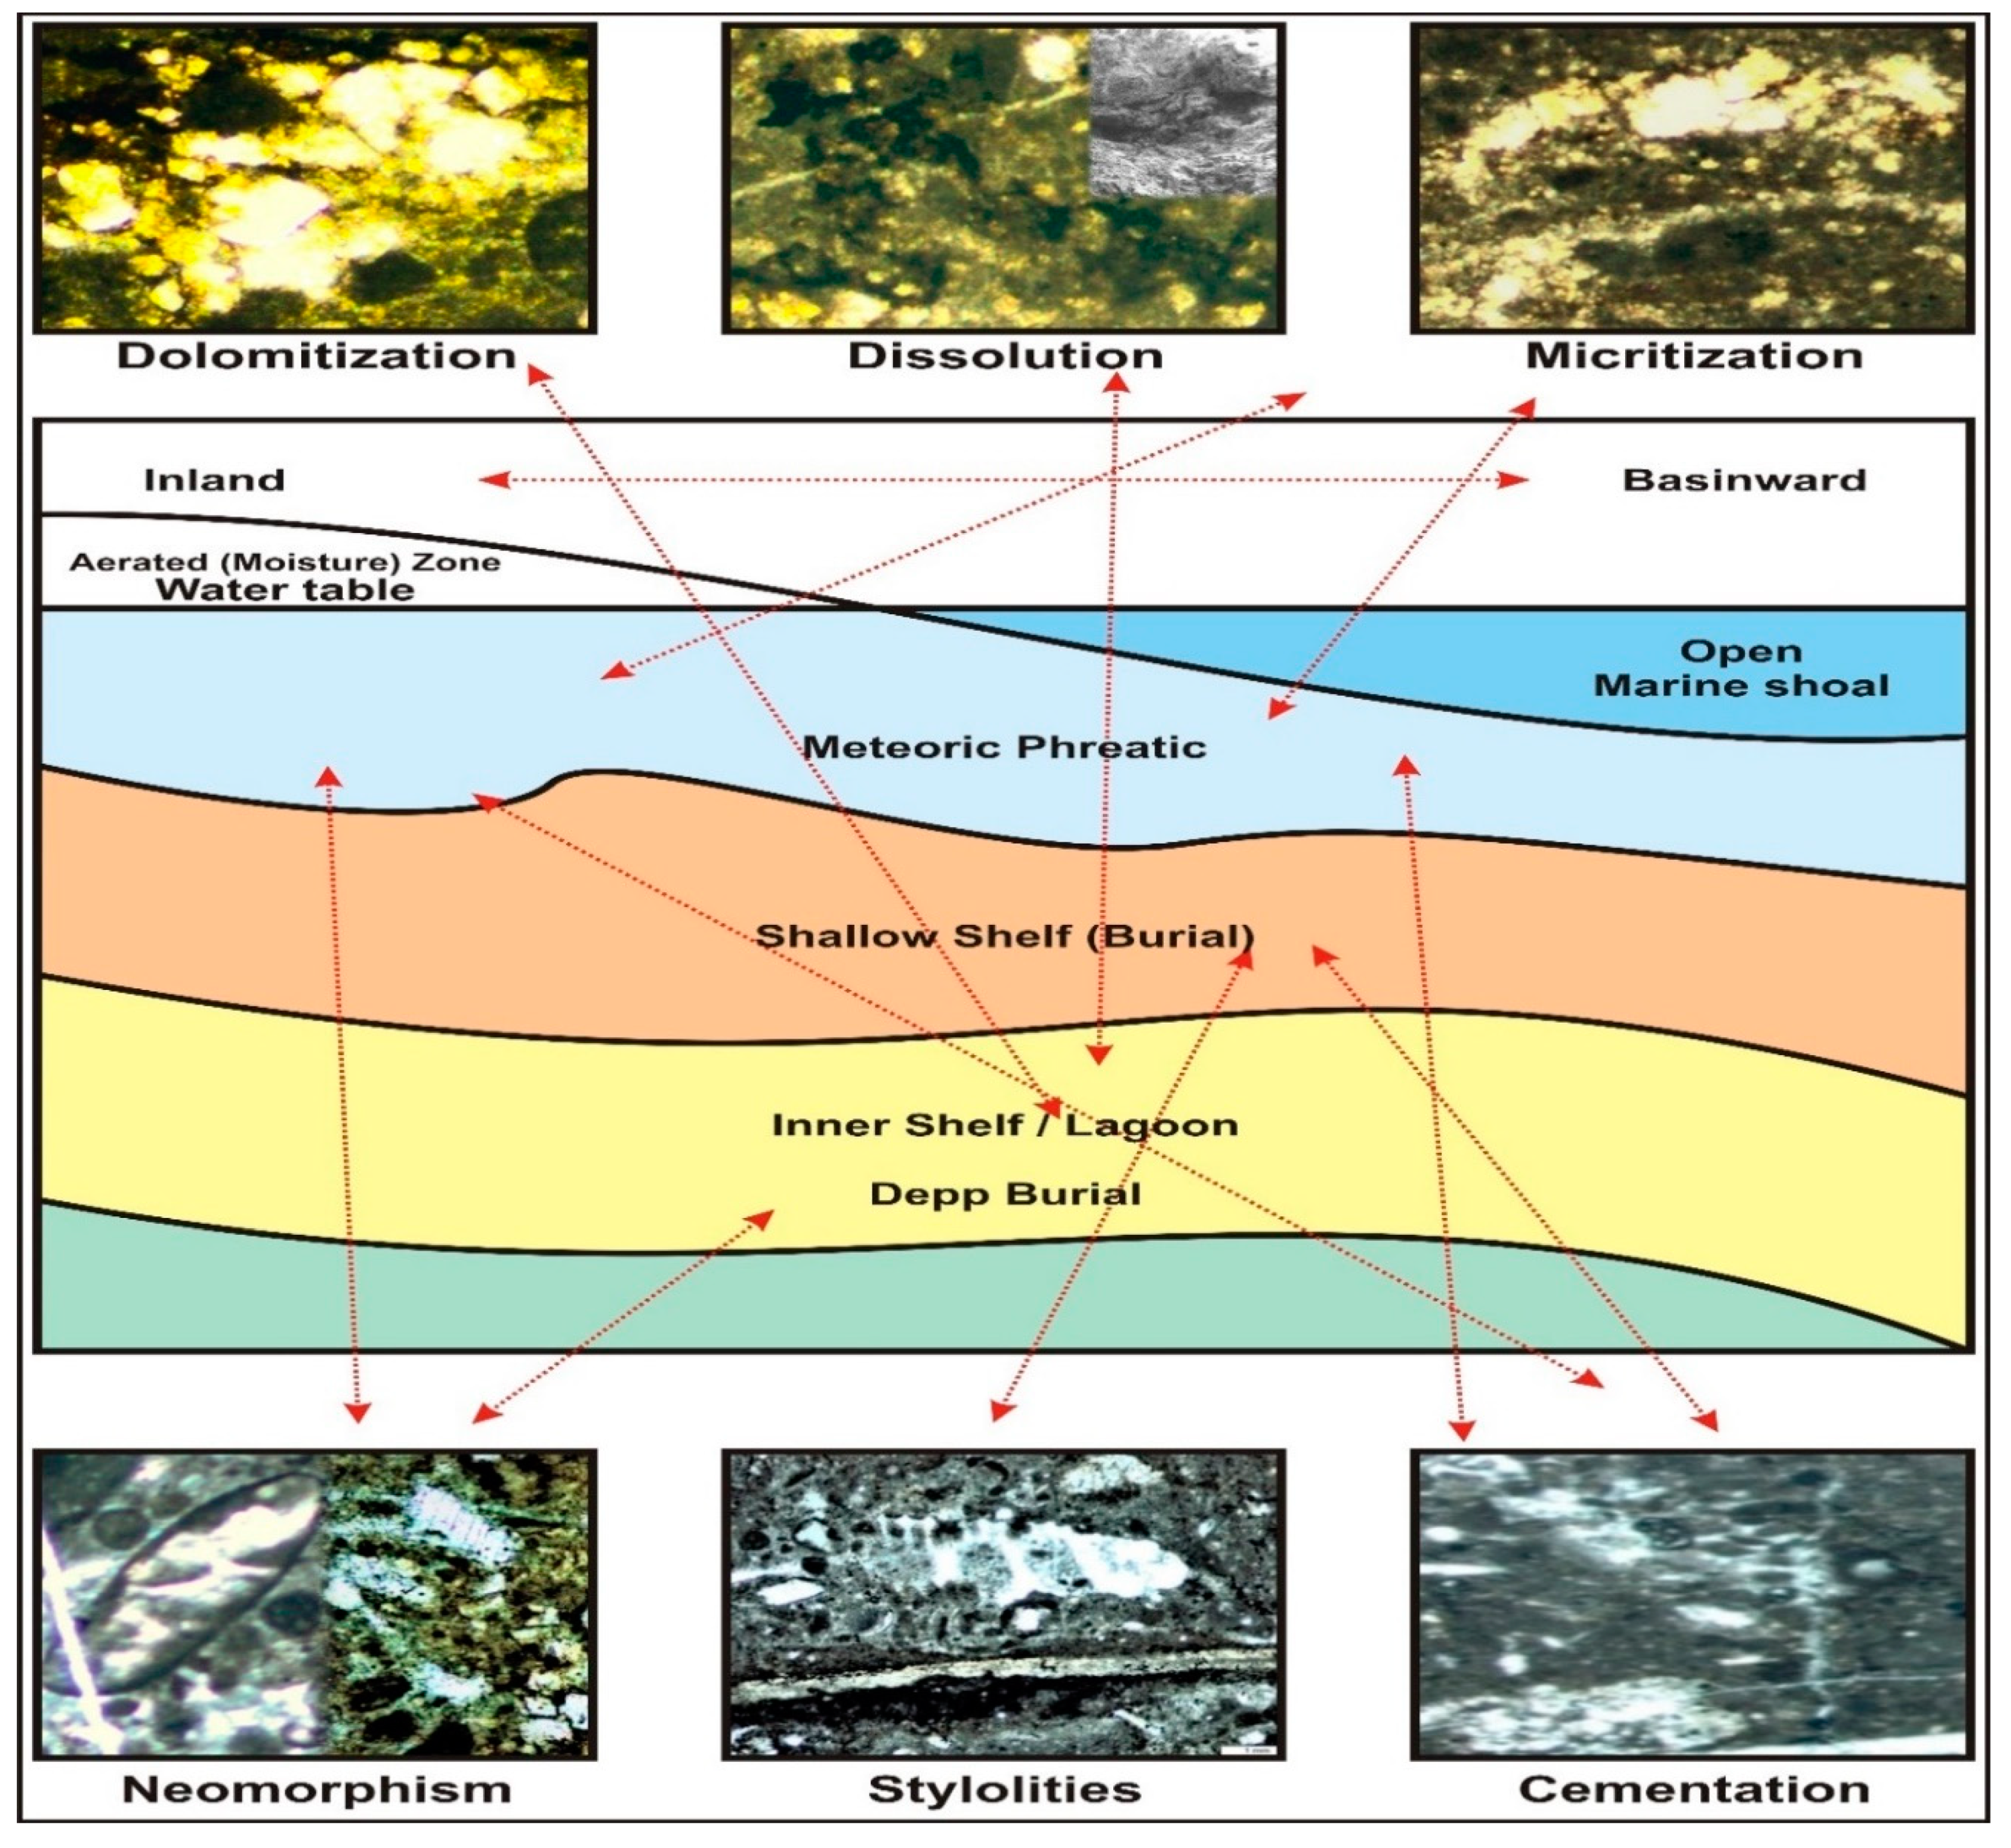
49]. Conversely, the presence of dolomite crystals, neomorphism and dissolution of biotic components suggests burial settings below storm wave base depositional phase, as shown in
Figure 6.
The order of diagenetic processes was established to identify the paragenetic relationships during the diagenetic study. These processes include micritization, cementation, dissolution, compaction, fracturing, and vein filling occurring in distinct diagenetic environments like marine, meteoric and burial as identified in
Figure 7. The early marine diagenetic settings encompass micritization of allochems, matrix disintegration and precipitation of isopachous fibrous cement, as observed during this phase. Micritization was caused by micro-boring organisms that partially destroy the grains at sediment-water interface and forming a micrite envelope. Isopachous calcite cement is an early marine cementation process which primarily restricted to open sea environment, leading to the early lithification of grains and the preservation of porosity [
50,
51]. Meteoric diagenesis follows early marine diagenesis and is characterized by the dissolution of granular and drusy mosaic cement, resulting in the formation of vugs and molds, as identified in
Figure 7. Meteoric diagenesis precedes burial diagenesis, which is characterized by marine cementation and dissolution. consequently, the pore spaces associated to stylolites, dolomite, and fractures cannot be expand or bridged [
52]. Following meteoric diagenesis, pore-filling cement and blocky cement were recognized as evidence of shallow burial settings, identified from micro-fractures, displaced grains, neomorphism and recrystallization. Deep burial diagenesis occurs at depths of hundreds of meters and involves various alterations like stylolitization, calcite vein filling, formation of coarse-grained dolomite crystals, compaction and neomorphism. The dolomites were formed by the release of Mg and Fe ions from clay during deep burial diagenesis, associated with stylolites [
51,
53].
3.4. Mineralogical Analysis
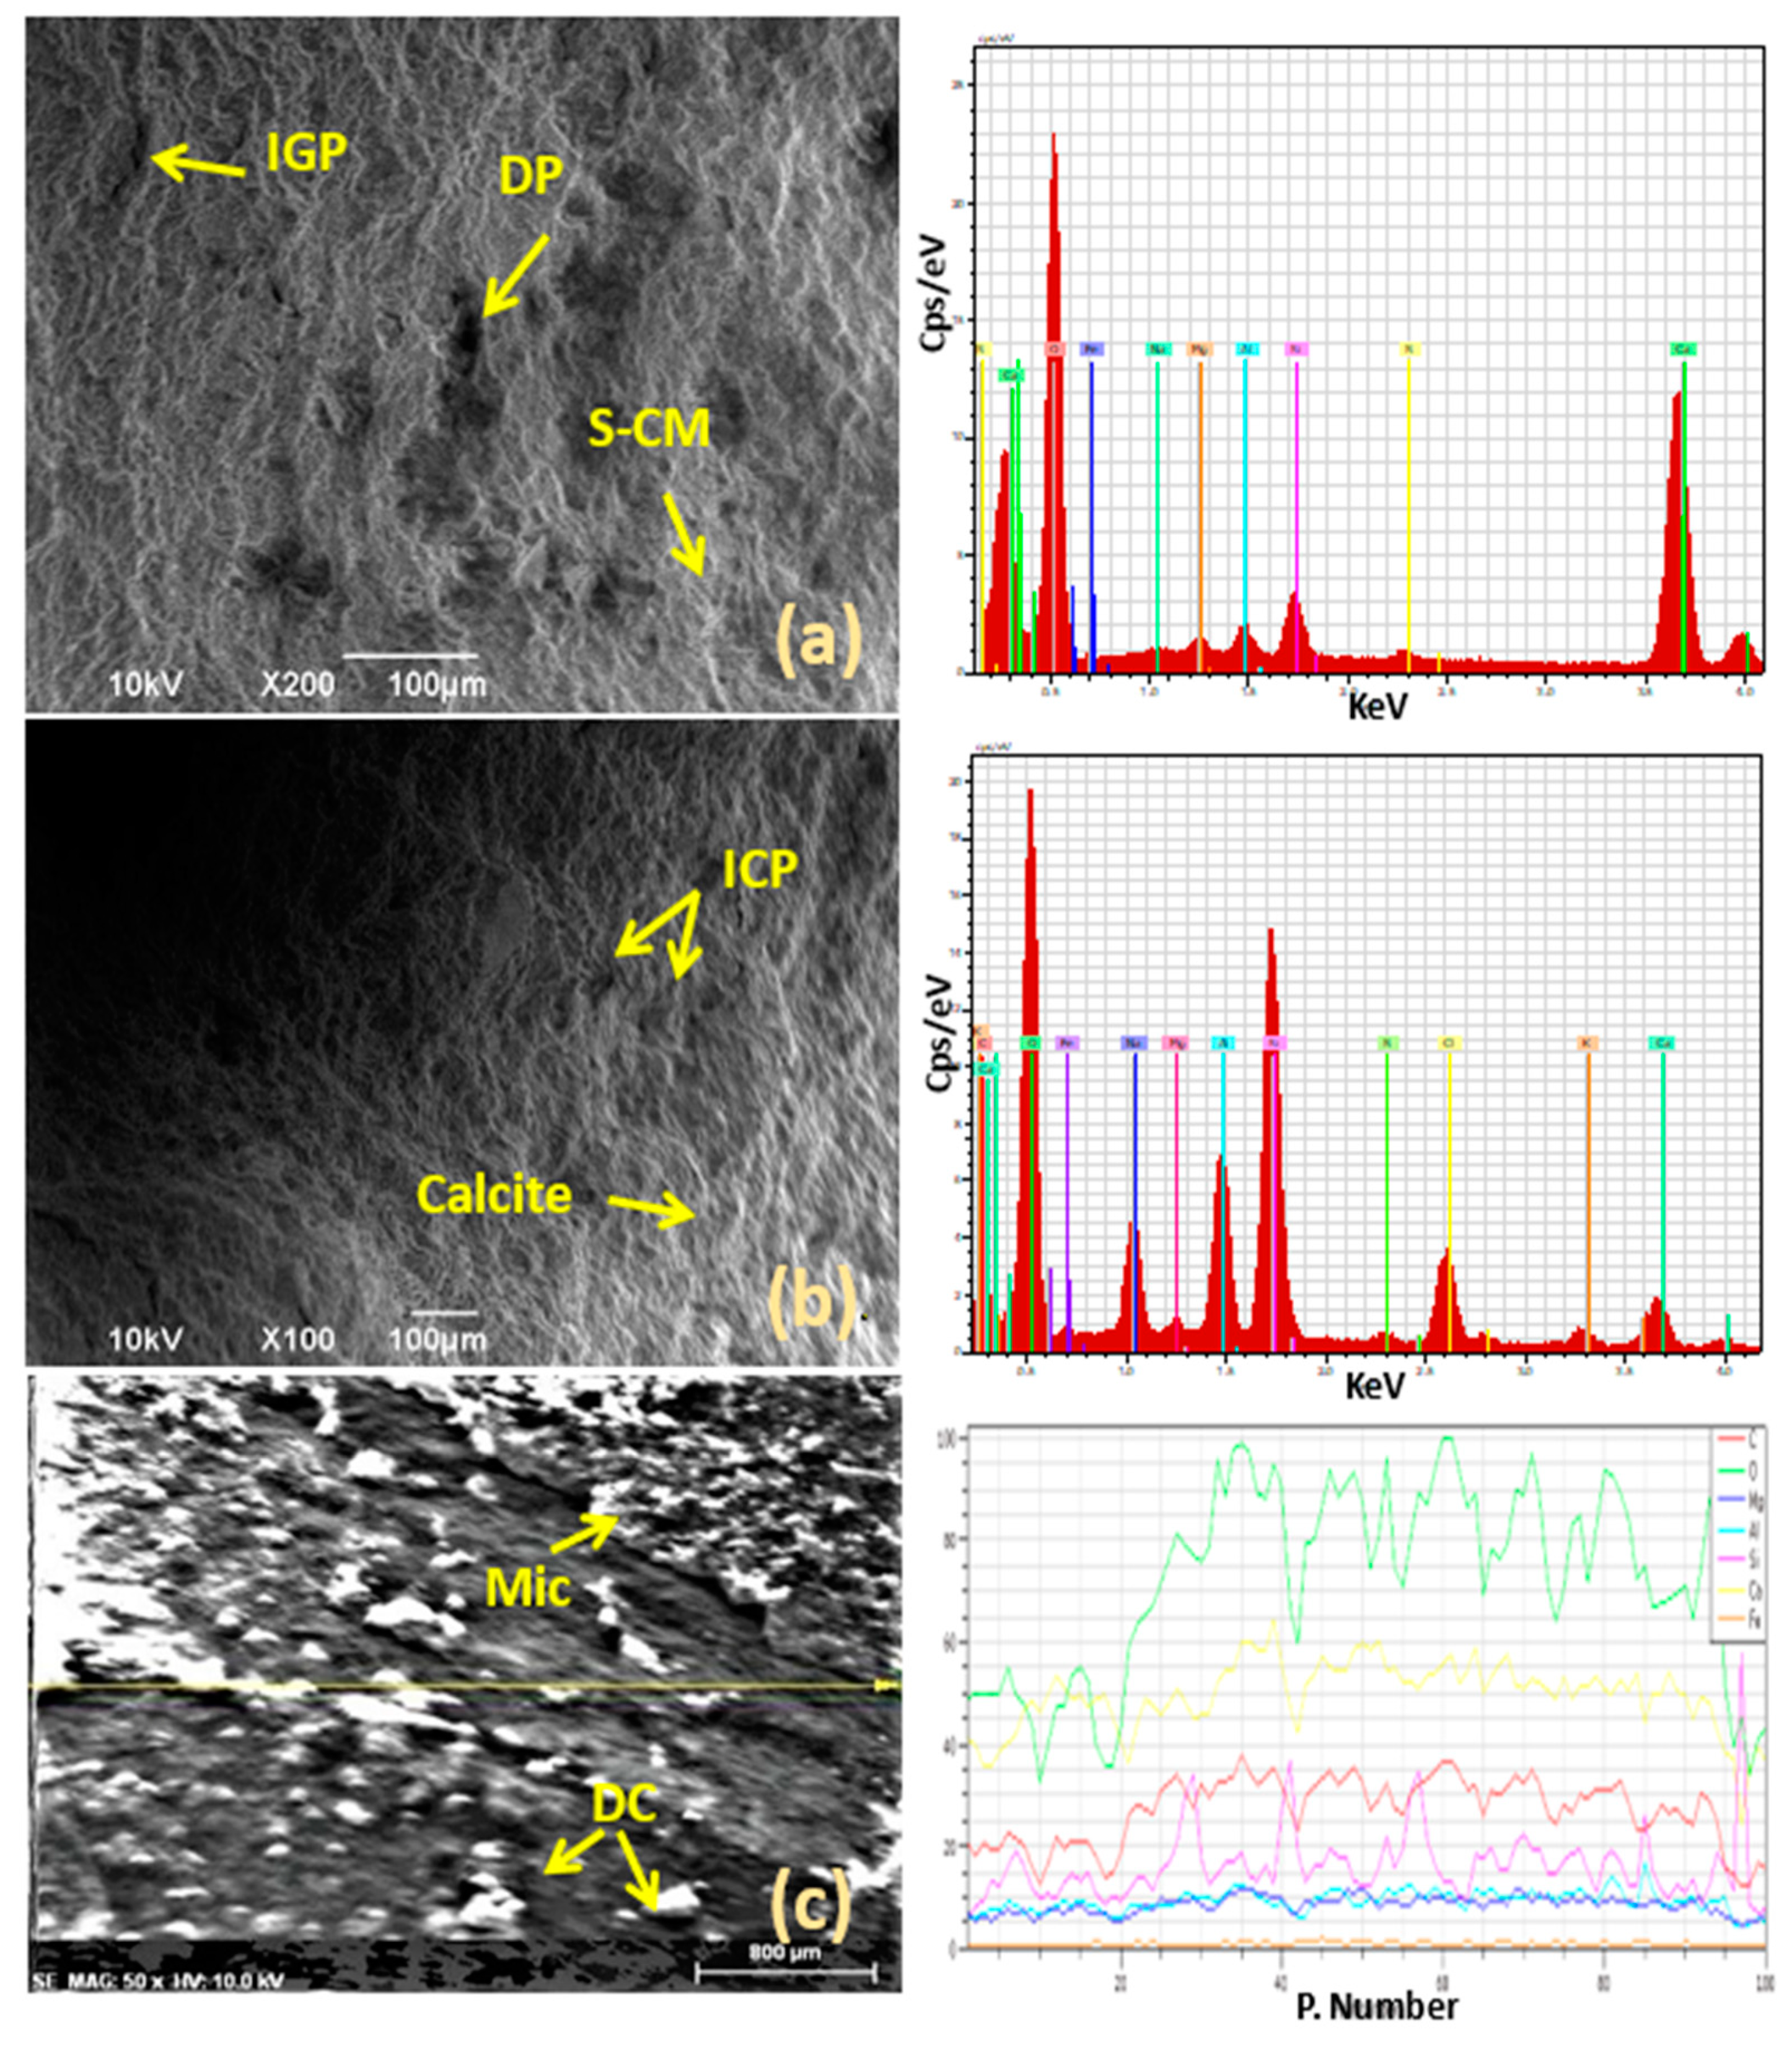
The mineral constituents of Chiltan limestone were analyzed through SEM-EDS, FTIR and thin sections. The observed mineralogy of the examined samples contains calcite, dolomite, and an intermix of clay and cementing materials as dominant mineral components. Furthermore, the presence of aluminum (Al), silicon (Si), iron (Fe), Sodium (Na), clay and cementing material were also observed. These minerals form the grain structure of carbonate rocks and detected in SEM-EDS patterns, as shown in
Figure 8(a & c). Calcium intermixed with magnesium (Mg) in the presence of Fe and formed saddle ferron dolomites. Meanwhile, the exposure of silicon (Si), aluminum (Al), sulfur (S), and sodium (Na) indicates the presence of clay minerals intermixed with silici-clastic influx, likely forming micrite, as shown in
Figure 8(a &c). The detailed mineral composition obtained from EDS analysis, along with their weight percentages (%), is shown in
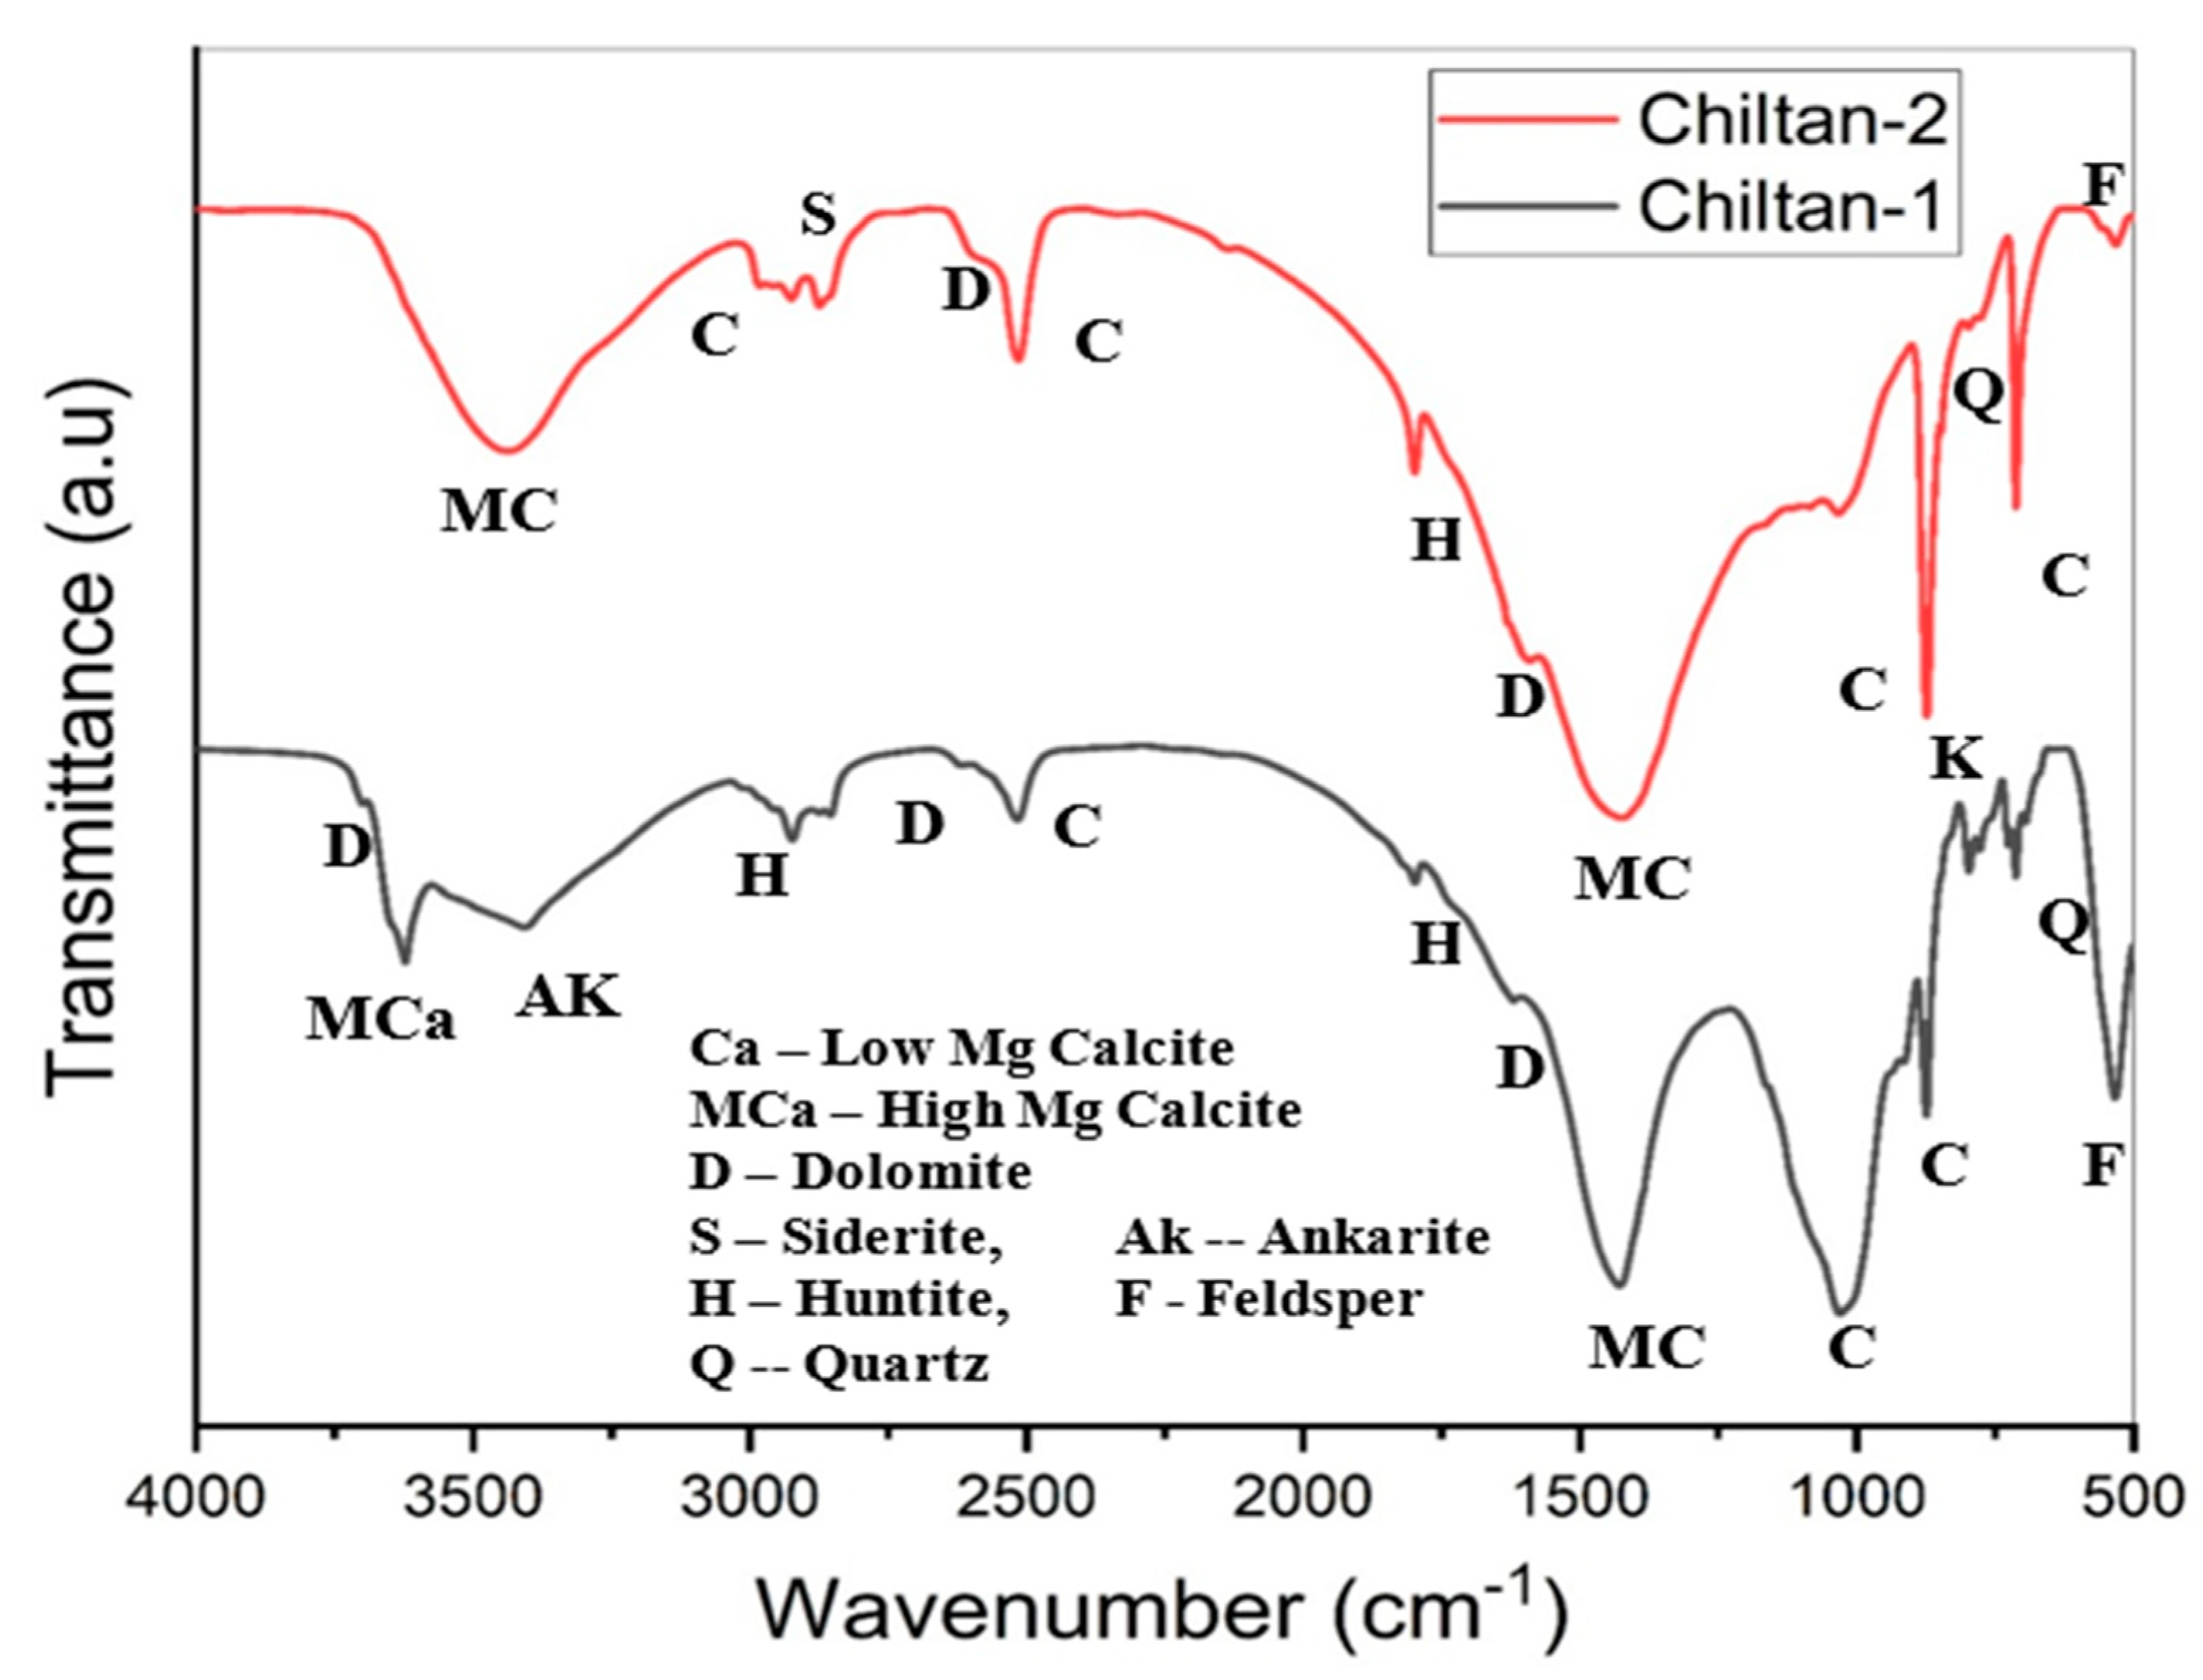
Table 2. Mineral compositions were compared with spectral bands in analysis to identify any changes in the mineral structures of the examined samples. The minerals within the specimen can be identified by detected absorption spectra. The FTIR investigation shows that low-Mg calcite predominates in both samples, despite a small high-Mg calcite phase being observed in analysis, as shown in
Figure 9. The carbonate phases were determined based on the peak wavenumbers of absorption bands. Dolomite phase was identified with three absorption bands of spectrum peak wavenumbers in sample 2, while a huntite phase (Mg rich content) was also observed with several bands in the spectrum. Furthermore, the absorption spectra of several tested minerals like quartz, feldspar, and kaolinite were also identified as non-carbonate phases.
According to the findings from FTIR analysis, Chiltan limestone exhibits a diverse range of carbonate phases. However, pure calcite (with low magnesium content, CaCO
3) is commonly found, characterized by peak wavenumbers at 850cm
-1, 1050cm
-1, 2500 cm
-1 and 3100cm
-1, as observed from
Figure 9. An increase in magnesium content results in a shift of peak wavenumber positions from calcite to dolomite, while peak wavenumbers for huntite and magnesite are greater than those for dolomite [
54]. Varying magnesium contents give rise to a range of high-Mg calcite [Ca
1-n Mg
n (CO
3)] bands observed in analysis. In high-Mg calcite matrices, Ca
2+ ions are replaced by Mg
2+, leading to an increase in wavenumbers. This phenomenon has also been reported in binary and ternary carbonate solid solution systems [55-57]. Based on SEM, EDS, FTIR and thin section analyses, the most prevalent carbonate cements in Chiltan limestone include calcite, ferroan dolomites, micrite muds and some clay minerals, which can impact carbonate quality through mineral precipitation. Additionally, some terrigenous sediment, grain coatings, huntite minerals and kaolinite clay were also identified, which could influence the quality of carbonate reservoir.
3.5. Petrophysical Measurements
For petrophysical assessment, density, porosity, and permeability of core plugs from each microfacies were determined. The relatively average density of the core samples was 2.664 g/cc. The relationship between bulk density and porosity was calculated to identify the degree of reservoir homogeneity. The observed relationship was linear and inverse with a weak correlation, as shown in
Figure 10a. This suggests that the rock samples had variable mineralogical structures, grain shape, packing, and fabric resulting in a non-uniform and heterogenous pore structure. The measured matrix porosity ranged from 0.52% to 6.4% with an average of 3.4%, while the permeability values raged from 0.18 to 1.69 mD with an average of 0.449 mD. It was also observed from porosity determination that wackestone microfacies had somewhat larger plug porosity values compared to the grainstone. Estimated visual porosity during microfacies analysis ranged from 2-4%, including intergranular, intracrystalline and dissolution porosities, which were distinguished by SEM analysis in
Figure 8(a - c). The plotted permeability and porosity data did not show a strong correlation and demonstrated a linear relationship with a weak coefficient due to the varied pore size and pore throat network, as shown in
Figure 10b. This complexity of the pore structure significantly impacts on fluid flow properties, which can be determined through rigorous porosity and permeability relationships. Few deviations in the cross-plotted data points were observed, indicating the presence of micro cracks, as confirmed by thin section and SEM analysis.
3.6. Klinkenberg Corrected Permeability and Gas Slippage Factor
Tight permeability rocks are sensitive to stress and pore pressure, which can lead to gas molecules slippage at low pore pressures, resulting in an increase in the measured permeability. This slippage effect occurs due to the difference between free path of the gas molecules and pore-throat sizes [
58,
59]. The account for the gas slippage effects in low permeability cores at low pore pressures, the measured permeability is often corrected using the Klinkenberg permeability method in current studies. Therefore, a practical method was established to calculate Klinkenberg permeability and the gas slippage factor in the low permeable Chiltan carbonate formation. Different empirical equations were utilized to determine the Klinkenberg corrected permeability based on the observed pore-throat geometries of the examined samples.
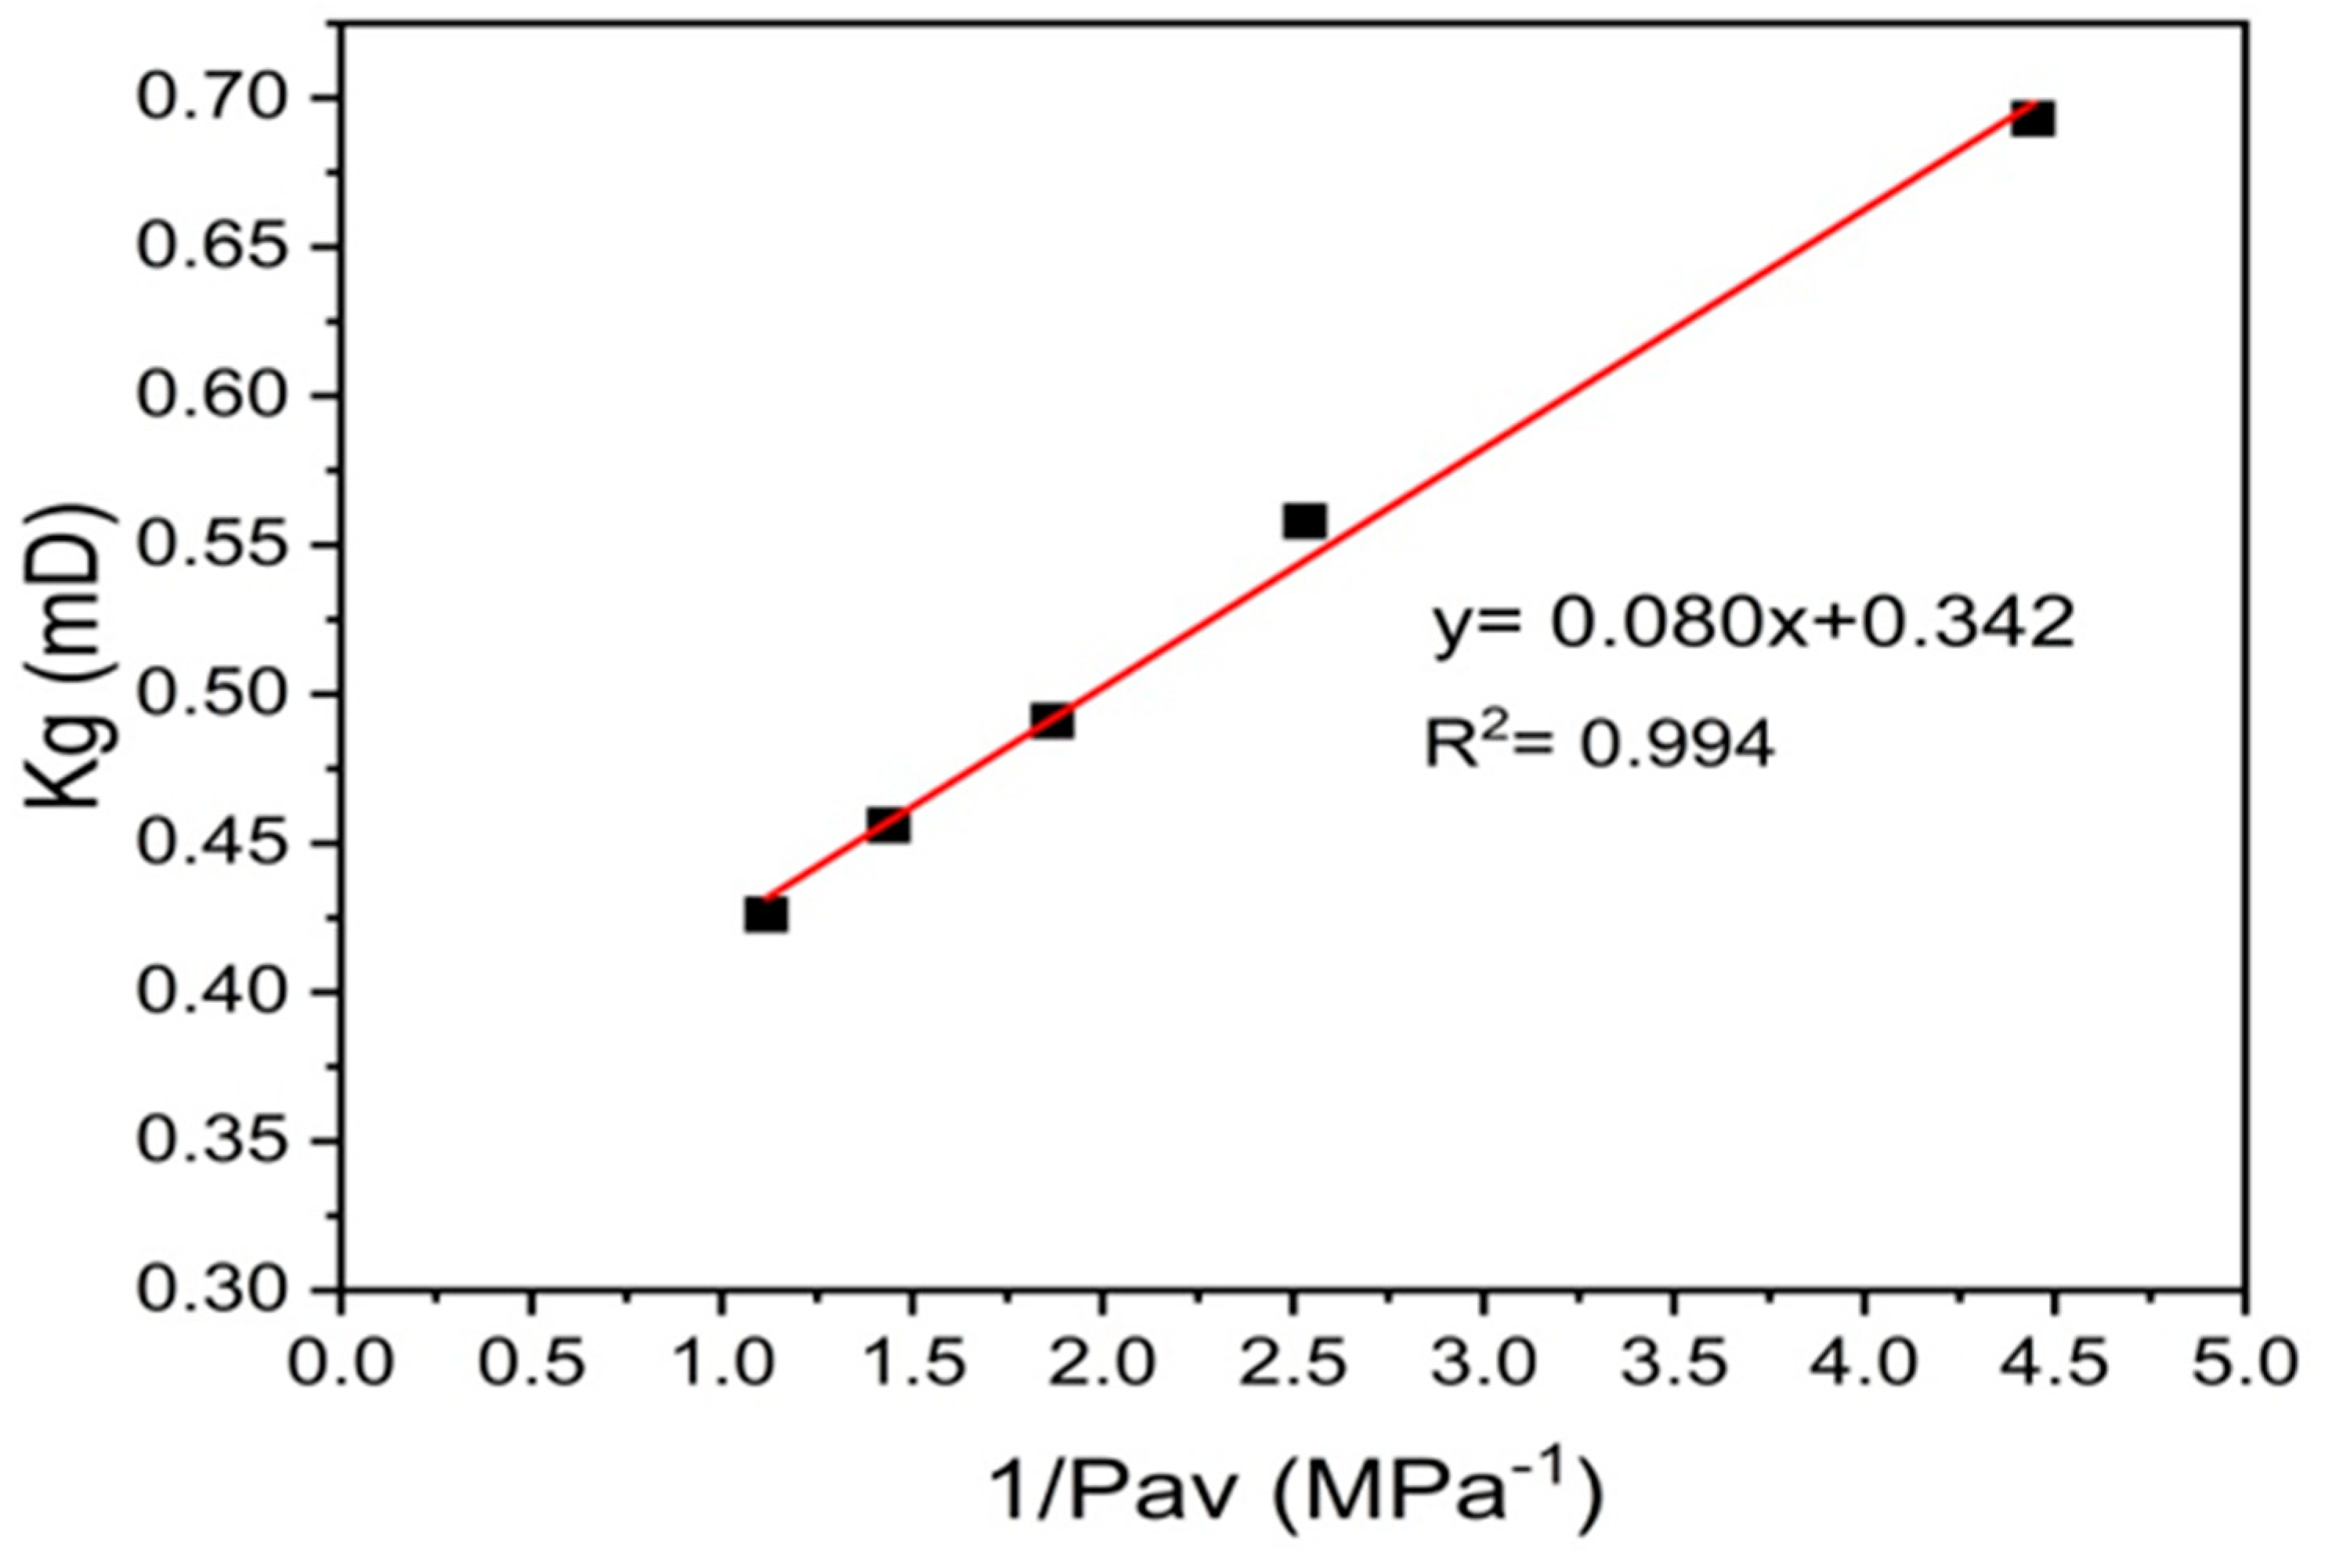
Figure 11 illustrates the linear relationship between permeability coefficients
(kg) and the reciprocal of average pore pressure
(1/Pav) under varying pore pressure conditions using Equation (1). The Klinkenberg permeability was determined by extrapolating the gas permeability line to zero. The obtained regression for the measured data was found to be satisfactory, with a coefficient of determination
(R2) equal to 0.994. The gas permeabilities measured at various mean pore pressures and identified Klinkenberg permeability values of 6 carbonate core samples are provided in
Table 3.
To calculate the gas slippage factor (
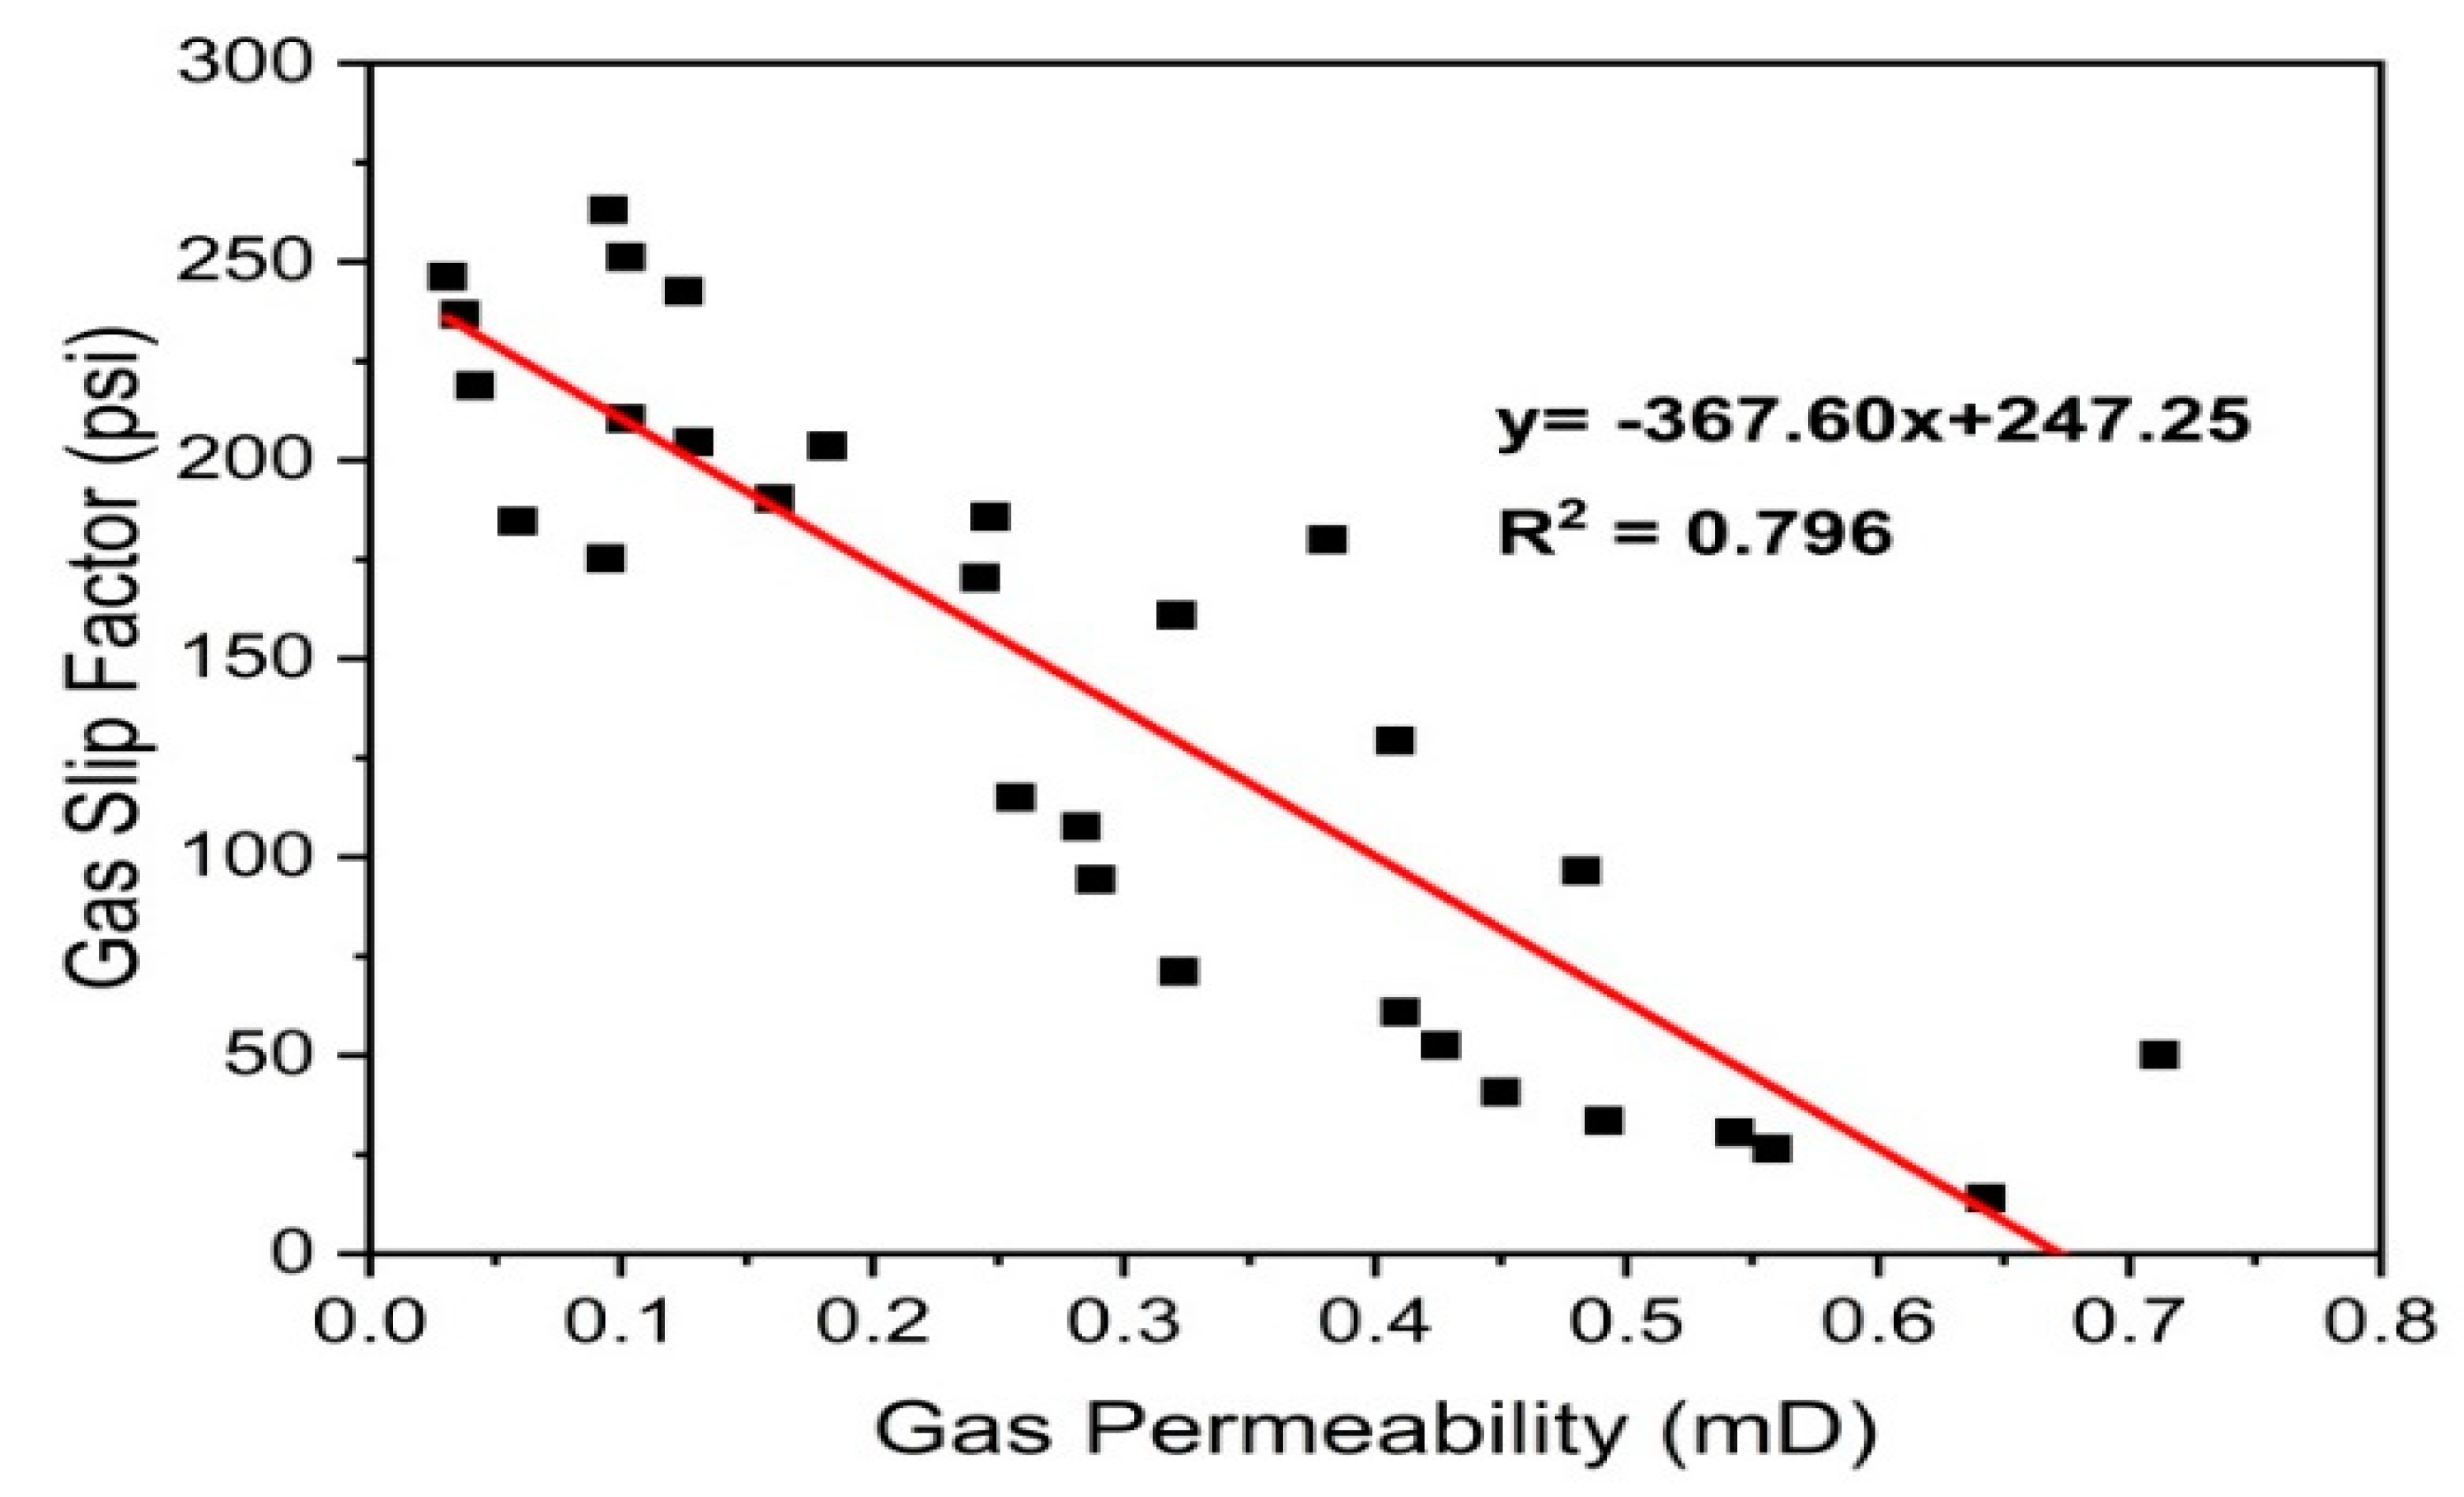
b), a straight line was fitted to the permeability data obtained from Klinkenberg tests using Equation (2) & (3). The outcome that could be fitted to a straight line with a correlation coefficient of greater than 0.79 for 30 data points were considered for the study. It was observed that there was variation and scattering in the data regarding the relationship between gas permeability (
kg) and gas slip factor (
bk), as shown in
Figure 12, and other relevant data are presented in
Table 3.The variation in slippage parameters and permeability may be attributed to the heterogeneity in carbonate rocks and non-uniform pore sizes in the samples under study. Consequently, it is evident that permeability results cannot be reliably calculated using available empirical correlations, as carbonate rocks exhibit significant heterogeneity and a variety of pore geometries [
18]. The slippage effect in a conventional reservoir core is negligible due to larger pore radius, and gas slip factor becomes close to zero. In contrast, a tight reservoir core possesses a very small pore radius and has significant effect on gas flow [
34,
60].
Furthermore, it was observed that the gas slippage effect increases the permeability at reduced pore pressure. This indicates that gas molecules have longer free paths than the pore throat diameter, which depends on effective pore size
(rslip). Therefore, the pore-throat structure of core samples has a significant impact on the Klinkenberg constant, which describes the difference between the measured gas permeability (
kg) and Klinkenberg permeability (
k∞). The calculated values of effective pore size (
rslip) and gas slip factor (
bk) for Klinkenberg permeability of the studied samples at different mean pore pressures were determined using Equation. (2), (3), & (4) and provided
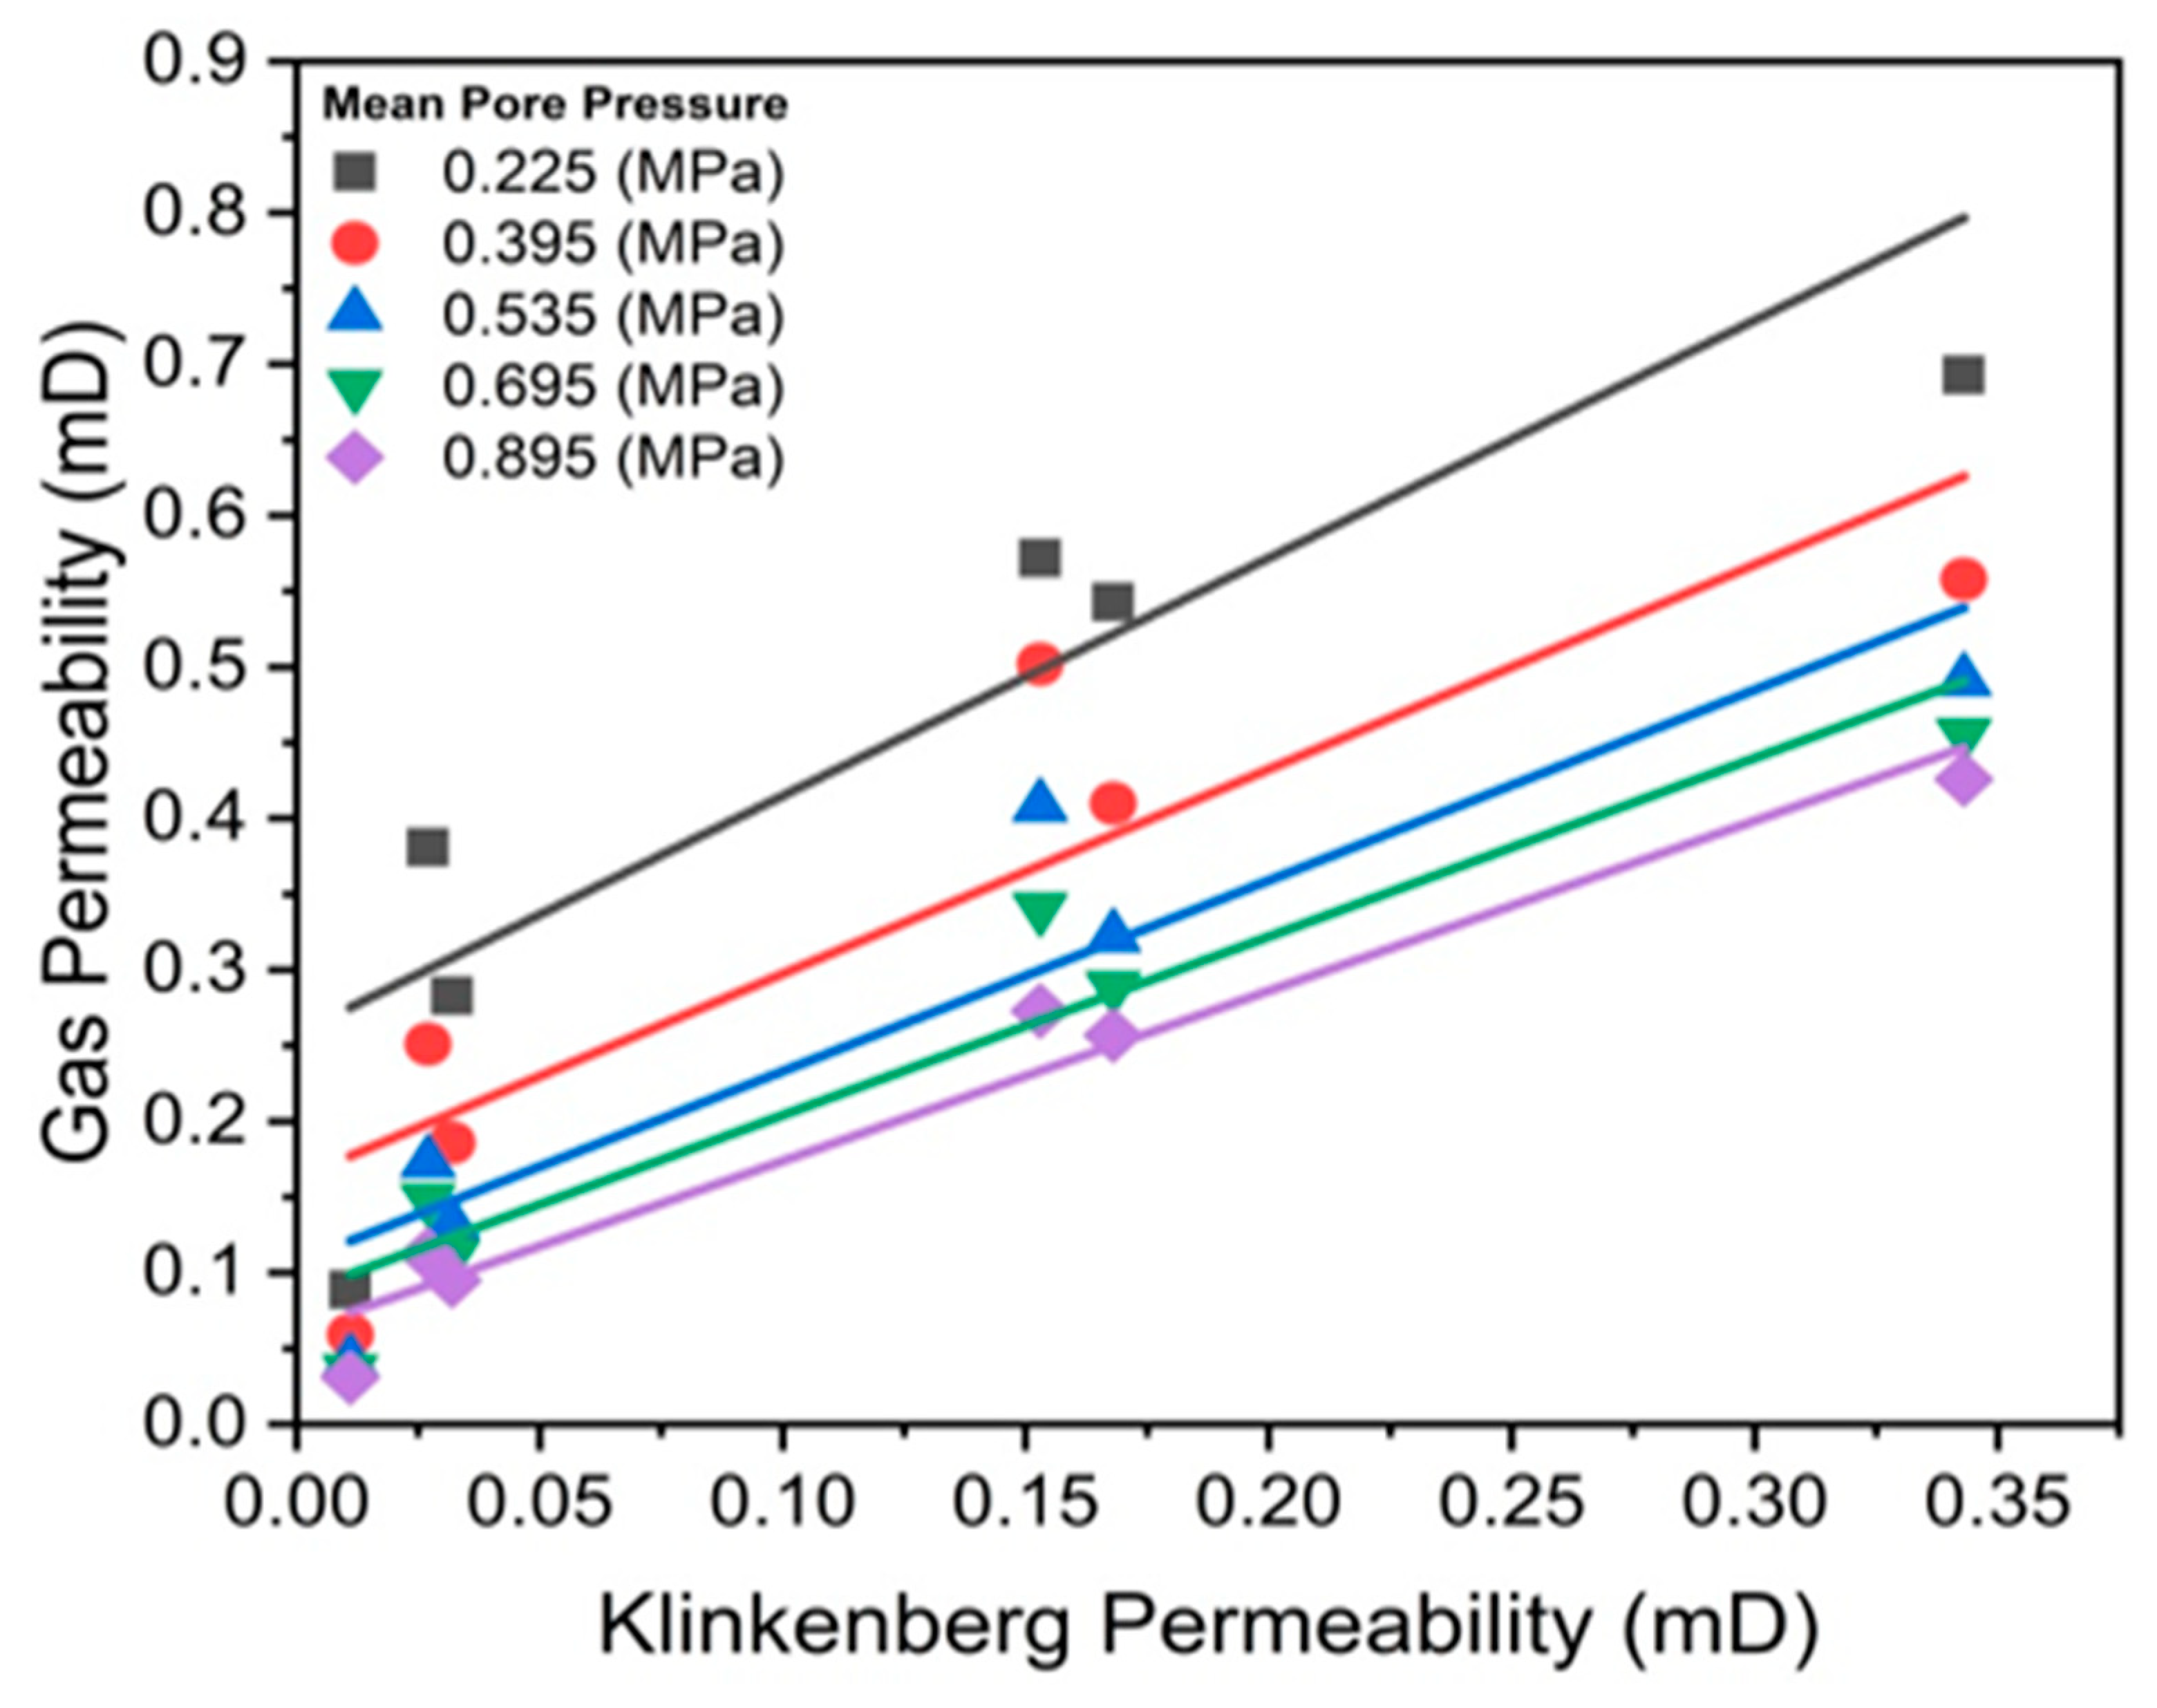
Table 3. The linear relationship between
k∞ and
kg at various mean pore pressures was also observed using Equation (5) and illustrated in
Figure 13.The corrected Klinkenberg permeability did not precisely match the average gas permeability at different mean pore pressures. This discrepancy can be attributed to the heterogeneity of carbonate rock and varying pore throat geometry of different lithofacies caused by diagenesis. Sample #03 is the only one that closely approximates the experimental results, with an average gas permeability of 0.21mD, which is somewhat close to corrected Klinkenberg permeability 0.11mD, as mentioned in
Table 3. Carbonates possess secondary porosity and fracture permeability due to their heterogeneity. Therefore, laboratory measurements of reservoir properties, such as special core analysis (SCAL) are essential for understanding reservoir performance.
3.7. Effect of Overburden Stress
Overburden stress can significantly reduce the permeability of low-permeable reservoirs, with a profound impact on pore morphology, geometry, and petrophysical properties. Carbonate reservoirs are particularly sensitive due to their complex lithofacies and diagenetic processes, which affects the reservoir quality and recovery [
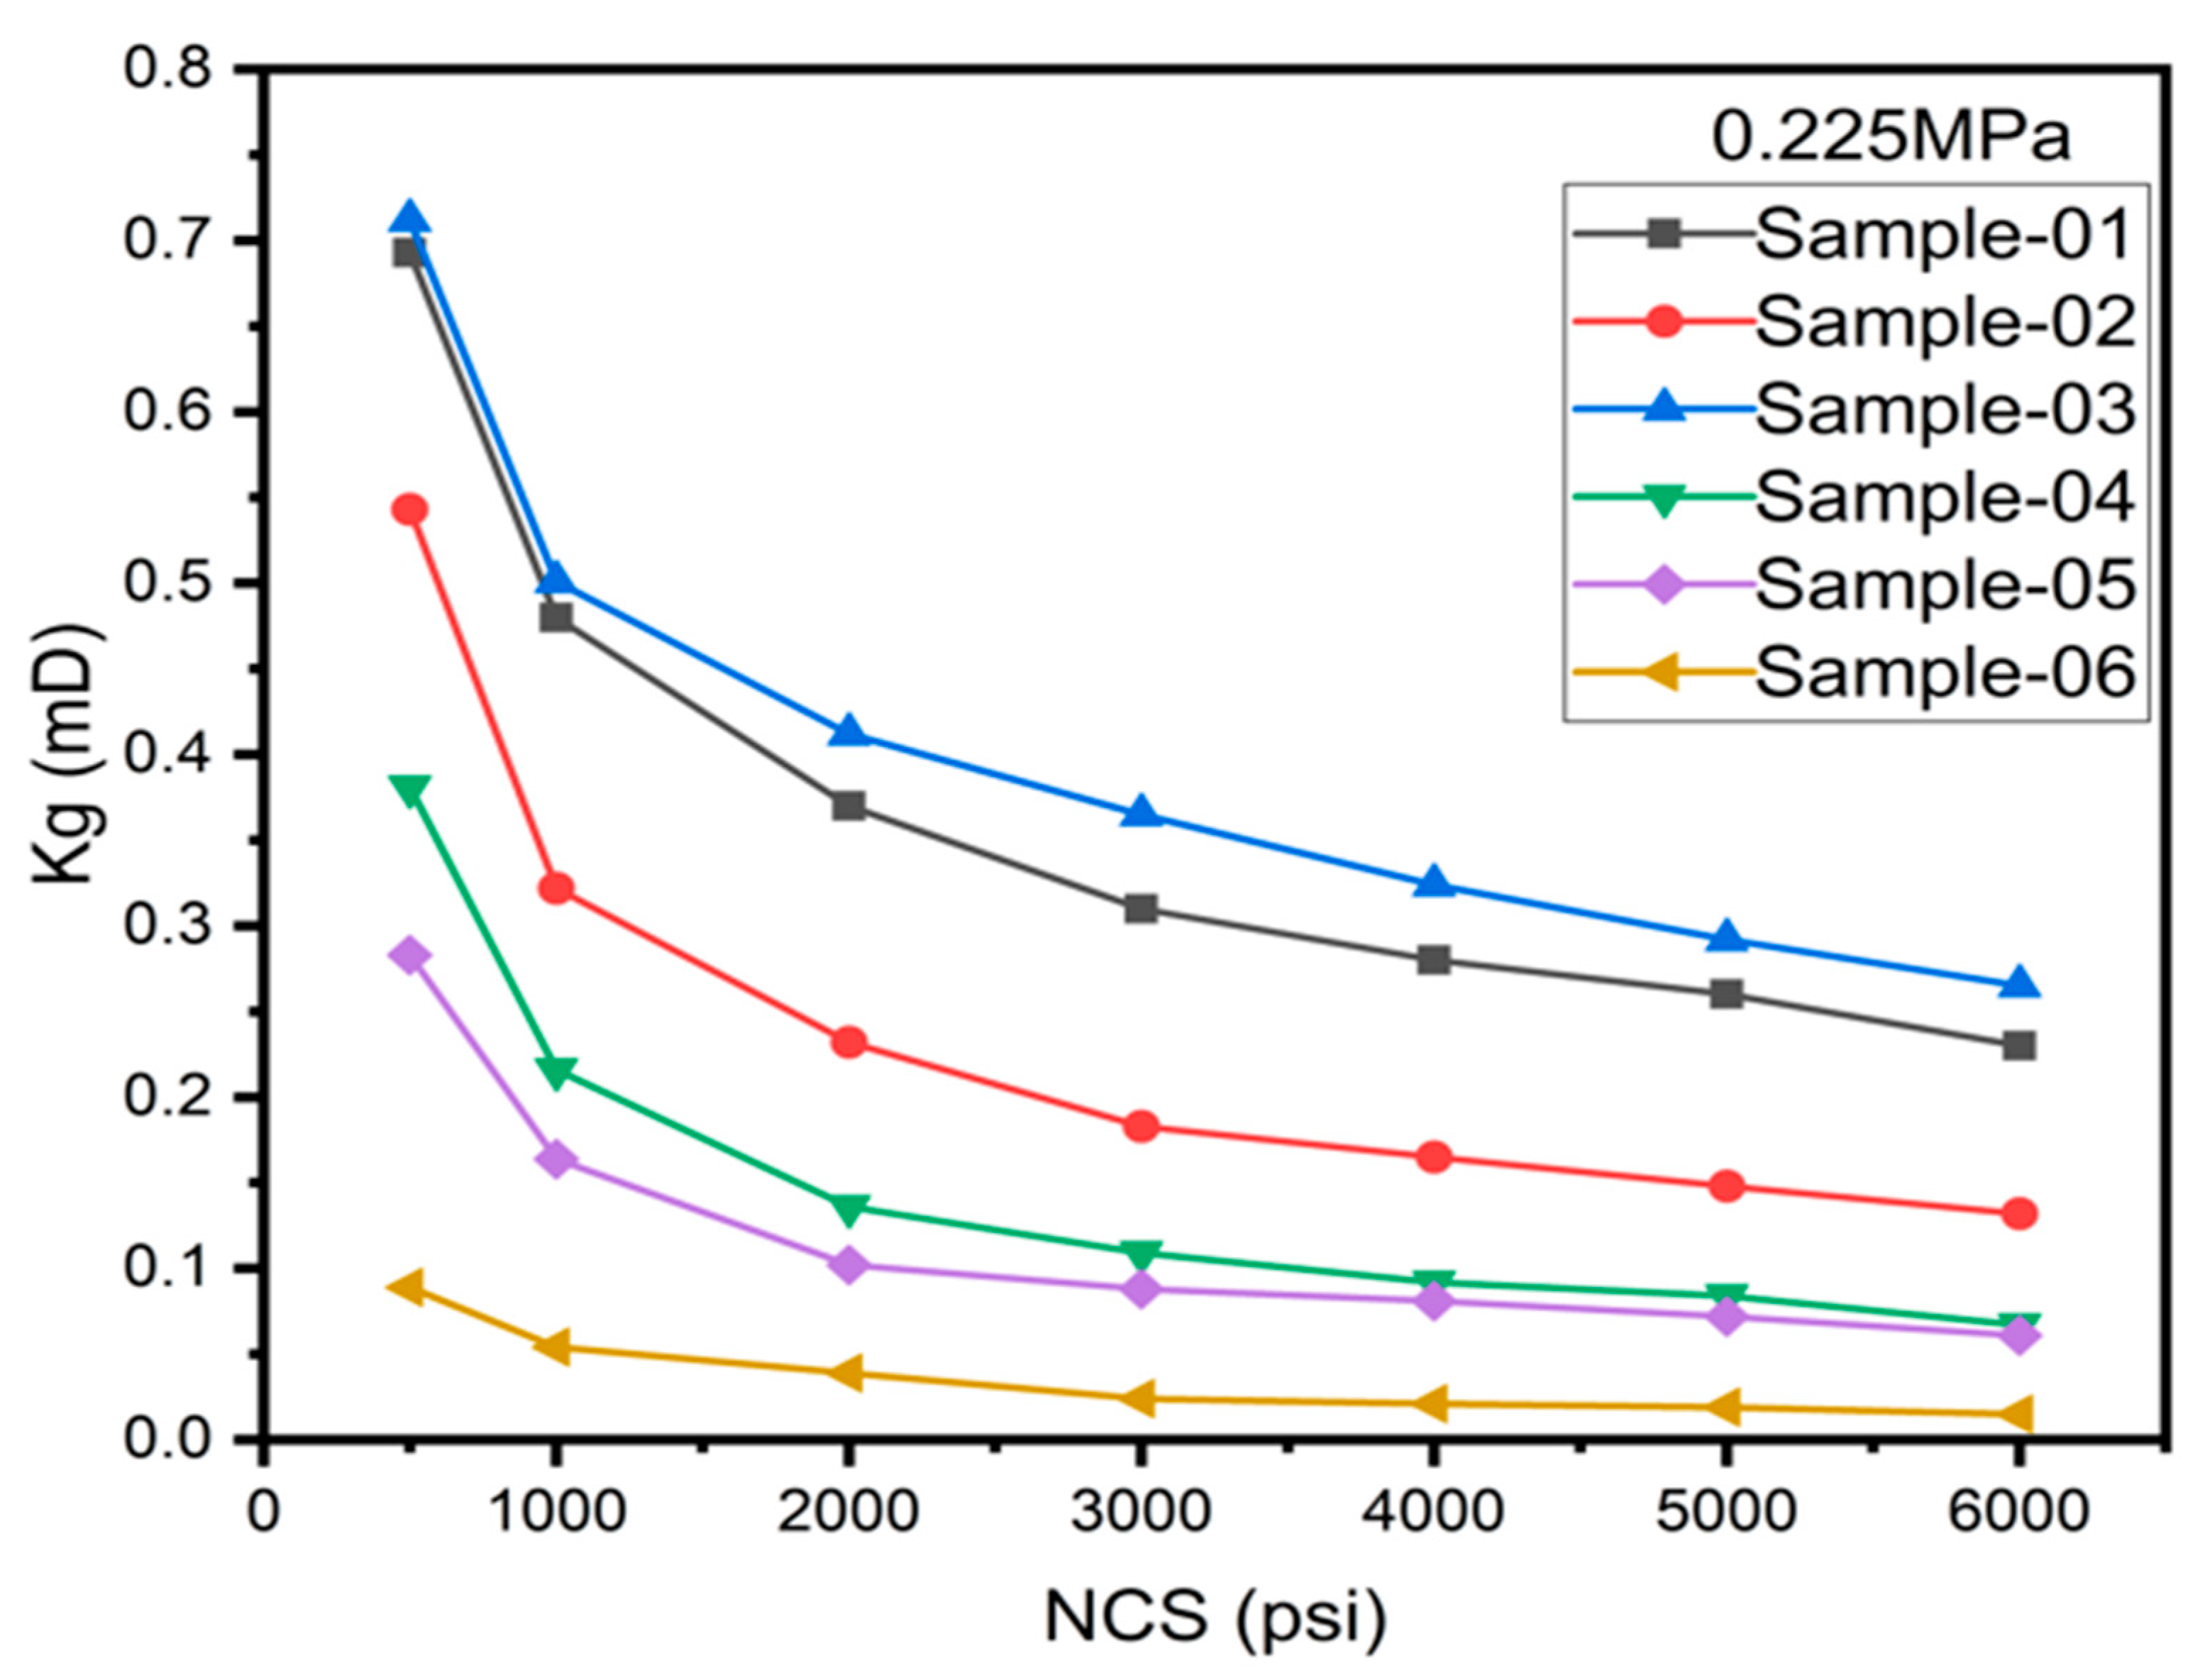
20]. According to experimental findings using Equation (6) & (7), gas permeability exhibits an inverse relationship and decreases with an increase in net stress, as illustrated in
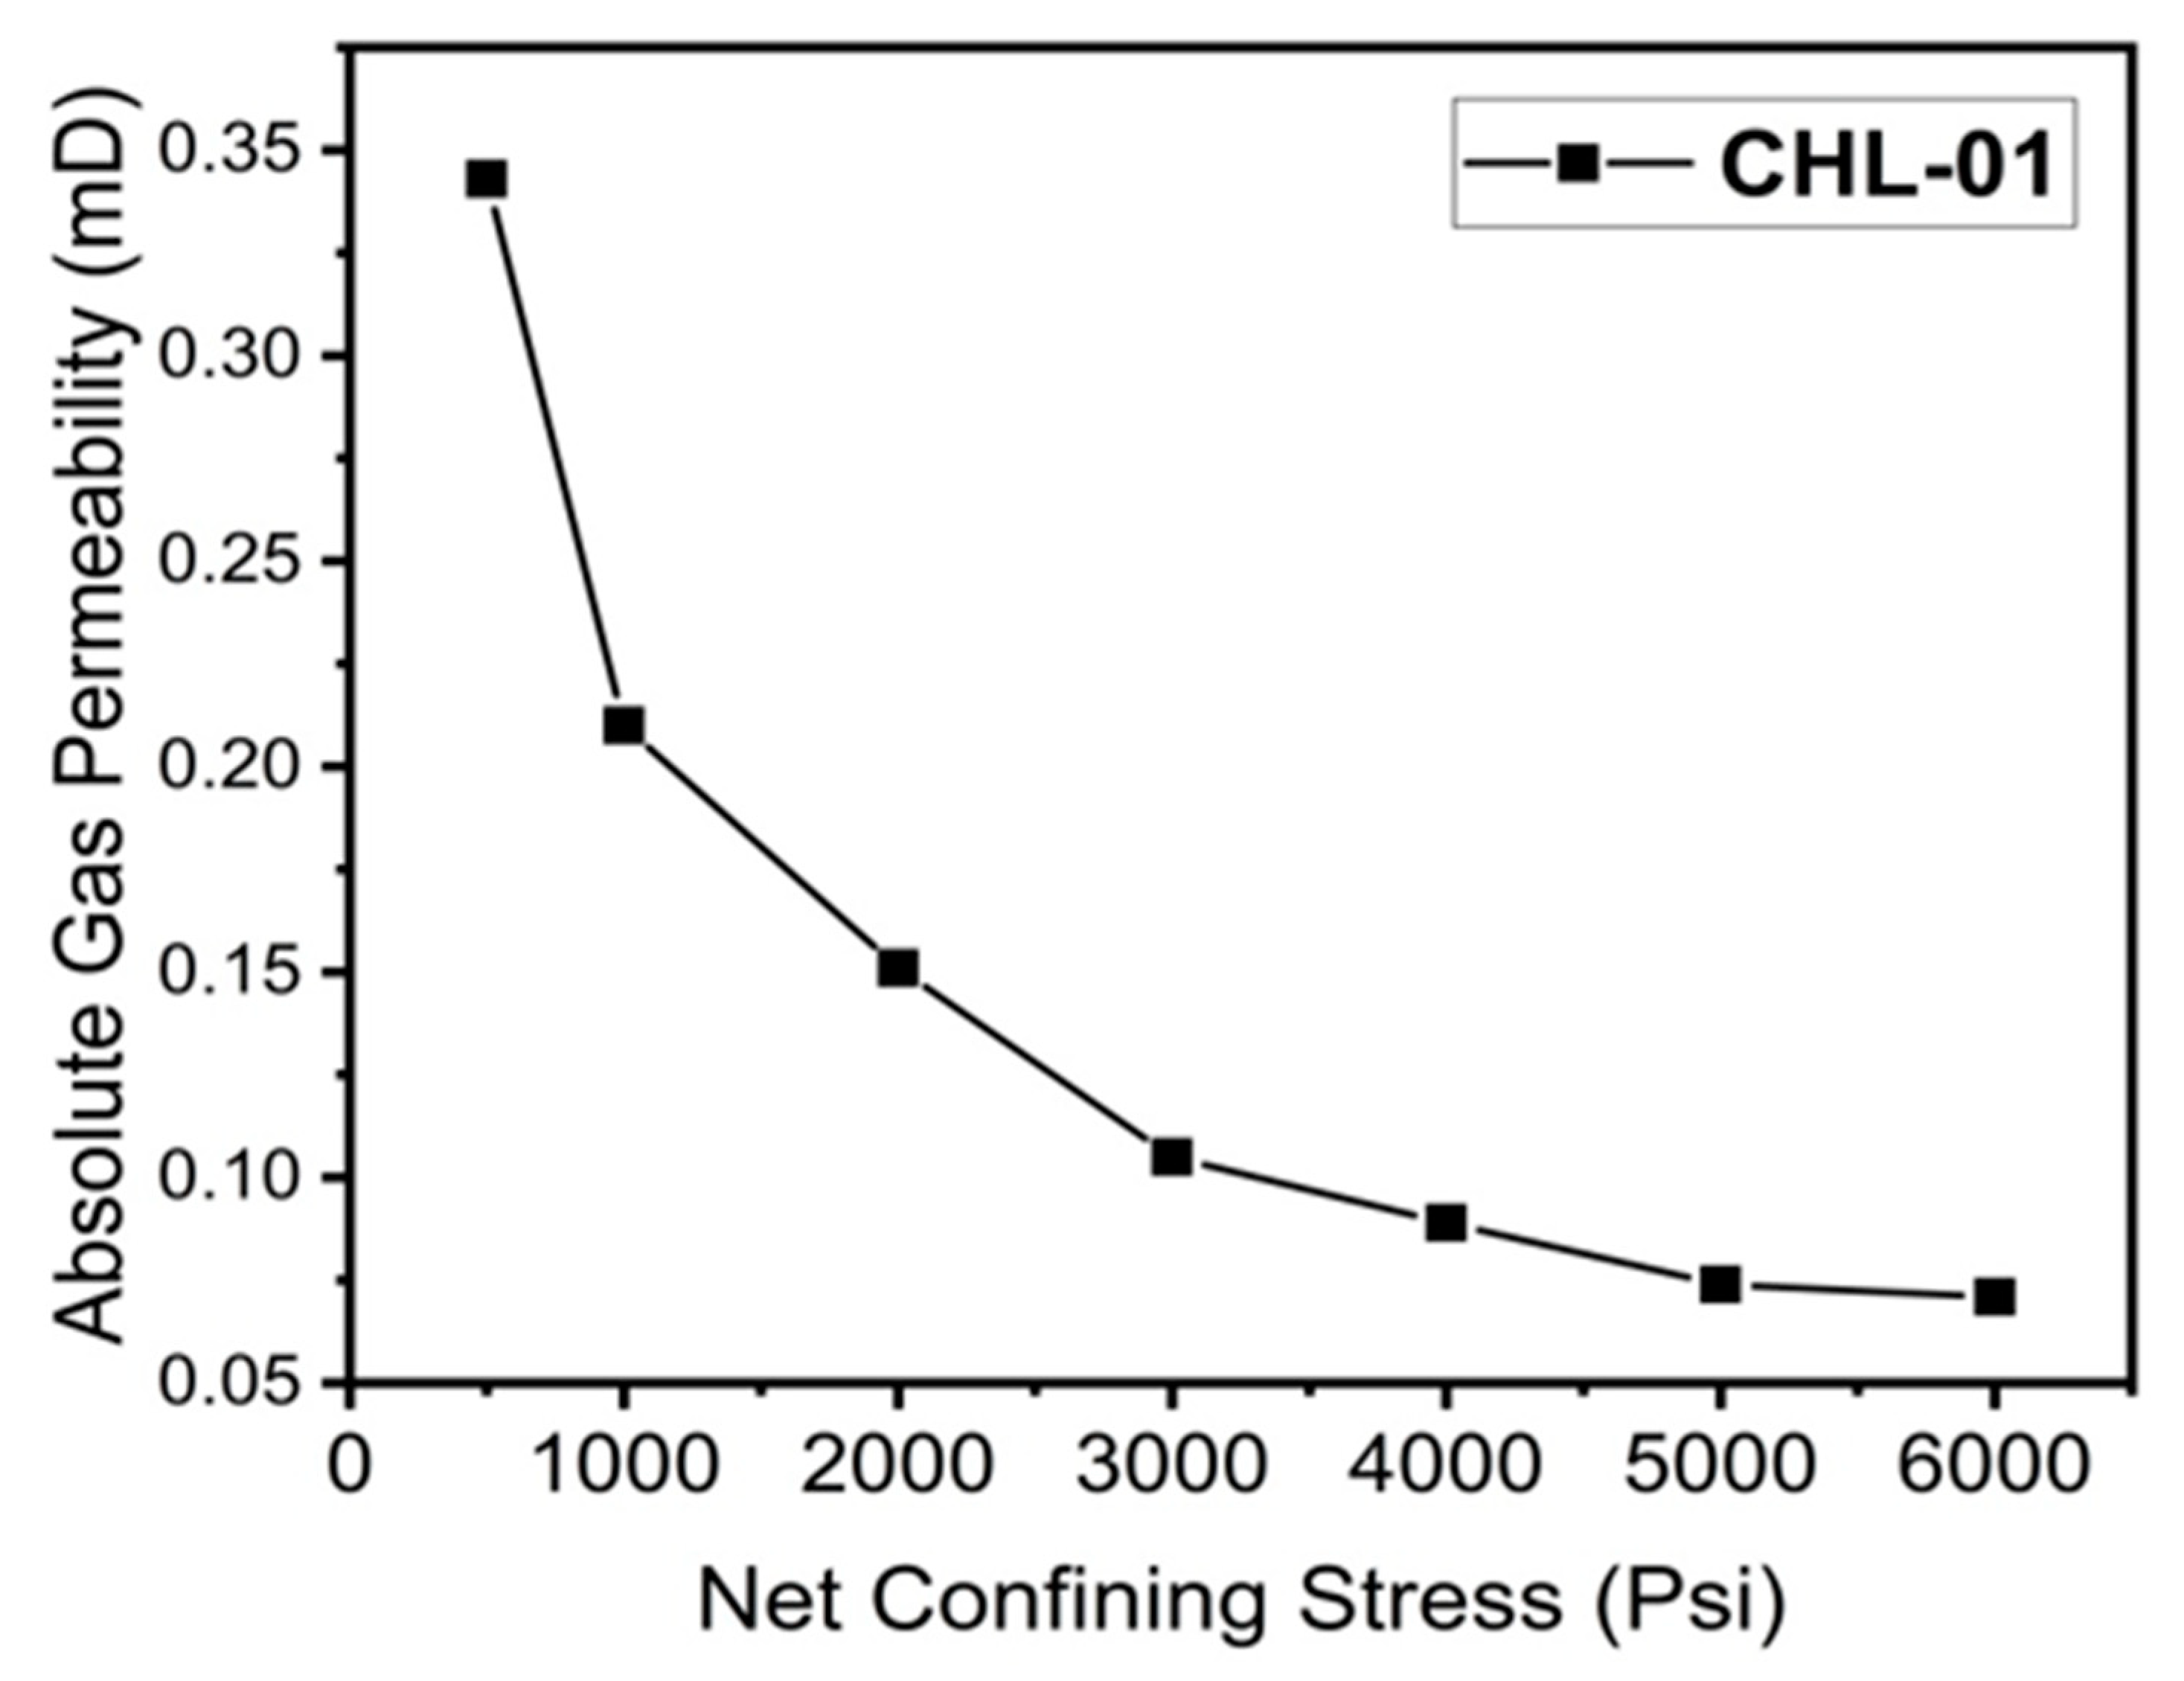
Figure 14. This suggests that an increase in net stress leads to a decrease in pore pressure, resulting in increased permeability due to the gas slippage effect. This effect allows gas to flow more easily through the pores. Furthermore, it was observed that an increase in net stress resulted in a decrease in absolute permeability, as shown in
Figure 15.
This implies that at lower stress levels, an increase in net stress leads to a decrease in permeability due to gas slippage effect, which becomes less pronounced at high pore pressure. The increased flow due to slippage effect compensates for the reduction in slip-adjusted permeability, resulting in larger decrease in permeabilities at higher net stresses and low pore pressures. The higher reduction in permeability at lower overburden stress was confirmed through micro-cracks, as identified in few samples by SEM and thin section analysis shown in
Figure 4 and
Figure 8. These micro-cracks at grain boundaries increase the permeability at lower confining stress. The variation in effective stress and pore pressures is the primary cause of changes in gas permeability. Therefore, it is essential to analyze the relationship between net stresses and gas slippage to evaluate their impact on reservoir pore radius [
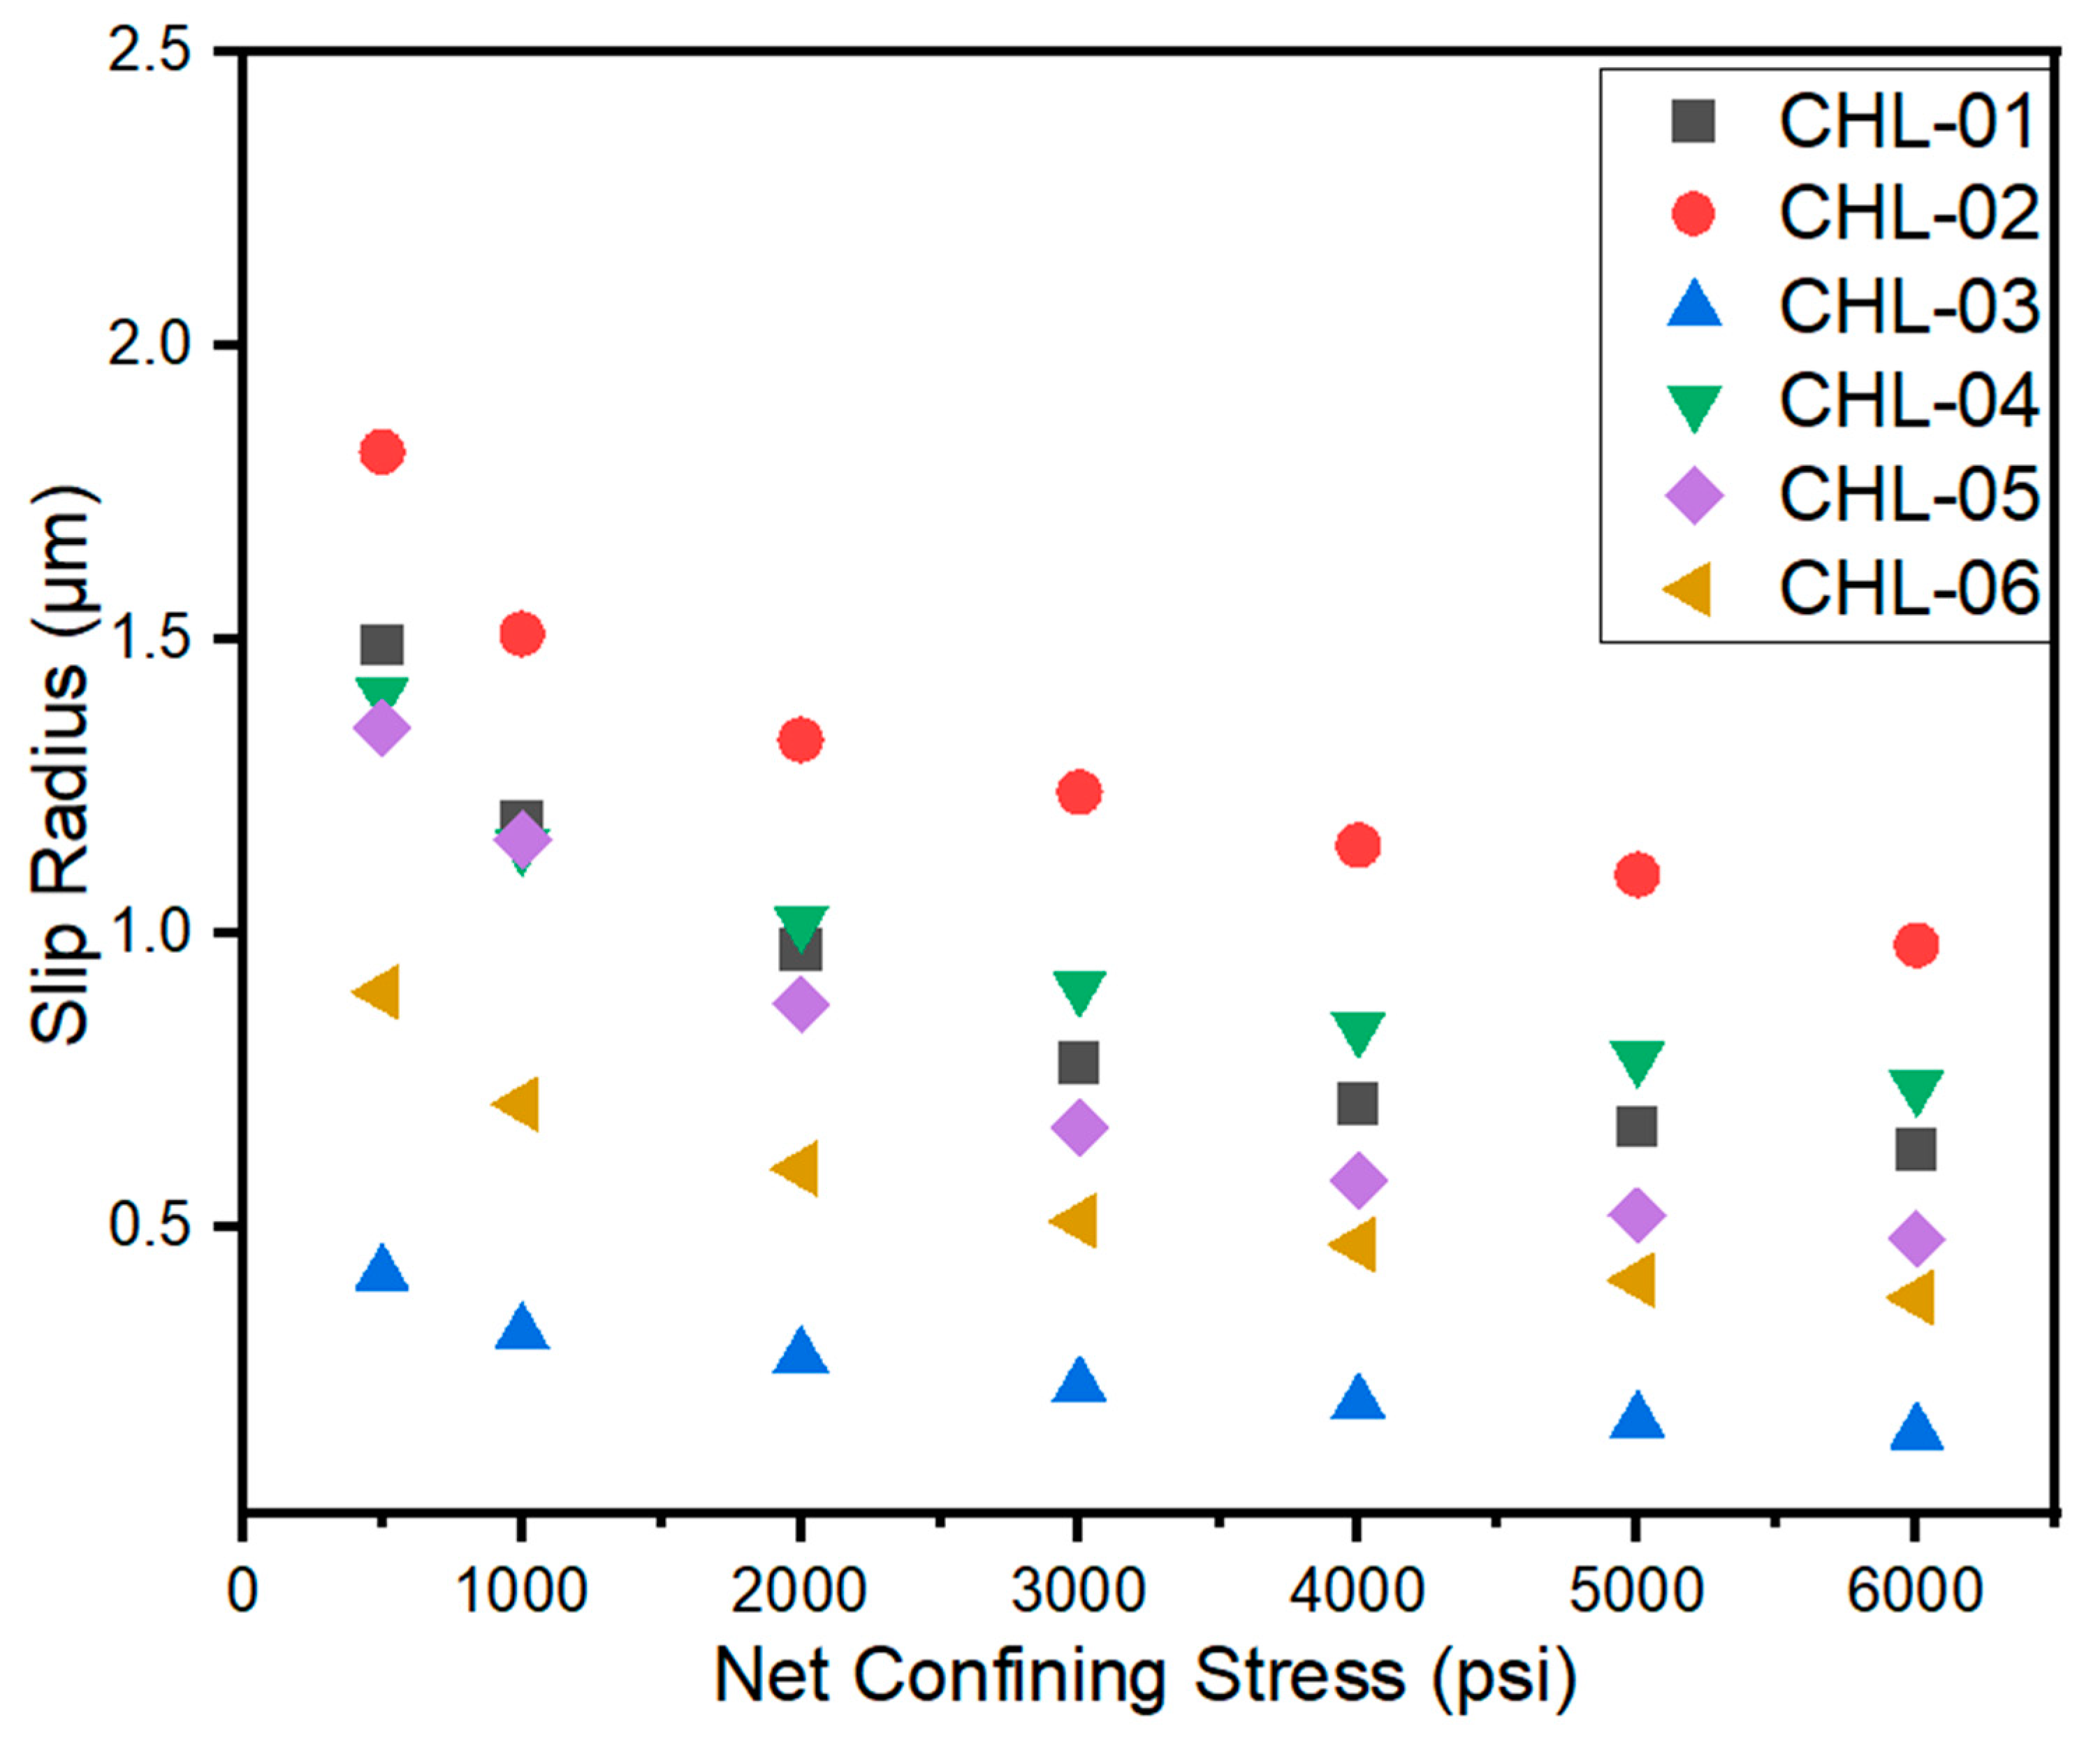
32]. However, the slippage radius values calculated at different confining stresses using model Equation (7) are illustrated in
Figure 16. The observed slippage radius decreases with increasing net stress in steady-state and pulse-decay measurements. This indicates that the compaction of observed micro-cracks, as identified through SEM and thin section analysis, causes a lower reduction in permeability at net confining stress. It implies that permeability below 01mD is more sensitive to net overburden stress. The permeability drop in heterogeneous carbonates cannot be generalized for all types of low permeable reservoirs. Therefore, the permeability of the examined samples demonstrated a continuous decline under increased net confining stress, especially with very low initial absolute permeability.
Figure 1.
Tectonic history of adjoining regions of the study area.
Figure 1.
Tectonic history of adjoining regions of the study area.
Figure 2.
Stratigraphic column of the study area showing petroleum play of different formations.
Figure 2.
Stratigraphic column of the study area showing petroleum play of different formations.
Figure 3.
Schematic workflow of the Chiltan carbonate formation.
Figure 3.
Schematic workflow of the Chiltan carbonate formation.
Figure 4.
Thin section microphotographs of the Chiltan formation displaying identified microfacies MF1 (a-b), MF2 (c-d) and MF3 (e-f). pallets (PT), intraclasts (IT), gastropods (GT), bioclasts (BT), bivalves (BV), silicic clasts (SC), peloids (PL), echinoderms (EC), ooids (OD), foraminifera (FR), matrix (MT), Stylolite disintegration (SD), vuggy porosity (VP), cement filled evaporate (FM), spar cement (SpC), fracture porosity (FP), micrite cement (Mic), branchiopods (BD), neo-morphed Algae (ALG).
Figure 5.
Showing thin section microphotographs (a, c, and e-h) and SEM microphotographs (b and d) of the Chiltan carbonate formation indicating different diagenetic features. Cement micritization (MIC), Dissolution of stylolite (DST), Dissolution of bioclasts (DBT), Dissolution of micrite cement (DM), Intragranular pores (IGP), Drusy cement (DC), Fracture enlargement (FE), Isopach fibrous cement (IF), Angular mosaic cement (GM), Dolomite crystals (DC), Blocky cement (BC), Spar cement (SC), Calcite filled fractures (CF), Physical compaction (PC), Low magnesium calcite (LC), Replacement and recrystallization (RPC), Grain Dissolution (GD), fracture dissolution (FD), ferron dolomite crystals (FE-DC), micrite envelop (MCE), clay minerals (GM).
Figure 6.
Schematic Depositional phases and diagenetic environments proposed for the Chiltan Limestone.
Figure 6.
Schematic Depositional phases and diagenetic environments proposed for the Chiltan Limestone.
Figure 7.
Sequential occurrences of diagenetic events and features with impacts on reservoir quality.
Figure 7.
Sequential occurrences of diagenetic events and features with impacts on reservoir quality.
Figure 8.
SEM microphotographs (a, b, and c) and EDS Patterns of studied Chiltan formation indicating various minerals and diagenetic features. Dissolution pores (DP), intragranular pores (IGP), silici-clastic minerals (S-CM), intracrystalline pores (ICP), micrite (Mic), dolomite crystals (DC).
Figure 8.
SEM microphotographs (a, b, and c) and EDS Patterns of studied Chiltan formation indicating various minerals and diagenetic features. Dissolution pores (DP), intragranular pores (IGP), silici-clastic minerals (S-CM), intracrystalline pores (ICP), micrite (Mic), dolomite crystals (DC).
Figure 9.
FTIR analysis of Chiltan carbonate formation.
Figure 9.
FTIR analysis of Chiltan carbonate formation.
Figure 10.
(a) Relationship between Porosity Vs Bulk Density, (b) relationship between Permeability Vs Porosity.
Figure 10.
(a) Relationship between Porosity Vs Bulk Density, (b) relationship between Permeability Vs Porosity.
Figure 11.
Measured gas permeability versus reciprocal mean pore pressure of sample # 03.
Figure 11.
Measured gas permeability versus reciprocal mean pore pressure of sample # 03.
Figure 12.
Relationship between gas slip factors versus measured gas permeability of studied carbonate samples.
Figure 12.
Relationship between gas slip factors versus measured gas permeability of studied carbonate samples.
Figure 13.
Relation between Corrected Klinkenberg Permeability versus measures gas permeability at different mean pore pressures.
Figure 13.
Relation between Corrected Klinkenberg Permeability versus measures gas permeability at different mean pore pressures.
Figure 14.
Permeability versus Net confining stress relation.
Figure 14.
Permeability versus Net confining stress relation.
Figure 15.
Relationship between Absolute gas permeability and Net confining stress.
Figure 15.
Relationship between Absolute gas permeability and Net confining stress.
Figure 16.
Slip radius as a function of net confining stress.
Figure 16.
Slip radius as a function of net confining stress.
Table 1.
Petrographic illustration of visual estimates for observed microfacies of the Chiltan formation.
Table 1.
Petrographic illustration of visual estimates for observed microfacies of the Chiltan formation.
| Microfacies |
Carbonate Grains |
Cement |
Estimated Visual Porosity (Thin Section) |
Dominant
Pore Type |
Diagenetic Features |
Depositional Environment |
| Lithology |
Bio-clasts % |
Intraclasts/ Echinoderm % |
Peloids/ Ooids % |
Calcite % |
Micrite % |
Intra-clastic
Ooidal packestone |
05% |
20% |
10% |
35% |
25% |
Bad porosity up-to 5% |
Primary porosity is limited. Secondary porosity is developed because of Stylolization |
Intra-Formational Clasts, Calcite veins, Neomorphism stylolization |
Shoal |
| Bioclastic grainstone |
25% |
25% |
15% |
20% |
13% |
Bad porosity up-to 2-3% |
Primary porosity is limited. Secondary porosity developed due to grain dissolution |
Calcite vein, Cementation, Dissolution, Dolomitization |
Lagoon |
| Pelliodal Packestone |
15% |
05% |
15% |
40% |
20% |
Bad porosity up-to 2-5% |
Primary porosity is limited. Secondary porosity developed due to grain dissolution |
Calcite vein, Cementation, Dissolution, Dolomitization |
Lagoon |
Table 2.
Mineral composition of Chiltan limestone.
Table 2.
Mineral composition of Chiltan limestone.
| Element |
Atomic No. |
Mass Norm. % |
Weight, % |
| Oxygen |
8 |
50.90 |
71.46 |
| Calcium |
20 |
42.09 |
23.59 |
| Iron |
26 |
1.92 |
0.77 |
| Aluminum |
13 |
0.94 |
078 |
| Silicon |
14 |
2.86 |
2.29 |
| Sulphur |
16 |
0.43 |
0.30 |
| Magnesium |
12 |
0.57 |
0.53 |
| Sodium |
11 |
0.28 |
0.28 |
Table 3.
Gas Permeability Data sheet and adjusted parameters at different mean pore pressures @ 500psi stress condition.
Table 3.
Gas Permeability Data sheet and adjusted parameters at different mean pore pressures @ 500psi stress condition.
| Sample ID: |
Parameters |
Mean Pore Pressure |
Klinkenberg Permeability (mD) |
| 0.225 |
0.395 |
0.535 |
0.695 |
0.895 |
| 23-CHL-01 |
Gas Permeability (Kg), mD |
0.693 |
0.558 |
0.491 |
0.45 |
0.426 |
0.343 |
| Slip radius (rslip), µm |
1.5 |
1.39 |
1.49 |
1.59 |
1.59 |
| Gas slip factor (bk), psi |
14.01 |
26.52 |
33.49 |
40.78 |
52.56 |
| 23-CHL-2A |
Gas Permeability (Kg), mD |
0.543 |
0.41 |
0.322 |
0.289 |
0.257 |
0.168 |
| Slip radius (rslip), µm |
0.68 |
0.6 |
0.7 |
0.69 |
0.72 |
| Gas slip factor (bk), psi |
30.64 |
60.94 |
71.14 |
94.32 |
115.06 |
| 23-CHL-03 |
Gas Permeability (Kg), mD |
0.089 |
0.059 |
0.042 |
0.036 |
0.031 |
0.011 |
| Slip radius (rslip), µm |
0.21 |
0.2 |
0.22 |
0.21 |
0.21 |
| Gas slip factor (bk), psi |
175.2 |
184.6 |
218.72 |
236.7 |
246.3 |
| 23-CHL-4B |
Gas Permeability (Kg), mD |
0.712 |
0.502 |
0.408 |
0.341 |
0.273 |
0.153 |
| Slip radius (rslip), µm |
0.41 |
0.38 |
0.38 |
0.4 |
0.48 |
| Gas slip factor (bk), psi |
50.15 |
96.5 |
129.36 |
160.94 |
170.36 |
| 23-CHL-05 |
Gas Permeability (Kg), mD |
0.381 |
0.251 |
0.173 |
0.149 |
0.112 |
0.027 |
| Slip radius (rslip), µm |
0.12 |
0.1 |
0.19 |
0.11 |
0.12 |
| Gas slip factor (bk), psi |
179.18 |
185.7 |
190.3 |
204.5 |
210.4 |
| 23-CHL-06 |
Gas Permeability (Kg), mD |
0.283 |
0.186 |
0.132 |
0.112 |
0.095 |
0.032 |
| Slip radius (rslip), µm |
0.19 |
0.18 |
0.21 |
0.2 |
0.19 |
| Gas slip factor (bk), psi |
107.67 |
243.6 |
242.54 |
251.2 |
263.1 |
