
Submitted:
18 October 2023
Posted:
19 October 2023
You are already at the latest version
Abstract
The effect of plasma electrolytic nitrocarburizing on the wear resistance of carbon tool steel in friction couples with hardened steel and lead-tin bronze is considered. The microgeometry of friction tracks and its change with increasing duration of friction tests are analyzed. The equilibrium roughness is determined, which is optimal for the friction couple and ensures minimal wear. The type and mechanism of wear of carbon tool steel after plasma electrolytic nitrocarburizing has been determined. The optimal values of the plasma electrolytic nitrocarburizing parameters, which provide the lowest values of the friction coefficient and weight wear, have been determined. The phase and elemental composition of the surface layer was studied using X-ray diffraction analysis and EDX analysis. The relationship of the microstructure of the nitrocarburized layer of tool steel with the friction coefficient and weight wear is established.
Keywords:
plasma electrolytic treatment
; nitrocarburizing
; tool steel
; microhardness
; wear resistance
1. Introduction
Tool carbon steels are characterized by low hardness and good machinability by cutting and pressure in the annealed state. One of the applications of such steels is the manufacture of cutting tools. The steel must have a high hardness in the cutting edge, much higher than the hardness of the material being machined and high wear resistance. Wear resistance is necessary to maintain the size and shape of the cutting edge during cutting. Increasing the wear resistance of the surfaces of products made of tool steels is relevant and promising in various industries [1,2,3,4,5,6,7].
One of the ways to increase hardness and wear resistance is nitrocarburizing [8,9,10]. This method of surface modification has a number of advantages. With simultaneous diffusion of carbon and nitrogen in austenite, the diffusion of carbon is accelerated. Nitrogen increases the content of residual austenite in the structure of the nitrocarburized layer. Retained austenite delays the occurrence of fatigue failures and increases the fatigue strength of nitrocarburized parts. The presence of nitrogen in the solid solution increases the stability of supercooled austenite. In this regard, nitrocarburized layers have a higher hardenability than cemented ones.
The disadvantages of traditional nitrocarburizing include the need to strictly maintain the carburizing and nitriding capacity of the gaseous medium within the required limits. In conventional ovens, a surface concentration of saturating elements of 1% is reached in a few hours. The same result is obtained in a few seconds in the case of plasma electrolytic treatment [11,12,13,14,15,16,17,18,19]. Hence, the prospects of using plasma electrolytic nitrocarburizing (PENC) for the intensification of chemical-thermal treatment are obvious.
The purpose of this work is to study the effect of PENC on the wear resistance of carbon tool steel, to determine the type and mechanism of wear, to establish the effect of the obtained structure of the nitrocarburized layer on wear resistance characteristics, and to calculate the equilibrium roughness in tribocontact. Research is carried out in different friction pairs: on-hardened tool alloy steel and tin-lead bronze. The combination of heat-treated steel in a friction pair with bronze is widely used for various interfaces in industry. For example, for sliding bearings of various types, worm gears, screw-nut interfaces bushings and guides for injection molding machines. The friction of hardened steel on hardened steel is also widespread, for example, in bearings and rolling guides, machine tool slideways, gears, and so on. The choice of widely used materials for friction interfaces determines the relevance of the study.
2. Materials and Methods
Tool carbon steel was used for PENC (wt.%: 0.76–0.83 C; 0.17–0.33 Si; 0.17–0.33 Mn; ≤0.25 Ni; ≤0.028 S; ≤0.03 P; ≤0.2 Cr; ≤0.25 Cu and balance Fe). The cylindrical samples had a diameter of 10 mm and a height of 15 mm.
PENC was carried out in an aqueous electrolyte solution of the composition: ammonium chloride NH4Cl (10%) and carbamide (NH2)2CO (20%). Carbamide is both a source of nitrogen and carbon, characterized by low cost and environmental safety. The treatment temperature was 650, 800, 850, and 900 °C. The duration of the PENC was 5 minutes. Quenching was carried out from a single-phase austenitic region. Samples after PENC at temperatures from 800 to 900 °C were quenched from the diffusion saturation temperature. The sample after PENC at 650 °C was quenched from a temperature of 800 °C. Quenching was carried out by switching off the voltage, as a result of which the vapor-gas envelope condensed and the contact of the sample with the cold electrolyte resumed. Two types of control samples were used in the work: raw untreated and heated in an oven to 800 °C and then quenched in oil.
PENC was carried out in a cylindrical working chamber (Figure 1). The electrolyte was fed into the working chamber using a pump, and the flow rate was controlled by a rotameter. The electrolyte temperature at the outlet of the heat exchanger was recorded with multimeter using a chromel-alumel thermocouple. The samples were attached to the positive output of the power source, and the electrolyzer was attached to the negative output. After voltage was applied to the system, the samples were immersed in the electrolyte to a depth equal to their height.
The Phenom G2 pro scanning electron microscope (SEM) (Phenom-World B.V., Eindhoven, The Netherlands) with digital image visualization served to study the microstructure of the cross-section of the steel samples. Determination of the nitrogen concentration on the modified surface was performed by EDX analysis on the same microscope.
The microhardness of the cross sections of the treatment sample was measured using a Vickers microhardness tester (Falcon 503, Innovatest Europe BV, Maastricht, Netherlands) under a 0.1-N load. According to 5 measurements, the average value of microhardness was found.
The surface roughness and parameters of the microgeometry of the friction tracks’ surface were measured with a Hommel tester t8000 profilometer (Jenoptik, Jena, Germany). The change in the weight of the samples was determined on a CitizonCY224C electronic analytical balance (ACZET (Citizen Scale), Mumbai, India) with an accuracy of ±0.0001 g after removing traces of salts by washing the samples in distilled water and subsequently drying.
X-ray diffraction (XRD) analysis was used to determine the phase composition of the samples. The XRD patterns were obtained by PANalytical Empyrean X-ray diffractometer (Malvern Panalytical, Malvern, UK) with CoKα radiation by a simple scanning mechanism in the theta-2theta-mode with a step of 0.026° and a scanning rate of 4.5°/min. Phase composition analysis was performed using the PANalytical High Score Plus software, software [20] and the ICCD PDF-2 and COD databases [21].
Friction tests were carried out according to the shaft-block scheme (Figure 2). The cylindrical sample was rotated at the required frequency. The counter body was a 2 mm thick rectangular plate. For the manufacture of counter bodies, two types of materials were used: tool alloy steel (wt.%: 0.9–1.2 Cr, 1.2–1.6 W, 0.8–1.1 Mn, 0.9–1.05 C and balance Fe) and tin-lead bronze (wt.%: 4–6 Pb; 4–6 Zn; 4–6 Sn and balance Cu). There was a semicircular cutout on one of the edges of the plate. The cutout tightly covered the surface of the sample. This kept the contact area of the friction pair constant. The pressing force was created using a pneumatic cylinder. The required value of the pressing force was set by the value of the air pressure in the cylinder. The design of the friction machine ensured that the alignment of the sample and the counter body was maintained despite the wear of the friction pair during testing. The measurement of the values of the forces required to calculate the friction coefficient was carried out using load cells. The temperature in the interface zone of the friction couple was measured on the friction track at the exit point from the contact area of the bodies using an infrared thermometer. Load cells and an infrared thermometer were interrogated using a microcontroller with a period of 0.3 seconds with the transmission of measurement results to a PC. Friction tests were carried out in dry friction mode under a load of 10 N. The sliding speed of the sample along the counter body was 1.555 m/s. The friction path was 1000 m.
3. Results
3.1. Energy characteristics of PENC
Figure 3 and Figure 4 show the current-voltage and temperature-voltage characteristics of the PENC. The energy of the power source is released in the zone of greatest resistance, that is, in the near-electrode region of the electrolyte. Therefore, heat will go from the electrolyte to the electrode. The formation of a vapor-gas envelope is a consequence of local boiling of the electrolyte due to internal heat sources due to the passage of an electric current [22,23,24]. The current-voltage characteristic has a falling character, since the thickness of the envelope increases with increasing voltage, and its electrical resistance increases (Figure 3). The temperature-voltage characteristic increases due to an increase in the power introduced into the system (Figure 4). The sample temperature in the range of 400–1000 °C is regulated by voltage, which allows hardening.
3.2. Composition, structure and microhardness of the surface layer
Quenching after PENC provides high cooling rates, on the order of hundreds of degrees per second [25]. This cooling rate is higher than the critical one for this steel. Therefore, the microstructure of all PENC samples is an acicular martensite (Figure 5) with a characteristic high hardness (Figure 6).
EDX analysis showed the enrichment of the surface layer of the samples with nitrogen at all processing temperatures (Table 1). The largest amount of nitrogen on the surface was recorded for the sample after PENC at 650 °C and decreases with its increase.
According to X-ray diffraction data, the surface layer of samples nitrocarburized at a temperature of 650°C contains iron nitrides and carbides (Figure 7). X-ray analysis of samples after PENC at higher temperatures revealed less intense peaks of iron nitrides (Figure 8 and Figure 9). With an increase in the PENC temperature, the peaks corresponding to iron oxides become the most intense and developed in the X-ray patterns. The formation of oxides is a consequence of the high-temperature oxidation of iron in the gas-vapor envelope, since the main component of the envelope is water vapor.
3.3. Tribological properties of treated surface
Figure 10 shows the dependence of the friction coefficient on the sliding distance of PENC samples. As control samples, raw and quenched into oil after heating in a furnace to a temperature of 800 °C are presented. The counter body is made of hardened steel. The running in of PENC samples occurred earlier than that of the control ones. For a raw sample and a sample after traditional oil quenching, the friction coefficient decreases markedly after the first 250 meters of the test. For PENC samples, steady wear occurs earlier, after about 100 meters of testing. After the first 100 meters of the path, the friction coefficient of PENC samples changes insignificantly.
The smallest value of the friction coefficient of 0.179 is shown by a sample nitrocarburized at a temperature of 650 °C and hardened from 800 °C (Figure 11). The minimum value of the friction coefficient is 2.8 times less than that of a raw untreated sample and 2.2 times less than that of a sample after traditional hardening. With an increase in the PENC temperature, the friction coefficient gradually increases to a value of 0.256 at temperatures of 850–900 °C. The maximum value of the friction coefficient for samples after PENC is 2 times lower than for raw and 1.5 times lower than for quenched in the traditional way.
The results of measurements of the friction coefficient correlate with the dependences of the weight loss of the sample during friction tests (Figure 12). The smallest weight loss is recorded for the sample with the minimum friction coefficient after PENC at 650 °C with quenching from 800 °C. In this case, the weight loss due to friction is 9.7 times less than that of the raw one and 7.5 times less compared to the sample after traditional hardening. An increase in the PENC temperature leads to an increase in weight friction losses in accordance with an increase in the friction coefficient (Figure 11 and Figure 12). At all PENC temperatures, the weight loss during friction in PENC samples is lower than in two control samples.
The smallest weight loss of the hardened steel counter body (Figure 13) is achieved after working in tandem with the sample after PENC at 650 °C, which is characterized by the lowest friction coefficient during the entire test (Figure 10 and Figure 11). The operation of this friction pair provides 36% less weight loss of the counter body than the pair with the untreated control sample and 24% less than when the counter body works with the sample after traditional hardening. Increasing the PENC temperature to 800 °C increases the weight loss of the hardened steel counter body. In the PENC temperature range from 650 to 800 °C, the weight loss of the counter body in the friction pair remains smaller than in friction pairs with both control samples. PENC at 850 and 900 °C leads to weight loss of the counter body that exceeds the control samples. At the PENC temperature of up to 800 °C, the oxide layer has a dense structure and is strongly bonded to the metal substrate. Increasing the temperature of PENC to 850 and 900 °C weakens the bond between oxides and the base metal, and oxides easily exfoliate during friction. After the peeling of the oxides, friction occurs on a metal substrate with high hardness (Figure 6). At lower temperatures, PENC oxides, firmly bonded to the substrate, play the role of a lubricant during friction, providing less weight loss of the counter body.
Figure 14 shows the dependence of the friction coefficient on the sliding distance of PENC samples when working in tandem with a counter body made of tin-lead bronze. PENC at all temperatures provides lower values of the friction coefficient than that of a raw untreated sample. PENC at temperatures in the range from 650 to 850 °C gives lower friction coefficients in comparison with the sample after traditional hardening. The minimum value of the friction coefficient (Figure 15), as in the case of friction on hardened steel was recorded for the sample after PENC at 650 °C with quenching from 800 °C. The value of the friction coefficient in this pair is 0.274, which is 1.6 times less than a pair with an untreated sample and 1.3 times less than in a friction pair with a sample quenched into oil after heating in a furnace.
The weight loss of samples after PENC in the process of friction on tin-lead bronze in all modes of PENC is less than that of a raw sample (Figure 16). PENC at temperatures not exceeding 800 °C leads to lower weight loss of the sample compared to conventional hardening. The weight loss during friction in PENC samples increases with an increase in the PENC temperature, which correlates with an increase in the friction coefficient (Figure 15 and Figure 16). The minimum weight loss is achieved with a sample paired with tin-lead bronze with the lowest friction coefficient. PENC at a temperature of 650 °C provides 11.5 times less weight loss of the sample during friction compared to the untreated one and 5 times less than the sample quenched in the traditional way. The weight loss of the bronze counter body when working on processed samples is less than on raw ones (Figure 17).
3.4. Determination of equilibrium roughness and the type of violation of frictional bonds during friction
During the running-in period, the roughness of the friction surface undergoes significant changes. One of the main conditions for the completion of the running-in process is considered the transition of the initial roughness to the operational one [26]. It was experimentally established [27] that at the end of running in, a roughness is formed on the friction surface, which does not depend on the initial roughness obtained during machining, but depends only on the wear conditions. This roughness is optimal for a given pair and friction conditions and provides minimal wear. It can be either less or more than the original [28].
I.V. Kragelsky and V.S. Kombalov [29] introduced the concept of "equilibrium roughness" for the roughness formed in the process of running-in and proposed a dimensionless complex parameter for its evaluation. The dimensionless complex parameter of equilibrium roughness is determined from the equation:
where Rmax is the maximum roughness height; r is the radius of rounding of the tops of microroughnesses; ν and b are parameters of the reference Abbott curve.
Modeling the protrusions of a rough sample by bodies of double curvature gives the following expression for the average radius of a single microroughness:
where Ra is the arithmetic mean profile deviation; Rp is the smoothing height or the distance from the protrusion line to the center line within the base length l. A line of protrusions is drawn through the top of the highest irregularity parallel to the midline; Sm is the average step of the irregularities. The numerical values of Ra, Rp, Sm were obtained by direct measurements with a profilometer on the friction tracks of the sample and the counter body. The values of microroughness radii (2) were averaged on the basis of 30 profilograms.
During the period of stationary wear, the equilibrium roughness is reproduced throughout the subsequent process of normal operation of the friction pair. The more the initial roughness of the friction surface differs from the optimal one, the greater will be the wear during the running-in period, and, consequently, the less the durability of the friction pair. This suggests that the friction surface treatment technology has a significant impact on its durability.
Table 2 presents the values of the Kragelsky-Kombalov criterion Δ for samples after PENC at different temperatures and control ones befor and after friction on hardened steel and tin-lead bronze.
It follows from the obtained results that the roughness obtained by the samples after PENC is close to the values of the optimal roughness both in the friction pair with hardened steel and in the friction pair with bronze. The maximum difference between the values of the initial and optimal roughness is recorded for raw and traditionally hardened samples during friction against steel. In this case, the longest and most pronounced running-in period is observed (Figure 10). The work of raw and hardened samples on bronze gives a smaller difference between the initial and steady-state roughness. The running-in period becomes shorter and less pronounced on the dependence of the friction coefficient on the sliding distance (Figure 14).
Due to the surfaces roughness of the sample and the counter body, their interaction during friction is discrete, the contact occurs in separate areas, the totality of which constitutes the actual contact area. Rough surfaces under normal load interpenetrate or flatten out, and corresponding stresses and deformations arise in the area of actual contact spots. During friction, a fixed volume of material lying in the near-surface layer experiences many repeated impacts. When the microroughness of the sample slides over the counter body, a frontal bead of the deformable material appears, which is under the influence of compressive stresses. Behind microroughness due to friction forces, the material is stretched. As a result, an alternating cycle of material loading occurs. Each such cycle does not pass without a trace for the material: damage accumulates in it, weakening it, which ultimately leads to the destruction of the material and the separation of wear particles. Such destruction, according to [26,29], is usually called fatigue.
The variety of changes occurring in the contact layer leads to various types of wear. Therefore, the type of wear cannot be defined in one term. The mechanism of destruction of the surface layer can be different.
To determine the type of violation of frictional bonds in the process of friction, the relative penetration of the sample and the counterbody was calculated similarly [30,31,32]:
where h is the absolute penetration of the sample into the counterbody surface, HB is the microhardness of the sample surface.
This characteristic makes it possible to distinguish between elastic contact, plastic contact and microcutting. Violation of friction bonds as a result of elastic displacement occurs during dry friction on steels at h/r < 0.01. Plastic pushing of the metal takes place at h/r < 0.1, and at h/r > 0.1, the destruction of friction surfaces begins as a result of microcutting. The results of calculating the value (3) are presented in Table 3. The relative error of all results does not exceed 2%.
It is shown that for all samples after PENC in tribocontact with both hardened steel and bronze, a plastic regime is realized. The nature of the interaction of surfaces is mechanical, adhesion and cohesion does not occur in the tribocontact. In raw and traditionally hardened specimens, frictional bonds are broken by microcutting when rubbing against steel. During friction on bronze, the mechanism of breaking frictional bonds in a raw sample is preserved, while in a hardened one it is replaced by a softer one – plastic deformation.
A more severe mode of destruction of friction bonds during friction of a raw sample against steel and bronze and a hardened sample against steel affects the high values of the friction coefficient and significant weight losses of these samples during friction (Figure 11, Figure 12, Figure 15 and Figure 16).
Thus, the wear mechanism of samples made of carbon alloy steel after PENC at various temperatures during friction against hardened steel and bronze is fatigue wear during friction without lubrication and plastic contact. For raw and hardened samples, friction on steel takes place in a more severe microcutting mode. A hardened sample in a friction pair with bronze has a wear mechanism similar to samples after PENC.
4. Conclusions
(a) PENC of samples from carbon tool steel for 5 minutes at various temperatures with quenching from a single-phase austenitic region reduces the friction coefficient and weight loss during friction on hardened steel. The best result was achieved for the sample after PENC at a temperature of 650 °C with quenching from 800 °C. The friction coefficient is 2.8 times less than that of a raw untreated sample and 2.2 times less than that of a sample after traditional hardening. Weight loss during friction is 9.7 times less than that of the raw one and 7.5 times less in comparison with the sample after traditional hardening. High wear resistance is associated with the resulting martensitic structure, saturated with iron carbides and nitrides.
(b) PENC at temperatures of 650 and 800 °C during friction against hardened steel also provides a reduction in counter body weight loss during testing compared to a raw sample and a sample after traditional hardening. A friction pair from a sample after PENC at a temperature of 650 °C and hardened steel loses 36% less mass of the counter body than a pair with a control untreated sample, and 24% less than when working with a counter body with a sample after traditional hardening. An increase in the PENC temperature to 850 and 900 °C leads to the exfoliation of oxides from the surface of the sample during friction. At lower temperatures, PENC oxides firmly bonded to the substrate play the role of a lubricant during friction, providing less weight loss of the counter body.
(c) PENC samples of carbon tool steel at any temperature when working on tin-lead bronze reduces the friction coefficient and frictional weight loss in comparison with the raw sample. Samples nitrocarburized at temperatures of 650 and 800 °C are characterized by lower friction coefficients and weight losses in tests compared to the sample after traditional hardening. The weight loss of the bronze counter body when working on samples after PENC and hardened has the same order and is 3.5 times less than when working on raw.
(d) The wear mechanism of samples after PENC at all temperatures is fatigue wear during dry friction and plastic contact. For raw and hardened samples, when rubbing against steel, and for raw samples, when rubbing against bronze, a more severe friction mode is observed – microcutting.
(e) Equilibrium roughness was estimated for samples after PENC and controls. The roughness obtained by the samples after PENC is close to the values of the optimal roughness both in the friction pair with hardened steel and in the friction pair with bronze. The maximum difference between the values of the initial and optimal roughness is recorded for raw and traditionally hardened samples during friction against steel. In this case, the longest and most pronounced period of running-in is observed.
Author Contributions
Conceptualization, S.K. and S.G.; methodology, T.M. and I.T.; validation, S.K., T.M. and I.T.; formal analysis, M.K. and I.S.; investigation, T.M., I.T., P.P., A.M. and R.Kh.; resources, I.S.; writing—original draft preparation, T.M. and S.K.; writing—review and editing, S.K., M.K., I.S. and S.G.; visualization, T.M., I.T., P.P., A.M. and R.Kh.; supervision, S.K.; project administration, I.S.; funding acquisition, S.G. All authors have read and agreed to the published version of the manuscript.
Funding
This work is supported financially by the Ministry of Science and Higher Education of the Russian Federation (project No FSFS-2021-0003). The study was carried out on the equipment of the Center of collective use of MSUT “STANKIN” supported by the Ministry of Higher Education of Russian Federation.
Data Availability Statement
Not applicable.
Conflicts of Interest
The authors declare no conflict of interest.
References
- Molnar, V. Experimental Investigation of Tribology-Related Topography Parameters of Hard-Turned and Ground 16MnCr5 Surfaces. Lubricants 2023, 11, 263. [Google Scholar] [CrossRef]
- Muhammed, M.; Javidani, M.; Heidari, M.; Jahazi, M. Enhancing the Tribological Performance of Tool Steels for Wood-Processing Applications: A Comprehensive Review. Metals 2023, 13, 1460. [Google Scholar] [CrossRef]
- Faga, M.G.; Settineri, L. Innovative anti-wear coatings on cutting tools for wood machining. Surf. Coat. Technol. 2006, 201, 3002–3007. [Google Scholar] [CrossRef]
- Toboła, D.; Brostow, W.; Czechowski, K.; Rusek, P. Improvement of wear resistance of some cold working tool steels. Wear 2017, 382–383, 29–39. [Google Scholar] [CrossRef]
- Kumar, P.; Chauhan, S.R.; Aggarwal, A. Effects of cutting conditions, tool geometry and material hardness on machinability of AISI H13 using CBN tool. Mater. Today Proc. 2021, 46, 9217–9222. [Google Scholar] [CrossRef]
- Dosbaeva, G.K.; El Hakim, M.A.; Shalaby, M.A.; Krzanowski, J.E.; Veldhuis, S.C. Cutting temperature effect on PCBN and CVD coated carbide tools in hard turning of D2 tool steel. Int. J. Refract. Hard Met. 2015, 50, 1–8. [Google Scholar] [CrossRef]
- Bartels, D.; Klaffki, J.; Pitz, I.; Merklein, C.; Kostrewa, F.; Schmidt, M. Investigation on the case-hardening behavior of additively manufactured 16MnCr5. Metals 2020, 10, 536. [Google Scholar] [CrossRef]
- Réger, M.; Horváth, R.; Széll, A.; Réti, T.; Gonda, V.; Felde, I. The Relationship between Surface and In-Depth Hardness for the Nitrocarburizing Treatment Process. Metals 2021, 11, 812. [Google Scholar] [CrossRef]
- Böcker, J.; Puth, A.; Dalke, A.; Röpcke, J.; van Helden, J.-P.H.; Biermann, H. Influence of the Active Screen Plasma Power during Afterglow Nitrocarburizing on the Surface Modification of AISI 316L. Coatings 2020, 10, 1112. [Google Scholar] [CrossRef]
- Jafarpour, S.M.; Pipa, A.V.; Puth, A.; Dalke, A.; Röpcke, J.; van Helden, J.-P.H.; Biermann, H. The Interplay Effects between Feed-Gas Composition and Bias Plasma Condition during Active-Screen Plasma Nitrocarburizing with a Solid Carbon Source. Coatings 2023, 13, 1103. [Google Scholar] [CrossRef]
- Yerokhin, A.L.; Leyland, A.; Tsotsos, C.; Wilson, A.D.; Nie, X.; Matthews, A. Duplex surface treatments combining plasma electrolytic nitrocarburising and plasma-immersion ion-assisted deposition. Surf. Coat. Technol. 2001, 142–144, 1129–1136. [Google Scholar] [CrossRef]
- Nie, X.; Tsotsos, C.; Wilson, A.; Yerokhin, A.L.; Leyland, A.; Matthews, A. Characteristics of a plasma electrolytic nitrocarburising treatment for stainless steels. Surf. Coat. Technol. 2001, 139, 135–142. [Google Scholar] [CrossRef]
- Taheri, P.; Dehghanian, C. Wear and corrosion properties of nanocrystalline coatings on stainless steel produced by plasma electrolytic nitrocarburising. Int. J. Mat. Res. 2008, 99, 92–100. [Google Scholar] [CrossRef]
- Belkin, P.N.; Kusmanov, S.A.; Zhirov, A.V.; Belkin, V.S.; Parfenyuk, V.I. Anode Plasma Electrolytic Saturation of Titanium Alloys with Nitrogen and Oxygen. J. Mat. Sci. Tech. 2016, 32, 1027–1032. [Google Scholar] [CrossRef]
- Kusmanov, S.; Tambovskiy, I.; Silkin, S.; Nikiforov, R.; Belov, R. Increasing the Hardness and Corrosion Resistance of the Surface of CP-Ti by Plasma Electrolytic Nitrocarburising and Polishing. Materials 2023, 16, 1102. [Google Scholar] [CrossRef] [PubMed]
- Kusmanov, S.A.; Kusmanova, Yu.V.; Naumov, A.R.; Belkin, P.N. Formation of Diffusion Layers by Anode Plasma Electrolytic Nitrocarburizing of Low-Carbon Steel. J. Mater. Eng. Perform. 2015, 24, 3187–3193. [Google Scholar] [CrossRef]
- Kusmanov, S.A.; Kusmanova, Y.V.; Smirnov, A.A.; Belkin, P.N. Modification of steel surface by plasma electrolytic saturation with nitrogen and carbon. Mater. Chem. Phys. 2016, 175, 164–171. [Google Scholar] [CrossRef]
- Kusmanov, S.A.; Dyakov, I.G.; Kusmanova, Yu.V.; Belkin, P.N. Surface Modification of Low-Carbon Steels by Plasma Electrolytic Nitrocarburising. Plasma Chem. Plasma Process. 2016, 36, 1271–1286. [Google Scholar] [CrossRef]
- Tambovskiy, Ivan; Mukhacheva, Tatiana; Gorokhov, Ilya; Suminov, Igor; Silkin, Sergey; Dyakov, Ilya; Kusmanov, Sergei; Grigoriev, Sergey. Features of Cathodic Plasma Electrolytic Nitrocarburizing of Low-Carbon Steel in an Aqueous Electrolyte of Ammonium Nitrate and Glycerin. Metals 2022, 12, 1773. [Google Scholar] [CrossRef]
- Shelekhov, E.V.; Sviridova, T.A. Programs for X-ray analysis of polycrystals. Metal Sci. Heat. Treat. 2000, 42, 309–313. [Google Scholar] [CrossRef]
- Grazulis, S.; Chateigner, D.; Downs, R.T.; Yokochi, A.T.; Le Bail, A. Crystallography open database—An open-access collection of crystal structures. J. Appl. Cryst. 2009, 42, 726–729. [Google Scholar] [CrossRef]
- Shadrin, S.Y.; Zhirov, A.V.; Belkin, P.N. Thermal features of plasma electrolytic heating of titanium. Int. J. Heat. Mass Transfer 2017, 107, 1104–1109. [Google Scholar] [CrossRef]
- Shadrin, S.Y.; Zhirov, A.V.; Belkin, P.N. Formation regularities of gaseous vapour plasma envelope in electrolyzer. Surf. Engin. Appl.Electrochem. 2016, 52, 110–116. [Google Scholar] [CrossRef]
- Shadrin, S.Yu.; Belkin, P.N. Analysis of models for calculation of temperature of anode plasma electrolytic heating. Int. J. Heat. Mass Transfer. 2012, 55, 179–186. [Google Scholar] [CrossRef]
- Belkin, P.N.; Kusmanov, S.A. Plasma Electrolytic Hardening of Steels: Review. Surf. Engin. Appl.Electrochem. 2016, 52, 531–546. [Google Scholar] [CrossRef]
- Kragelsky, I.V.; Dobychin, M.N.; Kombalov, V.S. Methods of evaluating the frictional properties of materials. Friction and Wear 1982, 367–405. [Google Scholar] [CrossRef]
- Kombalov, V.S. Estimating the Tribotechnical Properties of Surfaces in Contact, Nauka, Moscow, USSR, 1983, 324 pp.
- Kragel’skii, I.V.; Dobychin, M.M.; Kombalov, V.S. Principles of Computations for Friction and Wear, Mashinostroeniye, Moscow, USSR, 1977, 440 pp.
- Kragelsky, I.V.; Dobychin, M.N.; Kombalov, V.S. Friction and wear calculation methods; Pergamon Press Ltd.: Oxford, England, 1982; https://books.google.ru/books?id=QLcgBQAAQBAJ&hl=ru. [Google Scholar]
- Mukhacheva, T.; Kusmanov, S.; Suminov, I.; Podrabinnik, P.; Khmyrov, R.; Grigoriev, S. Increasing Wear Resistance of Low-Carbon Steel by Anodic Plasma Electrolytic Sulfiding. Metals 2022, 12, 1641. [Google Scholar] [CrossRef]
- Mukhacheva, T.L.; Belkin, P.N.; Dyakov, I.G.; Kusmanov, S.A. Wear mechanism of medium carbon steel after its plasma electrolytic nitrocarburising. Wear 2020, 462–463, 203516. [Google Scholar] [CrossRef]
- Kusmanov, S.; Mukhacheva, T.; Tambovskiy, I.; Naumov, A.; Belov, R.; Sokova, E.; Kusmanova, I. Increasing Hardness and Wear Resistance of Austenitic Stainless Steel Surface by Anodic Plasma Eiectrolytic Treatment. Metals 2023, 13, 872. [Google Scholar] [CrossRef]
Figure 1.
Schematic diagram of PENC setup: 1—electrolyte; 2—cold water; 3—heat exchanger; 4—power supply; 5—treated sample; 6—electrolytic cell; 7—flowmeter; 8—pump.
Figure 1.
Schematic diagram of PENC setup: 1—electrolyte; 2—cold water; 3—heat exchanger; 4—power supply; 5—treated sample; 6—electrolytic cell; 7—flowmeter; 8—pump.
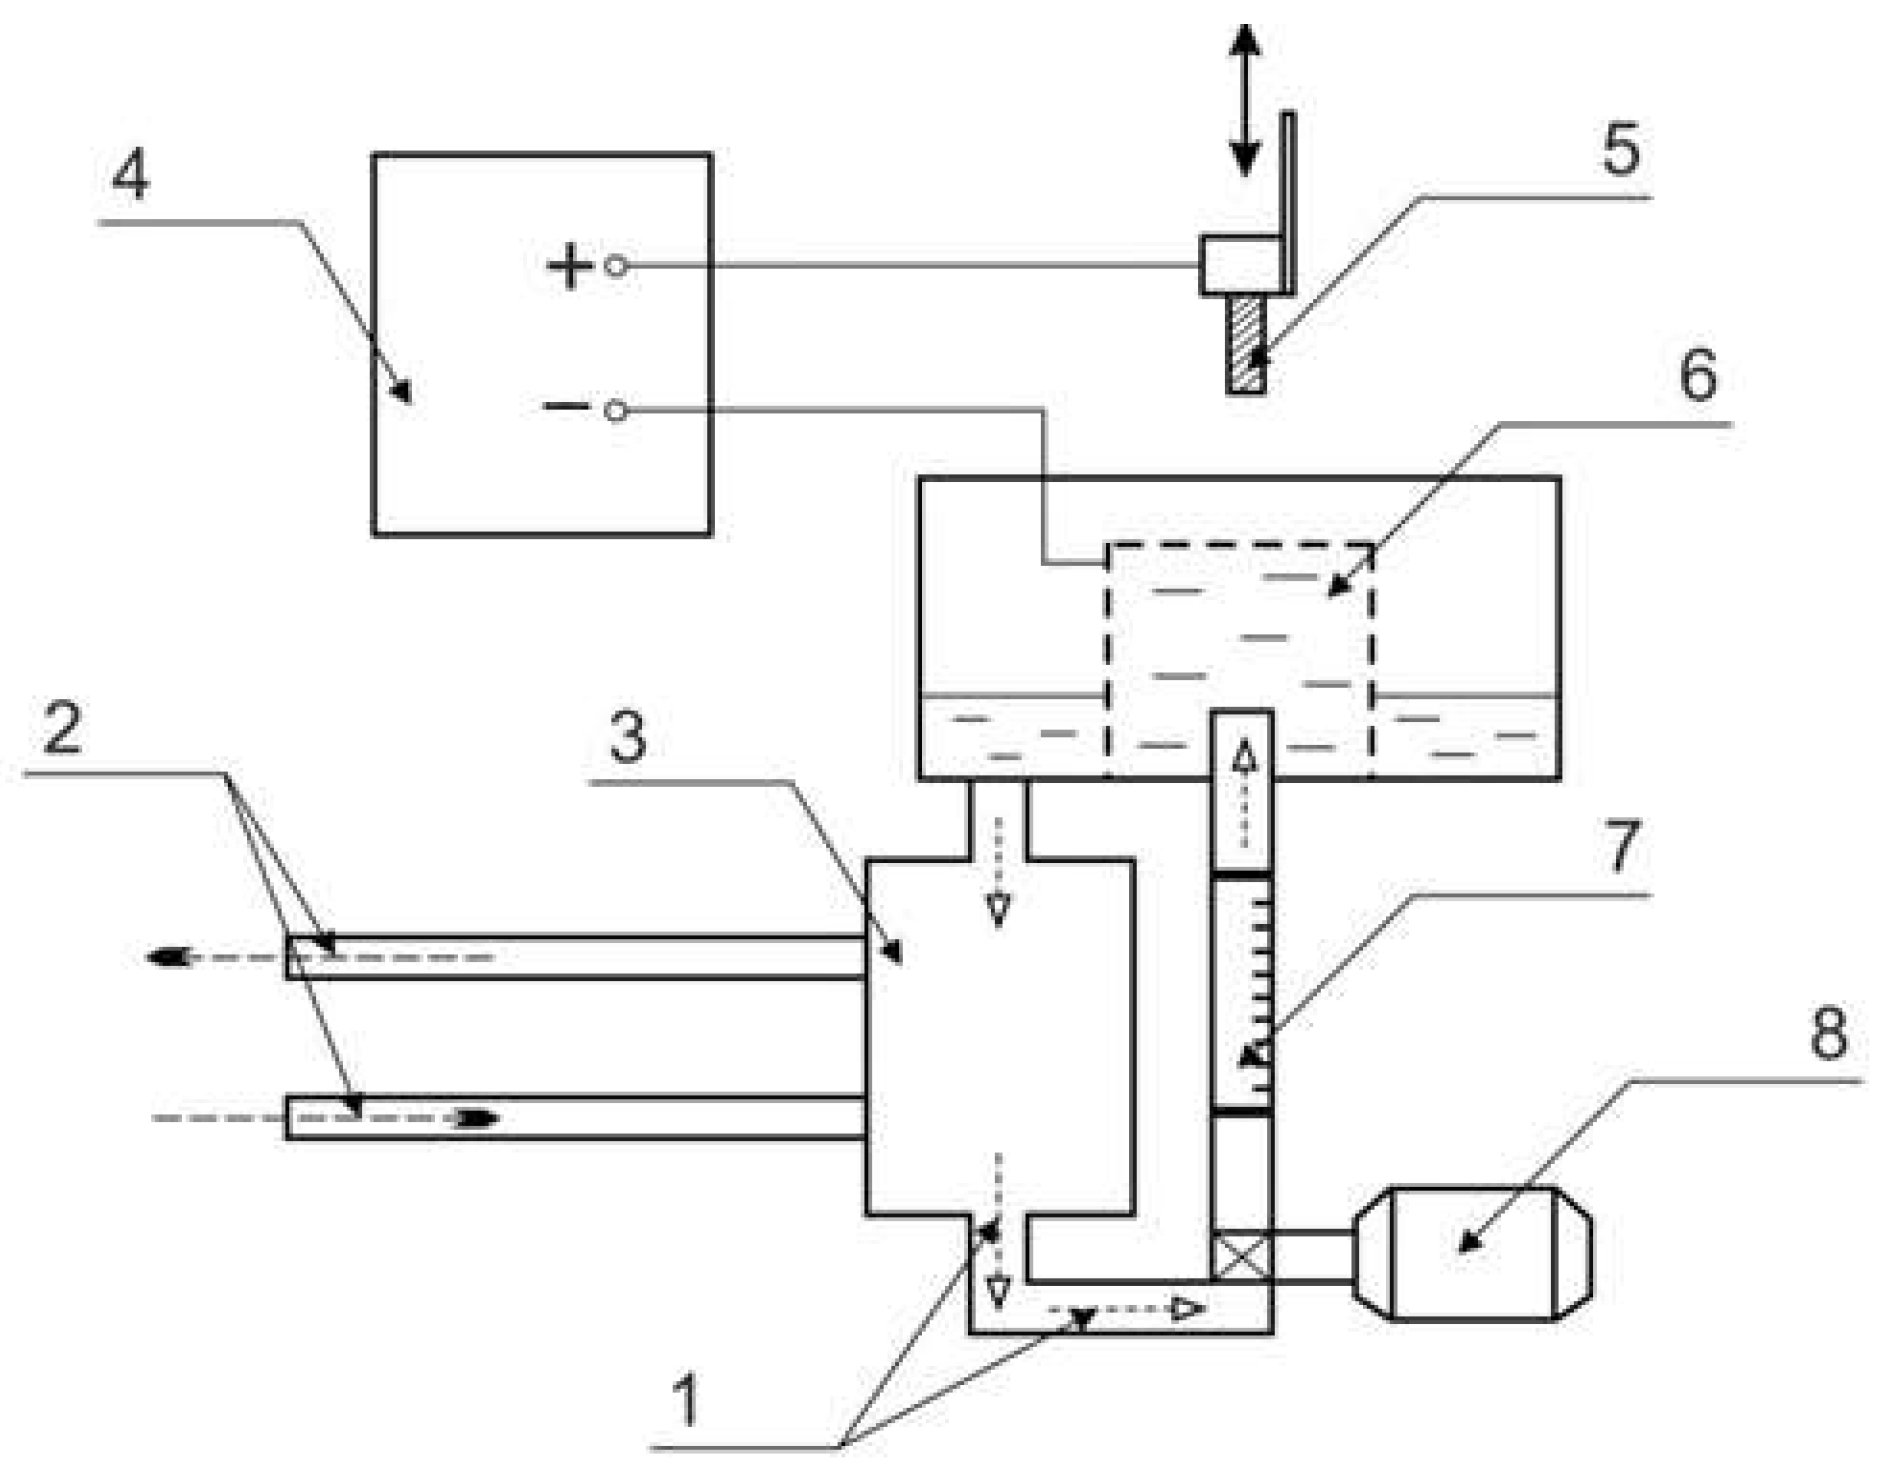
Figure 2.
Friction scheme.
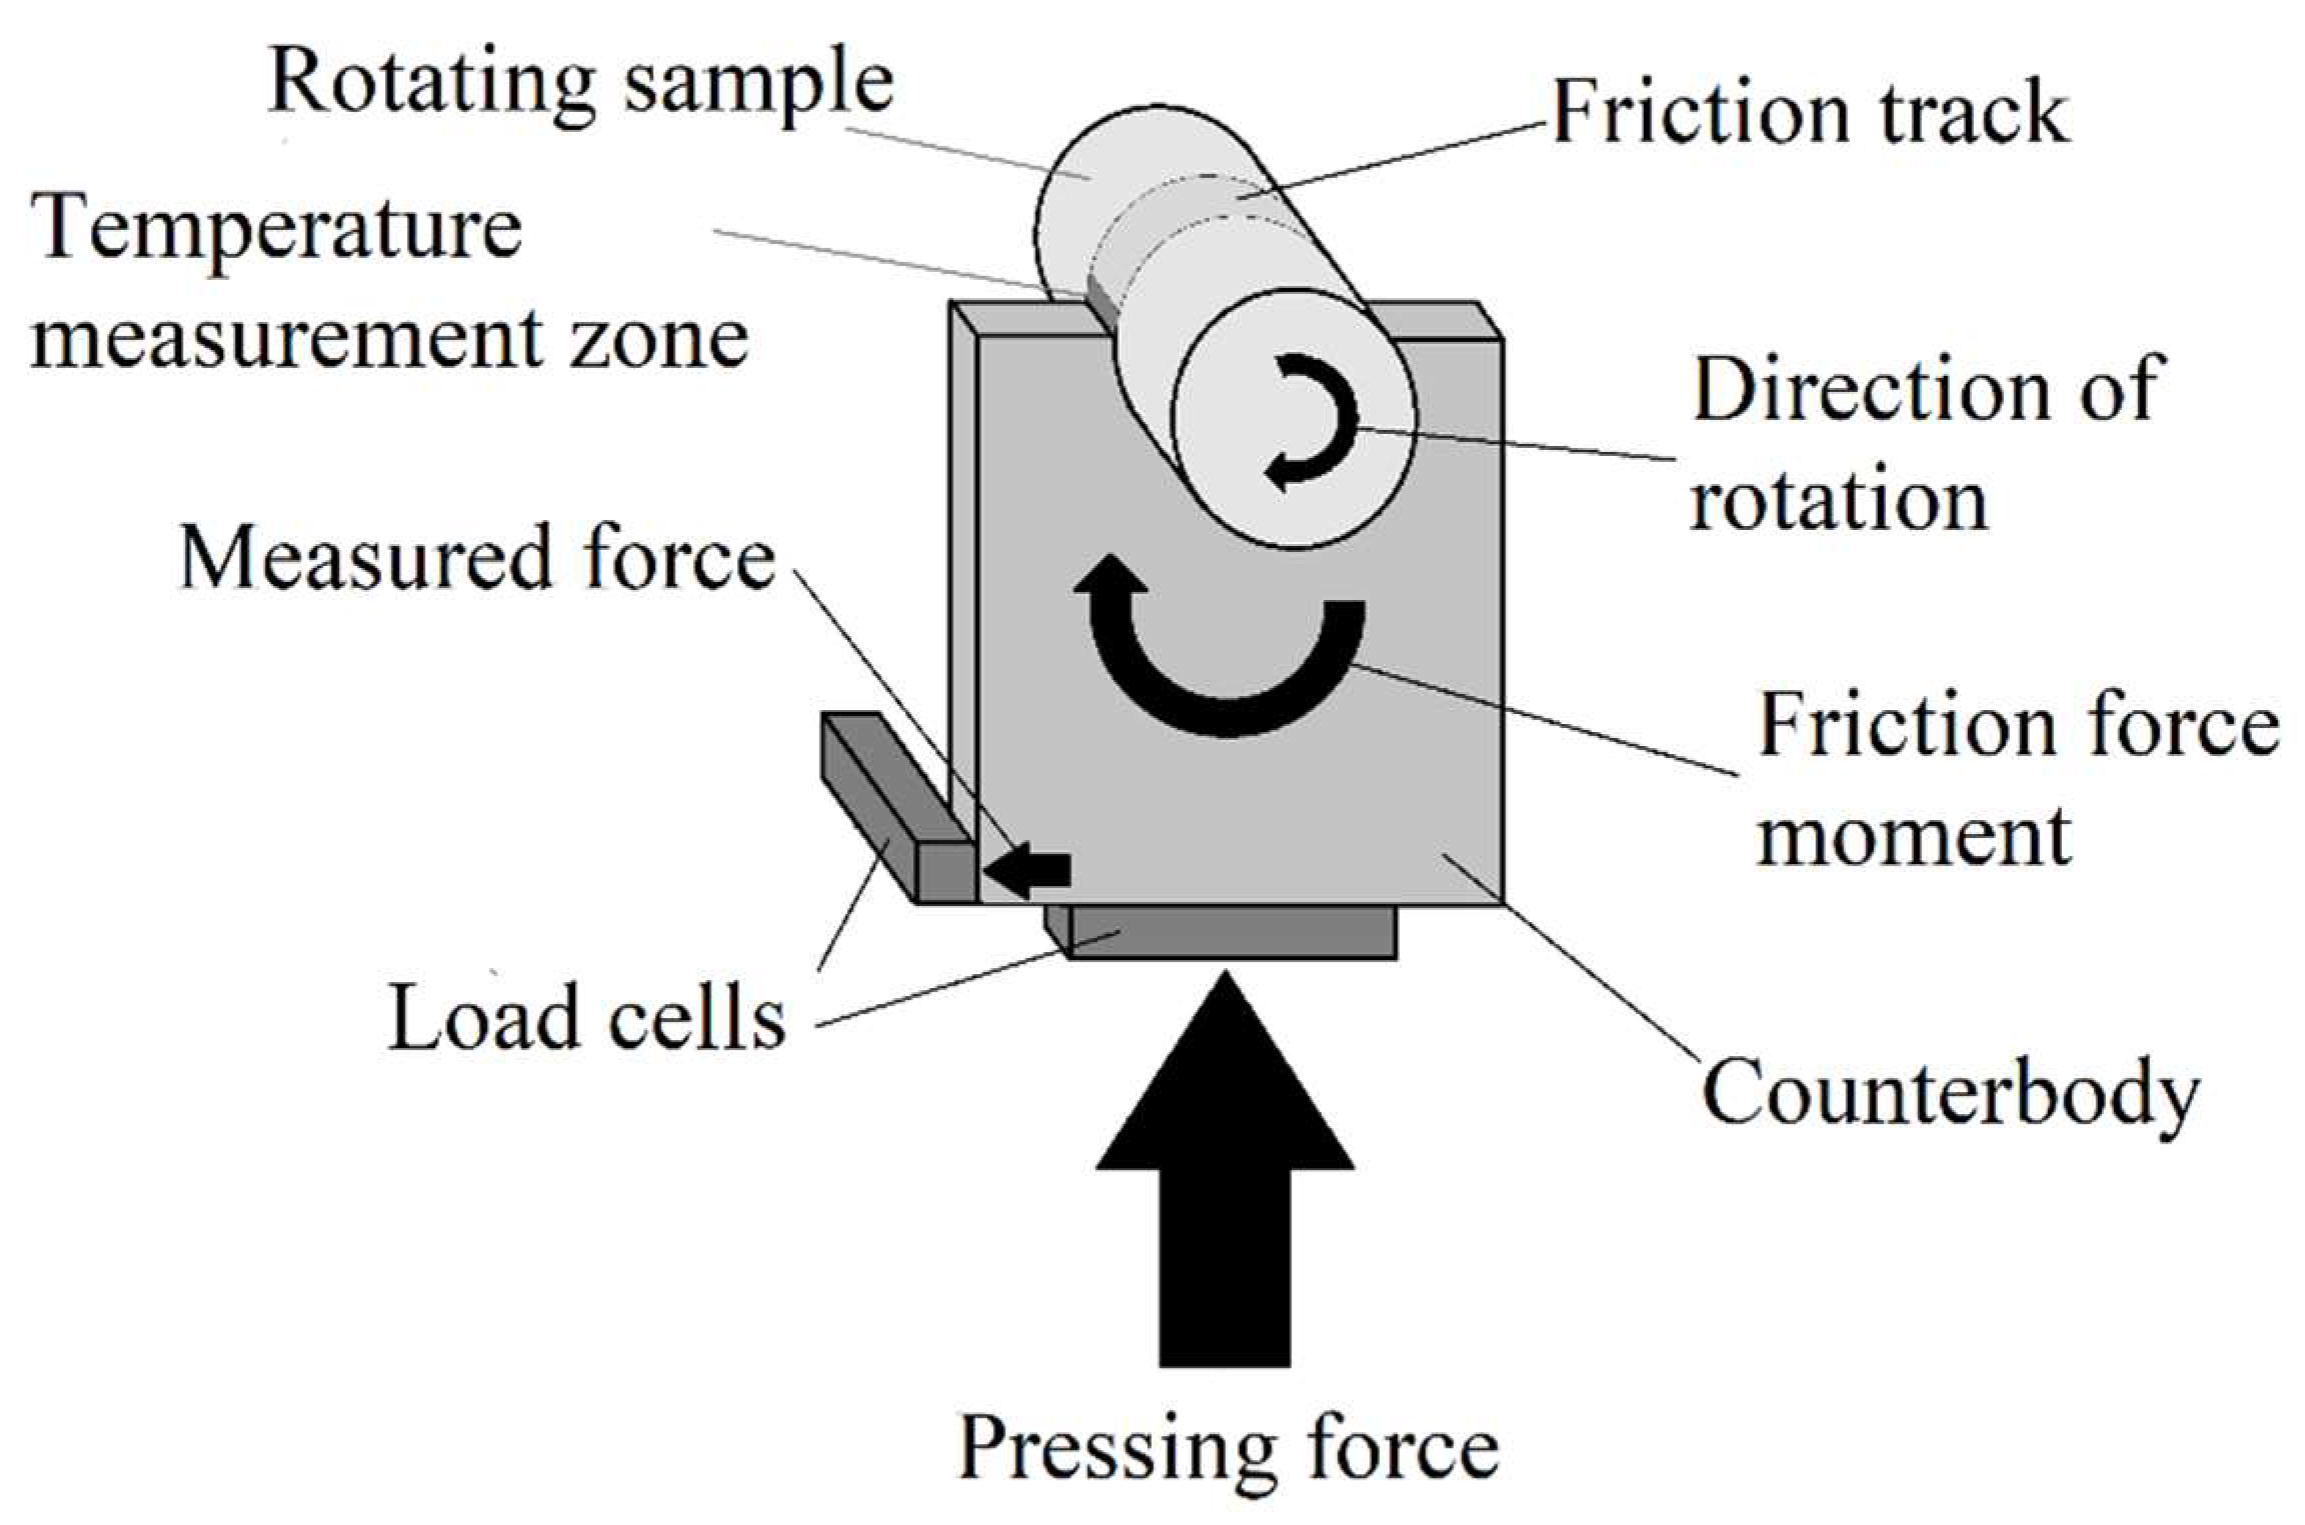
Figure 3.
Current-voltage characteristic of PENC.
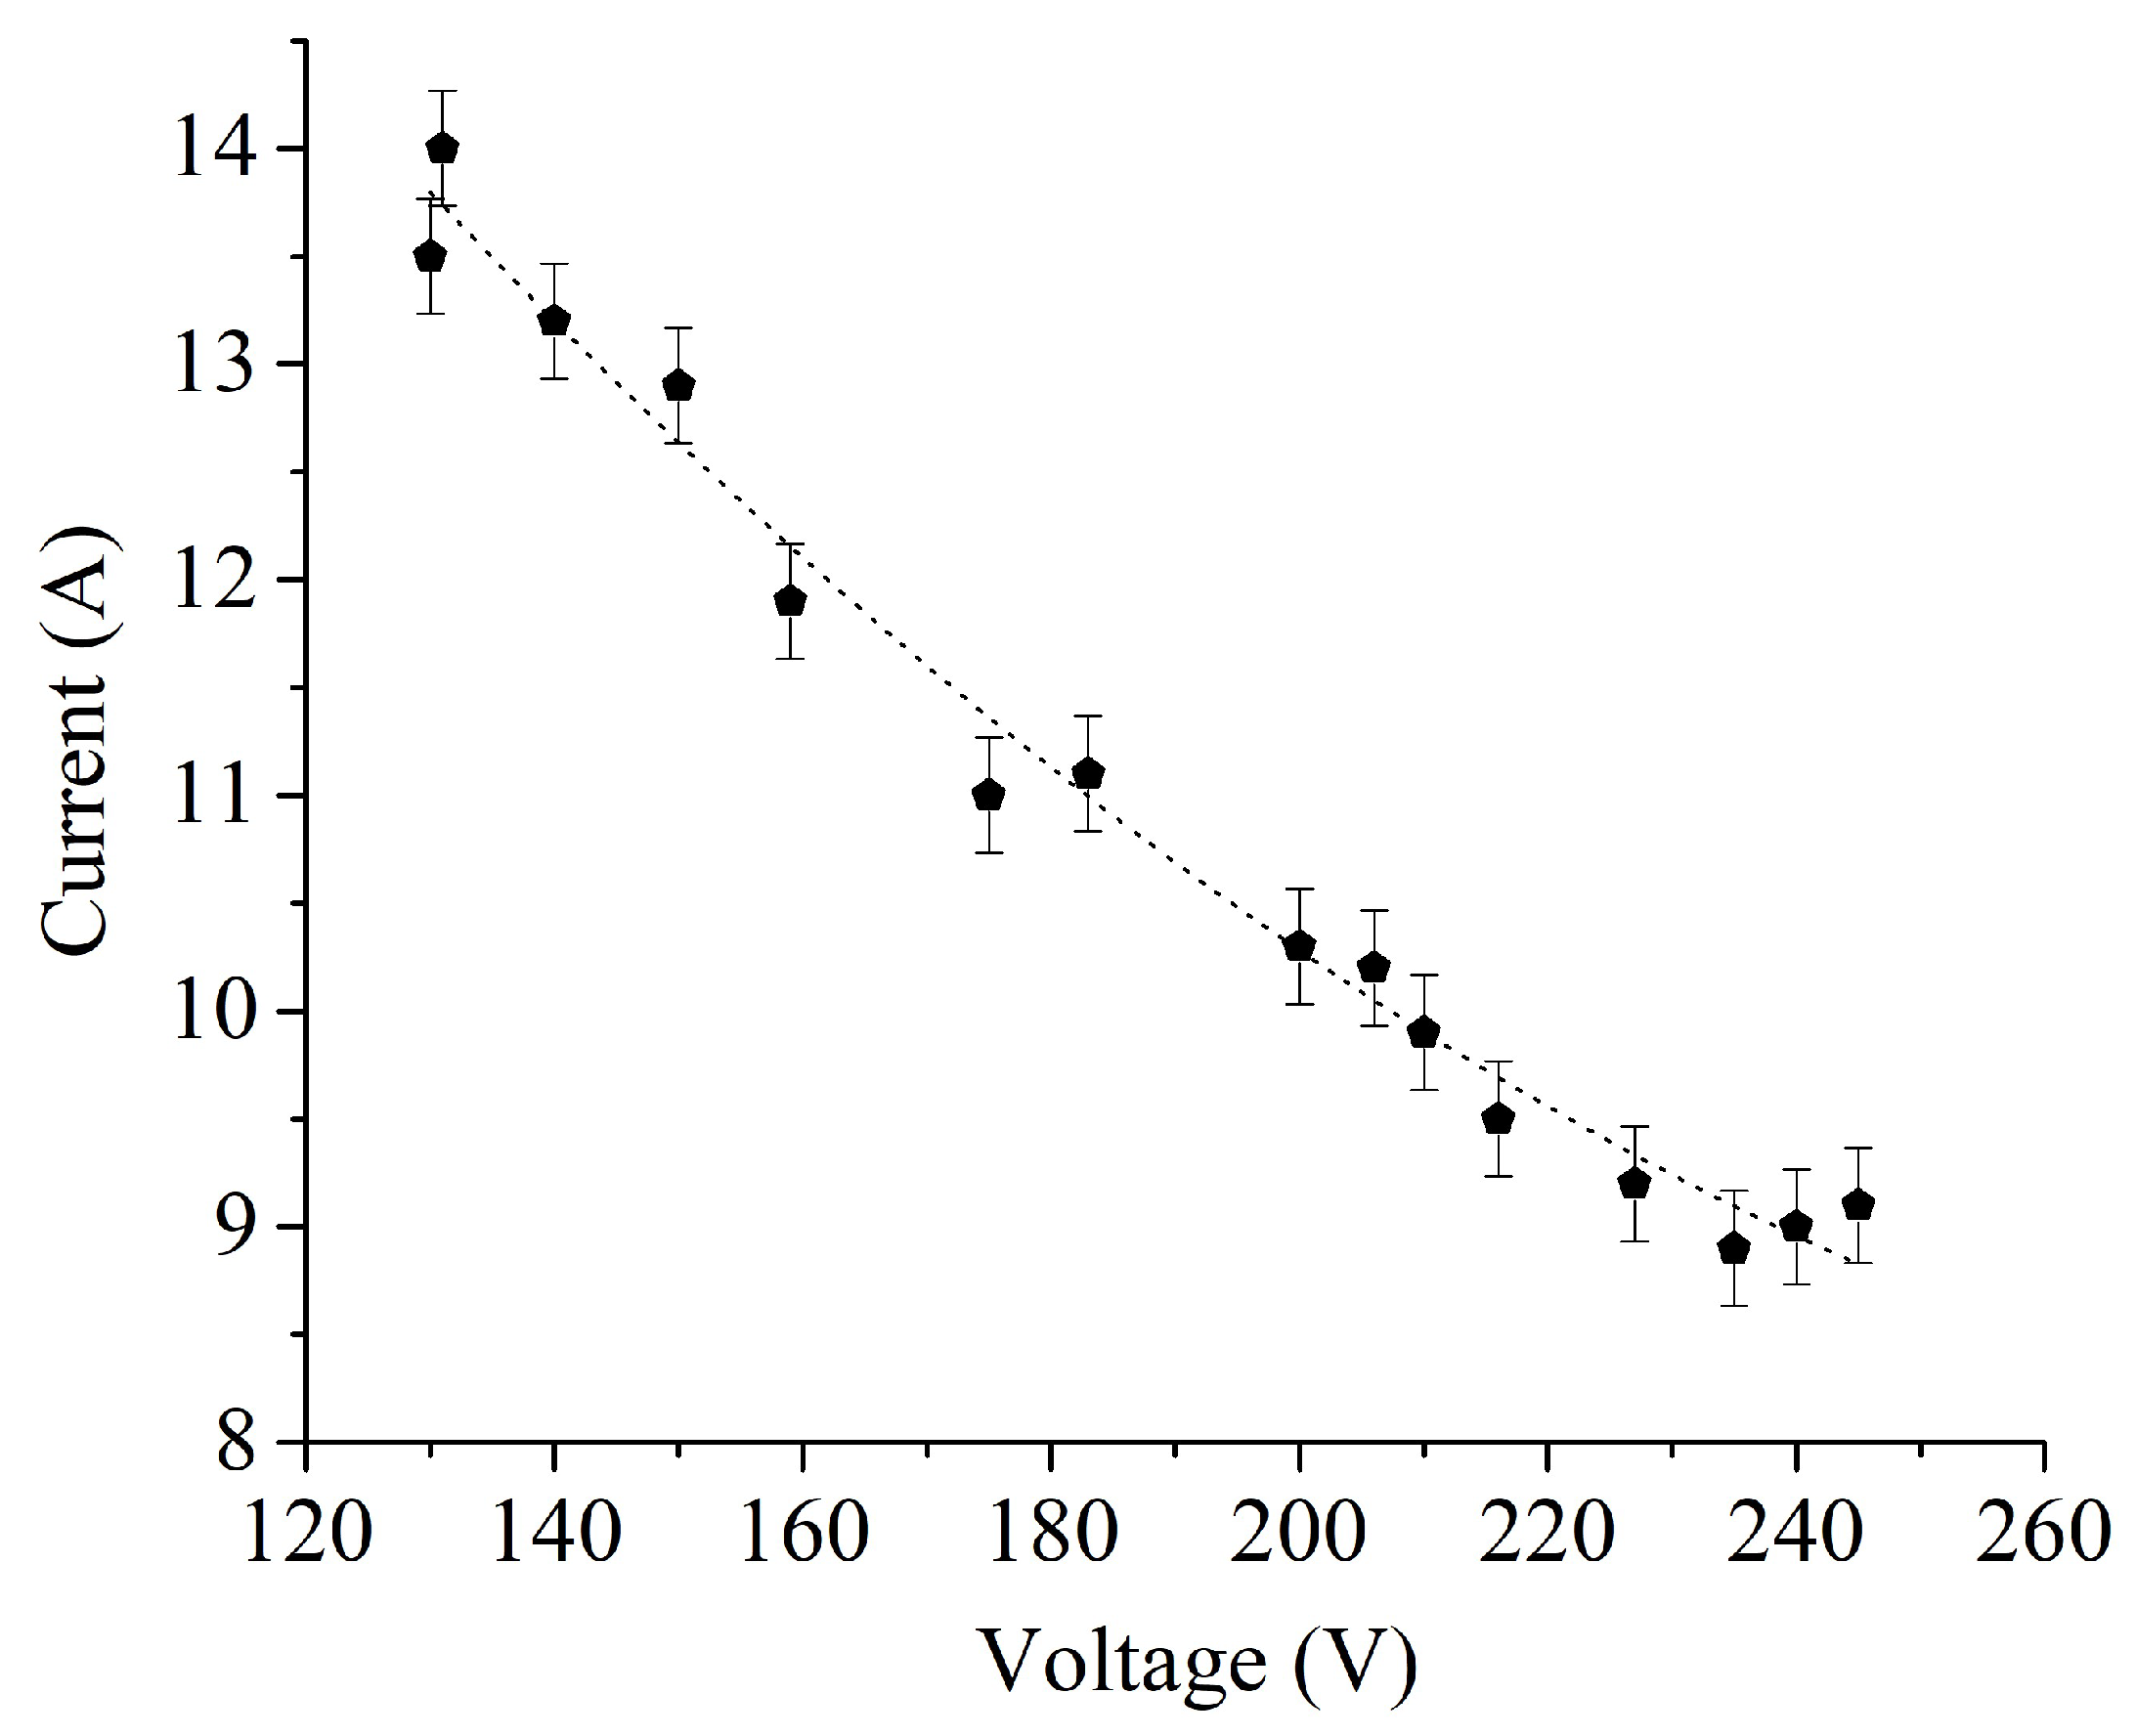
Figure 4.
Temperature-voltage characteristic of PENC.
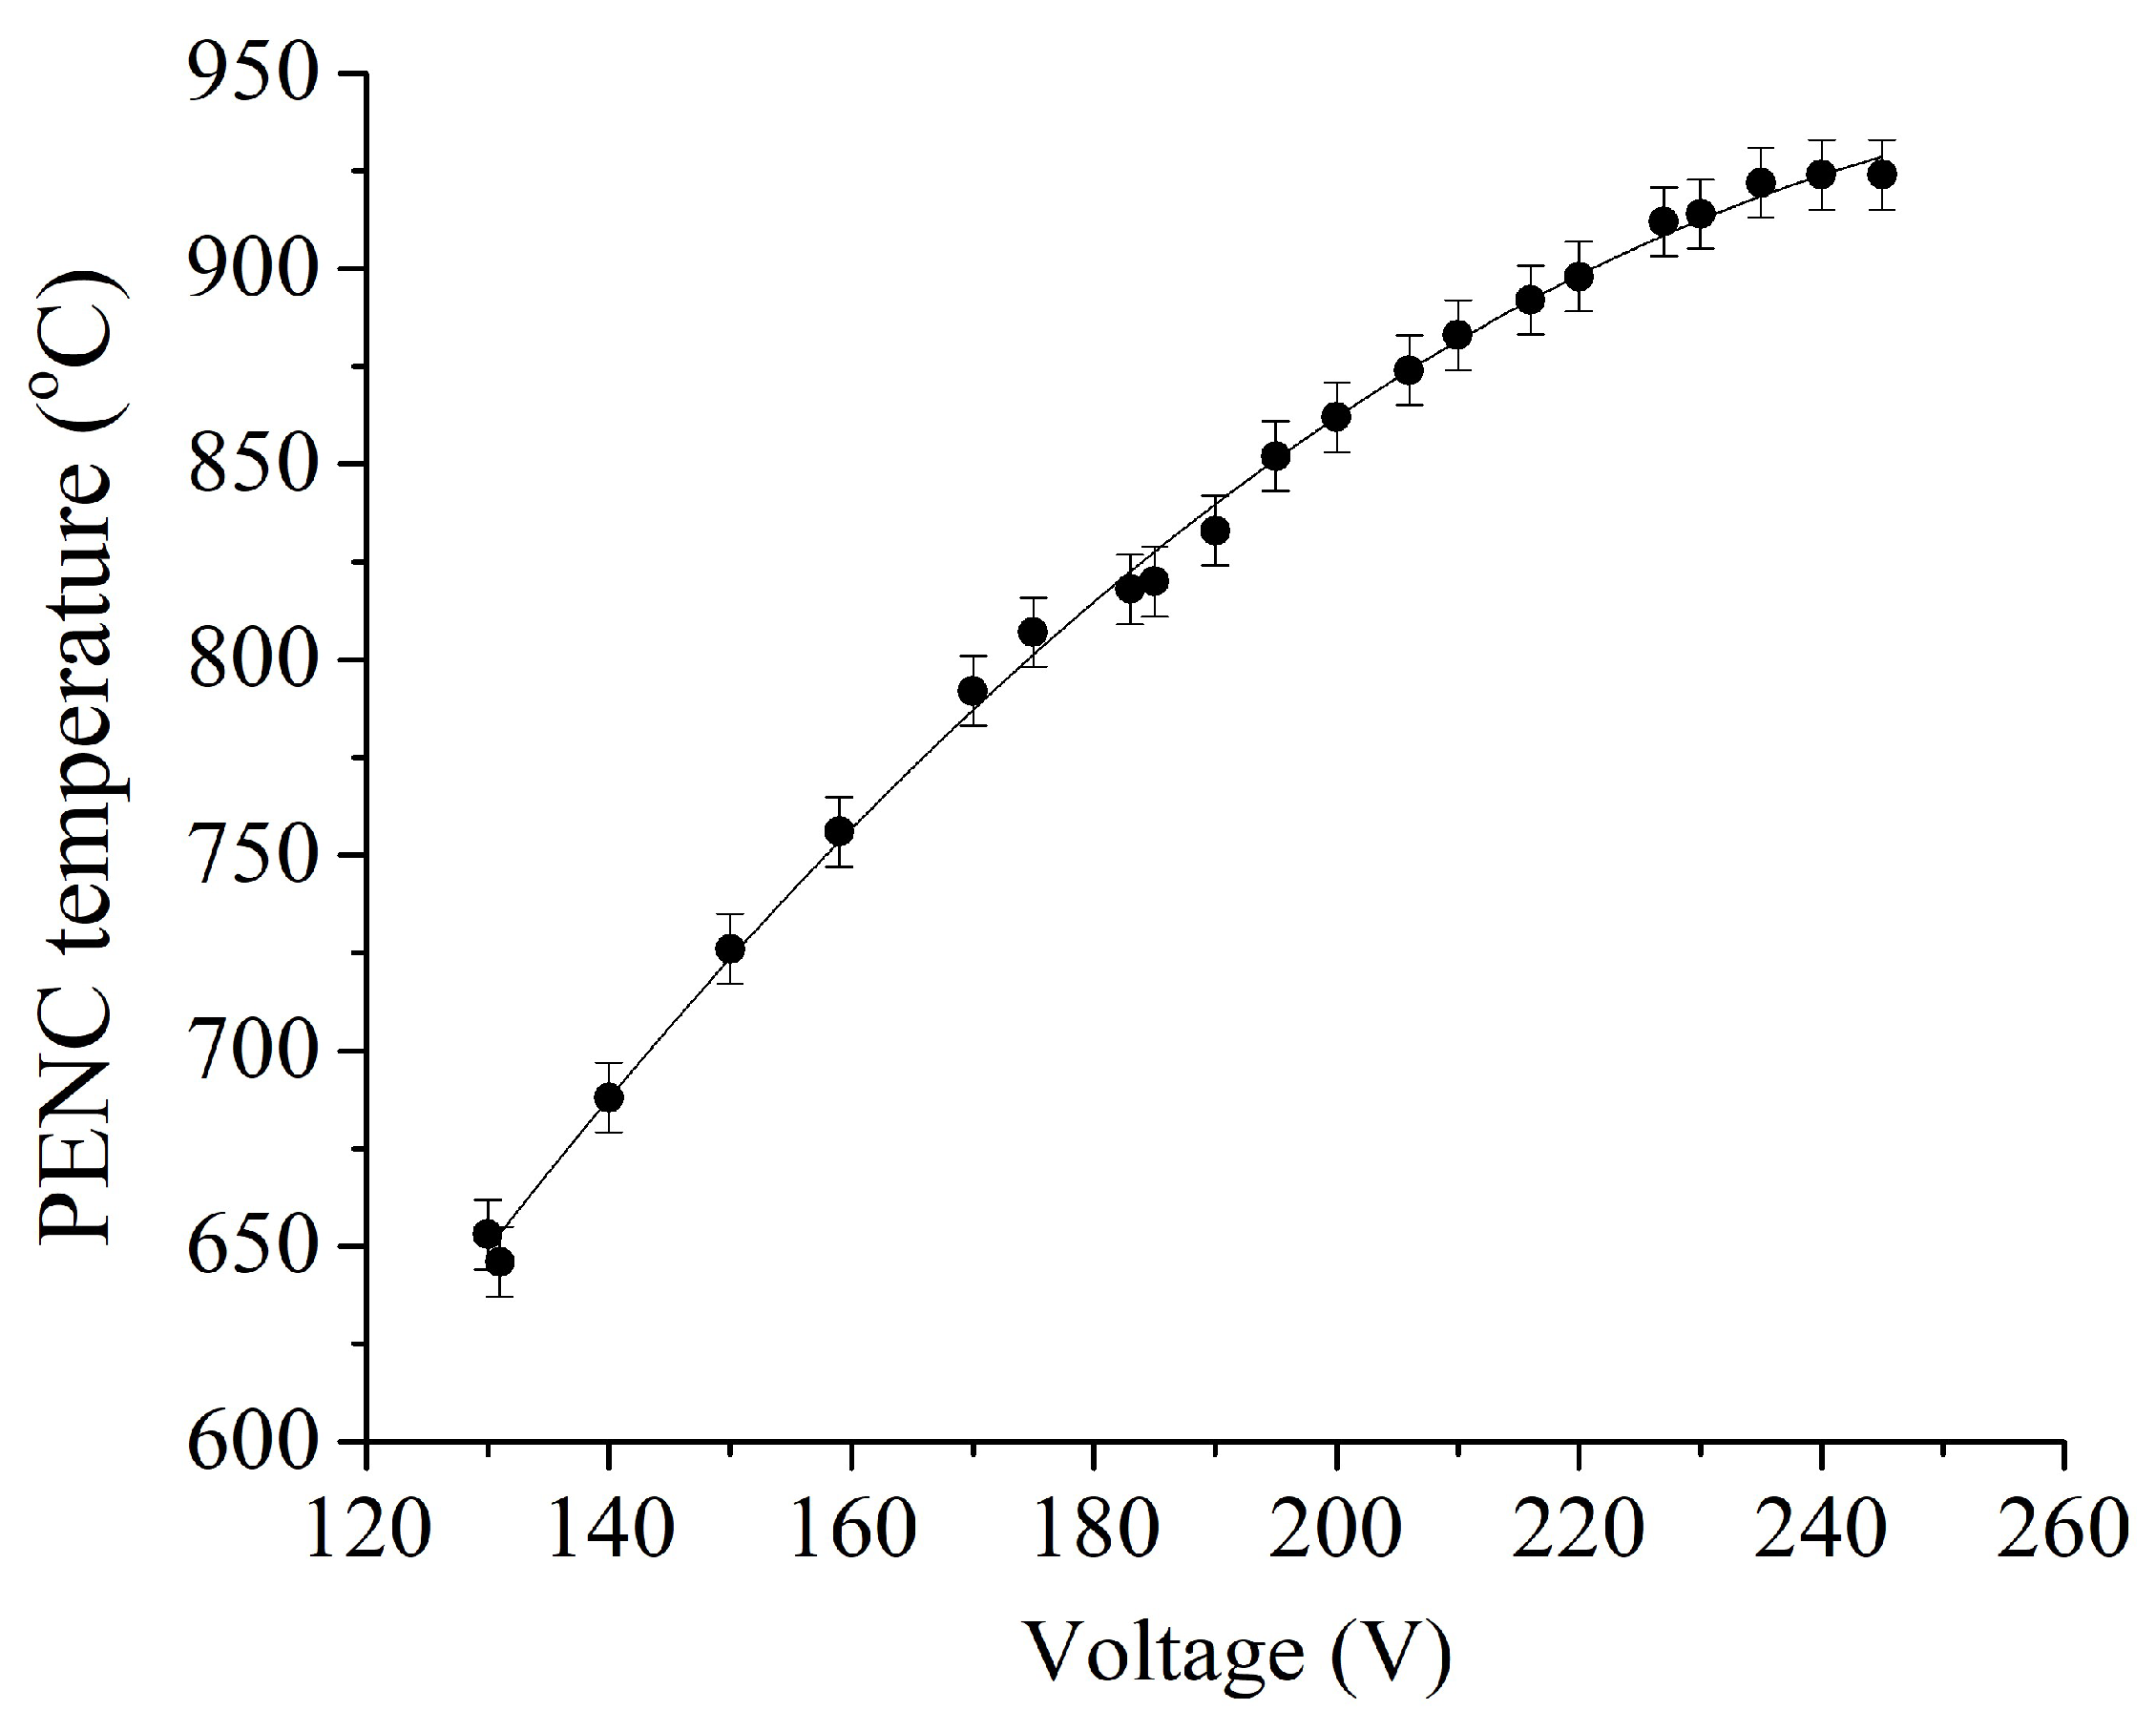
Figure 5.
Microstructure of cross-section of the steel surface after PENC at different treatment temperatures: (a) 900 °C; (b) 850 °C; (c) 800 °C; (d) 650 °C.
Figure 5.
Microstructure of cross-section of the steel surface after PENC at different treatment temperatures: (a) 900 °C; (b) 850 °C; (c) 800 °C; (d) 650 °C.
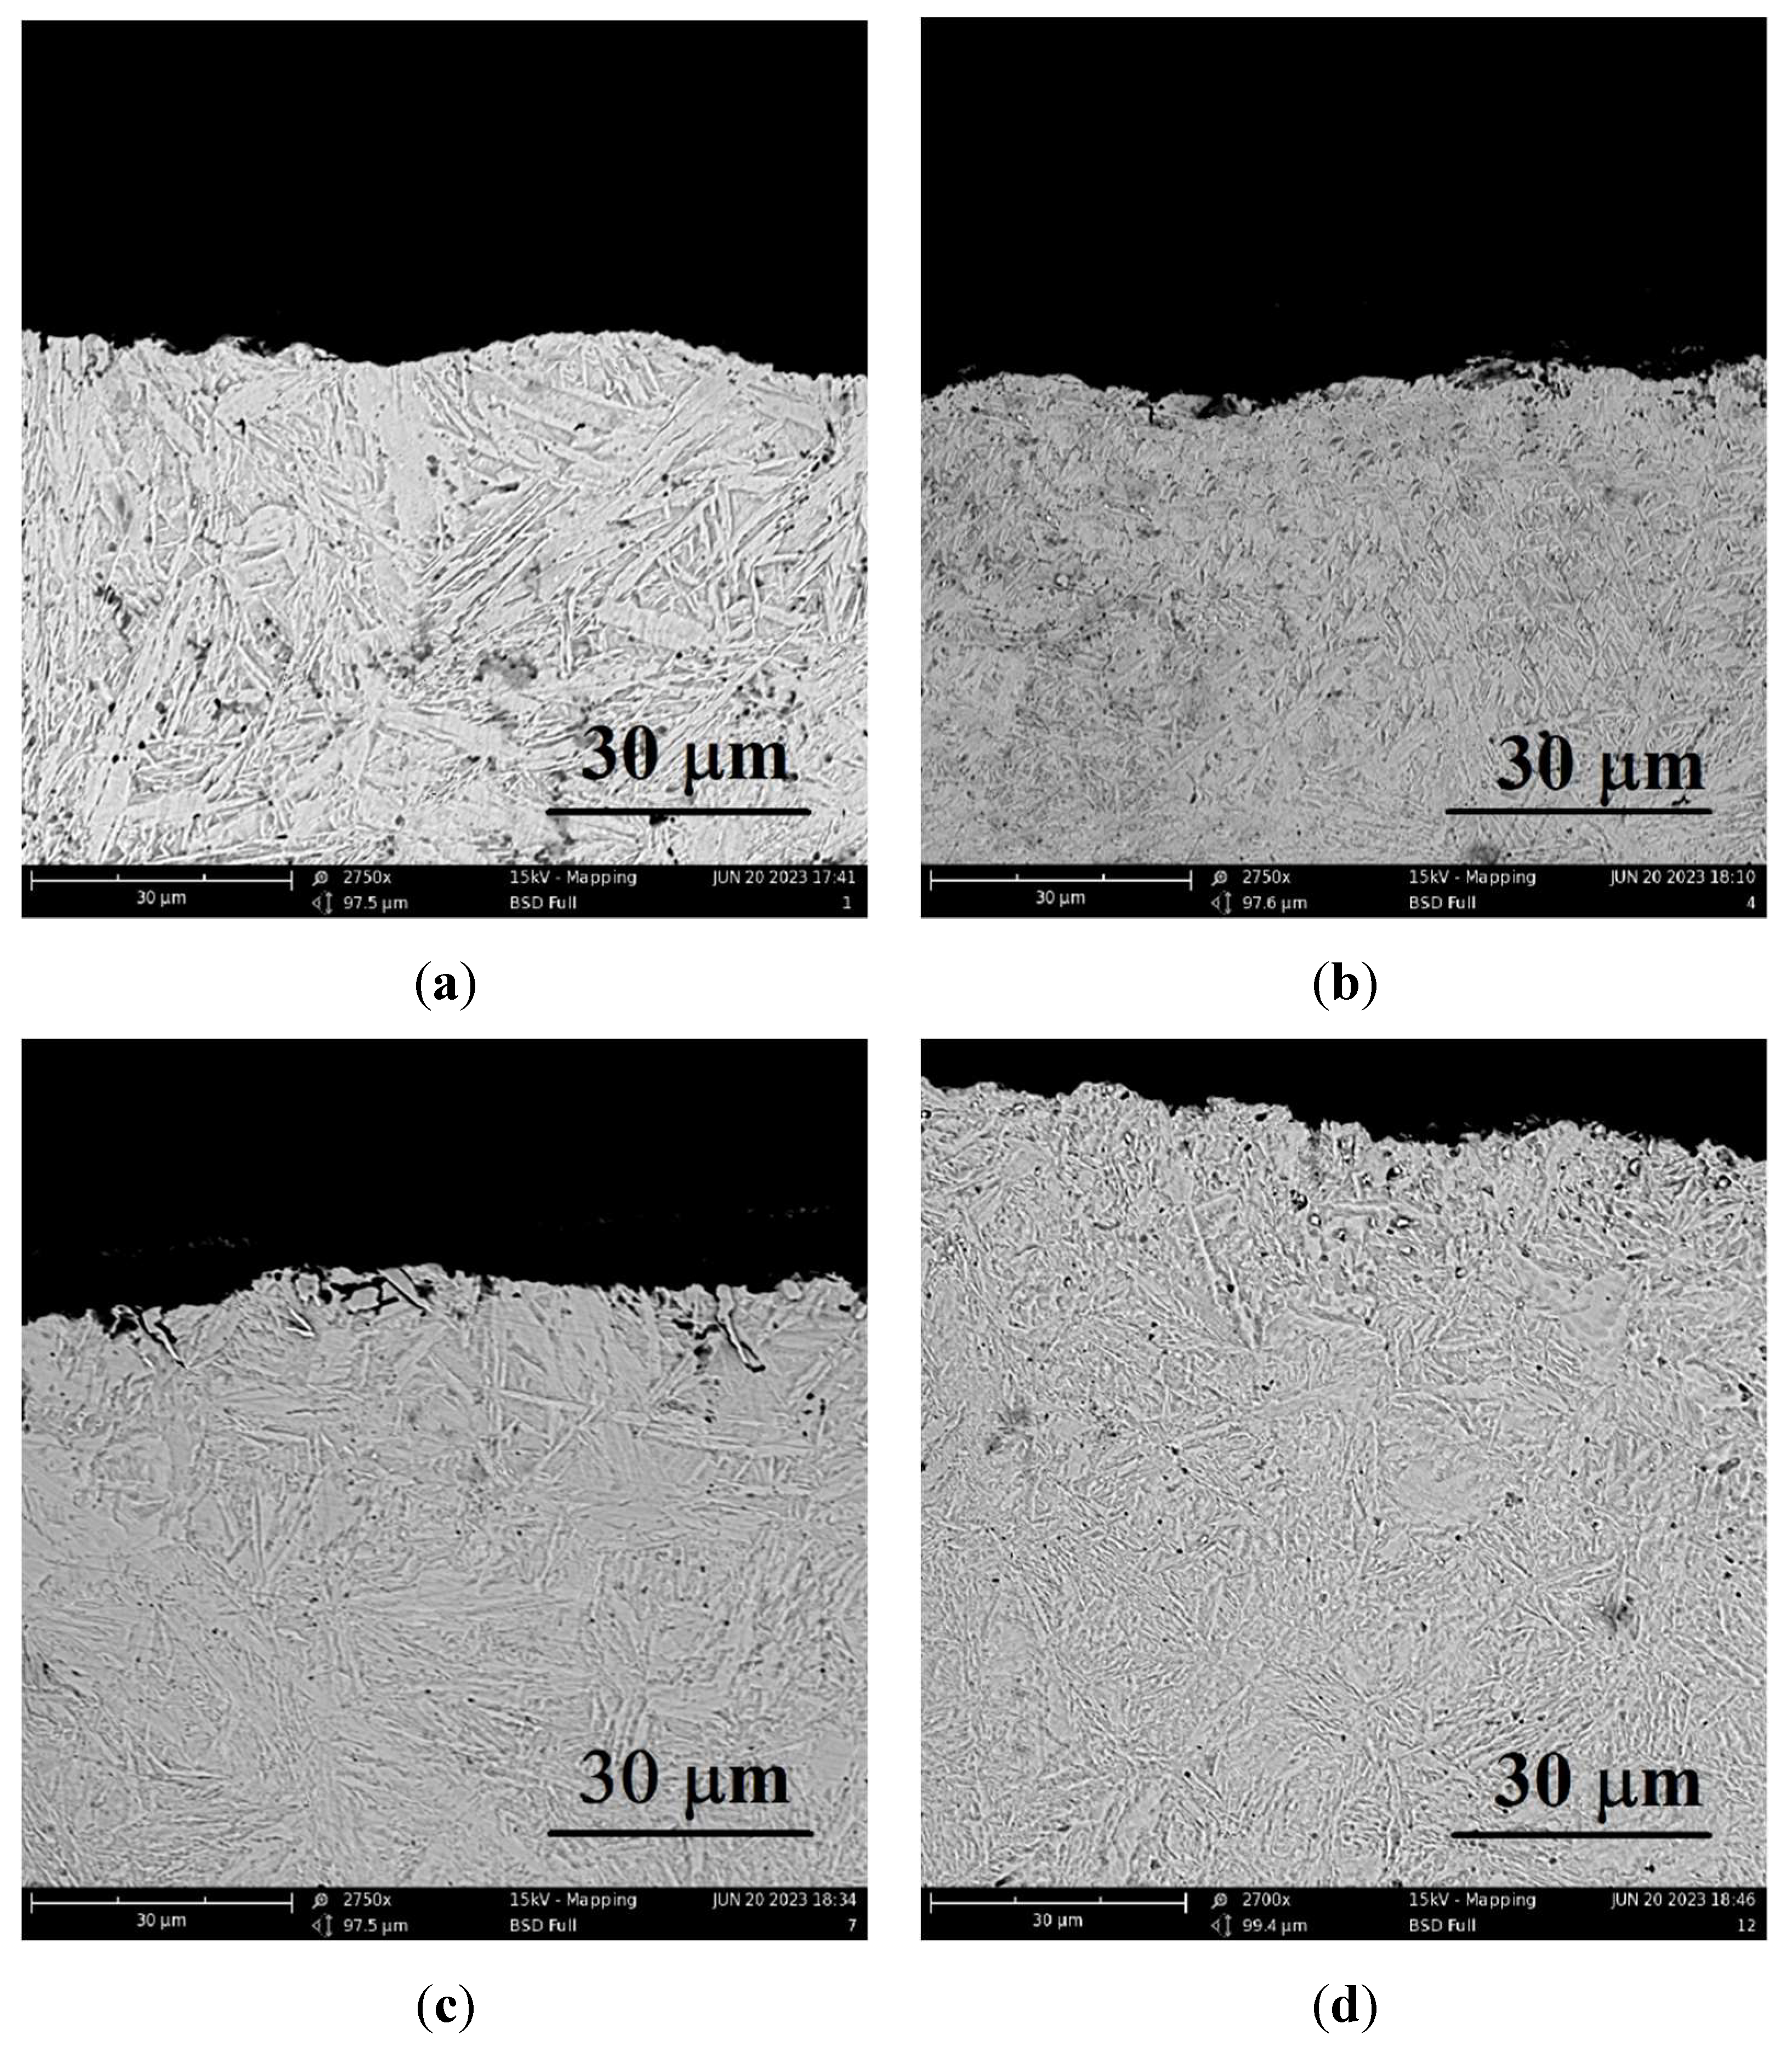
Figure 6.
Microhardness distribution in the surface layer after PENC at different temperatures.

Figure 7.
X-ray diffraction patterns of the steel surface layer after PENC at 650 °C.
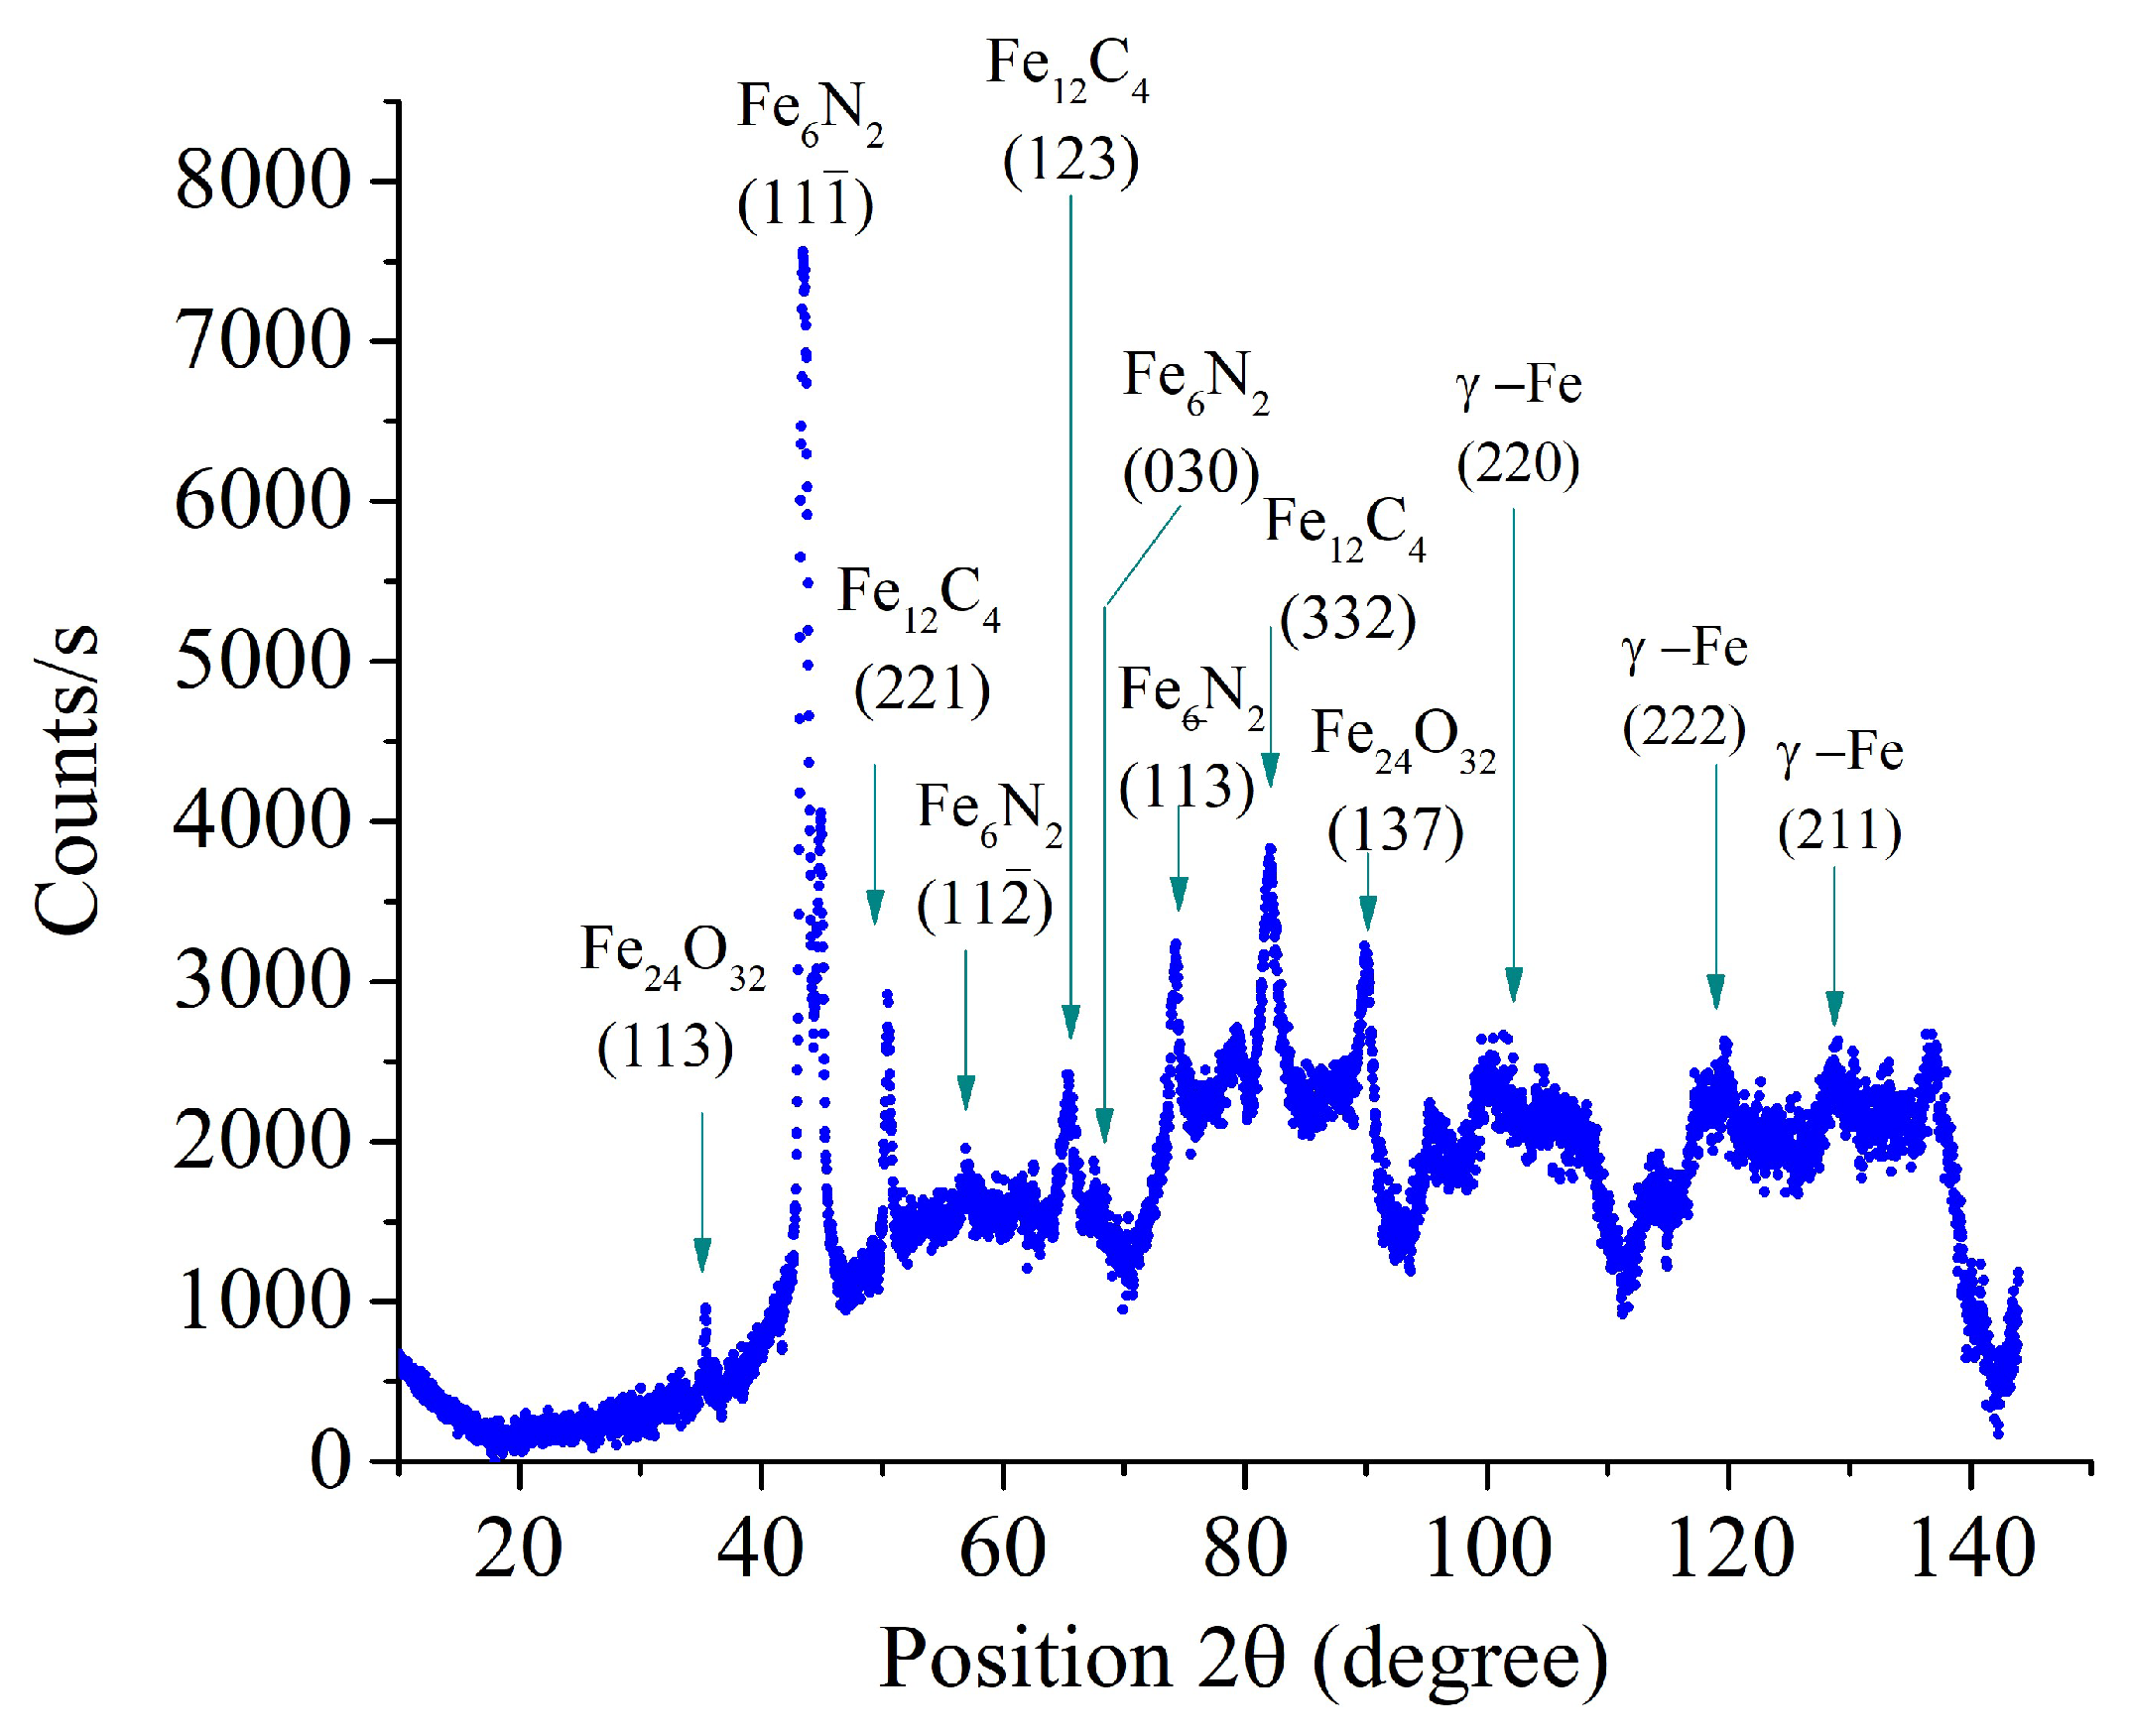
Figure 8.
X-ray diffraction patterns of the steel surface layer after PENC at 800 °C.
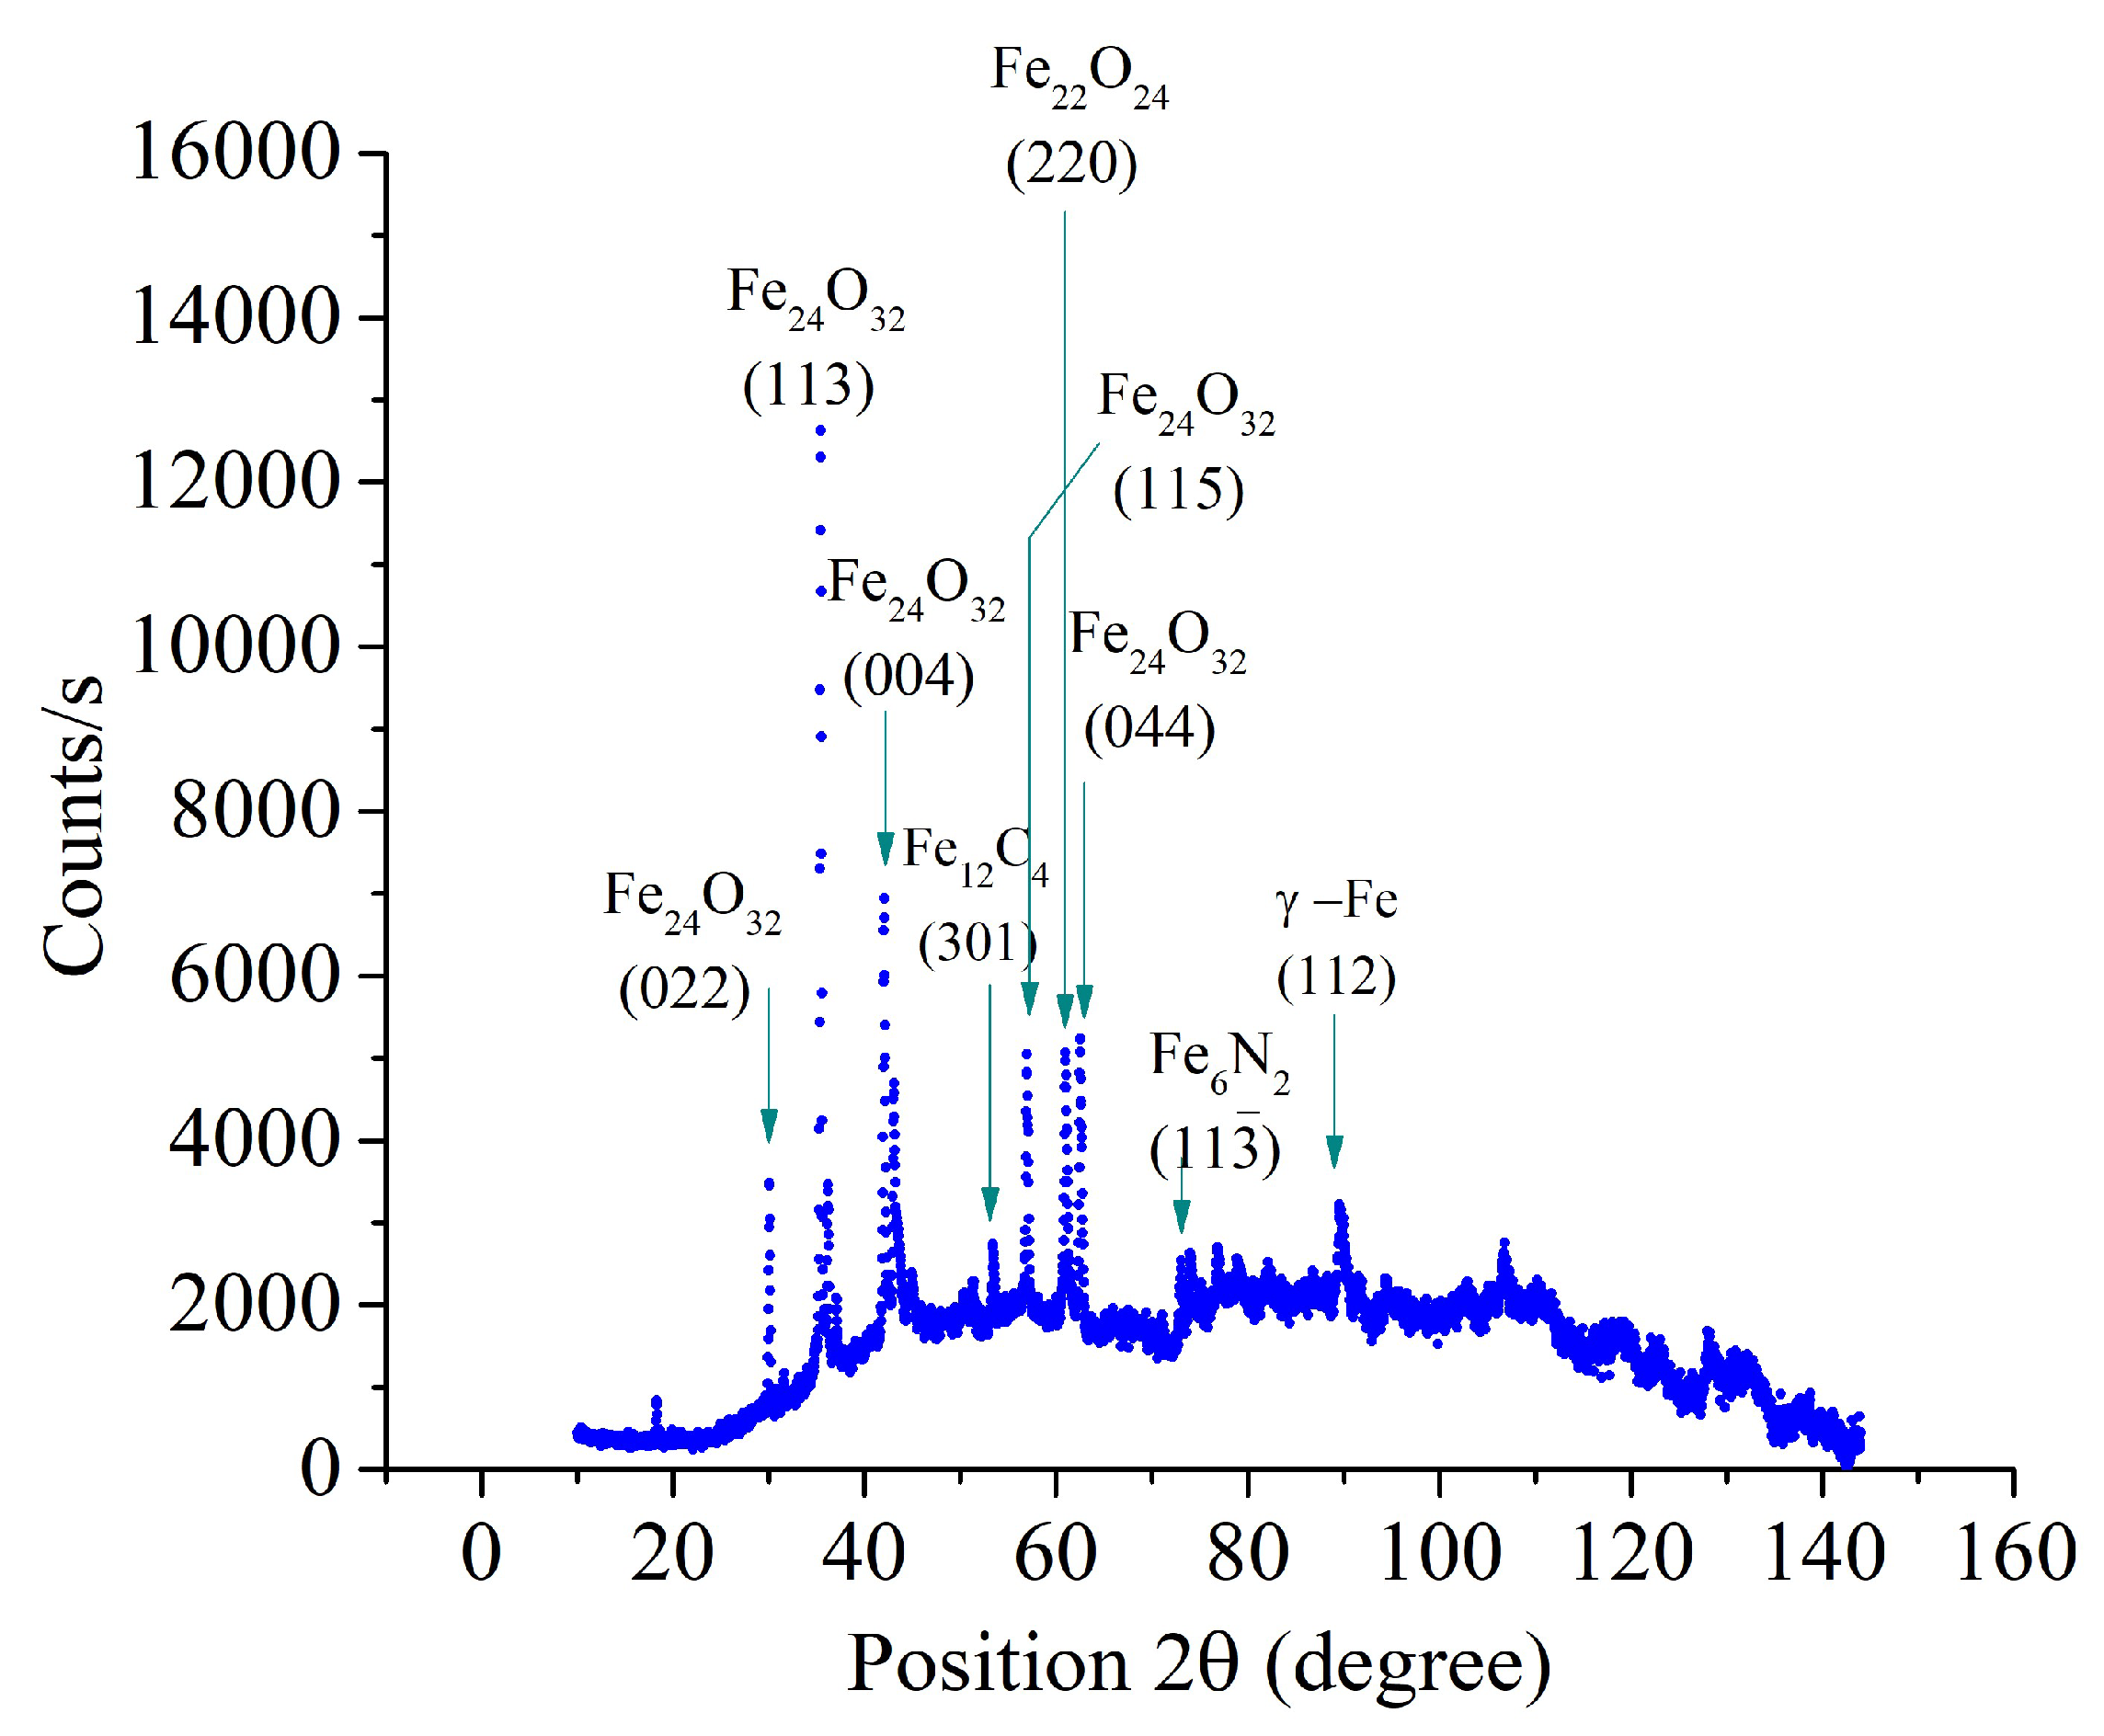
Figure 9.
X-ray diffraction patterns of the steel surface layer after PENC at 900 °C.
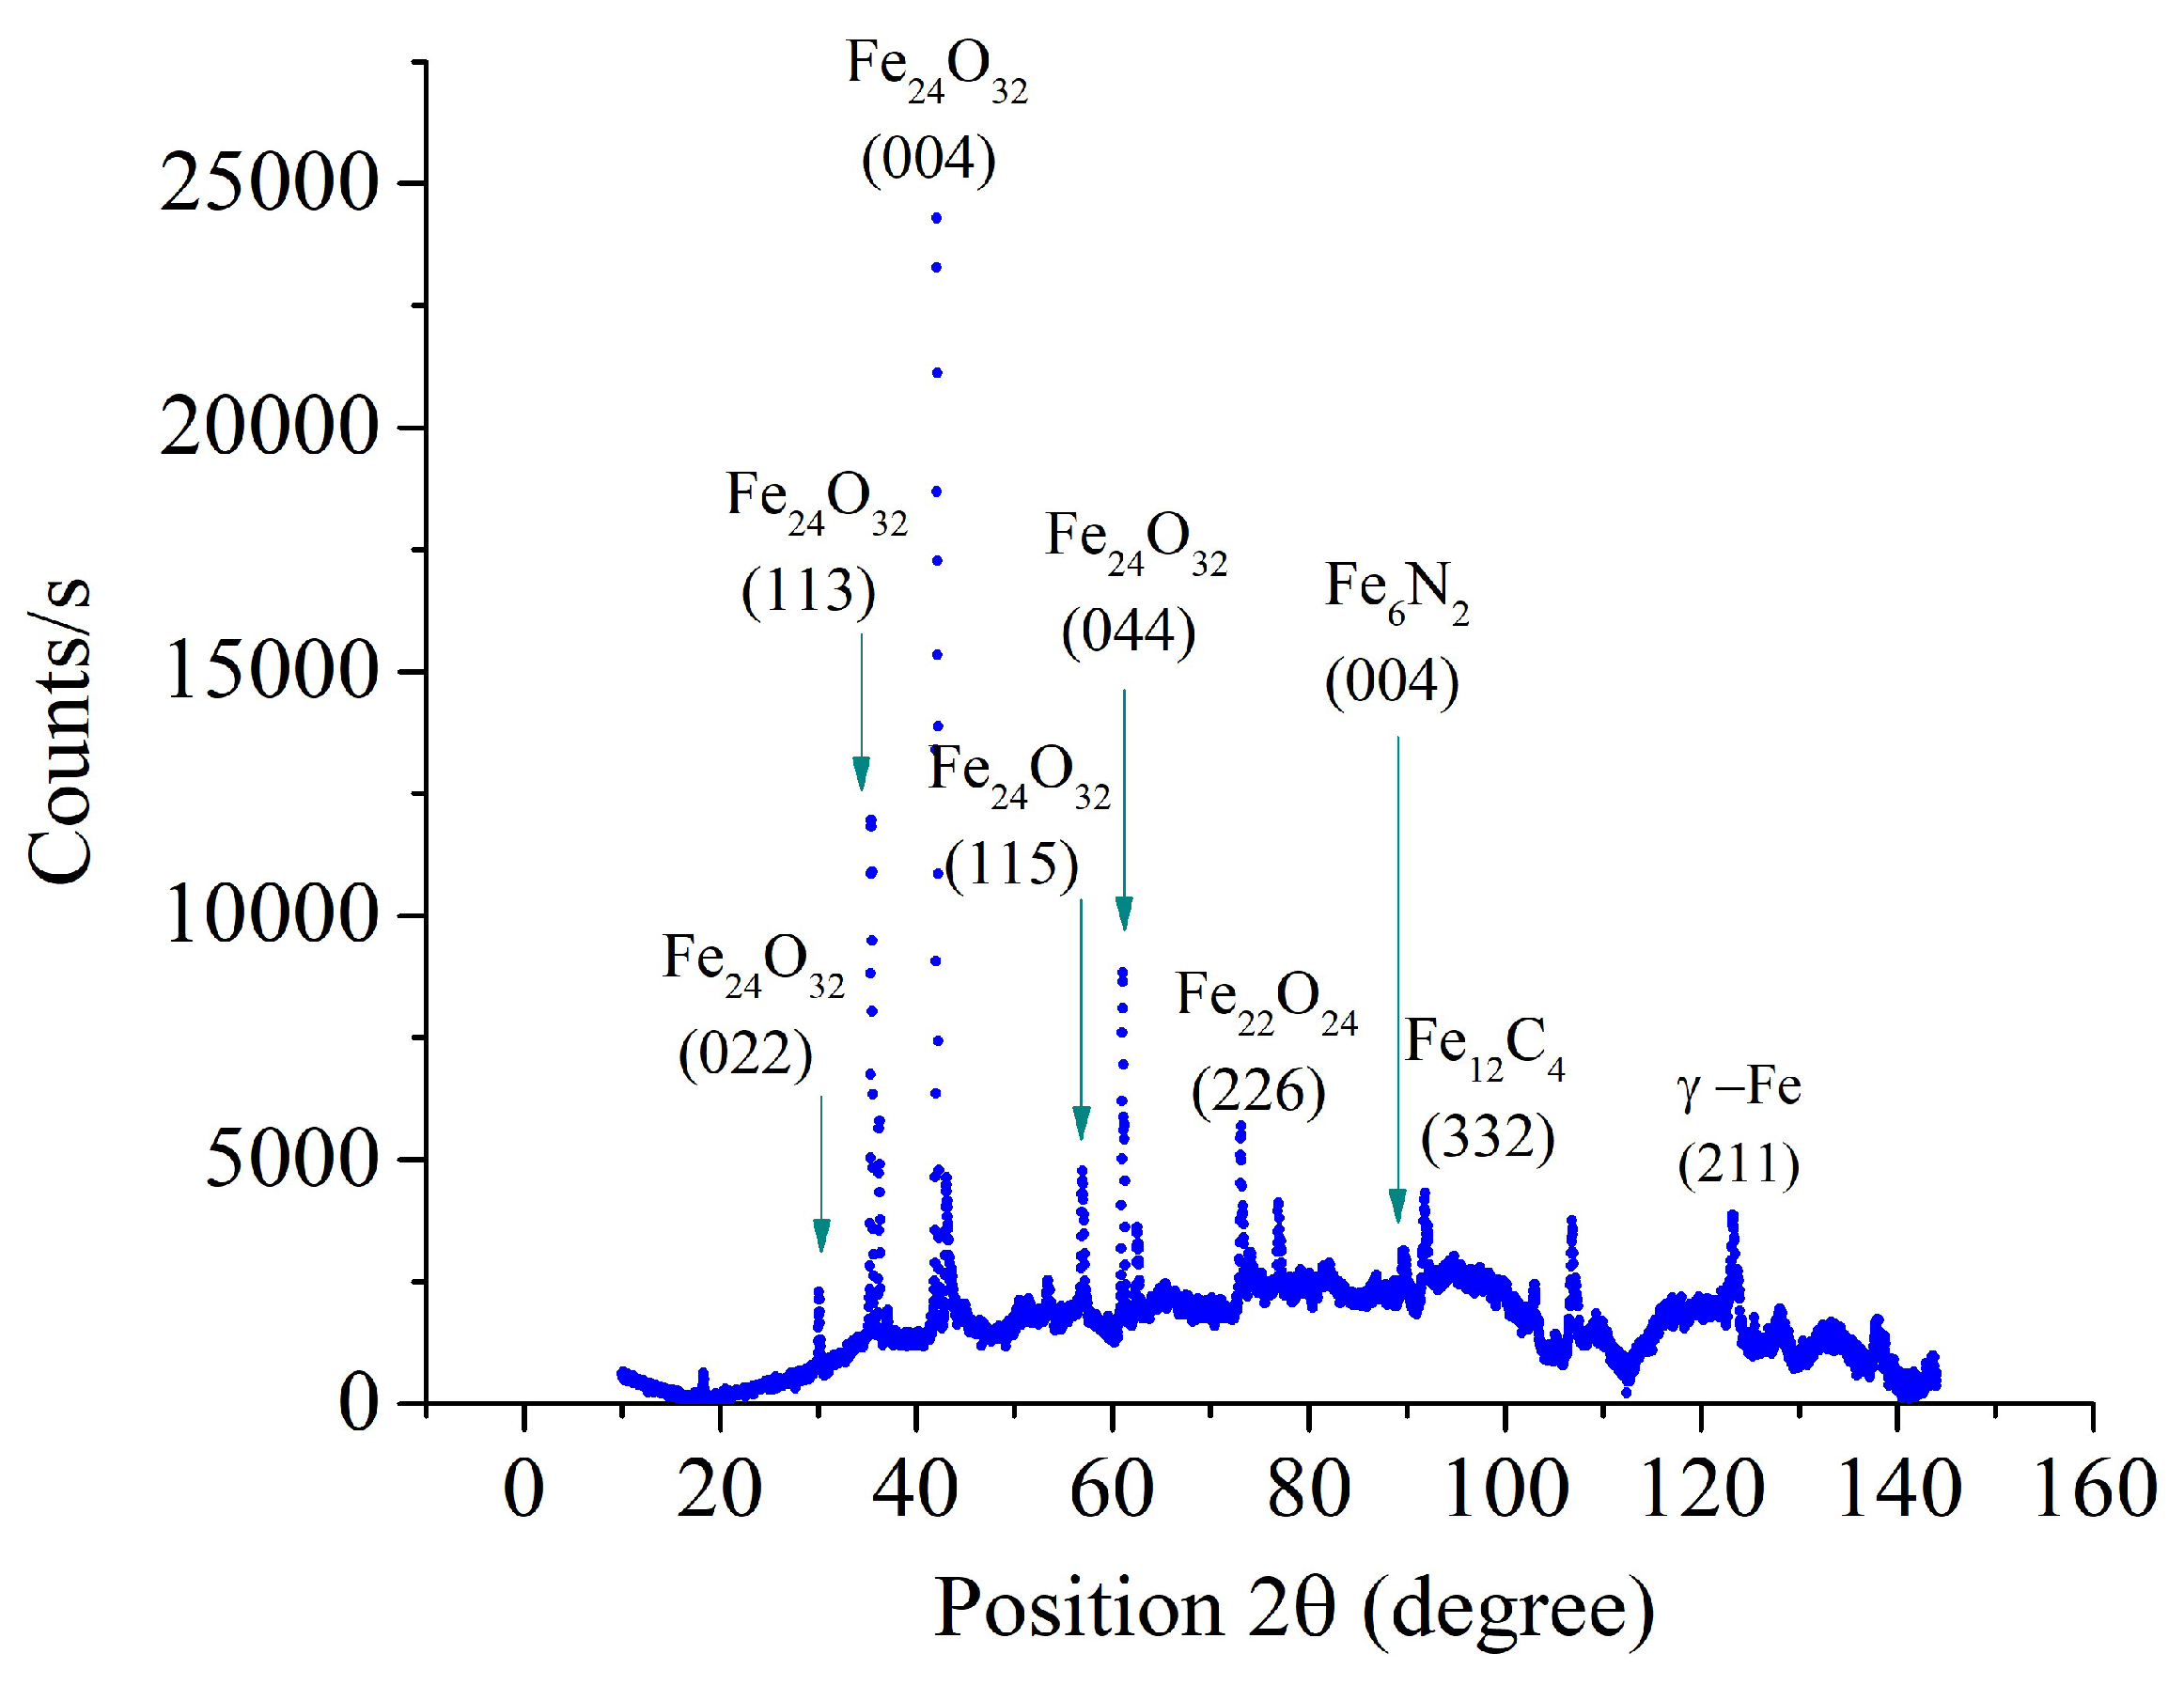
Figure 10.
Dependence of friction coefficient on sliding distance of the control and PENC samples at different temperatures. The counter body is hardened steel.
Figure 10.
Dependence of friction coefficient on sliding distance of the control and PENC samples at different temperatures. The counter body is hardened steel.
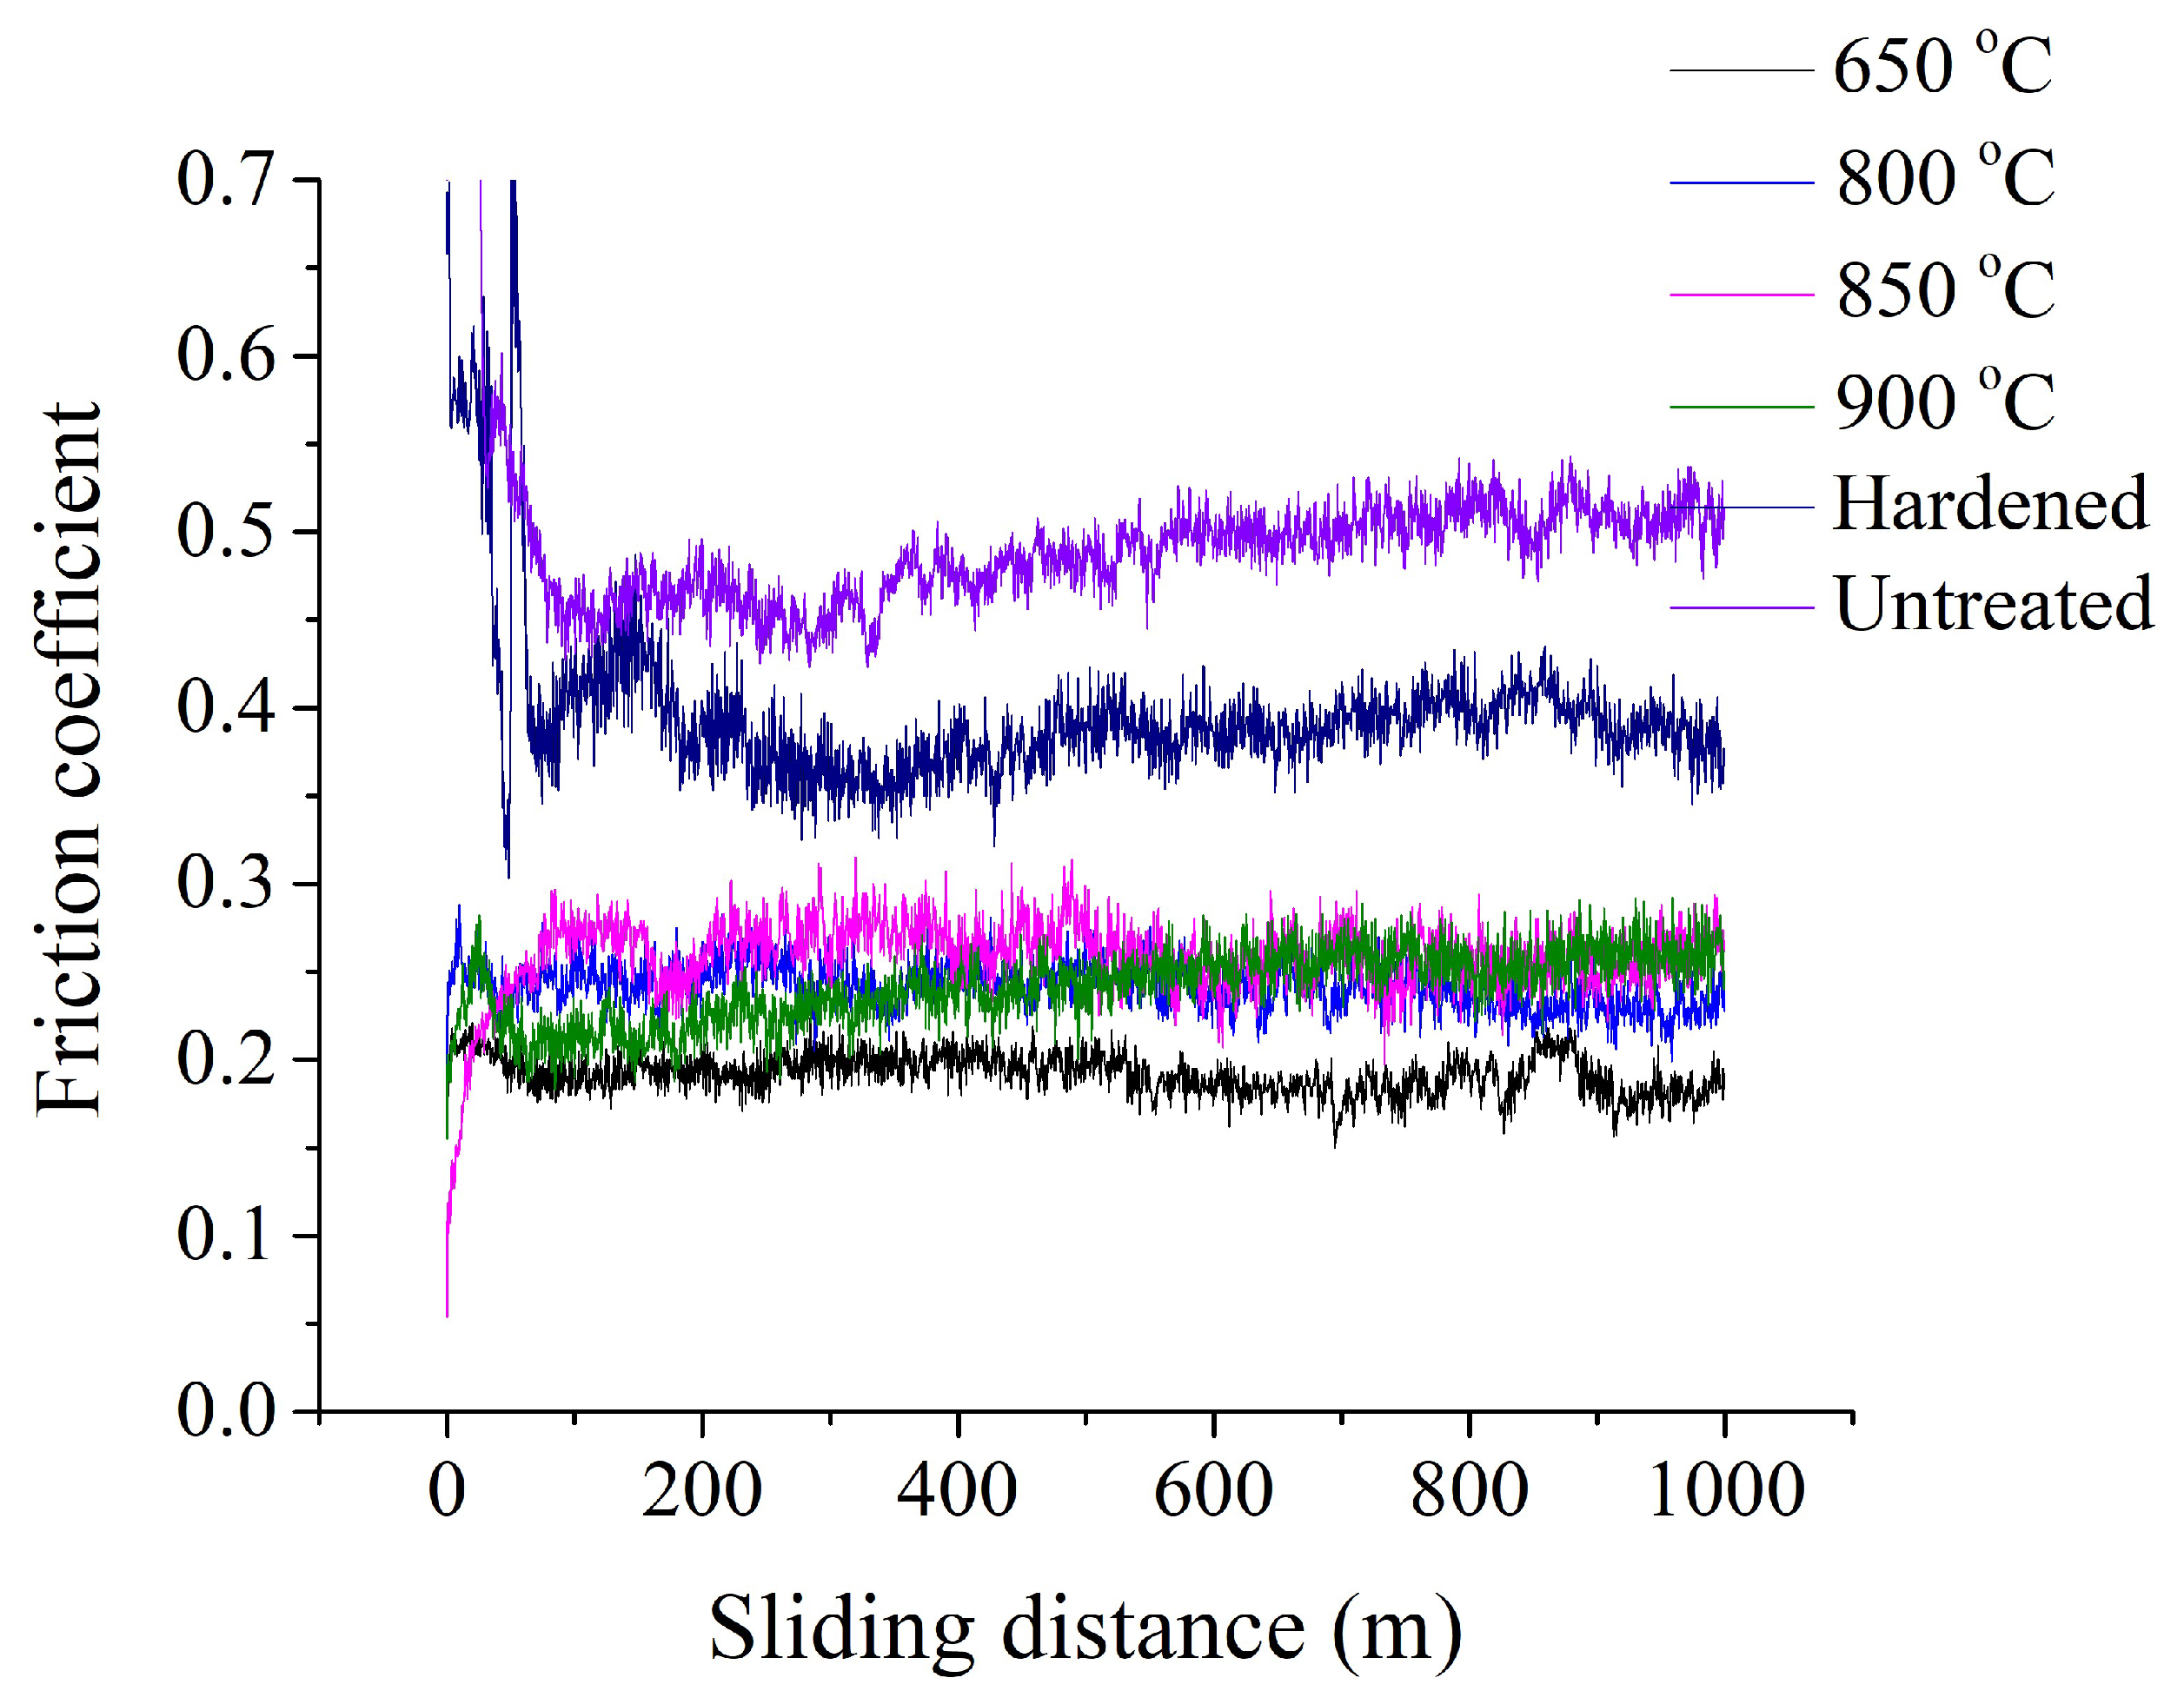
Figure 11.
Dependence of the friction coefficient averaged over the last 100 m of the sliding distance. The counter body is hardened steel.
Figure 11.
Dependence of the friction coefficient averaged over the last 100 m of the sliding distance. The counter body is hardened steel.
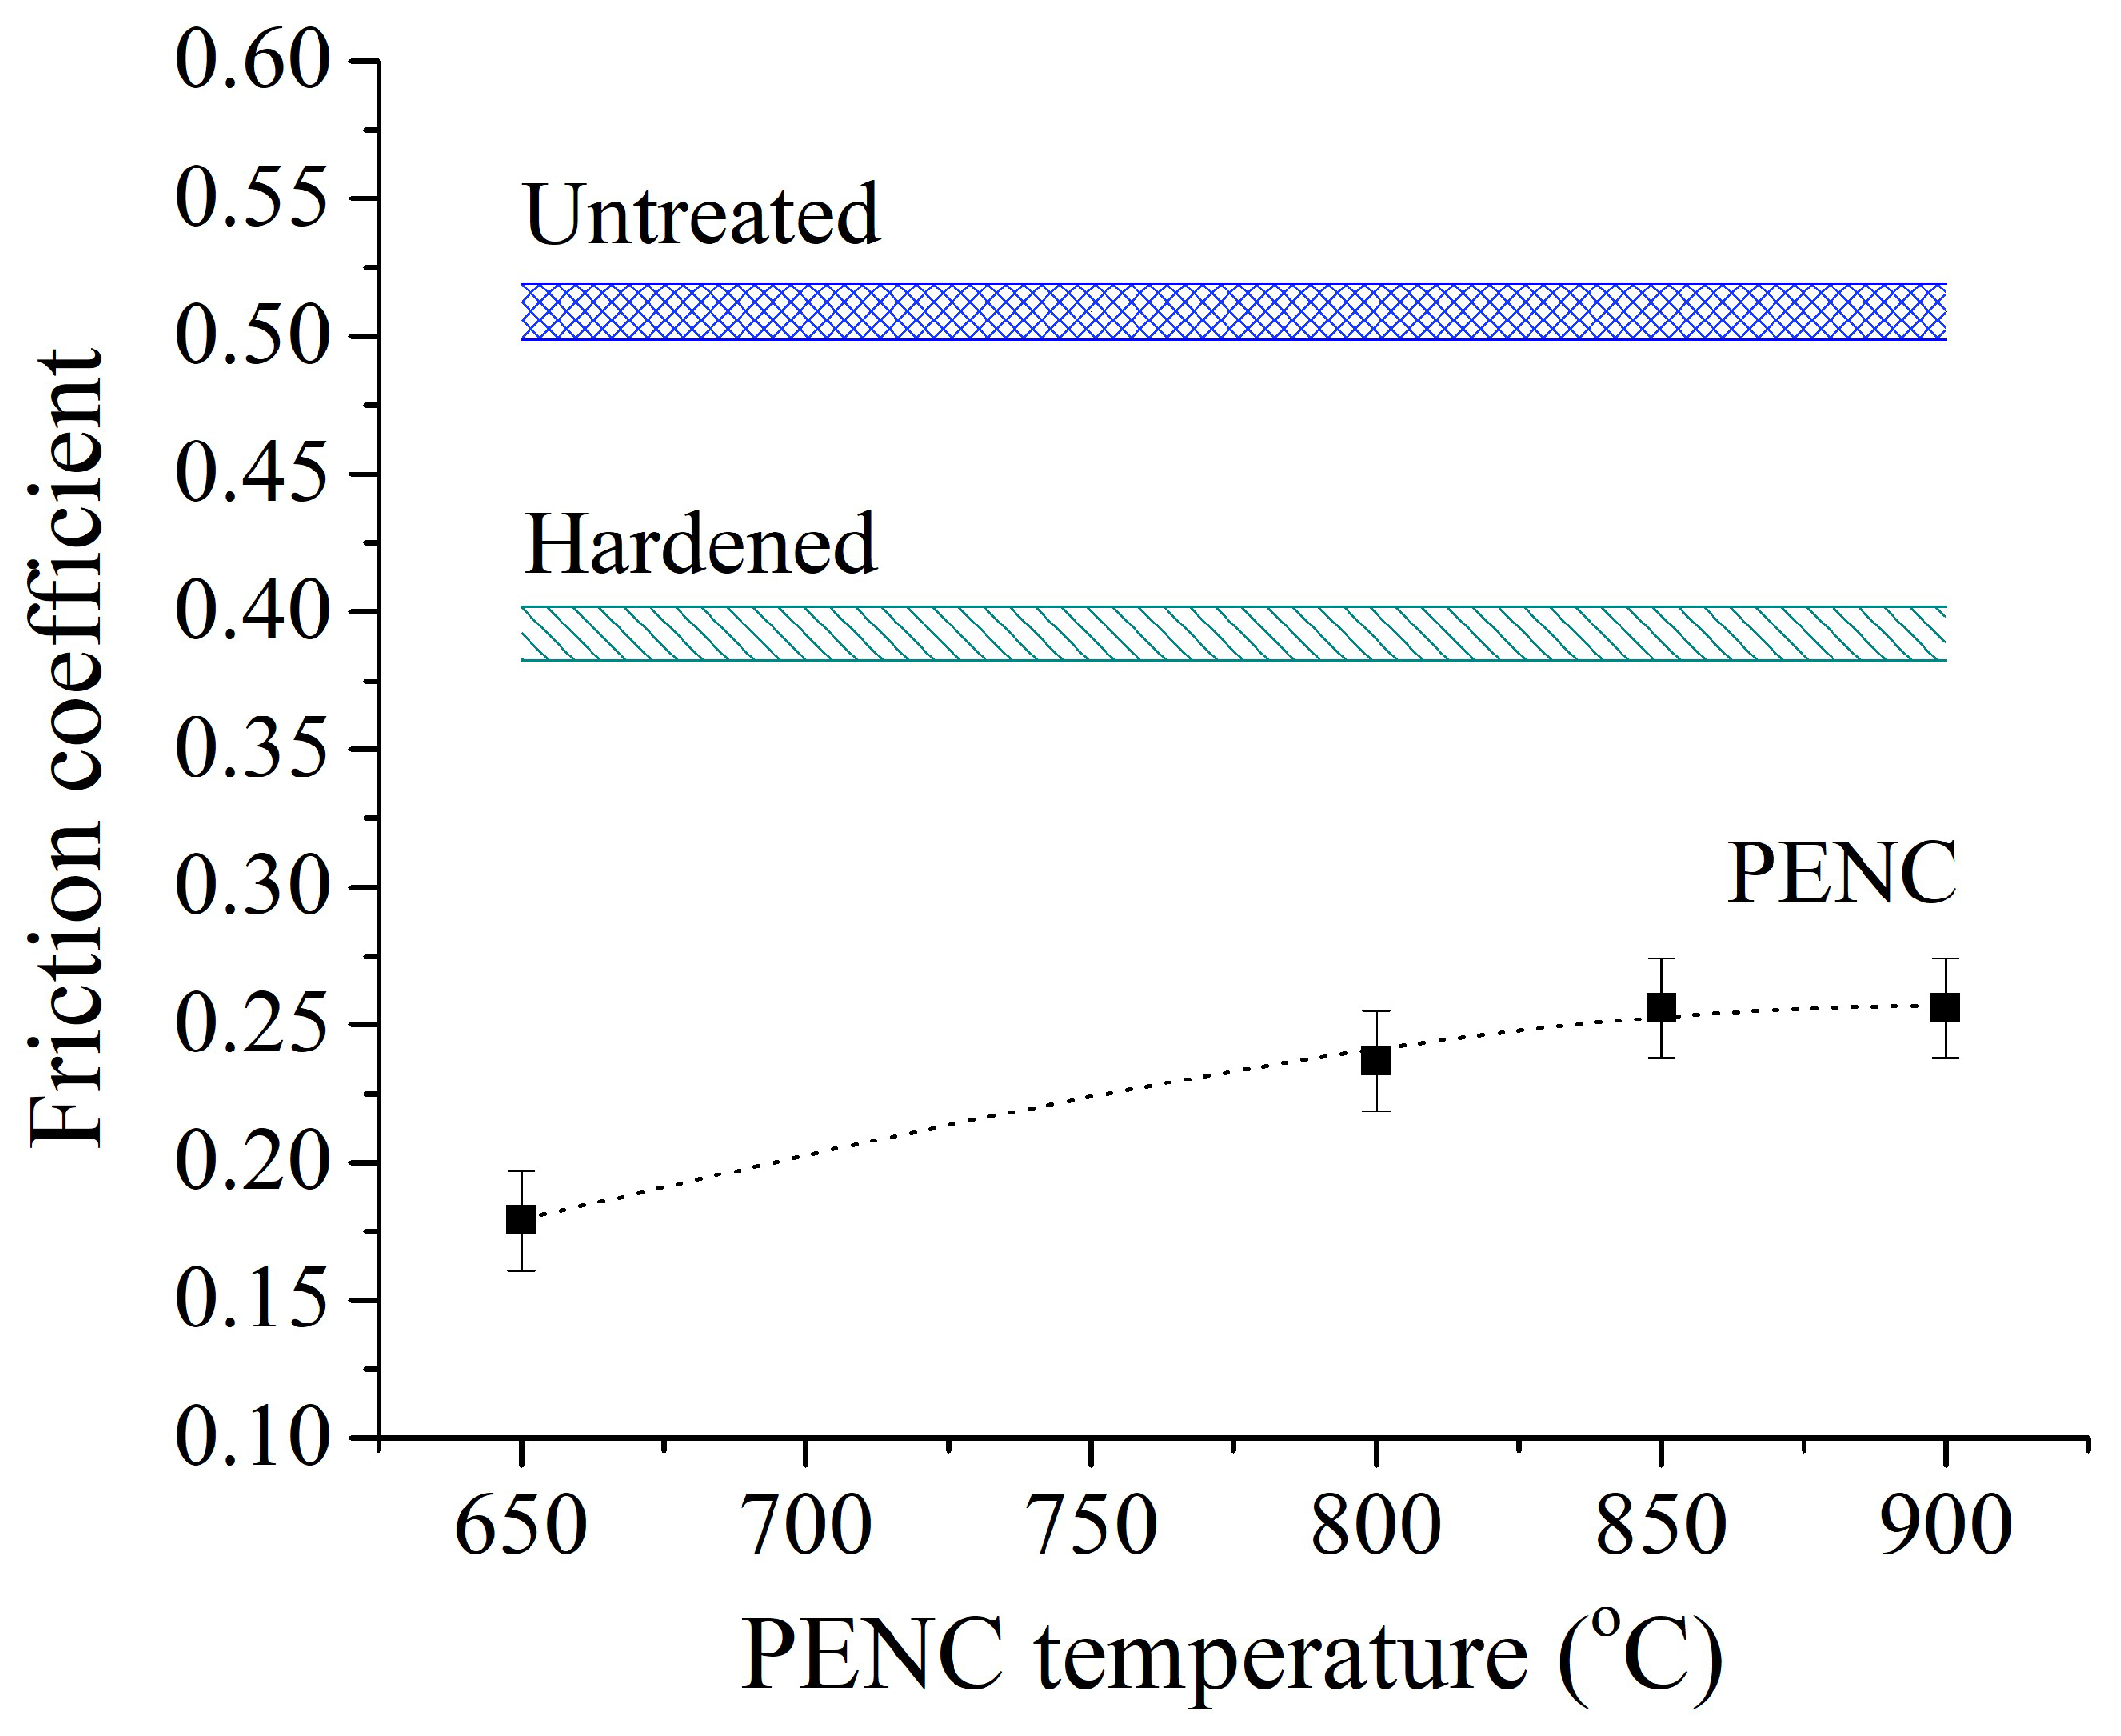
Figure 12.
Dependence of sample weight loss during friction. The counter body is hardened steel.
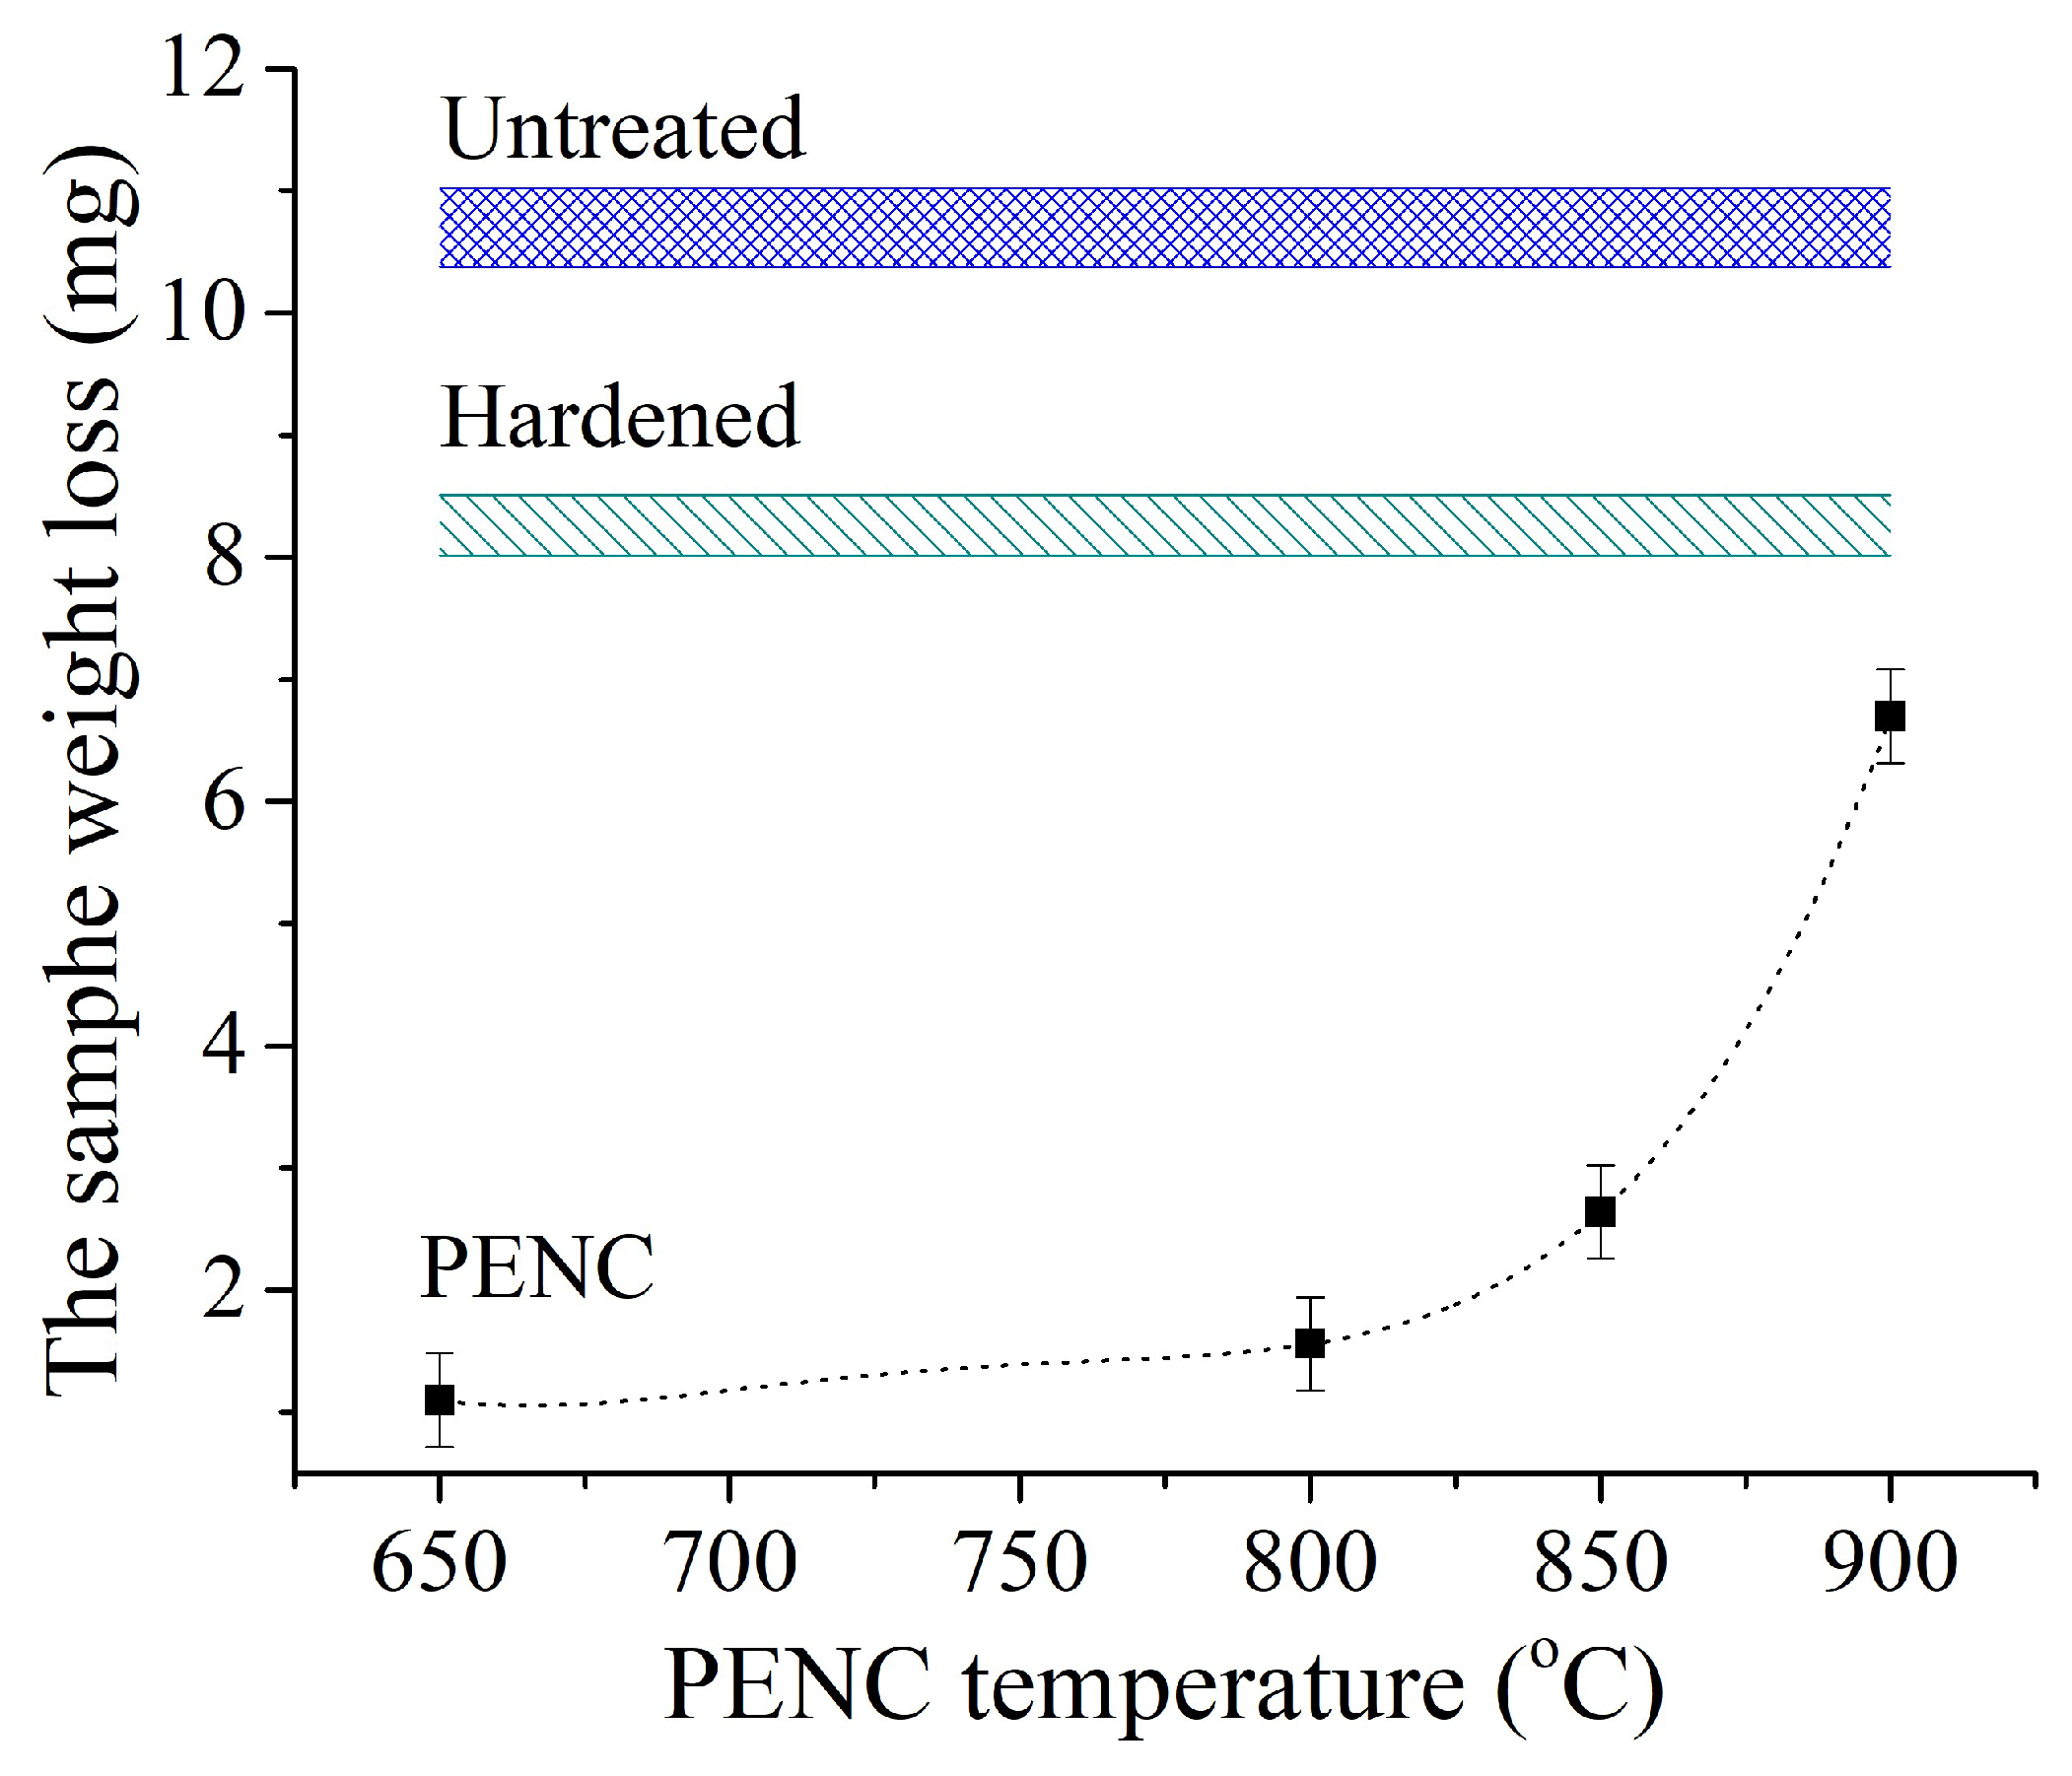
Figure 13.
Dependence of counter body weight loss during friction. The counter body is hardened steel.
Figure 13.
Dependence of counter body weight loss during friction. The counter body is hardened steel.
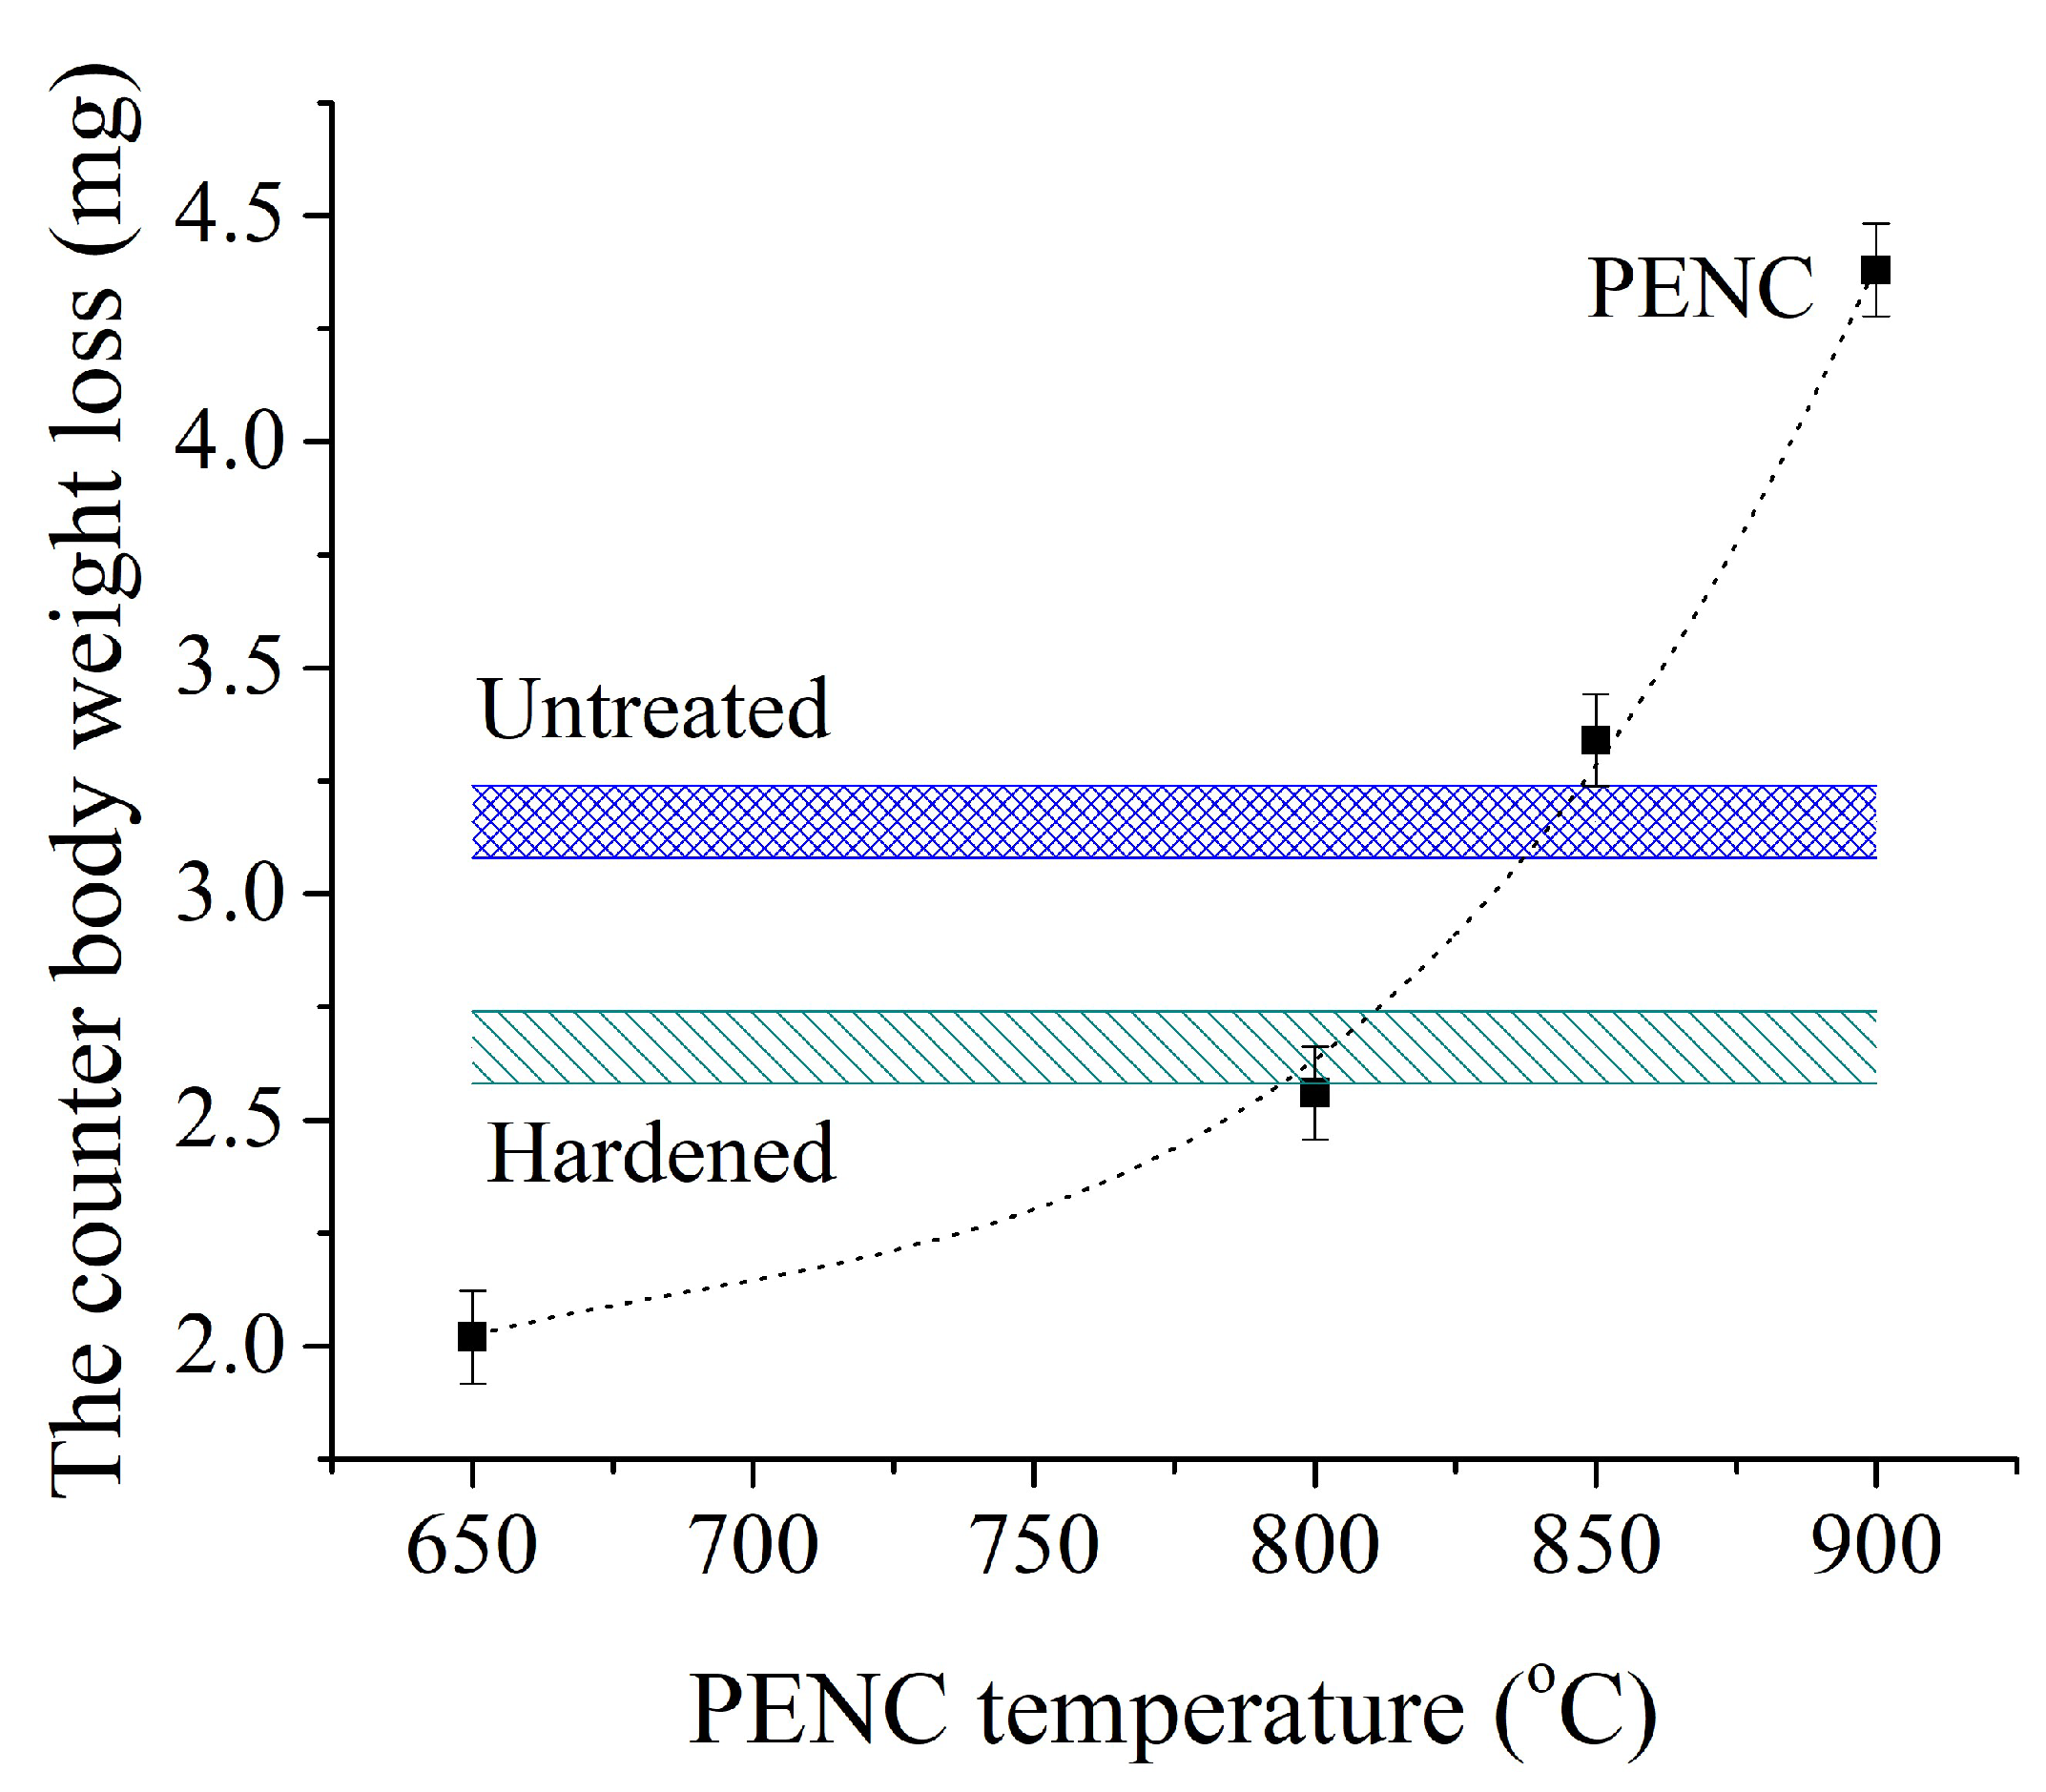
Figure 14.
Dependence of friction coefficient on sliding distance of the control and PENC samples at different temperatures. The counter body is tin-lead bronze.
Figure 14.
Dependence of friction coefficient on sliding distance of the control and PENC samples at different temperatures. The counter body is tin-lead bronze.
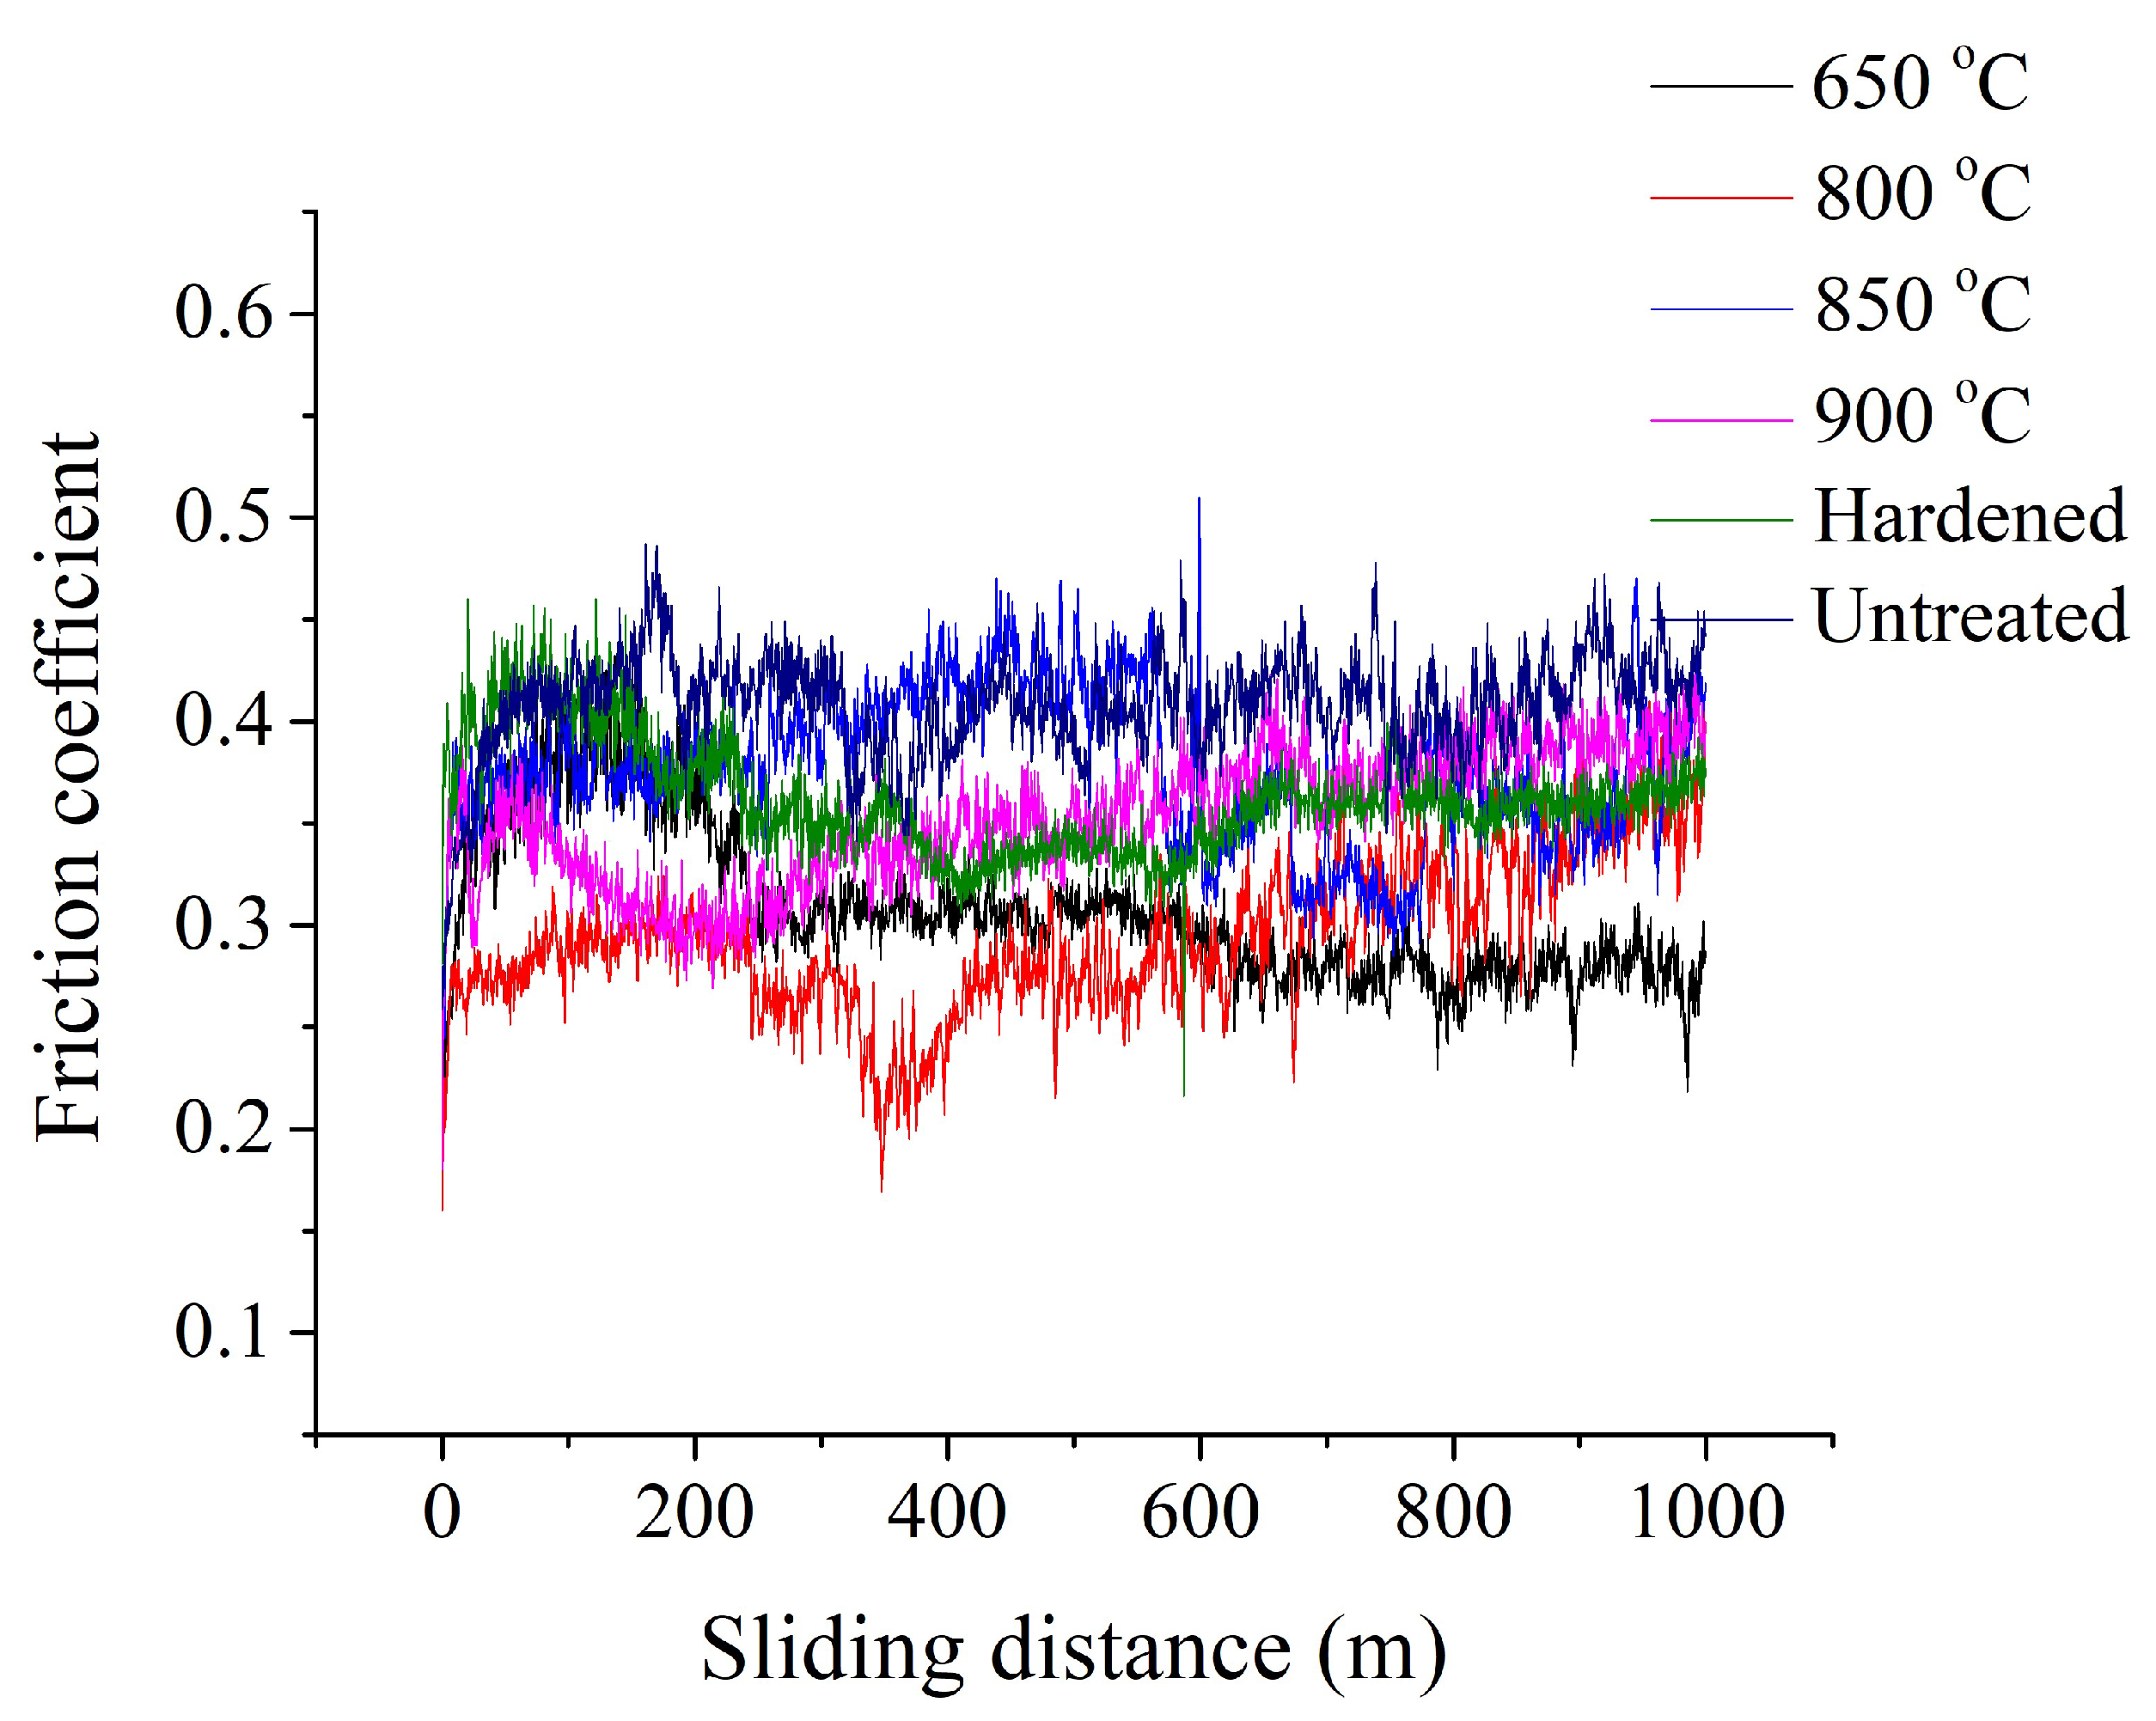
Figure 15.
Dependence of the friction coefficient averaged over the last 100 m of the sliding distance. The counter body is tin-lead bronze.
Figure 15.
Dependence of the friction coefficient averaged over the last 100 m of the sliding distance. The counter body is tin-lead bronze.
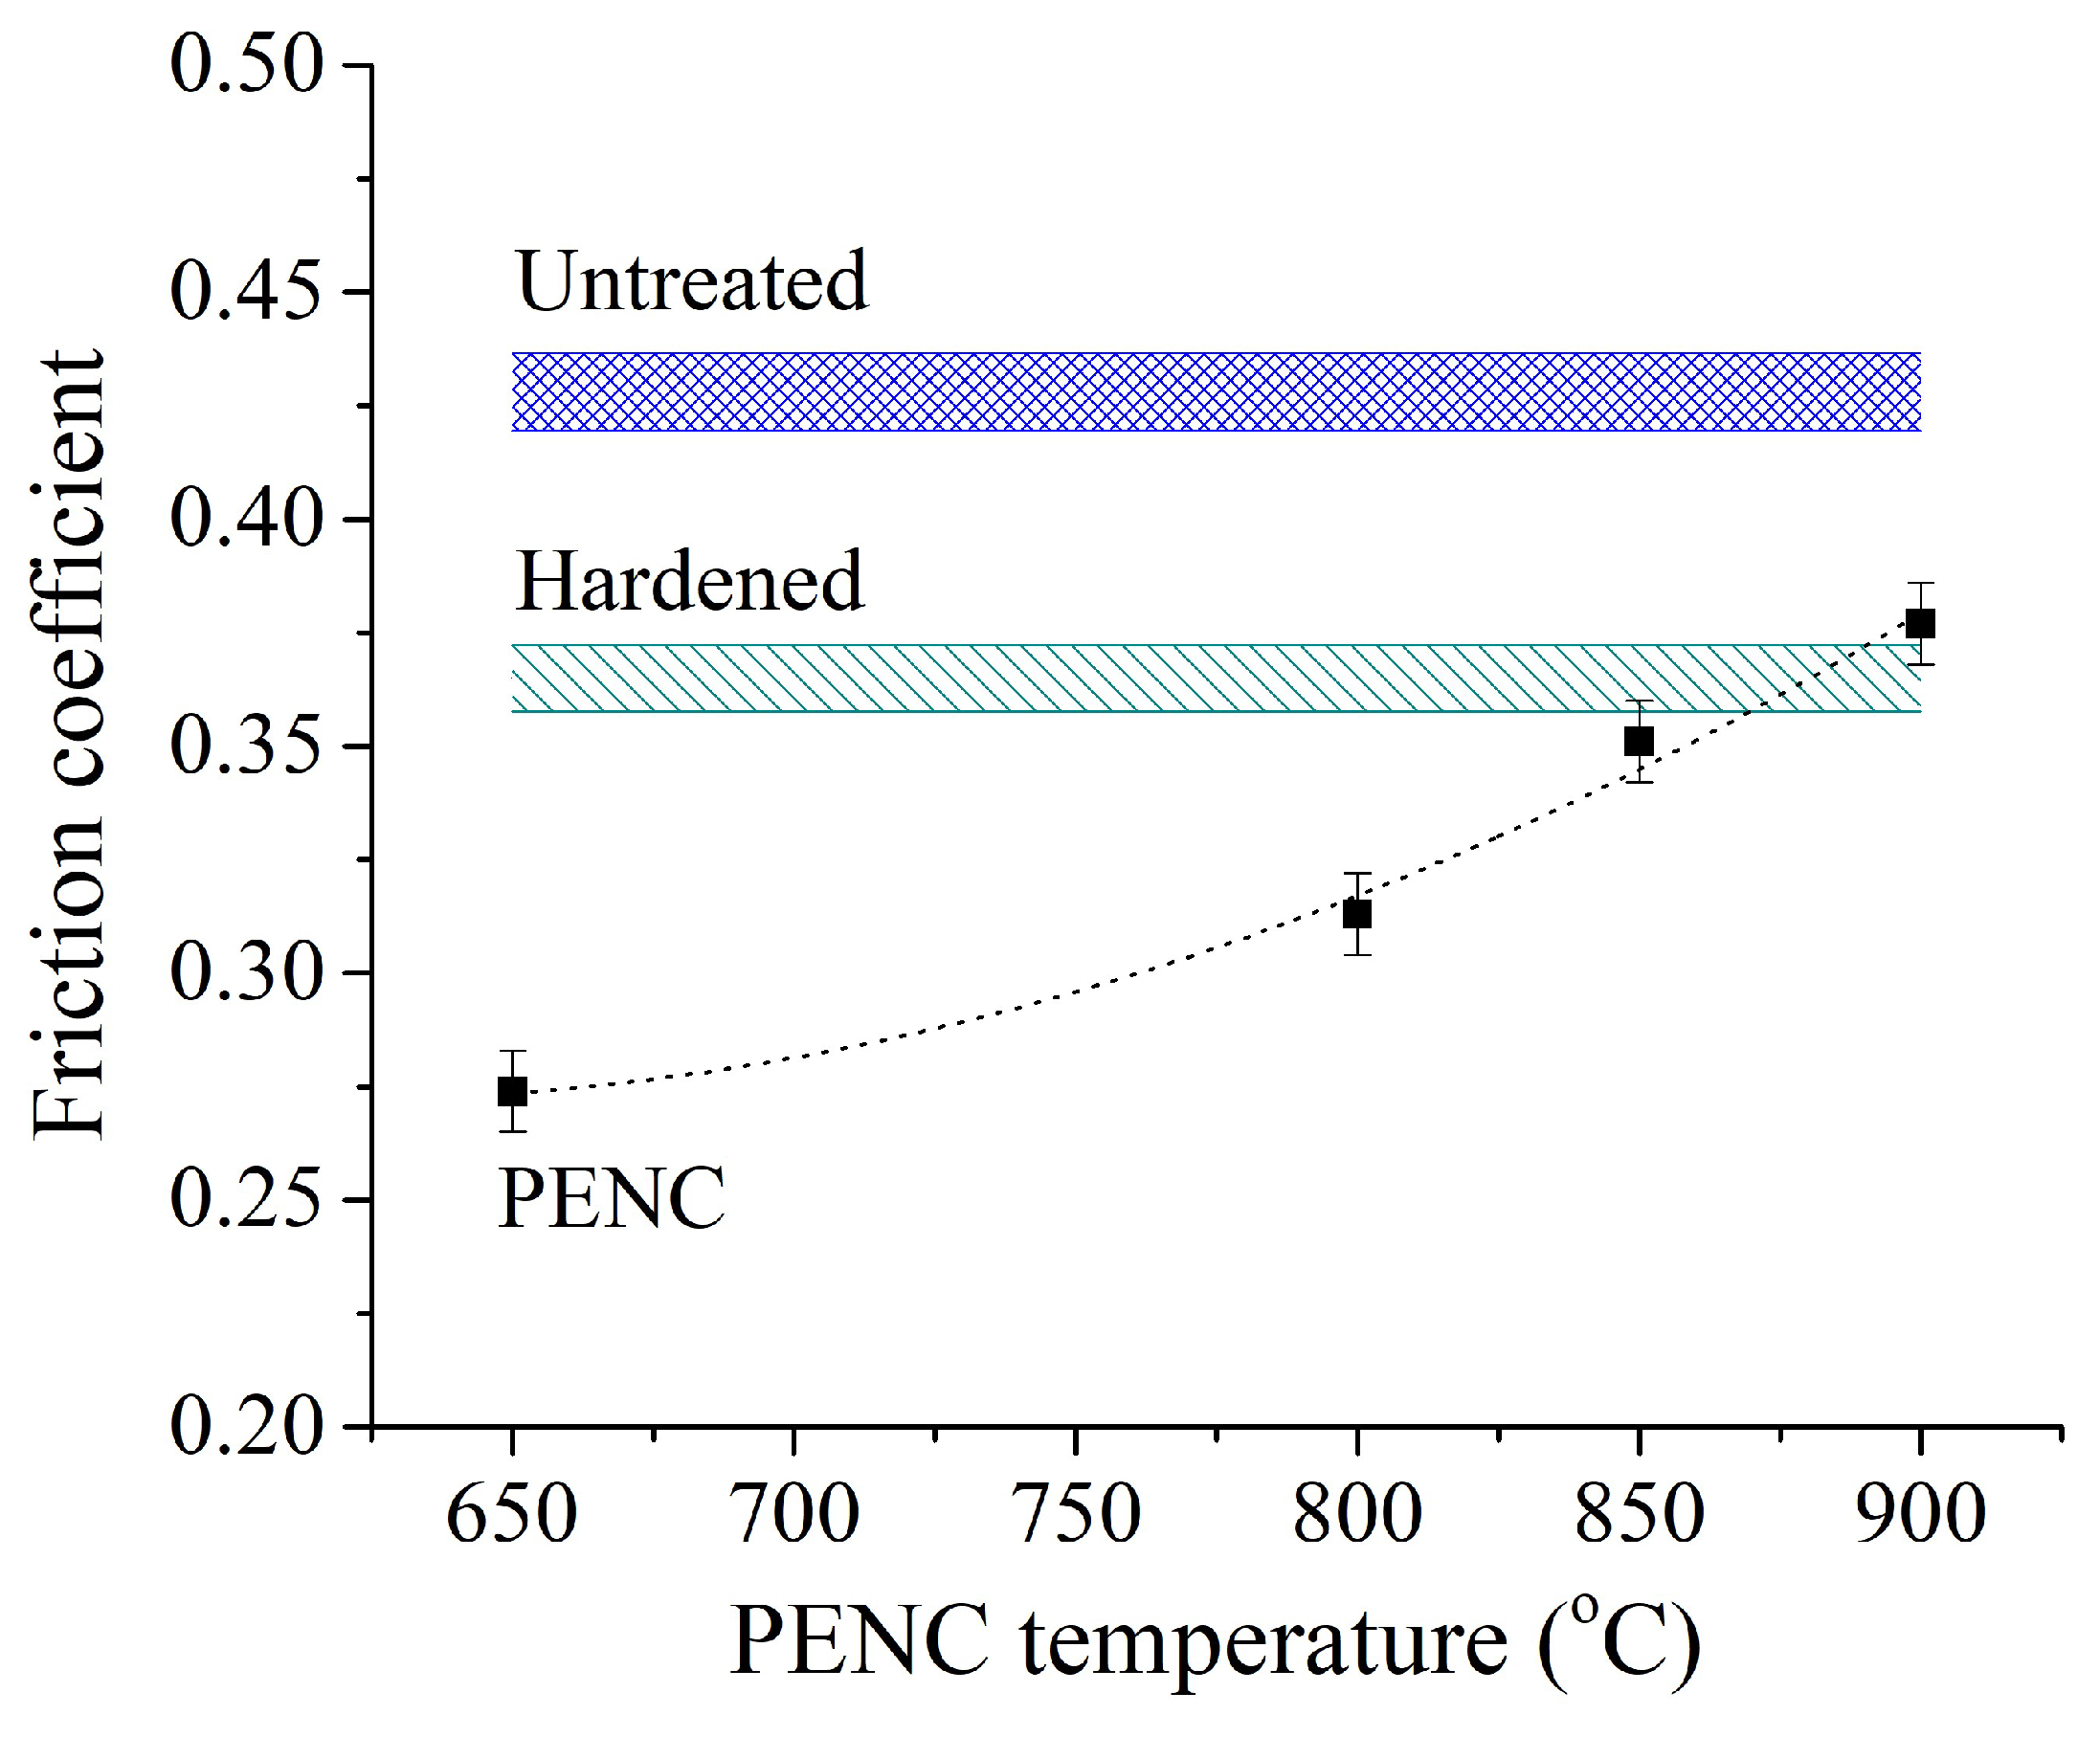
Figure 16.
Dependence of sample weight loss during friction. The counter body is tin-lead bronze.
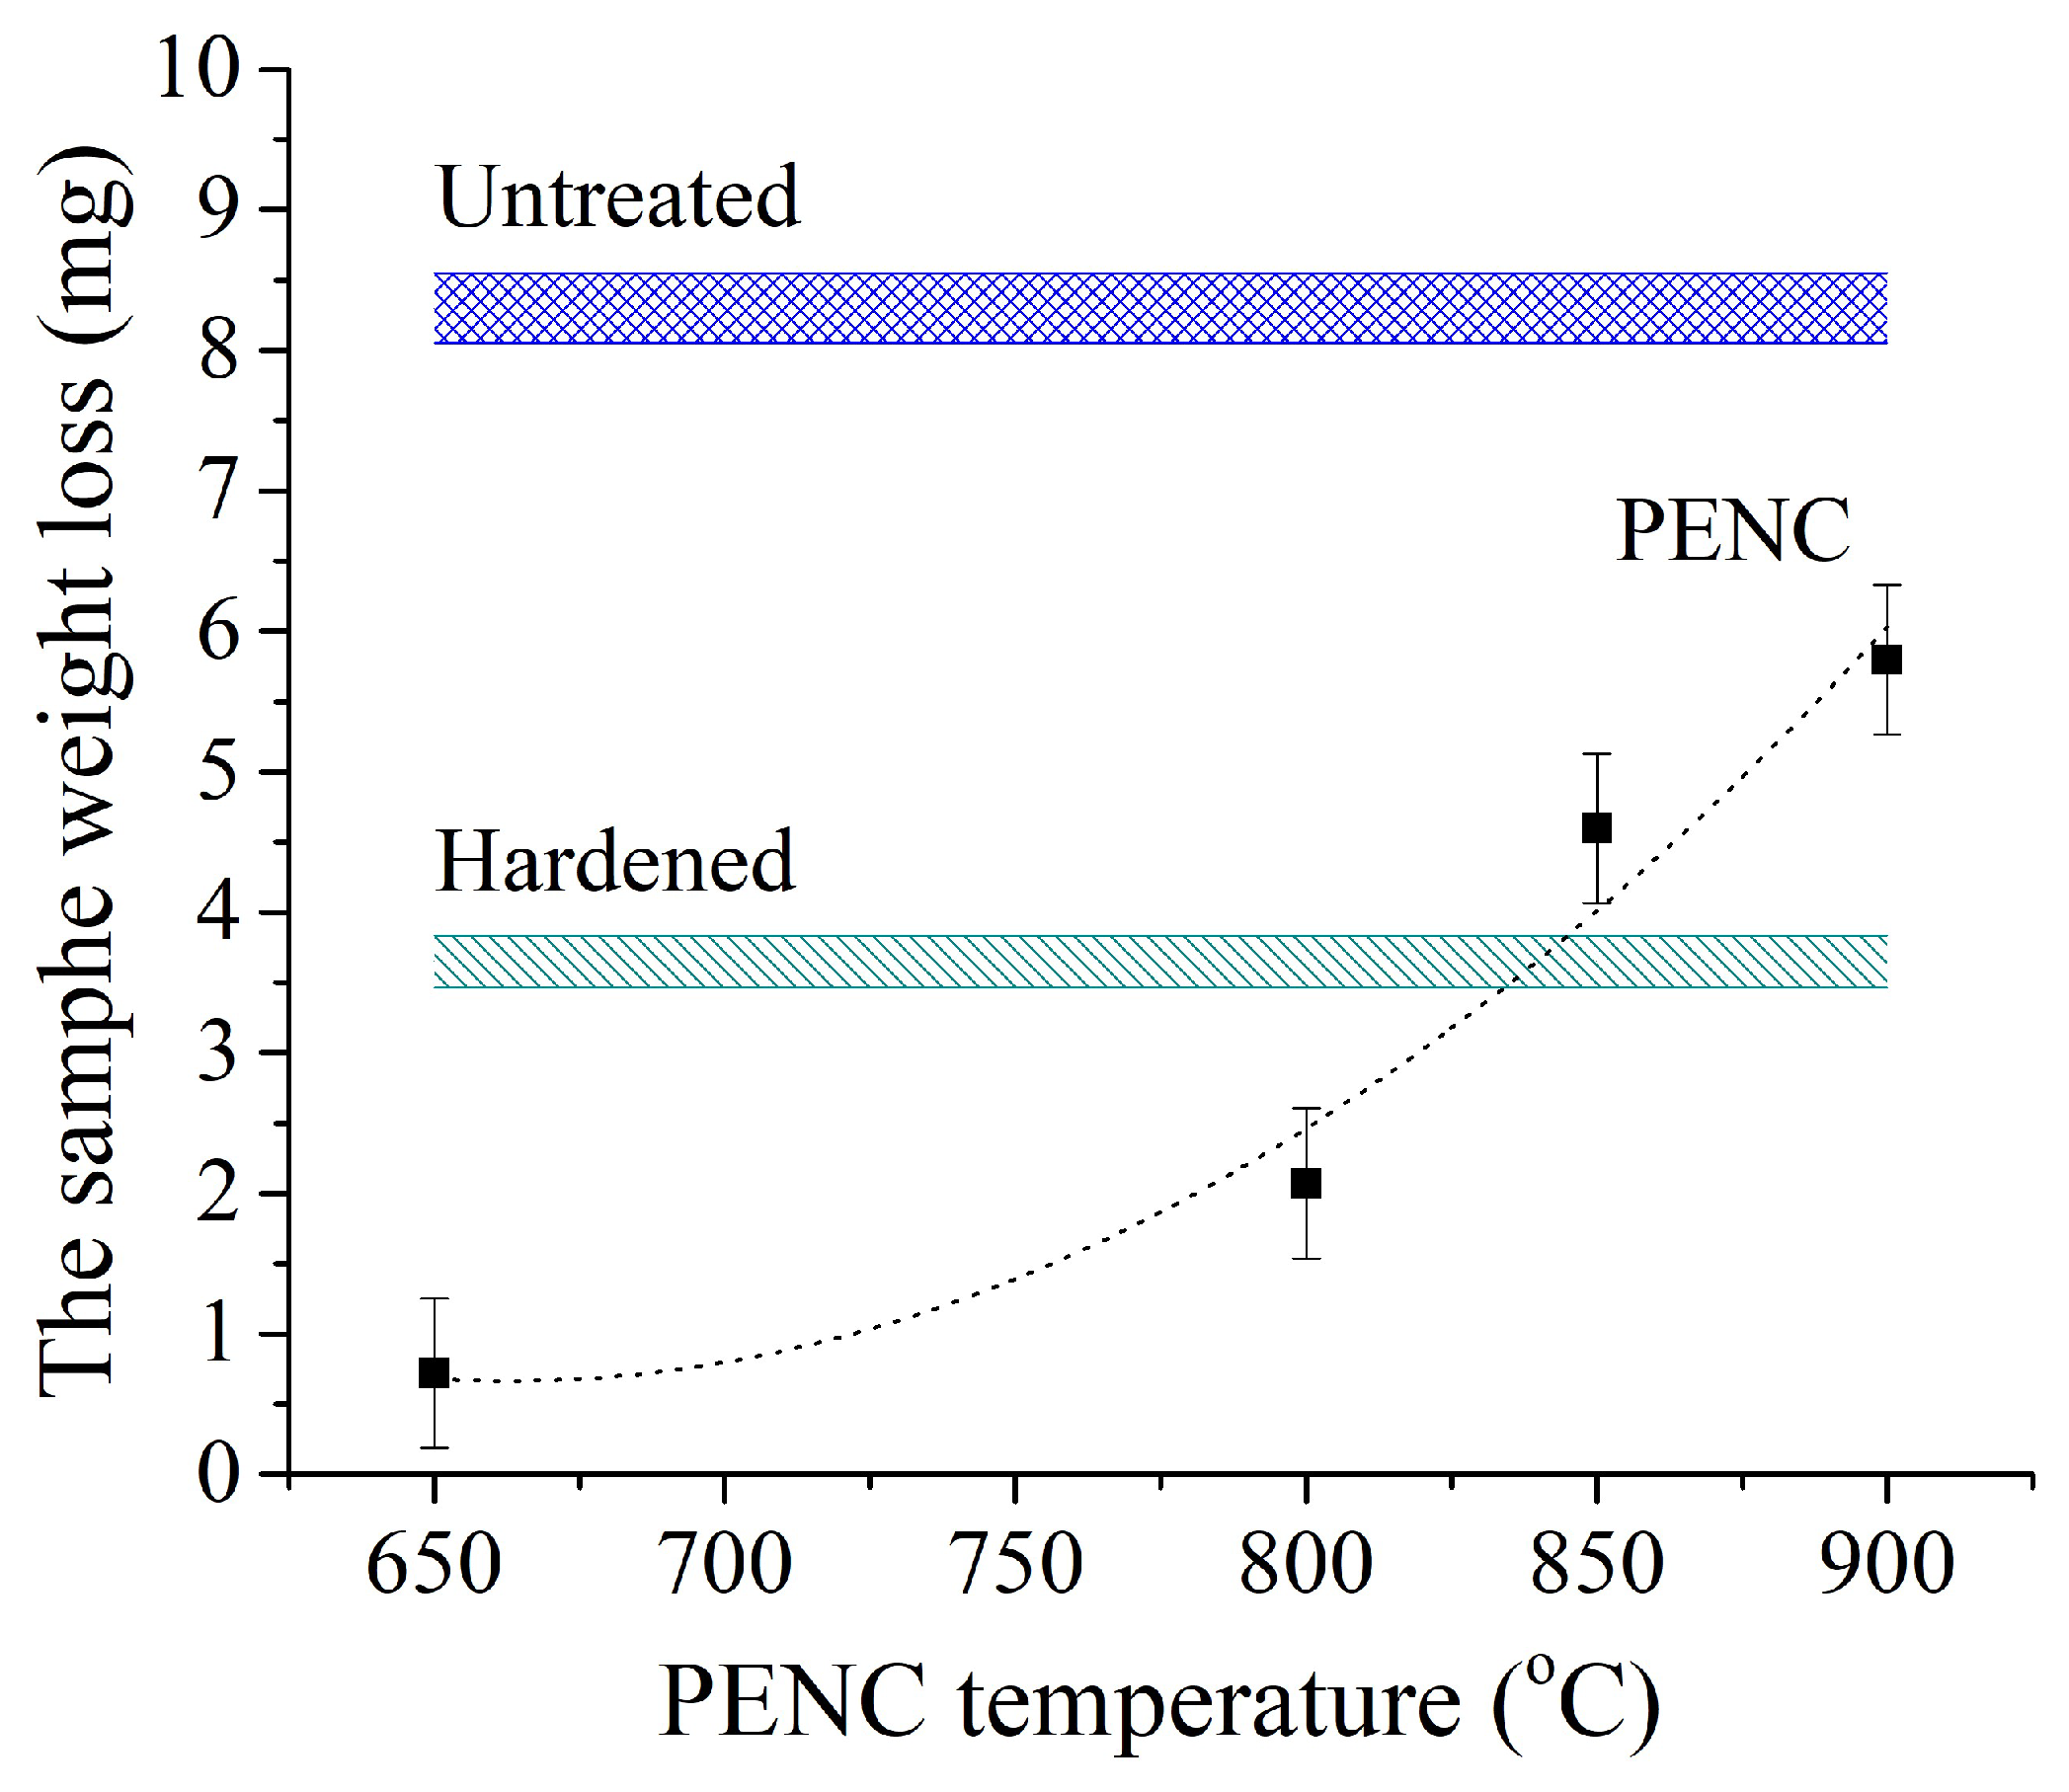
Figure 17.
Dependence of counter body weight loss during friction. The counter body is tin-lead bronze.
Figure 17.
Dependence of counter body weight loss during friction. The counter body is tin-lead bronze.
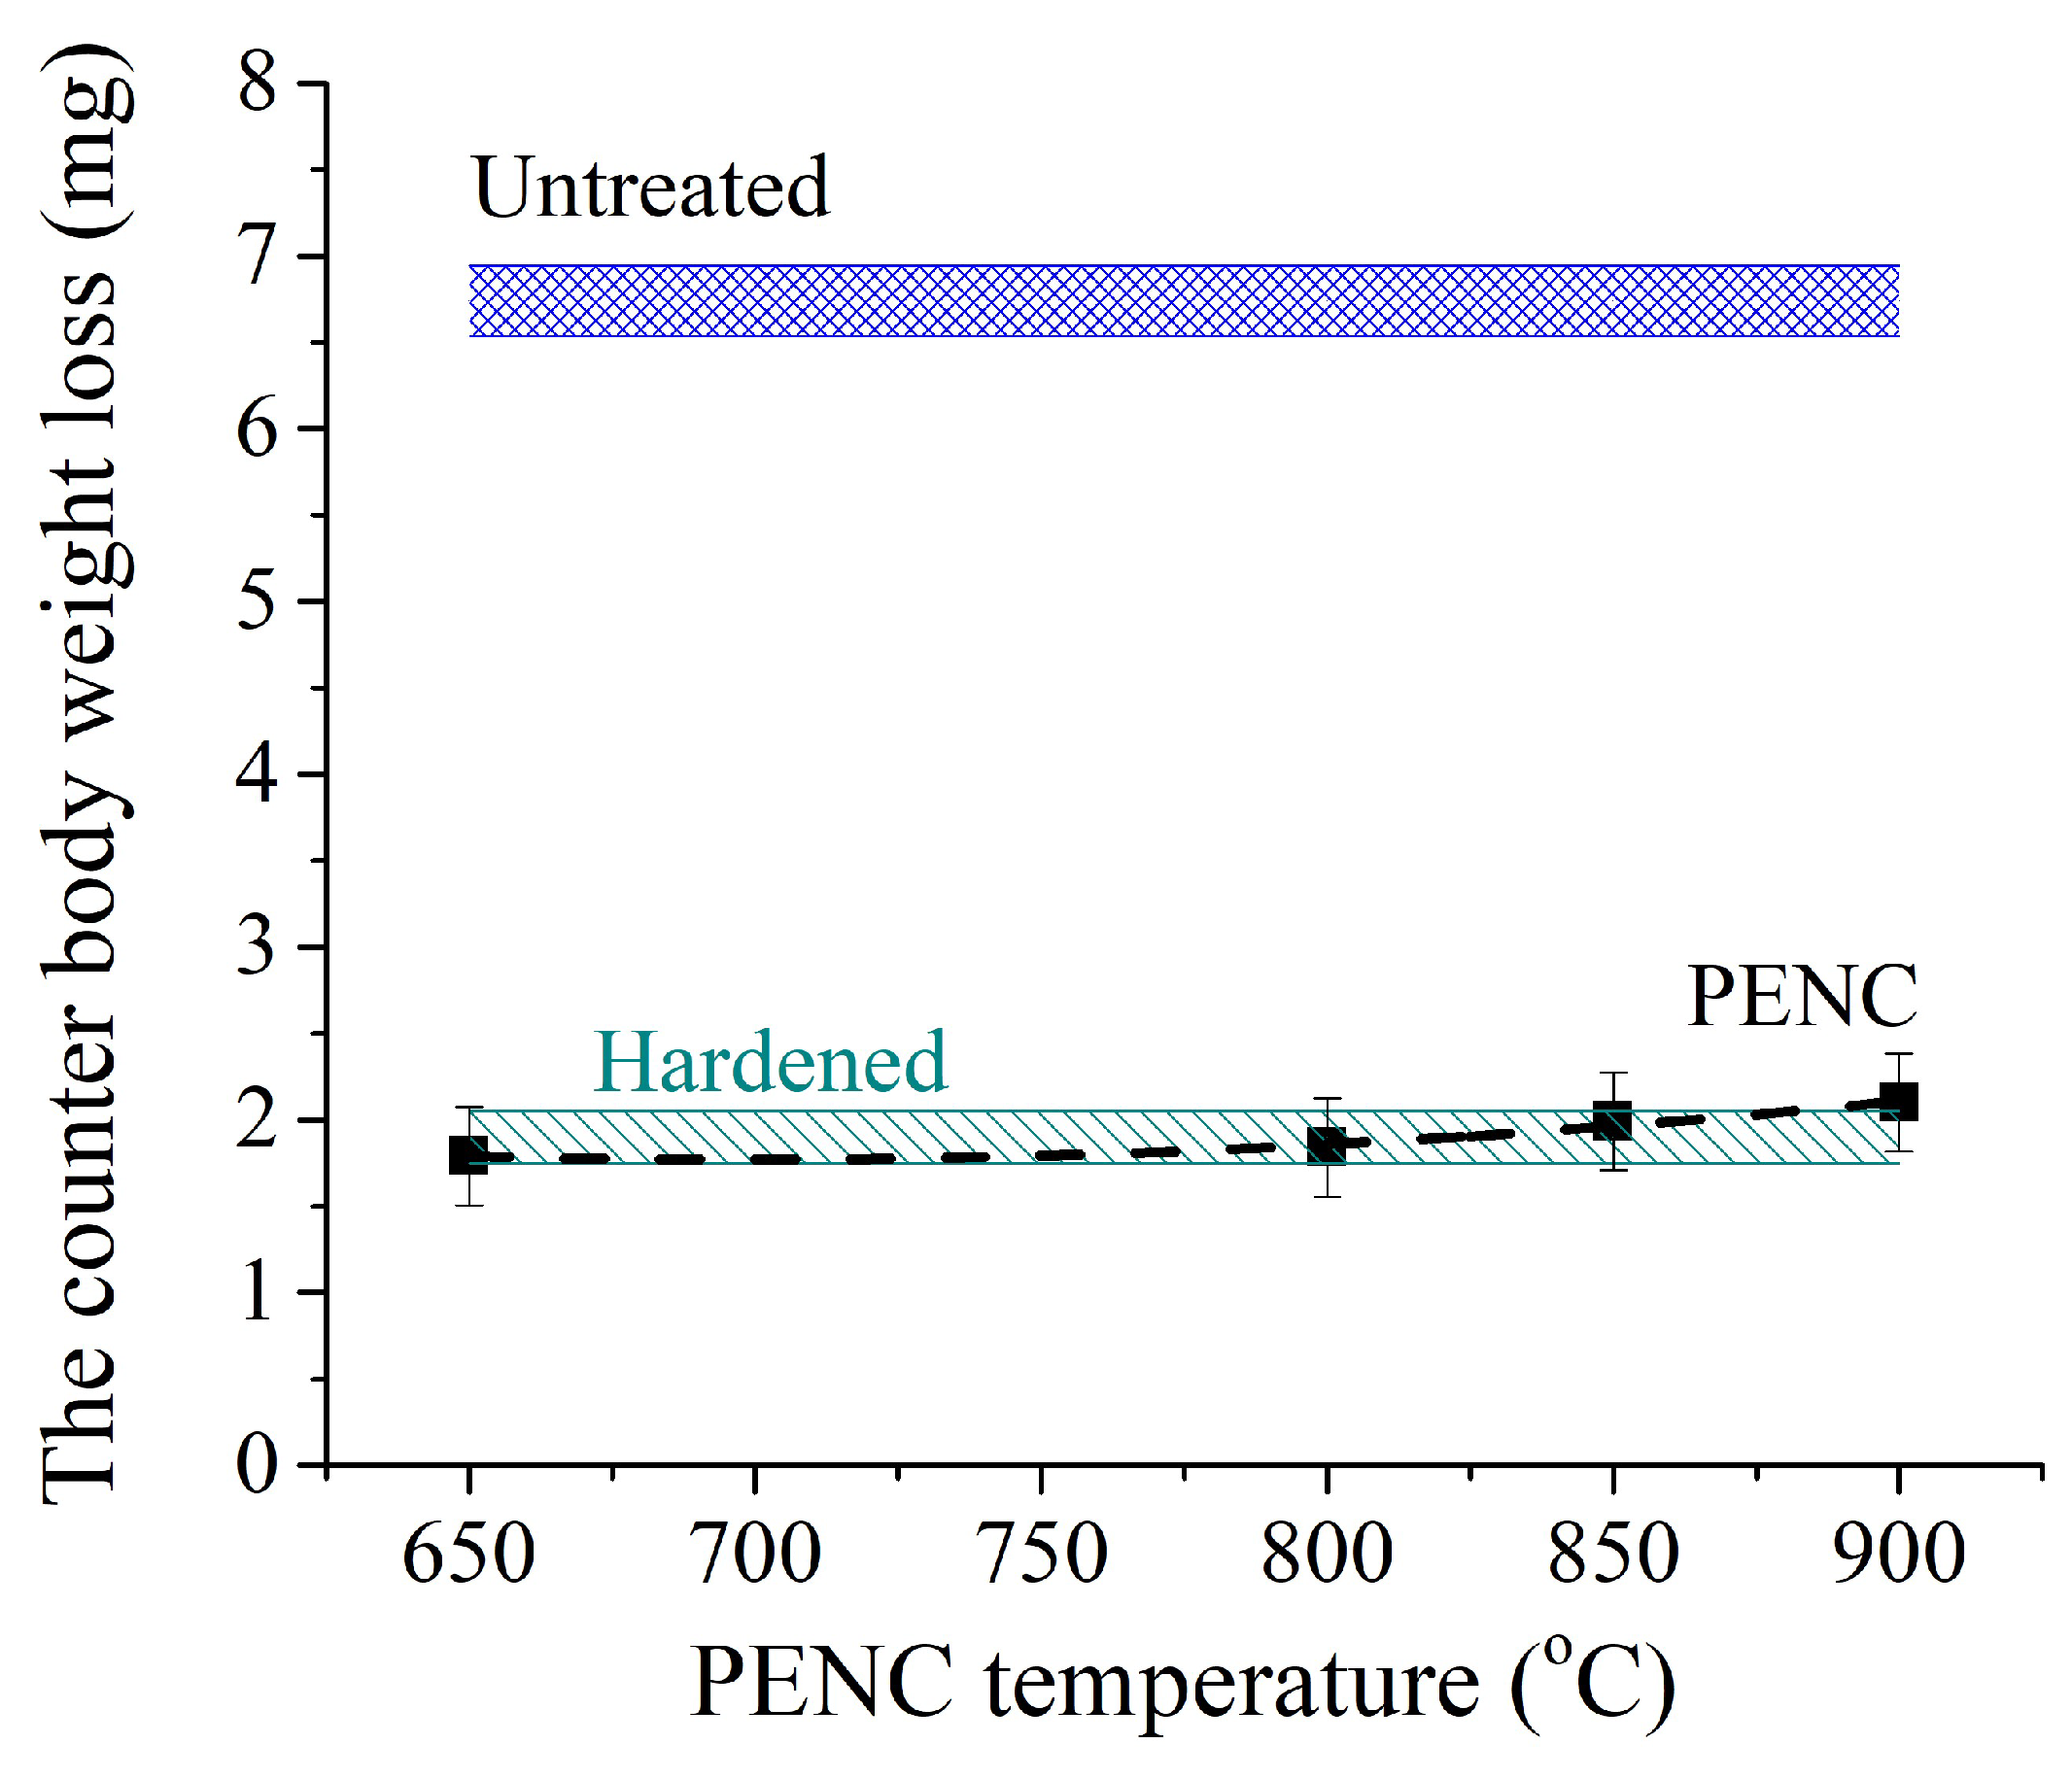

Table 1.
EDX analysis results.
| PENC temperature (°C) | 650 | 800 | 850 | 900 |
| Nitrogen concentration (wt.%) | 4.24 | 4.19 | 3.72 | 3.20 |
Table 2.
The values of the Kragelsky-Kombalov criterion Δ for PENC at different temperatures and control samples before and after tribological test.
Table 2.
The values of the Kragelsky-Kombalov criterion Δ for PENC at different temperatures and control samples before and after tribological test.
| Treatment mode | PENC 650 °C | PENC 800 °C | PENC 850 °C | PENC 900 °C | hardened | untreated |
|---|---|---|---|---|---|---|
| Before friction | 0.392±0.008 | 0.397±0.008 | 0.401±0.008 | 0.410±0.008 | 0.870±0.007 | 0.904±0.018 |
| After friction on hardened steel | 0.301±0.006 | 0.307±0.006 | 0.318±0.006 | 0.304±0.006 | 0.586±0.012 | 0.611±0.012 |
| After friction on tin-lead bronze | 0.318±0.006 | 0.320±0.006 | 0.317±0.006 | 0.302±0.006 | 0.605±0.012 | 0.703±0.014 |
Table 3.
The values of the relative penetration of the sample into the counter body surface h/r for PENC at different temperatures and control samples after tribological test.
Table 3.
The values of the relative penetration of the sample into the counter body surface h/r for PENC at different temperatures and control samples after tribological test.
| Treatment mode | PENC 650 °C | PENC 800 °C | PENC 850 °C | PENC 900 °C | hardened | untreated |
|---|---|---|---|---|---|---|
| After friction on hardened steel | 0.03 | 0.03 | 0.05 | 0.04 | 0.15 | 0.20 |
| After friction on tin-lead bronze | 0.04 | 0.04 | 0.04 | 0.06 | 0.08 | 0.16 |
Disclaimer/Publisher’s Note: The statements, opinions and data contained in all publications are solely those of the individual author(s) and contributor(s) and not of MDPI and/or the editor(s). MDPI and/or the editor(s) disclaim responsibility for any injury to people or property resulting from any ideas, methods, instructions or products referred to in the content. |
© 2023 by the authors. Licensee MDPI, Basel, Switzerland. This article is an open access article distributed under the terms and conditions of the Creative Commons Attribution (CC BY) license (http://creativecommons.org/licenses/by/4.0/).
Copyright: This open access article is published under a Creative Commons CC BY 4.0 license, which permit the free download, distribution, and reuse, provided that the author and preprint are cited in any reuse.


