Submitted:
17 October 2023
Posted:
18 October 2023
You are already at the latest version
Abstract
Keywords:
1. Introduction
2. 1×2 Y-Junction Optical Power Splitters
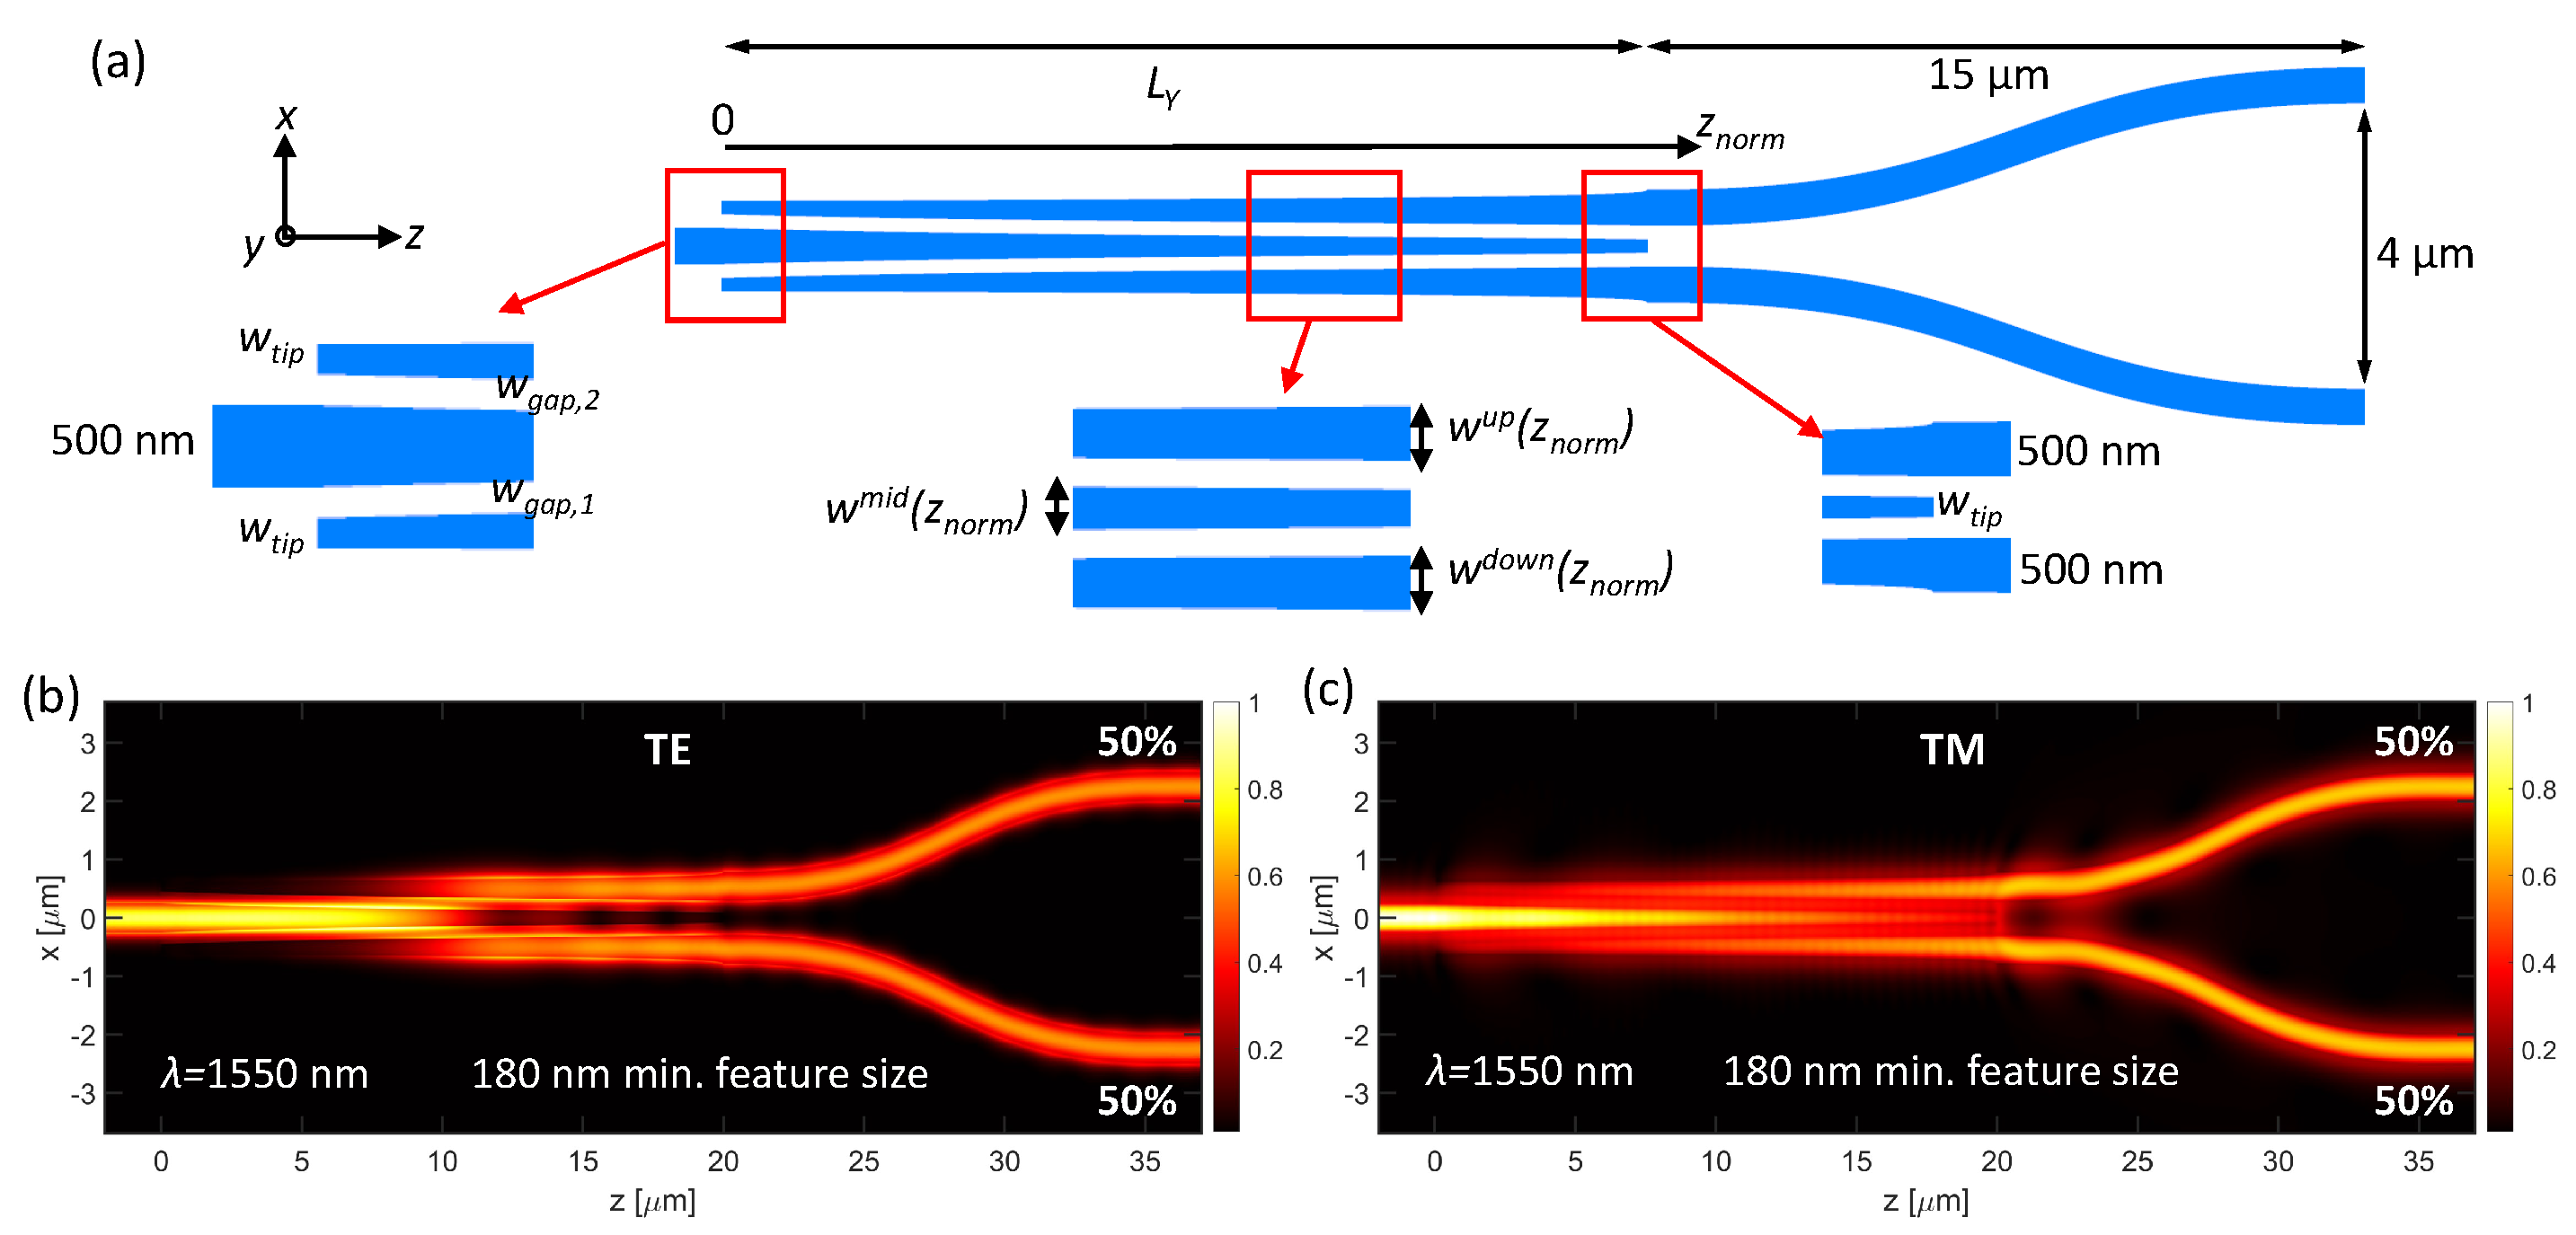
2.1. Design Methodology for 1×2 Y-Junction Power Splitters
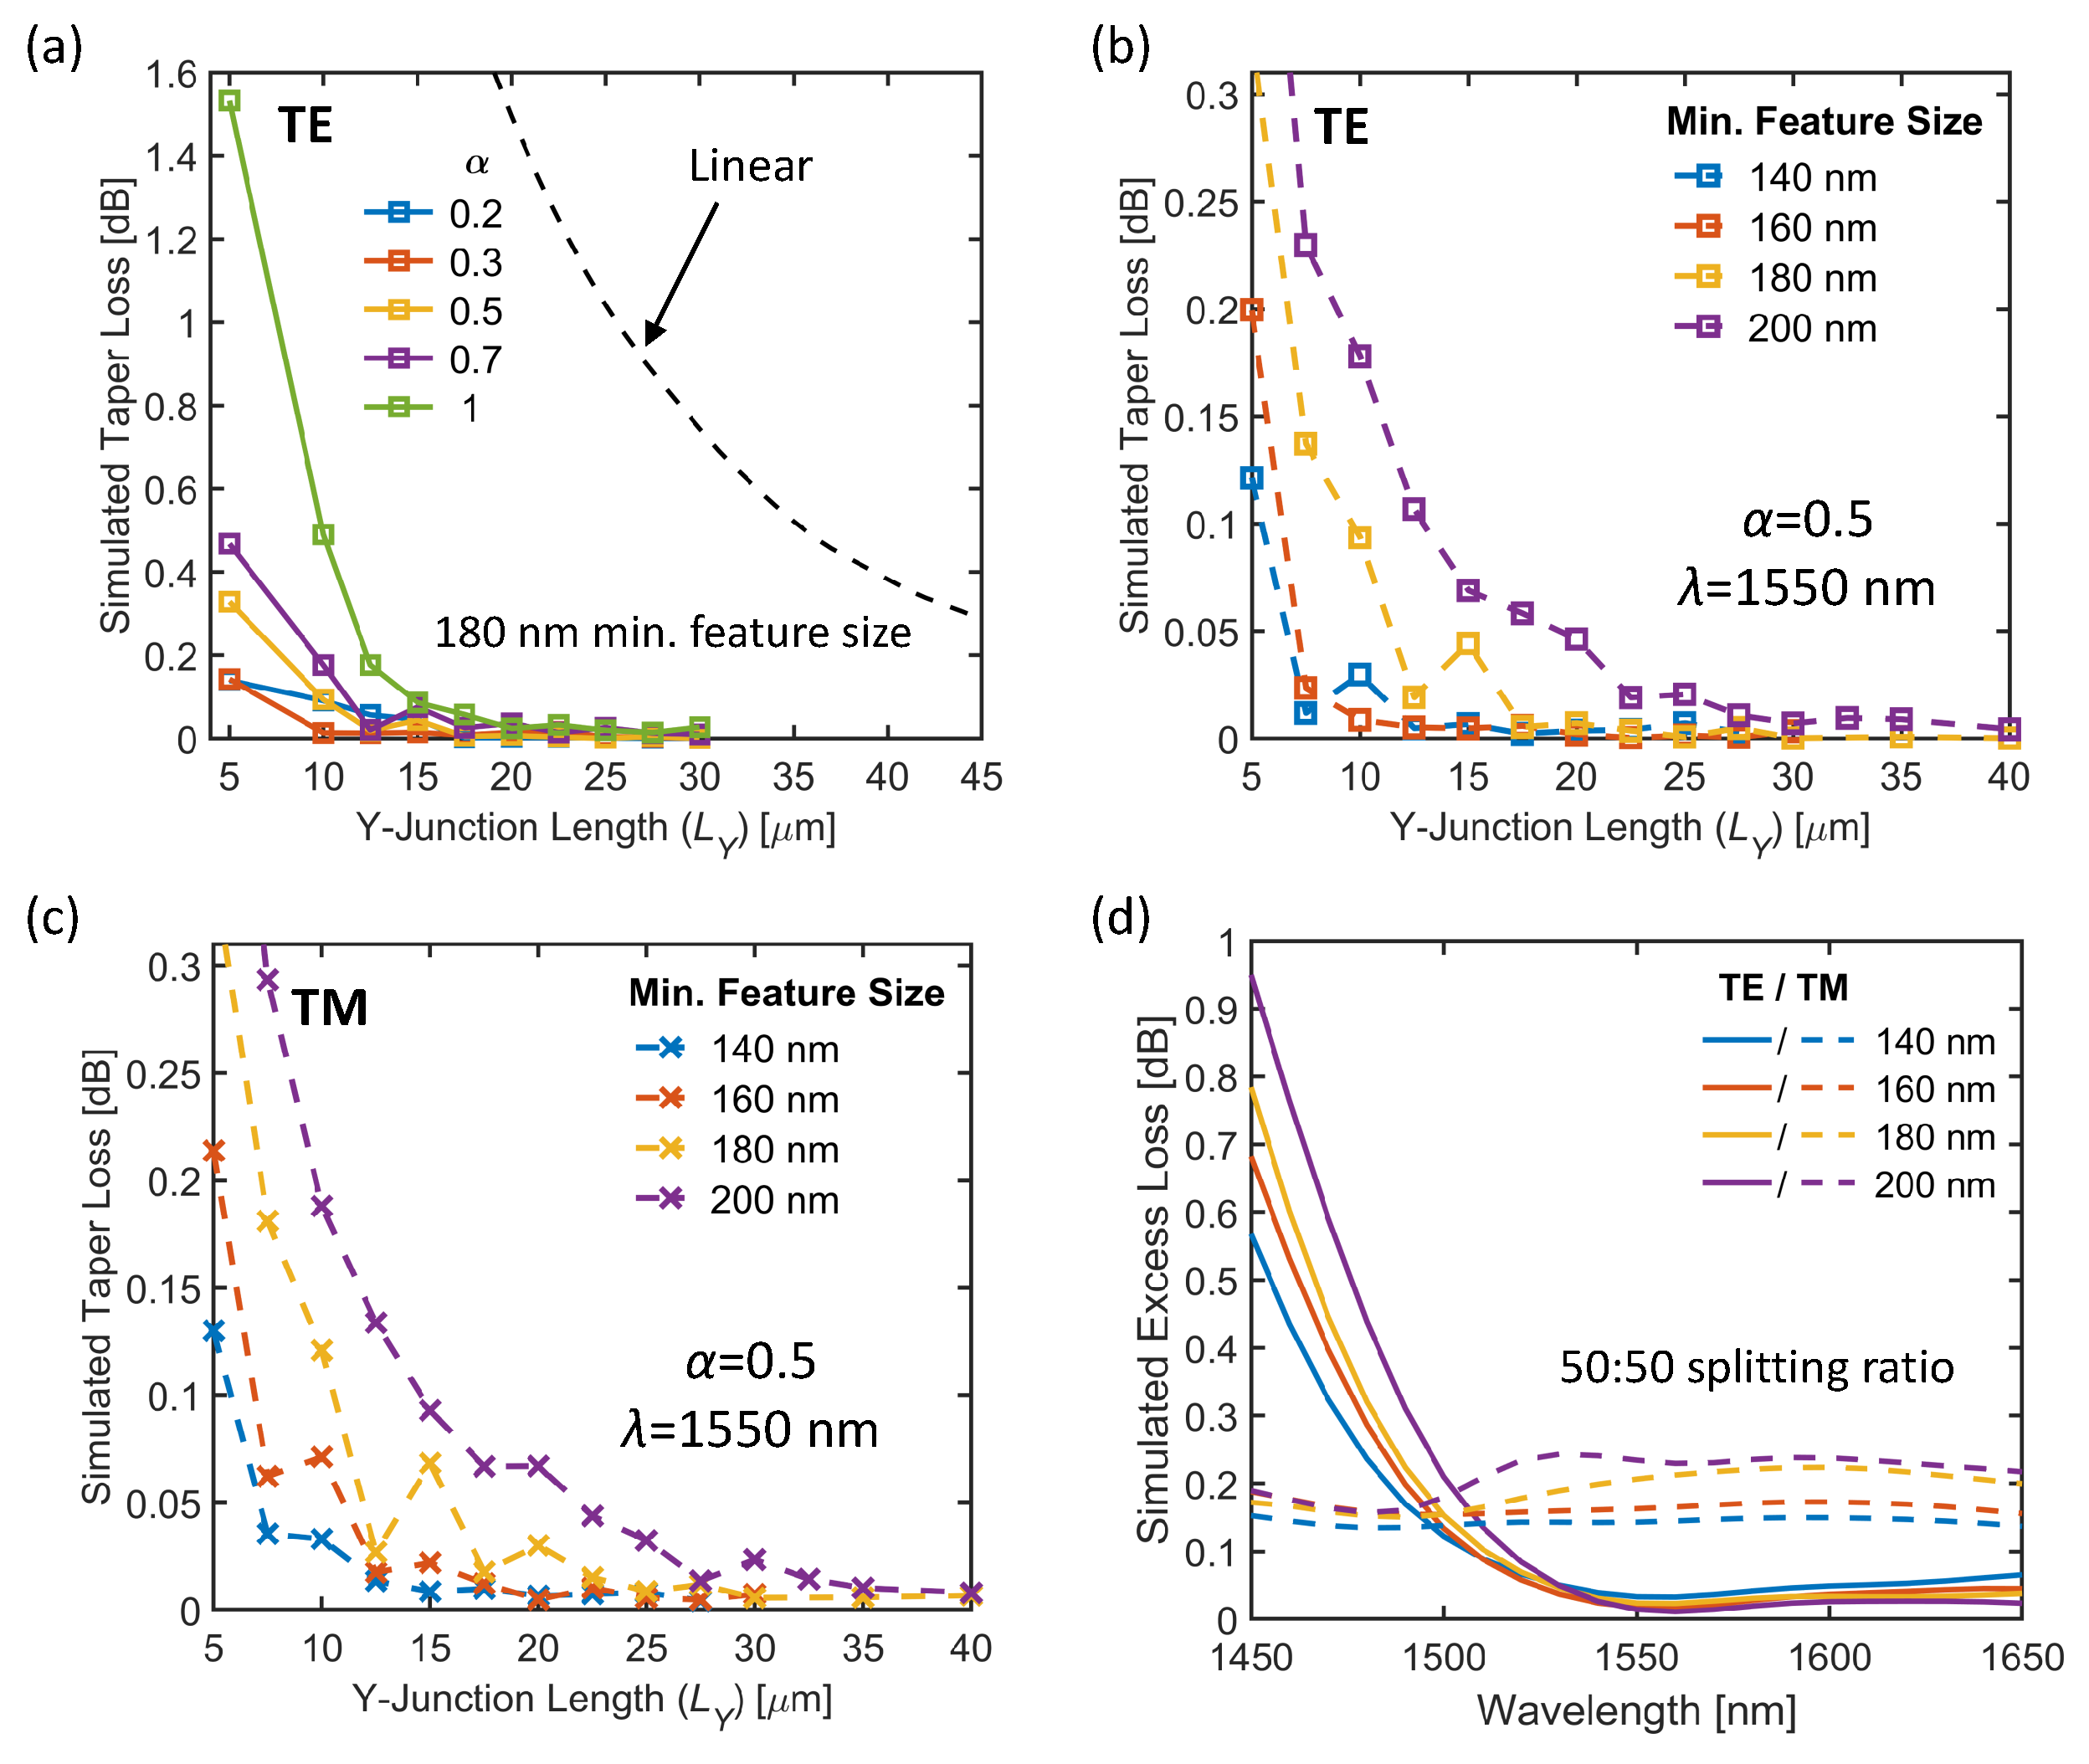
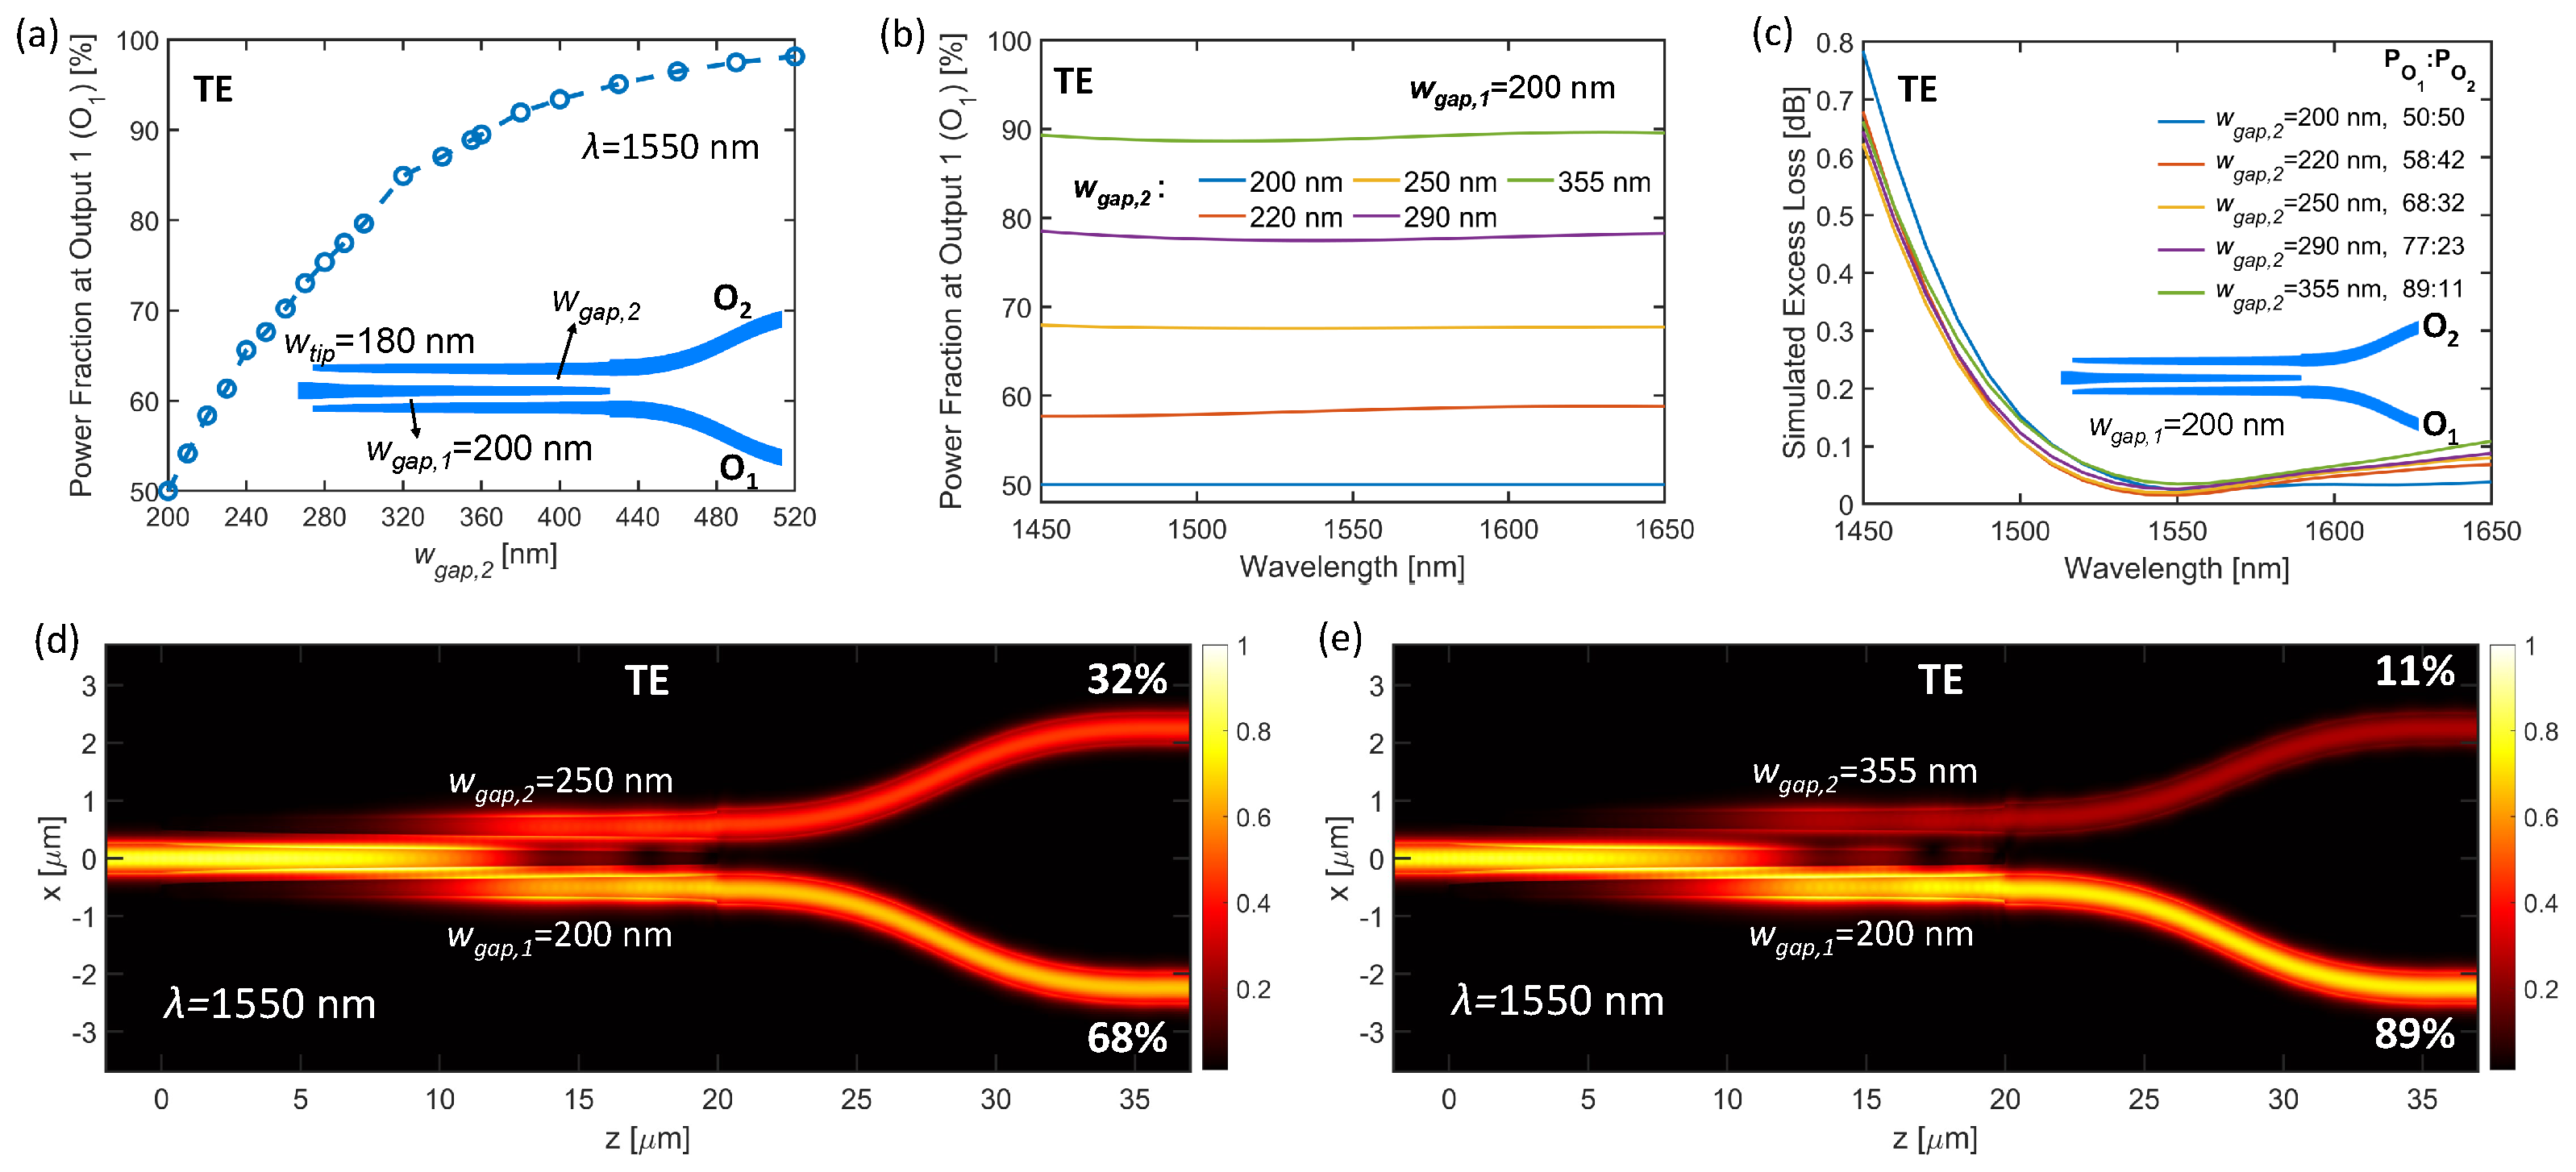
2.2. Profile-optimized 1×2 Y-Junction Power Splitters
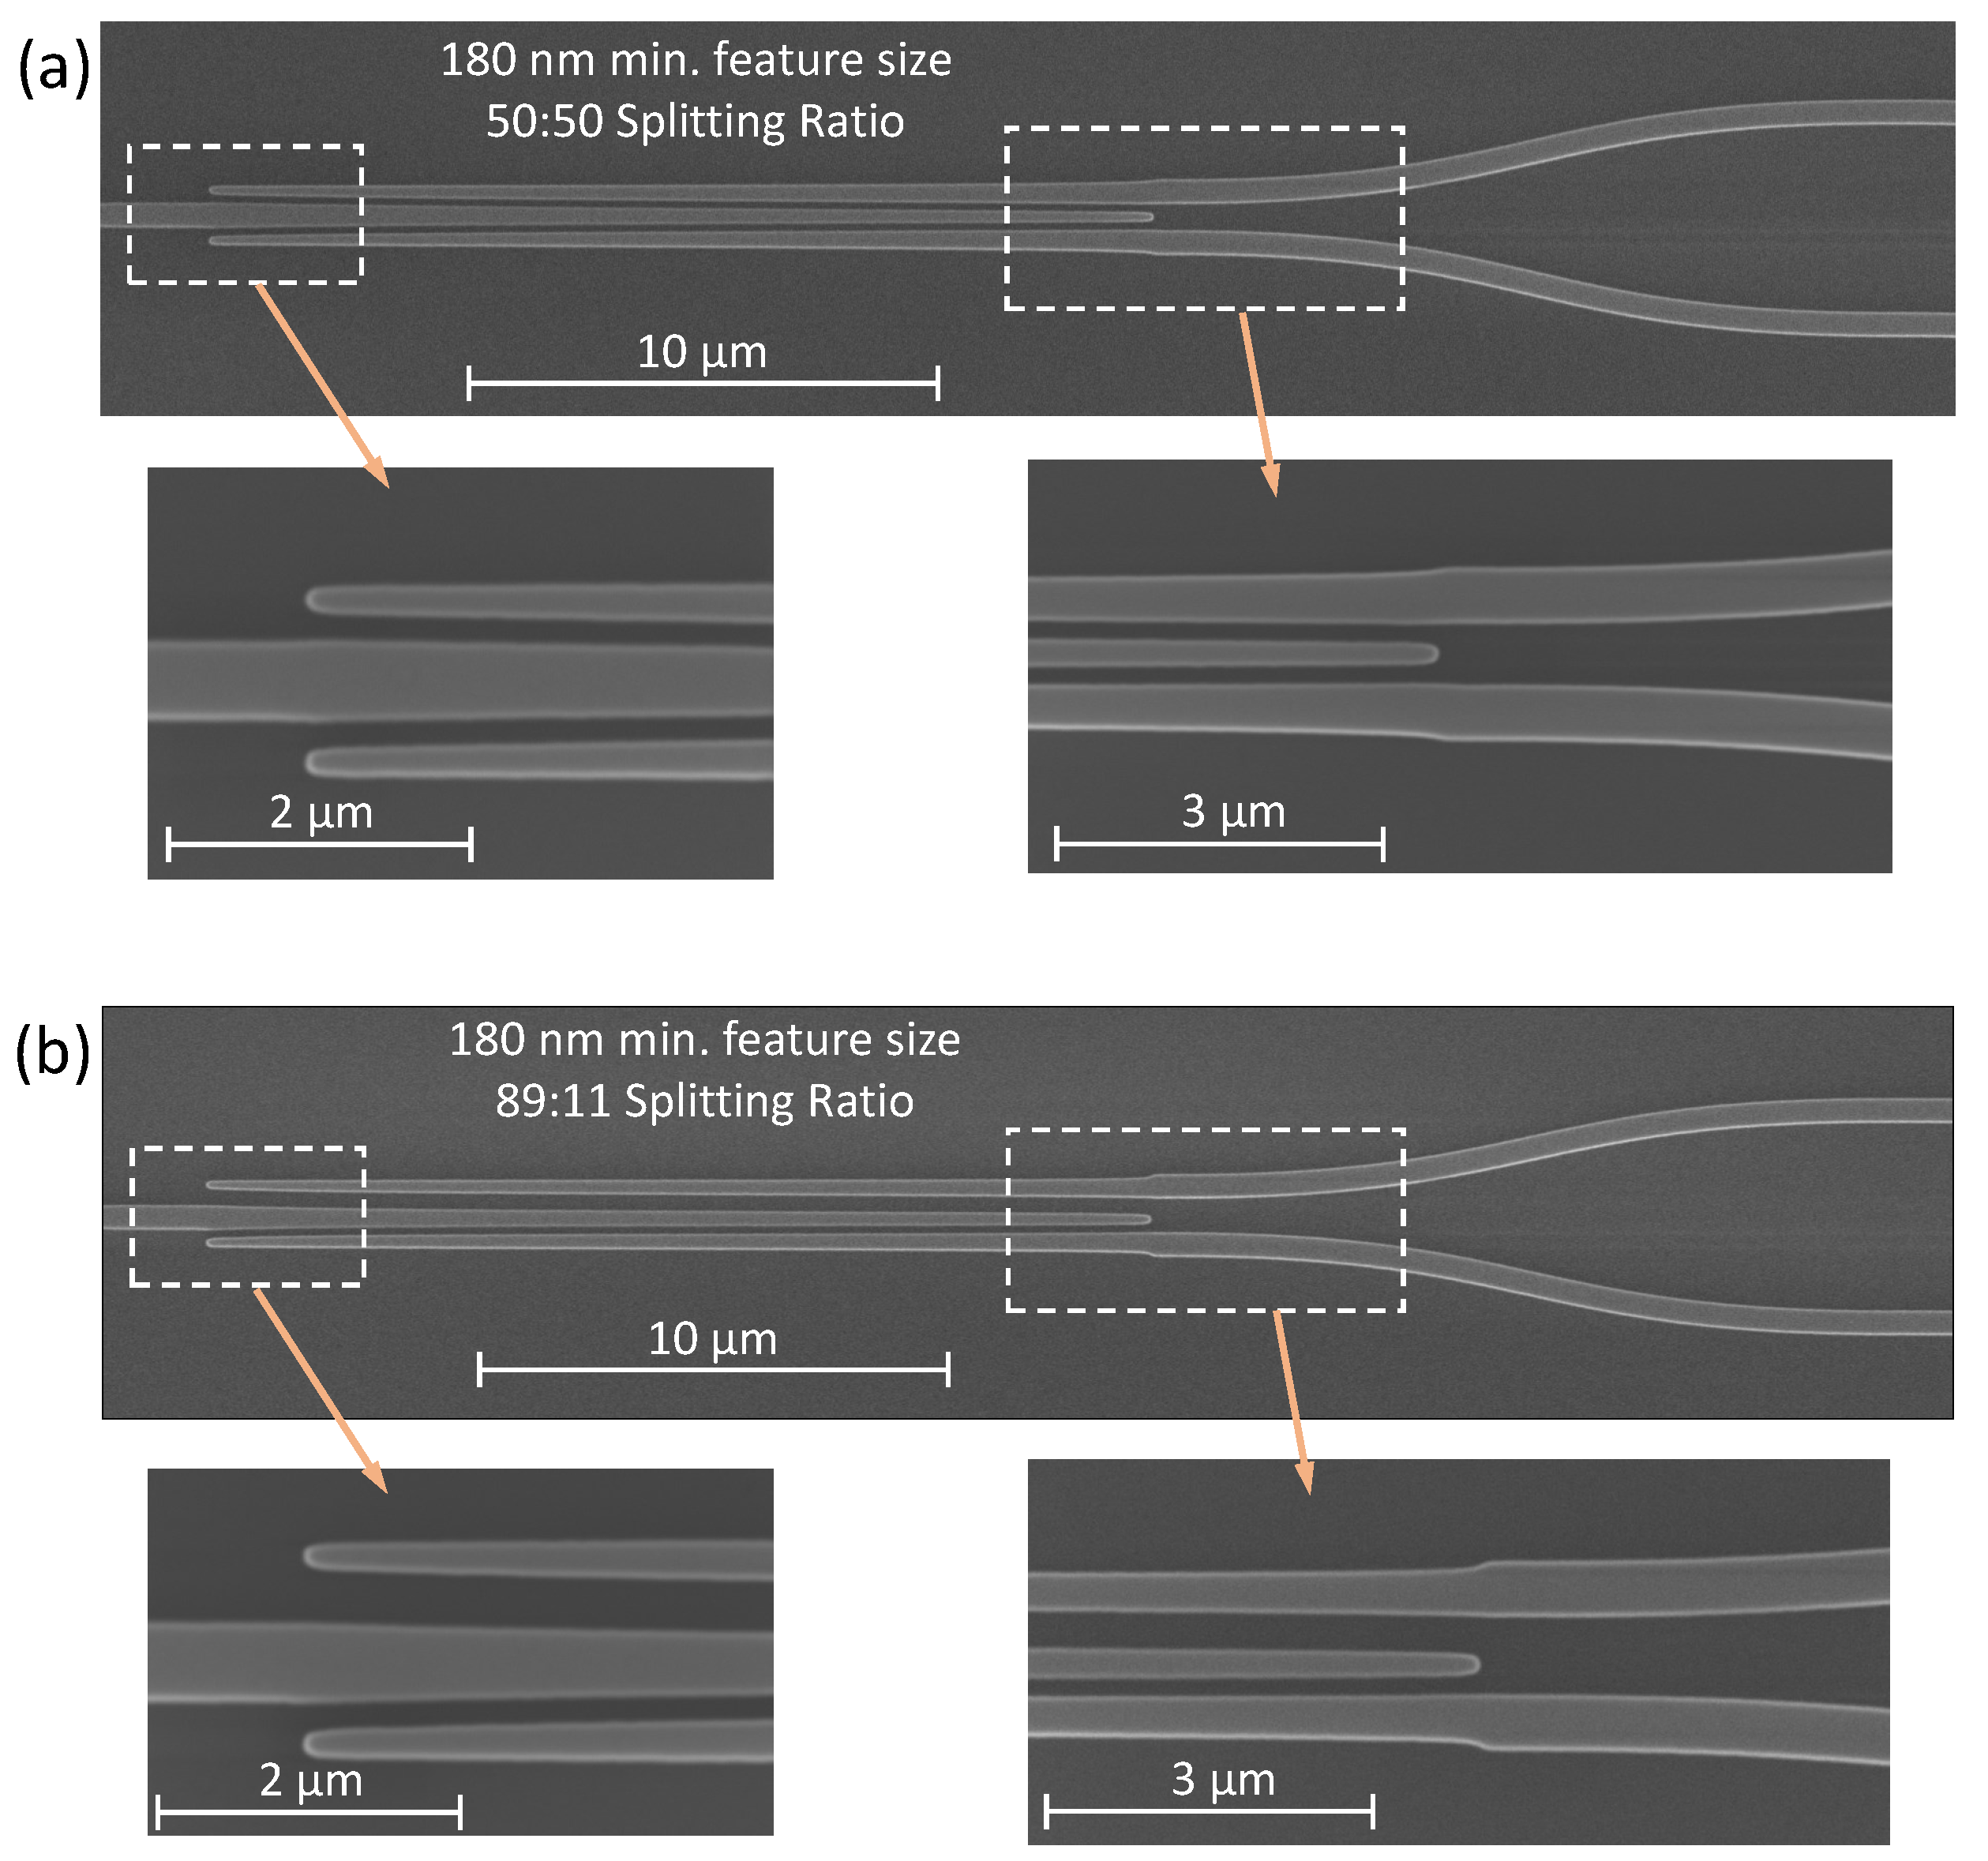
2.3. Experimental Results for 1×2 Y-Junction Power Splitters
3. Broadband 2×2 50:50 Optical Power Splitters on 90 nm Slab
3.1. Design of 2×2 50:50 Power Splitters
3.2. Experimental Design for the 2×2 50:50 Power Splitters
4. Conclusions
Author Contributions
Data Availability Statement
Acknowledgments
Conflicts of Interest
Appendix A
| Device | Min. Feature Size (nm) | Coupling Length (m) | pn | cn | |
|---|---|---|---|---|---|
| 1×2 50:50 Y-Junction | 140 | 10 | 0.5 | [0, 0.3, 0.5, 0.7, 1, 2, 5, 10] | [140, 0, 0, 0, 170, 37, 153] |
| 160 | 15 | [160, 0, 0, 50, 68, 127, 11, 84] | |||
| 180 | 20 | [180, 0, 1, 117, 52, 57, 82, 11] | |||
| 200 | 30 | [200, 0, 7, 73, 71, 33, 16, 100] | |||
| 1×2 58:42 Y-Junction | 180 | 20 | 0.5 | [0, 0.3, 0.5, 0.7, 1, 2, 5, 10] | [180, 22, 49, 57, 8, 56, 47, 81] |
| 1×2 68:32 Y-Junction | 180 | 20 | [180, 35, 57, 78, 5, 31, 54, 60] | ||
| 1×2 78:22 Y-Junction | 180 | 20 | [180, 60, 43, 40, 33, 21, 57, 66] | ||
| 1×2 89:11 Y-Junction | 180 | 20 | [180, 60, 79, 9, 13, 16, 56, 87] | ||
| 2×2 50:50 | 200 | 16 | 0.3 | [0, 0.1, 0.3, 0.5, 0.7, 1, 3, 5] | [400, 14, 45, 18, 1, 10, 0, 12] |
References
- Chen, S.; Shi, Y.; He, S.; Dai, D. Low-loss and broadband 2 ×2 silicon thermo-optic Mach–Zehnder switch with bent directional couplers. Opt. Lett. 2016, 41, 836–839. [Google Scholar] [CrossRef]
- He, M.; Xu, M.; Ren, Y.; Jian, J.; Ruan, Z.; Xu, Y.; Gao, S.; Sun, S.; Wen, X.; Zhou, L.; others. High-performance hybrid silicon and lithium niobate Mach–Zehnder modulators for 100 Gbit s- 1 and beyond. Nature Photonics 2019, 13, 359–364. [Google Scholar] [CrossRef]
- Bogaerts, W.; Pérez, D.; Capmany, J.; Miller, D.A.; Poon, J.; Englund, D.; Morichetti, F.; Melloni, A. Programmable photonic circuits. Nature 2020, 586, 207–216. [Google Scholar] [CrossRef]
- González-Andrade, D.; Wangüemert-Pérez, J.G.; Velasco, A.V.; Ortega-Moñux, A.; Herrero-Bermello, A.; Molina-Fernández, I.; Halir, R.; Cheben, P. Ultra-Broadband Mode Converter and Multiplexer Based on Sub-Wavelength Structures. IEEE Photonics Journal 2018, 10, 1–10. [Google Scholar] [CrossRef]
- Cao, G.; Gao, F.; Jiang, J.; Zhang, F. Directional couplers realized on silicon-on-insulator. IEEE Photonics Technology Letters 2005, 17, 1671–1673. [Google Scholar] [CrossRef]
- Campenhout, J.V.; Green, W.M.J.; Vlasov, Y.A. Design of a digital, ultra-broadband electro-optic switch for reconfigurable optical networks-on-chip. Opt. Express 2009, 17, 23793–23808. [Google Scholar] [CrossRef]
- Chen, G.F.; Ong, J.R.; Ang, T.Y.; Lim, S.T.; Png, C.E.; Tan, D.T. Broadband silicon-on-insulator directional couplers using a combination of straight and curved waveguide sections. Scientific reports 2017, 7, 7246. [Google Scholar] [CrossRef] [PubMed]
- Soldano, L.; Pennings, E. Optical multi-mode interference devices based on self-imaging: principles and applications. Journal of Lightwave Technology 1995, 13, 615–627. [Google Scholar] [CrossRef]
- Lagali, N.; Paiam, M.; MacDonald, R. Theory of variable-ratio power splitters using multimode interference couplers. IEEE Photonics Technology Letters 1999, 11, 665–667. [Google Scholar] [CrossRef]
- Deng, Q.; Liu, L.; Li, X.; Zhou, Z. Arbitrary-ratio 1 ×2 power splitter based on asymmetric multimode interference. Opt. Lett. 2014, 39, 5590–5593. [Google Scholar] [CrossRef]
- Liu, R.; Lu, L.; Zhang, P.; Chang, W.; Liu, D.; Zhang, M. Integrated Dual-Mode 3-dB Power Splitter Based on Multimode Interference Coupler. IEEE Photonics Technology Letters 2020, 32, 883–886. [Google Scholar] [CrossRef]
- Yao, R.; Li, H.; Zhang, B.; Chen, W.; Wang, P.; Dai, S.; Liu, Y.; Li, J.; Li, Y.; Fu, Q.; Dai, T.; Yu, H.; Yang, J.; Pavesi, L. Compact and Low-Insertion-Loss 1xN Power Splitter in Silicon Photonics. J. Lightwave Technol. 2021, 39, 6253–6259. [Google Scholar] [CrossRef]
- Xiao, Z.; Luo, X.; Lim, P.H.; Prabhathan, P.; Silalahi, S.T.H.; Liow, T.Y.; Zhang, J.; Luan, F. Ultra-compact low loss polarization insensitive silicon waveguide splitter. Opt. Express 2013, 21, 16331–16336. [Google Scholar] [CrossRef]
- Nair, D.P.; Ménard, M. A Compact Low-Loss Broadband Polarization Independent Silicon 50/50 Splitter. IEEE Photonics Journal 2021, 13, 1–7. [Google Scholar] [CrossRef]
- Zhang, Y.; Yang, S.; Lim, A.E.J.; Lo, G.Q.; Galland, C.; Baehr-Jones, T.; Hochberg, M. A compact and low loss Y-junction for submicron silicon waveguide. Opt. Express 2013, 21, 1310–1316. [Google Scholar] [CrossRef]
- Ozcan, C.; Mojahedi, M.; Aitchison, J.S. Optimization of Adiabatically Tapered Y-Branches for Dual Polarization Operation. 2021 IEEE Photonics Conference (IPC), 2021, pp. 1–2. [CrossRef]
- Halir, R.; Maese-Novo, A.; Ortega-Moñux, A.; Molina-Fernández, I.; Wangüemert-Pérez, J.G.; Cheben, P.; Xu, D.X.; Schmid, J.H.; Janz, S. Colorless directional coupler with dispersion engineered sub-wavelength structure. Opt. Express 2012, 20, 13470–13477. [Google Scholar] [CrossRef]
- Wang, Y.; Lu, Z.; Ma, M.; Yun, H.; Zhang, F.; Jaeger, N.A.F.; Chrostowski, L. Compact Broadband Directional Couplers Using Subwavelength Gratings. IEEE Photonics Journal 2016, 8, 1–8. [Google Scholar] [CrossRef]
- Zhao, S.; Liu, W.; Chen, J.; Ding, Z.; Shi, Y. Broadband Arbitrary Ratio Power Splitters Based on Directional Couplers With Subwavelength Structure. IEEE Photonics Technology Letters 2021, 33, 479–482. [Google Scholar] [CrossRef]
- Zhang, A.; Xia, L.; Li, T.; Chang, C.; Zhou, P.; Xu, X.; Zou, Y. Ultra-compact polarization-independent 3 dB power splitter in silicon. Opt. Lett. 2021, 46, 5000–5003. [Google Scholar] [CrossRef]
- Yang, N.; Xiao, J. A compact silicon-based polarization-independent power splitter using a three-guide directional coupler with subwavelength gratings. Optics Communications 2020, 459, 125095. [Google Scholar] [CrossRef]
- Hu, R.; Sun, L.; Zhang, Z.; Sun, Q.; Pan, Y.; Su, Y. Ultrabroadband and compact 2 ×2 3-dB coupler based on trapezoidal subwavelength gratings. Opt. Express 2023, 31, 23542–23550. [Google Scholar] [CrossRef]
- Zhong, W.; Xiao, J. Ultracompact polarization-insensitive power splitter using subwavelength-grating-based MMI couplers on an SOI platform. Appl. Opt. 2020, 59, 1991–1997. [Google Scholar] [CrossRef]
- Maese-Novo, A.; Halir, R.; Romero-García, S.; Pérez-Galacho, D.; Zavargo-Peche, L.; Ortega-Moñux, A.; Molina-Fernández, I.; Wangüemert-Pérez, J.G.; Cheben, P. Wavelength independent multimode interference coupler. Opt. Express 2013, 21, 7033–7040. [Google Scholar] [CrossRef]
- Wang, Z.; Liu, Y.; Wang, Z.; Liu, Y.; Du, J.; Song, Q.; Xu, K. Ultra-broadband 3 dB power splitter from 1.55 to 2 µm wave band. Opt. Lett. 2021, 46, 4232–4235. [Google Scholar] [CrossRef]
- Xu, Y.; Xiao, J. An Ultracompact Polarization-Insensitive Silicon-Based Strip-to-Slot Power Splitter. IEEE Photonics Technology Letters 2016, 28, 536–539. [Google Scholar] [CrossRef]
- Xiao, J.; Guo, Z. Ultracompact Polarization-Insensitive Power Splitter Using Subwavelength Gratings. IEEE Photonics Technology Letters 2018, 30, 529–532. [Google Scholar] [CrossRef]
- Chang, W.; Ren, X.; Ao, Y.; Lu, L.; Cheng, M.; Deng, L.; Liu, D.; Zhang, M. Inverse design and demonstration of an ultracompact broadband dual-mode 3 dB power splitter. Opt. Express 2018, 26, 24135–24144. [Google Scholar] [CrossRef]
- Xie, Y.; Huang, T.; Ji, Q.; Yang, M.; Wang, J.; Tu, X.; Cheng, Z.; Xu, G.; Wei, Q.; Wu, Y.; Shum, P.P. Design of an arbitrary ratio optical power splitter based on a discrete differential multiobjective evolutionary algorithm. Appl. Opt. 2020, 59, 1780–1785. [Google Scholar] [CrossRef] [PubMed]
- Xu, X.; Li, Y.; Huang, W. Inverse design of the MMI power splitter by asynchronous double deep Q-learning. Opt. Express 2021, 29, 35951–35964. [Google Scholar] [CrossRef]
- Tahersima, M.H.; Kojima, K.; Koike-Akino, T.; Jha, D.; Wang, B.; Lin, C.; Parsons, K. Deep neural network inverse design of integrated photonic power splitters. Scientific reports 2019, 9, 1368. [Google Scholar] [CrossRef] [PubMed]
- Kim, J.; Kim, J.Y.; Yoon, J.; Yoon, H.; Park, H.H.; Kurt, H. Experimental demonstration of inverse-designed silicon integrated photonic power splitters. Nanophotonics 2022, 11, 4581–4590. [Google Scholar] [CrossRef]
- Ma, H.; Huang, J.; Zhang, K.; Yang, J. Inverse-designed arbitrary-input and ultra-compact 1×N power splitters based on high symmetric structure. Scientific Reports 2020, 10, 11757. [Google Scholar] [CrossRef] [PubMed]
- Mak, J.C.C.; Sideris, C.; Jeong, J.; Hajimiri, A.; Poon, J.K.S. Binary particle swarm optimized 2 ×2 power splitters in a standard foundry silicon photonic platform. Opt. Lett. 2016, 41, 3868–3871. [Google Scholar] [CrossRef] [PubMed]
- Pilozzi, L.; Farrelly, F.A.; Marcucci, G.; Conti, C. Machine learning inverse problem for topological photonics. Communications Physics 2018, 1, 57. [Google Scholar] [CrossRef]
- Schubert, M.F.; Cheung, A.K.C.; Williamson, I.A.D.; Spyra, A.; Alexander, D.H. Inverse Design of Photonic Devices with Strict Foundry Fabrication Constraints. ACS Photonics 2022, 9, 2327–2336. [Google Scholar] [CrossRef]
- Hammond, A.M.; Oskooi, A.; Johnson, S.G.; Ralph, S.E. Photonic topology optimization with semiconductor-foundry design-rule constraints. Opt. Express 2021, 29, 23916–23938. [Google Scholar] [CrossRef] [PubMed]
- Gostimirovic, D.; Grinberg, Y.; Xu, D.X.; Liboiron-Ladouceur, O. Improving Fabrication Fidelity of Integrated Nanophotonic Devices Using Deep Learning. ACS Photonics 2023, 10, 1953–1961. [Google Scholar] [CrossRef]
- Wang, Y.; Gao, S.; Wang, K.; Skafidas, E. Ultra-broadband and low-loss 3 dB optical power splitter based on adiabatic tapered silicon waveguides. Opt. Lett. 2016, 41, 2053–2056. [Google Scholar] [CrossRef]
- Han, L.; Kuo, B.P.P.; Alic, N.; Radic, S. Ultra-broadband multimode 3dB optical power splitter using an adiabatic coupler and a Y-branch. Opt. Express 2018, 26, 14800–14809. [Google Scholar] [CrossRef]
- González-Andrade, D.; Lafforgue, C.; Durán-Valdeiglesias, E.; Le Roux, X.; Berciano, M.; Cassan, E.; Marris-Morini, D.; Velasco, A.V.; Cheben, P.; Vivien, L.; others. Polarization-and wavelength-agnostic nanophotonic beam splitter. Scientific reports 2019, 9, 3604. [Google Scholar] [CrossRef]
- Kim, H.; Shin, H. Tailorable and Broadband On-Chip Optical Power Splitter. Applied Sciences 2019, 9. [Google Scholar] [CrossRef]
- Sia, J.X.B.; Wang, W.; Guo, X.; Zhou, J.; Zhang, Z.; Rouifed, M.S.; Li, X.; Qiao, Z.L.; Liu, C.Y.; Littlejohns, C.; Reed, G.T.; Wang, H. Mid-Infrared, Ultra-Broadband, Low-Loss, Compact Arbitrary Power Splitter Based on Adiabatic Mode Evolution. IEEE Photonics Journal 2019, 11, 1–11. [Google Scholar] [CrossRef]
- Nguyen, H.V.; Kim, I.K.; Seok, T.J. Low-Loss and Broadband Silicon Photonic Y- Junction Using Tapered Rib Waveguides. 2019 International Conference on Optical MEMS and Nanophotonics (OMN), 2019, pp. 76–77. [CrossRef]
- Nguyen, V.H.; Kim, I.K.; Seok, T.J. Low-Loss and Broadband Silicon Photonic 3-dB Power Splitter with Enhanced Coupling of Shallow-Etched Rib Waveguides. Applied Sciences 2020, 10. [Google Scholar] [CrossRef]
- Yun, H.; Shi, W.; Wang, Y.; Chrostowski, L.; Jaeger, N.A.F. 2×2 adiabatic 3-dB coupler on silicon-on-insulator rib waveguides. Photonics North 2013; Cheben, P.; Schmid, J.; Boudoux, C.; Chen, L.R.; Delâge, A.; Janz, S.; Kashyap, R.; Lockwood, D.J.; Loock, H.P.; Mi, Z., Eds. International Society for Optics and Photonics, SPIE, 2013, Vol. 8915, p. 89150V. [CrossRef]
- Guo, D.; Chu, T. Compact broadband silicon 3 dB coupler based on shortcuts to adiabaticity. Opt. Lett. 2018, 43, 4795–4798. [Google Scholar] [CrossRef] [PubMed]
- Chung, H.C.; Wang, T.C.; Hung, Y.J.; Tseng, S.Y. Robust silicon arbitrary ratio power splitters using shortcuts to adiabaticity. Opt. Express 2020, 28, 10350–10362. [Google Scholar] [CrossRef]
- Hung, Y.J.; Li, Z.Y.; Chung, H.C.; Liang, F.C.; Jung, M.Y.; Yen, T.H.; Tseng, S.Y. Mode-evolution-based silicon-on-insulator 3 dB coupler using fast quasiadiabatic dynamics. Opt. Lett. 2019, 44, 815–818. [Google Scholar] [CrossRef] [PubMed]
- Hung, Y.J.; Chen, C.H.; Lu, G.X.; Liang, F.C.; Chung, H.C.; Tseng, S.Y. Compact and robust 2 ×2 fast quasi-adiabatic 3-dB couplers on SOI strip waveguides. Optics & Laser Technology 2022, 145, 107485. [Google Scholar] [CrossRef]
- Chung, H.C.; Chen, C.H.; Hung, Y.J.; Tseng, S.Y. Compact polarization-independent quasi-adiabatic 2×2 3 dB coupler on silicon. Opt. Express 2022, 30, 995–1002. [Google Scholar] [CrossRef]
- Siriani, D.F.; Tambasco, J.L. Adiabatic guided wave optics – a toolbox of generalized design and optimization methods. Opt. Express 2021, 29, 3243–3257. [Google Scholar] [CrossRef]
- Ozcan, C.; Aitchison, J.S.; Mojahedi, M. Adiabatic Waveguide Taper Profile Optimization on Al2O3/Si Platform for Polarization Insensitive Fiber-to-Chip Light Coupling. 2021 Conference on Lasers and Electro-Optics Europe & European Quantum Electronics Conference (CLEO/Europe-EQEC), 2021, pp. 1–1. [CrossRef]
- Ozcan, C.; Mojahedi, M.; Aitchison, J.S. Compact Adiabatic Power Splitters with Polynomial Taper Profile Optimization. CLEO 2023. Optica Publishing Group, 2023, p. JW2A.79. [CrossRef]
- Ozcan, C.; Mojahedi, M.; Aitchison, J.S. Short, broadband, and polarization-insensitive adiabatic Y-junction power splitters. Opt. Lett. 2023, 48, 4901–4904. [Google Scholar] [CrossRef]

| Device | Min. Feature Size (nm) | ELTE1 (dB) | ELTM1 (dB) | SRTE2 | Bandwidth (nm) |
|---|---|---|---|---|---|
| 1×2 50:50 Y-Junction | 180 | <0.5 | <0.5 | 50±2 | 1480-1585 |
| 1×2 58:42 Y-Junction | 180 | <0.6 | - | 58±2 | 1490-1590 |
| 1×2 68:32 Y-Junction | 180 | <0.5 | - | 71±3 | 1487-1590 |
| 1×2 78:22 Y-Junction | 180 | <0.6 | - | 84±5 | 14890-1590 |
| 1×2 89:11 Y-Junction | 180 | <0.6 | - | 94±2 | 1490-1590 |
| 2×2 50:50 | 200 | <0.7 | - | 50±3 | 1465-1590 |
Disclaimer/Publisher’s Note: The statements, opinions and data contained in all publications are solely those of the individual author(s) and contributor(s) and not of MDPI and/or the editor(s). MDPI and/or the editor(s) disclaim responsibility for any injury to people or property resulting from any ideas, methods, instructions or products referred to in the content. |
© 2023 by the authors. Licensee MDPI, Basel, Switzerland. This article is an open access article distributed under the terms and conditions of the Creative Commons Attribution (CC BY) license (https://creativecommons.org/licenses/by/4.0/).


