Submitted:
17 October 2023
Posted:
18 October 2023
You are already at the latest version
Abstract
Keywords:
1. Introduction
2. Results
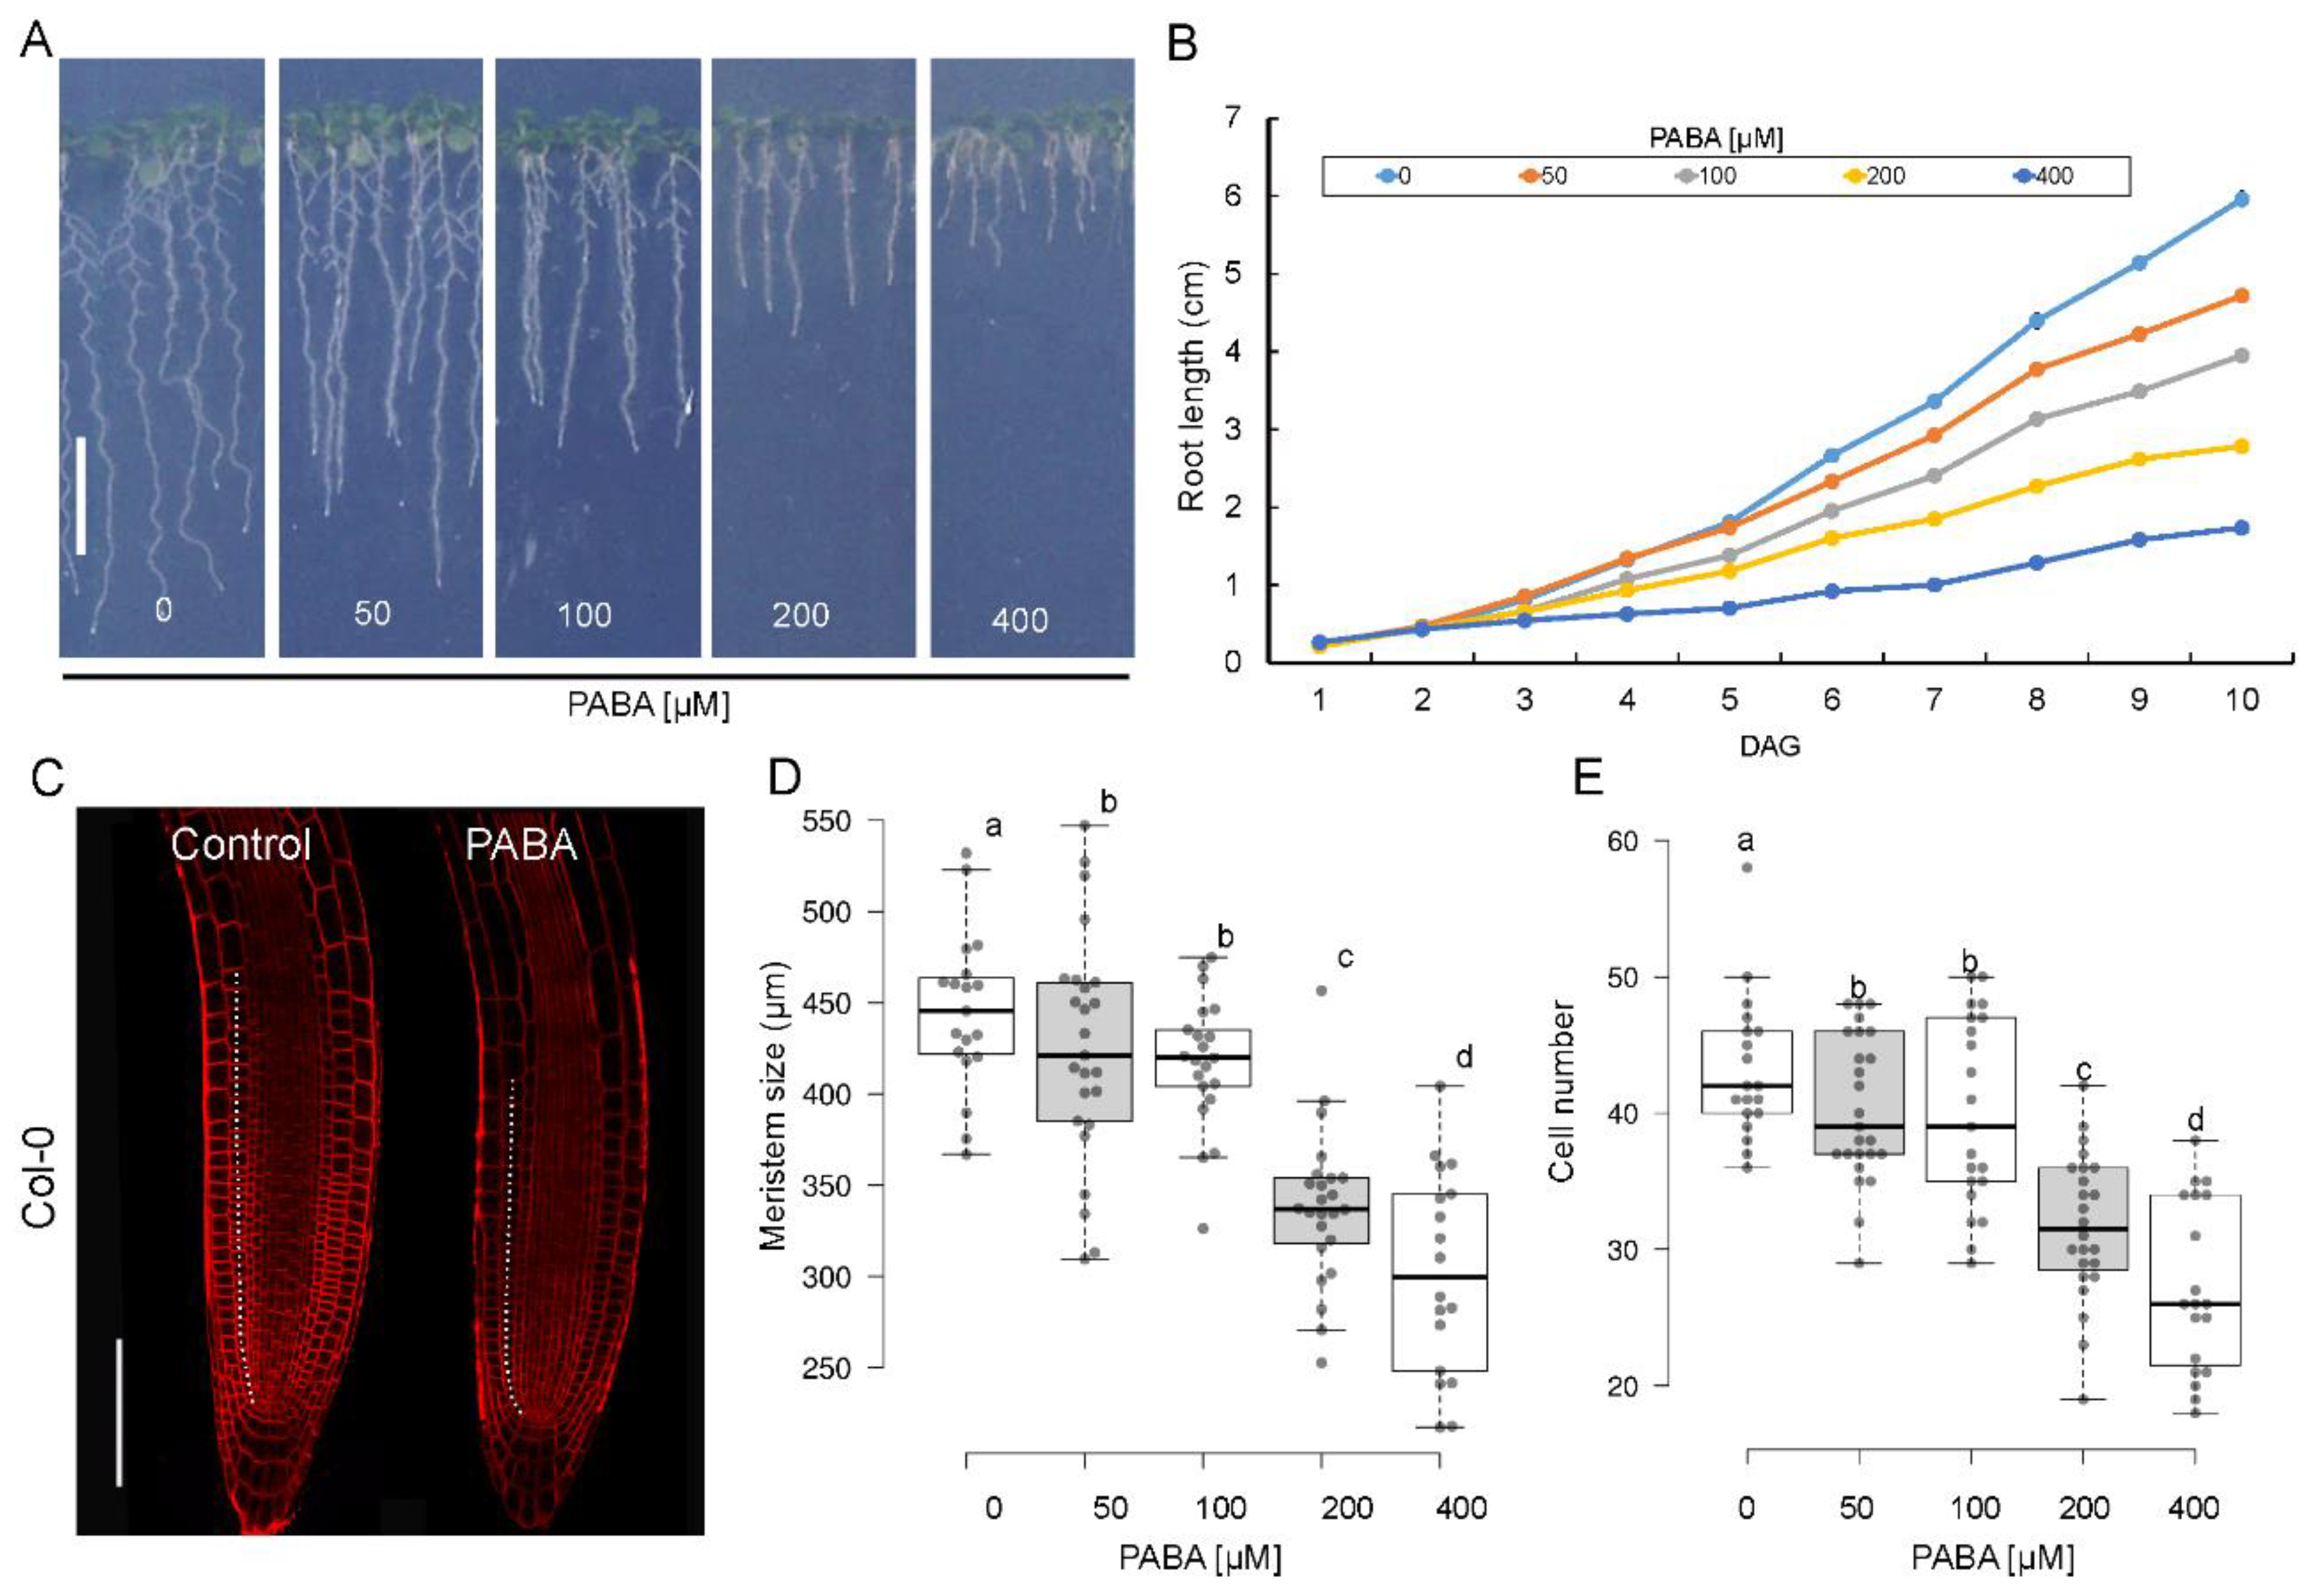
2.1. PABA reduces the number of cells in the root meristem
2.2. PABA regulation of root growth is independent of folates
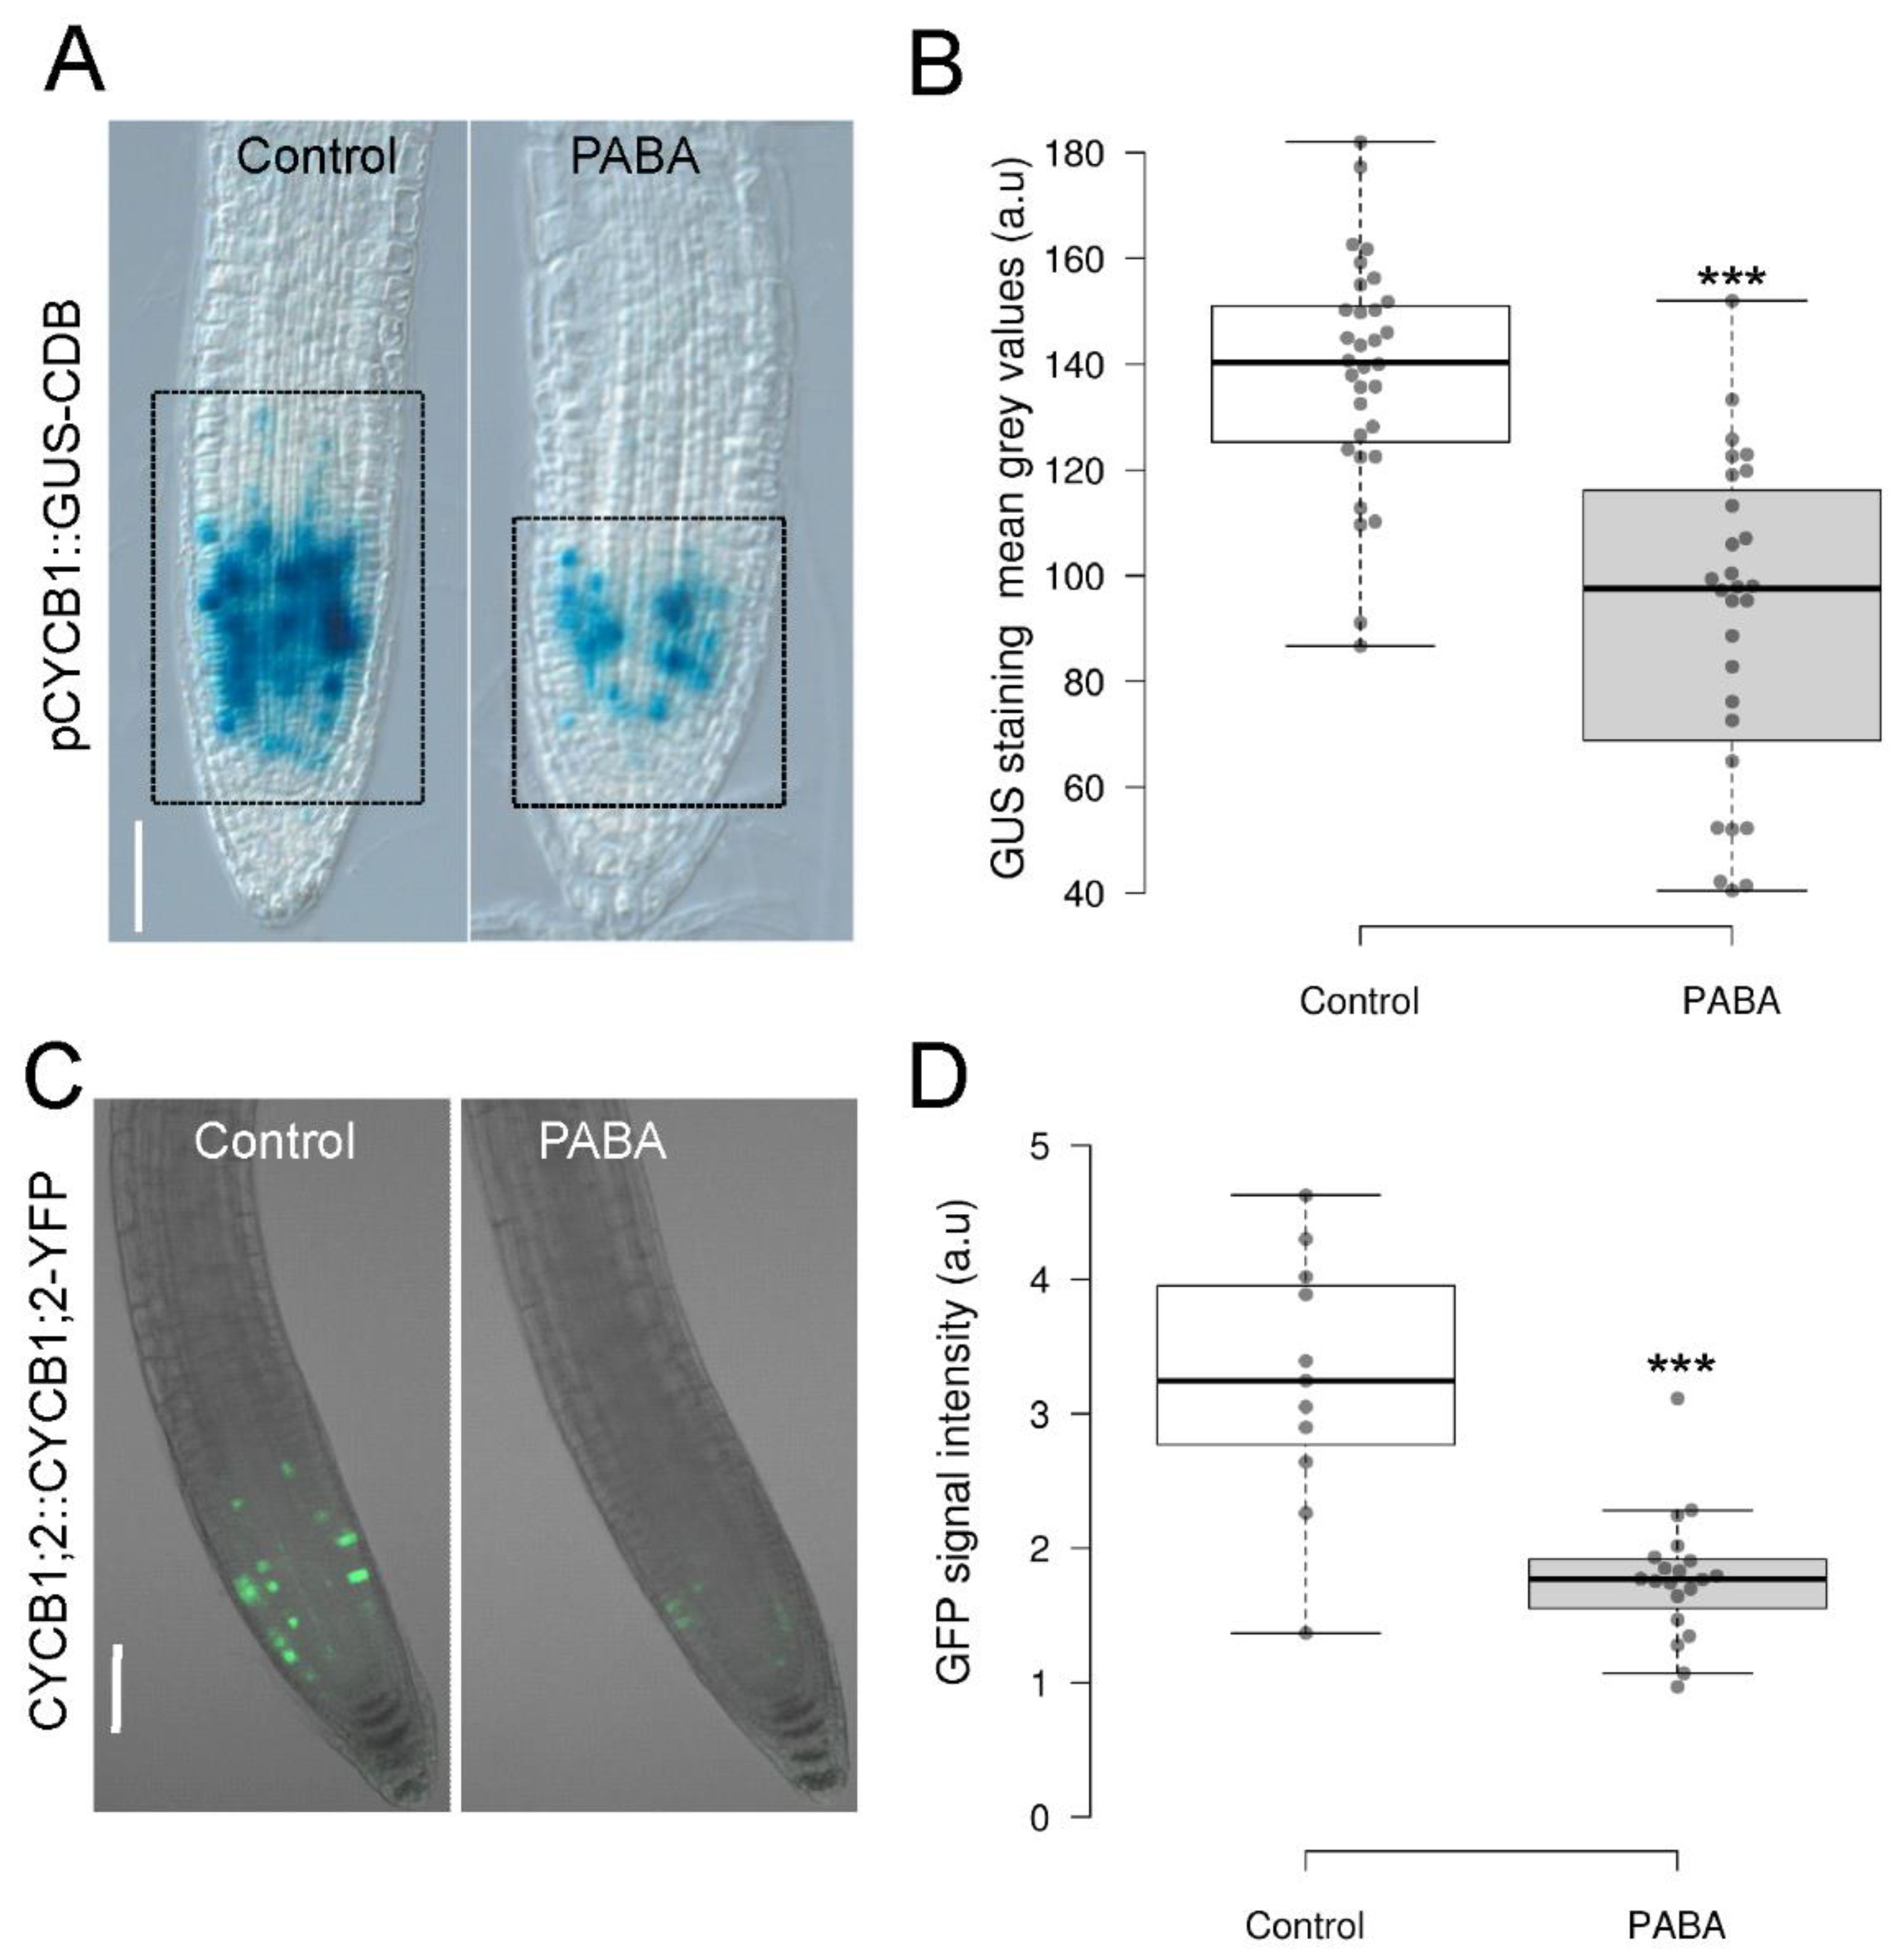
2.3. PABA negatively affects the G2/M transition of root meristematic cells
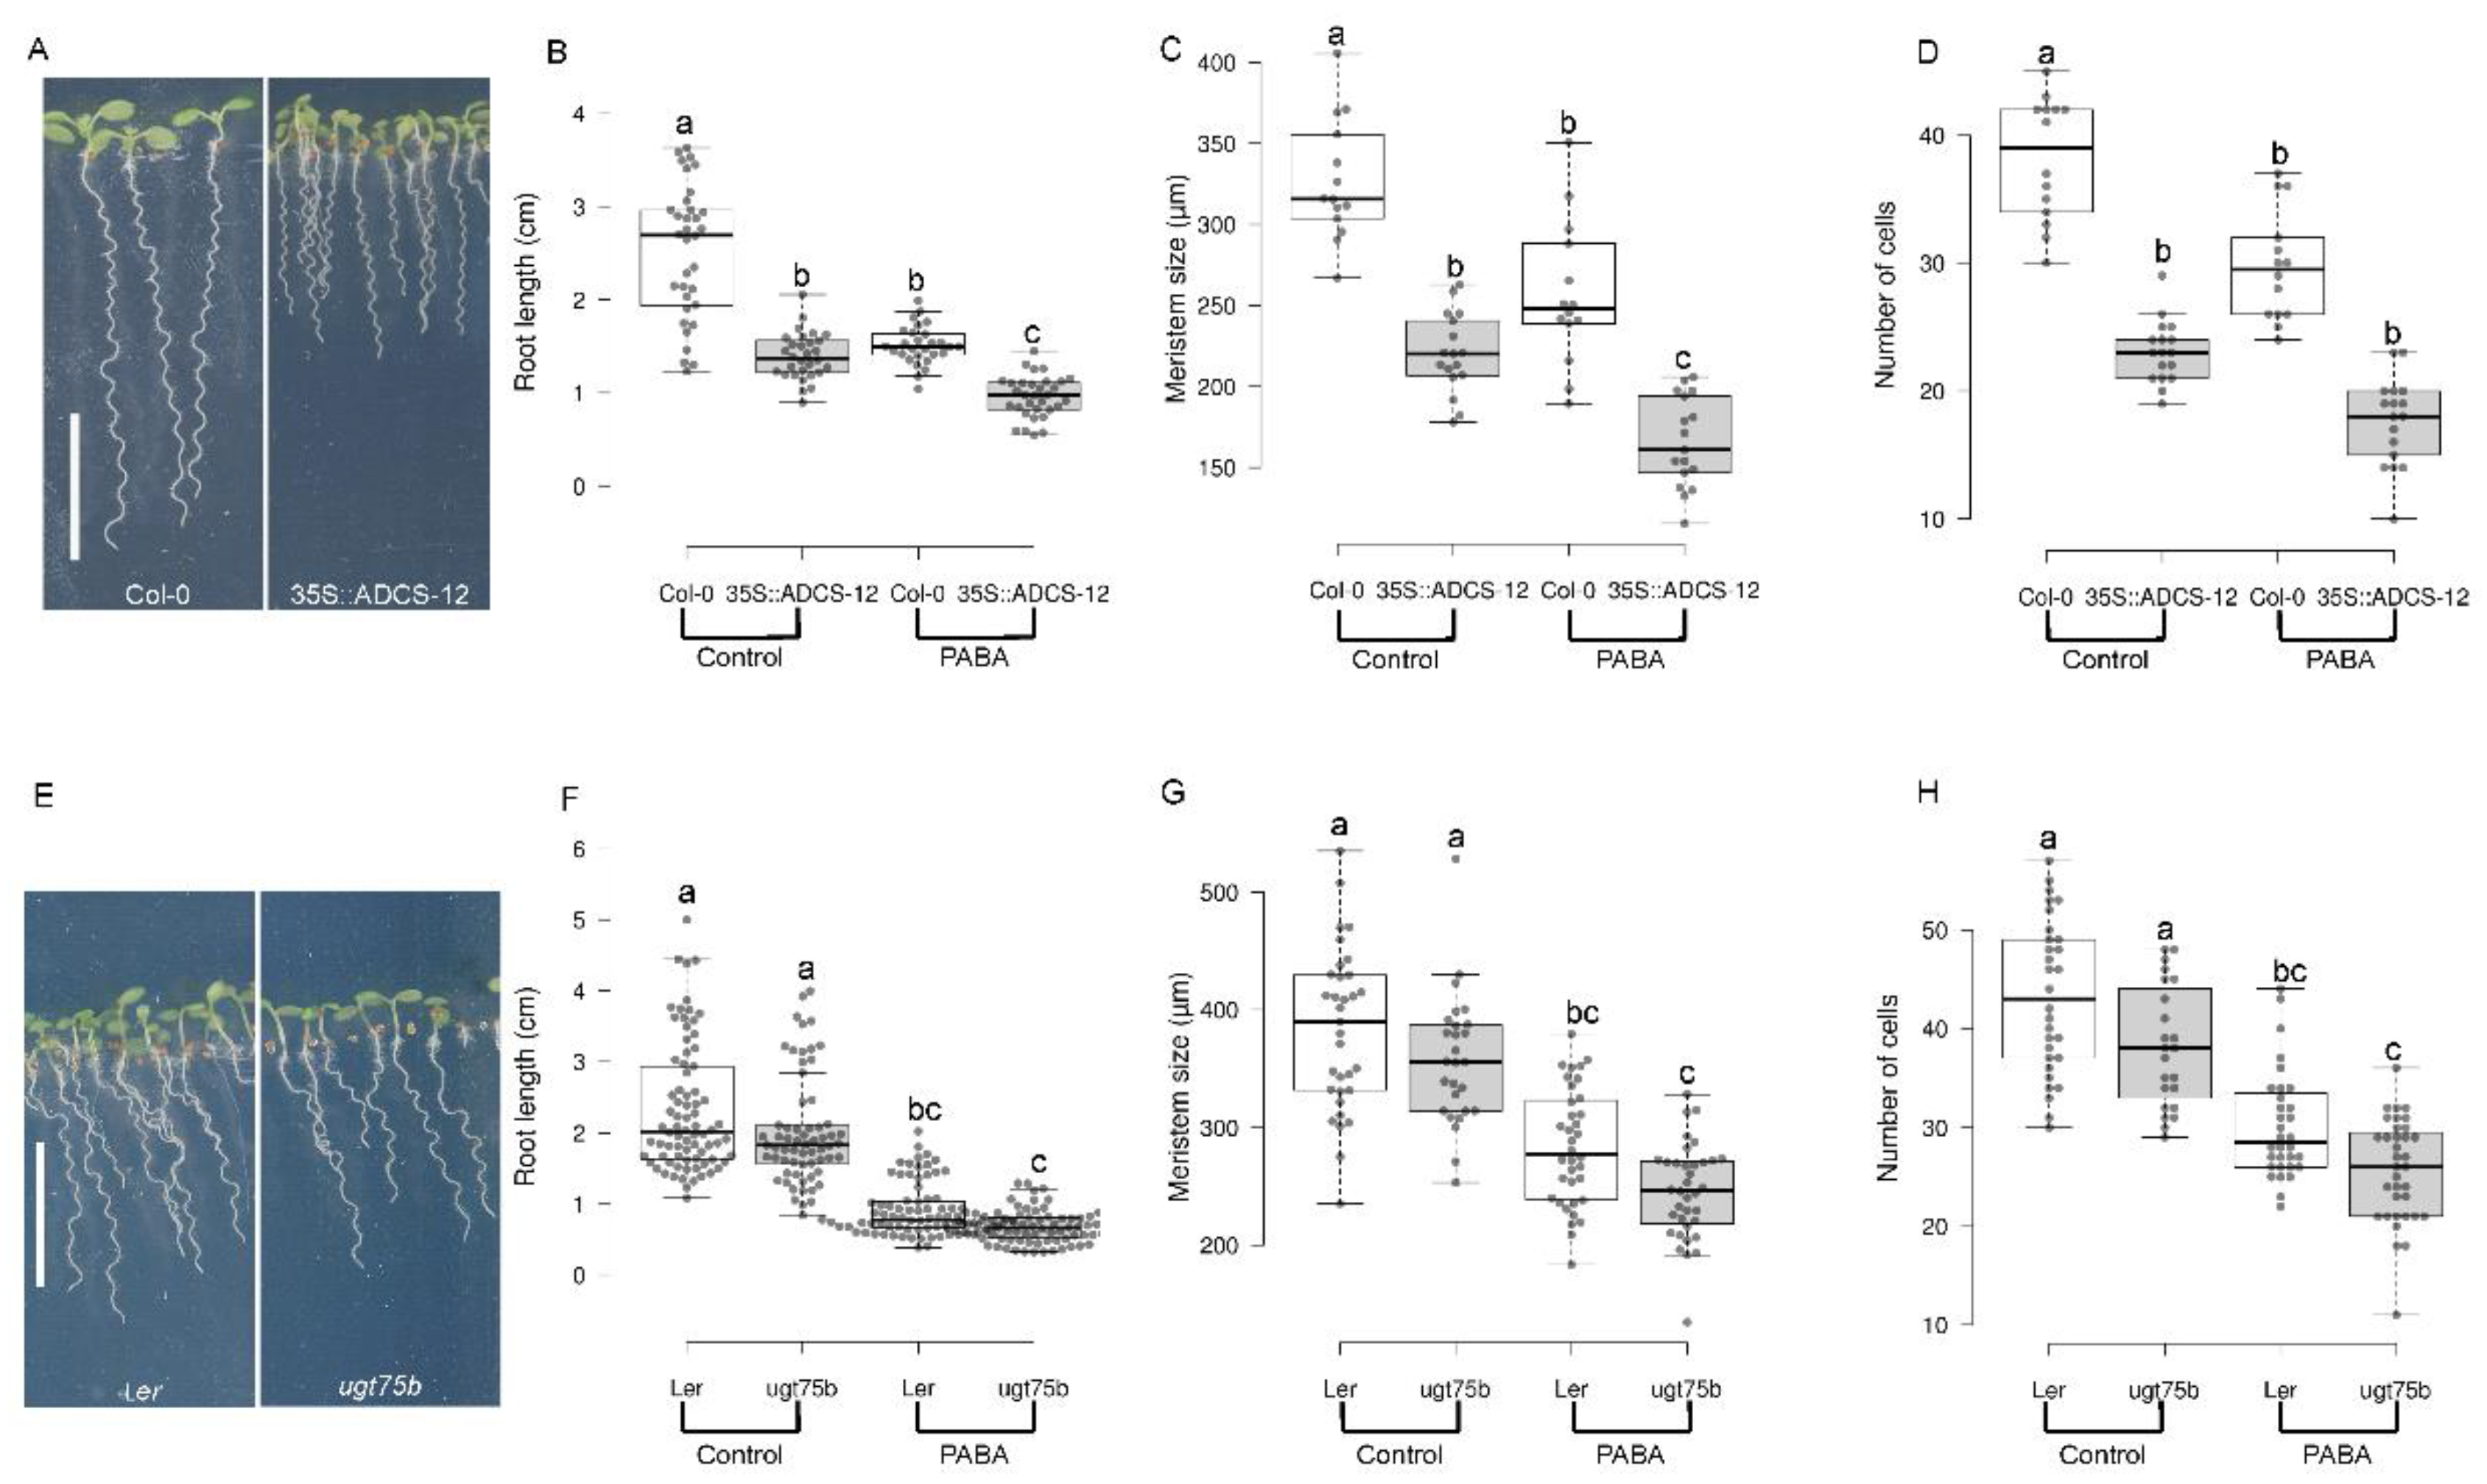
2.4. Endogenous PABA is a key component in the regulation of Arabidopsis root growth
3. Discussion
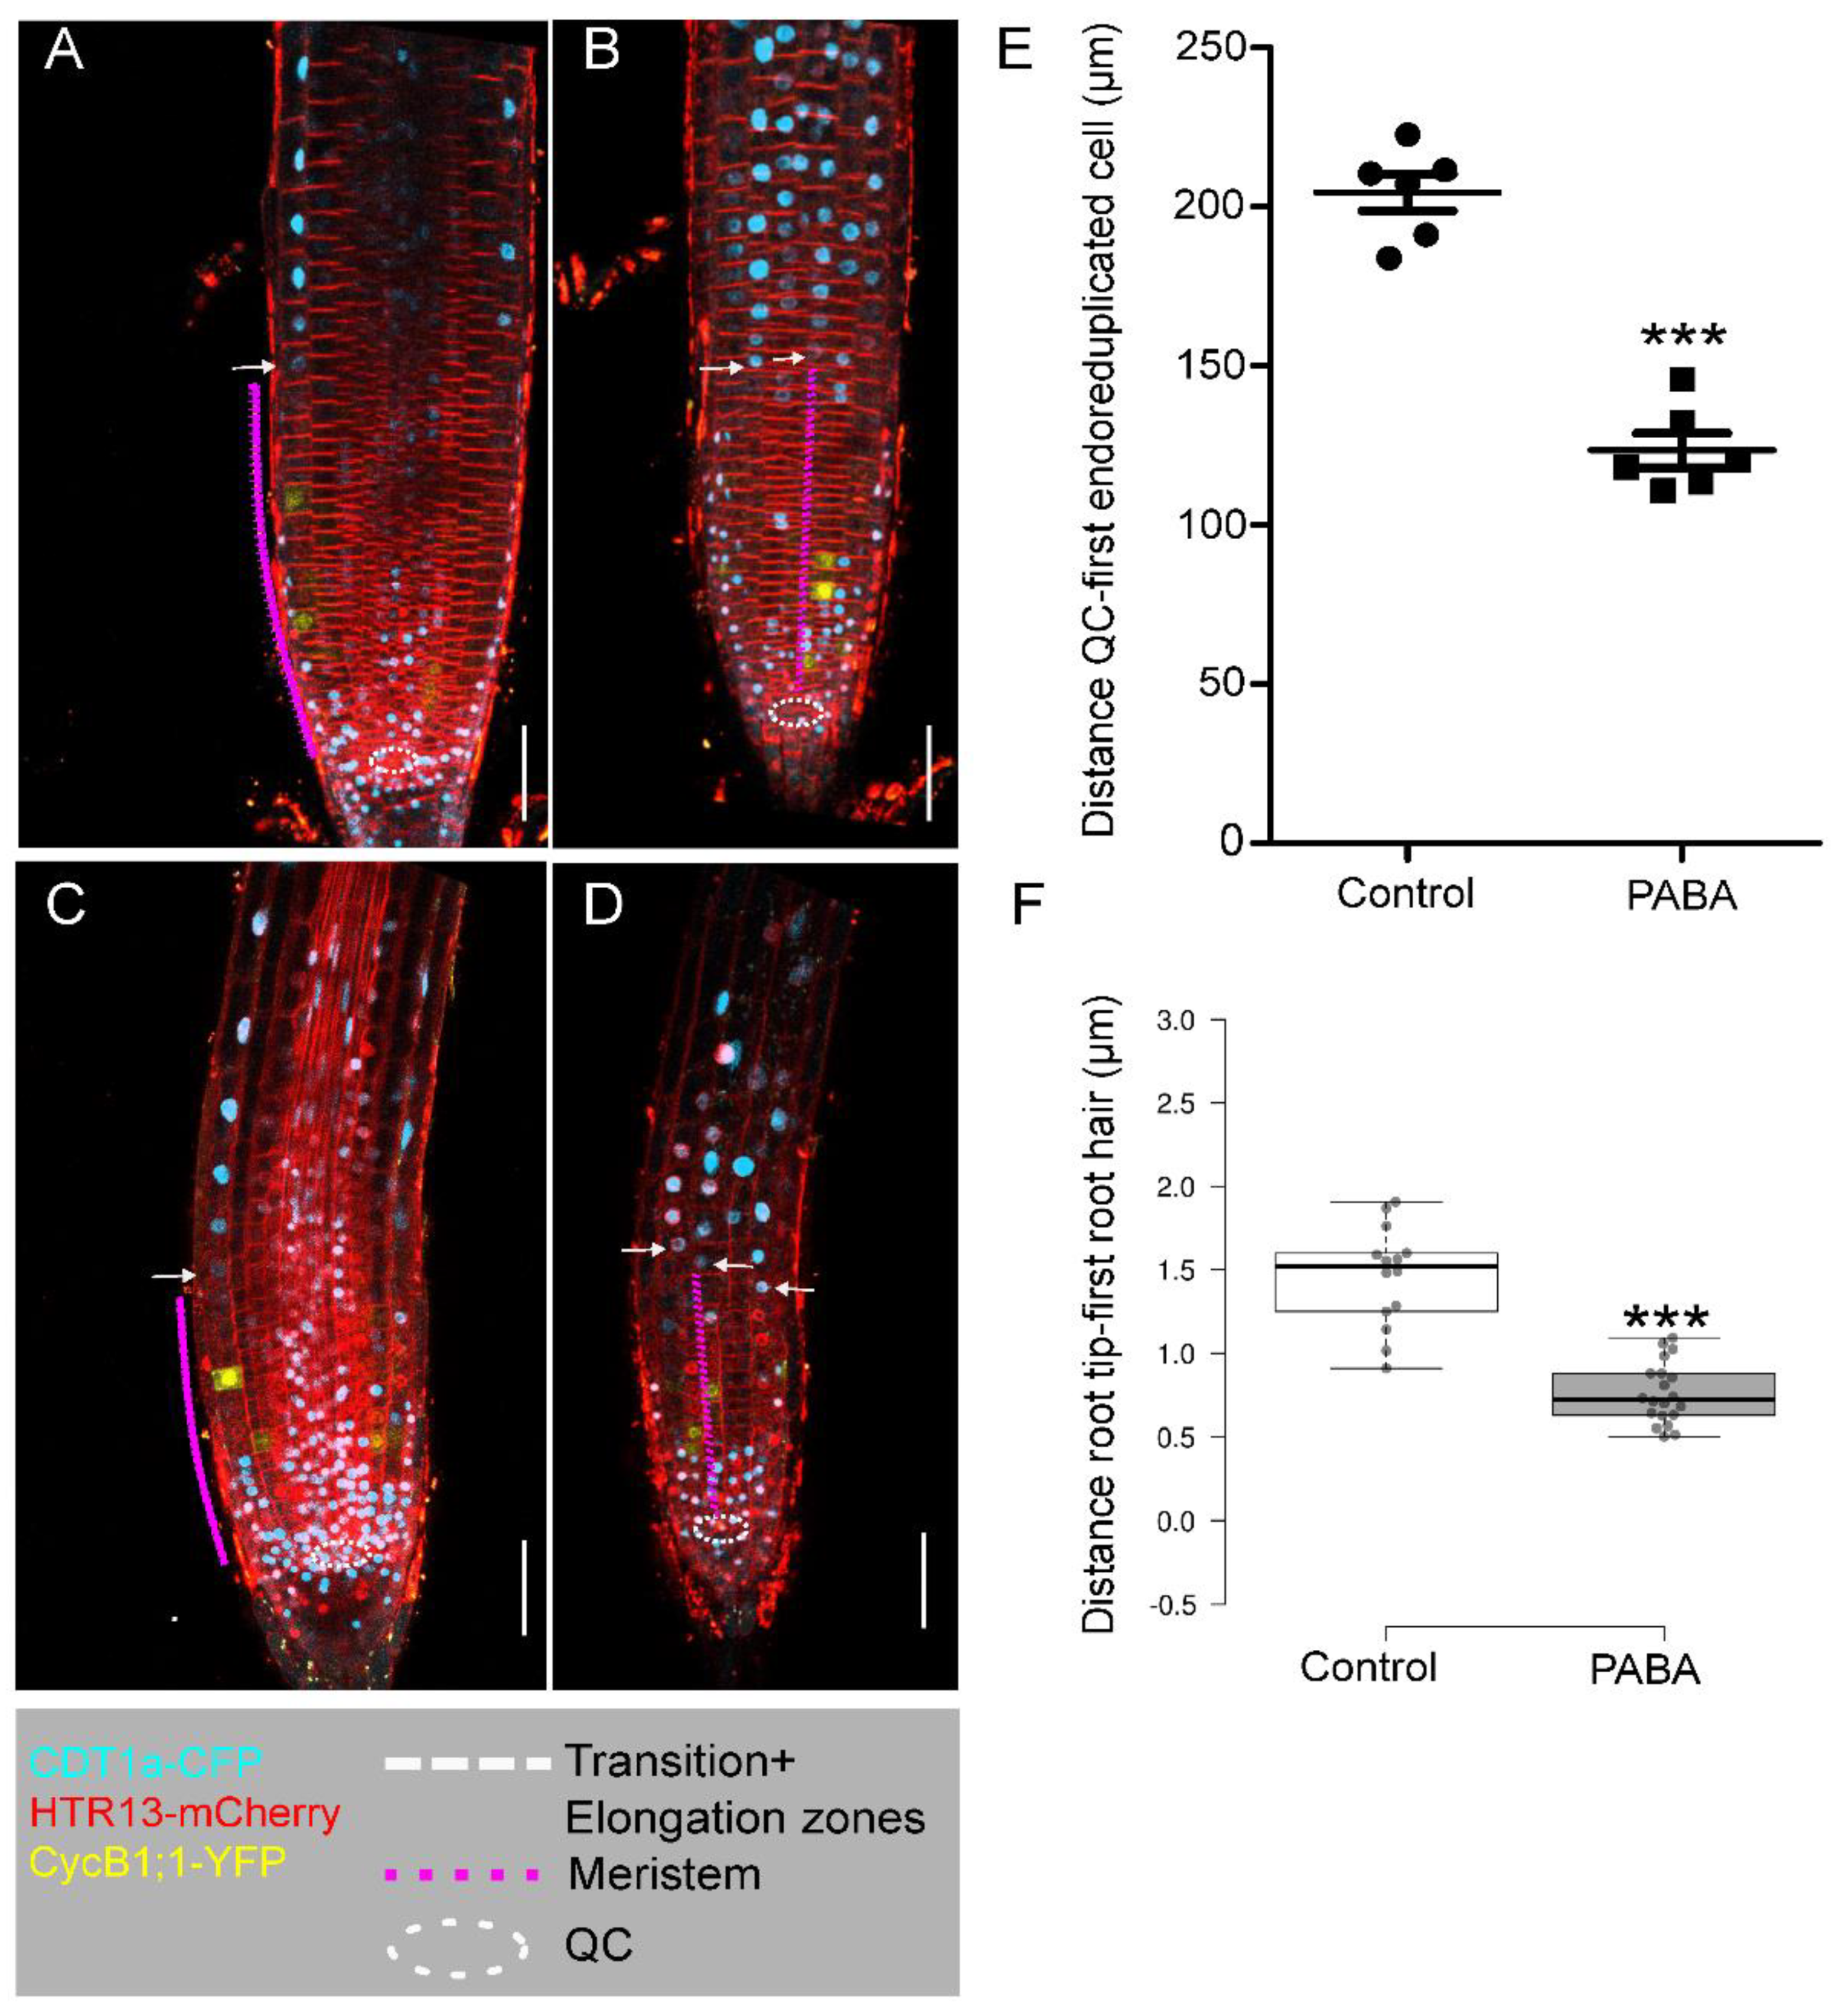
3.1. PABA represses G2/M transition and promotes endocycle
3.2. PABA and auxin display distinct activities on root growth
3.3. Conclusions and future prospects
4. Materials and Methods
4.1. Plant Material and Growth Conditions
4.2. Construction of plasmids
4.3. Plant Transformation
4.4. Plant Scanning and Microscopy
4.5. Quantification of Root Meristem Size and Number of Meristematic Cells
4.6. Quantification of GFP Signals
4.7. Quantification of GUS Signals
4.8. Quantification of eCFP/mCherry and YFP Signals
4.9. Quantification of free PABA
4.10. Accession Numbers
Supplementary Materials
Author Contributions
Funding
Data Availability Statement
Acknowledgments
Conflicts of Interest
References
- Smith, S.; De Smet, I. Root system architecture: insights from Arabidopsis and cereal crops. Philos Trans R Soc Lond B Biol Sci 2012, 367, 1441–1452. [Google Scholar] [CrossRef]
- Tian, H.; De Smet, I.; Ding, Z. Shaping a root system: regulating lateral versus primary root growth. Trends Plant Sci 2014, 19, 426–431. [Google Scholar] [CrossRef]
- Larkin, J.C.; Brown, M.L.; Schiefelbein, J. How do cells know what they want to be when they grow up? Lessons from epidermal patterning in Arabidopsis. Annu Rev Plant Biol 2003, 54, 403–430. [Google Scholar] [CrossRef]
- Verbelen, J.P.; De Cnodder, T.; Le, J.; Vissenberg, K.; Baluska, F. The Root Apex of Arabidopsis thaliana Consists of Four Distinct Zones of Growth Activities: Meristematic Zone, Transition Zone, Fast Elongation Zone and Growth Terminating Zone. Plant Signal Behav 2006, 1, 296–304. [Google Scholar] [CrossRef]
- Salvi, E.; Di Mambro, R.; Sabatini, S. Dissecting mechanisms in root growth from the transition zone perspective. J Exp Bot 2020, 71, 2390–2396. [Google Scholar] [CrossRef]
- Di Mambro, R.; De Ruvo, M.; Pacifici, E.; Salvi, E.; Sozzani, R.; Benfey, P.N.; Busch, W.; Novak, O.; Ljung, K.; Di Paola, L.; et al. Auxin minimum triggers the developmental switch from cell division to cell differentiation in the Arabidopsis root. Proc Natl Acad Sci U S A 2017, 114, E7641–E7649. [Google Scholar] [CrossRef]
- Dello Ioio, R.; Linhares, F.S.; Scacchi, E.; Casamitjana-Martinez, E.; Heidstra, R.; Costantino, P.; Sabatini, S. Cytokinins determine Arabidopsis root-meristem size by controlling cell differentiation. Curr Biol 2007, 17, 678–682. [Google Scholar] [CrossRef]
- Liu, S.; Strauss, S.; Adibi, M.; Mosca, G.; Yoshida, S.; Dello Ioio, R.; Runions, A.; Andersen, T.G.; Grossmann, G.; Huijser, P.; et al. Cytokinin promotes growth cessation in the Arabidopsis root. Curr Biol 2022, 32, 1974–1985. [Google Scholar] [CrossRef]
- Moubayidin, L.; Perilli, S.; Dello Ioio, R.; Di Mambro, R.; Costantino, P.; Sabatini, S. The rate of cell differentiation controls the Arabidopsis root meristem growth phase. Curr Biol 2010, 20, 1138–1143. [Google Scholar] [CrossRef]
- Dello Ioio, R.; Nakamura, K.; Moubayidin, L.; Perilli, S.; Taniguchi, M.; Morita, M.T.; Aoyama, T.; Costantino, P.; Sabatini, S. A genetic framework for the control of cell division and differentiation in the root meristem. Science 2008, 322, 1380–1384. [Google Scholar] [CrossRef]
- Perilli, S.; Sabatini, S. Analysis of root meristem size development. Methods Mol Biol 2010, 655, 177–187. [Google Scholar] [CrossRef]
- Kong, X.; Liu, G.; Liu, J.; Ding, Z. The Root Transition Zone: A Hot Spot for Signal Crosstalk. Trends Plant Sci 2018, 23, 403–409. [Google Scholar] [CrossRef]
- Pederson, T. Historical review: an energy reservoir for mitosis, and its productive wake. Trends Biochem Sci 2003, 28, 125–129. [Google Scholar] [CrossRef]
- Barnum, K.J.; O'Connell, M.J. Cell cycle regulation by checkpoints. Methods Mol Biol 2014, 1170, 29–40. [Google Scholar] [CrossRef]
- Romeiro Motta, M.; Zhao, X.; Pastuglia, M.; Belcram, K.; Roodbarkelari, F.; Komaki, M.; Harashima, H.; Komaki, S.; Kumar, M.; Bulankova, P.; et al. B1-type cyclins control microtubule organization during cell division in Arabidopsis. EMBO Rep 2022, 23, e53995. [Google Scholar] [CrossRef]
- Bhosale, R.; Maere, S.; De Veylder, L. Endoreplication as a potential driver of cell wall modifications. Current Opinion in Plant Biology 2019, 51, 58–65. [Google Scholar] [CrossRef]
- Yin, K.; Ueda, M.; Takagi, H.; Kajihara, T.; Sugamata Aki, S.; Nobusawa, T.; Umeda-Hara, C.; Umeda, M. A dual-color marker system for in vivo visualization of cell cycle progression in Arabidopsis. Plant J 2014, 80, 541–552. [Google Scholar] [CrossRef]
- Otero, S.; Desvoyes, B.; Peiro, R.; Gutierrez, C. Histone H3 Dynamics Reveal Domains with Distinct Proliferation Potential in the Arabidopsis Root. Plant Cell 2016, 28, 1361–1371. [Google Scholar] [CrossRef]
- Desvoyes, B.; Arana-Echarri, A.; Barea, M.D.; Gutierrez, C. A comprehensive fluorescent sensor for spatiotemporal cell cycle analysis in Arabidopsis. Nat Plants 2020, 6, 1330–1334. [Google Scholar] [CrossRef]
- Reyes-Hernandez, B.J.; Srivastava, A.C.; Ugartechea-Chirino, Y.; Shishkova, S.; Ramos-Parra, P.A.; Lira-Ruan, V.; Diaz de la Garza, R.I.; Dong, G.; Moon, J.C.; Blancaflor, E.B.; et al. The root indeterminacy-to-determinacy developmental switch is operated through a folate-dependent pathway in Arabidopsis thaliana. New Phytol 2014, 202, 1223–1236. [Google Scholar] [CrossRef]
- Srivastava, A.C.; Ramos-Parra, P.A.; Bedair, M.; Robledo-Hernández, A.L.; Tang, Y.; Sumner, L.W.; Díaz de la Garza, R.I.; Blancaflor, E.B. The folylpolyglutamate synthetase plastidial isoform is required for postembryonic root development in Arabidopsis. Plant Physiol 2011, 155, 1237–1251. [Google Scholar] [CrossRef]
- Kołton, A.; Długosz-Grochowska, O.; Wojciechowska, R.; Czaja, M. Biosynthesis Regulation of Folates and Phenols in Plants. Scientia Horticulturae 2022, 291, 110561. [Google Scholar] [CrossRef]
- Gorelova, V.; Ambach, L.; Rebeille, F.; Stove, C.; Van Der Straeten, D. Folates in Plants: Research Advances and Progress in Crop Biofortification. Front Chem 2017, 5, 21. [Google Scholar] [CrossRef]
- Rebeille, F.; Ravanel, S.; Jabrin, S.; Douce, R.; Storozhenko, S.; Van Der Straeten, D. Folates in plants: biosynthesis, distribution, and enhancement. Physiologia Plantarum 2006, 126, 330–342. [Google Scholar] [CrossRef]
- Basset, G.J.C.; Ravanel, S.; Quinlivan, E.P.; White, R.; Giovannoni, J.J.; Rebeille, F.; Nichols, B.P.; Shinozaki, K.; Seki, M.; Gregory, J.F., III; et al. Folate synthesis in plants: the last step of the p-aminobenzoate branch is catalyzed by a plastidial aminodeoxychorismate lyase. Plant Journal 2004, 40, 453–461. [Google Scholar] [CrossRef]
- Camara, D.; Bisanz, C.; Barette, C.; Van Daele, J.; Human, E.; Barnard, B.; Van Der Straeten, D.; Stove, C.P.; Lambert, W.E.; Douce, R.; et al. Inhibition of p-Aminobenzoate and Folate Syntheses in Plants and Apicomplexan Parasites by Natural Product Rubreserine. Journal of Biological Chemistry 2012, 287, 22367–22376. [Google Scholar] [CrossRef]
- Quinlivan, E.P.; Roje, S.; Basset, G.; Shachar-Hill, Y.; Gregory, J.F., III; Hanson, A.D. The folate precursor p-aminobenzoate is reversibly converted to its glucose ester in the plant cytosol. Journal of Biological Chemistry 2003, 278, 20731–20737. [Google Scholar] [CrossRef]
- Eudes, A.; Bozzo, G.G.; Waller, J.C.; Naponelli, V.; Lim, E.-K.; Bowles, D.J.; Gregory, J.F., III; Hanson, A.D. Metabolism of the folate precursor p-aminobenzoate in plants - Glucose ester formation and vacuolar storage. Journal of Biological Chemistry 2008, 283, 15451–15459. [Google Scholar] [CrossRef]
- Ravanel, S.; Cherest, H.; Jabrin, S.; Grunwald, D.; Surdin-Kerjan, Y.; Douce, R.; Rébeillé, F. Tetrahydrofolate biosynthesis in plants: molecular and functional characterization of dihydrofolate synthetase and three isoforms of folylpolyglutamate synthetase in Arabidopsis thaliana. Proc Natl Acad Sci U S A 2001, 98, 15360–15365. [Google Scholar] [CrossRef]
- Orsomando, G.; de la Garza, R.D.; Green, B.J.; Peng, M.; Rea, P.A.; Ryan, T.J.; Gregory, J.F., 3rd; Hanson, A.D. Plant gamma-glutamyl hydrolases and folate polyglutamates: characterization, compartmentation, and co-occurrence in vacuoles. J Biol Chem 2005, 280, 28877–28884. [Google Scholar] [CrossRef]
- Nziengui, H.; Lasok, H.; Kochersperger, P.; Ruperti, B.; Rebeille, F.; Palme, K.; Ditengou, F.A. Root Gravitropism Is Regulated by a Crosstalk between para-Aminobenzoic Acid, Ethylene, and Auxin. Plant Physiol 2018, 178, 1370–1389. [Google Scholar] [CrossRef]
- Li, W.; Liang, Q.; Mishra, R.C.; Sanchez-Mu Oz, R.; Wang, H.; Chen, X.; Van Der Straeten, D.; Zhang, C.; Xiao, Y. The 5-formyl-tetrahydrofolate proteome links folates with C/N metabolism and reveals feedback regulation of folate biosynthesis. Plant Cell 2021, 33, 3367–3385. [Google Scholar] [CrossRef] [PubMed]
- Donnelly, P.M.; Bonetta, D.; Tsukaya, H.; Dengler, R.E.; Dengler, N.G. Cell cycling and cell enlargement in developing leaves of Arabidopsis. Dev Biol 1999, 215, 407–419. [Google Scholar] [CrossRef]
- Ubeda-Tomas, S.; Federici, F.; Casimiro, I.; Beemster, G.T.S.; Bhalerao, R.; Swarup, R.; Doerner, P.; Haseloff, J.; Bennett, M.J. Gibberellin Signaling in the Endodermis Controls Arabidopsis Root Meristem Size. Current Biology 2009, 19, 1194–1199. [Google Scholar] [CrossRef]
- Beziat, C.; Kleine-Vehn, J.; Feraru, E. Histochemical Staining of beta-Glucuronidase and Its Spatial Quantification. Methods Mol Biol 2017, 1497, 73–80. [Google Scholar] [CrossRef] [PubMed]
- Kubo, M.; Imai, A.; Nishiyama, T.; Ishikawa, M.; Sato, Y.; Kurata, T.; Hiwatashi, Y.; Reski, R.; Hasebe, M. System for stable beta-estradiol-inducible gene expression in the moss Physcomitrella patens. PLoS One 2013, 8, e77356. [Google Scholar] [CrossRef]
- Crisan, M.E.; Bourosh, P.; Maffei, M.E.; Forni, A.; Pieraccini, S.; Sironi, M.; Chumakov, Y.M. Synthesis, crystal structure and biological activity of 2-hydroxyethylammonium salt of p-aminobenzoic acid. PLoS One 2014, 9, e101892. [Google Scholar] [CrossRef] [PubMed]
- Evans, T.; Rosenthal, E.T.; Youngblom, J.; Distel, D.; Hunt, T. Cyclin: a protein specified by maternal mRNA in sea urchin eggs that is destroyed at each cleavage division. Cell 1983, 33, 389–396. [Google Scholar] [CrossRef]
- Edgar, B.A.; Orr-Weaver, T.L. Endoreplication cell cycles: more for less. Cell 2001, 105, 297–306. [Google Scholar] [CrossRef]
- Desvoyes, B.; Fernandez-Marcos, M.; Sequeira-Mendes, J.; Otero, S.; Vergara, Z.; Gutierrez, C. Looking at plant cell cycle from the chromatin window. Frontiers in Plant Science 2014, 5. [Google Scholar] [CrossRef] [PubMed]
- Street, I.H.; Aman, S.; Zubo, Y.; Ramzan, A.; Wang, X.; Shakeel, S.N.; Kieber, J.J.; Schaller, G.E. Ethylene Inhibits Cell Proliferation of the Arabidopsis Root Meristem. Plant Physiol 2015, 169, 338–350. [Google Scholar] [CrossRef]
- Ruzicka, K.; Ljung, K.; Vanneste, S.; Podhorska, R.; Beeckman, T.; Friml, J.; Benkova, E. Ethylene regulates root growth through effects on auxin biosynthesis and transport-dependent auxin distribution. Plant Cell 2007, 19, 2197–2212. [Google Scholar] [CrossRef]
- Takahashi, N.; Kajihara, T.; Okamura, C.; Kim, Y.; Katagiri, Y.; Okushima, Y.; Matsunaga, S.; Hwang, I.; Umeda, M. Cytokinins control endocycle onset by promoting the expression of an APC/C activator in Arabidopsis roots. Curr Biol 2013, 23, 1812–1817. [Google Scholar] [CrossRef]
- Sablowski, R. Coordination of plant cell growth and division: collective control or mutual agreement? Curr Opin Plant Biol 2016, 34, 54–60. [Google Scholar] [CrossRef]
- Stepanova, A.N.; Yun, J.; Likhacheva, A.V.; Alonso, J.M. Multilevel interactions between ethylene and auxin in Arabidopsis roots. Plant Cell 2007, 19, 2169–2185. [Google Scholar] [CrossRef]
- Sumalan, R.L.; Halip, L.; Maffei, M.E.; Croitor, L.; Siminel, A.V.; Radulov, I.; Sumalan, R.M.; Crisan, M.E. Bioprospecting Fluorescent Plant Growth Regulators from Arabidopsis to Vegetable Crops. International Journal of Molecular Sciences 2021, 22. [Google Scholar] [CrossRef] [PubMed]
- Serre, N.B.C.; Kralik, D.; Yun, P.; Slouka, Z.; Shabala, S.; Fendrych, M. AFB1 controls rapid auxin signalling through membrane depolarization in Arabidopsis thaliana root. Nat Plants 2021, 7, 1229–1238. [Google Scholar] [CrossRef] [PubMed]
- Tanimoto, M.; Jowett, J.; Stirnberg, P.; Rouse, D.; Leyser, O. pax1-1 partially suppresses gain-of-function mutations in Arabidopsis AXR3/IAA17. BMC Plant Biol 2007, 7, 20. [Google Scholar] [CrossRef]
- Fendrych, M.; Akhmanova, M.; Merrin, J.; Glanc, M.; Hagihara, S.; Takahashi, K.; Uchida, N.; Torii, K.U.; Friml, J. Rapid and reversible root growth inhibition by TIR1 auxin signalling. Nat Plants 2018, 4, 453–459. [Google Scholar] [CrossRef] [PubMed]
- Himanen, K.; Boucheron, E.; Vanneste, S.; de Almeida Engler, J.; Inze, D.; Beeckman, T. Auxin-mediated cell cycle activation during early lateral root initiation. Plant Cell 2002, 14, 2339–2351. [Google Scholar] [CrossRef] [PubMed]
- Richard, C.; Lescot, M.; Inze, D.; De Veylder, L. Effect of auxin, cytokinin, and sucrose on cell cycle gene expression in Arabidopsis thaliana cell suspension cultures. Plant Cell Tissue and Organ Culture 2002, 69, 167–176. [Google Scholar] [CrossRef]
- Ishida, T.; Adachi, S.; Yoshimura, M.; Shimizu, K.; Umeda, M.; Sugimoto, K. Auxin modulates the transition from the mitotic cycle to the endocycle in Arabidopsis. Development 2010, 137, 63–71. [Google Scholar] [CrossRef] [PubMed]
- Ding, T.; Zhang, F.; Wang, J.; Wang, F.; Liu, J.; Xie, C.; Hu, Y.; Shani, E.; Kong, X.; Ding, Z.; et al. Cell-type action specificity of auxin on Arabidopsis root growth. Plant J 2021, 106, 928–941. [Google Scholar] [CrossRef]
- Sambrook, J.; Fritsch, E.F.; Maniatis, T. Molecular cloning: a laboratory manual; Cold spring harbor laboratory press: 1989.
- Clough, S.J.; Bent, A.F. Floral dip: a simplified method for Agrobacterium-mediated transformation of Arabidopsis thaliana. Plant J 1998, 16. [Google Scholar] [CrossRef]
- Ditengou, F.A.; Teale, W.D.; Kochersperger, P.; Flittner, K.A.; Kneuper, I.; van der Graaff, E.; Nziengui, H.; Pinosa, F.; Li, X.; Nitschke, R.; et al. Mechanical induction of lateral root initiation in Arabidopsis thaliana. Proc Natl Acad Sci U S A 2008, 105, 18818–18823. [Google Scholar] [CrossRef]
- Takatsuka, H.; Higaki, T.; Umeda, M. Actin Reorganization Triggers Rapid Cell Elongation in Roots. Plant Physiol 2018, 178, 1130–1141. [Google Scholar] [CrossRef] [PubMed]
Disclaimer/Publisher’s Note: The statements, opinions and data contained in all publications are solely those of the individual author(s) and contributor(s) and not of MDPI and/or the editor(s). MDPI and/or the editor(s) disclaim responsibility for any injury to people or property resulting from any ideas, methods, instructions or products referred to in the content. |
© 2023 by the authors. Licensee MDPI, Basel, Switzerland. This article is an open access article distributed under the terms and conditions of the Creative Commons Attribution (CC BY) license (http://creativecommons.org/licenses/by/4.0/).


