1. Introduction
The pathogenic protozoan
Trypanosoma cruzi causes Chagas disease and has developed efficient methods for exploiting host organisms (both vertebrates and invertebrates), which involve various developmental stages. As a result,
T. cruzi undergoes significant morphological modifications, including alterations in gene expression and rearrangements of its structures and organelles [
1,
2,
3,
4,
5,
6]. The morphological identification of the epimastigote, trypomastigote, transitional, and amastigote forms of
T. cruzi is mainly based on the relative positioning of the nucleus, kinetoplast, flagellum, and the length of the flagellum due to the 3D arrangement of the subpellicular microtubules [
3,
6,
7,
8] in conjunction with its molecular and biochemical composition [
9,
10,
11].
T. cruzi has a single flagellum that is responsible for parasite motility and is composed of a classic conserved axoneme (9+2 arrangement). However, like most of the members of the Trypanosomatidae family, it has a unique filamentous structure known as the paraflagellar rod (PFR), which is closely associated with the axoneme [
12,
13,
14,
15]. In most trypanosomatids, including
Trypanosoma brucei and Leishmania spp., the flagellum departs from the flagellar pocket, an extracellular space formed by the invagination of the plasma membrane. It is responsible for endocytic and exocytic activities [
16,
17]. Distinctively,
T. cruzi does not exhibit significant endocytosis via the flagellar pocket; instead, it has developed a highly specialized cytostome-cytopharynx complex that is responsible for this process, thus constituting the most polarized endocytic system described thus far [
18,
19,
20,
21].
After it exits the flagellar pocket, the flagellum remains attached to the cell body until it becomes free at the cell anterior. At this location, a special type of junction is formed between the flagellar membrane and the cell body membrane. One special feature in trypanosomatids that belong to the Trypanosoma genus is a large area where there is close association of the flagellum with the cell body. This structure was initially characterized using conventional transmission electron microscopy (TEM) of thin sections [
22] and freeze-fracture replicas [
19,
20,
21]. This highly specialized area was designated as the flagellar attachment zone (FAZ), which also presents a set of cytoplasmic fibers, filaments, and junctional complexes that start from the flagellum domain and are anchored to the cell cytoskeleton [
22,
23,
24,
25,
26].
While well-characterized in
T. brucei, the FAZ remains poorly understood in
T. cruzi. It is a key regulator of cellular processes such as cell motility, division, morphogenesis, and infectivity [
17,
24,
27,
28]. It comprises an electron-dense cytoplasmic region composed of the FAZ fibrillary network. This network involves several domains: the FAZ flagellum domain, FAZ intercellular domain, FAZ filament domain, microtubule quartet domain, and microtubule quartet-FAZ linker domain [
22,
24,
28]. This complex also includes the special organization of the flagellar and cell body plasma membrane, which was characterized using freeze-fracture, and a special organization of intramembranous particles was identified [
19,
20,
21].
In
T. brucei, 34 proteins were identified as part of the FAZ, and the majority have at least one orthologue in
Leishmania mexicana [
17,
25]. These proteins are heterogeneously distributed along the FAZ length and flagellum. It has been shown that protein function depends on localization, and alterations in components in the same domain can lead to similar phenotypes. In trypanosomes, the first molecule characterized in
T. cruzi was glycoprotein 72 (GP72), a membrane glycoprotein of 72 kDa [
29]. It was localized along the flagellum by immunofluorescence assay, and TcGP72-null mutants showed detachment of the flagellum from the cell body, changing cell morphology, and reducing the ability to infect insect vectors and mammalian cells [
15,
29,
30].
Despite the well-established depletion phenotype of TcGP72, little is known about its interaction with other proteins and their structural features during the life cycle of
T. cruzi. TcGP72 protein is a homolog of flagellum adhesion protein 1 (FLA-1), FLA-2, and FLA-3 in
T. brucei [
31]. These proteins are structured with an N-terminus peptide signal, an extracellular region with several N-glycosylation sites, an NHL-repeat domain, a transmembrane domain, and a short intracellular C-terminus [
27]. In
T. brucei, TbFLA1 protein interacts with FLA1-binding protein (TbFLA-1BP), promoting membrane adhesion between the flagellum and the cell body. TbFLA1 is localized on the side of the cell body and anchored to the membrane by the C-terminus transmembrane domain, a short tail of 16 amino acids. It is responsible for correctly targeting the extracellular domain and accomplishing the interaction of TbFLA1 with TbFLA-1BP. This TbFLA-1/TbFLA-1BP association favors the assembly of the FAZ and flagellum and regulates cell morphogenesis [
27].
In this study, we examined the role of the FAZ proteins TcGP72 and TcFLA-1BP using tagged parasites and null mutants for both proteins using a CRISPR/Cas9 system in epimastigote forms (the replicative stage in the insect vector) and during metacyclogenesis. We report that the arrangement of FAZ proteins in T. cruzi differs from their counterparts in T. brucei, with fewer isoforms compared to other Trypanosoma species. We demonstrate that the TcFLA-1BP protein is distributed along the parasite’s cell body, exhibiting a revers localization compared to what has been previously described in T. brucei.
The TcGP72 mutant labeled with mNeonGreen at the C-terminus acted as a dominant-negative mutant, displaying flagellar detachment similar to the null mutant. Consistent with previous studies on T. brucei and T. cruzi, we observed varying degrees of flagellar detachment from the cell body in the null mutants for the evaluated proteins. We show that complete or partial disruption of the FAZ compromised cell morphometry, resulting in cells with altered cell body and flagellum lengths.
The absence of TcGP72 and TcFLA-1BP altered cell growth and differentiation, significantly impacting cytokinesis, with a substantial number of parasites in the G2/M phase displaying aberrant forms. Our data indicate that despite the phenotypes found in the mutant parasites being similar to those described in T. brucei, T. cruzi exhibits unique characteristics in FAZ structure formation that may contribute to the success of cell division and parasite differentiation. Understanding the arrangement of these components in the parasite may contribute to better comprehension of changes that take place during the life cycle of this protozoan.
2. Materials and Methods
2.1. Parasite and Mammalian Cell Maintenance
T. cruzi epimastigotes (Dm28c strain) were maintained in the exponential growth phase in liver infusion tryptose (LIT) medium [
32] supplemented with 10% fetal bovine serum (FBS), 10 U/mL of penicillin, and 10 μg/mL of streptomycin (Invitrogen) at 28 °C. The parasites were usually seeded at 5 × 10
6 cells/mL (logarithmic growth phase) and counted manually in a Neubauer chamber. For metacyclogenesis, epimastigotes were grown until they reached a stationary phase (5 x 10
7 cells/mL), and then differentiation was accomplished as described previously [
33].
Metacyclic trypomastigotes (MTs) were purified from the supernatant by ion-exchange chromatography using 2-(diethylamino) ethyl ether cellulose (DEAE-cellulose) columns [
34]. Tissue-culture cell-derived trypomastigotes (TCTs) were obtained from supernatants of LLC-MK2 cells (Rhesus monkey kidney epithelial cells, ATCC CCL-7). The cells were infected with MTs or TCTs released from infected cells. The parasites were collected by centrifugation at 1500 g for 5 min and incubated for at least 60 min at 37 °C. TCT-enriched supernatants were collected and used for experiments.
2.2. T7Cas9 Line Generation
T. cruzi Dm28c T7Cas9 line was generated by electroporation using an Amaxa Nucleofector 2b (Lonza). This was done by following the manufacturer’s recommendations with two pulses of X-014 program in electroporation buffer (5.0 mM KCl, 0.15 mM CaCl
2, 90 mM Na
2HPO
4, 50 mM HEPES, and 50 mM Mannitol) [
35]. For expression of Cas9 and T7 RNA polymerase (RNAP), the pLEWT7Cas9-Neo plasmid was linearized with Not I before transfection. 2 x 10
7 cells of wild-type
T. cruzi Dm28c epimastigotes were transfected with 50 μg of linearized pLEWT7Cas9-Neo plasmid. After transfections, the parasites were positively selected [
36].
2.3. Endogenous C-terminus Tagging by CRISPR/Cas9 Editing
For C-terminus tagging of endogenous proteins, we used the Dm28c T7Cas9 line and a specific single guide RNA (sgRNA) sequence targeting the 3′ end of two different genes using the genome sequence of
T. cruzi Dm28c 2018 (
https://tritrypdb.org/tritrypdb/app). These genes were TcGP72 (Gene ID C4B63_21g104, Flagellum adhesion protein 1 or GP72), a homolog to FLA1, FLA2, and FLA3 in
T. brucei (Gene ID Tb927.8.4010, Tb927.8.4060, and Tb927.8.4110, respectively), and TcFLA-1BP (Gene ID C4B63_21g106, FLA1-binding protein), an orthologue to a gene in
T. brucei (Gene ID Tb927.8.4100). Each of these two mutants was generated by co-transfection of one SgRNA template with a DNA donor cassette to induce homology-directed repair in epimastigotes of the T7Cas9 line.
To determine the sgRNA targeting sequence, the Eukaryotic Pathogen CRISPR Guide RNA/DNA Design Tool (EuPaGDT software at
http://grna.ctegd.uga.edu) was used to select the best protospacer sequence. 3′ SgRNA targeting was designed to induce a double-stranded break by Cas9 nuclease downstream of the stop codons of each gene. Chimeric 3′ sgRNA templates were obtained by PCR with a forward primer (3′ SgRNA F) containing the T7 RNAP promoter, target sequence (protospacer), and a region complementary to a common reverse primer (G00: aaaagcaccgactcggtgccactttttcaagttgataacggactagccttattttaacttgctatttctagctctaaaac) containing the guide RNA scaffold sequence for Cas9 from Streptococcus pyogenes (SpCas9).
The PCR reactions to amplify the sgRNA template were prepared using 3′ UTR sgRNA forward primer (FLA-1BP 3′SgRNAF: gaaattaatacgactcactataggGAGTGTGTGCTTTTCTCCCGgttttagagctagaaatagc or GP72 3′SgRNAF: gaaattaatacgactcactataggGTCATTTCCCACCTTTCTCCgttttagagctagaaatagc) and G00 universal SgRNA reverse primer as described previously [
36]. The donor DNA fragment containing the protein tagging 3xMyc::mNeonGreen::3xMyc (called mNG Tag) and the resistance gene was amplified by mixing 200 ng of pPOTc-Blast-Blast-3xMyc::mNG::3xMyc with either FLA-1BP or GP72 downstream forward and reverse primers (P4 FLA-1BPF: AAAGAAGAGCAACGTGCACGAGACATGTACggttctggtagtggttccgg/P5 FLA-1BPR: GAGTCAGAGAGACACAGAGACAGACAGAGAccaatttgagagacctgtgc and P4 GP72F: CGGAGCGCTGTGATTCTTGTTCCACCCATGggttctggtagtggttccgg/P5 GP72R: TGTTGGTTTCTTCTAATTTCAATTTCTGAAccaatttgagagacctgtgc, respectively). The PCR reactions were performed as reported previously [
36]. Constructs were transfected in epimastigotes of the T7Cas9 line as described previously [
35,
37,
38]. Each cell line was analyzed using fluorescence microscopy, flow cytometry, and western blot. The tags were called TcGP72::mNG and TcFLA-1BP::mNG.
2.4. Generation of TcGP72-/- and TcFLA-1BP-/- Double-Knockout Cells via CRISPR/Cas9 Editing and Genotyping
To obtain knockout lines, we prepared two PCRs for amplification of SgRNA templates for each target gene. One sgRNA template was directed at 5′ UTR upstream of the target coding sequence (5′SgRNA FLA-1BP: gaaattaatacgactcactataggGTAAAGGAATTCTACACGTGgttttagagctagaaatagc; 5′SgRNAGP72: gaaattaatacgactcactataggGTAGACCGGACGTCCCGTCTgttttagagctagaaatagc), and one was directed 3′ UTR downstream (3′SgRNA FLA-1BP e 3′SgRNA GP72), as described previously for endogenous tagging (Alves et al., 2022). Each double-knockout was generated using two drug resistance markers (blasticidin and hygromycin), followed by cloning cell lines after transfection.
To amplify the donor DNA fragment containing the resistance gene, we used DNA templates (pPOTc-Blast-Blast-Myc::mNG::myc or pPOTc-Hygro-Hygro-Myc::mNG::myc) mixed with a 5′ UTR forward primer upstream of the coding sequence and a 3′ UTR reverse primer downstream (P1 FLA-1BP forward: AAAGACGGGGGGGGGGGAGGTGCGGCAGGAgtataatgcagacctgctgc/P7 FLA-1BP reverse: GAGTCAGAGAGACACAGAGACAGACAGAGAccggaaccactaccagaacc and P1 GP72 forward: ACAAACAAACAAGCAAAAACAAAAATATTTgtataatgcagacctgctgc/P7 GP72 reverse: TGTTGGTTTCTTCTAATTTCAATTTCTGAAccggaaccactaccagaacc, respectively). The PCR reactions were performed as described previously [
38,
39]. Constructs were transfected in epimastigotes of the T7Cas9 line as described previously [
35,
37,
38].
At 48 h after nucleofection, a selection marker was added to the cells (25 µg/mL blasticidin and 200 µg/mL hygromycin). Upon the establishment of selected cultures, the parasites were cloned through serial dilution. To confirm the gene deletions, genomic DNA (gDNA) was isolated using a Genomic DNA Mini Kit and used in PCR reactions with oligonucleotides that allowed the amplification of the 5′ end and part of the coding sequence of TcFLA-1BP (C1 FLA_1BP 5′UTR forward: TTCAGCAATAAGAAGAAGGAAGGG and C2 FLA1_BP ORF reverse: TACCTTCATAGAGCTTCACATCGG) and TcGP72 (C1 GP72 5′UTR forward: AAGAAGAGAGAGGGAGAGAGAG and C2 GP72 ORF REV: AAATGCCGGATTTGTTCACCAAAC) genes, as well as coding regions of the resistance genes for blasticidin (B1_BSD_Fow: CCTCATTGAAAGAGCAACGGC and B2_BDS_Rev AGGGCAGCAATTCACGAATC) and hygromycin (H1_Hygro_Fow: GAAAAAGCCTGAACTCACCGC and H2_Hygro_Rev: GTGTCGTCCATCACAGTTTGC). The PCR products were electrophoresed in 1% agarose gel. The result was detected by ethidium bromide staining, and visualization was done with the UVP bioimaging system.
2.5. Western Blotting
Whole parasite extracts were prepared by collecting cells and boiling them in Laemmli sample buffer (60 mM Tris. HCl, pH 7.4, 1% w/v SDS, 10% v/v glycerol, 20 mM DTT, 0.05% w/v Bromophenol Blue). Extracts were resolved on 8% polyacrylamide gel and then transferred to nitrocellulose membranes (GE Life Sciences) by standard procedures. The membranes were stained with 0.3% w/v Ponceau S in 0.3% v/v acetic acid, washed in water, and blocked with 5% w/v non-fat dry milk in Tris-Buffered Saline (10 mM Tris-HCl, pH 7.4, 0.15 M NaCl) with 0.05% Tween-20 (TBS-T). Primary antibody incubation was performed for 1 h at room temperature with TBS-T supplemented with 5% non-fat dry milk.
Membranes were washed with TBS-T and then incubated with secondary antibodies in the same conditions as the primary antibodies. HRP-conjugated secondary antibodies (anti-rabbit or anti-mouse Promega, 1:300) were used for protein detection and visualization. The blot was revealed using ECL plus (Promega) and registered by a ImageQuant™ LAS 500 (GE Healthcare). Proteins were detected by western blotting using the following antibodies: anti-Myc antibody 9E10 (Thermo Fisher, 1:3000 dilution), anti-aldolase antibody (1:3000) [
40], anti- glycoprotein 82 (GP82) antibody (Mab 3F6, 1:1000) [
34], and anti-eif5A [
41].
2.6. Flow Cytometry of Fluorescent Parasites
Log-phase epimastigotes (1 x 10⁶ cells/mL) were washed and resuspended in phosphate-buffered saline (PBS 1X - 137 mM NaCl, 2.7 mM KCl, 10 mM Na2HPO4, 2 mM KH2PO4, pH 7.4) and then examined by flow cytometry. The mNeonGreen (mNG) fluorescence was measured by flow cytometry using a BD Accuri™ C6 apparatus (BD Biosciences). The mNG fluorescence was measured in the FL1-A channel (525/30 filter), and the data were analyzed with FlowJo software. Negative controls including cells without mNG expression were used to draw gates to discriminate positive and negative events, and 20,000 events were analyzed per sample.
2.7. Localization of Protein Tags In Vivo and Immunofluorescence Microscopy
Cell cultures (1 x 10⁷ cells) of TcFLA-1BP::mNG and TcGP72::mNG carrying the 3xMyc::mNG::3xMyc tag and the wild type were washed in PBS 1X, incubated with Hoechst 33342 dye (Life Technologies) in PBS for 10 min, washed in PBS 1X, and adhered to poly-lysine coverslips for 15 min. Live cells were then visualized in an Axio Observer Z1 (Zeiss) equipped with a Zeiss N-Achroplan 100×/1.25 Ph3 M27 objective and a CCD camera (AxioCam HR R3). TcGP72-/- and TcFLA-1BP-/- mutants and T7Cas9 were washed in PBS 1X, fixed with recently prepared 4% formaldehyde in PBS 1X for 10 min, and adhered to poly-lysine-coated coverslips for 15 min. Coverslips were washed with PBS 1X, the cells were permeabilized with PBS 1X + 0.1% Triton X-100 for 10 min, and then blocking was performed with 3% w/v BSA for 1 h at room temperature (RT).
The parasites were incubated for 1 h at 4 °C with a 1:200 dilution of mAb L3B2 monoclonal antibody, which recognizes the FAZ-1 protein in the FAZ filament in
T. brucei [
42]. They were then washed three times with PBS 1X + 0.05% Tween-20 and incubated for 1 h at 4 °C with the secondary anti-mouse antibody conjugated with Alexa Fluor-488 (Thermo Fisher Scientific) at 1:500. The coverslips were washed three times and incubated once more with blocked solution for 16 h at 4 °C. Next, parasites were washed three times with PBS 1X + 0.05% Tween-20 and incubated with monoclonal antibody mAb 2F6 (1:200), which recognizes a flagellar protein of ~70 kDa (Ramos et al., 2011), and anti-mouse secondary antibody conjugated with Alexa Fluor-594 (Thermo Fisher Scientific) at 1:500 under the same conditions described above. Coverslips were mounted with Prolong Mounting Medium with DAPI and visualized in Axio Observer Z1 (Zeiss) equipped with a Zeiss N-Achroplan 100×/1.25 Ph3 M27 objective and a CCD camera (AxioCam HR R3).
2.8. Cell Cycle Analysis
Synchronization of epimastigote forms of T. cruzi in the G1/S phase of the cell cycle was achieved using hydroxyurea (HU). Cells in the exponential growth phase were incubated with 15 mM of HU for 16–24 h and then released by washing twice with PBS and suspending them in a culture medium with 10% FSB. Cell culture continued for 24 h, and samples were taken at 0, 6, 12, and 24 h post-treatment and processed. For flow cytometry analysis, 3 x 10⁵ cells were harvested by centrifugation, washed with PBS 1X, and fixed in 70% ethanol at -20 °C for 30 min. Then, they were washed once with PBS and suspended in a staining solution (69 μM propidium iodide, 38 mM citrate buffer pH 7.4, 0.2 mg.mL−1 RNase).
The DNA content of propidium iodide-stained cells was analyzed by flow cytometry using a BD Accuri™ C6 apparatus (BD Biosciences). Percentages of cells at different phases of the cell cycle were evaluated by Cyflogic software. The control was cells in the log growth phase without HU, and 20,000 events were analyzed per sample.
2.9. Ultrastructural Analysis
For scanning electron microscopy (SEM) analyses, cells were fixed for 1 h in 2.5% glutaraldehyde diluted in cacodylate buffer (0.1 M and pH 7.2). They were then adhered to coverslips, pre-coated with poly-L-lysine, and post-fixed for 1 h with 1% osmium tetroxide diluted in cacodylate buffer. Samples were dehydrated in a graded ethanol series (50%, 70%, 90%, and two exchanges of 100% ethanol for 10 min each step), and critical-point dried using CO2. Specimens were coated with a 5-nm layer of platinum and then visualized in an EVO 10 and ZEISS FIB-SEM AURIGA 40 scanning electron microscope at the multiuser unit of the National Center for Structural Biology and Bioimaging (CENABIO) at UFRJ. Cell lengths were measured in the SEM images using the AxioVision4 program.
For Transmission electron microscopy (TEM), parasites were washed twice in PBS and fixed in 2.5%
w/
v glutaraldehyde in 0.1 M cacodylate buffer at pH 7.2 for 1 h. Then, cells were washed in 0.1 M cacodylate buffer (pH 7.2) and post-fixed for 1 h using an osmium-thiocarbohydrazide-osmium (OTO) protocol [
18,
43]. After post-fixation, samples were washed in water, dehydrated in a series of increasing acetone concentrations, and embedded in epoxy resin. Ultrathin sections were obtained using an Ultracut Reichert Ultramicrotome and mounted on 400-mesh copper grids. Samples were stained with uranyl acetate and lead citrate and then analyzed using a Hitachi HT 7800 electron microscope operating at 100 kV at the CENABIO multiuser unit at UFRJ.
For negative staining, cells were harvested by centrifugation, adhered to formvar-coated grids, and extracted in 1% v/v NP-40 in PEME buffer (100 mM PIPES, 1 mM MgSO4, 0.1 mM EDTA and 2 mM EGTA, pH 6.9) for 5 min. They were then fixed in 2.5% (v/v) glutaraldehyde in PEME for 10 min as described previously (Vidal et al., 2016). Grids were negatively stained with 0.7% (v/v) aurothioglucose in water and observed in a Hitachi HT 7800 electron microscope operating at 100 kV at the CENABIO multiuser unit at UFRJ.
2.10. Growth Curve
To determine the growth rates of the cell lines, 5 x 10⁶ cells/mL (in the logarithmic phase) were seeded in 5 mL of LIT medium with 10% FBS and maintained at 28 °C for 7 days. The parasites were counted daily in a Neubauer chamber.
2.11. Morphometric and Statistical Analyses
Morphometric analyses were conducted using SEM images and then processed using the ImageJ program (National Institutes of Health, Bethesda, MD). Statistical analyses were carried out using GraphPad Prism 6 software (GraphPad Software). P-values less than 0.05 were considered statistically significant. All figures were prepared in Affinity Designer 2 software.
2.12. Genes IDs
Orthologous and paralogous genes related to TcGP72 deposited in TritrypDB: Angomonas deanei strain Cavalho ATCC PRA-265 (ID: ADEAN_001018200 - hypothetical protein, conserved), Crithidia fasciculata strain Cf-Cl (ID: CFAC1_040014300.1 - flagellar glycoprotein-like protein), Leishmania amazonensis MHOM/BR/71973/M2269 (ID: LAMA_000162700.1 - hypothetical protein, conserved), Leishmania braziliensis MHOM/BR/75/M2904 (ID: LbrM.10.0770 - flagellum adhesion protein 1), Leishmania donovani CL-SL (ID: LdCL_100013600 - flagellar glycoprotein-like protein), Leishmania infantum JPCM5 (ID: LINF_100013100 - flagellar glycoprotein-like protein), Leishmania major strain Friedlin (ID: LmjF.10.0630 - flagellum adhesion protein 1), Trypanosoma brucei EATRO1125 (IDs: Tb1125.8.4010 - flagellum adhesion protein 1, Tb1125.8.4060 - flagellum adhesion protein 2 and Tb1125.8.4110 - flagellum adhesion protein 3), Trypanosoma evansi strain STIB 805 (ID: TevSTIB805.8.4130 - flagellum-adhesion glycoprotein), Trypanosoma grayi ANR4 (DQ04_03901040 - flagellum-adhesion glycoprotein) and Trypanosoma vivax Y486 (TvY486_0803430 - flagellum adhesion protein 1).
Genes related to TcFLA-1BP: Angomonas deanei strain Cavalho ATCC PRA-265 (ID: ADEAN_001018300 - hypothetical protein, conserved), Crithidia fasciculata strain Cf-Cl (ID: CFAC1_040014200.1 - hypothetical protein, conserved), Leishmania amazonensis MHOM/BR/71973/M2269 (ID: LAMA_000162600.1 - hypothetical protein, conserved), Leishmania braziliensis MHOM/BR/75/M2904 (ID: LbrM.10.0760 - FLA1-binding protein), Leishmania donovani CL-SL (ID: LdCL_100013500 - LdCL_100013500), Leishmania infantum JPCM5 (ID: LINF_100013000 - hypothetical protein - conserved), Leishmania major strain Friedlin (ID: LmjF.10.0620 - FLA1-binding protein), Trypanosoma brucei EATRO1125 (IDs: Tb1125.8.4100 - FLA1-binding protein), Trypanosoma evansi strain STIB 805 (ID: TevSTIB805.5.5150 - hypothetical protein, conserved), Trypanosoma grayi ANR4 (DQ04_03901050 - hypothetical protein) and Trypanosoma vivax Y486 (TvY486_0803420 - FLA1-binding protein).
4. Discussion
To better understand the biology of
T. cruzi and gather insights for the prevention and treatment of Chagas disease, there is a growing focus on investigating its adaptability mechanisms. The investigation of
T. cruzi’s adaptability mechanisms is increasing to understand its biology and generate information for the prevention and treatment of Chagas disease. The various developmental stages of the parasite along its life cycle are designated based on the relative position of structures such as the nucleus, the kinetoplast, the flagellum’s emergence, and its association with the cell body. It is now clear that these morphological changes occur due to modification in the three-dimensional arrangement of the subpellicular microtubules [
3,
7,
8,
46].
The subpellicular microtubules maintain growth polarization towards the posterior end of the cell, and the other structures are rearranged according to the phase of the cycle [
8,
46,
47].
T. cruzi has three basic stages (epimastigotes, TCTs, and amastigotes). In addition, intermediate stages have been recently identified [
48]. The epimastigote forms are characterized by a long flagellum that emerges from the anterior portion and is attached to the cell body with a small free portion. It presents a rod-shaped kinetoplast, followed by a rounded nucleus. TCTs have a long flagellum emerging from the anterior region that is also attached to the cell body with a free portion, followed by a rounded posterior kinetoplast and an elongated nucleus. Amastigote forms exhibit a shortened anterior flagellar structure, rod-shaped kinetoplast, and rounded nucleus [
3,
7,
49].
In all forms of the parasite, the flagellum that emerges from the cell is attached to the cell body by either a long area (epimastigotes or TCTs) or short area (amastigotes). The flagellum/cell-body connection is established via the FAZ, an adhesive network composed of a set of structures that extends from the flagellar domain and interacts with the cytoskeleton. The FAZ is like a zipper with a portion originating from the skeleton and flagellar membrane and enters the cell body membrane. It is fixed in the microtubule quartet (MtQ) antiparallel to the subpellicular microtubules. This structure is composed of a network of interconnected proteins, forming an electron-dense adherent network. The FAZ has been previously described as a “cell ruler” of morphology because it plays a crucial role in regulating cell size, organelle position, cell division, differentiation, and pathogenesis [
23,
24,
26].
In this work, we characterized the structural and molecular organization of
T. cruzi’s FAZ. Searching for the proteins identified in the FAZ of
T. brucei, we observed that
T. cruzi presents fewer FAZ proteins. Of the 34 proteins previously described in
T. brucei [
25], we identified only 24 orthologues in
T. cruzi.
T. brucei presents isoforms not identified in
T. cruzi. It is possible that the higher number of FAZ proteins in
T. brucei may be evolutionarily advantageous for parasites evading the host immune system since it lives in the bloodstream and the extracellular portion of some tissues. In
T. brucei, it has been proposed that the FAZ plays a role in pathogenesis. The attachment of the flagellum to the parasite body allows host immune system factors deposited in this region to be directed to the flagellar pocket, where they can be ingested by endocytosis, degraded, and reabsorbed by the parasite [
50].
We decided to focus on two proteins. First, the previously characterized TcGP72 protein presents some open gaps regarding its localization in the FAZ and internal ultrastructural changes during the cell cycle. Second, the FLA-1BP is a possible ligand of GP72, which was already described in T. brucei. To characterize these proteins, we used the CRISPR/Cas9 system to generate mutants with endogenous genes labeled at the C-terminus with a fluorescent protein and knockout parasites for both proteins. By evaluating the sequences of the proteins in the different trypanosomatids, we observed conservation in the gene regions in which the proteins were inserted. The gene cluster comprises endonuclease G, FLA-1BP, FLA-1, and zinc finger protein. This clustering is observed in T. cruzi, T. brucei, Crithidia fasciculata, Leishmania spp, T. gray, T. vivax, and T. evansi, thus being a great indication of the relevance of this region in the genome of various trypanosomatids.
TcGP72 and TcFLA-1BP exhibit a similarity of ~45% with the other trypanosome species, having a higher divergence (~25%) with Leishmania spp., C. fasciculata, and Angomonas deanei. Apparently, in T. cruzi’s different published genomes, it is impossible to find isoforms of TcGP72 as described in T. brucei (TbFLA-1, TbFLA-2, and TbFLA-3) (LaCount et al., 2002; Sun et al., 2013). Interestingly, the isoforms in the T. brucei genome also exhibit the same clustering as FLA-1. By analyzing the domains present in each protein, we noticed that in T. cruzi, TcGP72 presents a different organization from that observed in all other trypanosomatids.
In
T. brucei, both TcFLA-1 and TcFLA-1BP proteins show similar organization with the short intracellular domain (N-terminus), a transmembrane segment, a long extracellular domain containing NHL and transmembrane repeats followed by an intracellular segment (C-terminus), with 16 amino acids (C16) for TbFLA-1 and 40 amino acids (C40) for TbFLA-1BP [
27]. We observed that TcGP72 has a different arrangement and does not contain the second transmembrane domain at the C-terminus. Among all trypanosomatids evaluated, T. cruzi is the only one that presents this arrangement. TcFLA-1BP has the same arrangement as
T. brucei but with a slightly longer C-terminus segment with 45 amino acids. In the model proposed for
T. brucei, the C-terminus segment is important for anchoring the FAZ in the flagellum and cell body [
27].
In mutants with the proteins truncated at the C-terminus, we observed that TcGP72 was retained in the cytoplasm and probably in the endoplasmic reticulum. TcFLA-1BP showed a tagging in the cell membrane different from that proposed in
T. brucei in the flagellar membrane [
27]. This localization in the cell body was confirmed when we generated in the TcFLA-1BP-tagged mutant, the TcGP72 knockout, which showed detachment from the flagellum, and TcFLA-1BP::mNG remained bound to the parasite body. Our results show for the first time that in T. cruzi, this model is reversed. Localization of TcGP72 in the flagellar domain of FAZ was also reported previously using small labels such as HA, Ty, and Flag [
15,
29,
44,
51]
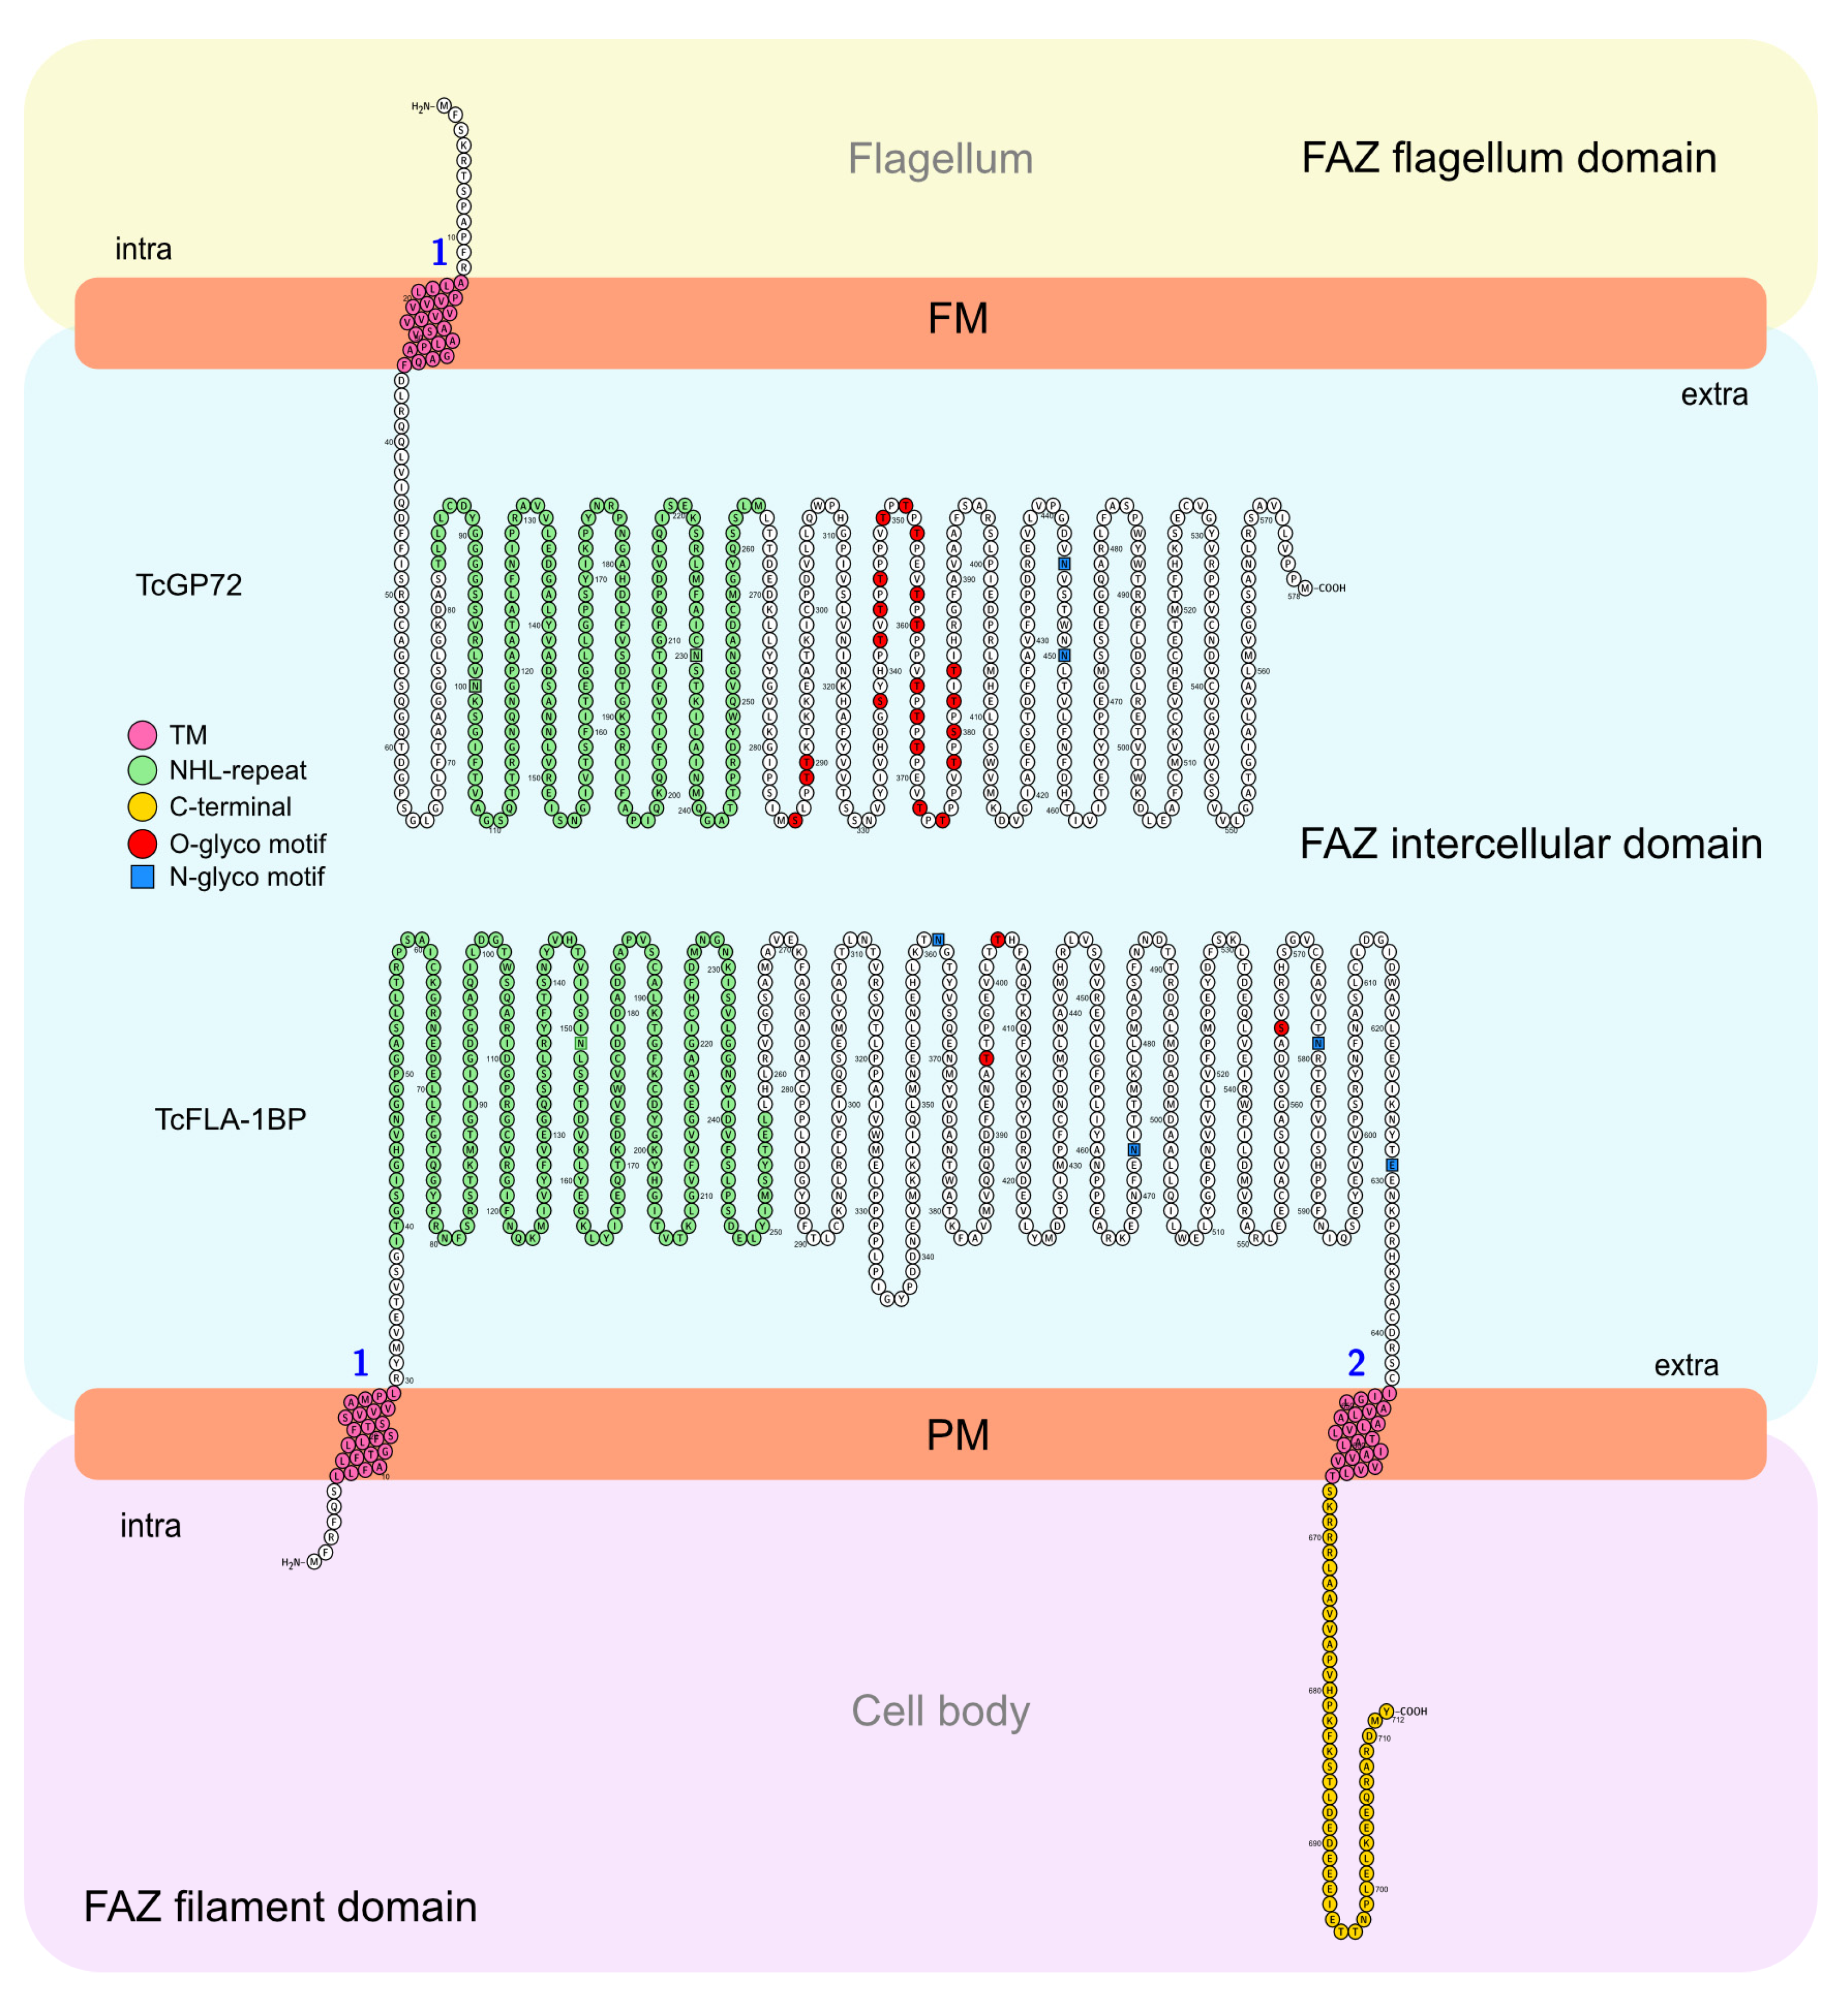
In the model that we propose for T. cruzi (
Figure 10), TcGP72 crosses the flagellar membrane, with the short intracellular domain facing the flagellum lumen, where it is probably attached. The extracellular domain faces the intermembrane region. On the cell body side, TcFLA-1BP is anchored by the intracellular domains at the N- and C-terminus, and the extracellular domain faces the intercellular domain of FAZ. This allows the proteins to potentially interact with the NHL domains.
The increase in molecular weight bands of the labeled TcGP72::mNG and TcFLA-1BP::mNG proteins can be explained by the addition of glycoconjugates to proteins. It has previously been demonstrated in T. cruzi that TcGP72 is a highly glycosylated protein. Our findings support previously published data for TcGP72 and indicate that TcFLA-1BP can also undergo post-translational modifications [
52,
53]. In our analyses in silico, we identified 21 possible sites of O-glycosylation and 2 sites of N-glycosylation for TcGP72 and 3 O-glycosylation sites and 4 N-glycosylation for TcFLA-1BP.
An important finding in this work was the morphological alteration similar to a knockout in the TcGP72::mNG parasite. The TcGP72::mNG protein retained in cytoplasmic structures generated a dominant negative resulting in an alteration in protein addressing for the flagellar membrane and leading to detachment of the flagellum as well as TcGP72 knockout. These data demonstrate the necessity of correct folding and the importance of the C-terminus for addressing the protein to the flagellar membrane. The expression of TcFLA-1BP::mNG was observed throughout the FAZ in all cell cycle forms of T. cruzi and was lower in amastigotes due to the short FAZ.
Deletion of TcGP72 caused flagellum detachment and the disappearance of the FAZ connections, consistent with previous reports on
T. cruzi [
15,
29,
51]. Morphologically, the parasite showed shortening of the cell body, with a variety of flagellar sizes, including parasites with a long flagellum (12 and 15 µM) and short flagella (1 and 4 µM) compared to the control. However, in the TcGP72 knockout parasites, the flagellum/cell-body ratio appeared scattered, resulting in a culture with a homogeneous morphology resembling promastigote forms of Leishmania.
In the TcFLA-1BP knockout parasite, we observed a heterogeneous population with fully or partially detached flagella. Most parasites showed a short flagellum, while the cell body size remained similar to the control parasite. In parasite knockouts for TcFLA-1BP, we commonly found parasites with a reduced FAZ exhibiting lateral attachment to the parasite body. In
T. brucei, RNAi of FLA-1BP causes complete flagellum detachment and a reduction in the length of the FAZ and cell body, resulting in epimastigote-like parasites [
27].
Labeling with L3B2 (anti-FAZ-1) revealed an accumulation of labeling near the flagellar pocket for all forms in the TcGP72 knockout. In epimastigotes and TCTs, this finding was more evident, and the same accumulation was observed when tagging for flagellar proteins as Mab2F6 antibody. The knockout for TcFLA-1BP showed a milder accumulation of these proteins, probably due to the partial detachment of the FAZ structure.
FAZ and flagellum assembly dynamics are polarized and require initial nucleation, where proteins directed to the region near the flagellar pocket are anchored to the membrane and are concomitantly extended with flagellum assembly [
54,
55]. In the model proposed for
T. brucei, the FAZ proteins are carried in vesicles that accumulate at the proximal end of the FAZ near the flagellar pocket, where they insert into the membrane of the flagellum and cell body. As subunits are added, they cause displacement of the other inserted proteins, leading to extension of the structure along the flagellum [
25,
55].
We observed that nucleation of proteins to the proximal region of the flagellar pocket continues even in the absence of the FAZ in both knockouts. However, targeting is mainly affected with the TcGP72 knockout, which presents protein accumulation in the proximal region, large protrusions, and flagellar projections. We observed that even with the detached flagellum, the TcFLA-1BP::mNGΔGP72 parasite is able to direct the TcFLA-1BP::mNG protein to the FAZ region in the cell body. Our findings suggest that even without the FAZ connections, the flagellum is assembled, but its extent is altered, probably due to impaired intraflagellar transport (IFT) along the axoneme.
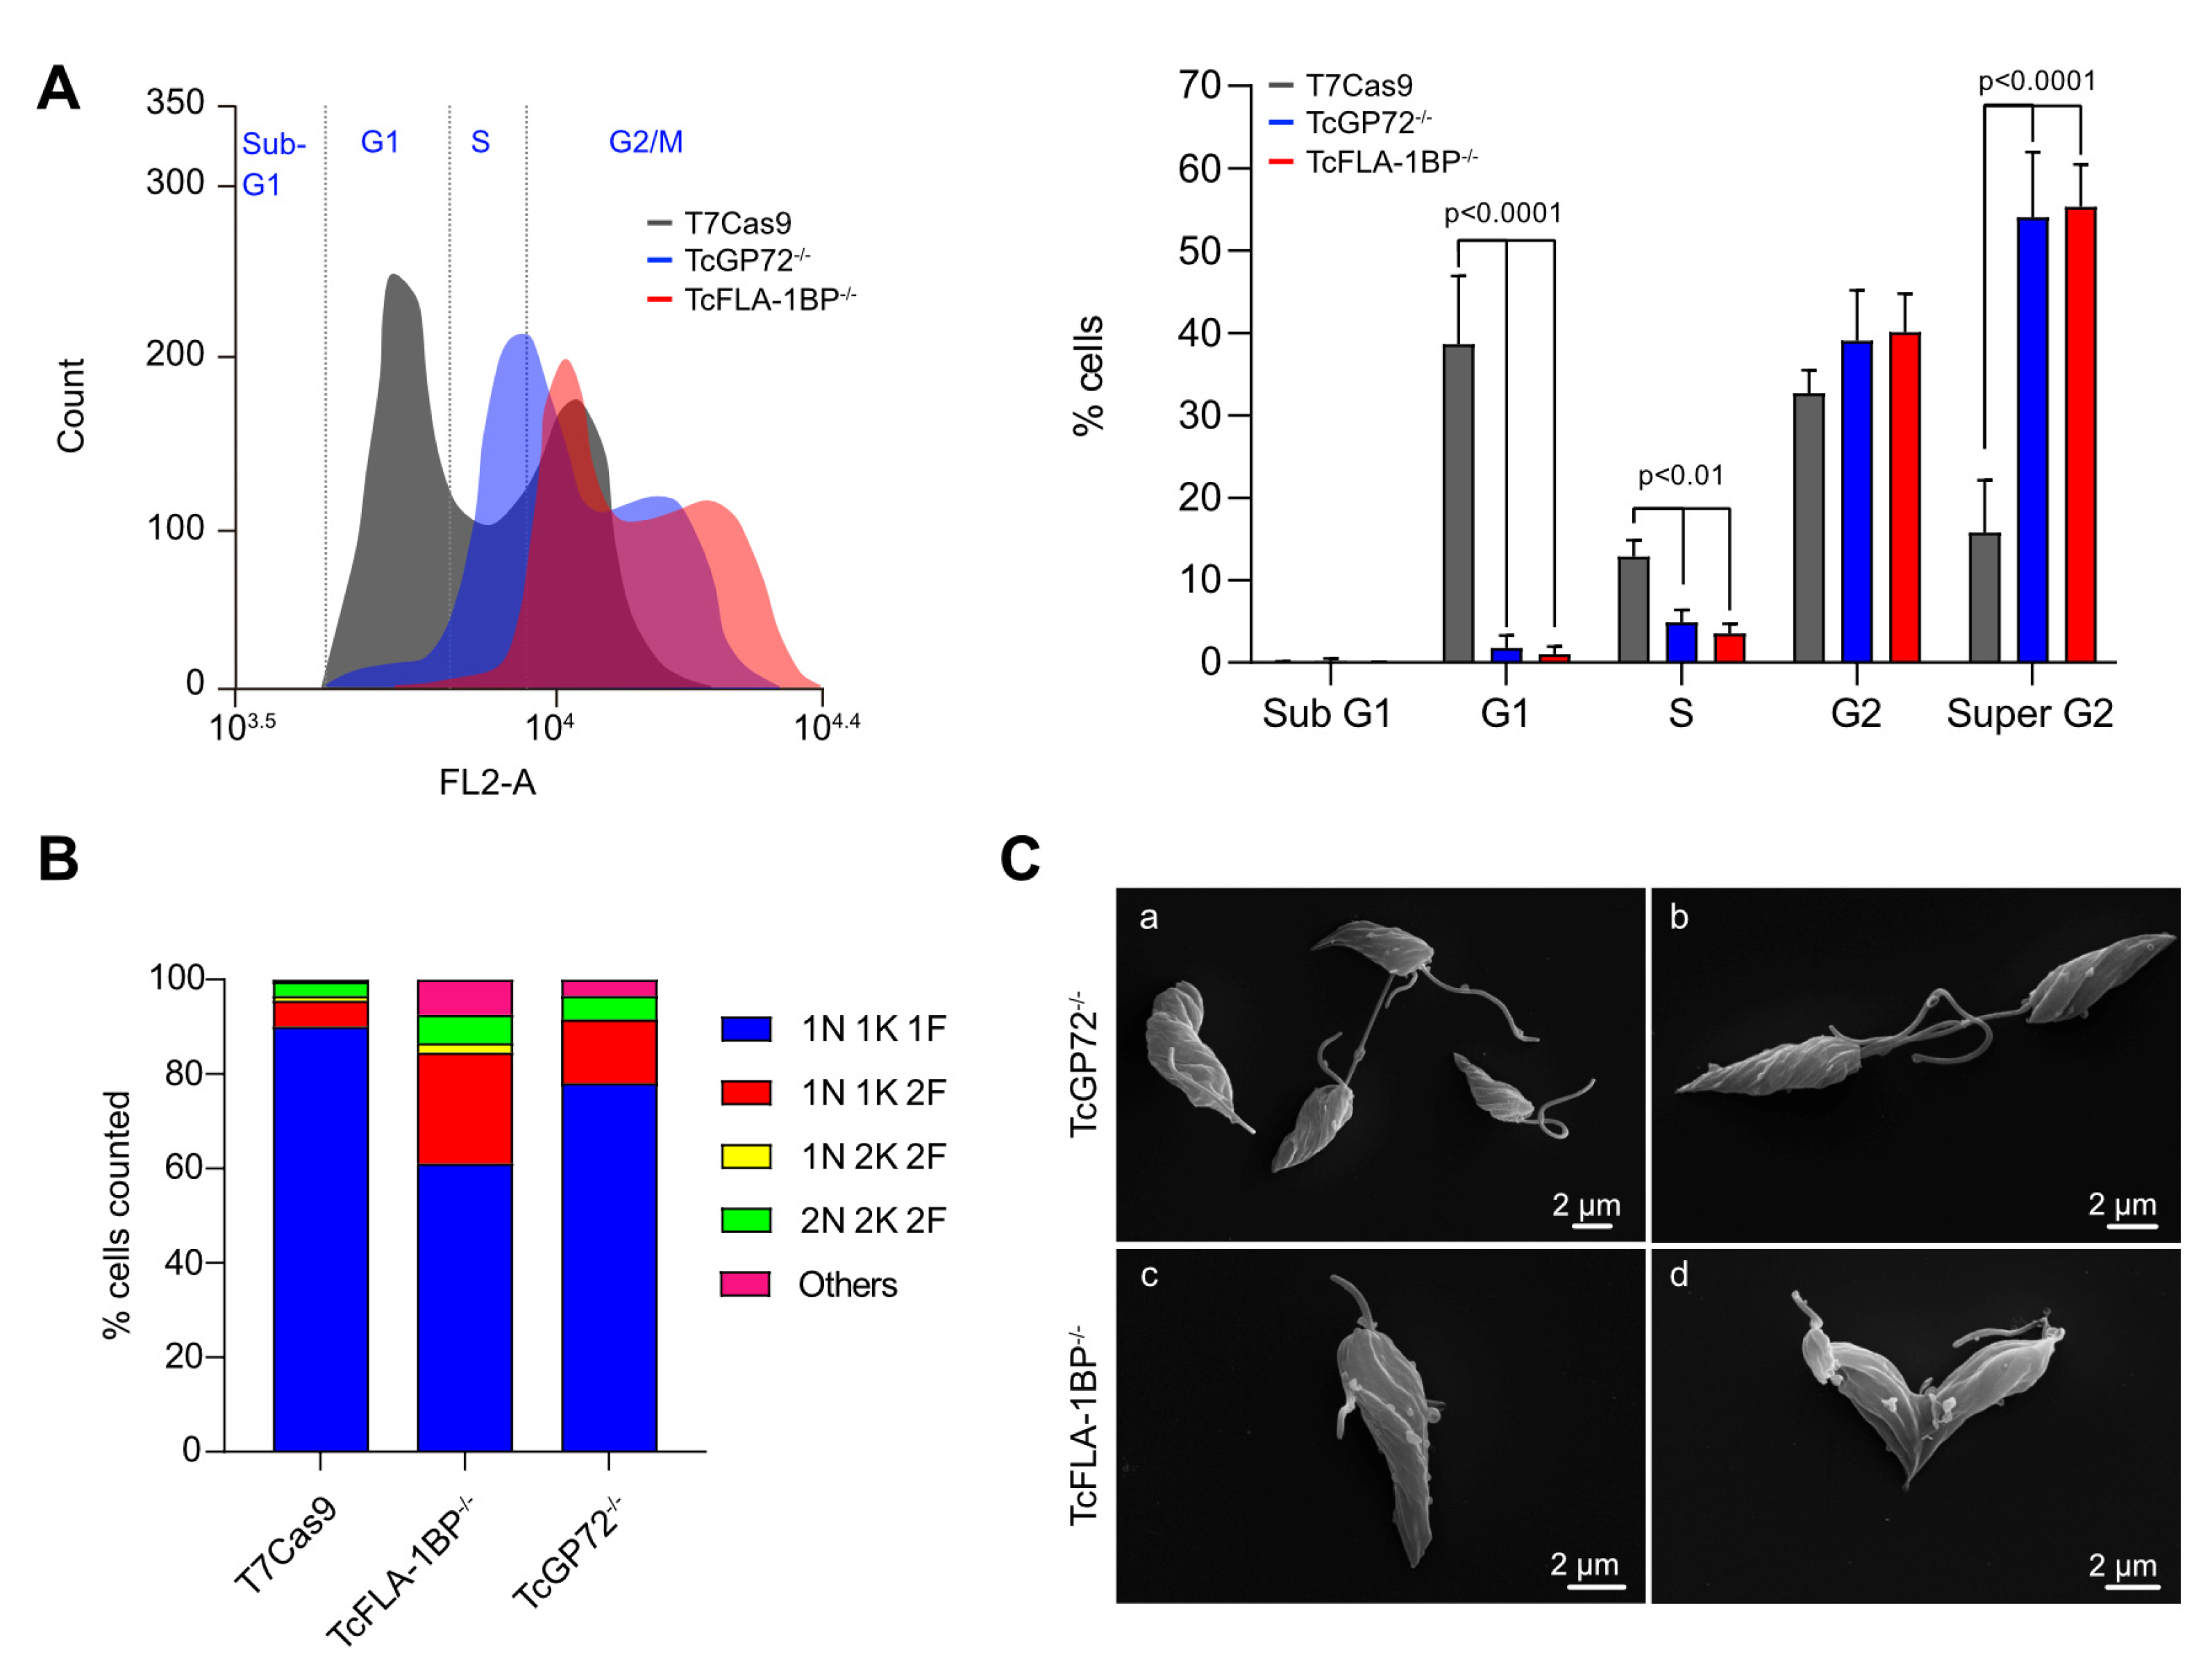
Cells depleted of TcGP72 and TcFLA-1BP showed failure in proper cell cycle progression. In epimastigotes, knockout parasites showed growth retardation with generation time approximately 2 times smaller than the control’s time. When evaluating DNA replication and cytokinesis, we observed drastic alterations with knockout parasites presenting a variable number of nuclei, kinetoplasts, and flagella compared to controls. This asymmetric division of the knockout parasites impaired the standard cell cycle progression because when evaluating the parasites by flow cytometry, we identified that the absence of both proteins results in parasite accumulation in the G2/M phase of the cell cycle, with characteristics of parasites undergoing cytokinesis.
Cell cycle delay was observed even after HU synchronization. The altered division was also observed by light microscopy and SEM. In
T. brucei, the deletion of most of the FAZ component proteins causes altered cytokinesis, and long culture times cause cell death. Most studies on
T. brucei are performed in an inducible editing system [
28,
31,
42]. In our analyses, we observed that TcGP72 and TcFLA-1BP knockouts remained viable even with a reduced growth rate and impaired cytokinesis, as previously described [
29,
52].
In trypanosomatids, it has been described that changes in the three-dimensional arrangement of the cytoskeleton provide for the repositioning of intracellular structures of the parasites [
8,
25,
46]. The dynamics of formation and rearrangement of subpellicular and cytoplasmic microtubules allow for the correct cell division of the cell body and other organelles, thus being directly linked to the morphological changes between forms [
46]. The FAZ in trypanosomes creates a seam between the quartet of specialized microtubules with the surrounding subpellicular microtubules, thus directing cell growth [
8,
45,
47].
The deletion of the TcGP72 and TcFLA-1BP proteins resulted in morphological changes and alterations in the positioning of cytoplasmic structures (mainly the nucleus and kinetoplast). During metacyclogenesis, we could not identify the differentiation rates because we lost the reference of the anterior and posterior regions of the parasites. However, we noticed that in the MTs purified, there were parasites with elongated shapes, globular kinetoplasts, and elongated nuclei that showed a reaction against the GP82 antigen characteristic of MTs [
34].
We hypothesized that even without repositioning organelles, the parasite could remodel the cellular structures and membrane components characteristic of each form while maintaining differentiation. Somehow, subpellicular and cytoplasmic microtubules rearrange themselves to maintain an architecture that allows structural remodeling of structures and organelles such as the cytostome-cytopharinx complex, FAZ, nucleus, and kinetoplast.
Figure 1.
Bioinformatics analysis and domain organization of TcGP72 and TcFLA-1BP. (
A) Phylogenetic tree from protein sequences of trypanosomatids. Amino acid sequences were aligned using Clustal Omega (
https://www.ebi.ac.uk/Tools/msa/clustalo/), and the aligned sequences were used to generate a phylogenetic tree (SeaView 5.4). (
B) Diagram of the conserved domains found in TcGP72 and TcFLA-1BP orthologous to Trypanosoma brucei. TcGP72 contains a transmembrane domain (TM) at the N-terminus and an NHL-repeat in the extracellular domain. TcFLA-1BP is structured with a transmembrane domain (TM) at the N-terminus, followed by NHL-repeat-containing extracellular domain, TM, and a 45-amino-acid tail (C45) at the C-terminus. Numbers indicate the amino acid residues. Domain organization is shown for TcGP72 and FLA-1BP fused to c-Myc and mNeonGreen tags at the C-terminus (3xMyc::mNG::3xMyc) named TcGP72::mNG and TcFLA-1BP::mNG. Tb:
Trypanosoma brucei. Tc:
Trypanosoma cruzi. Tev:
Trypanosoma evansi. TvY486:
Trypanosoma vivax. DQO04:
Trypanosoma grayi. ADEAN:
Angomonas deanei. CFAC1:
Crithidia fasciculata. LbrM:
Leishmania braziliensis. LAMA:
Leishmania amazonensis. LINF:
Leishmania infantum. LdCL:
Leishmania donovani. LmjF:
Leishmania major strain.
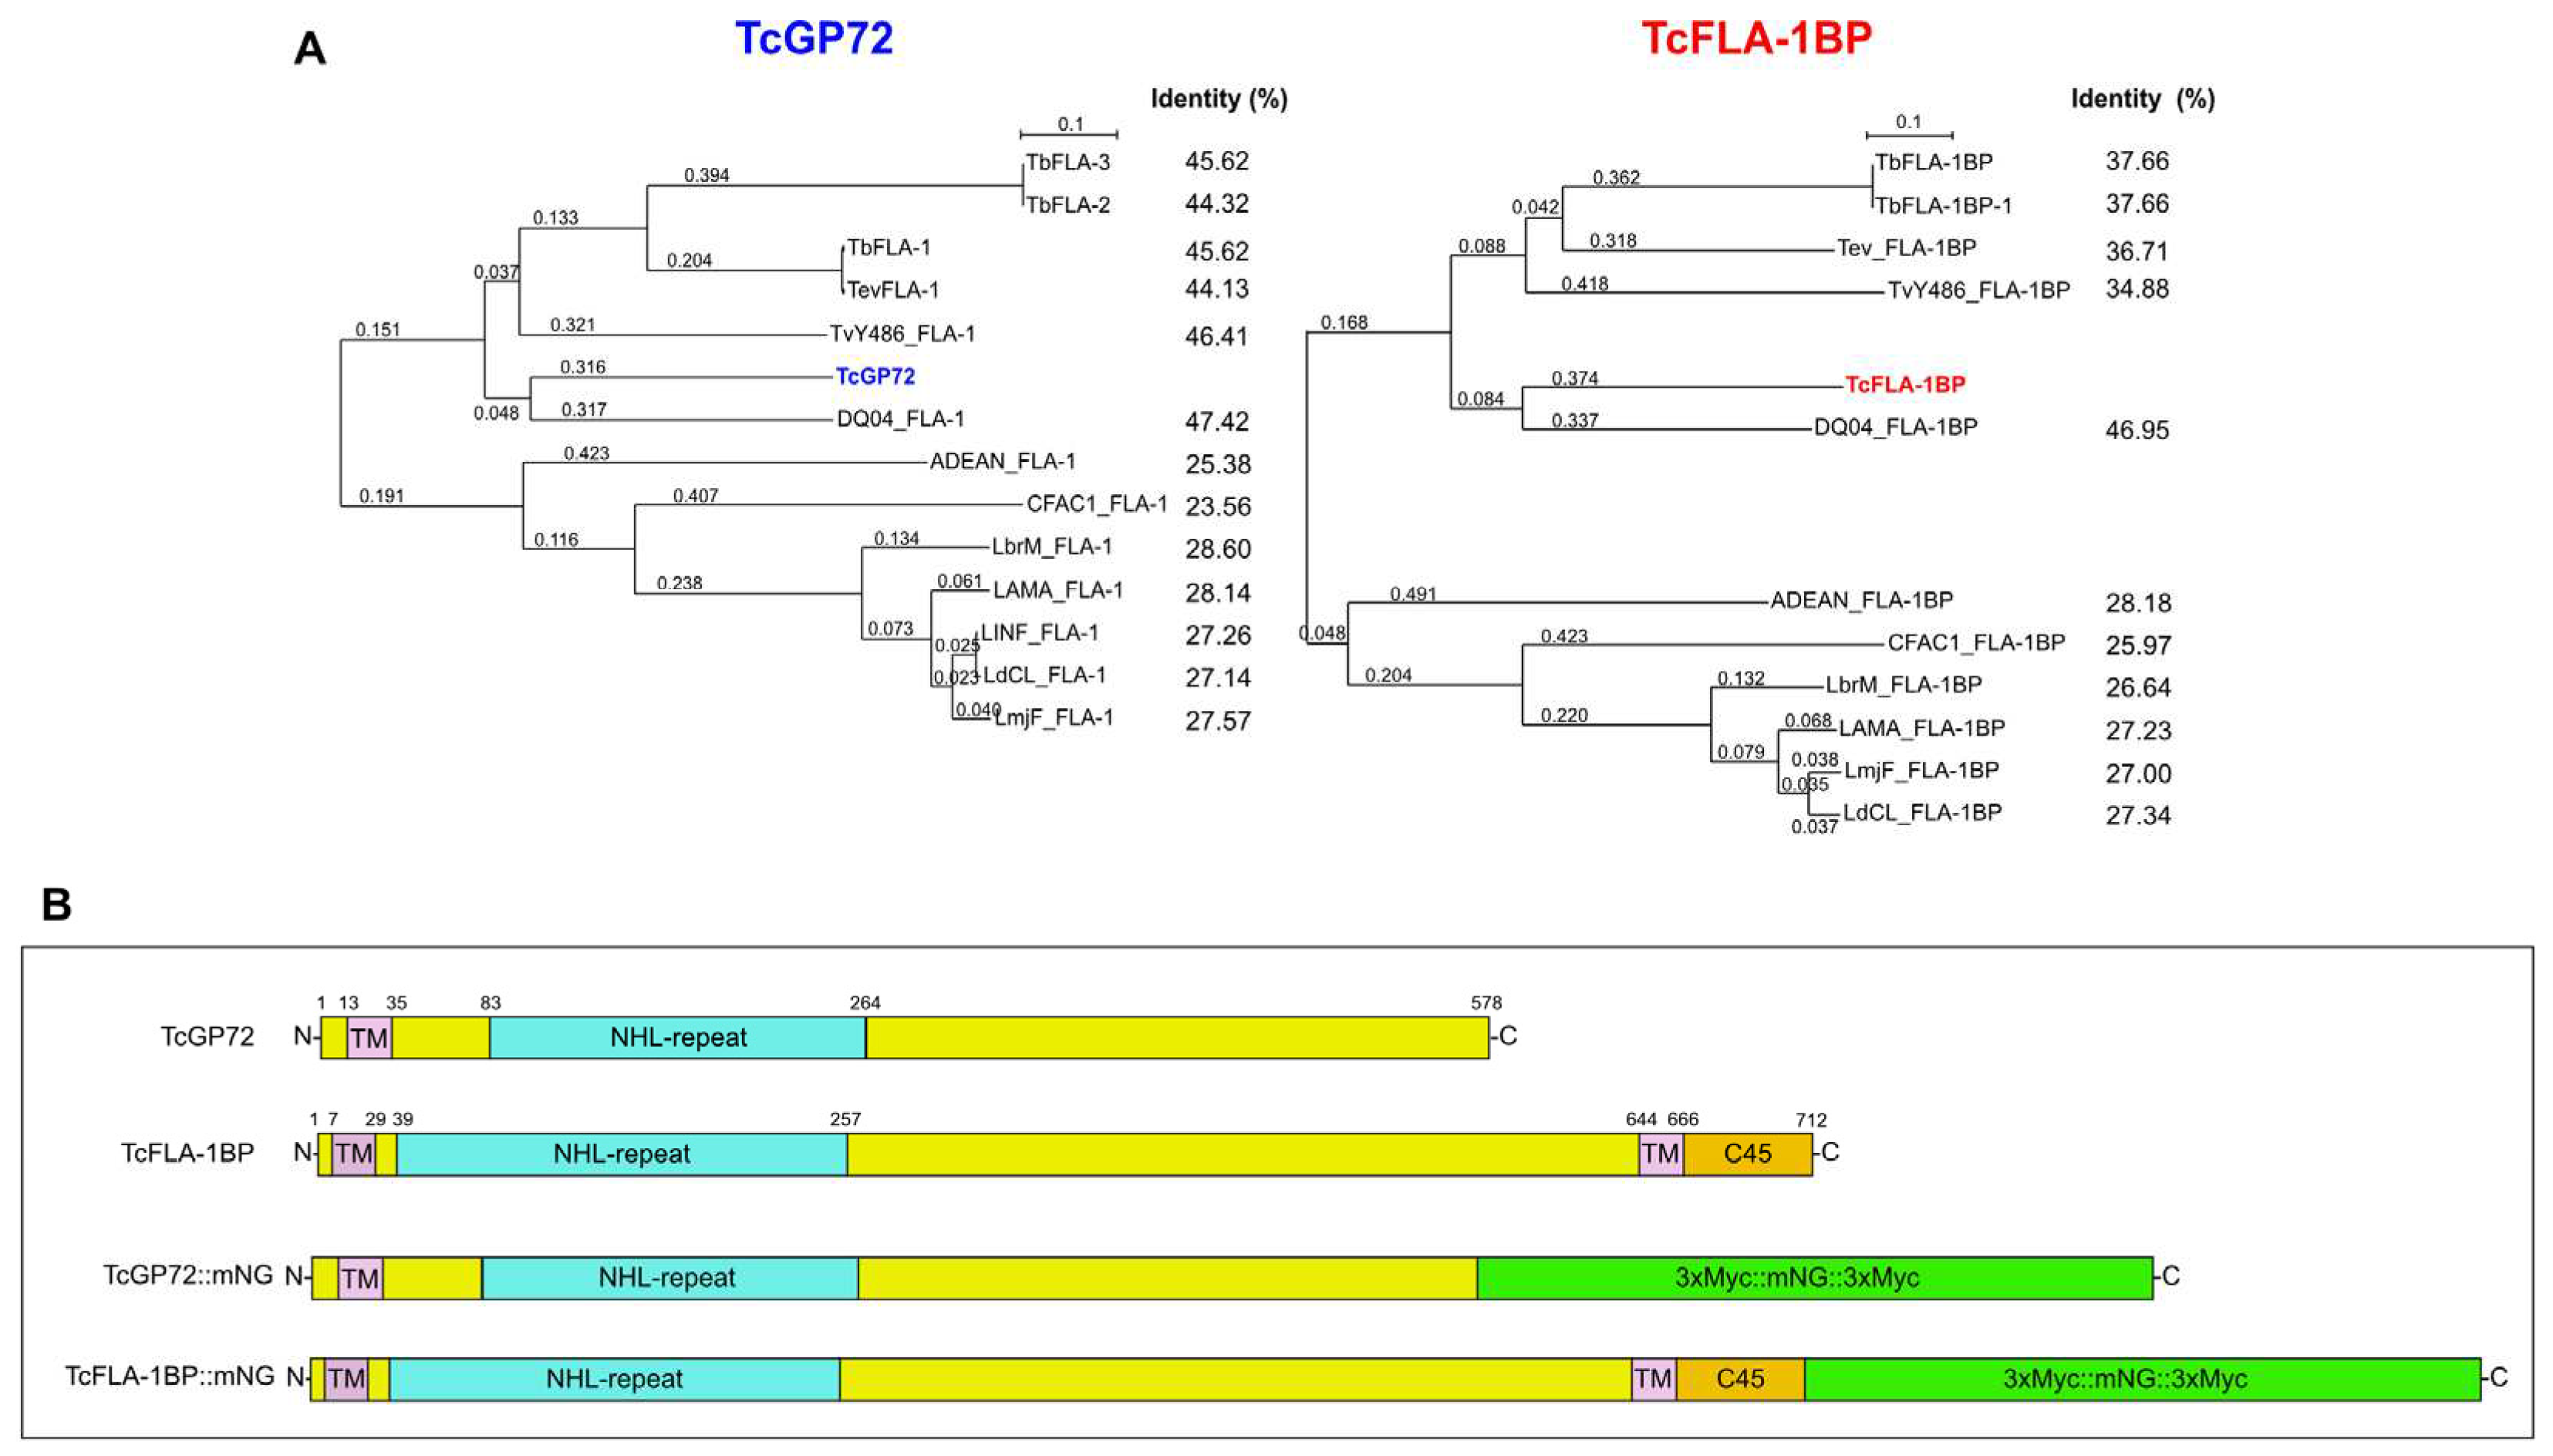
Figure 2.
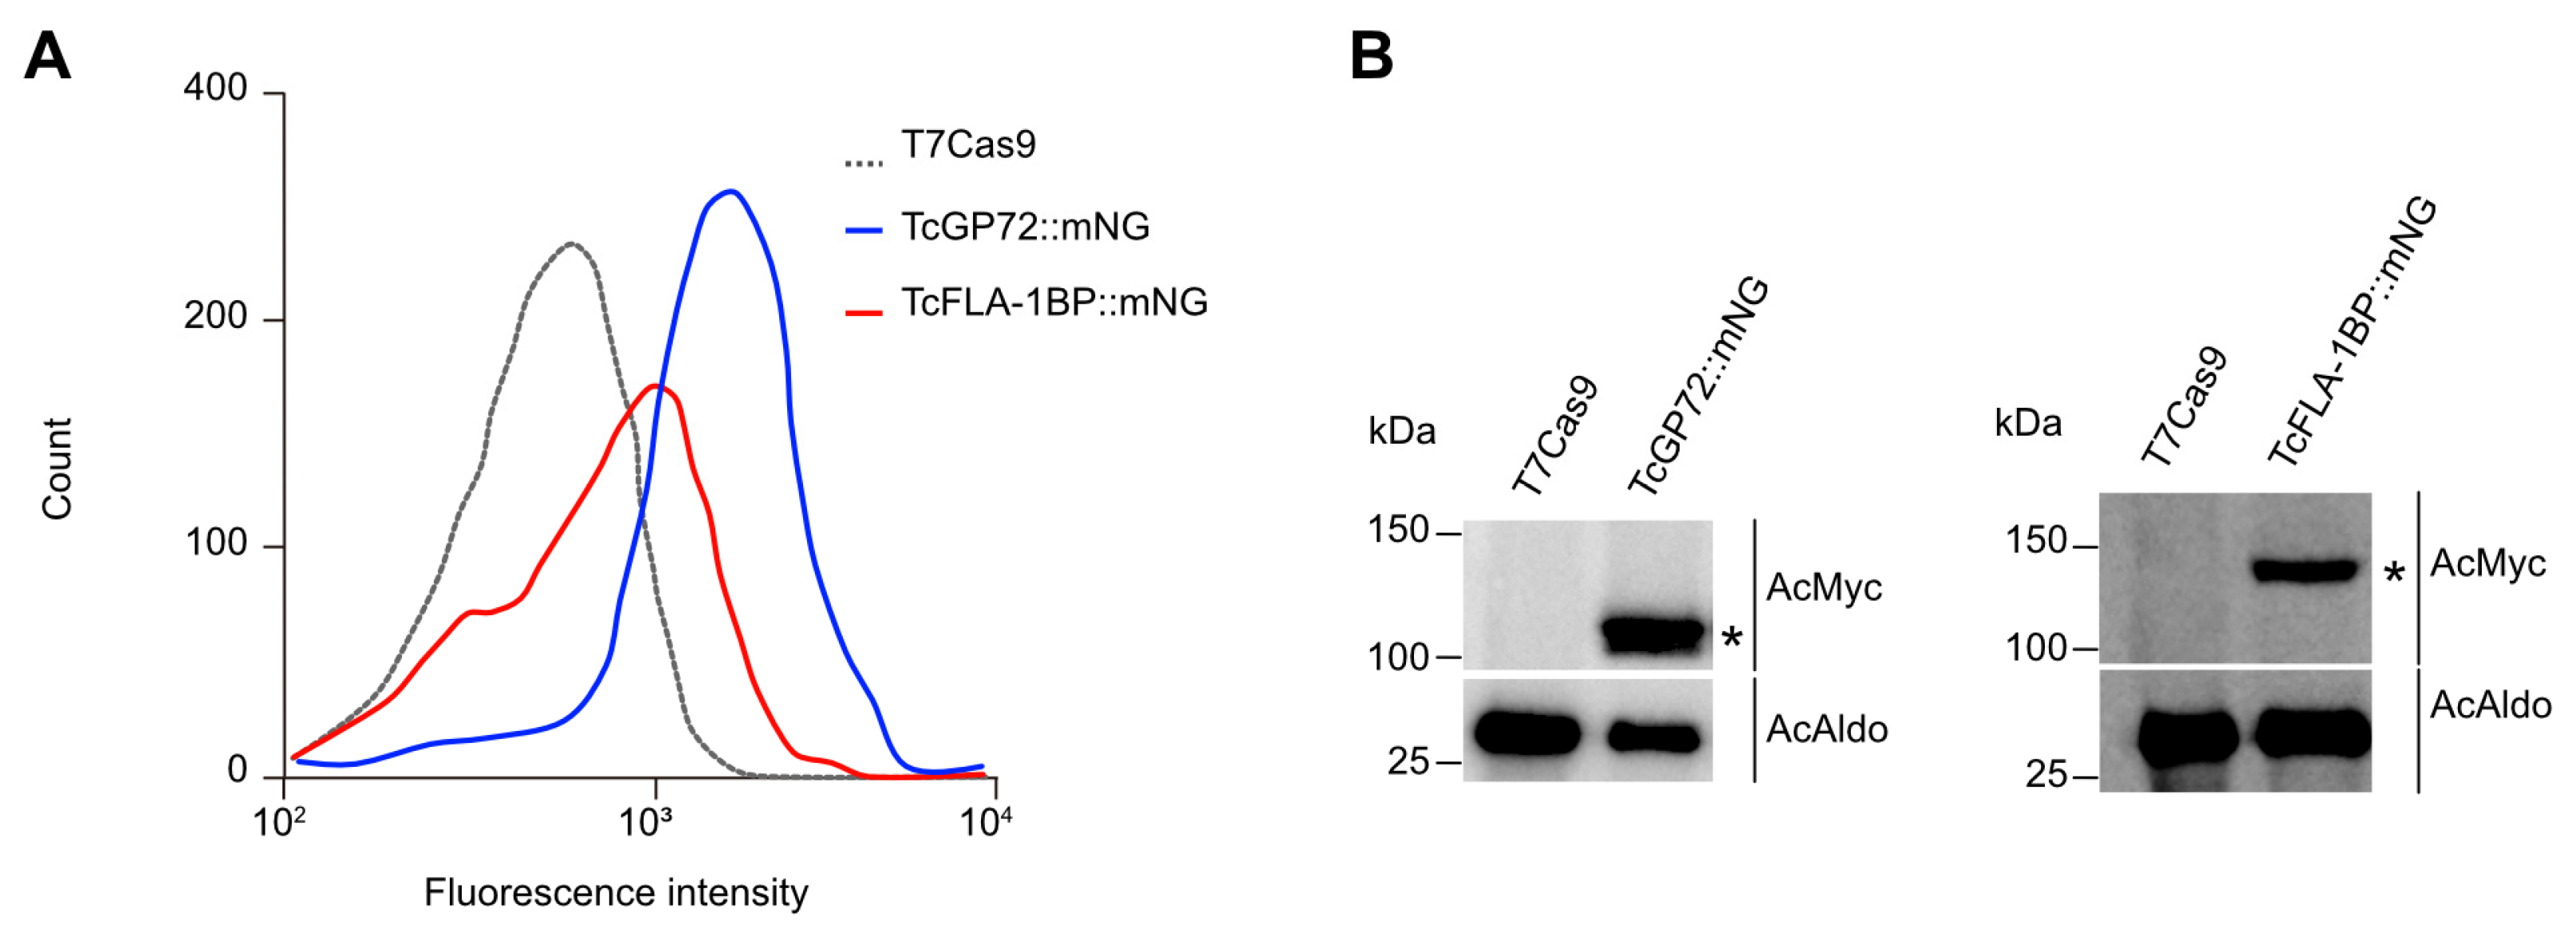
Analysis of fluorescent proteins expression. (A) Representative histograms showing the expression of fluorescent proteins in the mutant parasites. The peak with a black dashed line represents T7Cas9 lineage (control), and peaks with blue and red lines show TcGP72::mNG and TcFLA-1BP::mNG parasites, respectively. (B) Western blot analysis of fluorescent parasite (epimastigote) lysates expressing C-Myc and mNeonGreen fusion proteins (equivalent to 107 cells). Blots were probed with anti-Myc (AcMyc) antibodies and re-probed with anti-aldolase (AcAldo). kDa: molecular weight marker. The asterisk shows the tagged protein bands. TcGP72::mNG: 98.2 kDa. TcFLA-1BP::116 kDa. TcAldolase: 29.3 kDa.
Figure 3.
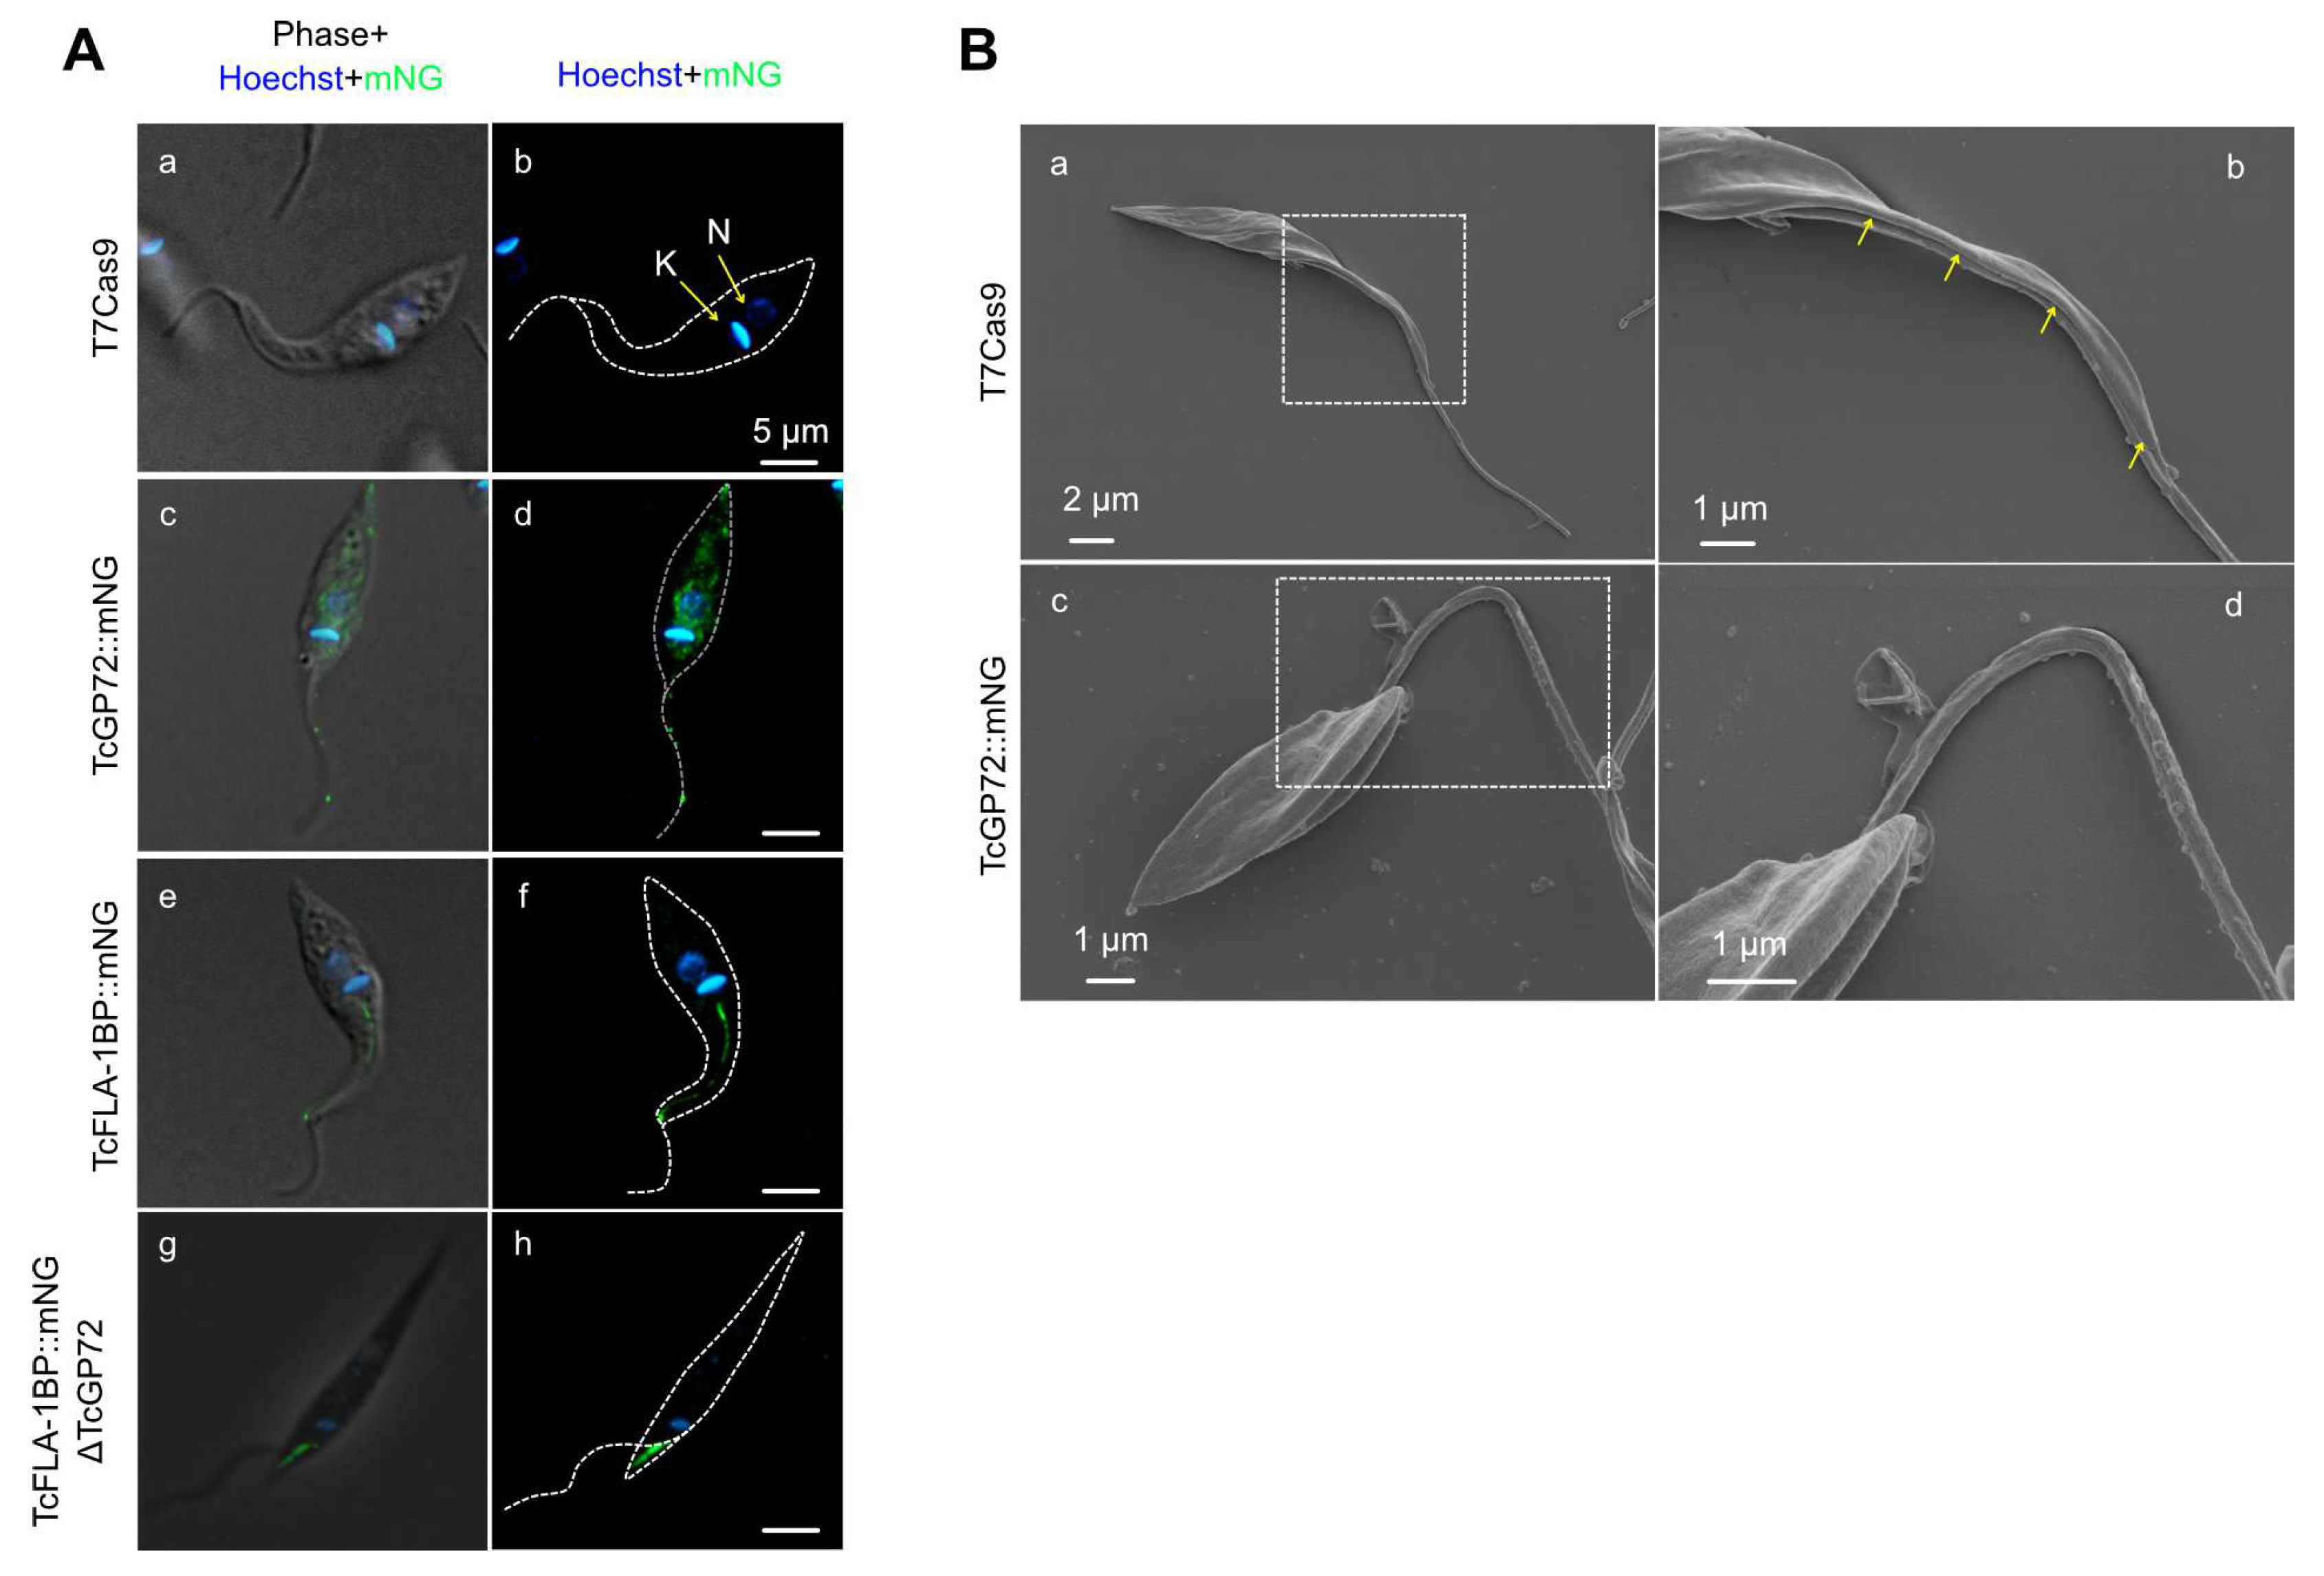
Localization of TcGP72::mNG and TcFLA-1BP::mNG proteins. (A) The fluorescent parasites generated by CRISPR/Cas9 were analyzed by fluorescence microscopy. Direct mNeonGreen fluorescence (green) reveals the cellular distribution of TcGP72::mNG (c,d) and TcFLA-1BP::mNG (e,f). TcGP72::mNG localized with distributed reticulated on the cell body and flagellum. In contrast, TcFLA-1BP::mNG was localized in just the FAZ. To confirm the FAZ domain localization of the TcFLA-1BP, we performed TcGP72 knockout in the TcFLA-1BP::mNG parasite (TcFLA-1BP::mNGΔGP72). TcFLA-1BP::mNGΔGP72 (g,h) parasites showed the detached flagellum and tagging exclusively on the cell body side along the FAZ. DAPI for DNA (blue). K: Kinetoplast, N: Nucleus. (B) Scanning electron microscopy shows TcGP72::mNG parasite (c,d) morphology with flagellum detachment in contrast to the T7Cas9 control parasite (a,b). The dotted region shows the magnified area, and the yellow arrows show the FAZ.
Figure 4.
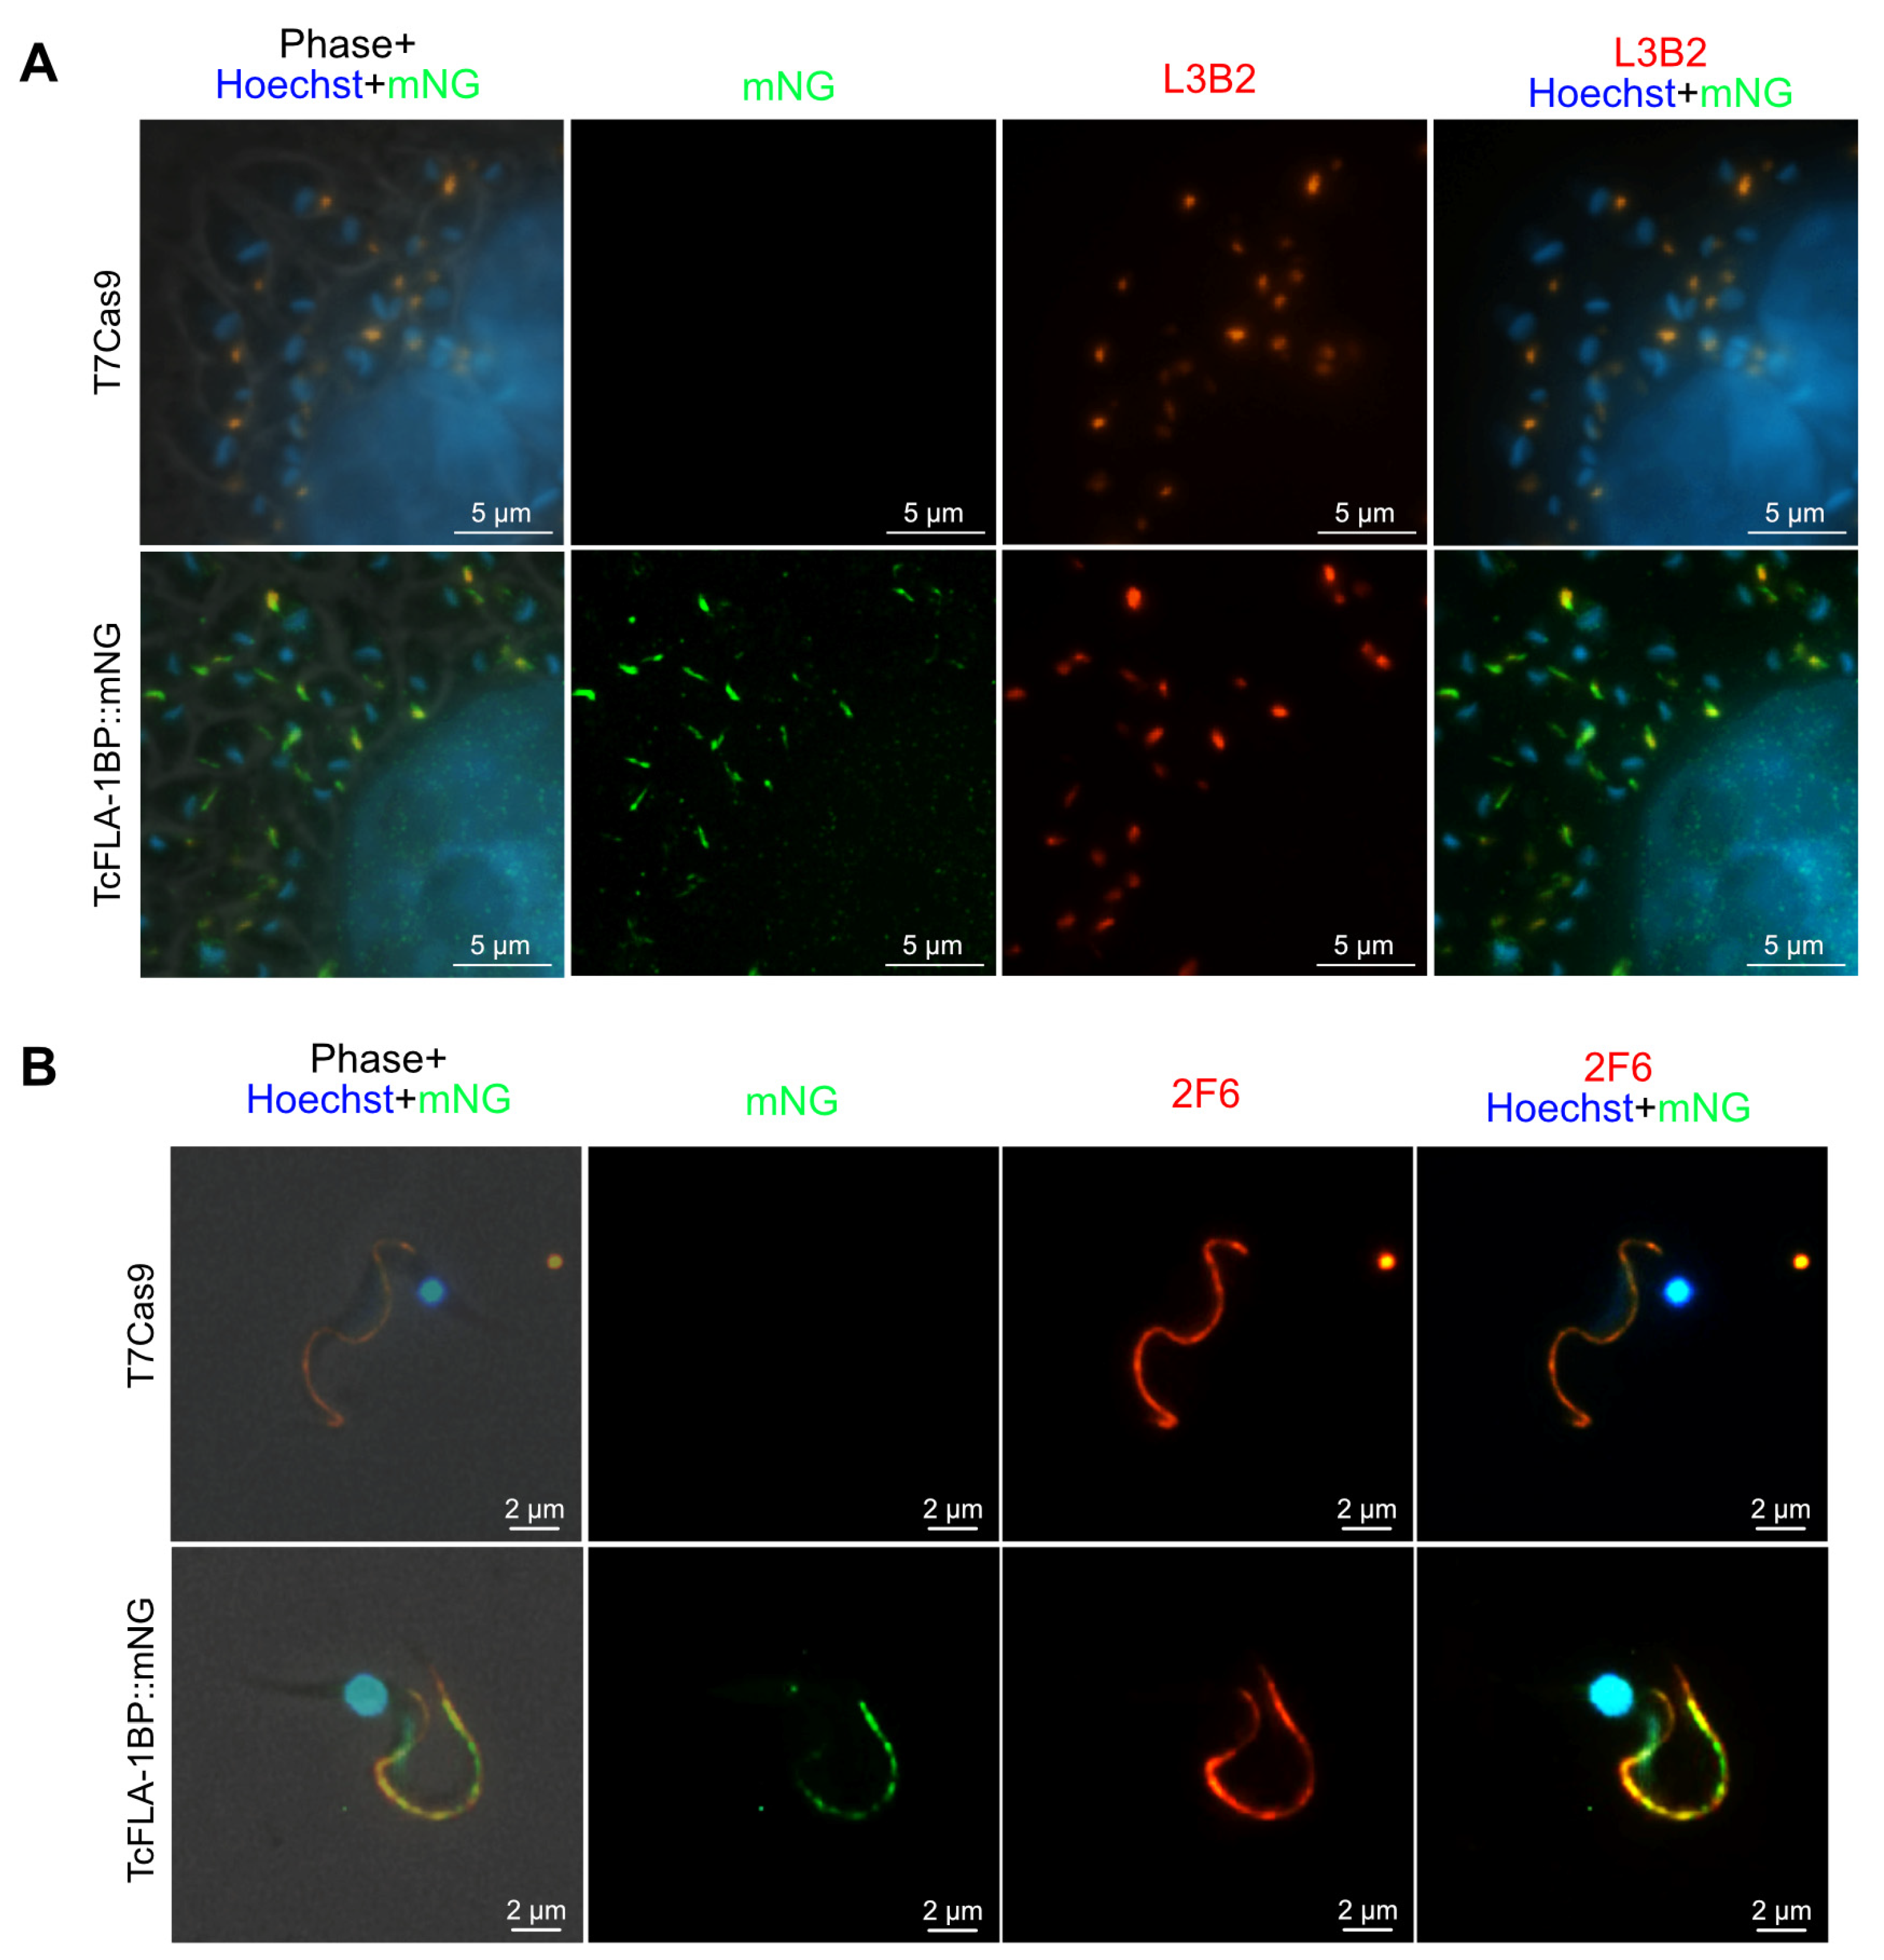
TcFLA-1BP targets the FAZ in amastigotes and trypomastigote (TCT) forms. (A) Fluorescence microscopy of TcFLA-1BP::mNG and T7Cas9 control in intracellular amastigotes (IAs) with FAZ labeled with anti-L3B2 (FAZ-1 T. brucei; red) and anti-mNG (mNeonGreen tag; green). (B) Localization in tissue culture-derived TCTs. Nuclei and kinetoplasts were stained with Hoechst (blue). Scale bars: 2 and 5 µm.
Figure 5.
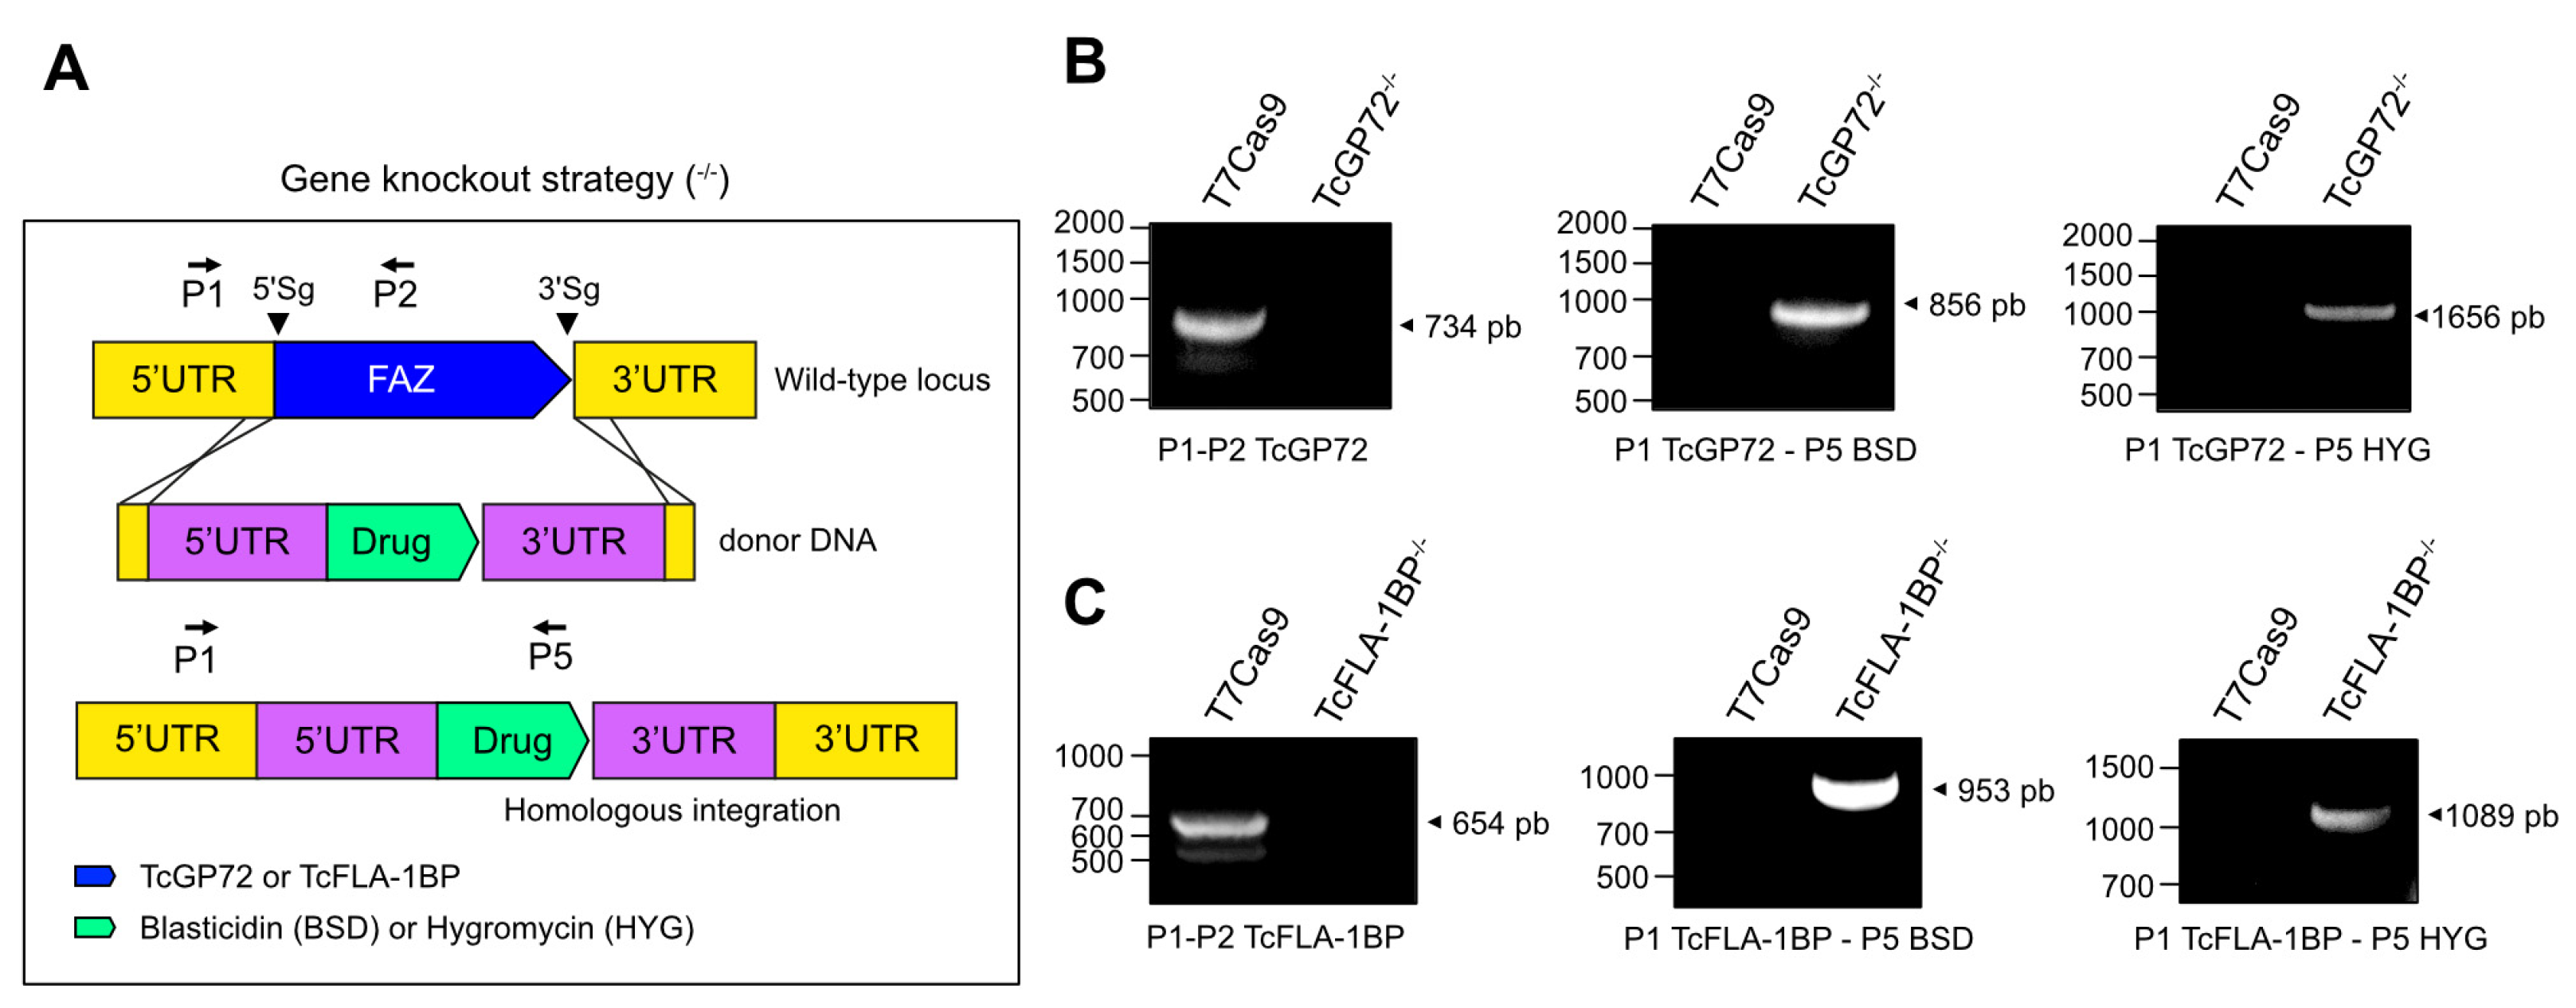
Depletion of TcGP72 and TcFLA-1BP. Illustration of gene knockout strategy (not to scale). (A) Diagram showing the TcGP72 and TcFLA-1BP locus and PCR primers (arrows) used to confirm the presence of the TcGP72 and TcFLA-1BP coding sequence (blue box) or the correct integration of the drug-resistance genes (green box). An arrowhead marks Cas9 cleavage sites. Yellow and purple boxes represent the untranslated regions (UTRs) of endogenous genes and donor DNA. (B,C) PCR products were visualized on agarose gel. T7Cas9, parental cell line; TcGP72-/-, double knockout parasite to TcGP72; TcGP72-/-, double knockout parasite to TcFLA-1BP. P1 (forward primer) anneals to the 5’ UTR of TcGP72 or TcFLA-1BP. P2 (reverse primer) anneals to the coding sequence of TcGP72 or TcFLA-1BP. P5 (reverse primer) anneals to the end of the resistance gene coding sequence (blasticidin or hygromicin).
Figure 6.
TcFLA-1BP and TcGP72 knockout in T. cruzi cause partial or total flagellum detachment and impairs assembly of the flagellum, morphogenesis, organelle positioning, and cell growth. (A) Fluorescence microscopy of TcGP72::mNG and TcFLA-1BP::mNG with FAZ labeled with anti-L3B2 (FAZ-1 T. brucei; green) or anti-2F6 (PFR; red). Nuclei and kinetoplasts were stained with Hoechst (blue). Scale bars: 2 µm. T7Cas9 (a–d). TcGP72-/- (e–h). TcFLA-1BP-/- (i–m). (B) SEM showing the morphology of knockout parasites. TcGP72-/- (c,d) with total flagellum detachment and TcFLA-1BP-/- (e,f) partial detachment relative to the T7Cas9 control parasite (a,b). (C) TEM (a,c,e) and negative staining-TEM (b,d,f) analysis. (a,c,e) Axial section of epimastigote forms showing the kinetoplast (K), nuclei (N), flagellum (F), and FAZ (yellow arrows). (b,d,f) Negatively stained showing the subpellicular microtubule of the cell body (CB) with the fully detached flagellum as in the TcGP72-/- or partially detached as TcFLA-1BP-/-. (D) Dot plots show flagellum length, cell size, and the relation between flagellum length and cell size in the epimastigote forms. The mean values are indicated with a black line. Statistically significant differences by p-value. n = 300 cells. The line chart depicts the growth curves of the knockout parasites. Statistically significant differences are indicated with asterisks for TcGP72-/- and pound signs for TcFLA-1BP-/- in relation to T7Cas9 control (* or # p < 0.05 and ** or ## p < 0.001).
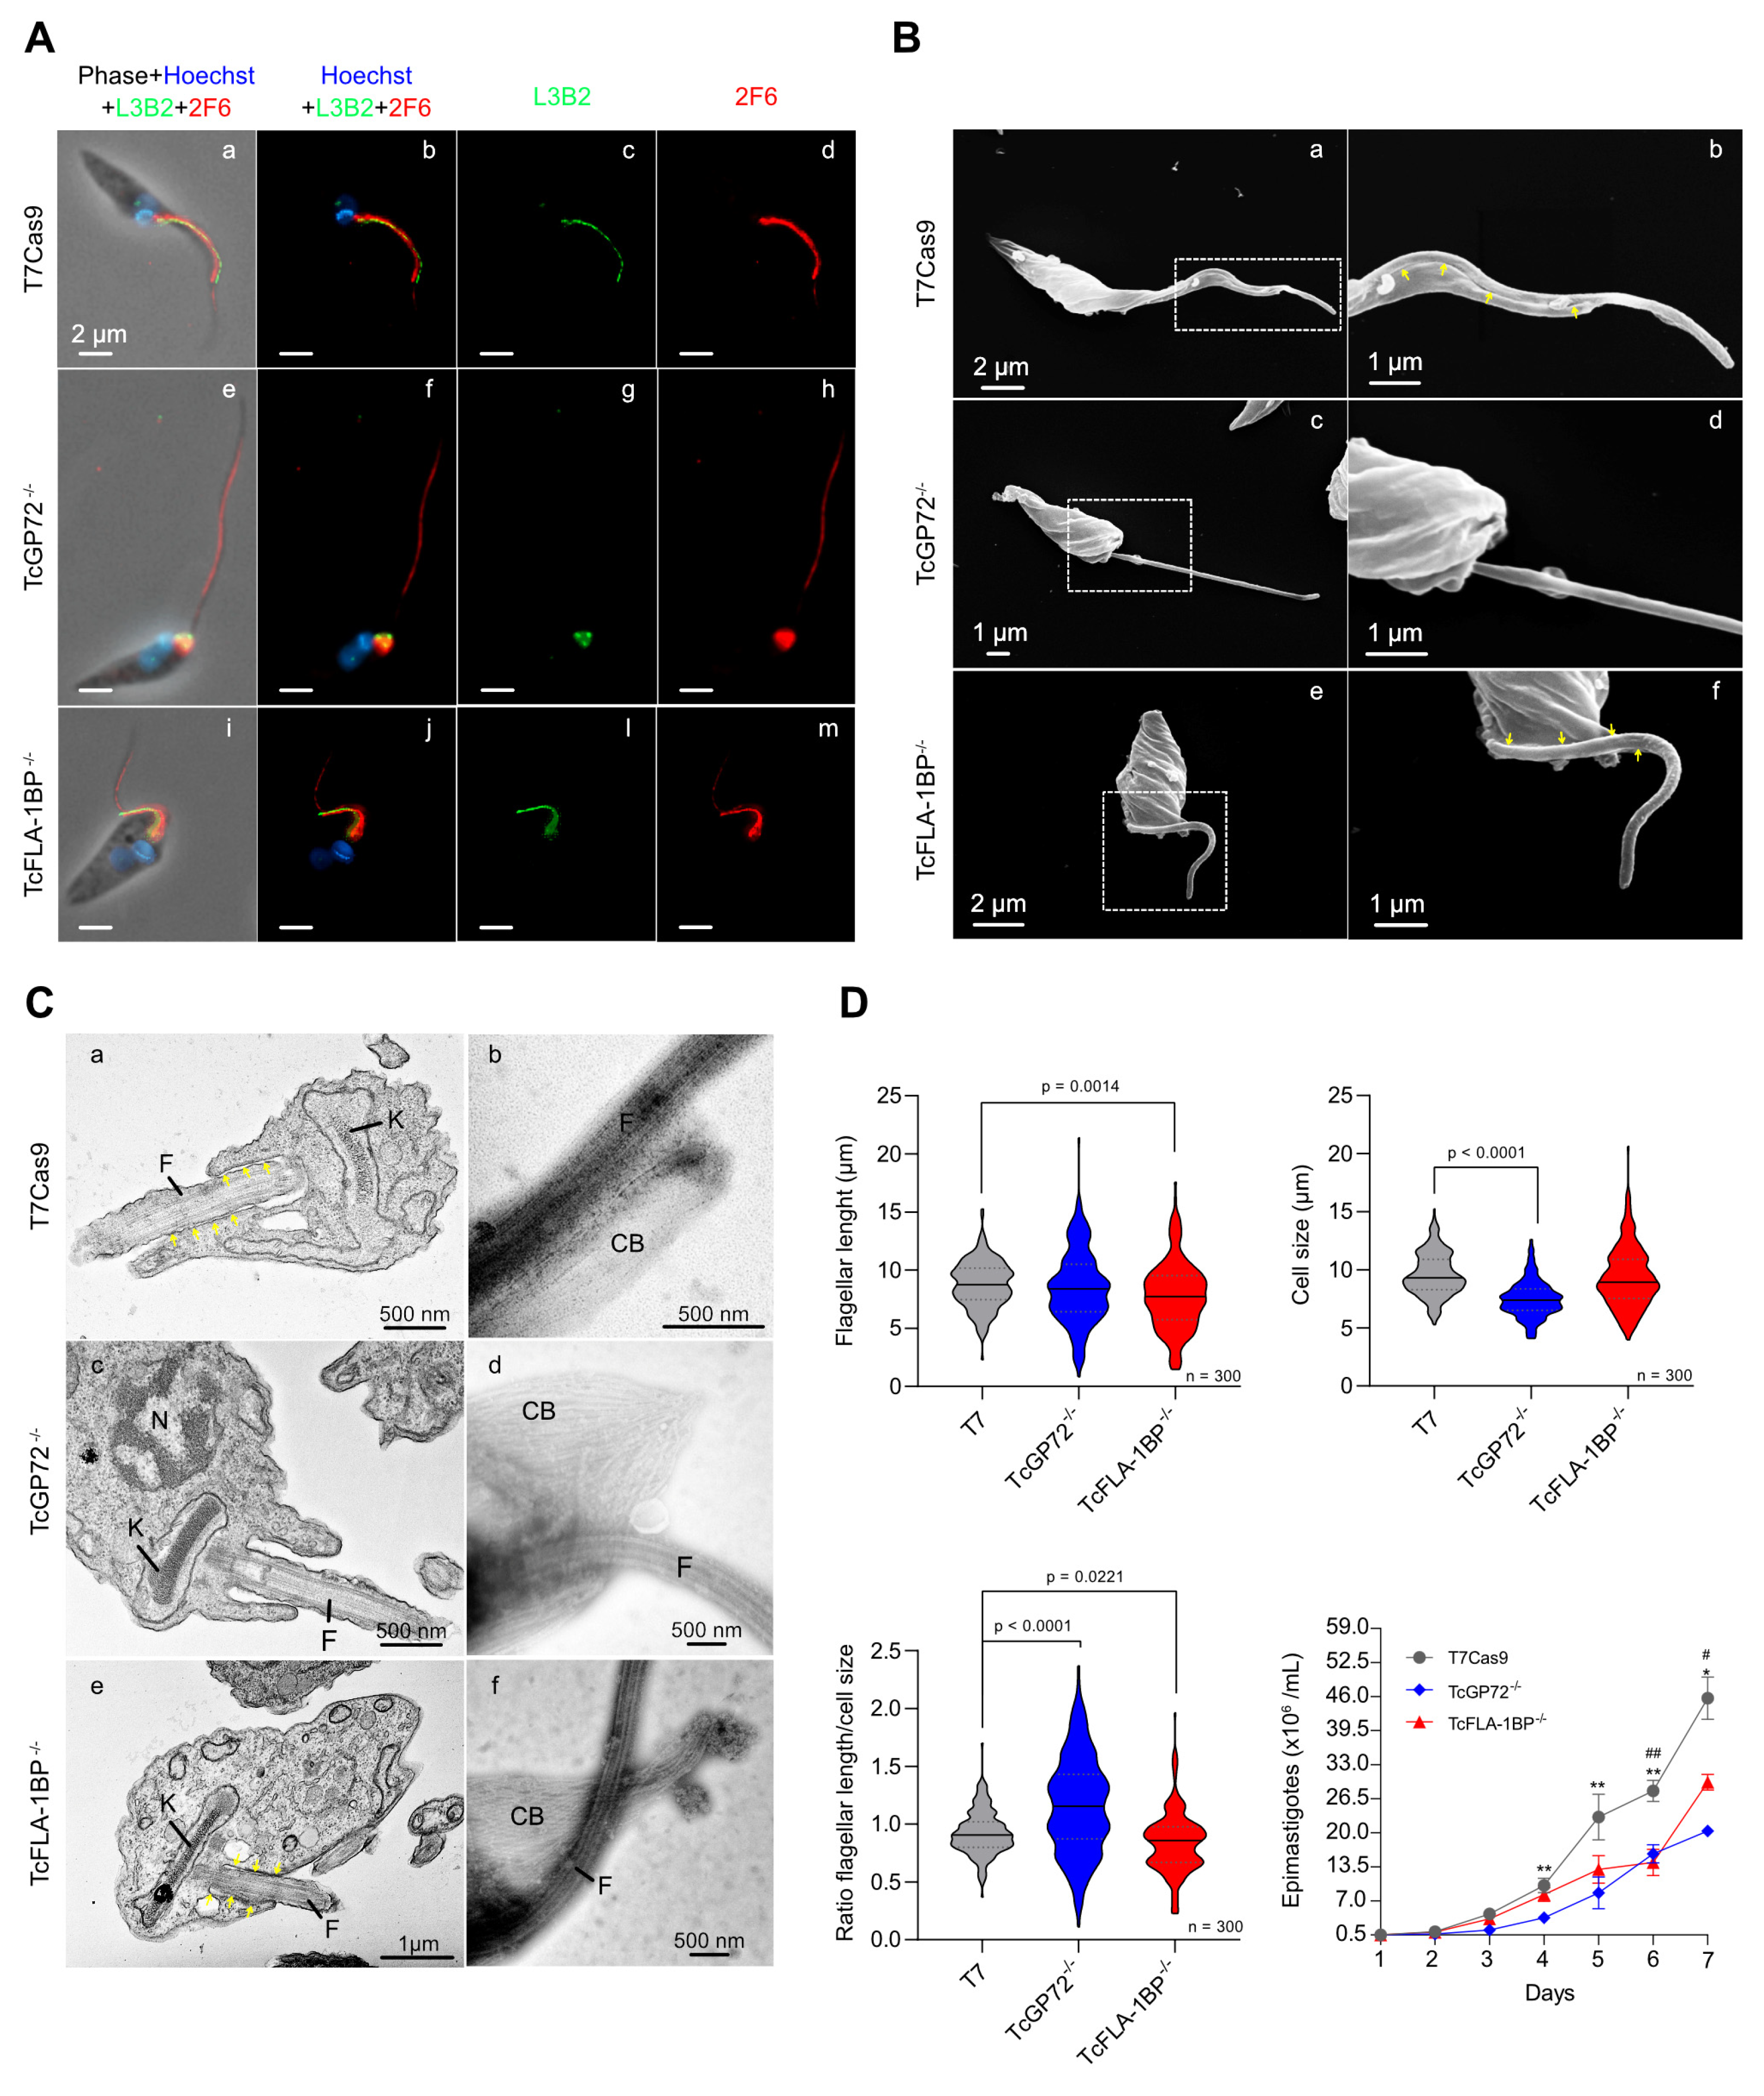
Figure 7.
TcGP72 knockout parasites display rosette formation, protrusions, and projection along the flagellum. (A) SEM of TcGP72-/- epimastigotes. (a) Rosette formation. (b) Flagellar membrane protrusions (yellow arrowhead) and (c,d) flagellar structures bizarrely filled by amorphous material. The dotted region (c) shows the magnified area (d). TEM shows the membrane projections (black arrowhead) and protrusions (yellow arrowhead) of the flagellum and the cell body membrane in TcGP72 knockout parasites. F: Flagellum.
Figure 8.
TcGP72 and TcFLA-1BP knockout in T. cruzi epimastigotes show cell cycle defects. Cell cycle comparative analysis by flow cytometry of the knockout parasites. (A) Representative histograms showing the DNA content of TcGP72-/-, TcFLA-1BP-/-, and T7Cas9 control. The peak in gray represents T7Cas9 parasites, and peaks in red and blue represent depleted TcFLA-1BP and TcGP72, respectively. The bar graph represents the percentage of cells in each cell cycle phase in three independent experiments. Statistical analysis was performed with two-way ANOVA with Bonferroni correction for multiple testing. (B) Quantification of nuclei, the kinetoplast, and flagellum in cells labeled for immunofluorescence microscopy with anti-2F6 (PFR) and Hoechst stain of knockout parasites (n = 300 cells). (C) SEM showing the abnormal morphology of knockout parasites. TcGP72-/- (a,b) and TcFLA-1BP-/- (c,d).
Figure 9.
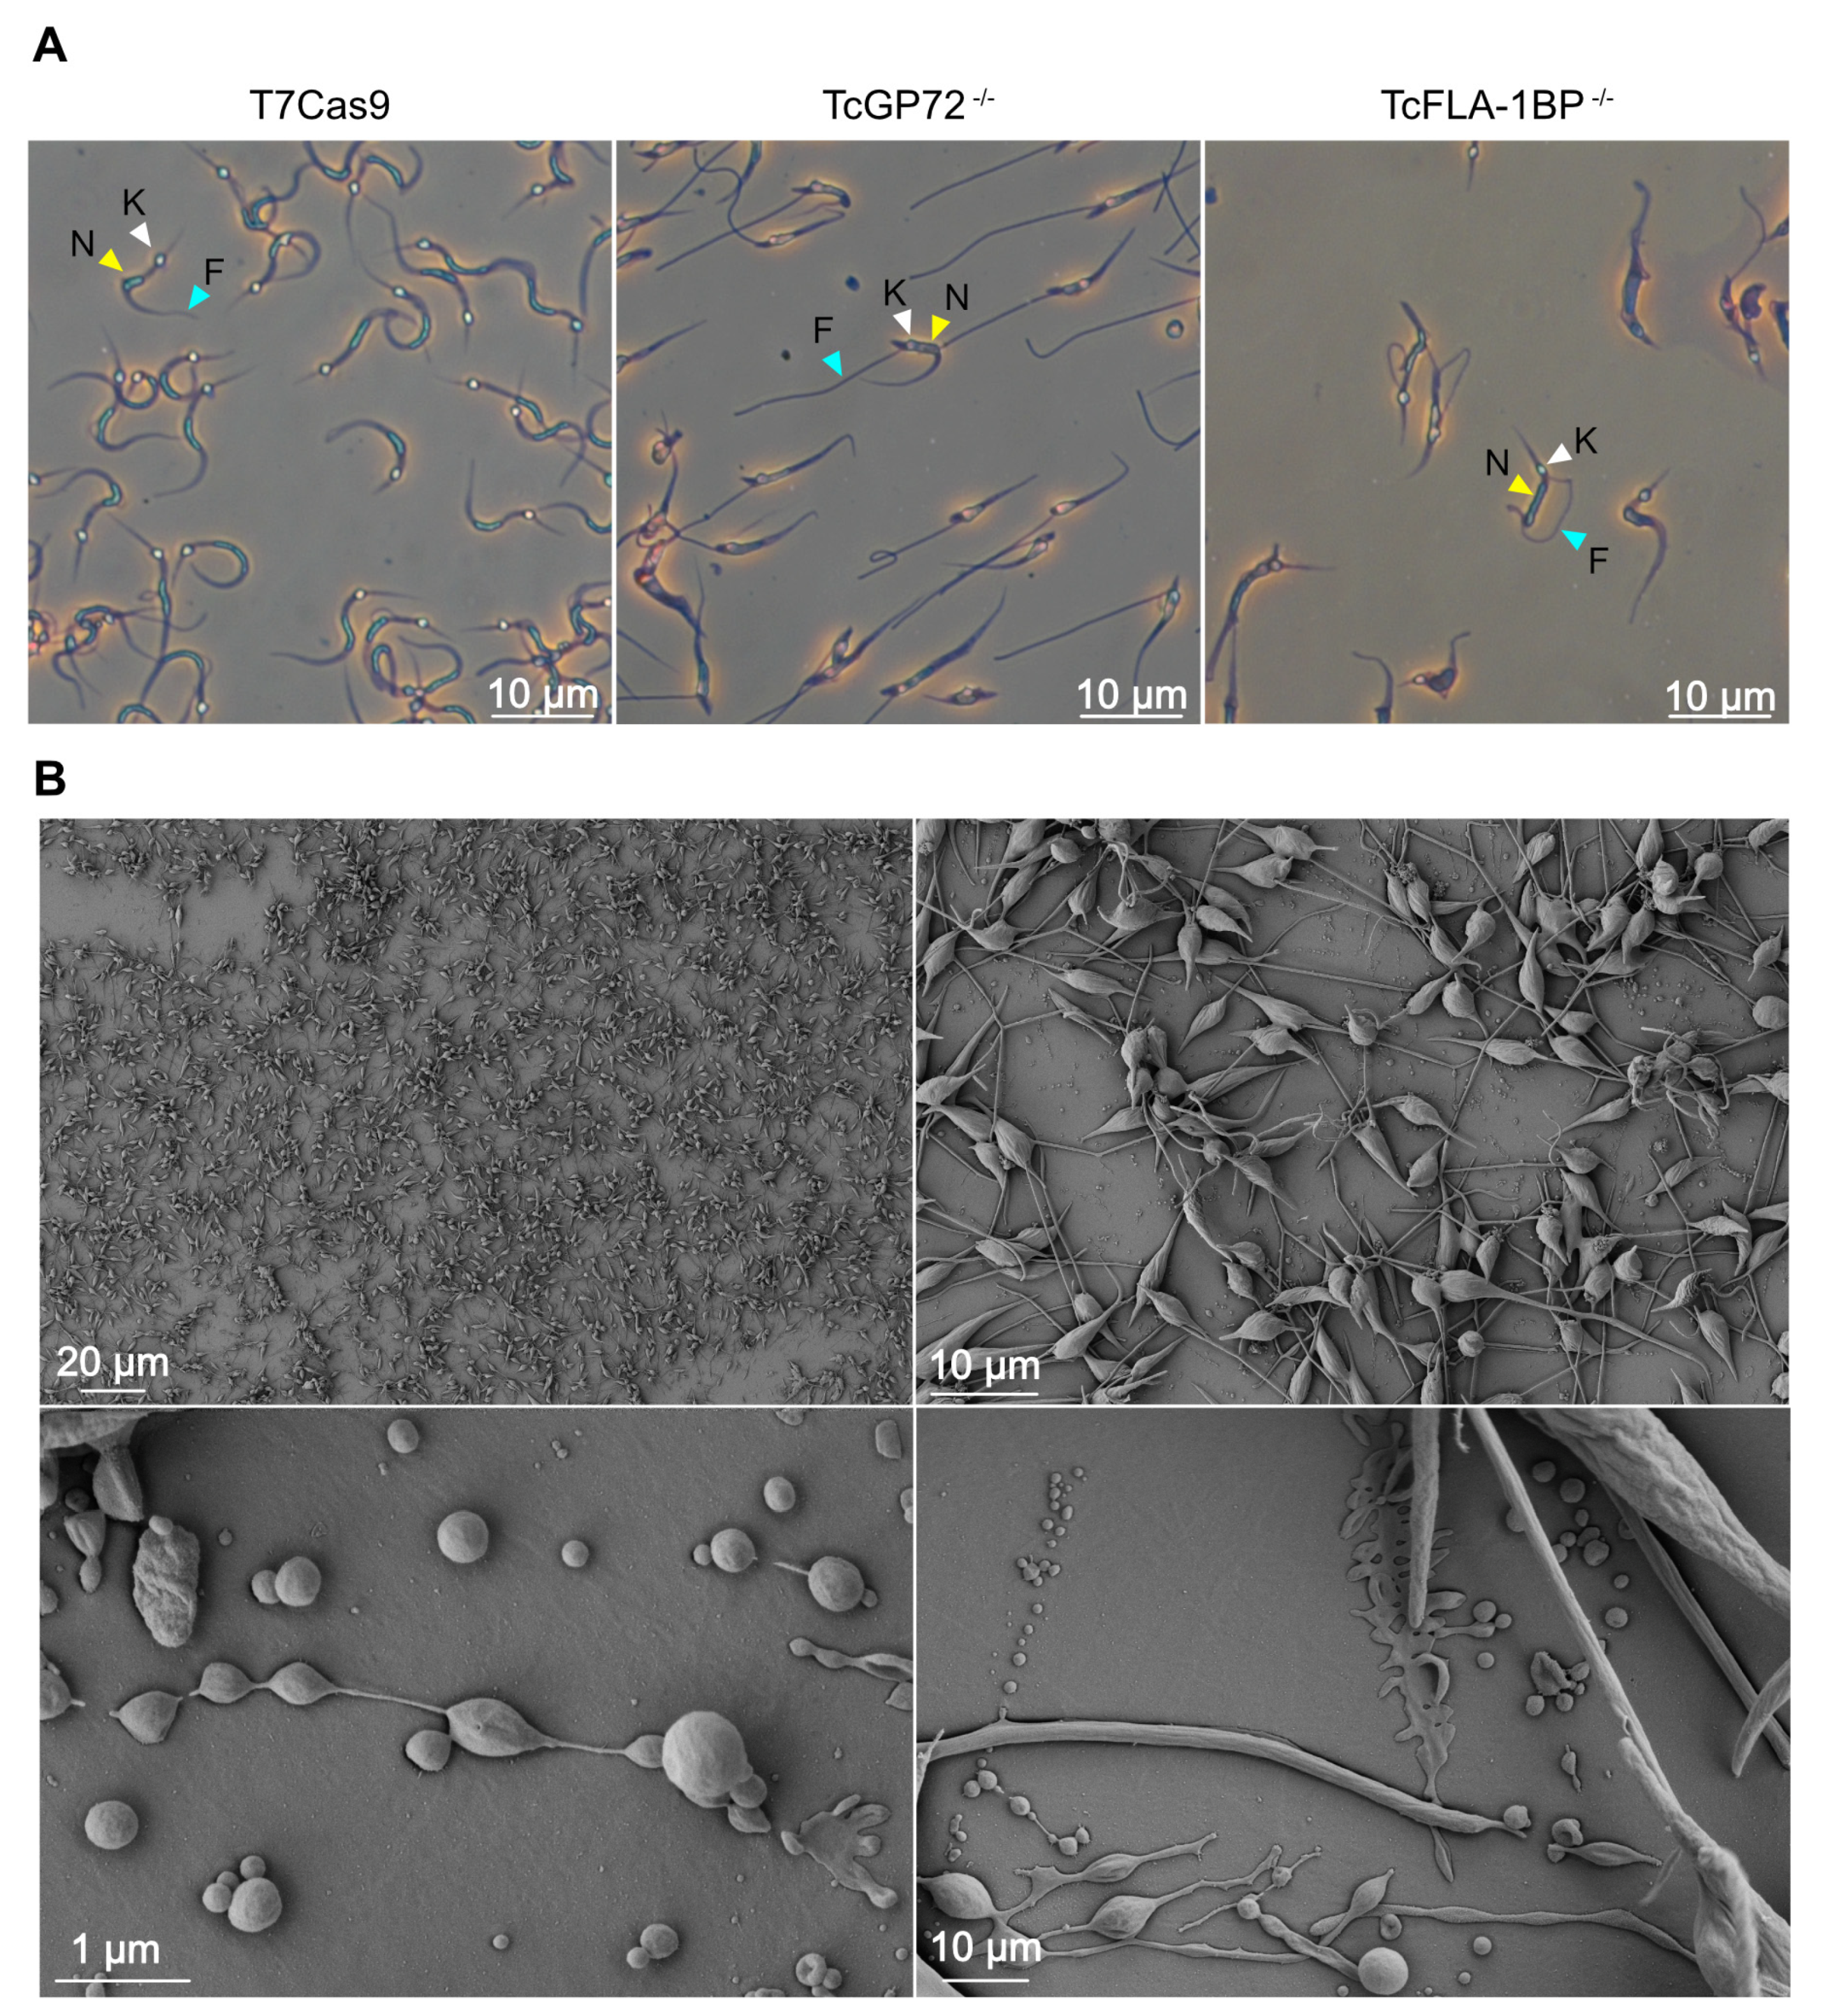
TcGP72 and TcFLA-1BP knockout T. cruzi show metacyclogenesis defects. (A) Metacyclic TCTs purified on a DEAE cellulose column stained with Giemsa and observed under a microscope. The white arrowhead represents the kinetoplast, the yellow arrowhead represents the nucleus, and the blue arrowhead represents the flagellum. (B) Scanning microscopy images of TcGP72-/- parasites forming an adhesion network at the bottom of the culture flask during the metacyclogenesis assay.
Figure 10.
A simplified view of the flagellum and cell body adhesion mediated by the interaction of TcGP72 and FLA-1BP in Trypanosoma cruzi. In T. cruzi, the flagellum membrane interacts with the cell body membrane, forming an adhesive network of proteins. This region is called the flagellar attachment zone (FAZ). The FAZ is divided into 3 main domains: 1) FAZ flagellum domain, 2) FAZ intercellular domain, and 3) FAZ filament domain. The components of the FAZ are distributed along the domains. Both TcGP72 and FLA1BP are essential for this adhesion at different intensities. In our model, TcGP72 is present on the flagellar membrane, and TcFLA-1BP is present on the cell membrane. TcGP72 is anchored to the flagellum by the intracellular domain at the N-terminus. TcFLA-1BP is anchored to the cell body by the two intracellular domains (N- and C-terminus). TcGP72 and TcFLA-1BP interact via the extracellular domains directed towards the intercellular domain of FAZ, thereby mediating flagellum/cell body adhesion. This interaction happens via the NHL repeat domains present in the extracellular regions. The absence of TcGP72 and TcFLA-1BP causes partial or complete detachment of the flagellum. Both proteins have N- and O-glycosylation sites. Extra: Extracellular. Intra: Intracellular. FM: Flagellum membrane. PM: Plasma membrane.
