Submitted:
18 October 2023
Posted:
19 October 2023
You are already at the latest version
Abstract
Keywords:
1. Introduction
2. Materials and Methods
2.1. Surface Preparation of Samples
2.2. SEM and EDS Study of the CoCrMo Alloy
2.3. Microhardness of the CoCrMo Alloy
2.4. Corrosion Resistance of the CoCrMo Alloy
2.5. Scanning Kelvin Probe Measurements of the CoCrMo Alloy
3. Results and Discussion
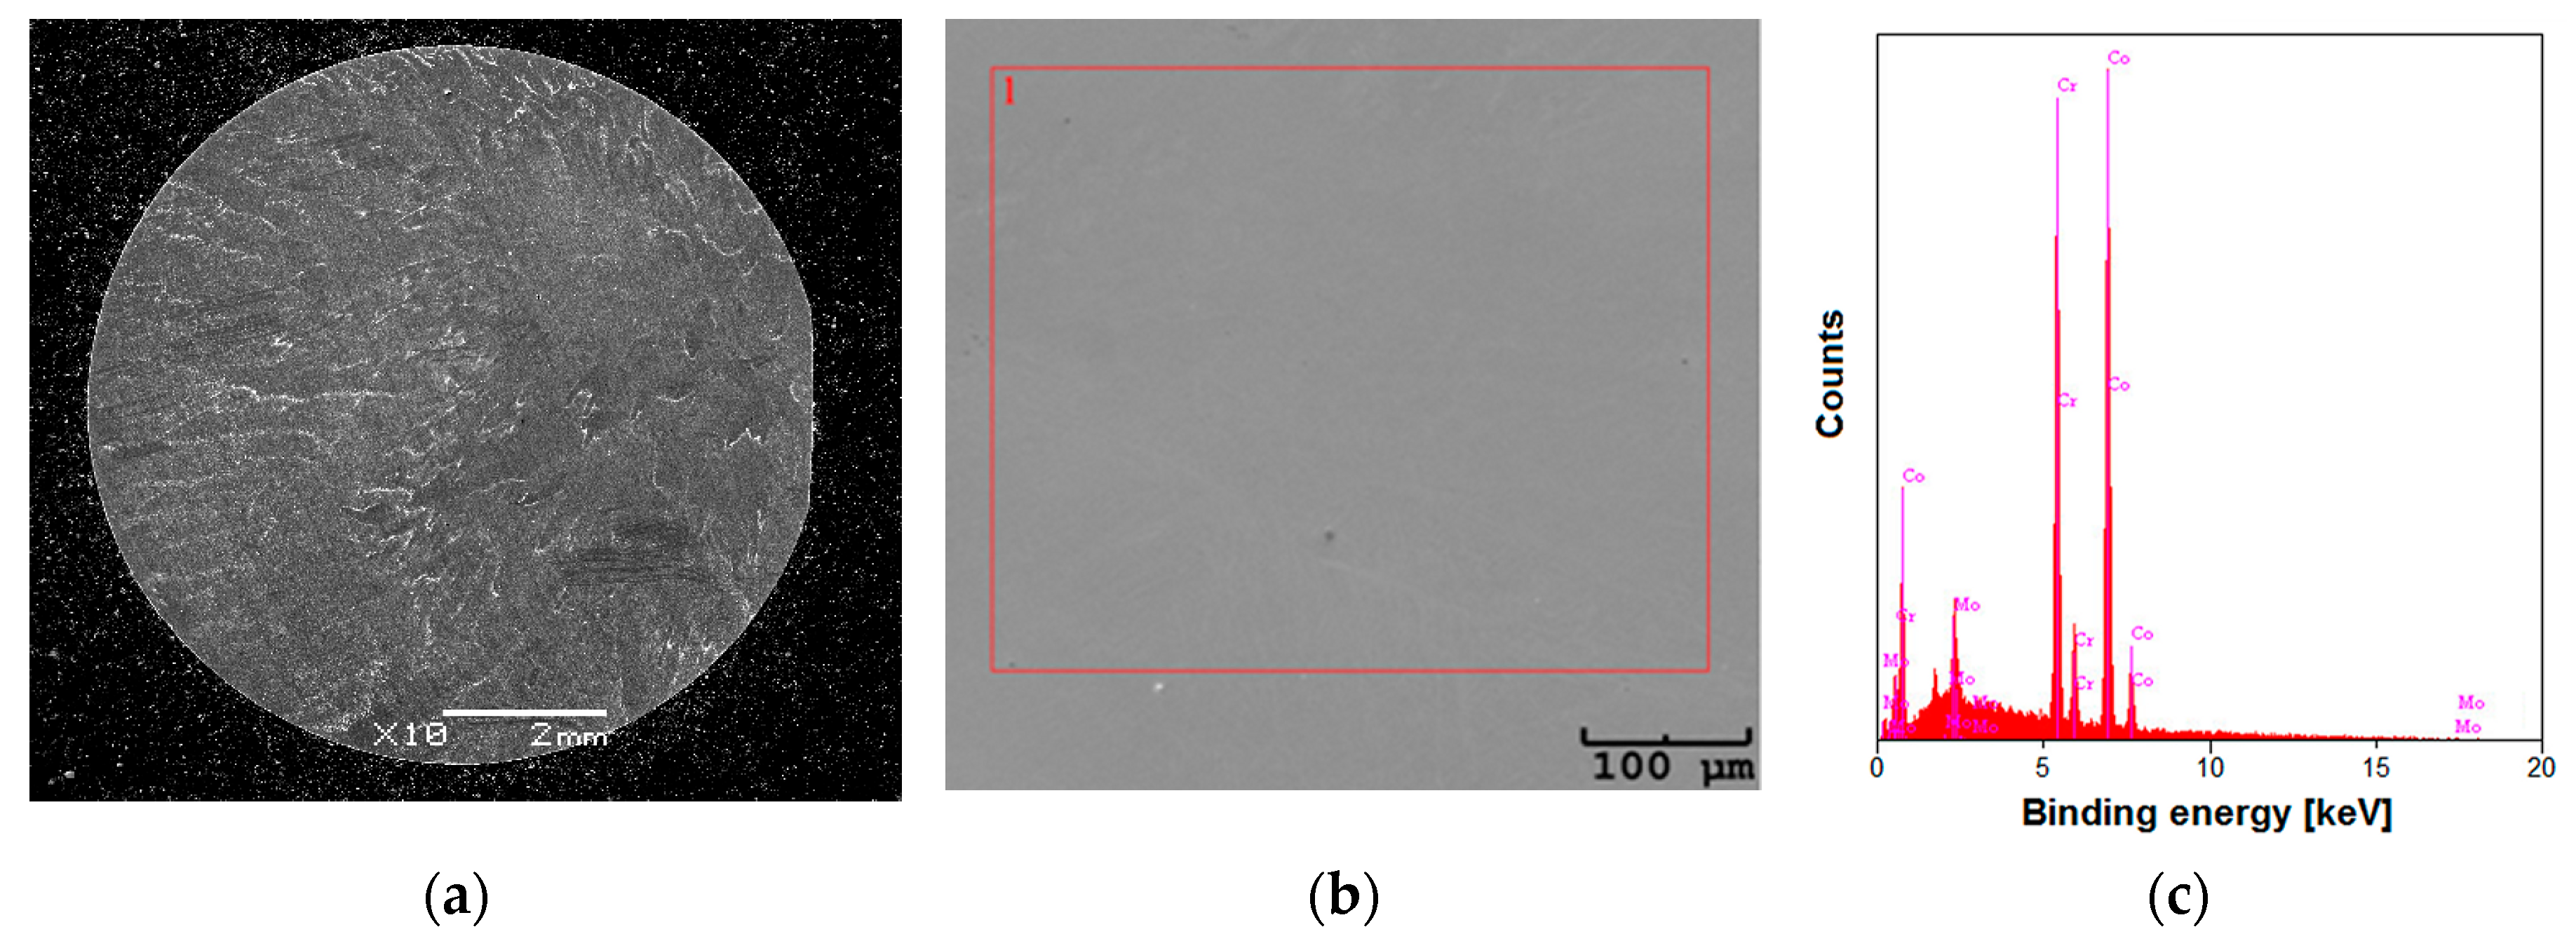
3.1. Microstructure and Chemical Composition of the CoCrMo Alloy
3.2. Micromechanical Properties of the CoCrMo Alloy
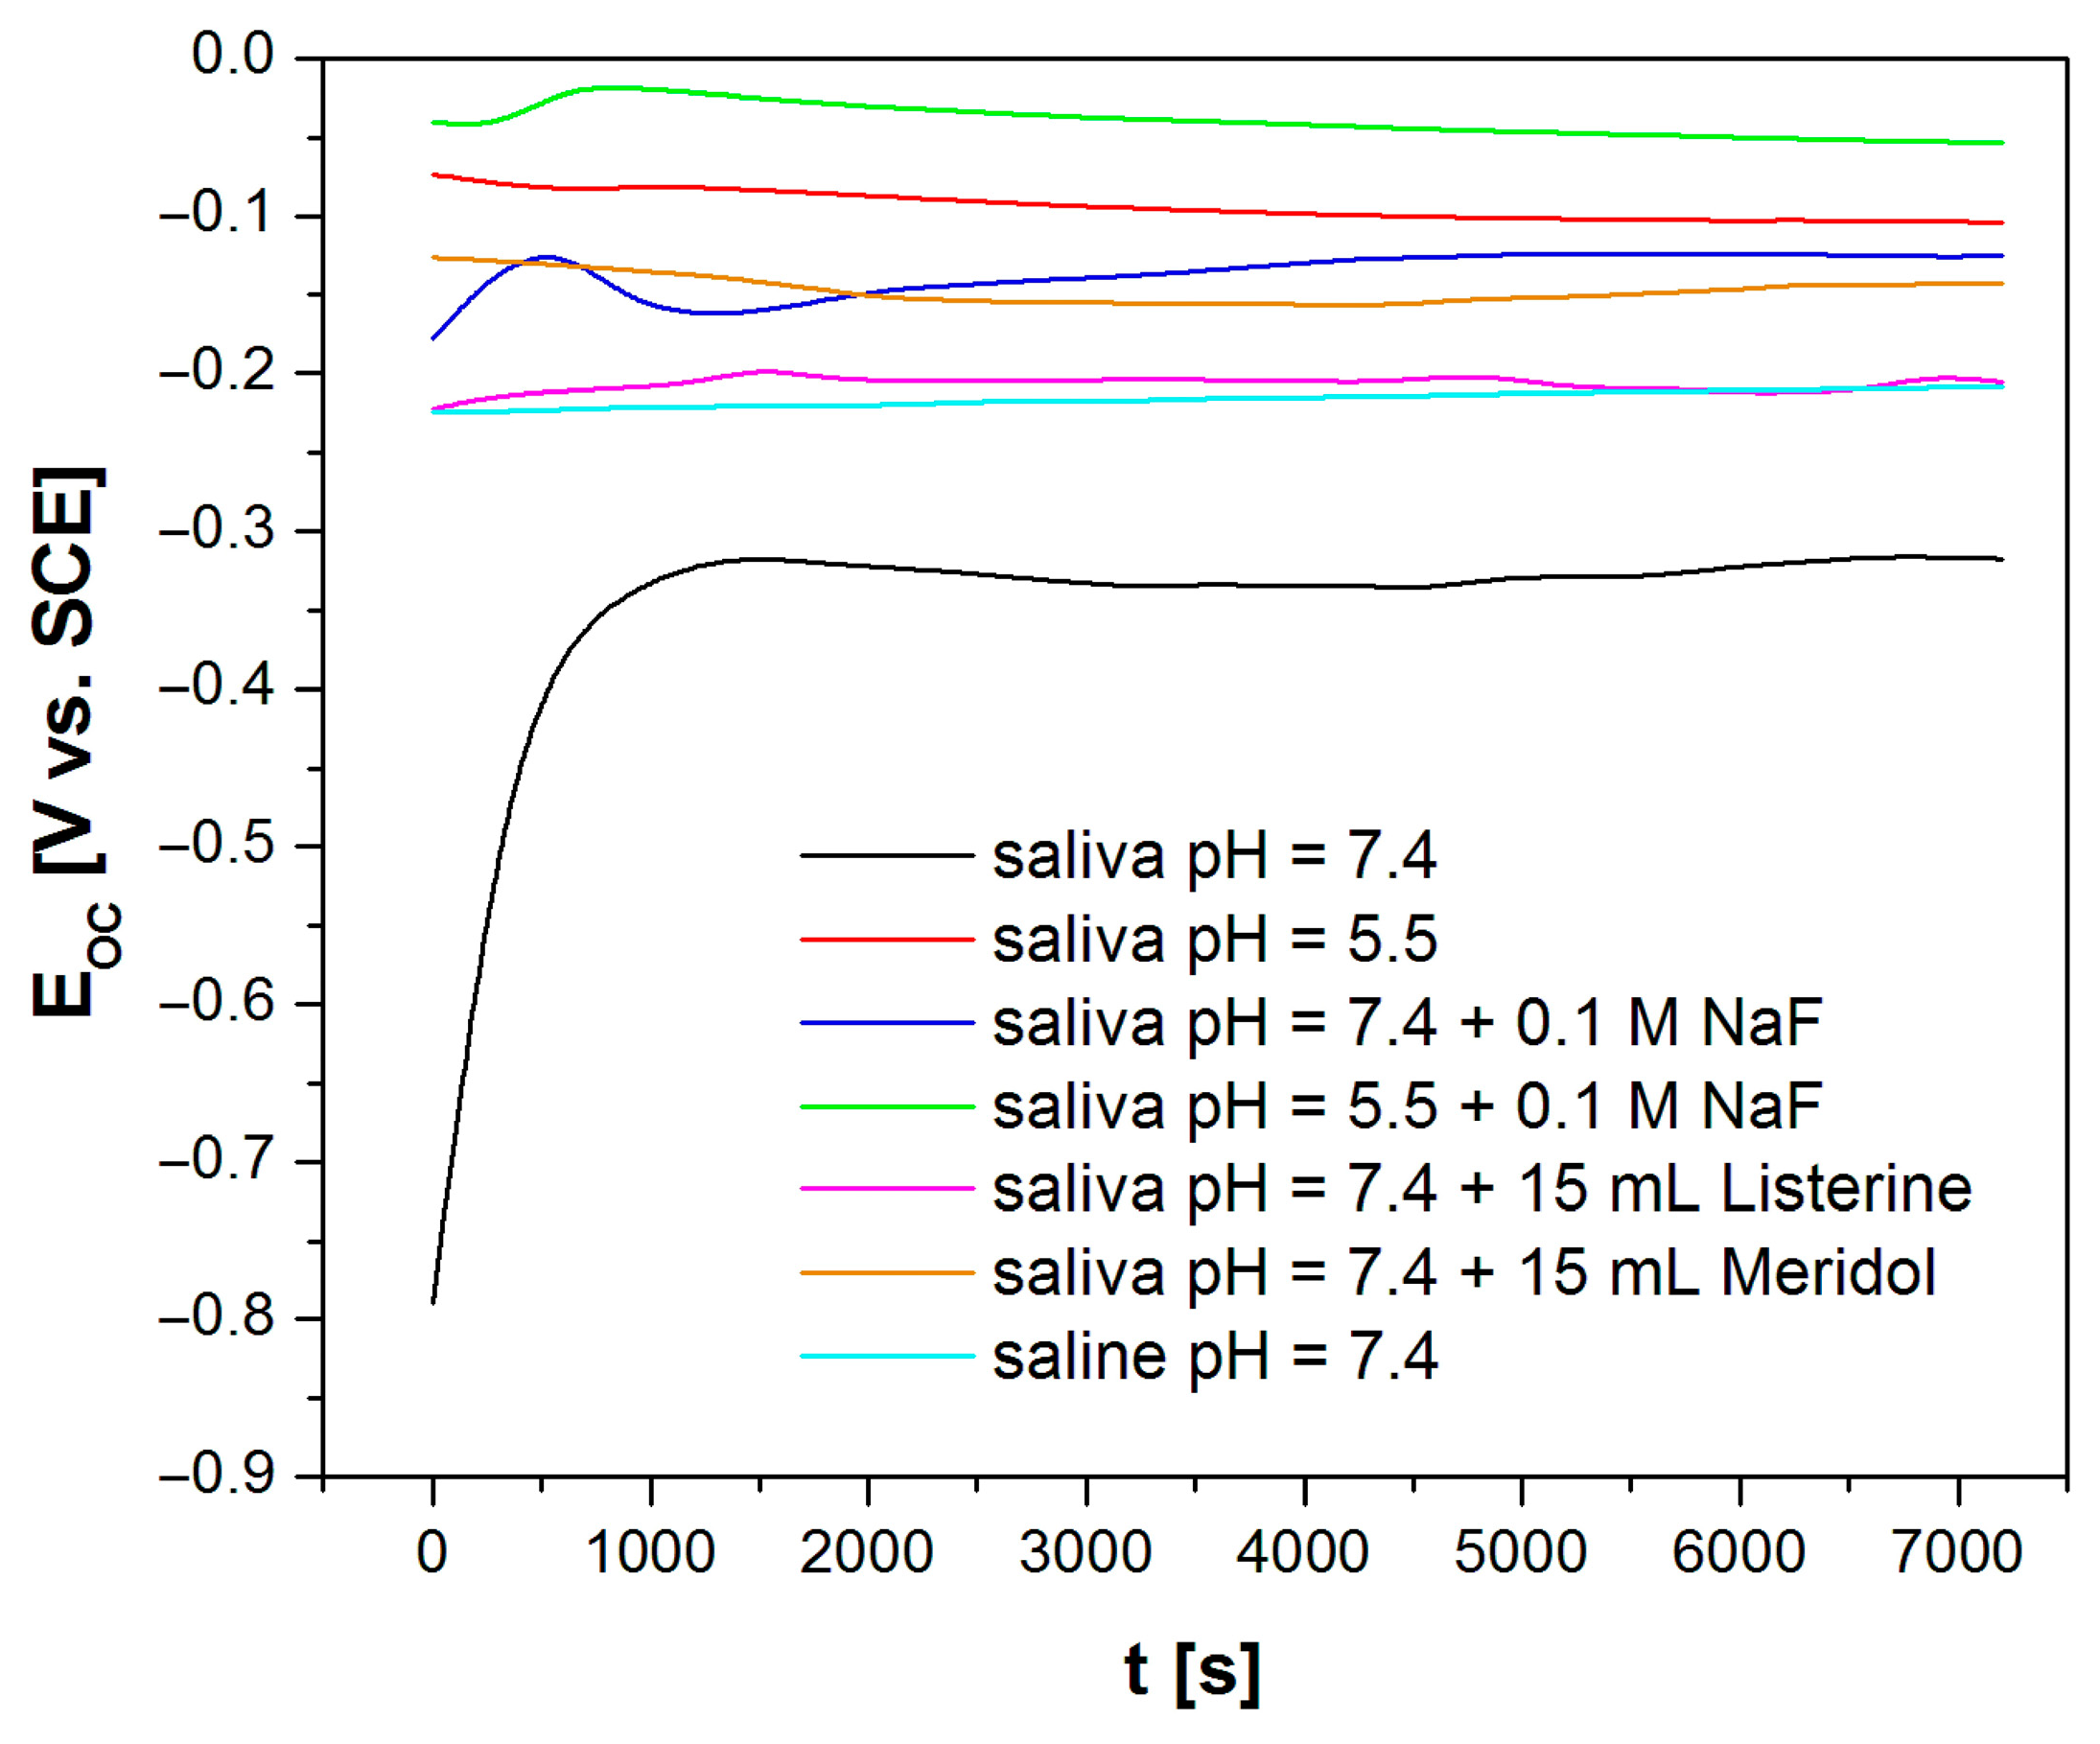
3.3. In Vitro Electrochemical Tests Using the Open Circuit Potential Method
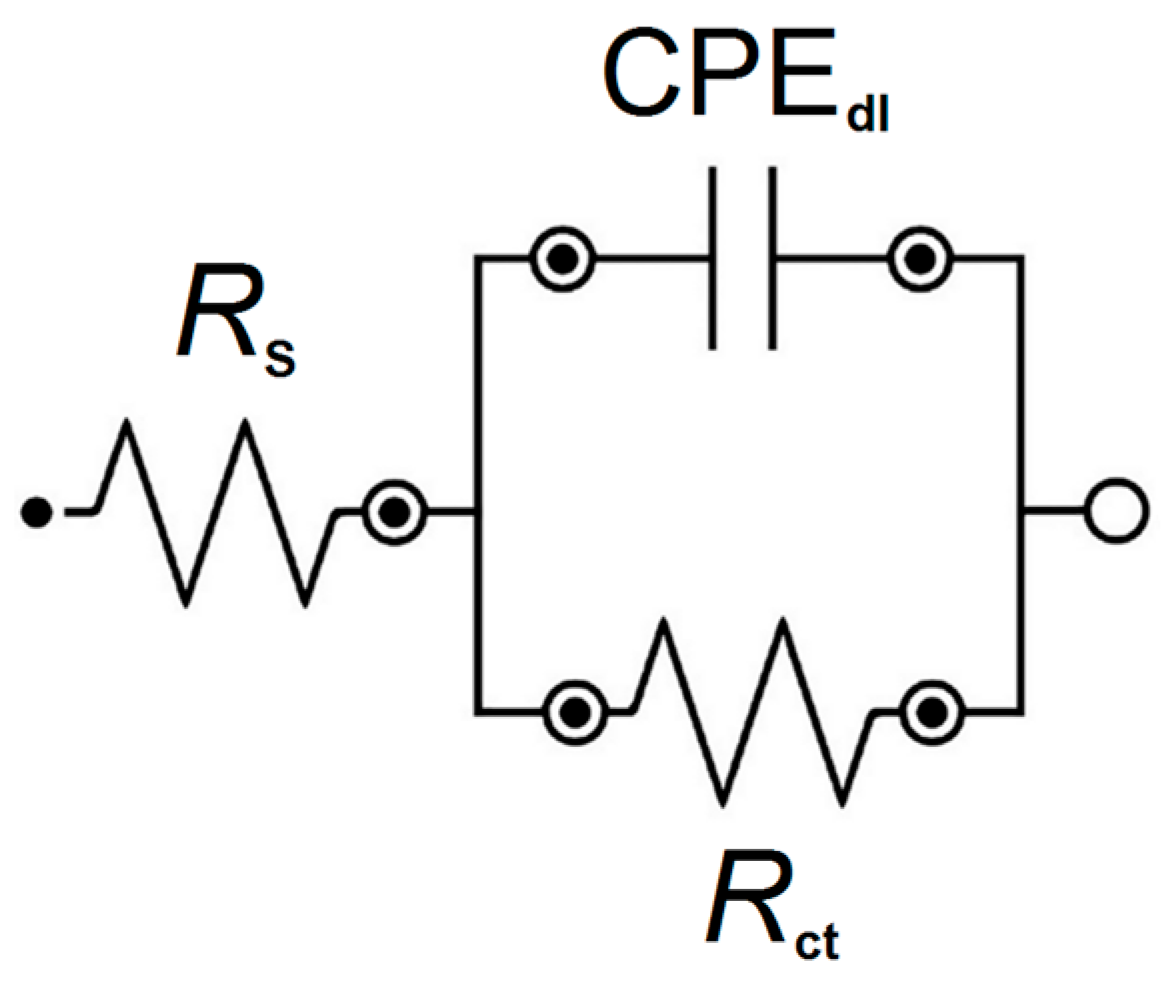
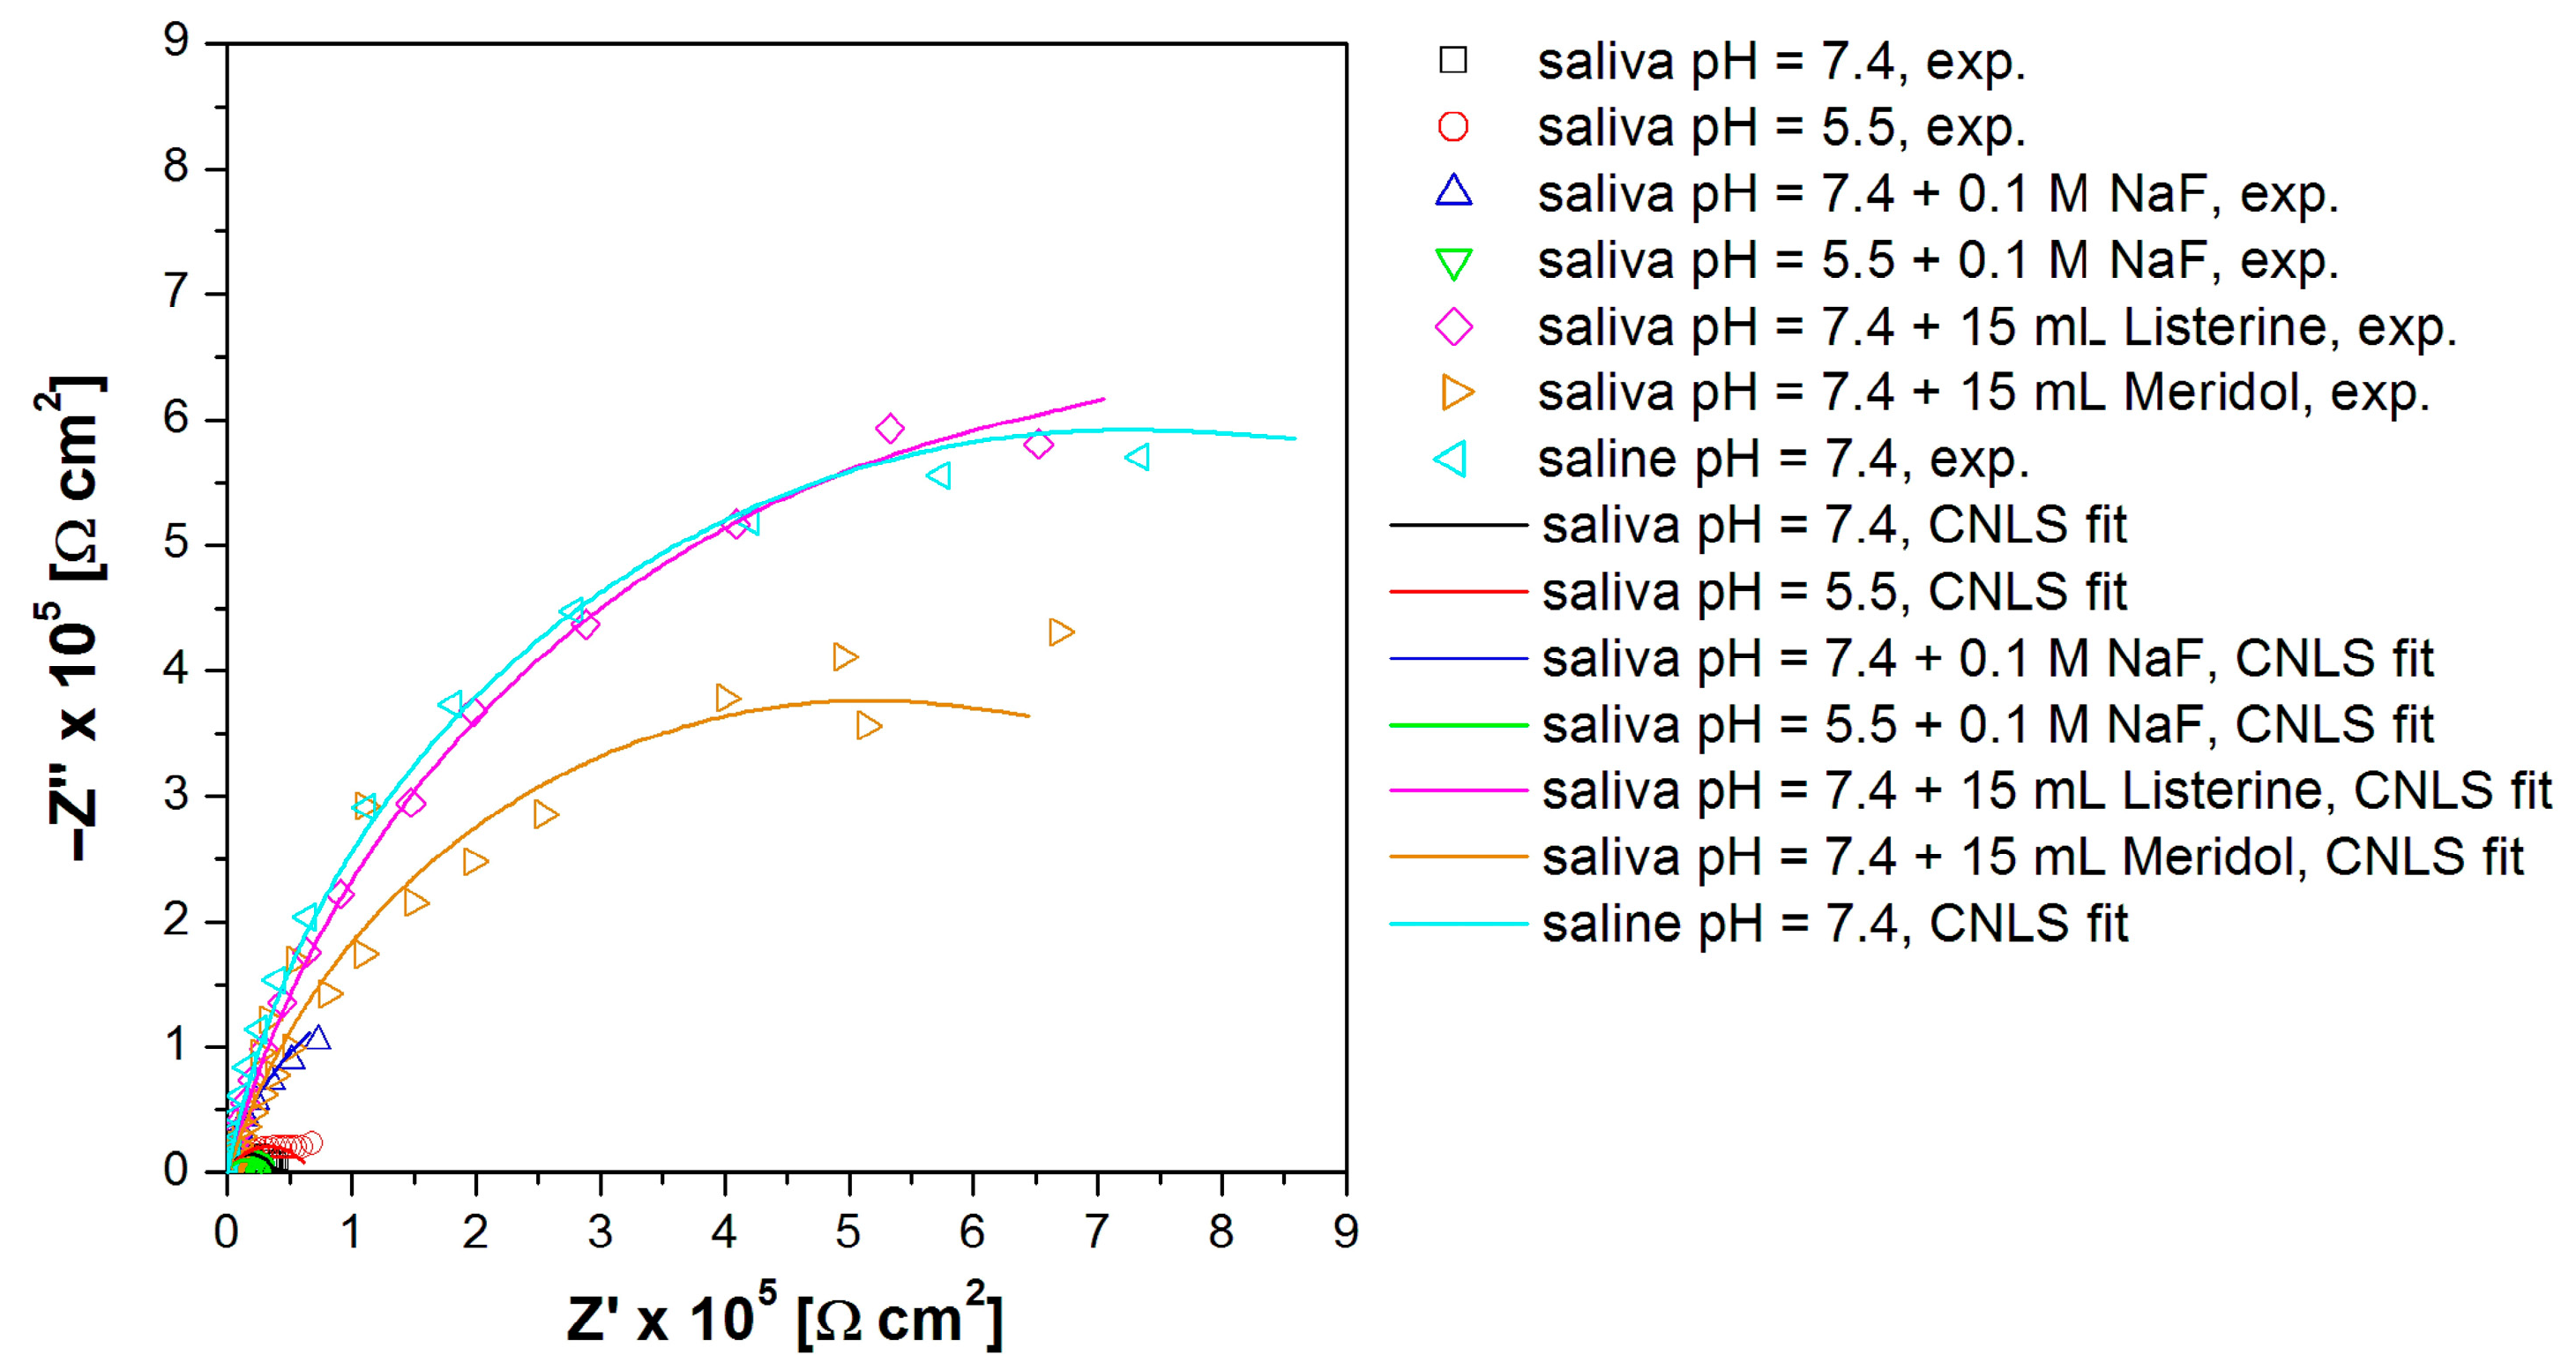
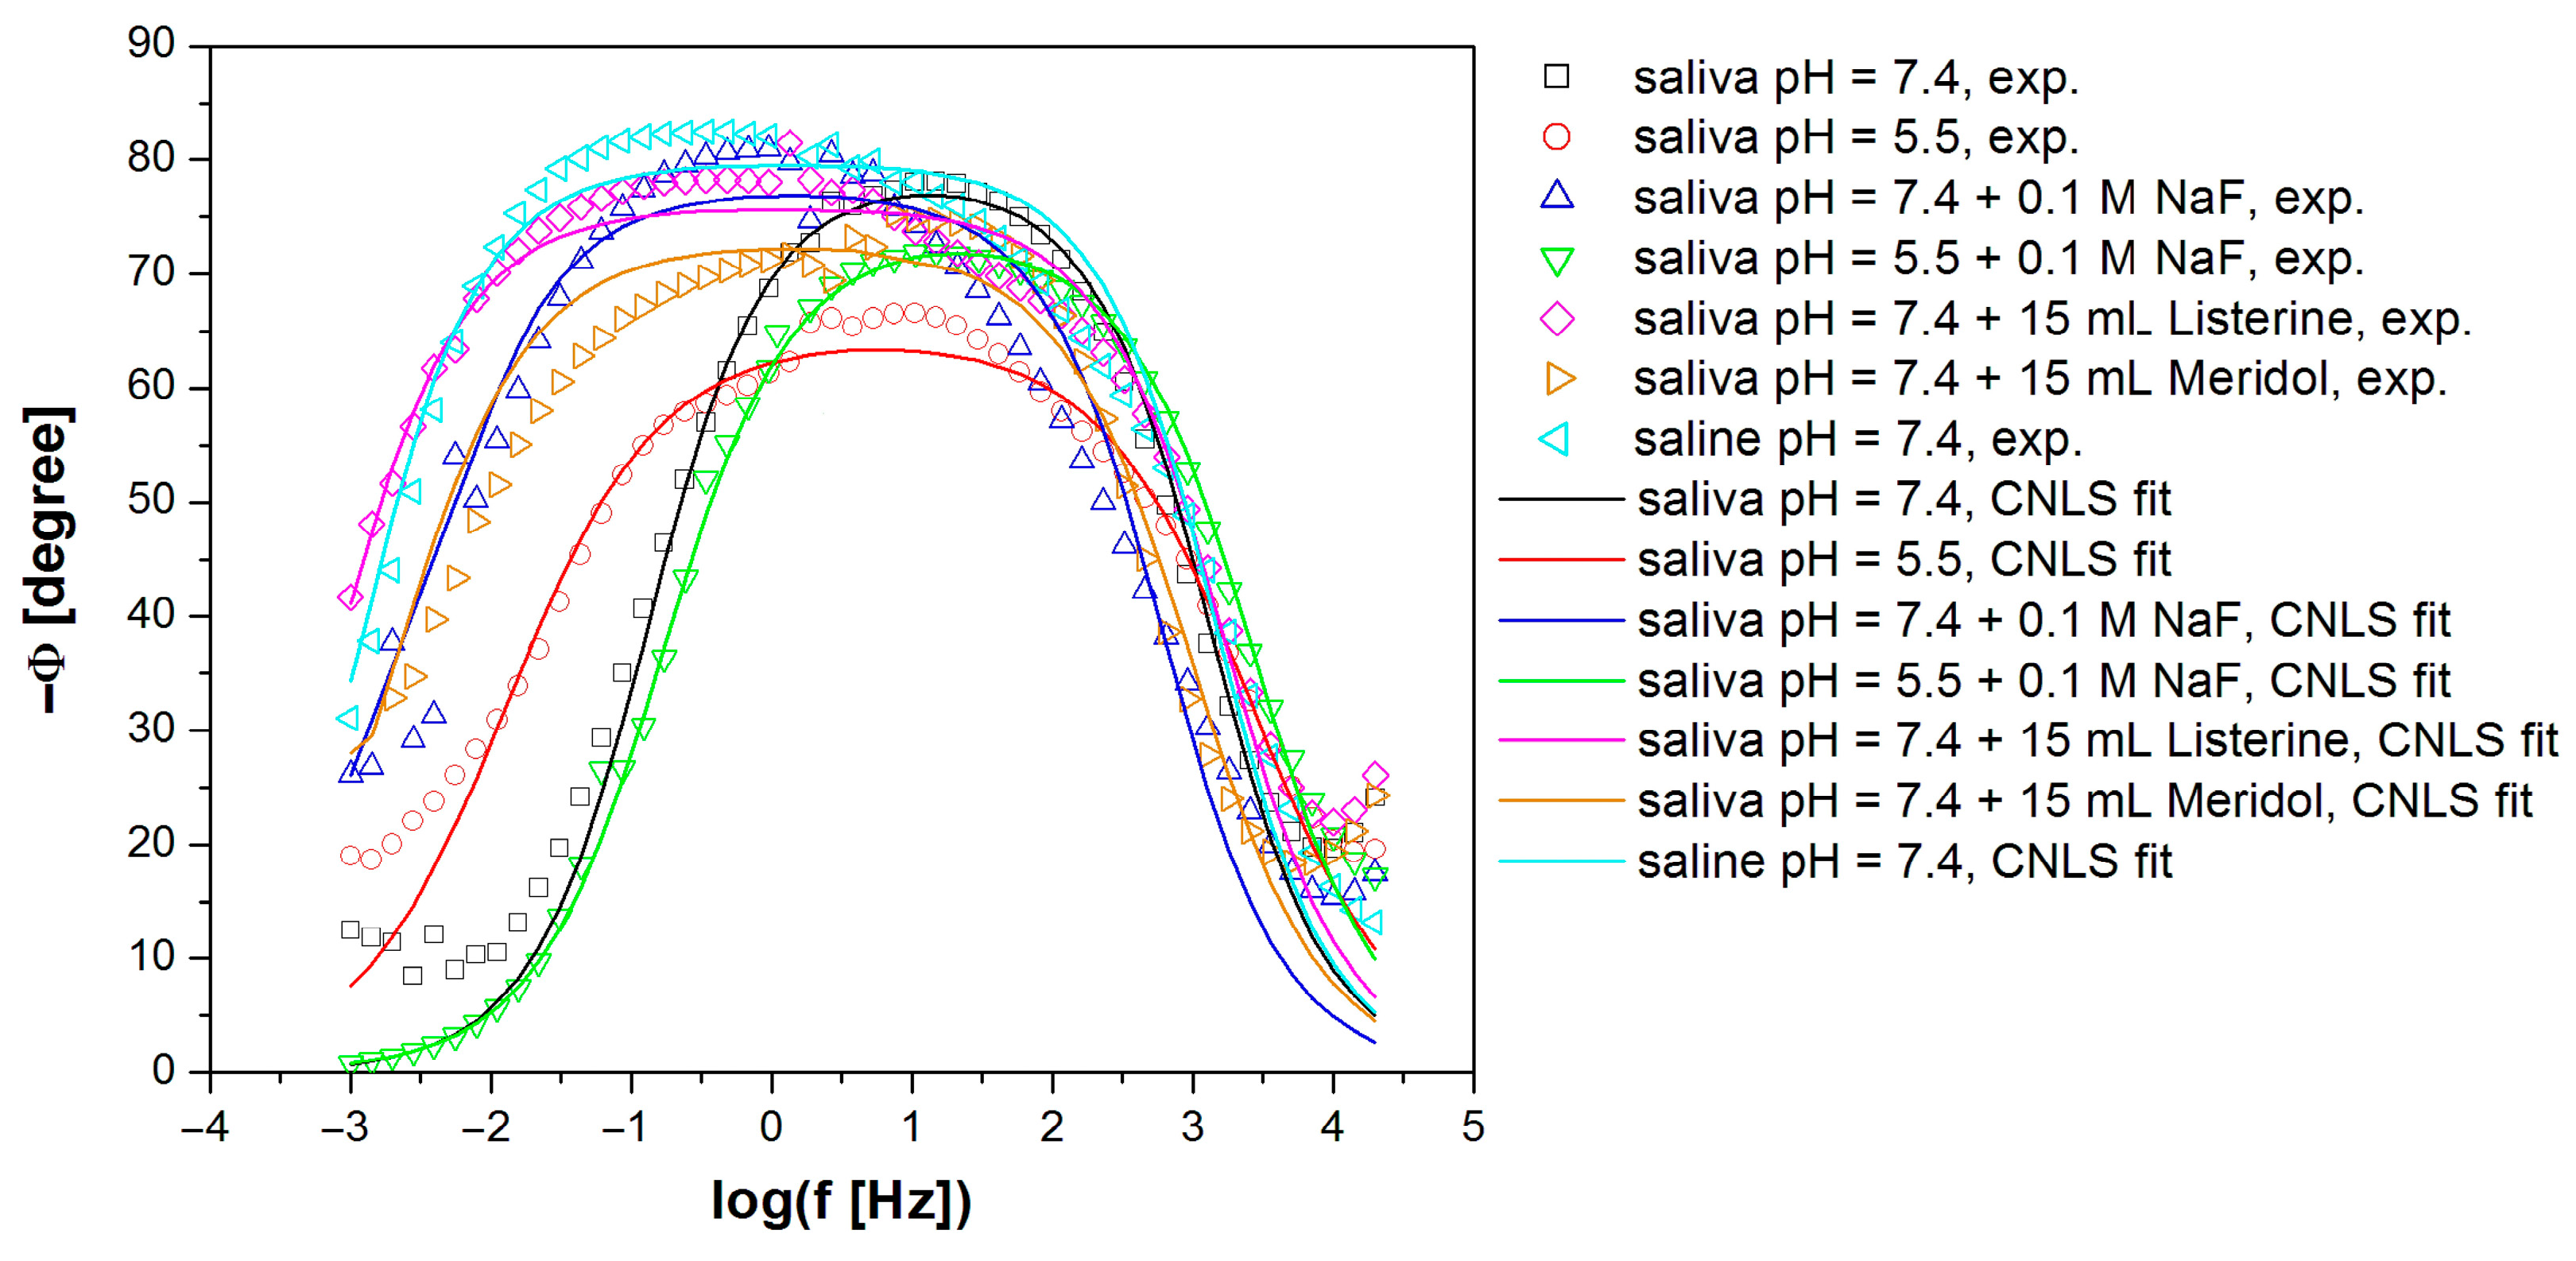
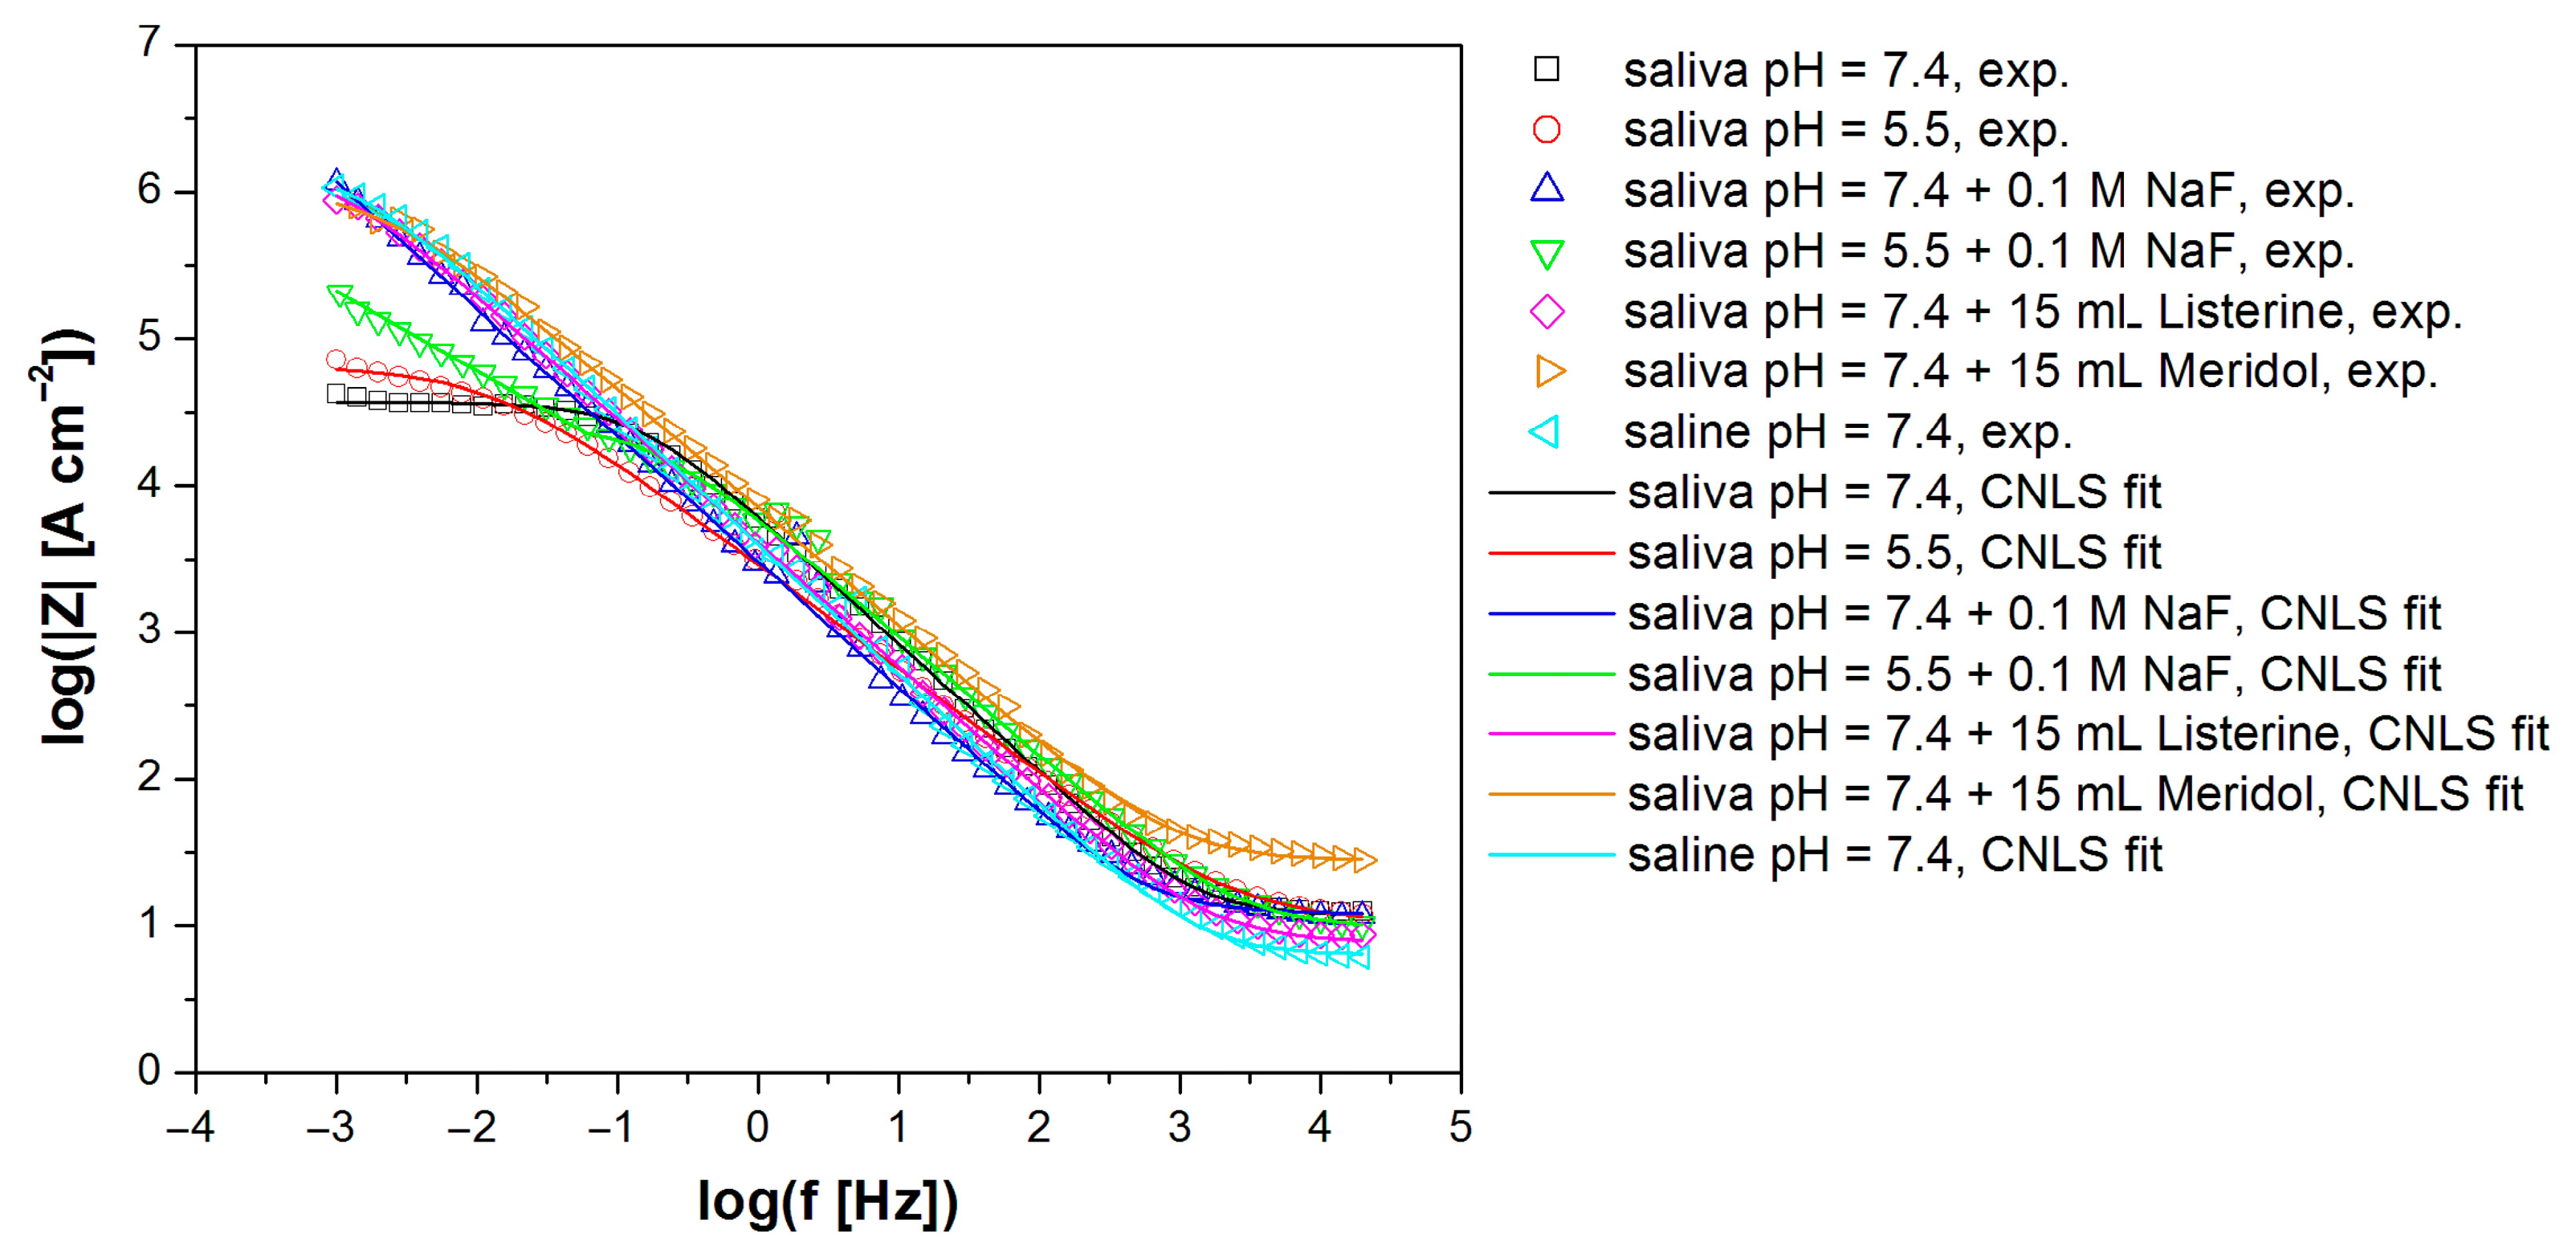
3.4. In Vitro Electrochemical Study Using Electrochemical Impedance Spectroscopy
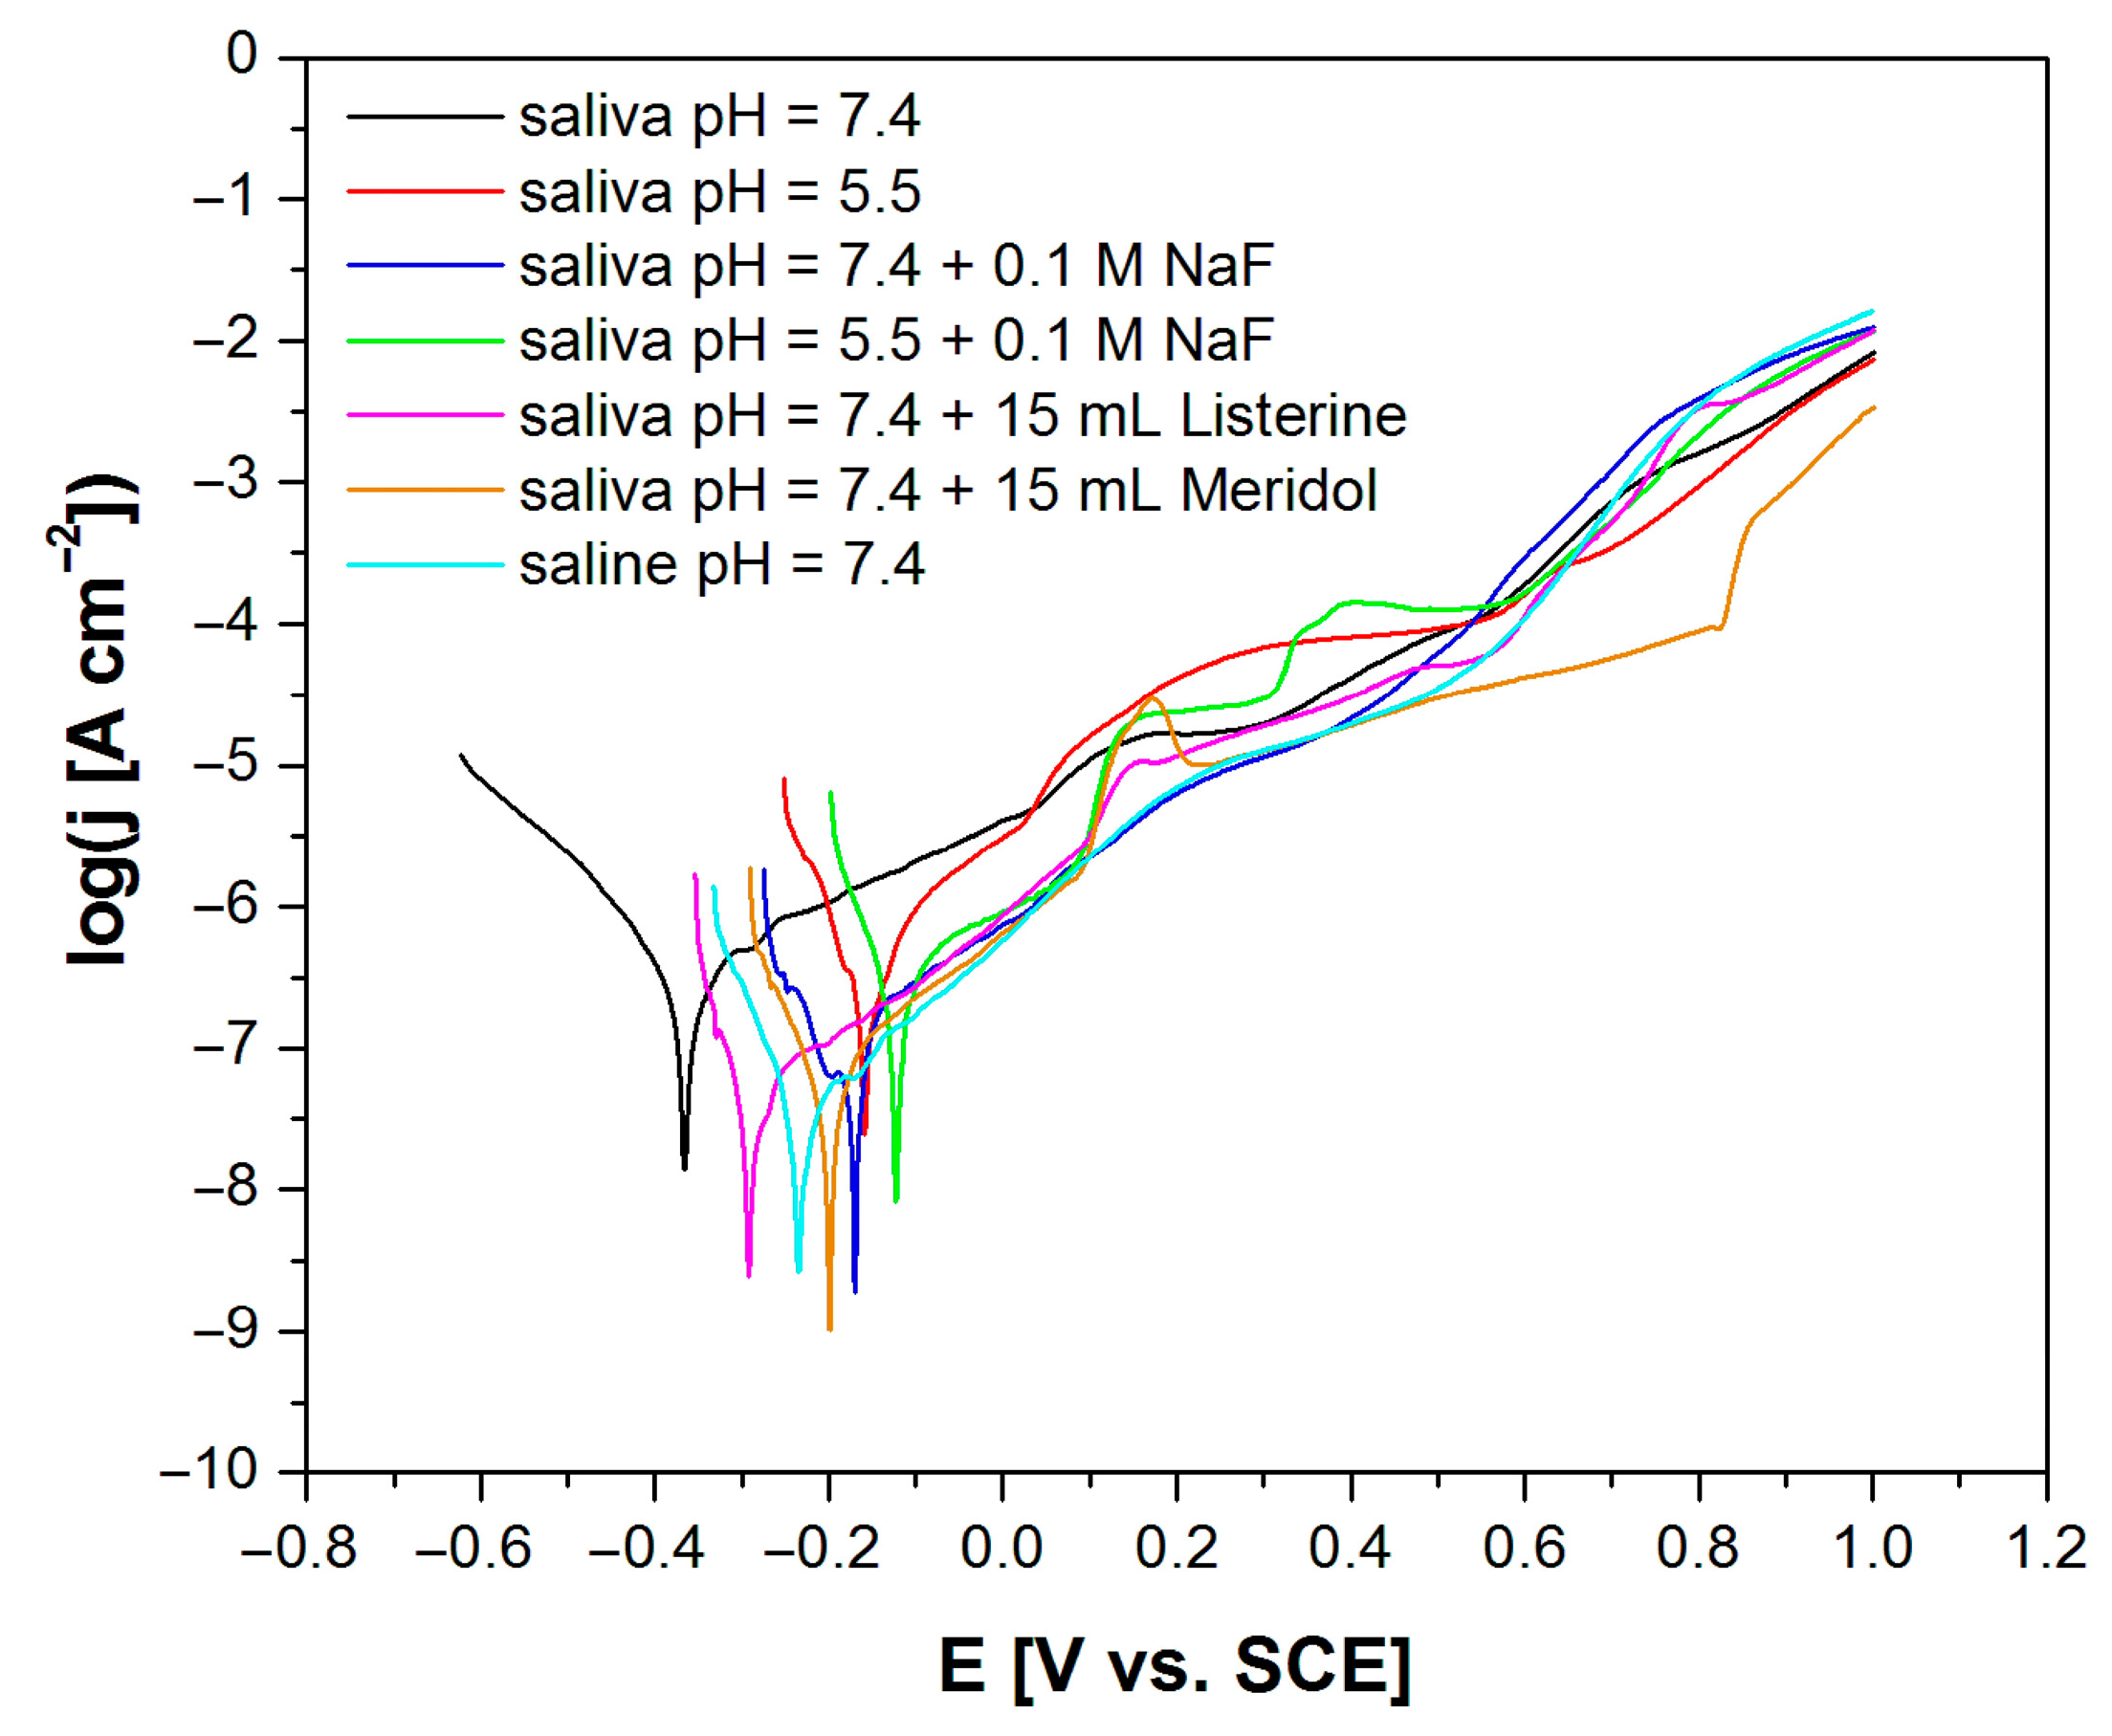
3.5. In Vitro Electrochemical Tests Using the Potentiodynamic Method
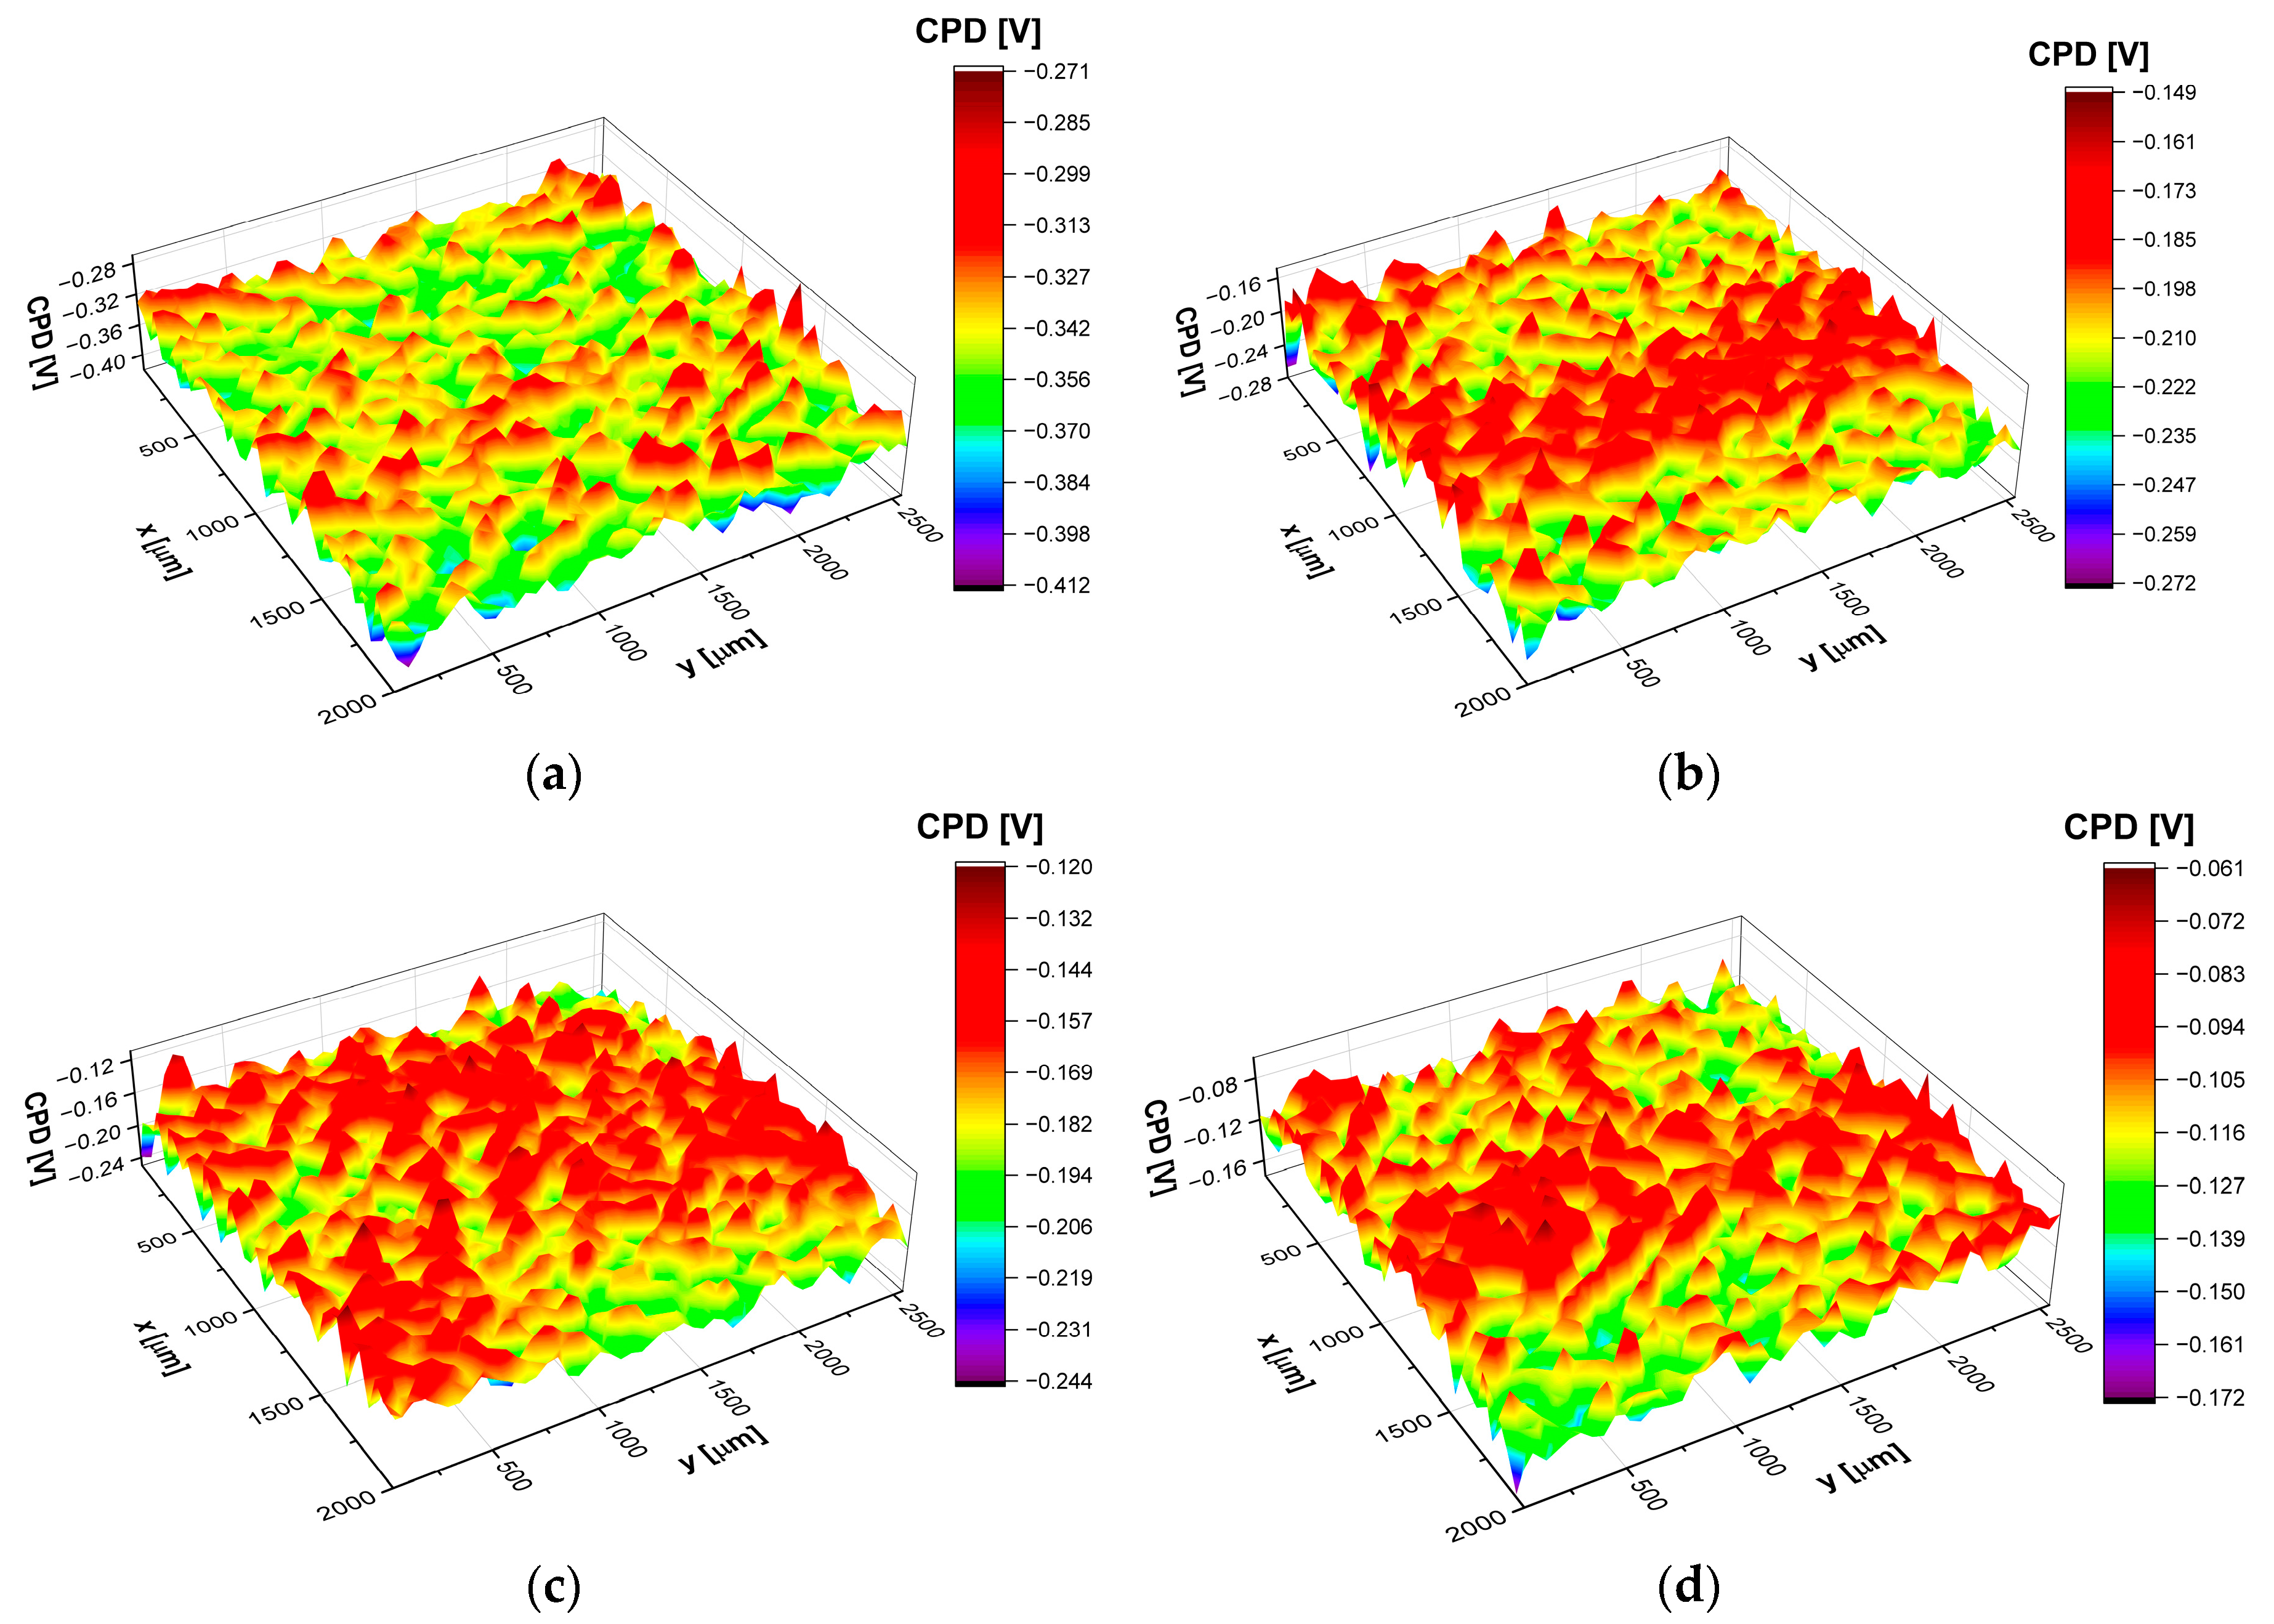
3.6. Scanning Kelvin Probe Study of the CoCrMo Alloy Surface
5. Conclusions
Author Contributions
Funding
Institutional Review Board Statement
Informed Consent Statement
Data Availability Statement
Conflicts of Interest
References
- Petković Didović, M.; Jelovica Badovinac, I.; Fiket, Ž.; Žigon, J.; Rinčić Mlinarić, M.; Čanadi Jurešić, G. Cytotoxicity of Metal Ions Released from NiTi and Stainless Steel Orthodontic Appliances, Part 1: Surface Morphology and Ion Release Variations. Materials 2023, 16, 4156. [Google Scholar] [CrossRef]
- Robles, D.; Brizuela, A.; Fernández-Domínguez, M.; Gil, J. Corrosion Resistance and Titanium Ion Release of Hybrid Dental Implants. Materials 2023, 16, 3650. [Google Scholar] [CrossRef] [PubMed]
- Correa-Rossi, M.; Romero-Resendiz, L.; Leal-Bayerlein, D.; Garcia-Alves, A.L.; Segovia-López, F.; Amigó-Borrás, V. Mechanical, Corrosion, and Ion Release Studies of Ti-34Nb-6Sn Alloy with Comparable to the Bone Elastic Modulus by Powder Metallurgy Method. Powders 2022, 1, 3–17. [Google Scholar] [CrossRef]
- Arakelyan, M.; Spagnuolo, G.; Iaculli, F.; Dikopova, N.; Antoshin, A.; Timashev, P.; Turkina, A. Minimization of adverse effects associated with dental alloys. Materials 2022, 15, 7476. [Google Scholar] [CrossRef]
- Dudek, K.; Dulski, M.; Łosiewicz, B. Functionalization of the NiTi shape memory alloy surface by HAp/SiO2/Ag hybrid coatings formed on SiO2-TiO2 glass interlayer. Materials 2020, 13, 1648. [Google Scholar] [CrossRef]
- Aniołek, K.; Łosiewicz, B.; Kubisztal, J.; Osak, P.; Stróż, A.; Barylski, A.; Kaptacz, S. Mechanical properties, corrosion resistance and bioactivity of oxide layers formed by isothermal oxidation of Ti–6Al–7Nb alloy. Coatings 2021, 11, 505. [Google Scholar] [CrossRef]
- Zatkalíková, V.; Halanda, J.; Vaňa, D.; Uhríčik, M.; Markovičová, L.; Štrbák, M.; Kuchariková, L. Corrosion Resistance of AISI 316L Stainless Steel Biomaterial after Plasma Immersion Ion Implantation of Nitrogen. Materials 2021, 14, 6790. [Google Scholar] [CrossRef] [PubMed]
- Szklarska, M.; Dercz, G.; Simka, W.; Łosiewicz, B. A.c. impedance study on the interfacial properties of passivated Ti13Zr13Nb alloy in physiological saline solution. Surf. Interface Anal. 2014, 46, 698–701. [Google Scholar] [CrossRef]
- Motoyoshi, M. (Ed.). Current Techniques and Materials in Dentistry, Publisher: MDPI AG, 2022; ISBN 3036544135.
- Givan, D.A. Precious metal alloys for dental applications. Precious Metals for Biomedical Applications 2014, 109–129. [Google Scholar] [CrossRef]
- Sinyakova, E.F.; Vasilyeva, I.G.; Oreshonkov, A.S.; Goryainov, S.V.; Karmanov, N.S. Formation of Noble Metal Phases (Pt, Pd, Rh, Ru, Ir, Au, Ag) in the Process of Fractional Crystallization of the CuFeS2 Melt. Minerals 2022, 12, 1136. [Google Scholar] [CrossRef]
- Stróż, A.; Dercz, G.; Chmiela, B.; Stróż, D.; Łosiewicz, B. Electrochemical formation of second generation TiO2 nanotubes on Ti13Nb13Zr alloy for biomedical applications. Acta Phys. Pol. 2016, 130, 1079–1080. [Google Scholar] [CrossRef]
- Łosiewicz, B.; Osak, P.; Maszybrocka, J.; Kubisztal, J.; Stach, S. Effect of autoclaving time on corrosion resistance of sandblasted Ti G4 in artificial saliva. Materials 2020, 13, 4154. [Google Scholar] [CrossRef]
- Padrós, R.; Giner-Tarrida, L.; Herrero-Climent, M.; Punset, M.; Gil, F.J. Corrosion Resistance and Ion Release of Dental Prosthesis of CoCr Obtained by CAD-CAM Milling, Casting and Laser Sintering. Metals 2020, 10, 827. [Google Scholar] [CrossRef]
- Uriciuc, W.A.; Boșca, A.B.; Băbțan, A.-M.; Vermeșan, H.; Cristea, C.; Tertiș, M.; Pășcuță, P.; Borodi, G.; Suciu, M.; Barbu-Tudoran, L.; Popa, C.O.; Ilea, A. Study on the Surface of Cobalt-Chromium Dental Alloys and Their Behavior in Oral Cavity as Cast Materials. Materials 2022, 15, 3052. [Google Scholar] [CrossRef] [PubMed]
- Kajzer, W.; Szewczenko, J.; Kajzer, A.; Basiaga, M.; Jaworska, J.; Jelonek, K.; Nowińska, K.; Kaczmarek, M.; Orłowska, A. Physical Properties of Electropolished CoCrMo Alloy Coated with Biodegradable Polymeric Coatings Releasing Heparin after Prolonged Exposure to Artificial Urine. Materials 2021, 14, 2551. [Google Scholar] [CrossRef]
- Mace; P. Khullar; C. Bouknight; J.L. Gilbert. Corrosion properties of low carbon CoCrMo and additively manufactured CoCr alloys for dental applications. Dental Materials 2022, 38, 1184–1193. [CrossRef]
- ISO 10271:2021; Dentistry — Corrosion test methods for metallic materials. ISO: Geneva, Switzerland, 2021.
- ISO 22674:2023-03; Dentistry — Metallic materials for fixed and removable restorations and appliances. ISO: Geneva, Switzerland, 2023.
- ISO 9693-1:2012; Dentistry — Compatibility testing - Part 1: Metal-ceramic systems. ISO: Geneva, Switzerland, 2012.
- ISO 13485:2016-04; Medical devices — Quality management systems — Requirements for regulatory purposes. ISO: Geneva, Switzerland, 2012.
- Available online:. Available online: https://www.tehnicaldent.ro/11606-wirobond-c (accessed on 10 October 2023).
- Available online:. Available online: https://gyenesdent.at/zahnersatz-gyor-ungarn (accessed on 10 October 2023).
- Available online:. Available online: https://bnb-dental.com/producto/wirobond-c-bego-por-1gr (accessed on 11 October 2023).
- ISO 10993-5:2009; Biological evaluation of medical devices — Part 5: Tests for in vitro cytotoxicity. ISO: Geneva, Switzerland, 2009.
- ISO 6507-1:2018-05; Metallic materials — Vickers hardness test — Part 1: Test method. ISO: Geneva, Switzerland, 2018.
- AFNOR/NF standard S90-701; Matériel médico-chirurgical — Biocompatibilité des matériaux et dispositifs médicaux — Méthodes d’extraction. French Standardization Association:: Paris, France, 1988.
- Boukamp, B.A. A Linear Kronig-Kramers transform test for immittance data validation. J. Electrochem. Soc., 1995, 142, 1885–1894. [Google Scholar] [CrossRef]
- Branzoi, I.V.; Iordoc, M.; Codescu, M.M. Corrosion behaviour of CoCrMo and CoCrTi alloys in simulated body fluids. UPB Scientific Bulletin, Series B: Chemistry and Materials Science 2007, 69, 11–18. [Google Scholar]
- Łosiewicz, B.; Osak, P.; Górka-Kulikowska, K. Electrophoretic Deposition of Multi-Walled Carbon Nanotubes Coatings on CoCrMo Alloy for Biomedical Applications. Micromachines (under review).
- Lasia, A. Electrochemical Impedance Spectroscopy and Its Applications; Springer Science + Business Media: New York, NY, USA, 2014; ISBN 978-1-4614-8932-0. [Google Scholar]
- Okamoto, G. Passive film of 18-8 stainless steel structure and its function. Corrosion Science, 1973, 13, 471–489. [Google Scholar] [CrossRef]
- Atlas of Eh-pH diagrams. Intercomparison of thermodynamic databases. Geological Survey of Japan Open File Report No.419.

| Parameter | Value |
|---|---|
| Type (accord. to ISO 22674) | 4 |
| Density | 8.5 g cm3 |
| Preheating temperature | 9001,000 °C |
| Solidus, liquidus temperature | 1,360 °C, 1,420 °C |
| Casting temperature | 1,500 °C |
| Young’s modulus | 180 GPa |
| Proof strength (Rp0.2) | 440 MPa |
| Ultimate strength (Rm) | 780 MPa |
| Elongation after fracture | 16 % |
| Vickers hardness | 310 HV10 |
| Coefficient of thermal expansion (CTE) 25500 °C, 106 K1 |
14.3 |
| Number of measurement | Sample 1 [μHV0.3] |
Sample 2 [μHV0.3] |
|---|---|---|
| 1 | 432 | 468 |
| 2 | 415 | 418 |
| 3 | 505 | 414 |
| 4 | 475 | 456 |
| 5 | 450 | 488 |
| 6 | 404 | 472 |
| 7 | 410 | 453 |
| 8 | 440 | 401 |
| 9 | 467 | 417 |
| 10 | 480 | 443 |
| Average value | 445 | |
| Standard deviation | 31 | |
| Electrolyte Type | R1 (Ω cm2) |
CPE1-T (F cm−2 sφ1) |
CPE1-φ | R2 (Ω cm2) |
Cdl (F cm−2) |
|---|---|---|---|---|---|
| Saliva pH = 7.4 [30] | 11.72(92) | 0.74(9) × 10−5 | 0.880(14) | 3.71(21) × 104 | 4.11 × 10⁻⁶ |
| Saliva pH = 5.5 | 10.33(65) | 0.24(2) × 10−5 | 0.720(6) | 6.6(11) × 104 | 7.72 × 10⁻⁶ |
| Saliva pH = 7.4 + 0.1 M NaF | 12.13(63) | 0.14(12) × 10−4 | 0.862(8) | 4.10(35) × 105 | 7.00 × 10⁻⁶ |
| Saliva pH = 5.5 + 0.1 M NaF | 9.64(61) | 0.37(3) × 10−5 | 0.820(10) | 2.71(16) × 104 | 7.77 × 10⁻⁷ |
| Saliva pH = 7.4 + 15 mL Listerine® | 7.79(32) | 0.83(4) × 10−5 | 0.843(4) | 1.59(16) × 106 | 5.26 × 10⁻⁶ |
| Saliva pH = 7.4 + 15 mL Meridol® | 27.43(35) | 0.27(6) × 10−5 | 0.800(16) | 1.03(29) × 106 | 9.97 × 10⁻⁷ |
| Saline pH = 7.4 | 6.39(34) | 0.14(9) × 10−4 | 0.881(5) | 1.43(17) × 106 | 7.81 × 10⁻⁶ |
| Electrolyte type | CPDav [mV] |
CPDrms [mV] |
CPDsk | CPDku |
|---|---|---|---|---|
| saliva pH = 7.4 | −346.3 | 18.6 | 0.001 | 0.10 |
| saliva pH = 5.5 | −112.6 | 16.5 | 0.05 | −0.14 |
| saliva pH = 7.4 + 0.1 M NaF | −172.7 | 17.7 | −0.06 | 0.04 |
| saliva pH = 5.5 + 0.1 M NaF | −169.3 | 16.4 | −0.12 | 0.06 |
| saliva pH = 7.4 + 15 mL Listerine® | −306.0 | 21.0 | 0.17 | 0.13 |
| saliva pH = 7.4 + 15 mL Meridol® | −204.6 | 17.5 | −0.07 | 0.21 |
| saline pH = 7.4 | −235.6 | 16.6 | −0.08 | 0.11 |
Disclaimer/Publisher’s Note: The statements, opinions and data contained in all publications are solely those of the individual author(s) and contributor(s) and not of MDPI and/or the editor(s). MDPI and/or the editor(s) disclaim responsibility for any injury to people or property resulting from any ideas, methods, instructions or products referred to in the content. |
© 2023 by the authors. Licensee MDPI, Basel, Switzerland. This article is an open access article distributed under the terms and conditions of the Creative Commons Attribution (CC BY) license (http://creativecommons.org/licenses/by/4.0/).


