Introduction
In the process of organ donation, it is essentially the immunological criteria that mark the selection process, attempting a correct donor-recipient matchin, since better graft survival has been demonstrated at fewer incompatibilities. When the number of Human Leukocyte Antigen (HLA) system incompatibilities increases, in turn increases the risk of developing specific donor anti-HLA-mediated rejection that may lead to reduced graft survivance.1,2 This immunological criterion determines both the type and intensity of immunosuppressive therapy, in an attempt to prevent the development of anti-HLA antibodies after transplantation, or to minimize their effect if developed. Thus, in a way, the immunological criterion is "modifiable" after transplantation.
However, at the time of selection of the donor-recipient pair, there are inherent characteristics to both, which are not modifiable later, and which can also influence the evolution of the graft. Among these characteristics in kidney transplantation are age, sex and body mass index (BMI). Several studies have evaluated the influence of different donor-recipient matching on these variables, finding different renal graft evolutions depending on the matching performed.3-5 The different evolutions according to these variables will be linked to the nephron load provided by the donated kidney, depending on whether it will be sufficient to maintain normal renal functions in the recipient depending on its characteristics. A donor-recipient mismatch in these variables may result in the contribution by the donated kidney of a nephron burden insufficient for the characteristics of the recipient, unable to perform normal renal functions.6
Most studies evaluate the influence of these variables on the evolution of the graft separately, or associating some of them, using criteria of renal graft functionality that may not be adequaty.3 Have a score with these three variables combined, similar to that obtained with the donor-HLA matching, could provide useful information in making the most correct decision during the donation process in order to try to achieve the best possible kidney function in the long term.
Materials and Methods
Study Description
A retrospective cohort study was conducted including all renal transplant recipients from January 2013 to June 2020 who had at least one year of follow-up, excluding patients with double transplantation and living donors.
Clinical and Analytical Variables
The following variables were collected: sex, age, weight and height of the donor and the recipient, and the BMI was calculated from the last two. Type of pre-transplant dialysis, type of immunosuppression used, steroid doses accumulated during the first year (equivalent doses of prednisone), chronic kidney disease diagnoses, history of diabetes mellitus prior to transplantation or development of the same one year after transplantation, number of HLA incompatibilities, time on dialysis prior to transplantation, previous transplant history, type of donation (excluding live donor transplantation), development of rejection, delayed graft function (understood as the need for hemodialysis during immediate post-transplantation), and development of BK virus infection. At the end of the follow-up, estimated glomerular filtration (FGe) was calculated using the CKD-EPI formula.
According to the mismatches in donor-recipient matchings in age, sex and BMI, a ranking of 0 to 2 points was awarded in each of the variables, with a higher rank due to greater disparity between donor and recipient (
Table 1). Subsequently, a combined Score was created with the combination of points from the previous ranking, which could have values between 0 and 6 points (
Table 2). The combined Score of each of the variables, was made with subjective criteria and taking into account the results of the studies published to date, evaluating the suitability of this score to what was observed in our sample, basically guiding the scoring process the theoretical nephron load provided by the donated kidney according to the characteristics of the receptors. In the sex variable, 0 points were awarded to the donor-recipient combination of "Male to Male" and "Female to Female". 1 point when the donation was made from "Male to Female", and 2 points when it was made from "Female to Male". For the variable age, the difference between donor and recipient was calculated, giving 0 points when the donor was 5 years or younger than the recipient (donor younger than the recipient), 1 point when the difference between donor and recipient was less than 5 years (donor as well as recipient), and 2 points when the recipient was 5 years or younger than the donor (recipient younger than the donor). In the BMI variable, the value of 30 kg/m2 (from which obesity is considered according to the WHO) was used as a reference value for the comparison. A donor with a BMI greater than 30 kg/m2 that has been evaluated and is considered optimal as a donor, implies the absence of proteinuria and normal renal function, thus translating into an adequate nephron charge that prevents hyperfiltration maintaining normal kidney function. 0 points were awarded when the donation was made from a donor with a BMI higher than 30 kg/m2 to a recipient with a BMI lower than 30 kg/m2 (non-obese donor-obese recipient), or when both donor and recipient had a BMI lower than 30 kg/m2; 1 point when both donor and recipient had BMI greater than 30 kg/m2, and 2 points when donation was made from a donor with a BMI lower than 30 kg/m2 to a recipient with a BMI greater than 30 kg/m2 (non-obese recipient-donor obese).
Statistical Analyses
Quantitative variables are expressed as mean and standard deviation (SD), or as median and interquartile range (IQR) according to data normality. Categorical variables are expressed as number and percentage of the total or within each category.
The comparison of means between two groups was evaluated by the T-Student statistic, or by Mann-Whitney U according to the case. The comparison of means between more than two groups was made by ANOVA of a factor. The categorical variables were compared using the Chi-Square, Fisher’s Exact Test or Likelihood Ratio tests according to the case, in addition to assessing the significance of the Linear Trend.
The influence of the combined Score on the renal function of the graft at the end of follow-up was analyzed by multivariate linear regression, adjusted to the rest of the variables, censoring the death of the patient with functioning graft.
Statistically significant p < 0.05 was considered. The data were analyzed using the statistical program SPSS 26.0 for Windows.
Results
Sample Characteristics
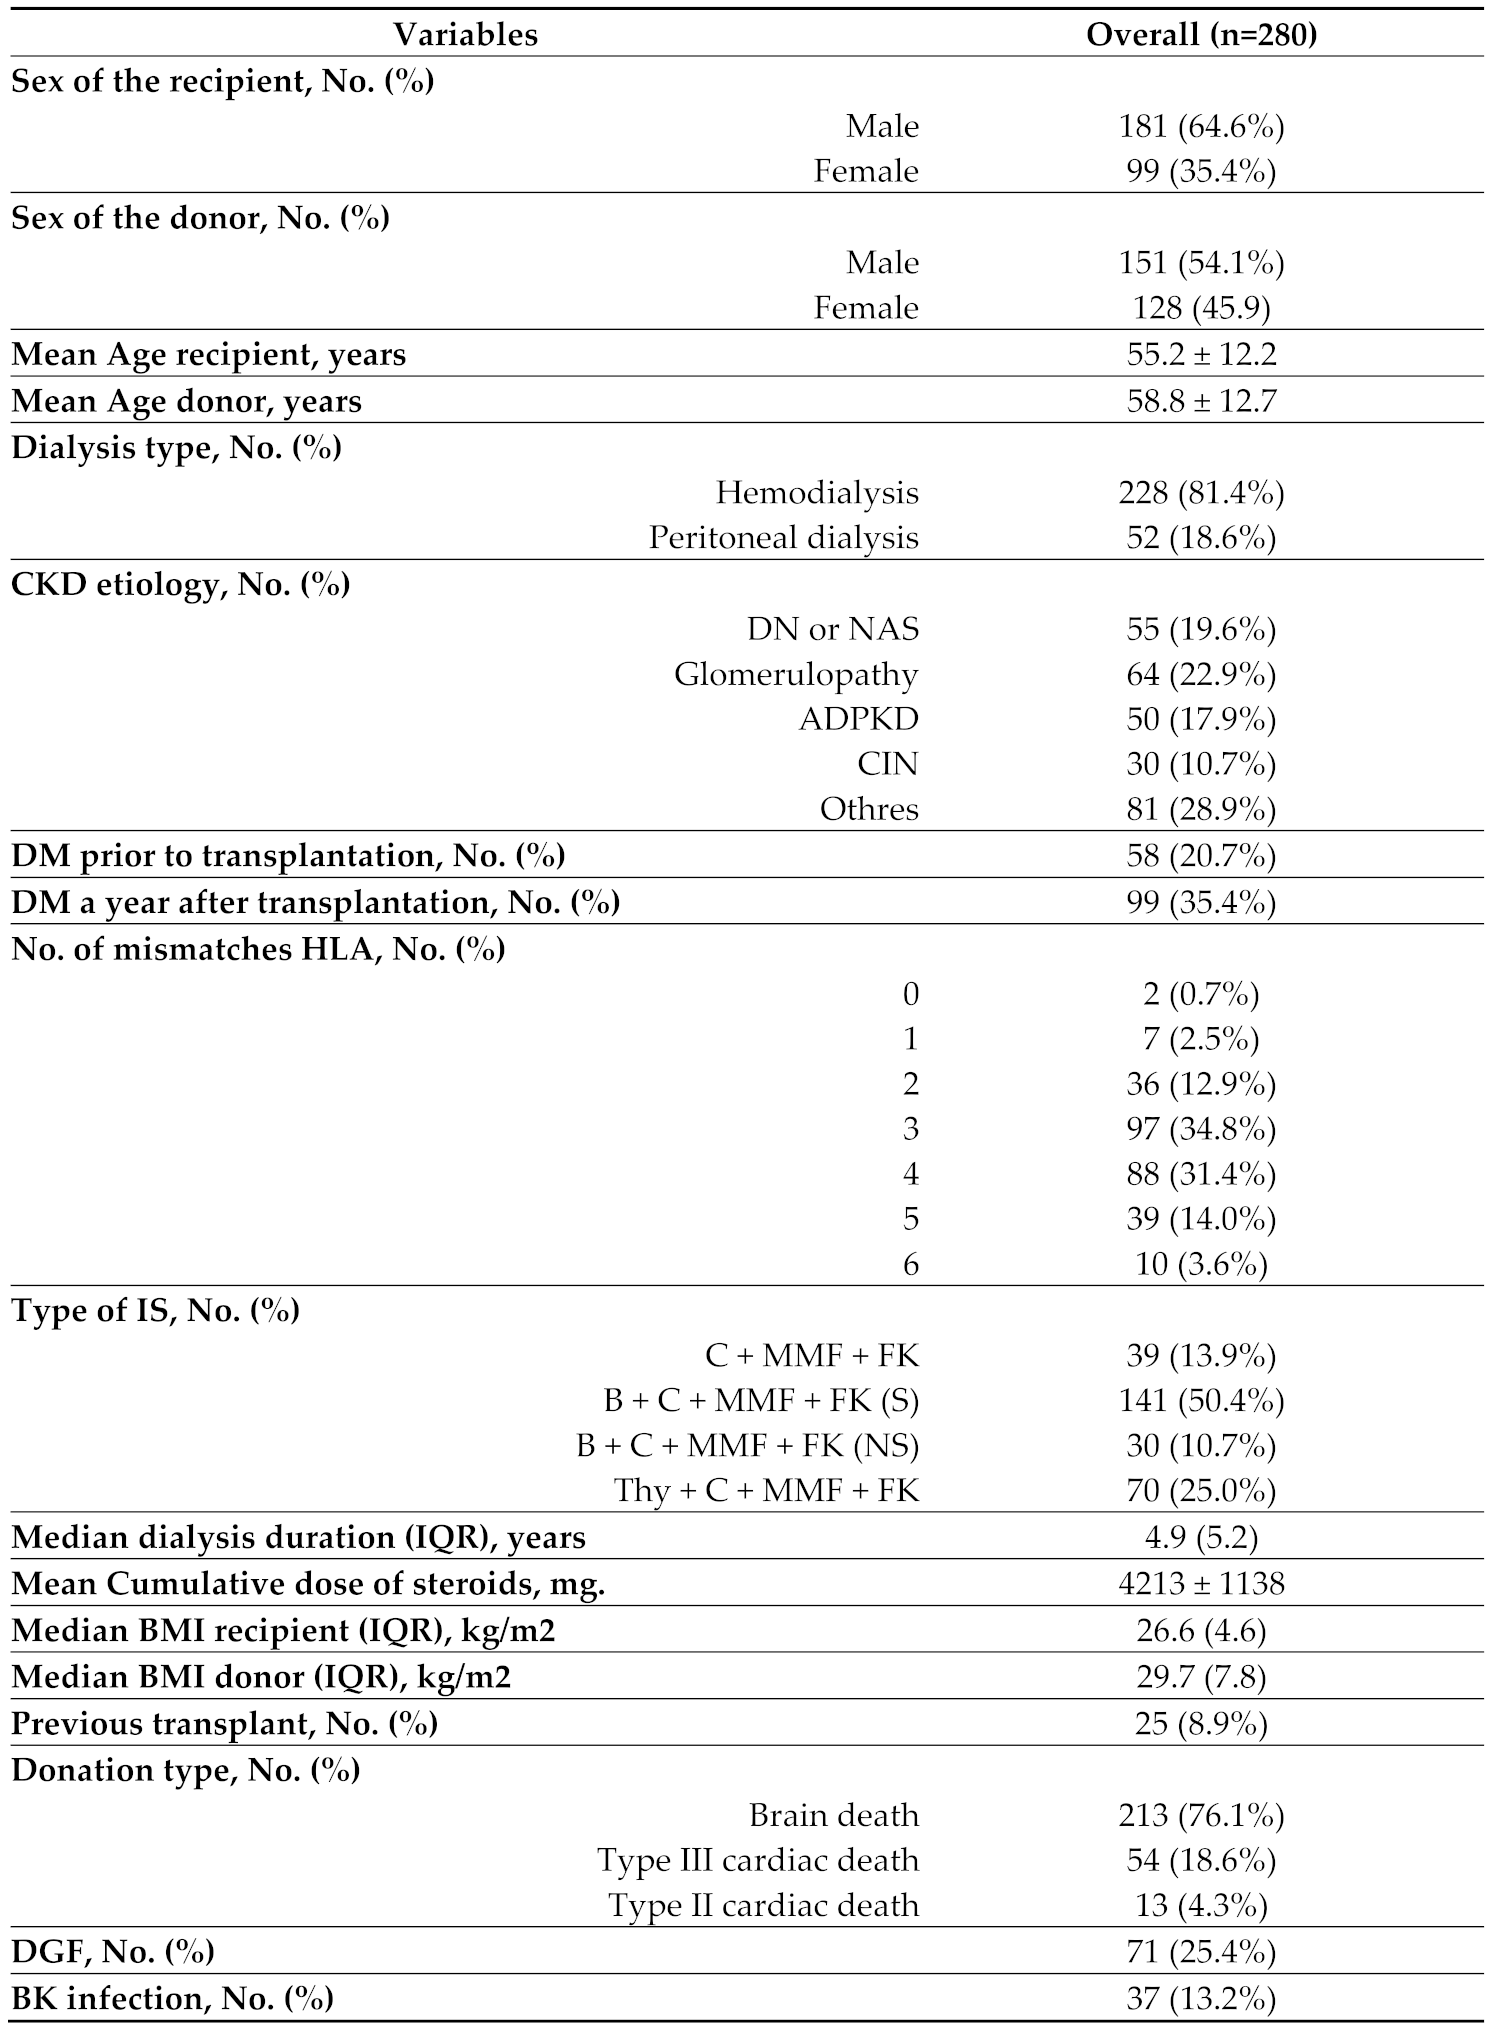
During the study period 280 patients were included, with a median follow-up of 4.3 years. The characteristics of the sample can be seen in
Table 3.
At the end of the follow-up, the mean of the eGF was 49.1 ml/min/1.73m2. 34 patients (12.1%) returned to dialysis during follow-up and 23 (8.2%) died with a functioning graft. There were no statistically significant differences in follow-up time between the groups created.
There was a predominance of males in recipients (181, 64.6%), while in donors the distribution was similar between men and women 54.1% vs. 45.9% respectively. There was a difference of 3.6 years in favor of donors: 58.8 years, compared to 55.2 years for recipients. Some 36.3 per cent of donors were obese, while only 22.1 per cent of recipients were obese.
Individual Analysis of Age, Sex and BMI Variables
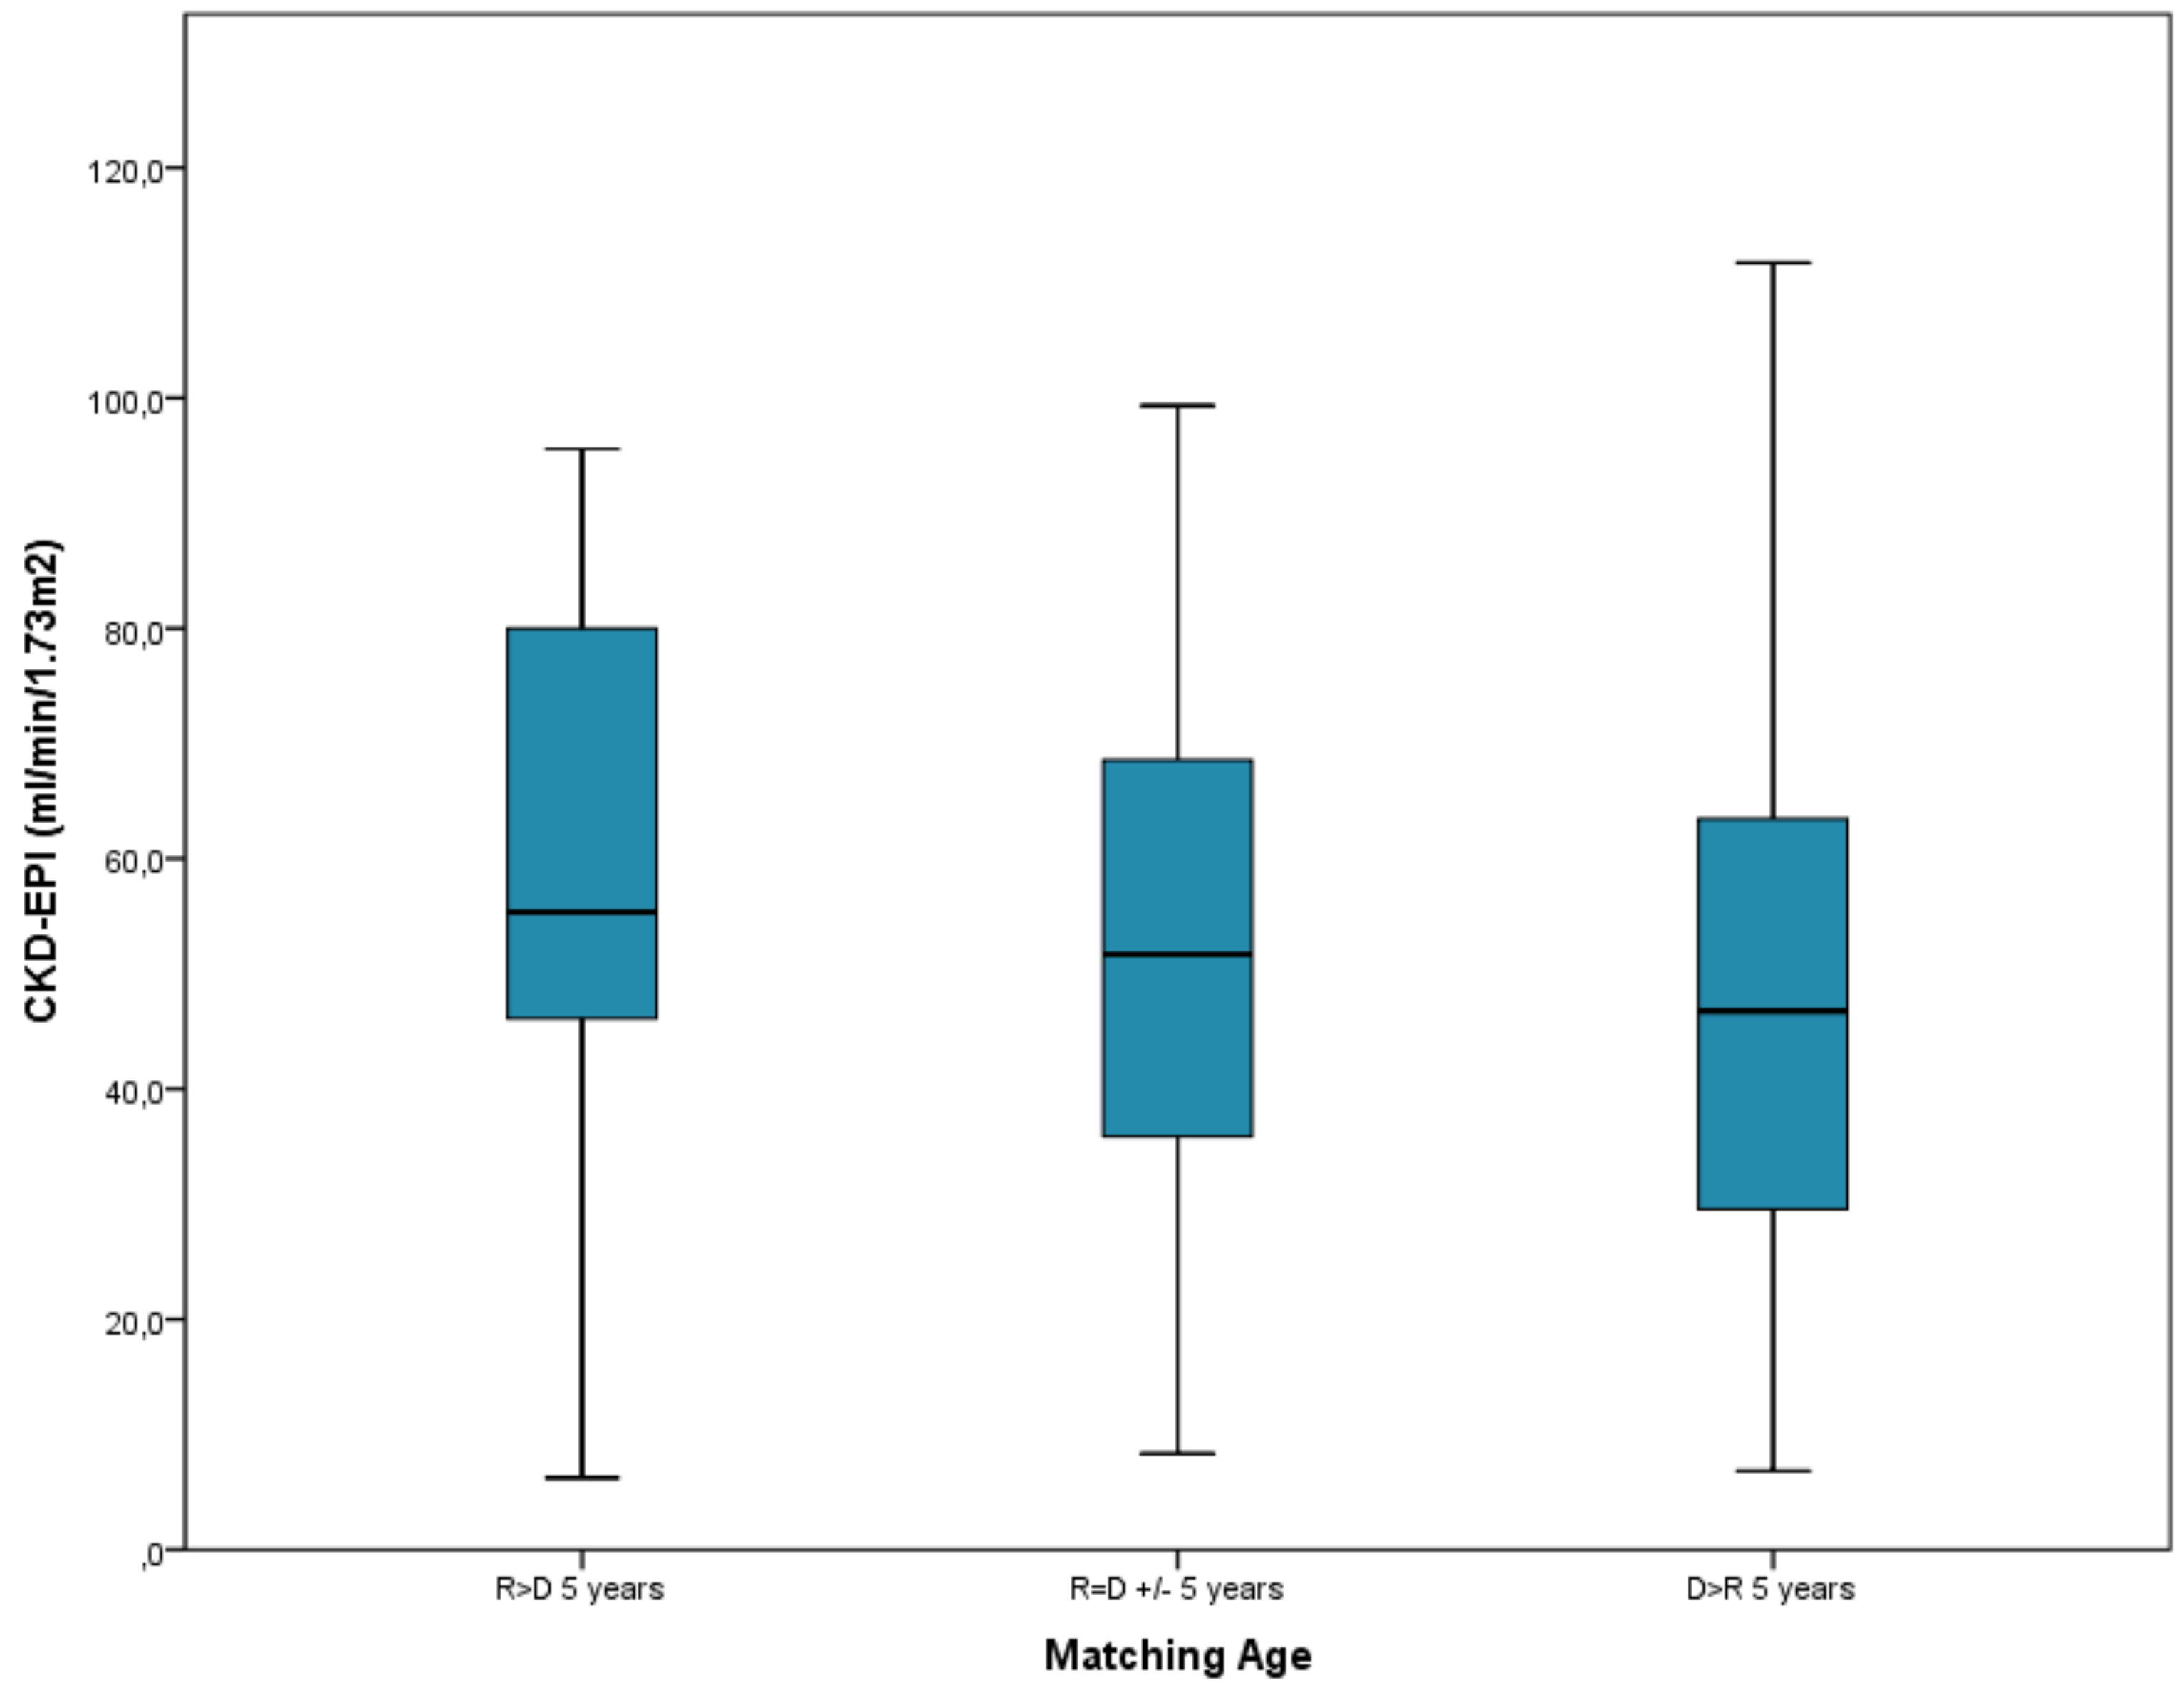
Regarding the age variable, as the score resulting from pairing increased, renal function worsened, with a statistically significant Linear Trend test (P = .01), with the worst renal function at the end of follow-up in the group of patients where recipients were younger than donors in 5 years or more with 47.5 ml/min, compared with 59.2 ml/min in the group where donors were younger than recipients in 5 years or more, P = .01 (
Figure 1).
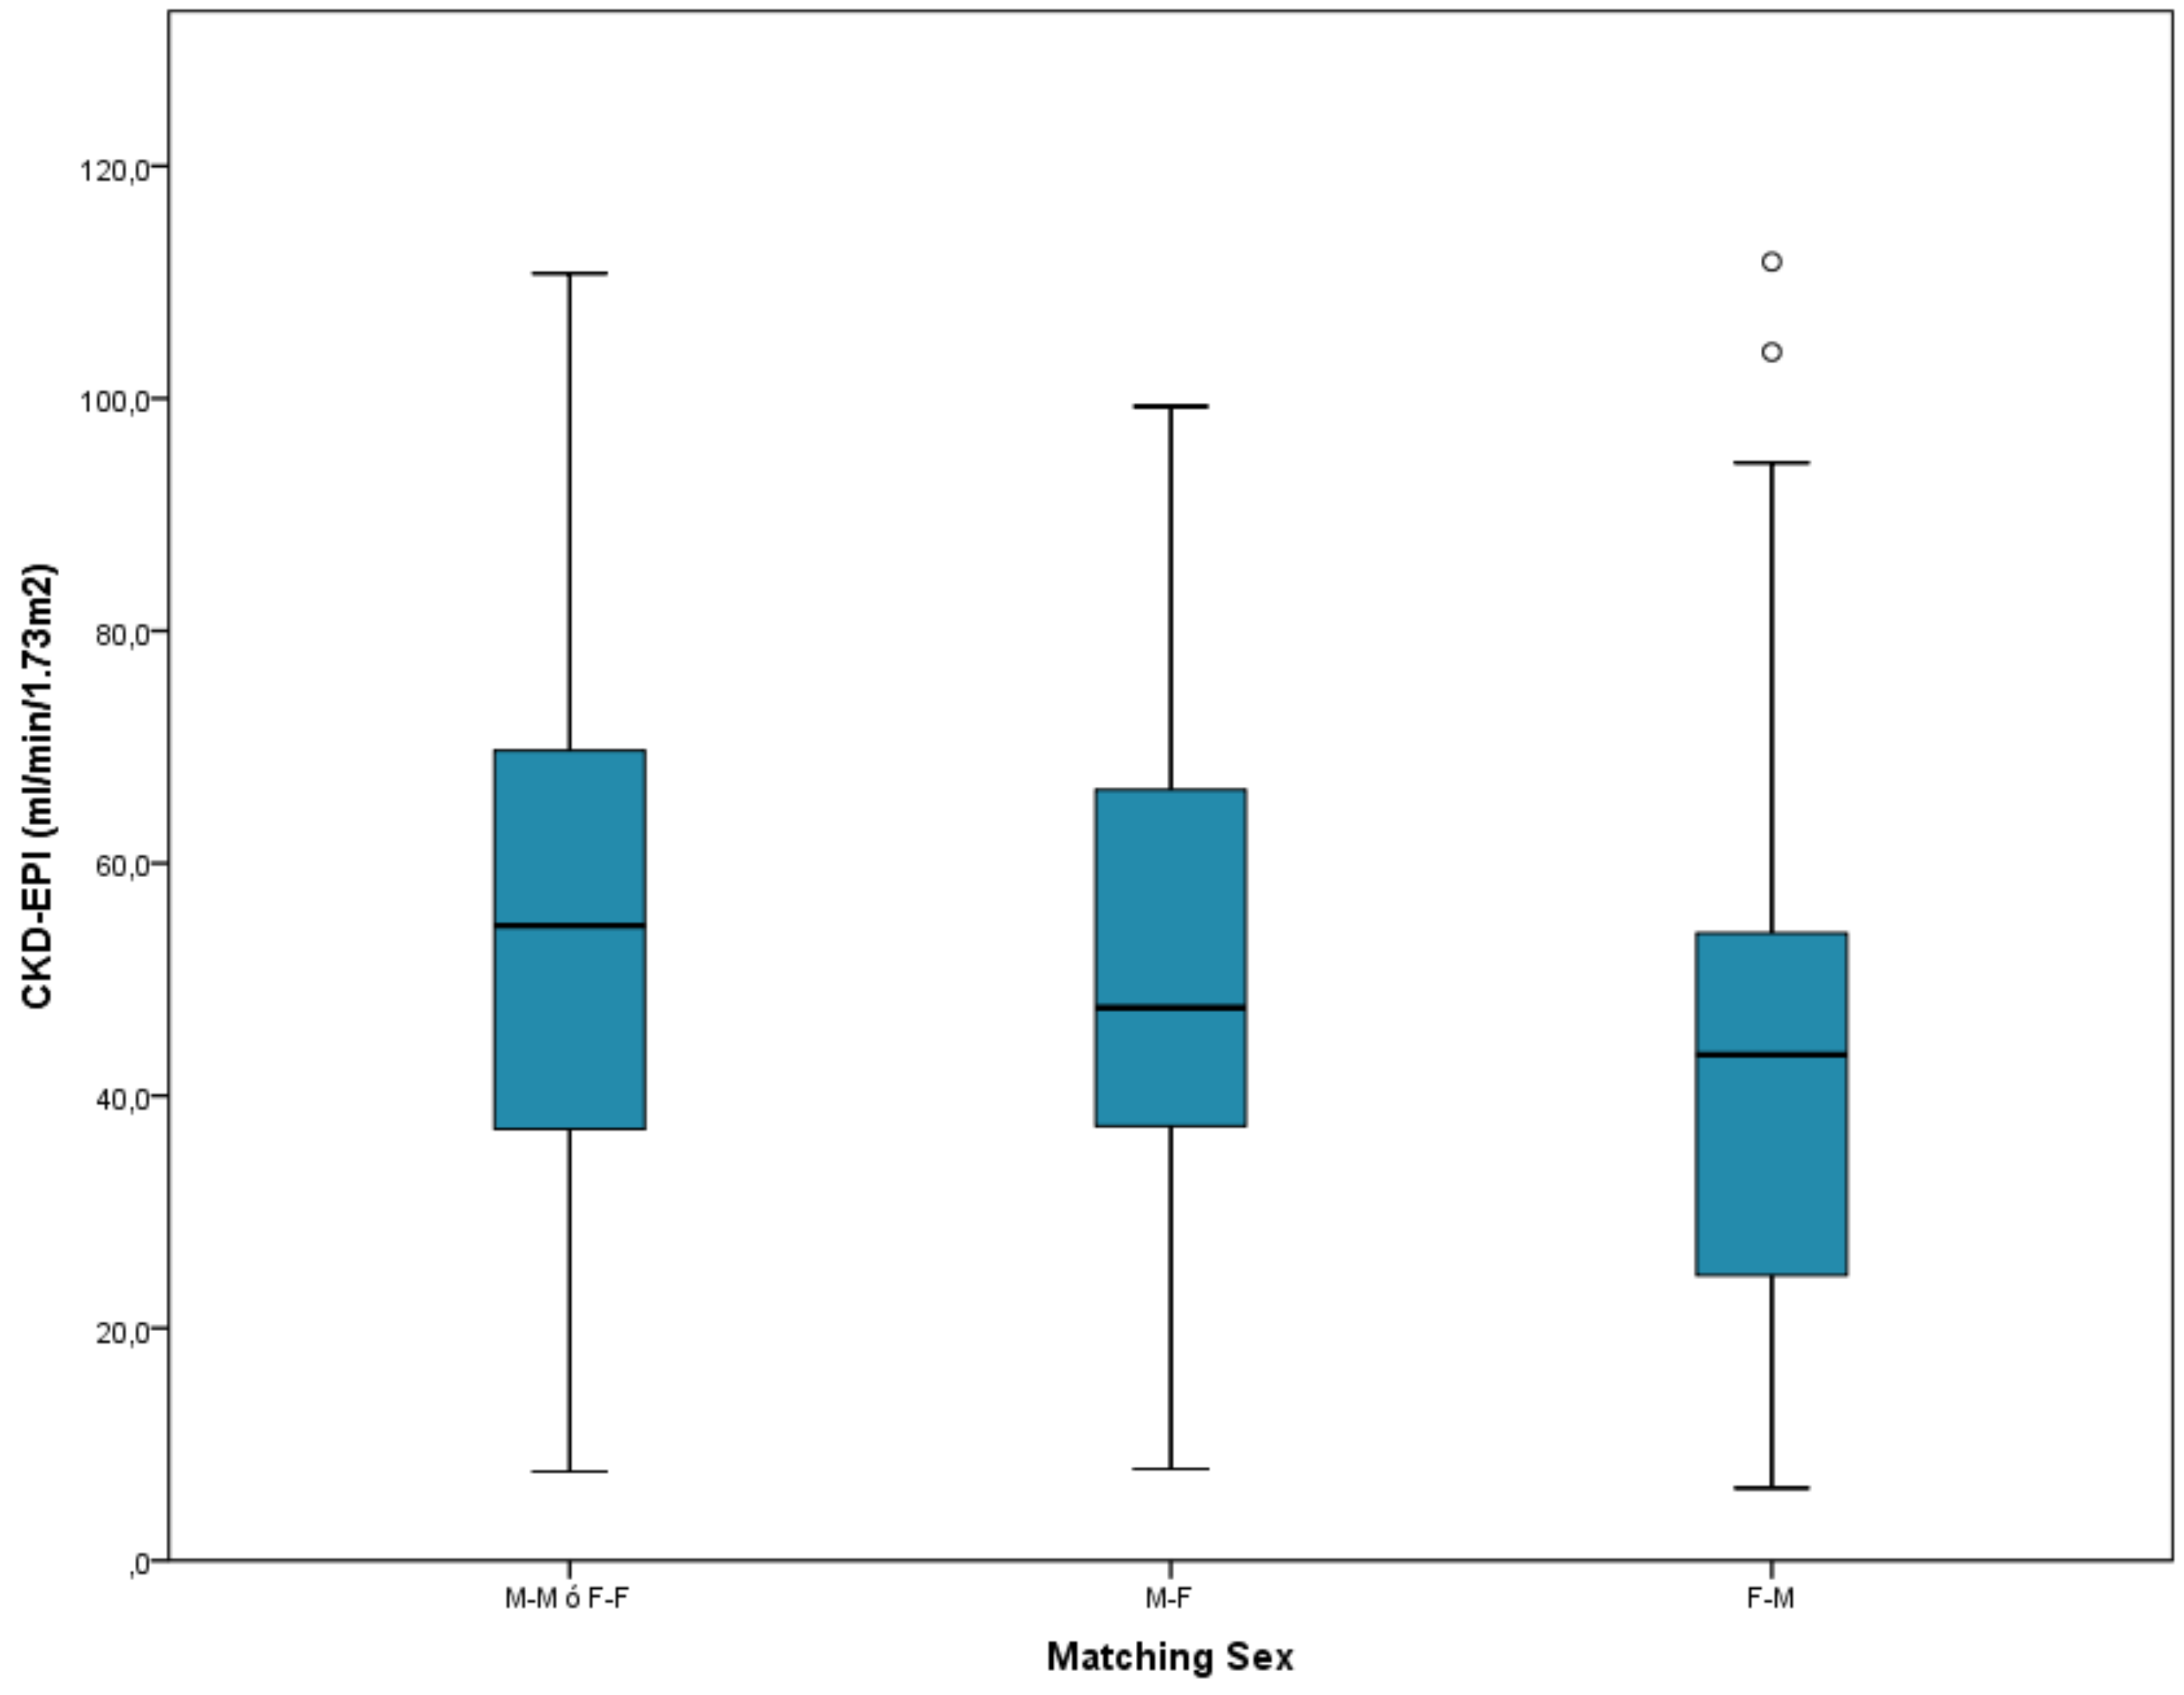
The donor-recipient matching in the sex variable was mainly from male to male or female to female, with 130 recipients. Worse renal function was observed as the matching ranking increased, with a statistically significant Linear Trend test (P = .026), obtaining 53.2 ml/min mean for rank with 0 points (male to male, or female to female), versus 44.1 ml/min mean for rank with 2 points (female to male), P = .026 (
Figure 2).
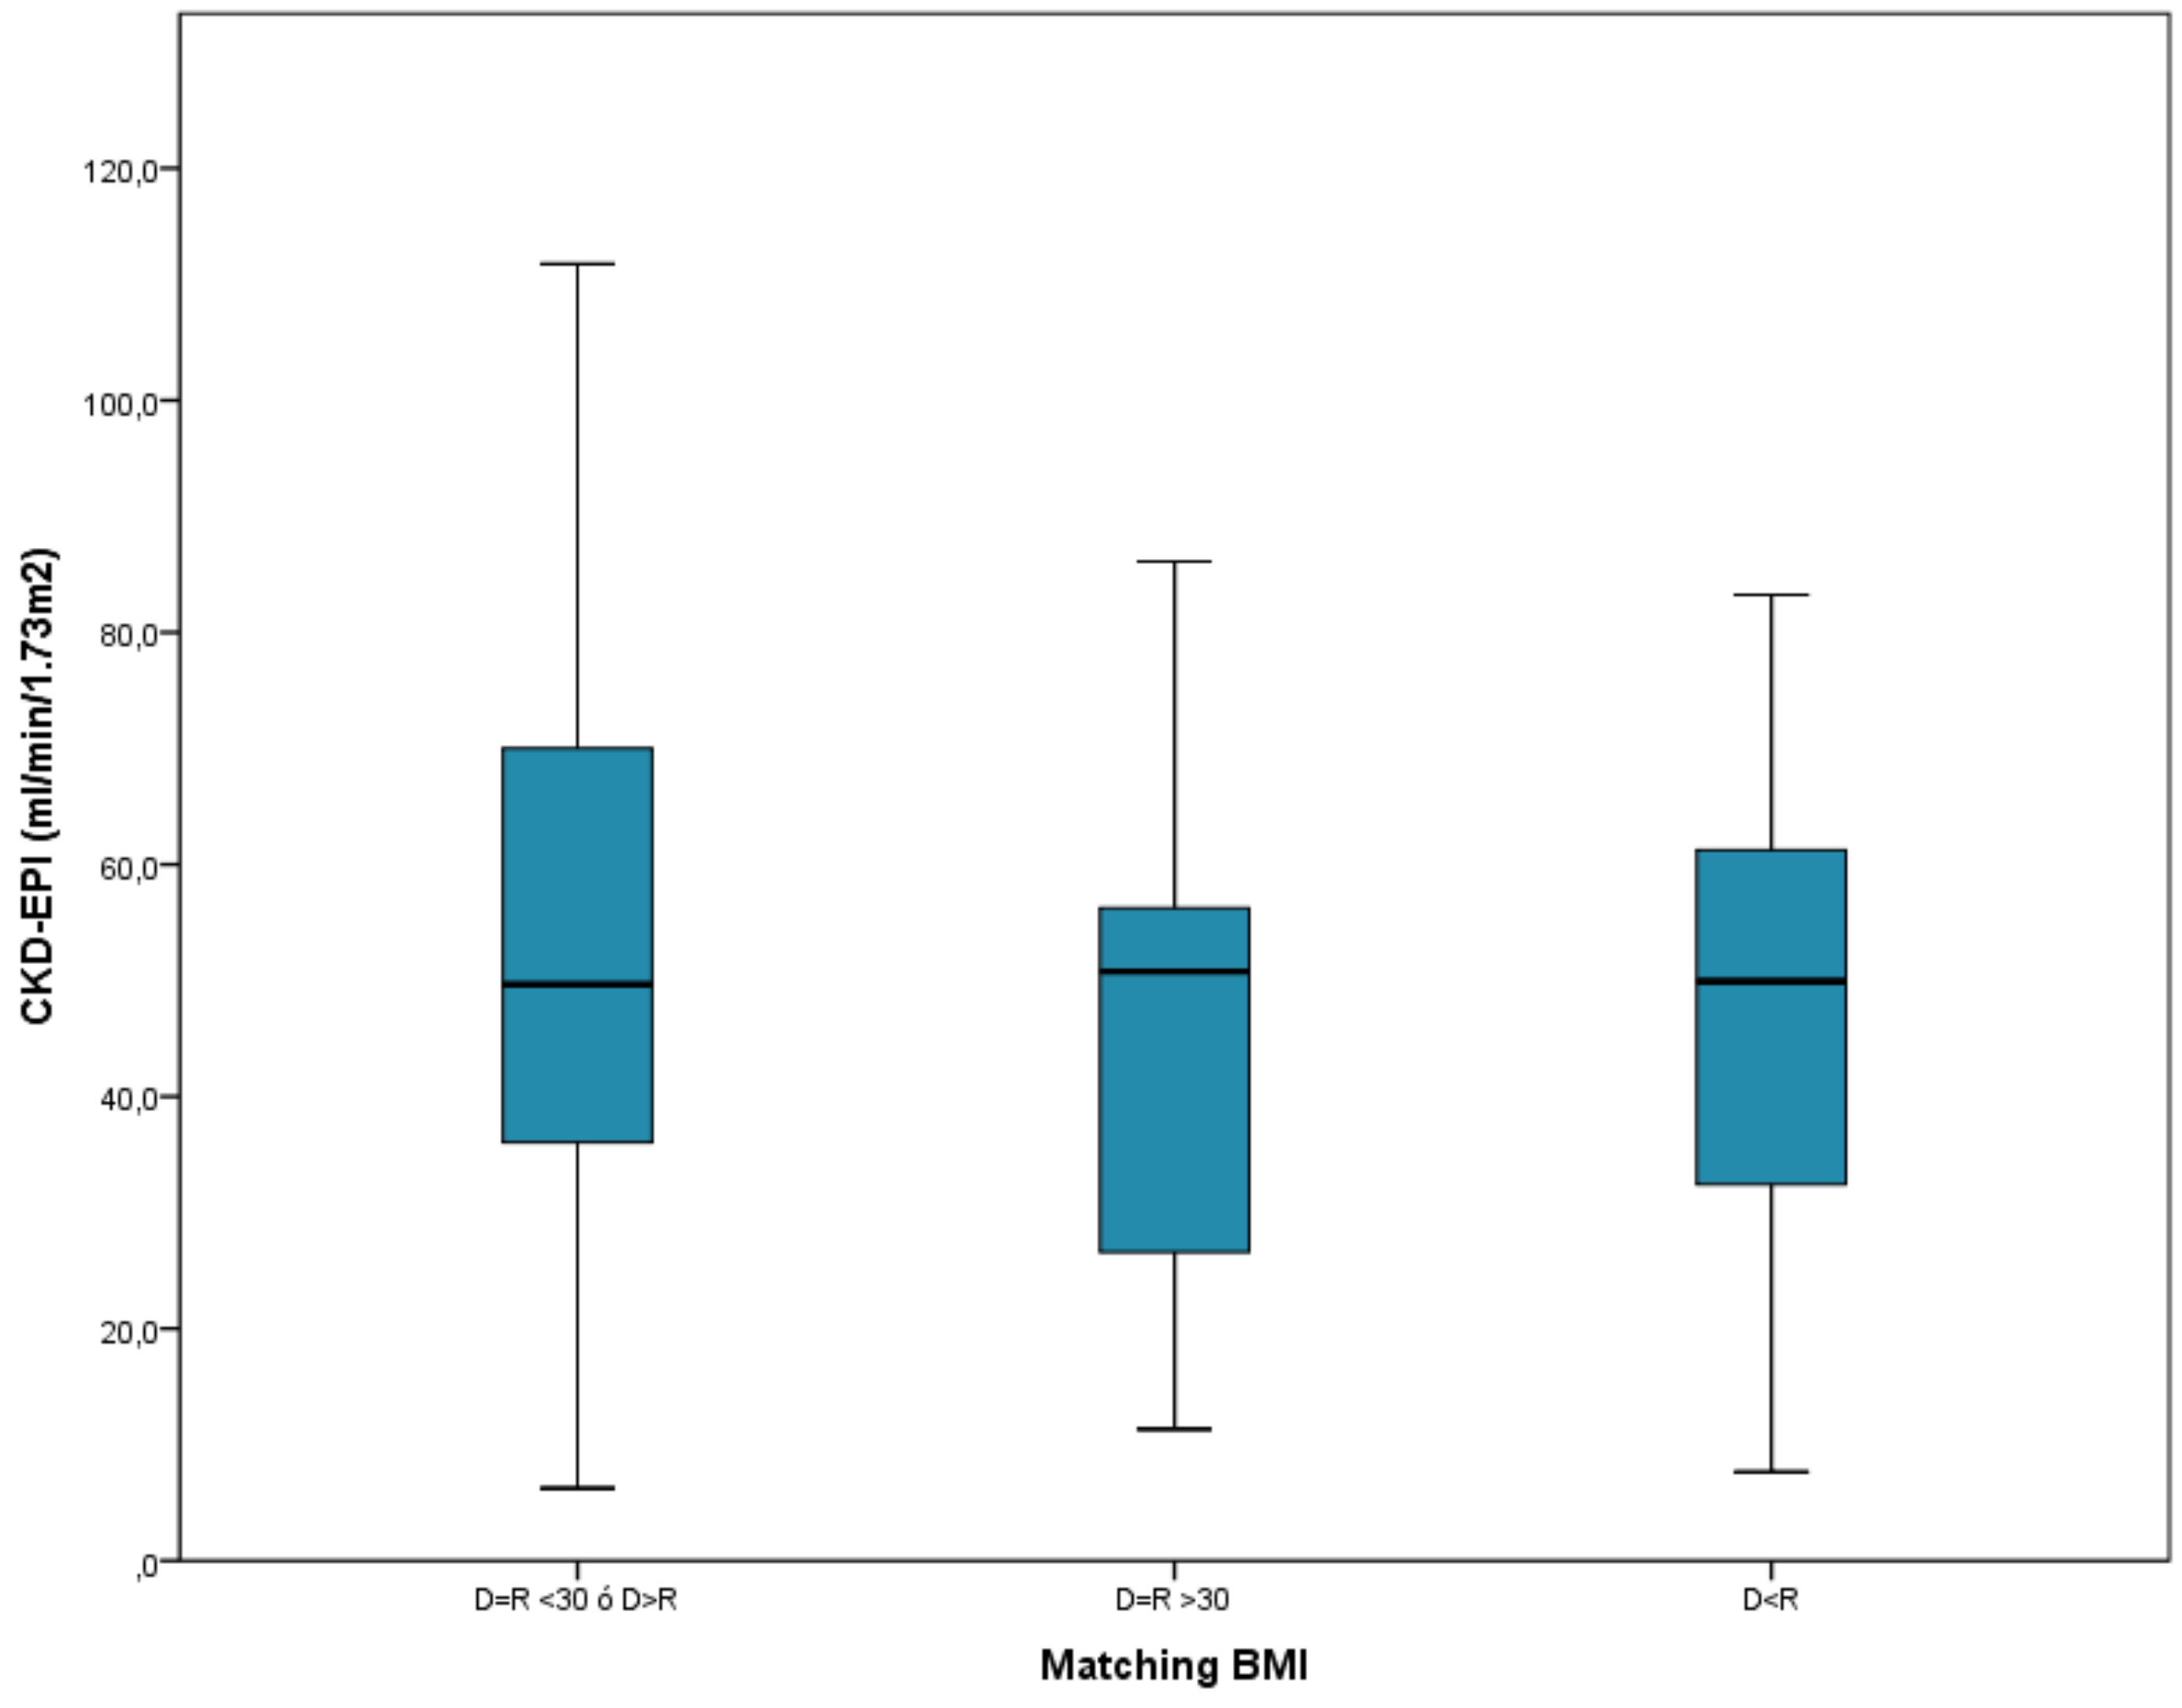
The group where the donor was obese and not the recipient, or where both donor and recipient were not obese, was the majority in the BMI matching, with 193 patients. This group with 0 points had the best renal function at the end of follow-up, with 52.3 ml/min on average, compared to the group where the recipient was obese without being the donor, with 46.3 ml/min, although the difference was not statistically significant (P = .257). Nor was the Linear Trend test statistically significant (
Figure 3).
Age-Sex-BMI Combined Analysis
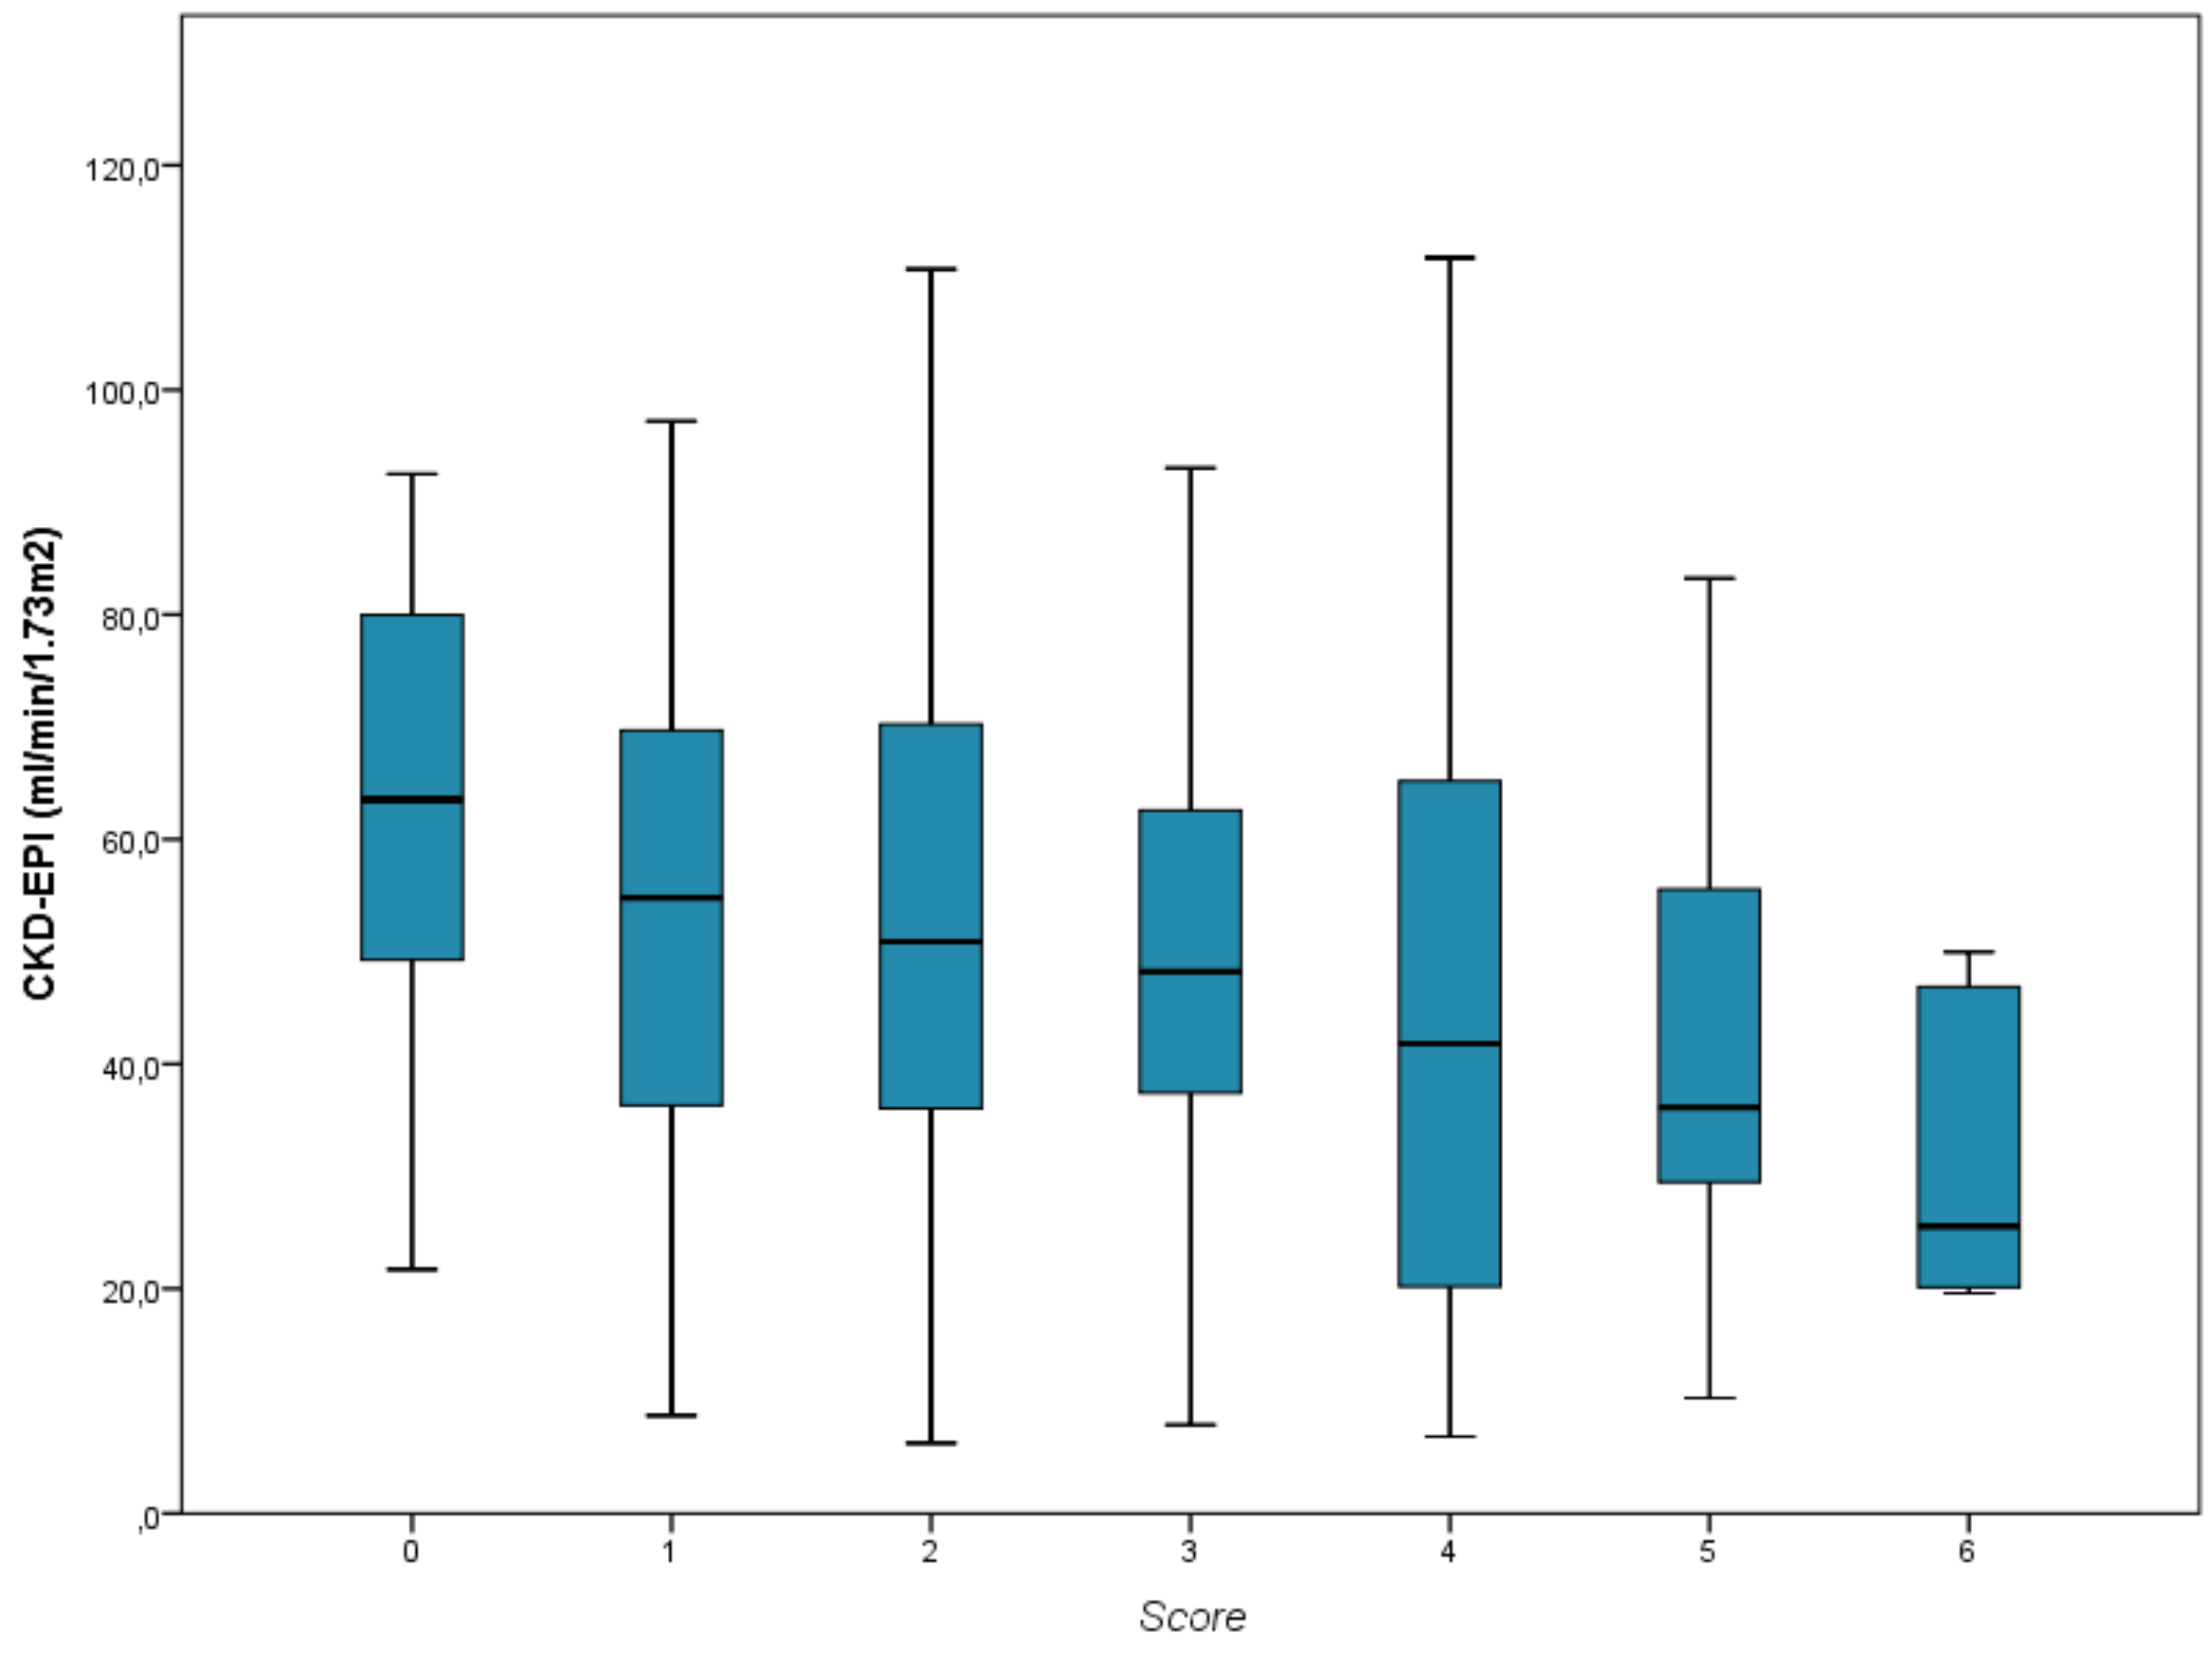
In the analysis of the influence of the combined Score on the graft function, a worse renal function was observed as the Score increased, with a statistically significant Linear Trend test (P = .002) (
Figure 4). In the multivariate linear regression analysis adjusted for the rest of the confounding variables, a fall of 2.4 ml/min was found for each Score increase (95% CI: 0.4 to 4.4 ml/min, P = .018).
Discussion
In our study, we showed that an inadequate donor-recipient matching in age, sex and BMI, correlates with worse graft function as the mismatch in these characteristics increases. With the points obtained from the combination of the different matching in these variables, we elaborated a Score which correlates with a worse renal function at the end of the follow-up as its range increases. Taking this Score into account during the donation process can be useful for a correct donor-recipient pairing, beyond HLA compatibility, in order to try to achieve the best possible renal function in the long term. While the effect of donor-recipient HLA incompatibilities may later be modified with the use of immunosuppressive therapy, the above variables are not modifiable, except perhaps the recipient’s BMI.
Until now, few studies had evaluated the influence of pairing in these three variables between donor and recipient in the evolution of the graft. Unlike our work, Baddiri et al. used serum creatinine values as a marker of renal function, with a follow-up of patients as young as 12 months, and performing a statistical analysis without adjusting to other possible variables that may condition the evolution of the graft.3 In other studies, however, they analyze only the influence of donor characteristics on the evolution of the graft, without taking into account matching with the recipient, finding that kidney receptors from elderly and female donors, have worse kidney function than those from young donors or male sex.7,8 This reasoning, which seems logical, is why we have guided ourselves to award the different scores in the three variables to study, although there are studies that do not find significant differences in the evolution of the graft according to the sex combination between donor and recipient, but carried out in a population of living donors, with a much lower age than our sample, and not comparable with BMI.9
One of the characteristics inherent to these variables that could determine better or worse renal function is the nephron load. The influence of the nephron load brought by the donated kidney on graft function has been demonstrated years ago. A lower nephron load means worse kidney function. Ancient studies have shown different nephron loads depending on the characteristics of the patients studied. Thus, elderly or female patients have lower nephron mass.7,10-12 Since not all obese patients have impaired renal function, it suggests that a low nephron load at birth in certain patients who suffer obesity in adulthood, is behind impairment of renal function due to obese glomerulopathy;13,14 a decrease in body mass index in these patients is associated with an improvement in renal function.15 Therefore, an obese patient, who does not present deterioration of renal function, and who is therefore selected as a potential donor, we can assume that presents a nephron load at least adequate.
Matching a recipient with a certain donor that may have a probable low nephron load according to these variables, not according to the characteristics of the first, may imply a worse long-term renal function of the graft.
The main point of contention of our work in the creation of this Score, lies in the score given to each of the groups. This score was carried out mainly according to the probable nephron load provided by the donated kidney according to the characteristics of the recipient. Previous studies show that selecting small donors for large recipients, with also imbalances in sex, means worse renal function.16 Thus, although some authors find worse renal function when the donation is made from man to woman in relation to a probable higher number of rejection in this group of patients, compared to other combinations,17,18 this worse evolution is compensated when the donated kidney comes from a male donor with higher BMI by providing a theoretical higher nephron burden.19 For this reason, we understand that the nephron load provided by a male donor, or a female donor, to a recipient of the same sex, fits the characteristics of the latter, and only the mismatch would be modified, as far as nephron load is concerned, by age or BMI, variables that are also part of the Score and therefore adjust the pairing. Similarly, although univariate analysis did not find statistically significant differences in the groups created from pairing as a function of donor-recipient BMI, similar to what was observed in other studies,8,20 we decided to include this variable in the final creation of the Score since the BMI may be different depending on both the sex and the age of the patients.
Several are the limitations of our study, highlighting the small sample size, being performed in a single center, and with patients all of them of Caucasian race, the latter factor that can influence the survival of the graft.20 Therefore, it would be necessary to check our results and the usefulness of our Score, in a multicenter study with greater racial variability.
Conclusions
An inadequate donor-recipient pairing assessed by the Score obtained with the score derived from imbalances in age, sex and BMI, correlates with worse kidney function in the long term. In addition to the donor-recipient HLA pairing during the donation process, this Score should be taken into account to achieve the best possible graft function. Additional studies with more patients would be needed to corroborate these results.
References
- Williams RC, Opelz G, McGarvey CJ, Weil EJ, Chakkera HA. The Risk of Transplant Failure With HLA Mismatch in First Adult Kidney Allografts From Deceased Donors. Transplantation. 2016;100(5):1094-1102. [CrossRef]
- CTS - Collaborative Transplant Study. Accessed June 10, 2022. https://www.ctstransplant.org/public/graphics/sample.shtml.
- Baddiri AT, Villanueva RT, Cabanayan-Casasola CB. Impact of Age Difference, Sex Matching, and Body Mass Index Matching Between Donor and Recipient in Renal Transplant. Transplant Proc. 2019;51(8):2568-2574. [CrossRef]
- Lee YJ, Chang JH, Choi HN, et al. Donor-recipient age difference and graft survival in living donor kidney transplantation. Transplant Proc. 2012;44(1):270-272. [CrossRef]
- Zhou JY, Cheng J, Huang HF, Shen Y, Jiang Y, Chen JH. The effect of donor-recipient gender mismatch on short- and long-term graft survival in kidney transplantation: A systematic review and meta-analysis. Clin Transplant. 2013;27(5):764-771. [CrossRef]
- Naderi G, Azadfar A, Yahyazadeh SR, Khatami F, Aghamir SMK. Impact of the donor-recipient gender matching on the graft survival from live donors. BMC Nephrol. 2020;21(1):1-7. [CrossRef]
- Brenner BM, Milford EL. Nephron Underdosing: A Programmed Cause of Chronic Renal Allograft Failure. Am J Kidney Dis. 1993;21(5):66-72. [CrossRef]
- Bellini MI, Nozdrin M, Pengel L, Knight S, Papalois V. How good is a living donor? Systematic review and meta-analysis of the effect of donor demographics on post kidney transplant outcomes. J Nephrol. 2022;35(3):807-820. [CrossRef]
- Matter YE, Elhadedy MA, Abbas TM, et al. Impact of sex disparities on outcomes of living-donor kidney transplant in Egypt: Data of 979 patients. Exp Clin Transplant. 2018;16(2):133-137. [CrossRef]
- Jacobs SC, Nogueira JM, Phelan MW, Bartlett ST, Cooper M. Transplant recipient renal function is donor renal mass- and recipient gender-dependent. Transpl Int. 2008;21(4):340-345. [CrossRef]
- Kalucki SA, Lardi C, Garessus J, et al. Reference values and sex differences in absolute and relative kidney size. A Swiss autopsy study. BMC Nephrol. 2020;21(1):1-11. [CrossRef]
- Nyengaard JR, Bendtsen TF. Glomerular number and size in relation to age, kidney weight, and body surface in normal man. Anat Rec. 1992;232(2):194-201. [CrossRef]
- Xu T, Sheng Z, Yao L. Obesity-related glomerulopathy: Pathogenesis, pathologic, clinical characteristics and treatment. Front Med. 2017;11(3):340-348. [CrossRef]
- D’Agati VD, Chagnac A, De Vries APJ, et al. Obesity-related glomerulopathy: Clinical and pathologic characteristics and pathogenesis. Nat Rev Nephrol. 2016;12(8):453-471. [CrossRef]
- Docherty NG, le Roux CW. Bariatric surgery for the treatment of chronic kidney disease in obesity and type 2 diabetes mellitus. Nat Rev Nephrol. 2020;16(12):709-720. [CrossRef]
- Miller AJ, Kiberd BA, Alwayn IP, Odutayo A, Tennankore KK. Donor-recipient weight and sex mismatch and the risk of graft loss in renal transplantation. Clin J Am Soc Nephrol. 2017;12(4):669-676. [CrossRef]
- Zeier M, Döhler B, Opelz G, Ritz E. The effect of donor gender on graft survival. J Am Soc Nephrol. 2002;13(10):2570-2576. [CrossRef]
- Meier-Kriesche HU, Ojo AO, Leavey SF, et al. Gender differences in the risk for chronic renal allograft failure. Transplantation. 2001;71(3):429-432. [CrossRef]
- McGee J, Magnus JH, Islam TM, et al. Donor-Recipient Gender and Size Mismatch Affects Graft Success after Kidney Transplantation. J Am Coll Surg. 2010;210(5):718. [CrossRef]
- Bellini MI, Nozdrin M, Pengel L, Knight S, Papalois V. The impact of recipient demographics on outcomes from living donor kidneys: Systematic review and meta-analysis†. J Clin Med. 2021;10(23). [CrossRef]
|
Disclaimer/Publisher’s Note: The statements, opinions and data contained in all publications are solely those of the individual author(s) and contributor(s) and not of MDPI and/or the editor(s). MDPI and/or the editor(s) disclaim responsibility for any injury to people or property resulting from any ideas, methods, instructions or products referred to in the content. |
© 2023 by the authors. Licensee MDPI, Basel, Switzerland. This article is an open access article distributed under the terms and conditions of the Creative Commons Attribution (CC BY) license (http://creativecommons.org/licenses/by/4.0/).
