Preprint
Article

Temporal and Spatial Changes of Agriculture Green Development in Beijing Ecological Conservation Developing Areas from 2006 to 2016

Altmetrics

Downloads

78

Views

19

Comments

0

A peer-reviewed article of this preprint also exists.

Submitted:

18 October 2023

Posted:

20 October 2023

You are already at the latest version

Alerts
Abstract
As an irreplaceable ecological barrier, the ecological conservation developing area (ECDA) is vital for the integrated construction of urban and rural areas, and optimization and adjustment of industrial structure. Developing green agriculture is the foundation and guarantee for improving the rural ecological environment and meeting the increasing needs of farmers′ income. Issued by the Chinese government, No. 1 Central Document stated the necessity of promoting agricultural green development (AGD) and the related technologies in dealing with ecological pressure and resource shortages, especially for large cities like Beijing. However, few empirical studies have conducted on spatiotemporal variations of AGD in ECDA of large cities. Based on the green agricultural traits of Beijing and the accessible data, we evaluate AGD and analyze its spatial and temporal heterogeneity of Beijing ECDA by constructiing a framework with 13 indicators. The weight coefficients of AGD indicators were calculated by the projection pursuit method, with the district panel data from 2006 to 2016. The results demonstrated that energy consumption is a vital factor of green agriculture production, and agricultural output value per unit of the arable land area is the key to the green agricultural revenue. From 2006 to 2016, the AGD index of ECDA had an increasing trend till 2012, followed by a decreasing tendency. The AGD index of the northern region is higher than the southern of ECDA. The obstacle degree model was used to verify AGD limiting factors. They were poor infrastructure, slow agritourism, low labor productivity, and low resource utilization efficiency that varied by districts in ECDA. Given these findings, our study is conducive to the AGD evaluation at the district (county) level for ECDA of large cities and also provides important policy implications.
Keywords: 
Subject: Environmental and Earth Sciences  -   Environmental Science

1. Introduction

Rapid urbanization had severe impacts on ecological security for its companion of environmental pollution in past decades [1,2]. How to achieve the dynamic equilibrium between economic development and environmental protection was of great concern during the urbanization process [3,4]. The concept of ‘green’ has been recently brought up as an intrinsic requirement for worldwide economic development to reduce environmental pollution while earning a competitive advantage (Holden E et al., 2017) [5]. Green development was proved to be an effective path for governments around the world to achieve sustainable socio-economic development [6,7]. While worldwide efforts have been consecutively made on green development (Holden E et al., 2017) [5], its assessment subsequently emerged and has been conducted on national, regional, and watershed scales for green industries. Bolcárová and Kološta [8] studied the sustainable development status of 27 EU countries by establishing indicators for regional green development. Cracolici et al. [9] investigated green development status on multiple sites in Italy via the regional welfare indicators of sustainable development. Zhu et al. [10] constructed a systematic evaluation framework for green industry development to compare the developing trends and analyze the influencing factors in multiple regions of Fujian Province. Zhou et al. [11] studied the running status of low-carbon economy among different provinces in China by establishing a low-carbon indicator framework for regional green development. The related assessments greatly promoted green development at the country, region, and industry level, with discrepancies in evaluating scales, indicators, and methods.
Under the background of decreasing global natural resources, increasingly severe environmental pollution, and rising demand for safe agricultural products, green development has become a major trend for agriculture across the globe. Agricultural green development (AGD) was part of a global strategy to achieve sustainable development goals (SDGs) of agri-food systems, as proposed by the United Nations [12]. The General Office of the Communist Party of China (CPC) Central Committee formally introduced the concept of green development into agricultural modernization processes in the ‘Opinions on promoting green development of agriculture by innovation institutions and mechanisms’ in 2017. In 2021, the Ministry of Agriculture and Rural Affairs and five other Ministries jointly issued the 14th Five-Year Plan, making systematic arrangements for AGD in the next five years in China (MARA, 2021) [13]. AGD assessment in China thereby attracted increasing attention to advance its green level. Nandy et al. [14] and Jin [15] established evaluating indictor frameworks for AGD on national level. AGD assessment was also conducted at provincial level, such as Shandong, Gansu, Henan, Zhejiang, Guangxi, and Hebei in China [16,17,18,19,20]. On watershed and regional scales, researchers had established evaluating indicators frameworks for Bohai Rim, Yellow River Basin and Yangtze River Economic Belt regions to analyze regional differences and temporal characteristics of AGD [21,22,23,24]. However, Chinese AGD assessment is still in its infant stage. Choosing the appropriate AGD evaluating model is still a big challenge in metropolises, such as Beijing and Shanghai where had prominent contradictions between environmental protection and economic growth.
In past decades, large population and rapid economic growth have triggered a series of environmental problems, such as water shortage and soil deterioration in Beijing, ecological conservation developing area (ECDA) in particular [25,26]. The implementation of ECDA has made significant contributions to sustainable development of the neighboring metropolises [27,28,29]. Early in 2006, Beijing municipal government adjusted developing paths and overall goals for ECDA: significantly improved level of eco-environment conservation, substantial breakthroughs in the major fields and crucial links of eco-environment construction, the forest coverage rate reaching over 70%, and greatly improved surface water quality and tree protection index by 2010. Policies related to environmental protection changed accordingly. For instance, industrial facilities and activities degrading eco-environment were prohibited or limited in regions like Beijing ECDA. As a result, choosing conducive industries for sustainable development and alternative livelihoods of local residents was becoming a priority in these areas [27,30]. In the meantime, the development of ECDA itself has been relatively slower than other areas in Beijing, mainly reflected in infrastructure conditions, residents' income level and regional self-development ability. Therefore, it was a big challenge to coordinate the dual objectives of ecological environment construction and economic development, to ensure the eco-environment protection while increasing its rapid development level in ECDA in Beijing. As the capital of China, Beijing has great motivation to achieve AGD, which has already been realized in developed countries (such as USA, Japan, Australia and European Union) in 20th century [31,32,33,34].
The objectives of this study were to (1) sort previous literatures on evaluating indicator frameworks and methods for AGD assessing; (2) establish an AGD evaluating indicator framework and model for Beijing ECDAs; (3) construct panel data based on socioeconomic statistical data from 2006 to 2016 that covering 13 districts of Beijing, to analyze temporal and spatial variations of AGD; (4) analyze AGD hindering factors and provide corresponding insights into effective policies and countermeasures in ECDA.

2. Literature Review

2.1. AGD Evaluating Indicator Framework

We comprehensively reviewed previous studies with distinct AGD evaluating indicator frameworks and evaluating methods. A rational evaluating indicator framework serves as the foundation of AGD, with the ultimate goal of effective assessment of regional green agriculture to provide decision-making basis for agricultural structure upgrading and eco-environment protection. Scholars have not reached an agreement on the evaluating index framework, which was key to accurate calculation of AGD level. In previous studies on AGD at national, key river basin, and provincial scales, multiple material input indicators on agricultural energy and water consumption, and fertilizer, pesticide, and agricultural film use intensity were reported, as well as output indicators on land and agricultural labor productivity [17,18,20,21,35,36,37,38]. These indicators were context-dependent and slightly varied by specific applications. For instance, energy consumption was calculated by per unit of gross agricultural output value and per unit of arable land area; water consumption was measured by water-saving irrigation efficiency, per unit of arable land area, per unit of agricultural output value. Nevertheless, it is acknowledged that AGD is a new development mode of harmonious coexistence between man and nature, with further research on its concept, characteristics, and type. AGD has economic and efficient utilization of resources as the main characteristics, ecological conservation as the fundamental requirement, environmental friendliness as the internal attribute, and ample supply of green products as the central goal [39,40]. While these fundamental features are independent of the evaluating scale, AGD evaluating indicators were context-specific, varied by study purpose, location, and data availability. For example, the proportion of agriculture, forestry, and water conservancy expenditure in fiscal expenditure, and arable land retention rate were chosen as evaluating indicators when assessing the AGD in the Beijing-Tianjin-Hebei region [34]. Kuang et al. [20] included sugar crop yield per unit land area in AGD evaluation in Guangxi province. For AGD in the Yellow River Basin, Tan [41] added indicators of soil erosion controlling level and the capacity of combating agricultural disaster, while Zhang et al. [42] employed forest coverage rate and agricultural natural disaster incidence to reflect local natural characteristics. In economically developed areas, the proportion of agritourism in agricultural output value was selected as AGD output indicator in the Yangtze River Delta [35], as well as agritourism revenue in Tianjin [36], and industrial convergence level in the Yellow River Basin [42]. In addition, output indicators at the provincial scale included certifications number of green, organic, and geographic identification of agricultural products [42,43] and the area of nature reserves [17,20,32,35].
Previous studies focused on the construction of AGD evaluating indicator frameworks at national and provincial scales, which often could not apply at smaller scales (such as city, county, and industrial sectors) for its inapplicability. The county is the fundamental administrative unit in China, with a rural, regional, hierarchical, comprehensive, and unbalanced economy. Thereby, the county economy has become the forefront and main battlefield in promoting AGD in China, especially under rural revitalization and the structural reform of the agricultural supply side. It is of practical significance to conduct AGD evaluation at the county level. Generally, due to the distinct evaluating dimensions and selected indicators, it is somewhat difficult to make cross-time and cross-space comparisons of AGD. For example, natural reserve areas and water-saving irrigation efficiency on national or provincial scales are not applicable at the county scale. Therefore, researchers have made attempts for AGD evaluation on the county scale. Xiong et al. [44] adopted 11 indicators related to grain production for AGD evaluation in grain-producing counties of Sichuan. Hou et al. [45] constructed AGD evaluating indicator framework in Lishu County, Jilin Province based on NUFER-AGD model. Shen and Wang [46] used agricultural carbon footprint as the undesired output to construct the super-efficiency SBM model and panel Tobit fixed effect model to evaluate AGD efficiency of 11 cities in Hebei Province. Yang [47] built AGD indicators based on the county cross-section data of Hubei Province in 2017. The differences of counties were considered in these indicators in Hubei Province, such as the mechanization level of mechanical tillage, mechanical sowing, mechanical harvesting, the scale of livestock and poultry breeding. Duan et al. [48] established the evaluating indicators of AGD in Bailang County of Tibet, adding characteristic indicators such as retention rate of arable land and wetland, comprehensive grassland vegetation coverage rate, and balance ratio on livestock and natural grassland. Despite their objective assessment of a particular industry or location, it is still difficult to compare AGD across industry types and regions using a microscale framework. For the county-level AGD evaluation index framework, it is necessary to fully reflect heterogeneity among regional, physical, and economic characteristics among counties.

2.2. AGD Evaluating Methods

Previous studies employed distinct methods for AGD evaluation: objective method, subjective method, or a combination of both. Objective methods, such as the entropy method, were widely used to avoid personal bias from decision-makers in AGD evaluation [20,35,44,49]. The entropy-TOPSIS (Technique for order preference by similarity to ideal solution) method [17,42,50], a modified version of the entropy method, allows weighting of each criterion from decision-makers, without limitations on the number of indicators and samples, or the investigation scale [51]. However, it has the disadvantage of overly weighting the indicator with high values, and can only precisely reflect the distances to the ideal solution/sample [52]. Thereby, the entropy-TOPSIS method was often employed for samples/solutions ranking, while the entropy method was used to determine the weight of indicators with good stability [53]. AHP (Analytic Hierarchy Process) is a subjective, flexible, and practical multi-criteria decision-making method for quantitative analysis of qualitative problems [36,47,48,54]. The main advantage of AHP is to determine indicator weights on top and bottom levels [51]. However, assigning weights by AHP needs to compare the significance of indicators in pairs, which may be difficult in practice [55].
The projection pursuit method is a new reliable statistical method proposed to deal with high dimensional, nonlinear, and non-normal distributed data in the 1970s [56,57]. It has the advantage of reducing dimension to find the most “interesting” projections in high-dimensional data by maximizing a so-called projection index stage-wisely. In specific cases, the projection index could have distinct definitions. For instance, new projection indicators were proposed to provide low-dimensional projections for efficient supervised classification [58]. For the classification of complex data, Grochowski and Duch [59] constructed a neural network algorithm via projection pursuit to find the simplest models. Projection pursuit was also used to develop a novel recurrent neural network for discriminant analysis [60]. The projection pursuit model method can locate the optimal projection direction according to data characteristics of the sample itself, allowing an objective determination of influence weight of each evaluating indicator. Thereby, it has been widely used in multiple fields and various comprehensive evaluation problems, such as ecosystem carrying capacity [61], innovation capacity [28], efficiency and risk assessment [16], development quality [50], and water resources carrying capacity [62]. However, it has not been applied in AGD assessment with prominent ecological value. In view of the serious impacts of ECDA on the surrounding areas, it is of great theoretical and practical significance to study the AGD status in regions with critical ecological value for further implementation of regional sustainable development and people's welfare improvement.

3. Materials and Methods

3.1. Study Area and Data

The 13 districts of Beijing are divided into function expansion area (Chaoyang, Fengtai, and Haidian districts), urban developing area (Fangshan, Tongzhou, Shunyi, Changping, and Daxing districts), and ECDA (Mentougou, Huairou, Pinggu, Miyun, and Yanqing districts) (Figure A1). To analyze the temporal and spatial characteristics of AGD, we constructed the panel data of these districts from 2006 to 2016. These data were originally from the Beijing Statistical Yearbook, Beijing Regional Statistical Yearbook (issued by the Beijing Municipal Bureau of Statistics, and Survey Office of the National Bureau of Statistics in Beijing), Beijing Culture and Tourism Statistics Report (issued by the Beijing Municipal Bureau of Culture and Tourism), Beijing Ecology and Environment Statement (issued by Beijing Municipal Ecology and Environment Bureau), National Economic and Social Development Report (issued by National Bureau of Statistics), and the 2nd and 3rd National Agricultural Census Report (issued by National Bureau of Statistics).
Vector maps (in the shp format) of basic Chinese geographic information were from the 1:400 million map database of the National Geomatics Center of China (www.ngcc.cn), which were used as the base map for GIS (geographic information system) analysis. Geographical coordinates were registered to Lambert_Conformal_conic Projection coordinate system through the digitalization of ArcGIS. The map had two information coverage_city layer (area data) and district/county layer (area data).
Two cross-sectional data (2006 and 2016) were chosen to study the spatial pattern and evolution track of green agriculture in Beijing at the district/county level.

3.2. AGD Evaluating Method-Projection Pursuit Method

AGD in Beijing was evaluated with the projection pursuit method after quantified using normalization in this study.
We first normalize the indicators in the AGD evaluation framework with the following equations.
x´i= (xi -min xi)/(max xi - min xi), when xi is a positive indicator;
x´i= (max xi - xi)/(max xi - min xi), when xi is a negative indicator.
A function of AGD projection indicators was then constructed, which transformed the multi-dimensional data{ Xij| j=1,2,…,n} into one-dimension projected values:
Z i = j = 1 n a j X i j ( i = 1 , 2 , ... , m ; j = 1 , 2 , ... n )
Afterwards, a function of AGD target indicators was constructed, with equations as follows.
Q(a)=S(a)D(a)
where S(a) is the standard deviation of multiple Zi, and D(a) is the local density of Zi.
S ( a ) = i m ( Z i E ) 2 / ( m 1 ) i = 1 , 2 , ... m
D ( a ) = i = 1 m j = 1 m ( R r i j ) u ( R r i j ) i , j = 1 , 2 , ... m
Where Ei is the mean value of Zi, and R is the window radius of local density (generally 0.01); rij=|zi-zj| is the distance between projected values, n is the number of samples, m is the number of indicators, i and j is the current count of samples, u(t) is the unit step function as follow:
u ( t ) = 1 , t 0 0 , t < 0 t = R - rij
According to the following limiting constraints, optimal projection direction aj that indicates the weight of indicators can be obtained.
u ( t ) = 1 , t 0 0 , t < 0
Where max Q(a) is the maximum value of Q(a), aj is the weight of each index, and regional integrated assessment value Zi can be then calculated by inputting aj in equation (1), to analyze AGD in different districts.
Based on the regional integrated assessment value Zi, AGD degree of Beijing (Pi), with the following equation:
P i = Z i i = 1 n a i × 100

3.3. Obstacle Degree Calculating Model

Obstacle degree (Oij) was introduced to identify and diagnose obstacle factors of the AGD index layer to provide a reference value for AGD improvement in ECDA. The equation to calculate the obstacle degree is as follows:
O i j = 1 r i j a i 100 i = 1 m 1 r i j a i
Where Oij is the obstacle degree of index i to the AGD level in year J. The smaller the Oij value is, the less the hindrance of the index in the process of AGD is, and vice versa.

4. Results and Discussion

4.1. AGD Evaluating Indicator Framework for Beijing ECDA

Following the principles of accessibility, comparability, integrity, and regional heterogeneity, 13 indicators were selected to assess AGD in ECDA (Table 1) according to the actual agricultural development in Beijing. They included eight indicators that reflected green agricultural production (AP1-AP8) and five indicators that reflected green agricultural revenue (AI1-AI5). Among them, AP1-AP6 were negative indicators that decreased with increasing AGD, while the rest seven were positive indicators. Compared to other evaluating frameworks, the agricultural characteristics of the metropolis were reflected in our framework, such as the proportion of agritourism revenue in gross agricultural output value (AI1). Previous studies in Tianjin [36] and the Yangtze River delta area [38] also reported this indicator, indicating a prominent leading role of agritourism in economically developed areas. The convergence of agriculture and tourism could further promote enthusiasm for farmers' green production [63]. In the meantime, the proportion of seed industry revenue in gross agricultural output value (AI2) was included in our evaluation framework, which was closely related to the positioning of advanced and sophisticated development of the agricultural industry since 2014, when “capital of seed industry” was proposed in Beijing. Moreover, the proportion of fixed asset investment in rural areas (AI5) as a new indicator was added to the framework, which could reflect the infrastructure conditions of agricultural development in Beijing ECDA.
AGD evaluation framework was often concerned with several aspects (such as resource utilization, environmental protection, economic benefits, social service, etc.), with distinct evaluating indicators selected according to research purposes. To date, indicators of economic benefits, resource utilization, and environmental protection statistics are relatively sound and proven in AGD evaluation. However, social services assessments are still in the developing stage, with evaluating indicators and methods that needed to be improved. How to make full use of the existing statistical data to construct an orderly and rigorous evaluating framework is the core.
Therefore, we proposed a regional AGD evaluating indicator framework should be established based on the existing statistical regime and data. In this study, AGD evaluating indicators are the organic integration, refining, and even sublimation of the original statistics data, rather than a simple copy or pile-up of the traditional indicators in economic, environmental, social, and other fields. Thereby, we constructed the comprehensive evaluating indicator framework of AGD for Beijing ECDA, which could reflect partial functions of agriculture on the economy, environment, and society.

4.2. Weight of Integrated Evaluating Indicators

According to Table 1, the green agricultural production was decisive in AGD in Beijing from 2006 to 2016, with a weight coefficient of 2.08. Energy consumption (AP1 and AP2) had a weight coefficient of 0.9549, indicating that agricultural development was overly dependent on energy consumption in ECDAs. Future AGD requires continuously focusing on energy consumption reduction and clean energy substitution. So Beijing implemented “coal to clean energy” and “coal reduction and cleaner coal” programs since 2016 to accelerate the use of clean energy in rural areas. The weight coefficients of these four indicators (AP1-AP4) accounted for 67.37% of total green agriculture production, indicating that agricultural production still greatly relied on resource consumption. So the transformation to modern agriculture had a long way to go in this Area. Arable land area per capita (AP8) and water consumption (AP5 and AP6) had weight coefficients of 0.2809 and 0.2408, separately, indicating more pressures on arable land area retention and agricultural water-saving irrigation.
The green agricultural revenue affected AGD on the aspects of agricultural industry structure, technology level, labor productive efficiency, and investment in agricultural infrastructure. Besides agritourism revenue, other indicators (AI2-AI5) greatly contributed to green agricultural revenue with high weight coefficients. The decisive role of agricultural output value per unit of arable land (AI4, weight coefficient of 0.3428) in green agriculture revenue was mainly due to the vast differences in arable land quality in ECDA. Therefore, it is necessary to develop appropriate agricultural industries in this Area according to local conditions, which can reduce unnecessary agricultural inputs and also increase agricultural outputs.
Comparing the evaluation layers, the green agricultural production had a greater contribution than green agricultural revenue to AGD from 2006 to 2016. At this stage, AGD focused on green production rather than green revenue, which emphasized the need to take various measures for continuously increasing green revenue in ECDA.

4.3. Green Agricultural Production

In 2016, ECDA had a green agricultural production index of 48.91, which was higher than in urban developing area (44.90) and function expansion area (28.01) (Figure 1). This was caused by the low energy consumption per unit of agricultural output value (AP1) and larger arable land area per capita (AP8) in ECDA. However, facility agriculture (0.36) in ECDA was less developed than in the urban developing area (2.01) and function expansion area (3.73) in 2016, mainly due to increased construction costs for the complex terrain condition and insufficient investment in agricultural infrastructure. From 2006 to 2016, the green agricultural production index decreased by 0.07 in Beijing ECDA, whose sustainability of green agriculture is more insufficient than that in the urban developing area (0.36) and function expansion area (1.44).
Generally, changes in most indicators of green agricultural production at the district level were observed from 2006 to 2016. Indicator values on resource utilization (AP4, AP5, and AP6) were increased over the ten years in ECDA, especially for fertilizer usage per unit of gross agriculture output value (AP4, increased by 33.19%). However, the increase of fertilizer use efficiency in ECDA was far lower than in the urban developing area (increased by 100.59%) and function expansion area (83.09%), indicating that there is still room for improvement in resource utilization efficiency. Arable land area per capita (AP8) decreased the most by 17.58%, suggesting that arable land retention still needs to be strengthened in ECDA. In conclusion, increasing agricultural energy use efficiency of fertilizer and water is crucial to realize the development of local green agriculture in ECDA.
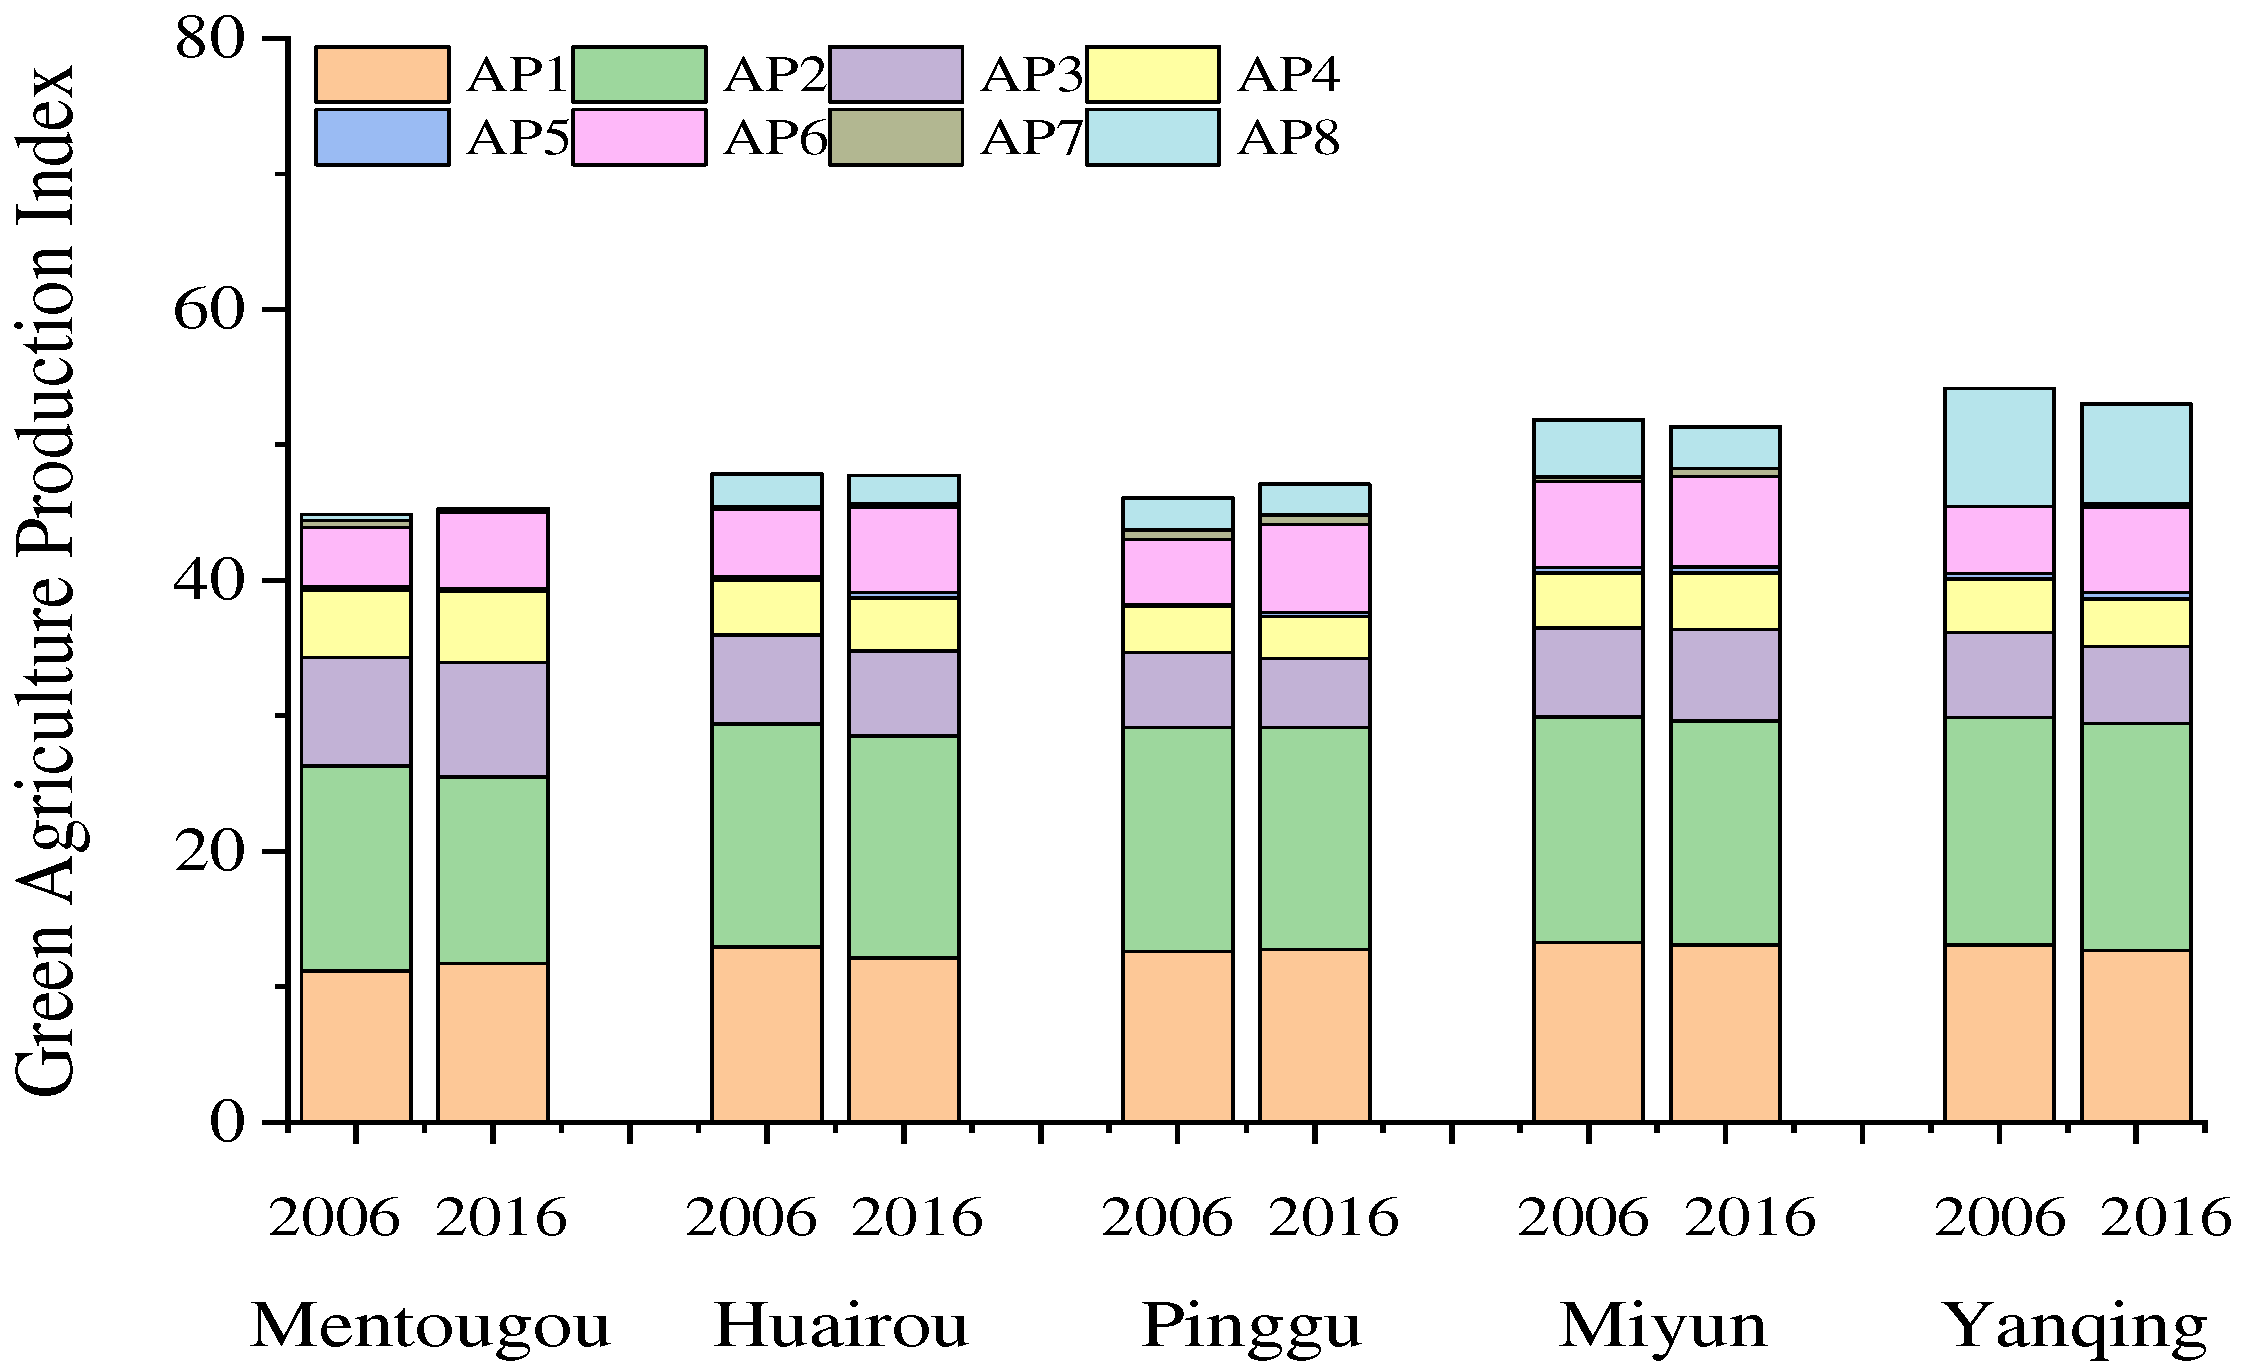
As for the district perspective, the green agricultural production index in ECDA ranged from 45.33 to 53.02, with the highest values in Yanqing (53.02) and Miyun (51.33) districts in 2016 (Figure 2). Despite the low chemical fertilizer usage, green agricultural production was the smallest in Mentougou district (45.33), which was mainly due to high energy consumption, large mountain area (98.50%, Mentougou Statistical Yearbook) and low arable land area per capita. In comparison to 2006, the green agricultural production index in 2016 decreased in Yanqing, Huairou, and Miyun districts, but increased in Pinggu and Mentougou districts, which resulted from increased agricultural output value per unit of arable land and agricultural labor productivity (Figure 2).

4.4. Green Agricultural Revenue

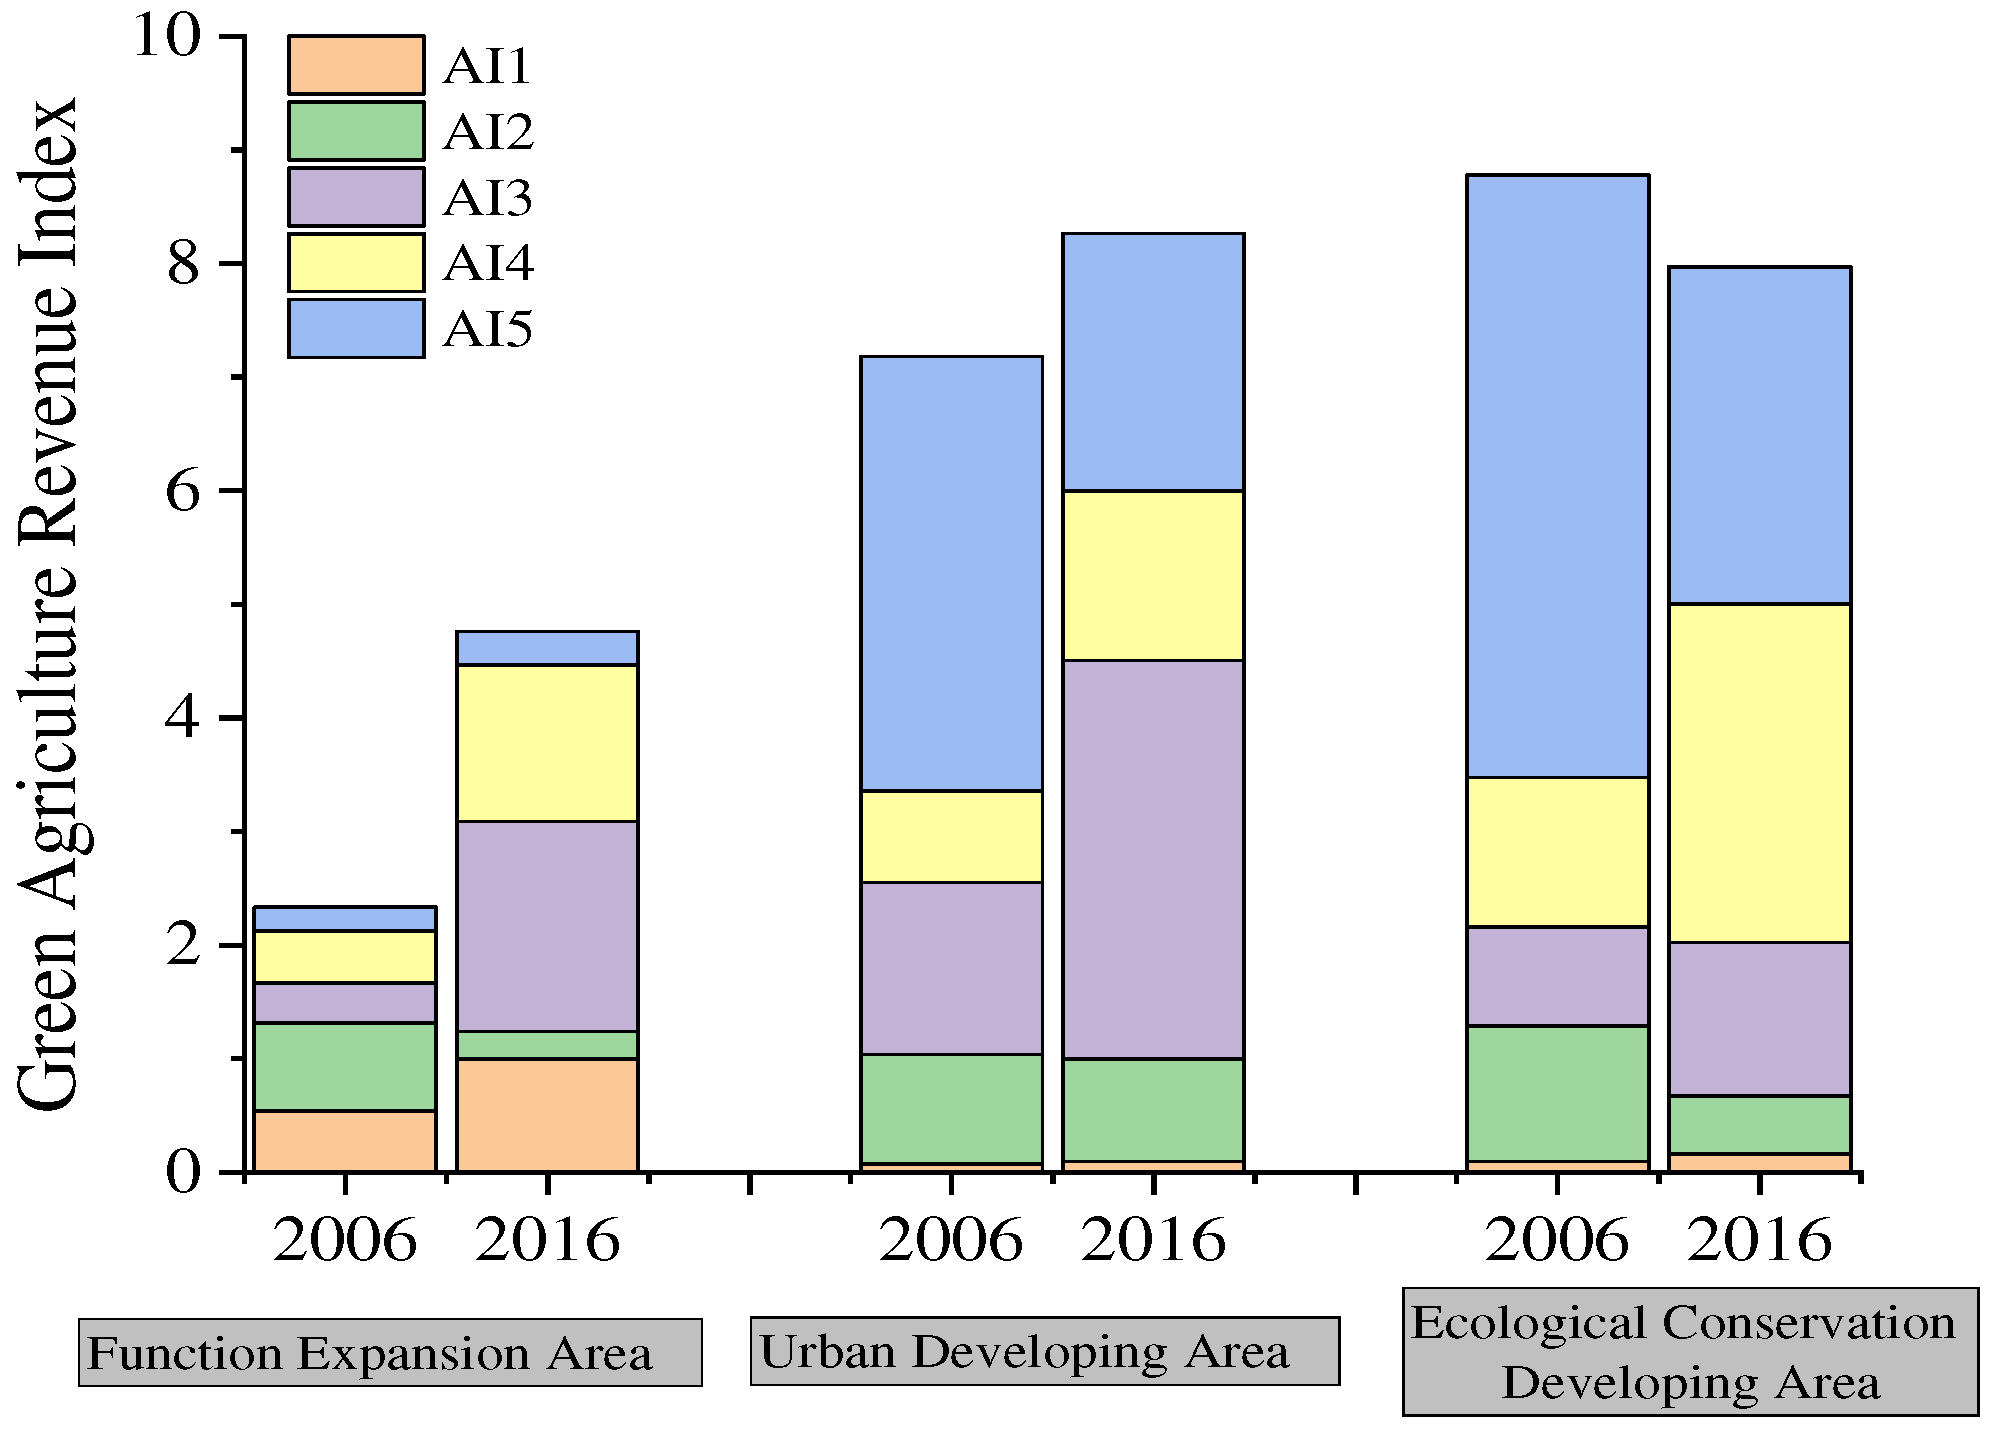
In 2016, the green agricultural revenue index of ECDA was 7.97, mainly constituted of agricultural production per unit of arable land area (AI4, 2.98) and the proportion of fixed asset investment in rural areas (AI5, 2.97). The green agricultural revenue index of ECDA in 2016 was higher than the urban developing area (8.26), lower than the function expansion area (4.76) (Figure 3). Green agricultural revenue indicators related to agritourism, seed industry, and labor productivity were relatively lower in ECDA than in urban developing area, especially on the latter two indicators. Despite the increases in the proportion of agritourism revenue in gross agricultural output value (AI1), labor productivity (AI3), and agricultural production per unit of arable area (AI4), the green agricultural revenue index of ECDA in 2016 decreased compared to 2006, mainly because of the decreases in the proportion of fixed asset investment in rural areas (AI5) and seed industry revenue (AI2). With the improvement of agricultural infrastructure conditions, further agricultural production efficiency would be a significant task to increase green agricultural revenue in ECDA.
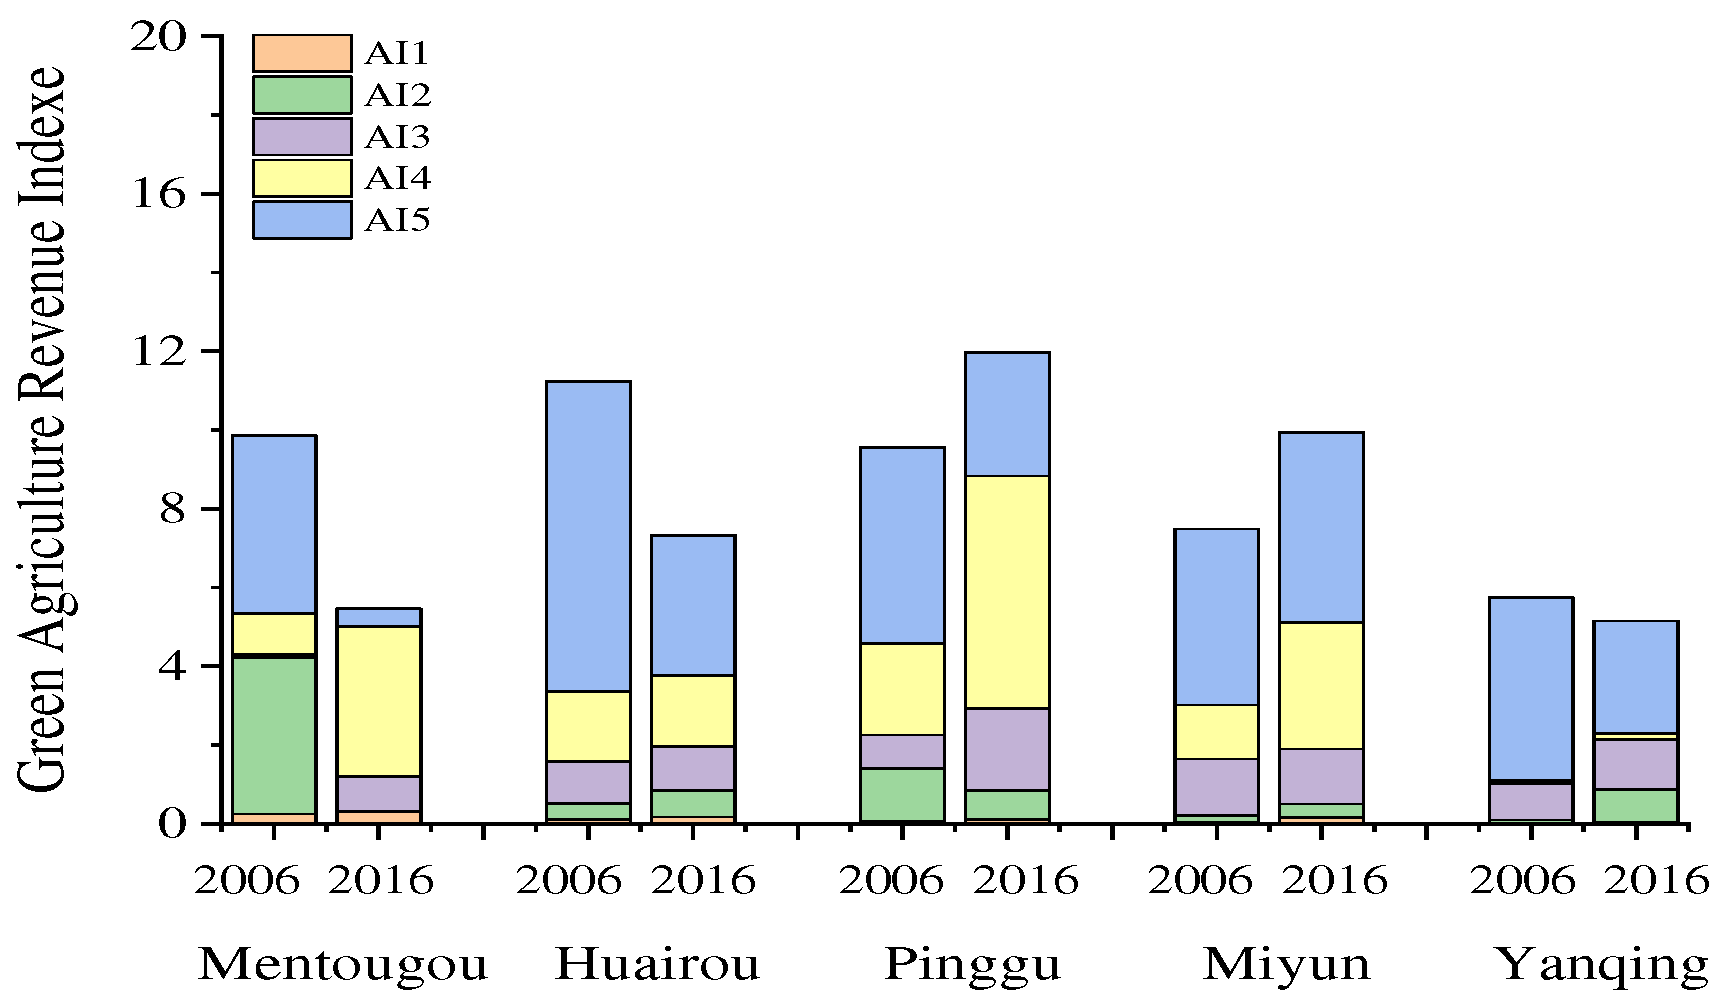
Considerable distinctions in the green agricultural revenue index and its components were observed in the five districts of ECDA in 2016 (Figure 4). Among these five districts, high agricultural production efficiency (AI3 and AI4) contributed to the highest green agricultural revenue index (11.97) in Pinggu district. Miyun district has the second high green agricultural revenue index (9.94), mainly because of the high proportion of fixed asset investment in rural areas (AI5, 4.84). The green agricultural revenue indexes of both Mentougou (5.46) and Yanqing (5.15) were comparably low, with different limiting factors.
Generally, the green agricultural revenue index in ECDA in 2016 was lower than in the urban developing area. In ECDA, the green agricultural revenue index often varied by district, with distinct limiting factors from 2006 to 2016. Therefore, agricultural policies and measures should adjust according to their actual conditions in different districts of ECDA to improve the green agricultural revenue.

4.5. Temporal and Spatial Variations of AGD in Beijing ECDA

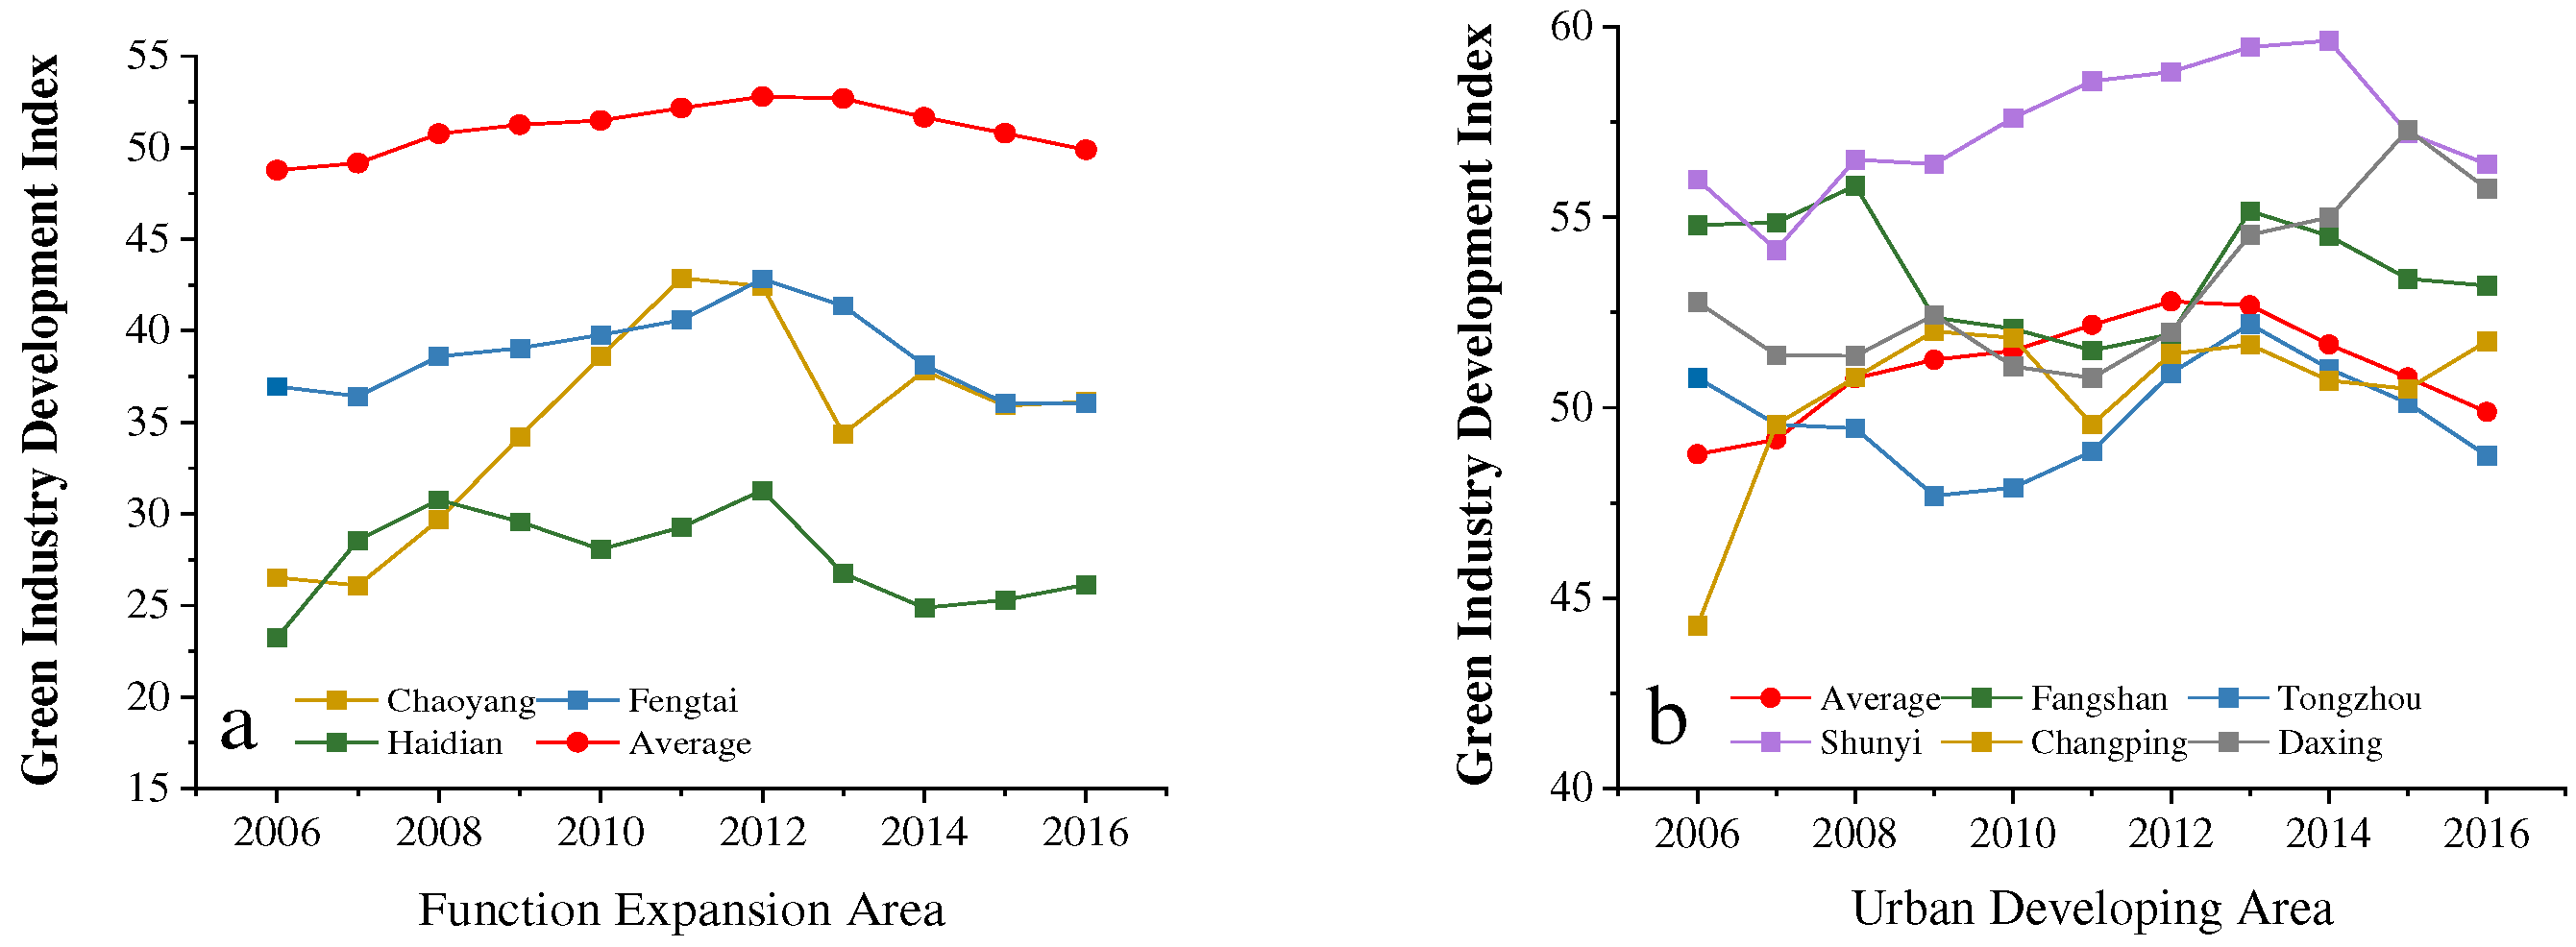
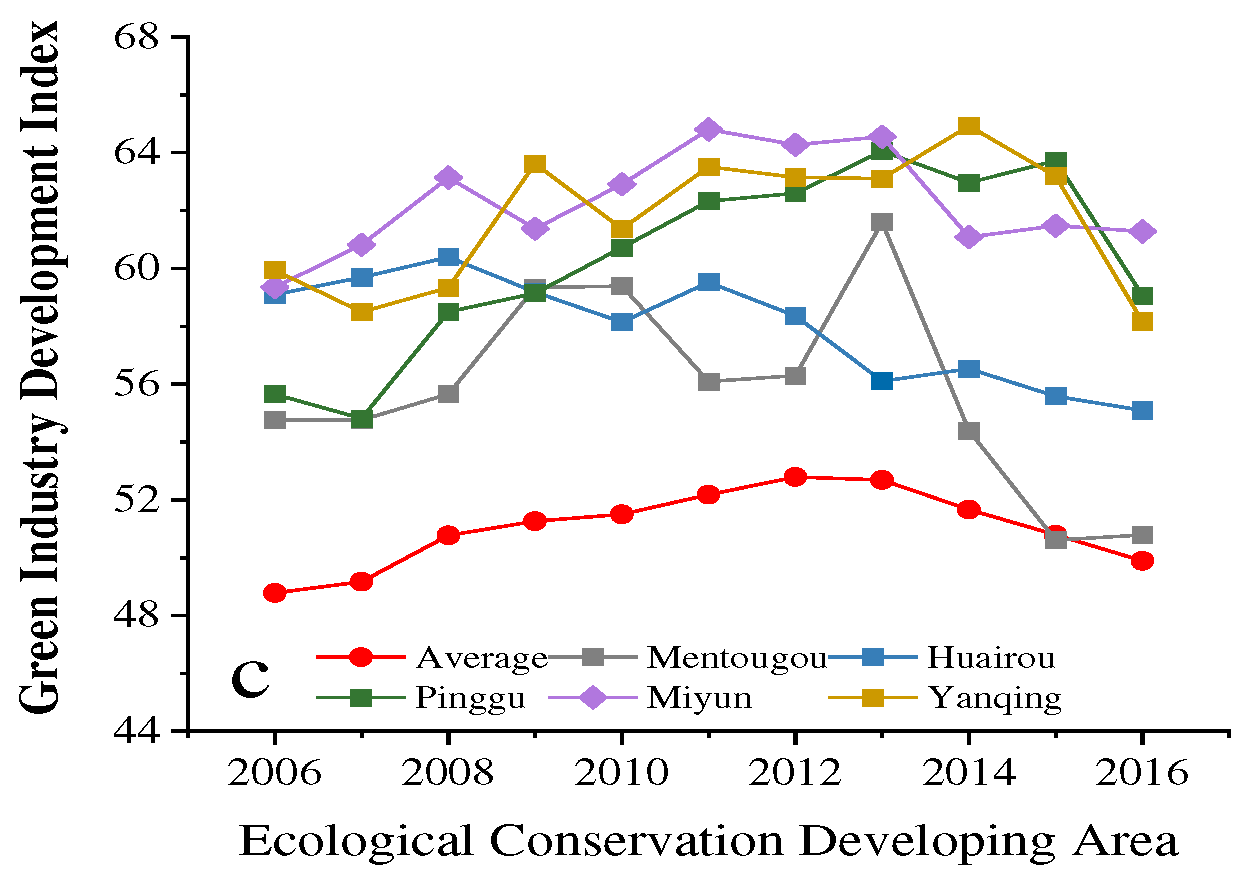
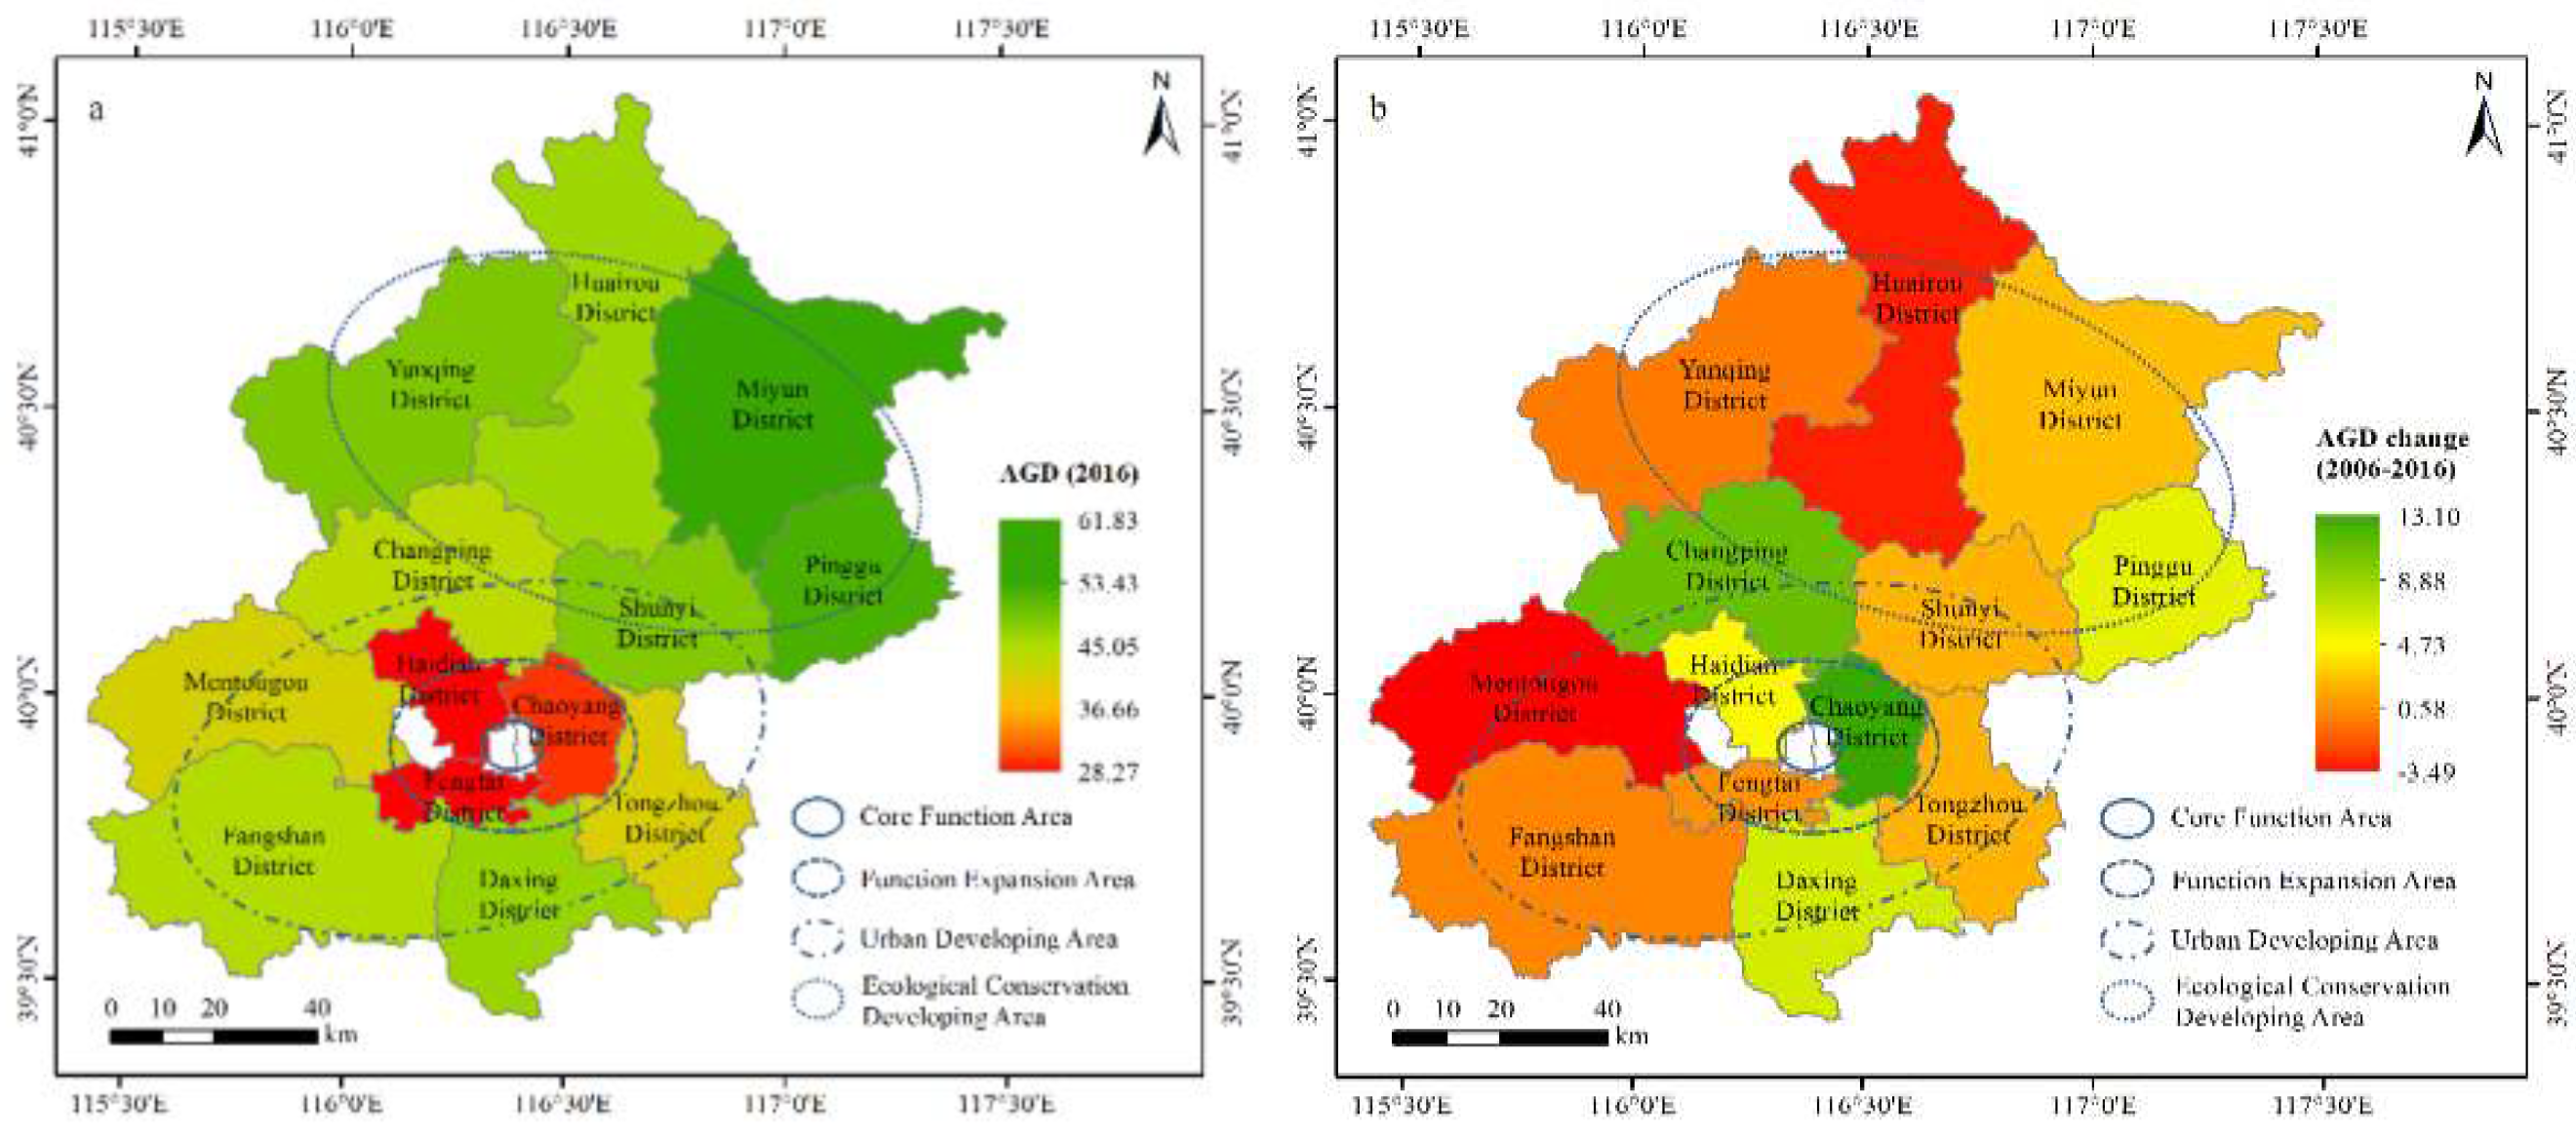
From 2006 to 2016, the AGD index of the district generally demonstrated an overall pattern of an increase followed by a decrease, with a peak in 2012-2013 (Figure 5). This coordinated with the agricultural development policies in Beijing, such as the “Opinions on the development of water-saving and high-efficiency agriculture by adjusting structure and changing mode (Beijing No.16, 2014)”, and “the first round of afforestation project of one million mu in Beijing plain area from 2012 to 2017”. All these policies led to continuous reduction of arable land area (decreased from 283,000 ha in 2006 to 151,000 ha in 2016, Beijing Statistical Yearbook 2007-2017) and agricultural water consumption (decreased from 910 million m3 in 2012 to 610 million m3 in 2016, Beijing Statistical Yearbook 2013-2017). Figure 6b demonstrated district differences in AGD index values from 2006 to 2016 in Beijing. In EDCA, AGD index demonstrated a differentiated tendency, with the highest accretion of 3.42 in Pinggu district, and an obvious reduction in Yanqing, Huairou, and Mentougou districts (1.77, 4.00, and 3.97). All these results reflected that the year 2012 was an critical time point, and the north region had spatial agglomeration of AGD.

5. Discussion

AGD evaluation is to assess its green level and clarify the key limiting factors. Then we could maximize the adjustment of the corresponding agricultural development mode and policy for AGD acceleration to the maximum extent. Therefore, it is necessary to further "pathologically" diagnose AGD obstacles. Based on the calculated obstacle degree (Table 2), we further analyzed the top six indicators with obstacle degrees bigger than 6%.

5.1. Poor Infrastructure Hindering Development of Green Agricultural Industries

The proportion of facility agriculture area in arable land area (AP7) was the most significant limiting indicator for AGD in ECDA of Beijing, with an obstacle degree increased from 8.34% in 2006 to 11.25% in 2016. The relatively backward infrastructures in ECDA were the main reason. As infrastructure is the basis of socioeconomic development, regions with superior infrastructures are attractive to green industry and qualified personnel, which is also conducive to AGD. ECDA had infrastructure conditions far worse than the function expansion area and the urban developing area because it was in remote rural areas with limited socioeconomic development.
In view of the limited statistical data, the fixed asset investment of each district was used as representative of infrastructure conditions to make a comparative analysis. Although the proportion of fixed asset investment in rural areas was relatively high, the total amount of rural fixed assets investment in ECDA was far lower than in the urban developing area in 2016, indicating a demand for the continuous increase of the invested amount (Figure A2). To achieve this, local government should increase the utilization efficiency of agricultural funding by integrating its source and supervising its usage (scope and input) to speed up the construction of agricultural infrastructure. Meanwhile, the government should strengthen the guiding role of fiscal funding in infrastructure construction by increasing agricultural infrastructure investment at a rate faster than the growth rate of total fiscal revenue. Finally, agricultural infrastructure investment should broaden financing channels and systems to attract credit funds and private capital. A similar supportive policy on more investment in green agriculture by the United States Department of Agriculture [31,64]. On the other hand, the hysteretic infrastructures and managing modes in ECDA require to meet the development of emerging green agriculture. Improving the quantity and quality of infrastructure is significant in attracting capital investment for the emerging green agricultural industries in ECDA.

5.2. Slow Improvement of Agritourism Quality Affecting AGD in ECDA

The proportion of agritourism revenue in gross agricultural output value (AI1) was the second major AGD limiting factor, with an obstacle degree exceeding 8% from 2006 to 2016. As a new convergence industry form, agritourism became the major measure to fulfill multifunctional agriculture, which rationalized the great efforts of the Beijing municipal government in promoting agritourism development in the suburbs (Beijing "ten-hunadred-million-thousand" agritourism action implementation opinions). Agritourism in ECDA was weak in driving regional economy and increasing farmers' income (Table 1). Taking agricultural tourism parks as an example, although the total income of tourism parks in ECDA was significantly higher than that in the function expansion area and the urban developing area, its contribution rate (the proportion in total agricultural output value) was comparably low. In 2006, the density of agricultural tourism parks, employees per park, visitors per park, and expenditure per capita in ECDA were lower than those in the other two Areas (Figure A3). Agricultural tourism parks had developed greatly by 2016, along with economic development and the growing ecological advantages in ECDA. However, employees per park and expenditure per tourist of ECDA were far lower. The main reason was most agricultural tourism parks in ECDA focused on sightseeing tourism. This short industrial chain, which lacked a clear theme of agritourism activity and deep cultural embedding during industrial convergence, had limited effect on promoting local economic benefits.
The implementation plan on "comprehensively promoting the key work of rural revitalization in 2022" issued by the Beijing Municipal Government pointed out that it was necessary to continuously promote the converged development of the primary, secondary and tertiary industries, and expand the multiple functions of agriculture. Local governments should propel the joint development of high-quality homestay and regional tourism in rural areas by extending the industrial value chain. This provided a new developing opportunity and path for agritourism in ECDA. New types of agritourism incorporated with ECDA natural resources and characteristic humanistic resources should be explored as an advantage. Relying on the characteristic culture, enriched agritourism experience could further highlight the natural scenery and local customs of ECDA. Moreover, tourists could experience abundant agritourism products, including agricultural sightseeing, camping in the field, and outdoor self-driving on the surrounding routes of the landscape. All these could integrate inter-industry resources, and extend the upstream and downstream industrial chains of characteristic industries, to promote the transformation and upgrading of agritourism in ECDA.

5.3. Low Labor Productivity Hampering AGD in ECDA

Low labor productivity also restricted AGD in ECDA, possibly for the insufficiencies in independent crop varieties, specialized and differentiated agricultural products, and agricultural green technology, as well as the unreasonable structure of agricultural industries. On the other hand, farmers in ECDA had part-time jobs outside their daily farming due to urbanization, with the wage income accounted for 75% of their total income (Beijing Statistical Yearbook 2017). The relatively short average education years of labors in ECDA (less than 8 years according to the sixth census data of Beijing) also limited their ability in acquiring high-end and new technologies. Consequently, ECDA aggregated with resource-intensive and labor-intensive industries that has low industrial convergence and short industrial chain, with hardly any high-tech and leading industries. The agriculture in ECDA were often weak in market competitiveness and external risks resistance, which restricted the labor productivity. Meanwhile, high production costs (including land, labor, seeds, fertilizer, irrigation and other inputs) made it more difficult to improve agricultural labor productivity.
In ECDA, we should promote the formation of green production, strengthen the scientific and technological supply of green agricultural products and ecological products, and enhance efficiency and competitiveness of green agricultural development, through innovating and promoting green technologies. In addition, added value of agricultural products should be further explored. More than 80% of the unique agricultural products of Beijing was originated from ECDA (work report from Beijing Bureau of Agriculture and Rural affairs), for its relatively good natural environment and diverse microclimate. High proportion (40%) of the local agricultural products were high quality with pollution-free, green and organic product certification (work report from Beijing Bureau of Agriculture and Rural affairs). In ECDA, it is determined that construction of regional brand of green agricultural products and improvement of agricultural industry structure should be accelerated, with actively development of agricultural science and technology, and well-known agricultural brand. With a standpoint on the layout of "park-town-district-city", development of the whole industrial chain of agricultural products should be promoted as well. The vocational skill training, and technology popularization for farmers should be strengthened to effectively improve their scientific and technological competence.

5.4. Low Resource Utilization Efficiency Restricted AGD in ECDA

The factor of resource utilization efficiency had an obstacle degree >6% during the ten years. Compared to 2006, resource utilization efficiency (AP4 and AP6) was generally decreased in 2016 for all districts (Figures A4 and A5), which was comparably higher in ECDA. Low resource utilization efficiency limited its AGD to a certain extent. The results above suggested that resource-intensive agricultural industries with high energy consumption still have a dominated role in ECDA, resulting in low resource production efficiency and land production efficiency (Figure A6).
To promote AGD in ECDA, it is necessary to accelerate the application of technologies on reducing agricultural input and enhancing its efficiency, while improving the refinement degree of agricultural production. It is urgent to improve water utilization efficiency in Beijing, which has an extreme shortage of water and an annual water resource of about 100 m3 per capita for many years. In ECDA, the grain production region, vegetable and orchard fields should be demarcated, with strictly enforced water consumption quota to achieve the goal of negative growth of total agricultural water consumption. The allocation progress of agricultural water-saving facilities can be speed up, including building high-efficiency water-saving irrigation facilities for vegetables and fruit trees, and adopting different water-saving facilities for different planting structures. The research and popularizing of agronomic measures on water saving should be accelerated, such as practical technologies (rainwater collection, moisture conservation, and fertigation) that could make full use of rainwater resources. In addition, the price of agricultural water should be determined according to local total water resource and agricultural water consumption of each district. Similarly, the Netherlands and Japan issued laws and acts in relevant to chemical fertilizer reduction in agricultural production to develop a circular economy, protect environment and conserve resources with an ultimate goal of sustainable agriculture [32,65].
Improving the irrigation system, nutrient forms, and ratio of fertilizers are essential to increase resource utilization efficiency, as well as enhancing farmers' awareness of scientific irrigation and fertilization. In ECDA, it is crucial to accelerate the research and development on integrated water and fertilizer technology, including slow and controlled released fertilizer, organic fertilizer, adjusting nutrient form of fertilizer, and promoting local adapted irrigation methods (moist irrigation, alternate irrigation, ridge and furrow irrigation, etc.). Consequently, the ultimate goals of regulation of farmland water cycle, promoting coupling of water and fertilizer, improving the utilization rate of resources, and reducing environmental pollution could be achieved.

6. Conclusion and Corresponding Policy Recommendations

6.1. Effectiveness of the Selected AGD Indicators and Evaluation Method in Beijing

Based on the district panel data of Beijing from 2006 to 2016, we construct evaluation framework with 13 evaluating indicators for AGD in ECDA, which can reveal the developing characteristics of green agriculture. The important role of selected indicators in AGD can be reflected objectively by using the projection pursuit model to determine the indicators′ weight when assessing AGD on the district level. The results verify that evaluating indicator frame and method can effectively illustrate the temporal and spatial heterogeneity of AGD in ECDA of Beijing. Of course, we do not deny that there may be some more suitable indicators for AGD evaluation. We used the data issued in official statistical yearbook for AGD evaluation in view of authority, long-term comparability, and systematic acquisition of data. Therefore, this study can provide reference for district (county) AGD evaluation in other big cities in China, such as Shanghai and Guangzhou.

6.2. AGD Level Presented Obvious Heterogeneous Characteristics of Spatial and Temporal Characteristics on District Level for Beijing

The apparent spatial differentiation characteristic of AGD level in Beijing demonstrated a trend of increasing from the core to the periphery areas: ECDA > urban developing area > function expansion area. AGD in Beijing also showed temporal differentiation characteristics: a continuous increase from 2006 to 2013, and a general decrease from 2014 to 2016 for all districts (with exceptions in Changping and Miyun districts). It is necessary to further the main driving factors leading to this temporal change of AGD. The long-term AGD evaluation of ECDA could provide an opportunity for further analysis of its temporal and spatial patterns, and locate the possible spatial aggregation effect of AGD at certain critical time points. On the other hand, this study proved that conducting AGD evaluation on the district (county) level is practical and operable, especially in big cities with significant differences like Beijing. For instance, regional restricting factors of AGD, analyzed by the obstacle degree model, could be neglected in larger-scale evaluations that often cover spatial differences and individual problems.

6.3. Corresponding Policy Recommendations

A grim fact is that AGD has a long-standing and currently prominent status for sustainability development for Beijing, especially for ECDA. Therefore, promoting AGD is not an overnight management activity. The evaluation results suggested that ECDA needs to formulate corresponding policies and systems according to local development characteristics, plans, objectives, and promote systematic reform, to better promote the rapid and healthy development of local green agriculture. Preferential policies on land, taxation, and finance should be issued to attract AGD with high and new technologies. It is necessary to strengthen green regulation, speed up institutional reform of ecological civilization, to establish organizations and regimes on natural resources management and natural ecological environment supervision in ECDA.
Accordingly, all strategic decisions should be continuous and dynamic to make a full function of AGD in guiding socioeconomic development in ECDA. Nevertheless, there are still limitations in the current study. For instance, the indicators of agricultural film and pesticide use intensity were excluded due to the unavailability of data. This underestimated the green agricultural production and thus influenced the results to a certain extent. Moreover, exploring the driving mechanisms of AGD stretching over a long period needs sustaining AGD in ECDA.

Author Contributions

Conceptualization, H.L. and F.L.; methodology, X.X. and F.L.; software, W.Z. and N.S.; validation, H.L., F.L., and Y.S.; formal analysis, X.X.; investigation, X.X. and Y.S.; resources, X.X. and H.L.; data curation, X.X.; writing—original draft preparation, H.L., F.L. and N.S.; writing—review and editing, H.L.; visualization, N.S. and W.Z. All authors have read and agreed to the published version of the manuscript.

Funding

This work was was funded by the Science and Technology Capacity Improvement Project of Beijing Academy of Agricultural and Forestry Sciences (ZHS202306); Beijing Innovation Consortium of Agriculture Research System (BAIC09-2023); the Natural Science Foundation of Beijing (8232028); and Beijing Science and Technology Project of Beijing Municipal &Technology Commission (Z191100004019001); Beijing Bureau of Statistics research project on the third National Agricultural census (2017012).

Data Availability Statement

Data will be available on request.

Conflicts of Interest

No conflict of interest exits in the submission of this manuscript, and manuscript is approved by all authors for publication.

References

  1. Gibbs, D.; Longhurst, J. Sustainable development and environmental technology: A comparison of policy in Japan and the European Union. Environmentalist 1995, 15, 196–201. [Google Scholar] [CrossRef]
  2. Su, Y.; Chen, X.; Liao, J.; Zhang, H.; Wang, C.; Ye, Y.; Wang, Y. Modeling the optimal ecological security pattern for guiding the urban constructed land expansions. Urban For. Urban Green. 2016, 19, 35–46. [Google Scholar] [CrossRef]
  3. Xie, H.; Yao, G.; Liu, G. Spatial evaluation of the ecological importance based on GIS for environmental management: A case study in Xingguo county of China. Ecol. Indic. 2015, 51, 3–12. [Google Scholar] [CrossRef]
  4. Sun, X.; Lu, Z.; Li, F.; Crittenden, J.C. Analyzing spatio-temporal changes and trade-offs to support the supply of multiple ecosystem services in Beijing, China. Ecol. Indic. 2018, 94, 117–129. [Google Scholar] [CrossRef]
  5. Holden, E.; Linnerud, K.; Banister, D. The imperatives of sustainable development. Sustain. Dev. 2017, 25, 213–226. [Google Scholar] [CrossRef]
  6. United Nations Environment Program (UNEP). Guidelines for AEO Cities Integrated Environmental Assessment and Report. United Nations Environment Program (UNEP, 2005; pp. 52–143. [Google Scholar]
  7. United Nations Environment Program (UNEP). Green Economy: Cities Investing in Energy and Resource Efficiency. 2011. Available online: https://wedocs.unep.org/handle/20.500.11822/7979.
  8. Bolcárová, P.; Kološta, S. Assessment of sustainable development in EU 27 using aggregated SD index. Ecol. Indic. 2015, 48, 699–705. [Google Scholar] [CrossRef]
  9. Cracolici, M.F.; Cuffaro, M.; Lacagnina, V. Assessment of sustainable well-being in the Italian Regions: An Activity Analysis Model. Ecol. Econ. 2018, 143, 105–110. [Google Scholar] [CrossRef]
  10. Zhu, B.; Hu, Z.; Yao, Q. Comprehensive evaluation and proposals about the development of green industry in Fujian Province. Log. Eng. Manage. 2014, 36, 136–139. [Google Scholar]
  11. Zhou, S.; Zhang, N.; Zhang, X. Metro construction risk assessment based on PPC-D-S evidence theory. Mod. Tunn. Technol. 2021, 58, 75–83. [Google Scholar] [CrossRef]
  12. Ma, L.; Bai, Z.; Ma, W.; Guo, M.; Jiang, R.; Liu, J.; Oenema, O.; Velthof, G.L.; Whitmore, A.P.; Crawford, J.; et al. Exploring future food provision scenarios for China. Environ. Sci. Technol. 2019, 53, 1385–1393. [Google Scholar] [CrossRef]
  13. The Ministry of AgricultuFre and Rural Affairs (MARA). 2021. Available online: http://www.gov.cn/zhengce/zhengceku/2021-09/07/5635867/files/737ff96c0cc74f788394eb6194cc44c6.pdf (accessed on 8 May 2023).
  14. Nandy, S.; Singh, C.; Das, K.K.; Kingma, N.C.; Kushwaha, S.P.S. Environmental vulnerability assessment of eco-development zone of Great Himalayan National Park, Himachal Pradesh, India. Ecol. Indic. 2015, 57, 182–195. [Google Scholar] [CrossRef]
  15. Jin, S. Spatial correlation and influencing factors of agricultural green development in China. Commercial Sci. Res. 2018, 6, 44–52. [Google Scholar]
  16. Zhou, X.; Li, X. Analysis of spatial heterogeneity of green agricultural production level: Based on empirical data of Shandong province from 2010 to 2019. Rev. Econ. Manage. 2021, 37, 152–164. [Google Scholar] [CrossRef]
  17. Wang, X.; Lv, J. The comprehensive evaluation of agricultural green development level and analysis of its obstacle factors in Gansu Province. Terri. Nat. Resour. Stud. 2022, 22, 69–73. [Google Scholar] [CrossRef]
  18. Li, X.; Li, J. Evaluation of agricultural green development level in Henan Province based on close value method. Shanxi Agric. Econ. 2022, 14, 22–24. [Google Scholar]
  19. Zhang, W.; Duan, L. Identification of driving factors and performance evaluation of Zhejiang agricultural green development. Chinese, J. Agric. Resour. Region. Plan. 2022, 43, 24–33. [Google Scholar]
  20. Kuang, A.; Yue, Y.; Cao, S. Comprehensive evaluation of green agricultural development level in Guangxi. J. Guangxi Agric. 2022, 37, 37–43. [Google Scholar]
  21. Li, F.; Zhou, X.; Zhou, Y. Evaluation and regional difference analysis of agricultural green development level in Bohai Rim Region. J. Agric. Resour. Region. Plan. 2022. Available online: https://kns.cnki.net/kcms/detail/11.3513.S.20220318.1604.028.html.
  22. Zha, J.; Zhou, X.; Zhou, Y. Evaluation of agricultural green development level in the Yellow river. Chin. J. Agric. Resour. Region. Plan. 2022, 1, 18–28. [Google Scholar]
  23. Zhou, J. Evaluation, regional difference analysis and optimization path of agricultural green development in Yangtze River Economic Belt. Rural Econ. 2021, 12, 99–108. [Google Scholar]
  24. Liu, J.; Liu, X. Study on measurement and enhancement path of the level of the agricultural green development: An empirical example from 11 Cities in the Pearl River-West River economic belt. Ecol. Econ. 2022, 38, 100–107. [Google Scholar]
  25. Yang, Z.C.; Zhou, L.D.; Sun, D.F.; Li, H.; Yu, M. Proposal for developing carbon sequestration economy in ecological conservation area of Beijing. Adv. Mater. Res. 2012, 524, 3424–3427. [Google Scholar] [CrossRef]
  26. Xu, J.; Wang, J.; Xiong, N.; Chen, Y.; Sun, L.; Wang, Y.; An, L. Analysis of Ecological Blockage Pattern in Beijing Important Ecological Function Area, China. Remote Sens. 2022, 14, 1151. [Google Scholar] [CrossRef]
  27. Jogo, W.; Hassan, R. Balancing the use of wetlands for economic well-being and ecological security: The case of the Limpopo wetland in southern Africa. Ecol. Econ. 2010, 69, 1569–1579. [Google Scholar] [CrossRef]
  28. Zhang, Y. Evaluation and spatial difference of agricultural green development level in the Yellow River basin based on entropy weight-TOPSIS. Hubei Agr. Sci. 2022, 61, 230–236. [Google Scholar]
  29. Tang, C.; Wu, X.; Zheng, Q.; Ning, L. Ecological security evaluations of the tourism industry in ecological conservation development areas: A case study of Beijing's ECDA. J. Clean. Prod. 2018, 197, 999–1010. [Google Scholar] [CrossRef]
  30. Liu, C.L.; Chen, M.X.; Tang, Z.P.; Liu, W.; Lu, D.; Zhang, Y. The “valley economy” model of regional development: A case study of mountain areas in Beijing, Northern China. J. Mt. Sci. 2014, 11, 1372–1382. [Google Scholar] [CrossRef]
  31. Lin, Q.; Ouyang, Z.; Kong, L.; Wang, X.; Yang, X.; He, W.; Yang, S. Policy evolution of green agricultural development in the United States and its enlightenments to China. Agr. Outlook. 2022, 18, 10–17. [Google Scholar]
  32. Wang, X.; Xin, Z.; He, W.; Lin, Q.; Yang, X.; Kong, L.; Ouyang, Z. Status quo of agricultural green development policy in Netherlands and its enlightenments to China. Agr. Outlook. 2022, 18, 24–29. [Google Scholar]
  33. Ma, J.; Yu, H.; Zhou, J. Sustainable agriculture development under the green perspective in Japan: Paths, results and policy inspirations. Chinese J. Eco-Agr. 2022. [Google Scholar] [CrossRef]
  34. Guo, J.; Huang, Y. Construction and empirical analysis of evaluation indicator system of agricultural green development in Beijing-Tianjin-Hebei region. Agr. Outlook 2022, 18, 50–56. [Google Scholar]
  35. Song, Y.; Yang, P.; Zheng, S. Evaluation of green development level of agriculture in Yangtze River Delta. J. Anhui Univ. Sci. Tech. 2022, 24, 11–17. [Google Scholar]
  36. Dou, Y.; Zhao, G.; Jiang, Y. Comprehensive evaluation of the green development level of agriculture in Tianjin. J. Chinese Agr. Mech. 2021, 42, 159–165. [Google Scholar]
  37. Li, Y.; Zhang, J.; Cui, S.; Ma, L.; Ma, W.; Wei, J. Temporal and spatial characteristics of agricultural green development indicators in counties of Hebei Province. Chinese J. Eco-Agri. 2020, 28, 1168–1180. [Google Scholar]
  38. Song, C.; Zhang, J.; Liu, L.; Ma, W.; Ma, L.; Ding, S.; Zhao, H. Spatial and temporal characteristics of agricultural green development indicators in Hainan Island. Chinese J. Eco-Agri. 2020, 28, 1156–1167. [Google Scholar]
  39. Yu, X. Promoting Agriculture Green Development to realize the great rejuvenation of the Chinese nation. Front. Agr. Sci. Eng. 2020, 7, 112–113. [Google Scholar]
  40. Yin, C.; Li, F.; Wang, S.; Hao, A. The concept, connotation and principle of agricultural green development in China. Chinese J. Agri. Resour. Reg. Plan. 2021, 1, 1–6. [Google Scholar]
  41. Zhang, Y.; Liu, L. The influence of the Sci-Tech finance ecosystem on technological innovation from symbiotic perspective. Syst. Eng. 2021, 39, 25–36. [Google Scholar]
  42. Zhang, Y.; Mu, L.; Zhao, Y. Research on evaluation and countermeasures of regional green industry development. Ecol. Econ. 2017, 33, 41–44. [Google Scholar]
  43. Gai, M.; Yang, Q.; He, Y. Spatiotemporal changes and influencing factors of agricultural green development level in main grain producing areas in Northeast China. Resour. Sci. 2022, 44, 927–942. [Google Scholar] [CrossRef]
  44. Xiong, Y.; Liu, Q.; Hu, X. Evaluation of agricultural green development in main grain producing counties of Sichuan Province. Agr. Outlook. 2022, 18, 46–52. [Google Scholar]
  45. Hou, X.; Li, H.; Wang, Y.; Feng, G.; Liu, Y.; Li, X.; Gao, Q. Time variation characteristics of county agricultural green development index in Jilin Province-take Lishu County as an example. Chinese J. Eco-Agr. 2022. [Google Scholar] [CrossRef]
  46. Shen, S.; Wang, L. Study on agricultural green development efficiency and influencing factors based on unexpected output model-taking 11 cities in Hebei Province as an example. Innov. Sci. Tech. 2021, 21, 80–88. [Google Scholar]
  47. Yang, J. Construction and empirical research on county agricultural green development index—Based on county cross-sectional data of Hubei Province in 2017. Jiangsu Agr. Sci. 2021, 49, 24–30. [Google Scholar] [CrossRef]
  48. Duan, C.; Yu, C.; Li, S.; Zhong, Z.; He, Y. A comprehensive assessment of agricultural green development at the county level on the Tibetan plateau-a case study in Bailang County. Chinese J. Agri. Resour. Reg. Plan. 2022. [Google Scholar]
  49. Wei, L.; Zhang, A. Evaluation of agricultural green development level and obstacle factor analysis in Gansu Province. Terr. Nat. Resour. Stud. 2023, 1, 15–18. [Google Scholar]
  50. Li, L.; Wang, W. Spatial heterogeneity of manufacturing development quality in China: Analysis based on projection pursuit model. East China Econ. Manag. 2020, 34, 1–11. [Google Scholar] [CrossRef]
  51. Petridis, K.; Drogalas GZografidou, E. Internal auditor selection using a TOPSIS/nonlinear programming model. Ann. Oper. Res. 2021, 296, 513–539. [Google Scholar] [CrossRef]
  52. Neogi, D. Performance appraisal of select nations in mitigation of COVID-19 pandemic using entropy based TOPSIS method. Cien. Saude. Colet. 2021, 26, 1419–1428. [Google Scholar] [CrossRef] [PubMed]
  53. Wang, Z.; Wang, Z.; Zhang, G.; Wang, Z. Evaluation of agricultural extension service for sustainable agricultural development using a hybrid entropy and TOPSIS method. Sustain. 2021, 13, 1–17. [Google Scholar] [CrossRef]
  54. Ahmad, N.; Qahmash, A. Implementing fuzzy AHP and FUCOM to evaluate critical success factors for sustained academic quality assurance and ABET accreditation. PLoS ONE 2020, 15, 1–30. [Google Scholar] [CrossRef] [PubMed]
  55. Zizovic, M.; Pamučar, D. New model for determining criteria weights: Level based weight assessment (LBWA) model. Decis. Ma. Appl. Manage. Eng. 2019, 2, 126–137. [Google Scholar] [CrossRef]
  56. Li, Z. Projection pursuit technology (PPT) and its progress of application. Nat. Mag. 1997, 19, 224–227. [Google Scholar]
  57. Fu, Q.; Zhao, X. Principle and Application of Projection Pursuit Model; Science Press: Beijing, 2006. [Google Scholar]
  58. Lee, E.; Cook, D.; Klinke, S.; Lumley, T. Projection pursuit for exploratory supervised classification. J. Comput. Graph. Statist. 2005, 14, 831–846. [Google Scholar] [CrossRef]
  59. Grochowski, M.; Duch, W. Projection Pursuit Constructive Neural Networks Based on Quality of Projected Clusters, in: International Conference on Artificial Neural Networks; Springer: Berlin, 2008; pp. 754–762. [Google Scholar]
  60. Grear, T.; Avery, C.; Patterson, J.; Jacobs, D.J. Molecular function recognition by supervised projection pursuit machine learning. Sci. Rep. 2021, 11, 1–15. [Google Scholar] [CrossRef]
  61. Qu, L.; Wang, Y.; Liu, Y.; Ma, Q. Evaluation of water and land resources system bearing capacity and path optimization for rural revitalization. J. Nat. Resour. 2021, 36, 300–314. [Google Scholar] [CrossRef]
  62. Jin, J.; Liu, D.; Zhou, R.; Zhang, L.; Cui, Y.; Wu, C. Evaluation model of water resources carrying capacity based on projection pursuit weight optimization. Water Resour. Prot. 2021, 3, 1–6. [Google Scholar] [CrossRef]
  63. Wu, T. Agriculture Tourism and the Transformation of Rural Countryside. Tour. Geogr. 2018, 20, 354–357. [Google Scholar] [CrossRef]
  64. Unite States Department of Agriculture (USDA). Farm Security and Rural Investment Act of 2002. Available online: https://www.fns.usda.gov/pl-107-171 (accessed on 9 May 2023).
  65. He, W.; Ouyang, Z.; Wang, X.; Yang, X.; Lin, Q.; Kong, L.; Liu, X. Current situation and characteristics of green agricultural development in Japan and its enlightenments to China. Agr. Outlook. 2022, 6, 18–23. [Google Scholar]
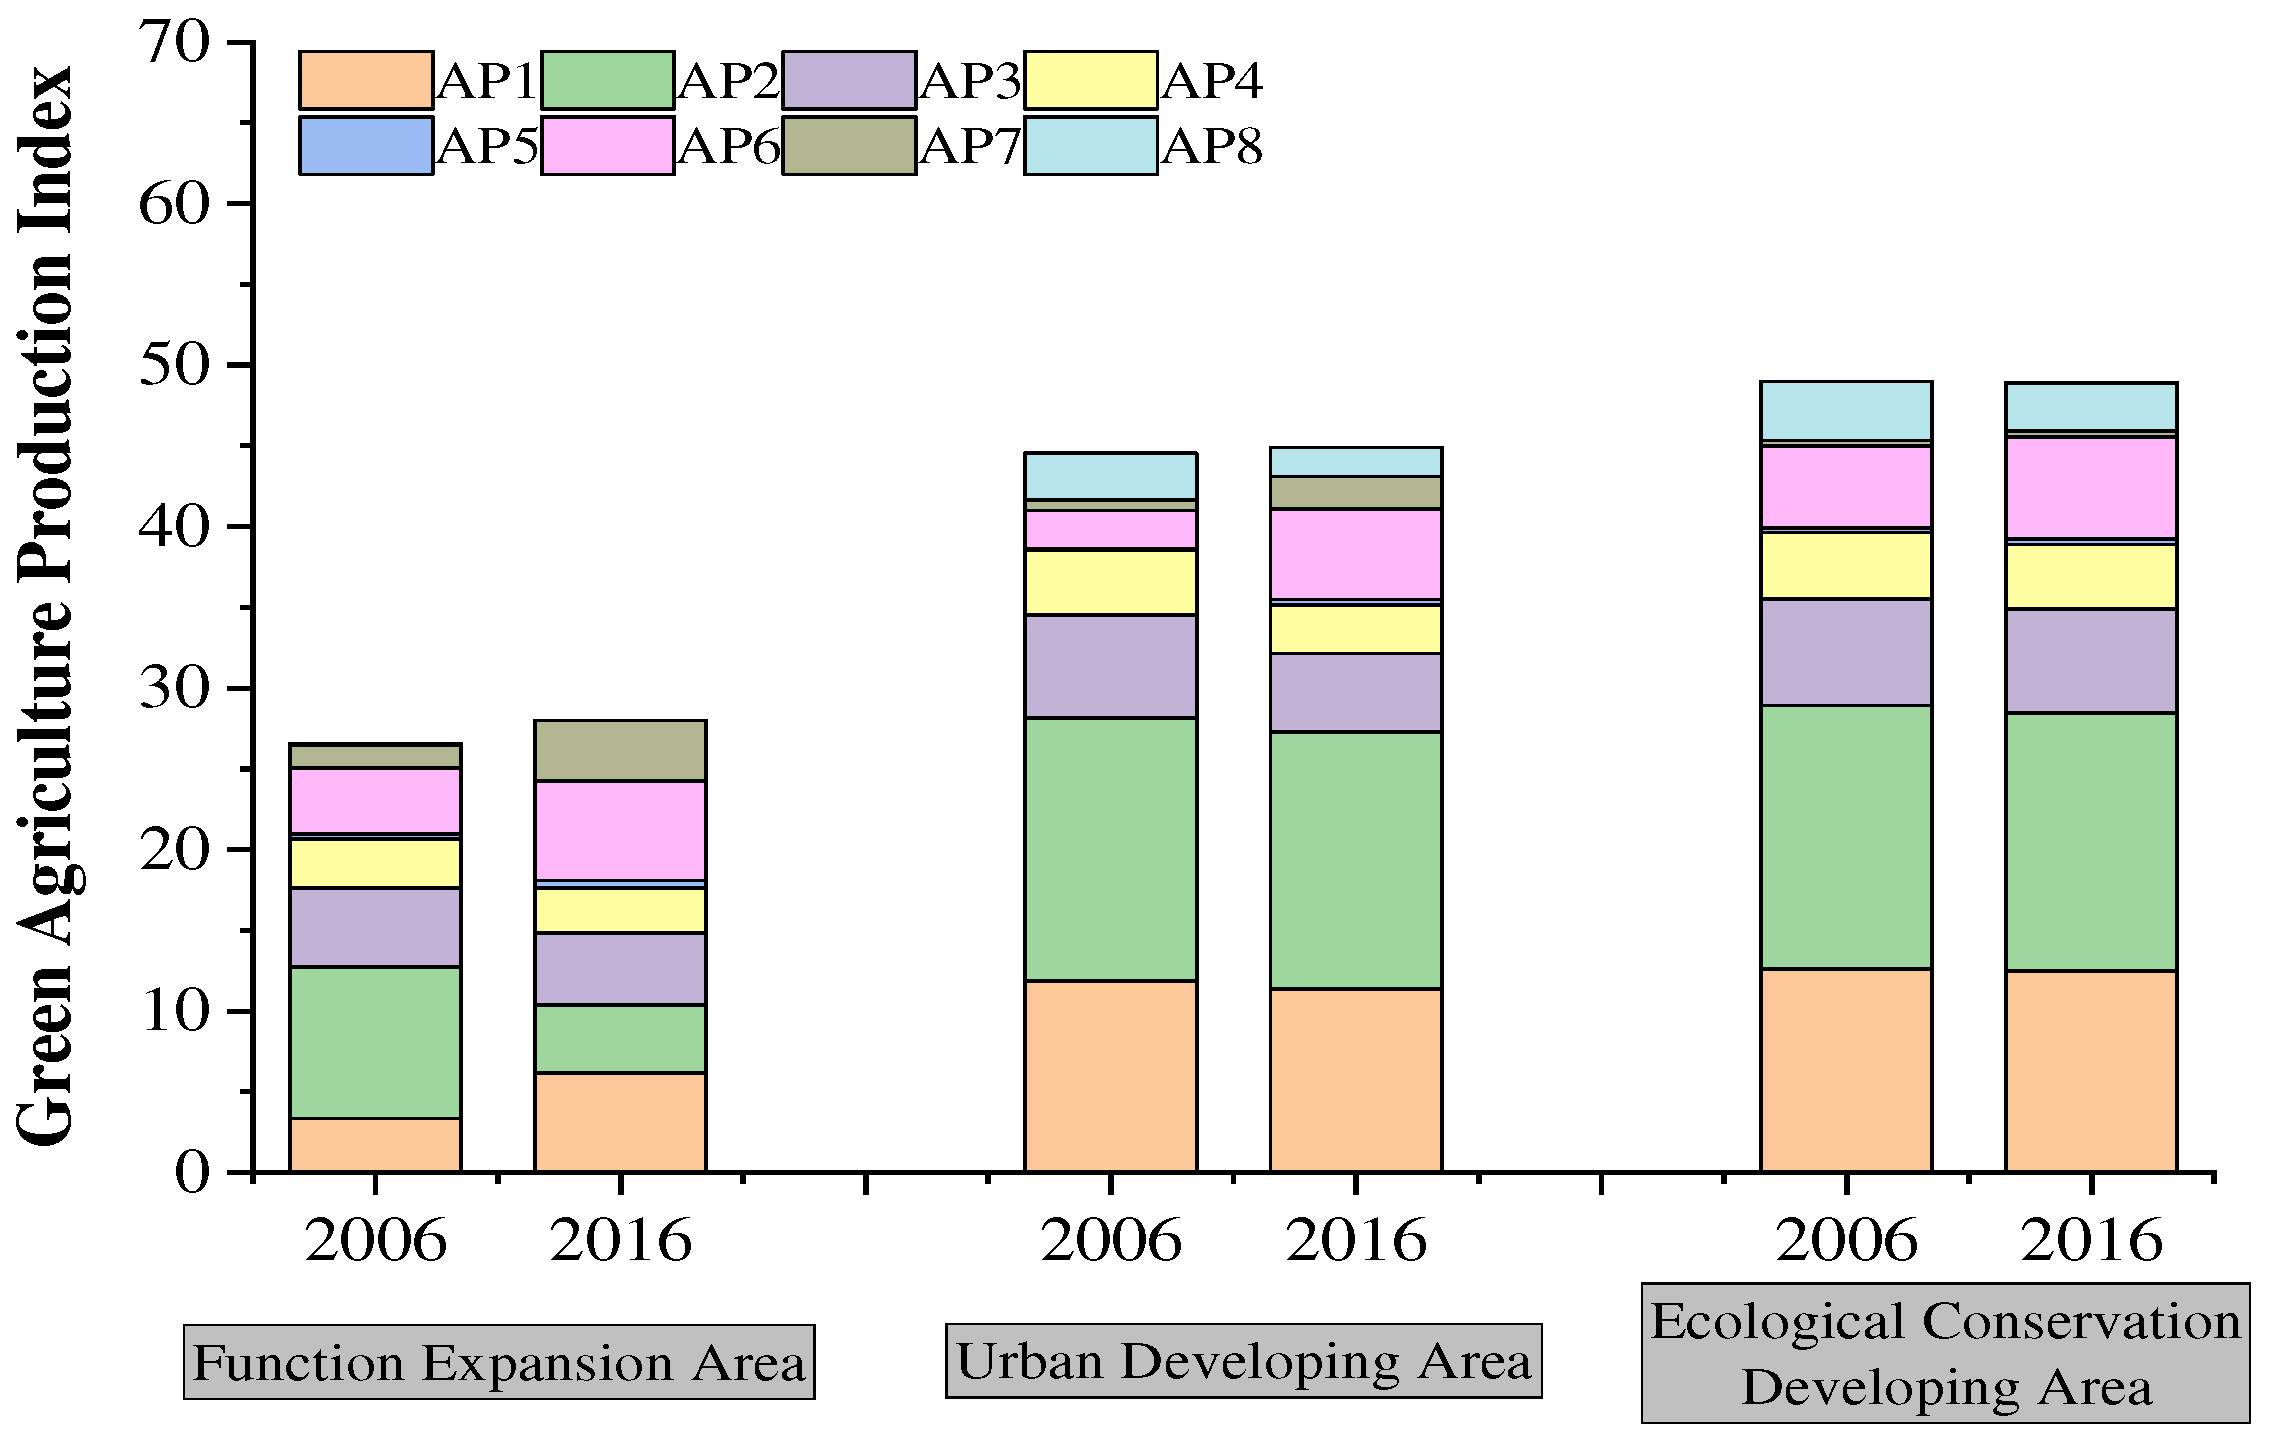
Figure 1. Green agricultural production indicators of Beijing in 2006 and 2016.
Preprints 88136 g001
Figure 2. Green agricultural production indicators of five districts in ECDA of Beijing in 2006 and 2016.
Preprints 88136 g002
Figure 3. Green agricultural revenue indicators of 13 districts in Beijing in 2006 and 2016.
Preprints 88136 g003
Figure 4. Green agricultural revenue indicators in ECDA of Beijing in 2006 and 2016.
Preprints 88136 g004
Figure 5. AGD index from 2006 to 2016 in districts of function expansion area (a), urban developing area (b), and ECDA (c).
Preprints 88136 g005aPreprints 88136 g005b
Figure 6. 6a: AGD index distribution map of 13 districts of Beijing in 2016; 6b: Change of AGD index values between 2006 and 2016 for 13 districts in Beijing.
Preprints 88136 g006
Table 1. The evaluating indicator framework of AGD in Beijing ECDA from 2006 to 2016.
Evaluation Layer Index Type Unit Weight Coefficient
Green agricultural production
2.08
AP1: energy consumption per unit of gross agricultural output value Negative 1000 tons of standard coal/1000 yuan 0.4220
AP2: energy consumption per unit of arable land area Negative 1000 tons of standard coal/ha 0.5329
AP3: fertilizer usage per unit of sown area Negative ton/ha 0.2753
AP4: fertilizer usage per unit of gross agriculture output value Negative kg/1000 Yuan 0.1711
AP5: water consumption per unit of arable land area Negative ton/ha 0.0169
AP6: water consumption per unit of gross agricultural output value Negative m3/1000 Yuan 0.2239
AP7: proportion of facility agriculture area in arable land area Positive % 0.1530
AP8: arable land area per capita Positive Ha/capita 0.2809
Green agricultural revenue
1.10
AI1: proportion of agritourism revenue in gross agricultural output value Positive % 0.0695
AI2: proportion of seed industry revenue in gross agricultural output value Positive % 0.2040
AI3: agricultural labor productivity Positive 1000 yuan/capita 0.2314
AI4: agricultural output value per unit of arable land area Positive 10 million yuan/ha 0.3428
AI5: proportion of fixed asset investment in rural areas Positive % 0.2503
Table 2. Top six indicators with obstacle degree greater than 6% in ECDA (The number in the brackets is obstacle degree of the indicator).
Ranking 1 2 3 4 5 6
2006 AP7 (8.35) AI1 (8.06) AI3 (7.85) AI2 (7.43) AI4 (7.38) AP3 (6.27)
2007 AP7 (8.50) AI1 (8.05) AI3 (7.82) AI2 (7.58) AI4 (7.38) AP3 (6.87)
2008 AP7 (8.47) AI1 (8.04) AI3 (7.83) AI2 (7.58) AI4 (7.33) AP3 (6.76)
2009 AI1 (8.13) AP7 (8.07) AI3 (7.84) AI4 (7.25) AI2 (7.16) AP3 (6.76)
2010 AP7 (8.68) AI1 (8.17) AI3 (7.80) AI2 (7.32) AI4 (7.14) AP3 (6.93)
2011 AP7 (9.02) AI1 (8.36) AI3 (7.80) AI2 (7.75) AI4 (6.96) AP3 (6.49)
2012 AP7 (9.18) AI1 (8.22) AI3 (8.05) AI2 (7.76) AI4 (6.99) AP5 (6.41)
2013 AP7 (9.57) AI1 (8.21) AI3 (8.10) AI2 (7.71) AP5 (7.67) AP8 (6.46)
2014 AP7 (10.08) AI3 (8.41) AI1 (8.09) AI2 (7.53) AP5 (7.47) AI4 (6.75)
2015 AP7 (10.74) AP5 (8.43) AI3 (8.32) AI1 (8.31) AI2 (7.62) AP4 (7.10)
2016 AP7 (11.26) AI3 (9.15) AI1 (8.39) AP5 (8.07) AI2 (7.81) AP4 (7.25)
Disclaimer/Publisher’s Note: The statements, opinions and data contained in all publications are solely those of the individual author(s) and contributor(s) and not of MDPI and/or the editor(s). MDPI and/or the editor(s) disclaim responsibility for any injury to people or property resulting from any ideas, methods, instructions or products referred to in the content.
Copyright: This open access article is published under a Creative Commons CC BY 4.0 license, which permit the free download, distribution, and reuse, provided that the author and preprint are cited in any reuse.
Prerpints.org logo

Preprints.org is a free preprint server supported by MDPI in Basel, Switzerland.

Subscribe

© 2024 MDPI (Basel, Switzerland) unless otherwise stated