Preprint
Article

On the Evaluation of Higher Harmonic Current Responses in Disordered Superconductors

Altmetrics

Downloads

94

Views

40

Comments

0

A peer-reviewed article of this preprint also exists.

This version is not peer-reviewed

Submitted:

19 October 2023

Posted:

19 October 2023

You are already at the latest version

Alerts
Abstract
We discuss a formalism which allows for the calculation of a higher harmonic current response to an applied electric field for disordered superconducting systems described on the basis of tight-binding models. The theory is based on an expansion of the density matrix in powers of the field amplitudes where we solve the equation of motion for the individual components. This allows the evaluation of higher order response functions on significantly larger lattices than one can achieve with a previously used approach, which is based on a direct temporal integration of the equation of motion for the complete density matrix. In case of small lattices, where both methods can be applied by including also the contribution of collective modes, we demonstrate the agreement of the corresponding results.
Keywords: 
Subject: Physical Sciences  -   Condensed Matter Physics

1. Introduction

Both, linear and non-linear response spectroscopies provide valuable and complementary information on the excitations of high-temperature superconductors. Since the discovery of these materials optical conductivity measurements have been central in advancing our understanding of the unusual electronic properties, including e.g. the superconducting gap, pseudogap or the transition from a Mott-insulating state to a (non-) Fermi liquid (for a review see e.g. [1]).
On the other hand, the development of non-equilibrium spectroscopies has significantly put forward our understanding of complex materials, due to the possibility of disentangling different dynamical processes via their different relaxation times. [2] With regard to superconducting materials, measurements of the non-linear current response have been recently been applied in order to elucidate the order parameter dynamics which, as a scalar quantity, is not visible in the equilibrium response. Corresponding experiments have been conducted in NbN [3,4,5], MgB2 [6,7], pnictides [8] and cuprate superconductors [9,10,11,12] whereas the theoretical understanding of these studies has been advanced in Refs. [13,14,15,16,17,18,19,20,21,22,23,24]. Basically, the current density in response to an applied vector potential A ( t ) can be expanded up to third order as j α = χ α β ( 1 ) A β + χ α β γ δ ( 3 ) A β A γ A δ where χ ( 1 ) is the linear response which is related to the optical conductivity. On the other hand, χ ( 3 ) incorporates processes where the (scalar) order parameter fluctuations δ Δ are driven by terms quadratic in A ( t ) so that the third harmonic generation (THG) is expected to be enhanced at twice the frequency of the incoming field 2 ω corresponding to the spectral gap 2 Δ of the superconductor (SC). However, it has been shown [13] that for clean single-band s-wave SC’s these amplitude (’Higgs’) excitations yield only a minor contribution to the THG which instead is dominated by the BCS quasiparticle excitations across the SC spectral gap. For a square lattice, the amplitude excitations only become visible when the THG is measured at an angle of π / 4 with respect to the bond direction which suppresses the QP contribution. For a clean system the response is only due to the diamagnetic current while disorder induces also a paramagnetic contribution [4,15,16,19]. It has been shown [19] that at moderate disorder the response is still dominated by the BCS part while collective modes may yield comparable contributions only in the limit of strong disorder.
In this context various approximations for the theoretical description of disorder within the BCS theory have been considered. In the weakly disordered limit k F l 1 previous work [16,21] is either based on the Mattis-Bardeen model [25] or on the self-consistent Born approximation [4]. The summation of diagrams with impurity ladders, equivalent to the solution of quasiclassical Eilenberger equations and formally valid for arbitrary scattering rate, has been accomplished in Ref. [15]. In our previous work [19,26] we have treated the influence of disorder on the THG exactly by solving the time-dependent Bogoljubov-de Gennes equations on finite lattices with local Anderson-type disorder. Formally this has been achieved by adding a time-dependent vector potential to the hamiltonian and by computing the resulting dynamics from the equation of motion for the time-dependent density matrix. This formalism can be accomplished in two different ways which have been used in Ref. [19] and Ref. [26], respectively. First, the dynamics of the full density matrix can be computed from the equation of motion and at the end the various harmonic contributions, proportional to the corresponding power in the amplitude of the applied vector potential A 0 n , have to be extracted numerically, see [19]. This is a rather flexible approach, which allows to consider the influence of collective modes (amplitude, phase, charge) and in principle also allows to incorporate different pump-probe protocols. However, for a lattice with N sites, the density matrix for a superconductor has dimensions 2 N × 2 N so that the formalism is restricted to small lattices only. Second, as outlined in Ref. [26], the density matrix can be expanded from the beginning in powers of the applied vector potential. The equations of motion can be immediately formulated in frequency space for the individual components and allow for the computation of the current response at the respective order. This approach is less flexible in the time domain but can be applied to much larger lattices as relevant for the investigation of d-wave superconductors, at least on the BCS level, as has been demonstrated in Ref. [26].
Here we compare in detail both formalisms and also discuss how collective modes can be incorporated into the second approach. Section 2 introduces the model and we will analyze the two different approaches for the computation of the THG in disordered tight-binding lattices in Section 3. In the same section we also compare the outcome of both procedures for the case of a disordered s-wave system. We conclude our discussion in Section 4.

2. Model

We illustrate our formalism within the attractive Hubbard model on a square lattice plus local on-site disorder (cf. e.g., [19,27,28,29,30,31])
H = i j σ t i j c i σ c j σ | U | i n i n i + i σ V i n i σ
where the local potential V i is taken from a flat distribution V 0 V i + V 0 .
To describe the SC state Equation (1) is solved in mean-field using the BdG transformation
c i σ = k u i ( k ) γ k , σ σ v i * ( k ) γ k , σ
which yields the eigenvalue equations
ω k u n ( k ) = j t n j u j ( k ) + [ V n | U | 2 n n μ ] u n ( k ) + Δ n v n ( k )
ω k v n ( k ) = j t n j * v j ( k ) [ V n | U | 2 n n μ ] u n ( k ) + Δ n * u n ( k )
and the SC order parameter is defined as Δ n = | U | c n , c n , .
From the eigenvalue problem Equations (2,3) one can iteratively determine the ground state density matrix R with the elements
ρ i j = c i , c j , = k v i ( k ) v j * ( k ) ( 1 f ( E k ) ) + u i * ( k ) u j ( k ) f ( E k ) ρ ¯ i j = c i , c j , = k u i ( k ) u j * ( k ) ( 1 f ( E k ) ) + v i * ( k ) v j ( k ) f ( E k ) κ i j = c i , c j , = k u i ( k ) v j * ( k ) ( 1 f ( E k ) ) + v i * ( k ) u j ( k ) f ( E k )
and which in compact notation can be written as
R = ρ κ κ ρ ¯ .
The BdG approximated energy can then be expressed via the density matrix as
E B d G = i j t i j ρ i j ρ ¯ i j + U i ρ i i ( 1 ρ ¯ i i ) + κ i i * κ i i + i V i ρ i i ρ ¯ i i + 1 ,
and the BdG-hamiltonian matrix is defined as
H i j B d G = E B d G R j i .
In the absence of an external field the density matrix R and the Hamiltonian H B d G commute, so that the density matrix has no time evolution. The dynamics of R ( t ) is induced via the coupling to the electromagnetic field E ( t ) = A ( t ) / t . Let us consider e.g the case of a (spatially constant) field along the x direction. A x ( t ) is coupled to the system via the Peierls substitution c i + x , σ c i , σ e i A x ( t ) c i + x , σ c i , σ , where for simplicity we will drop from the equations all the constant by putting the lattice spacing, the electronic charge e, the light velocity c and the Planck constant equal to one. The Peierls substitution, modifies the kinetic-energy part, leading to the following contribution to E B d G :
T B d G = t e i A x ρ i + x , i + e i A x ρ i x , i e i A x ρ ¯ i + x , i e i A x ρ ¯ i + x , i t e i A x ρ i + x , i + y + e i A x ρ i x y , i e i A x ρ ¯ i + x + y , i e i A x ρ ¯ i + x + y , i + e i A x ρ i + x , i y + e i A x ρ i x + y , i e i A x ρ ¯ i + x y , i e i A x ρ ¯ i + x y , i
where we have included a nearest ( t ) and next-nearest ( t ) neighbor hopping into the hamiltonian.

3. Computation of the Dynamics

The equation of motion for the density matrix reads
i d d t R = R , H B d G
with the BdG hamiltonian matrix given by Equation (4).
Solving Equation (6) yields a time-dependent BdG energy E B d G ( t ) and thus a time-dependent current density which is obtained from
j x ( t ) = 1 N E B d G A x = 1 N T B d G ( t ) A x
with N denoting the number of sites. The task is now to evaluate the current reponse for a given order in the amplitude of the applied vector potential. As a first step we expand Equation (5) up to third order in A x which yields
j x = 1 1 2 A x 2 j p a r a x + A x 1 1 6 A x 2 j d i a x
with
j p a r a x = i t n ρ n + x , n ρ ¯ n x , n ρ n x , n + ρ ¯ n + x , n + i t n ρ n + x + y , n ρ ¯ n x y , n ρ n x y , n + ρ ¯ n + x + y , n + i t n ρ n + x y , n ρ ¯ n x + y , n ρ n x + y , n + ρ ¯ n + x y , n j d i a x = t n ρ n + x , n ρ ¯ n x , n + ρ n x , n ρ ¯ n + x , n t n ρ n + x + y , n ρ ¯ n x y , n + ρ n x y , n ρ ¯ n + x + y , n t n ρ n + x y , n ρ ¯ n x + y , n + ρ n x + y , n ρ ¯ n + x y , n .
Here the subscript p a r a and d i a refer to the usual identification of the leading terms coupling the gauge field to the fermionic operators in the Hamiltonian, i.e. the linear coupling between the paramagnetic term and A x , and a quadratic coupling between the electronic density and A x 2 , that leads to the standard diamagnetic contribution to the current in linear response. However, both j p a r a x and j d i a x still contain the vector potential to all orders in A x .
Writing A x ( t ) = A 0 f ( t ) we can expand the currents in a power series in A 0
j p a r a x = n A 0 n j p a r a x , ( n ) j d i a x = n A 0 n j d i a x , ( n )
which upon inserting into Equation (8) allows us to extract the various current contributions to order n, j x ( n ) . In particular, the 3rd harmonic contribution to the current density reads
j x ( 3 ) ( t ) = j p a r a x , ( 3 ) ( t ) 1 2 f 2 ( t ) j p a r a x , ( 1 ) ( t ) + f ( t ) j d i a x , ( 2 ) ( t ) 1 6 f 3 ( t ) j d i a x , ( 0 )
where we find that the dominant para- and diamagnetic contributions are given by j p a r a x , ( 3 ) and A 0 j d i a x , ( 2 ) . On the other hand, j p a r a x , ( 1 ) and j d i a x , ( 0 ) also enter the calculation of the optical conductivity in first order.
In Ref. [19] we have numerically integrated Equation (6) using an Adams-Bashforth algorithm and an initializing 4th order Runge-Kutta method. The resulting time-dependent currents j p a r a x and j d i a x then have been separated numerically into the individual components j p a r a x , ( n ) and j d i a x , ( n ) from which, after Fourier transformation, the frequency dependent third harmonic response Equation (9) has been evaluated. In particular at low energies, this procedure is rather time consuming since the integration has to be performed over several periods of the incoming field.
Here we compare this approach with a different strategy where from the beginning we expand the density matrix in powers of the applied vector potential
R = n = 0 A 0 n R ( n ) .
Here R ( 0 ) is the equilibrium density matrix for which
R ( 0 ) , H B d G = 0 ,
as we already emphasized above.
According to Equation (9) higher order contributions to the density matrix R ( n ) allow for the computation of the non-harmonic current responses j p a r a x , ( n ) and j d i a x , ( n ) which, as we will show in the following, can be directly obtained in frequency space. The next subsections will address in detail the evaluation of current responses up to 3rd order including the contribution from collective mode via the random phase approximation (RPA).

3.1. First order

The first order current contribution, relevant for the evaluation of the optical conductivity, is given by
j x ( 1 ) = j p a r a x , ( 1 ) + A 0 j d i a x , ( 0 )
which requires evaluation of the density matrix up to order n = 1 .
By selecting all terms A 0 in the equation of motion Equation (6) one obtains
i R ˙ ̲ ̲ ( 1 ) = R ̲ ̲ ( 1 ) , H ̲ ̲ ( 0 ) | U | R ̲ ̲ ( 0 ) , D ̲ ̲ ( 1 ) + f ( t ) R ̲ ̲ ( 0 ) , V ̲ ̲
with
V ̲ ̲ = v ̲ ̲ 0 ̲ ̲ 0 ̲ ̲ v ̲ ̲
and
v n m = i t δ m , n + x δ m , n x i t δ m , n + x + y δ m , n x y i t δ m , n + x y δ m , n x + y .
The matrix D ̲ ̲ ( 1 ) is defined as
D ̲ ̲ ( 1 ) = ρ ¯ D ( 1 ) κ D , ( 1 ) κ D ( 1 ) ρ D ( 1 )
and the subscript D indicates that it only contains the diagonal elements of the respective matrices, e.g. [ ρ D ( 1 ) ] n m [ ρ ( 1 ) ] n m δ n m which are part of R ̲ ̲ ( 1 ) .
The non-perturbed hamiltonian H ̲ ̲ ( 0 ) (i.e. for A 0 = 0 ) can be diagonalized
H ˜ ̲ ̲ ( 0 ) = T ̲ ̲ 1 H ̲ ̲ ( 0 ) T ̲ ̲ = E N 0 0 0 0 0 E 1 0 0 0 0 E 1 0 0 0 0 E N
and the same transformation also diagonalizes the non-perturbed density matrix
R ˜ ̲ ̲ ( 0 ) = T ̲ ̲ 1 R ̲ ̲ ( 0 ) T ̲ ̲ = 1 0 0 0 0 0 1 0 0 0 0 0 0 0 0 0 0 .
With this transformation Equation (13) can be written as
i R ˜ ˙ n m ( 1 ) = ( E m m E n n ) R ˜ n m 1 | U | ( R ˜ n n 0 R ˜ m m 0 ) D ˜ n m ( 1 ) + ( R ˜ n n 0 R ˜ m m 0 ) V ˜ n m f ( t )
where V ˜ ̲ ̲ and D ˜ ̲ ̲ ( 1 ) denote the transformed matrices Equations (14,15).
We now perform a Fourier transformation
R ˜ n m 1 ( ω ) = d t e i ω t R ˜ n m 1 ( t ) f ( ω ) = d t e i ω t f ( t )
so that Equation (16) reads
R ˜ n m 1 ( ω ) = R ˜ n n 0 R ˜ m m 0 ω E m m + E n n V ˜ n m f ( ω ) | U | R ˜ n n 0 R ˜ m m 0 ω E m m + E n n D ˜ n m ( 1 ) χ ˜ n m ( 0 ) ( ω ) V ˜ n m f ( ω ) | U | χ ˜ n m ( 0 ) ( ω ) D ˜ n m ( 1 ) .
On the BCS level ( U = 0 ) the density matrix is now obtained by transforming back to R i j ( 1 ) in the original site representation. For the practical computation, χ ˜ n m ( ω ω i ϵ ) should be shifted into the complex plane in order to avoid singularities.
Including fluctuations means to include the corrections due to the matrix D ̲ ̲ ( 1 ) . In the original site representation and in case of local interactions (as in the present case of the attractive Hubbard model) D ̲ ̲ ( 1 ) has only diagonal elements in ρ and κ which in the following we denote by greek letters, i.e. D α β ( 1 ) refers to a non-zero element of the matrix D ̲ ̲ ( 1 ) . The case of intersite interactions, as e.g. relevant for the description of d-wave superconductivity requires a corresponding modification of the following discussion.
However, in the present case the elements D α β ( 1 ) are related to diagonal elements of the density matrix which we obtain by backtransforming Equation (17)
R α β ( 1 ) = T α n χ ˜ n m ( 0 ) ( ω ) V ˜ n m T m β 1 f ( ω ) | U | T α n χ ˜ n m ( 0 ) ( ω ) D ˜ n m ( 1 ) T m β 1 τ α ν y D ν μ ( 1 ) , τ μ β y = τ β ν y D ν μ ( 1 ) τ μ α y
where we have used the following identity for the diagonal elements of the density matrix
R ̲ ̲ D ( 1 ) = τ ̲ ̲ y D ̲ ̲ ( 1 ) , τ ̲ ̲ y
with
τ ̲ ̲ y = 0 ̲ ̲ i 1 ̲ ̲ i 1 ̲ ̲ 0 ̲ ̲ .
Equation (18) can be solved for D ν μ ( 1 ) as
D ν μ ( 1 ) = τ μ α y T α n χ ˜ n m ( 0 ) ( ω ) V ˜ n m T m β 1 τ β ν y f ( ω ) + | U | τ μ α y T α n χ ˜ n m ( 0 ) ( ω ) D ˜ n m ( 1 ) T m β 1 τ β ν y = τ μ α y T α n χ ˜ n m ( 0 ) ( ω ) V ˜ n m T m β 1 τ β ν y f ( ω ) + | U | τ μ α y T α n χ ˜ n m ( 0 ) ( ω ) T n ρ 1 D ρ σ ( 1 ) T σ m T m β 1 τ β ν y
where in the last step we have transformed back D ˜ ( 1 ) into the original site representation.
We now define
K ν μ = τ μ α y T α n χ ˜ n m ( 0 ) ( ω ) V ˜ n m T m β 1 τ β ν y
W ν μ , ρ σ = τ μ α y T α n χ ˜ n m ( 0 ) ( ω ) T n ρ 1 T σ m T m β 1 τ β ν y
so that the equation for D ̲ ̲ ( 1 ) is given by
D ν μ ( 1 ) = K ν μ ( ω ) f ( ω ) + | U | W ν μ , ρ σ D ρ σ ( 1 )
or
δ ν μ , ρ σ | U | W ν μ , ρ σ M ν μ , ρ σ D ρ σ ( 1 ) = K ν μ ( ω ) f ( ω )
and therefore
D ̲ ̲ ( 1 ) ( ω ) = M ̲ ̲ 1 ( ω ) K ̲ ̲ ( ω ) f ( ω ) .
Inserting the transformed solution of Equation (25) into Equation (17) yields the transformed solution for the density matrix.
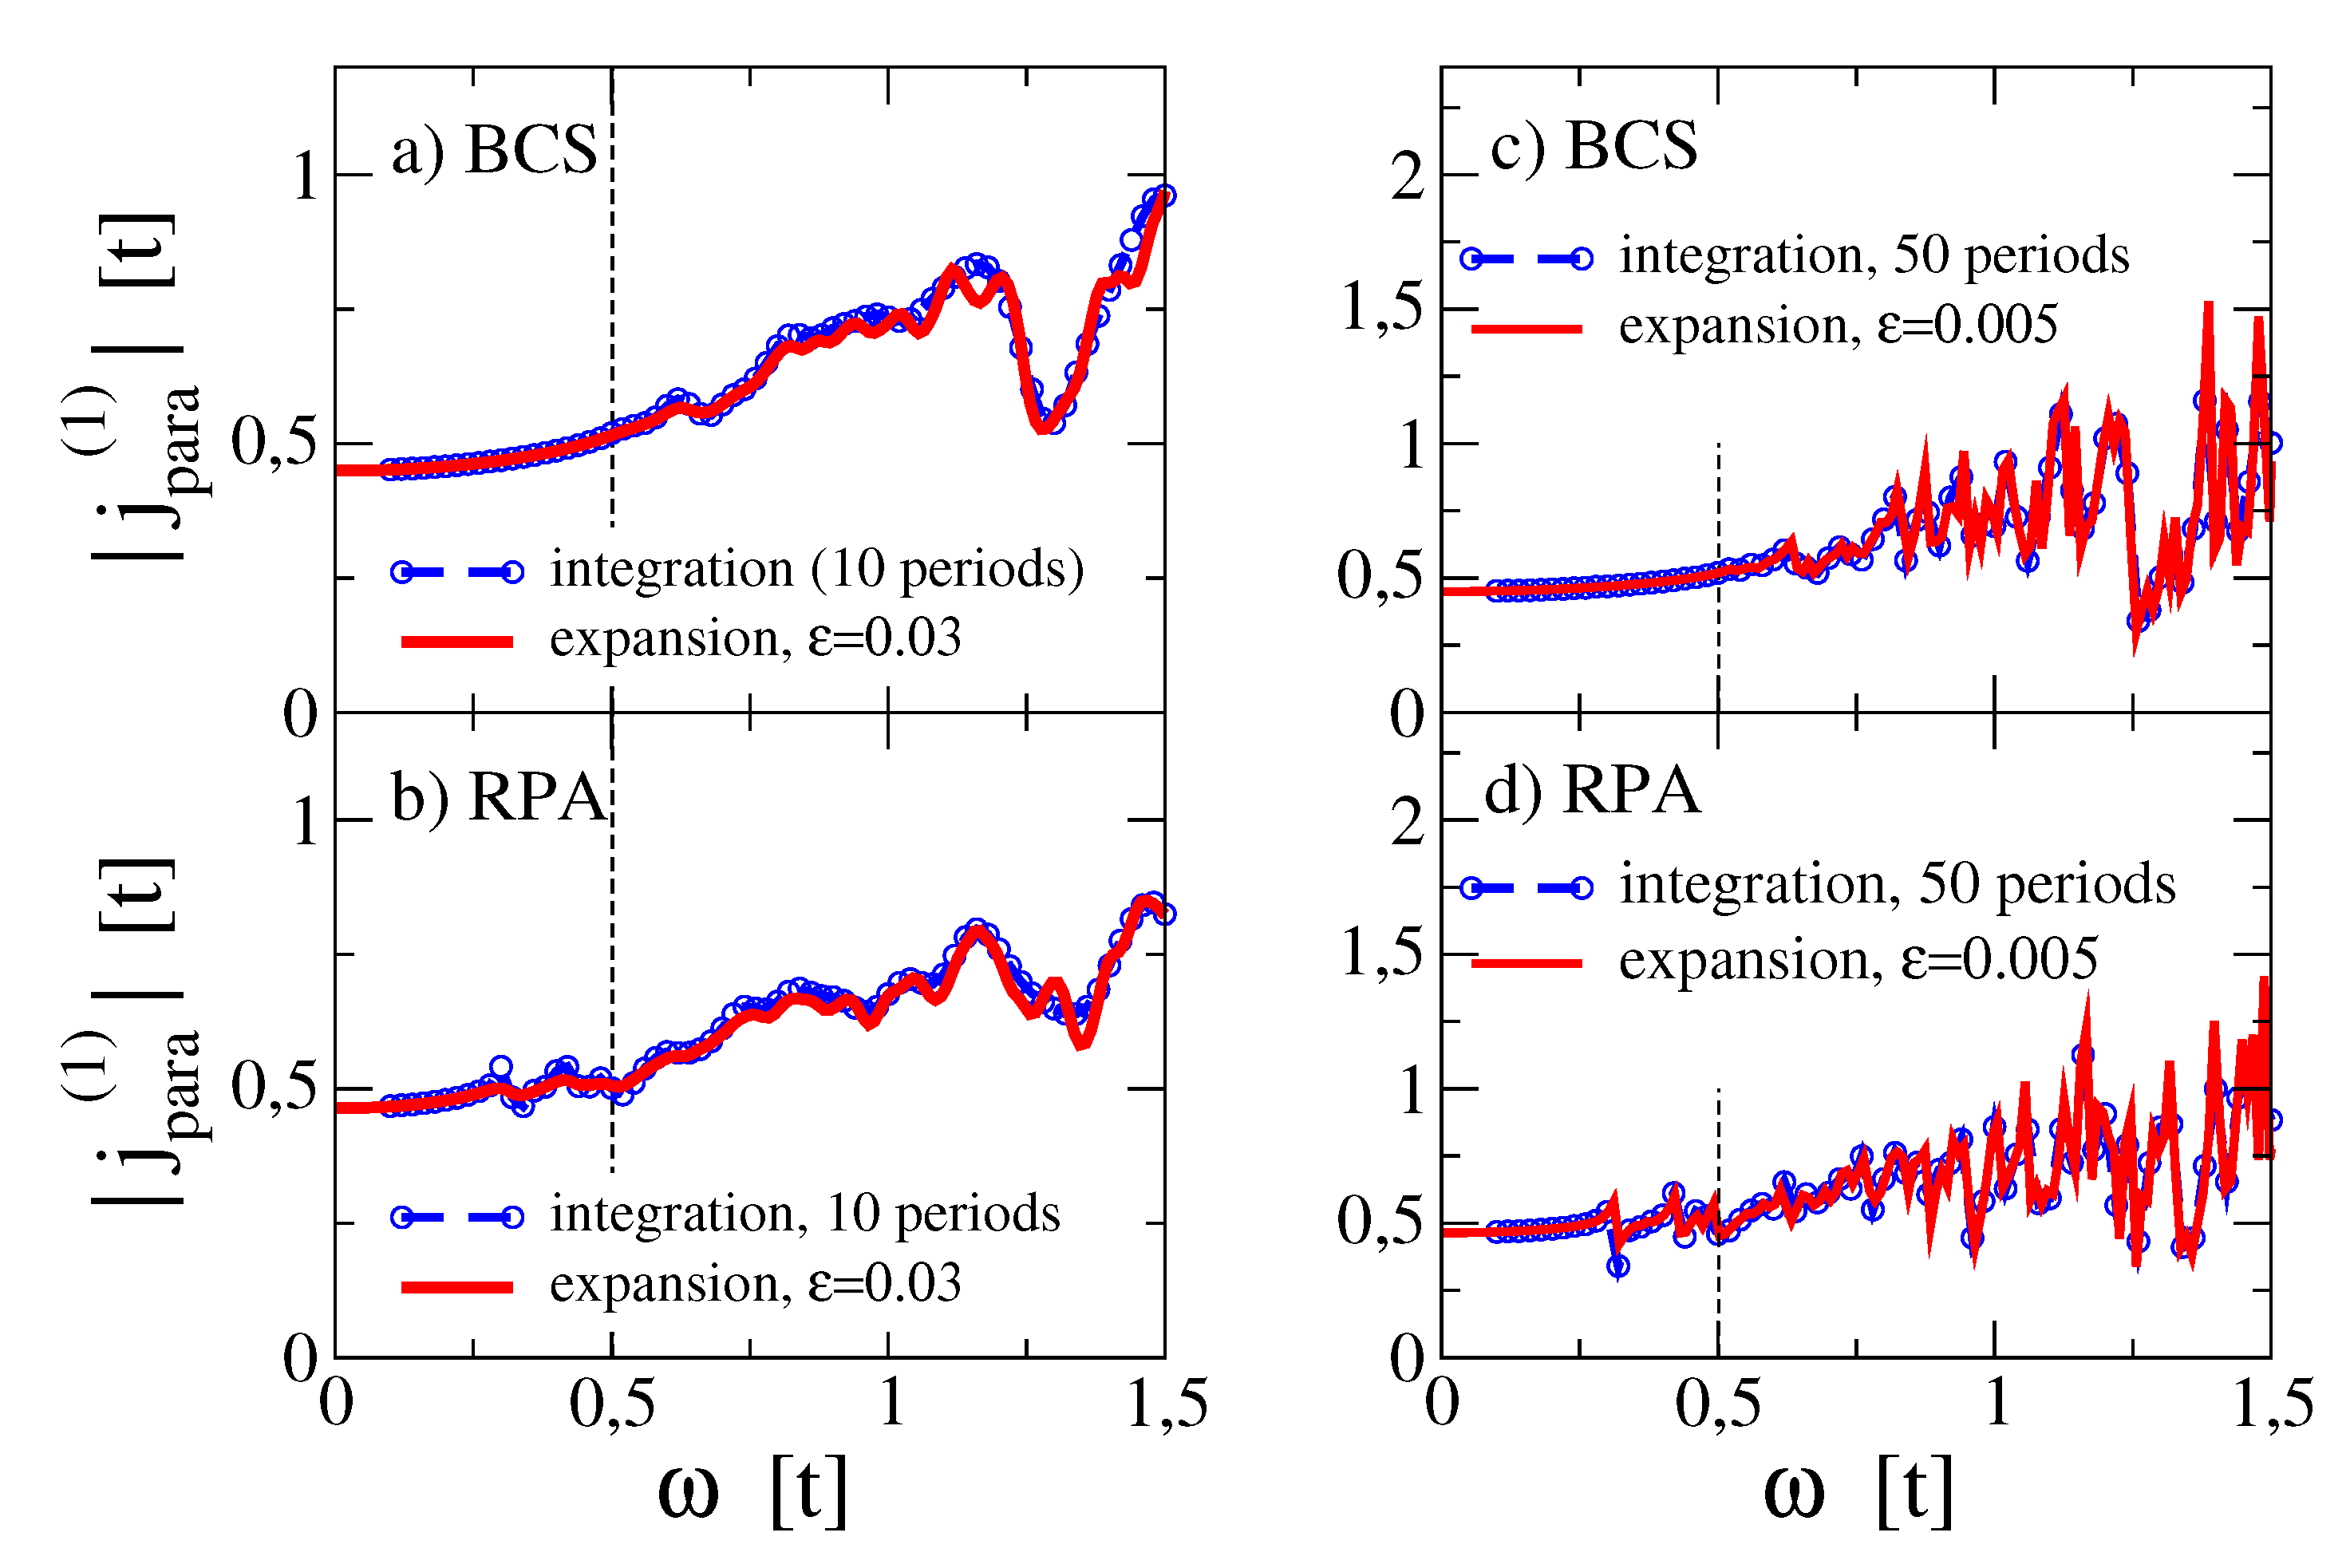
Figure 1 shows the magnitude of the first harmonic response for a particular disorder configuration ( V / t = 1 ) on a 8 × 8 square lattice. We compare the current, obtained from the direct time integration of Equation (6) with the result from Equation (17). For the BCS result, we have neglected the time evolution of local charge densities and anomalous correlations in the BdG hamiltonian Equation (4). This amounts to neglect the contribution of D ˜ in Eq. (17) which instead is relevant for the inclusion of collective modes within the RPA. In particular phase modes are responsible for the excitations (peaky structures in Figure 1b,d) below the optical gap 2 Δ , cf. Ref. [19]. Note that Figure 1 reports the magnitude of the first order current response so that the finite BCS response below 2 Δ is due to the real part of the current-current correlations. Obviously the energy resolution in the direct time integration (blue dotted lines) depends on the time interval over which the time integration is performed. In the expansion approach, Equation (17) this resolution can be mimicked by using different values for the parameter ϵ which shifts the energy into the complex plane. However, a finite ϵ describes an exponential damping of the time dependent density matrix over a time scale 1 / ϵ . On the other hand, there is no damping in the time integration method but the integration is simply performed over a fixed time interval. In Figure 1 we use 10 (panels a,b) and 50 (panels c,d) periods of the applied vector potential as time interval for the integration. Note that for each frequency point a separate time integration is required.

3.2. Second order

We proceed by evaluating the diamagnetic contribution to the third harmonic current A 0 j d i a x , ( 2 ) , cf. Equation (9). Collecting all term A 0 2 we find for the correction to the density matrix in second order
i R ˙ ̲ ̲ ( 2 ) ( t ) = R ̲ ̲ ( 2 ) ( t ) , H ̲ ̲ ( 0 ) + R ̲ ̲ ( 1 ) ( t ) , V ̲ ̲ f ( t ) + 1 2 R ̲ ̲ ( 0 ) , C ̲ ̲ f 2 ( t ) | U | R ̲ ̲ ( 1 ) , D ̲ ̲ ( 1 ) | U | R ̲ ̲ ( 0 ) , D ̲ ̲ ( 2 )
where we have defined the matrix
C ̲ ̲ = c ̲ ̲ 0 ̲ ̲ 0 ̲ ̲ c ̲ ̲
and
c n m = t δ m , n + x + δ m , n x + t δ m , n + x + y + δ m , n x y + t δ m , n + x y + δ m , n x + y .
Fourier transformation yields
ω R ̲ ̲ ( 2 ) ( ω ) = R ̲ ̲ ( 2 ) ( ω ) , H ̲ ̲ ( 0 ) + d ν R ̲ ̲ ( 1 ) ( ν ) , V ̲ ̲ f ( ω ν ) + 1 2 R ̲ ̲ ( 0 ) , C ̲ ̲ d ν f ( ν ) f ( ω ν ) | U | d ν R ̲ ̲ ( 1 ) ( ν ) , D ̲ ̲ ( 1 ) ( ω ν ) | U | R ̲ ̲ ( 0 ) , D ̲ ̲ ( 2 ) ( ω )
which upon applying the transformation to diagonal states can be written as
R ˜ n m ( 2 ) ( ω ) = 1 2 χ ˜ n m ( 0 ) ( ω ) C ˜ n m d ν f ( ν ) f ( ω ν ) | U | χ ˜ n m ( 0 ) ( ω ) D ˜ n m ( 2 ) ( ω ) + 1 ω + E n n E m m d ν r ˜ ( 1 ) ( ν ) , ϑ ˜ ( ω ν ) n m f ( ν ) f ( ω ν ) .
Here we have defined
R ˜ n m ( 1 ) ( ω ) r ˜ n m ( 1 ) ( ω ) f ( ω ) = χ ˜ n m ( 0 ) ( ω ) ϑ n m ( ω ) f ( ω ) ϑ n m ( ω ) V ˜ n m | U | d ˜ ( 1 ) ( ω ) n m D ˜ n m ( 1 ) ( ω ) d ˜ n m ( 1 ) ( ω ) f ( ω ) .
We can now follow the same procedure than in case of the 1st order RPA calculation. By transforming to the real space representation, where D n m ( 2 ) is again diagonal (similar to Equation (15)), one obtains
D ρ σ ( 2 ) ( ω ) = M ρ σ , ν μ 1 ( ω ) G ν μ ( ω ) d ν f ( ν ) f ( ω ν ) M ρ σ , ν μ 1 ( ω ) τ μ α y T α , n 1 ω + E n n E m m d ν r ˜ ( 1 ) ( ν ) , ϑ ˜ ( ω ν ) n m T m β 1 τ β ν y f ( ν ) f ( ω ν )
where the matrix M ̲ ̲ is the same than in Equation (24) and we have defined
G ν μ = 1 2 τ μ α y T α n χ ˜ n m ( 0 ) ( ω ) C ˜ n m T m β 1 τ β ν y .
Then by solving Equation (30) and plugging the transformed result into Equation (29) one obtains the second order frequency dependent contribution to the density matrix in response to an external field f ( ω ) .
We exemplify the result for a harmonic external field with f ( ω ) = δ ( ω Ω ) + δ ( ω + Ω ) . Then from Equation (9) it turns out that the diamagnetic contribution to j x ( 3 ) ( t ) is given by f ( t ) j d i a x , ( 2 ) ( t ) which upon Fourier transformation implies that j x ( 3 ) ( ω ) is given by j d i a x , ( 2 ) ( ω Ω ) . Thus the diamagnetic response at ω = 3 Ω is determined by the density matrix R ˜ n m ( 2 ) ( ω Ω ) . From Equations (29,30) one finds
R ˜ n m ( 2 ) ( ω Ω ) = 1 2 χ ˜ n m ( 0 ) ( 2 Ω ) C ˜ n m δ ( ω 3 Ω ) | U | χ ˜ n m ( 0 ) ( 2 Ω ) D ˜ n m ( 2 ) ( ω Ω ) + 1 2 Ω + E n n E m m r ˜ ( 1 ) ( Ω ) , ϑ ˜ ( Ω ) n m δ ( ω 3 Ω ) ,
with
D ρ σ ( 2 ) ( ω Ω ) = M ρ σ , ν μ 1 ( 2 Ω ) G ν μ ( 2 Ω ) δ ( ω 3 Ω ) M ρ σ , ν μ 1 ( 2 Ω ) τ μ α y T α , n 1 2 Ω + E n n E m m × r ˜ ( 1 ) ( Ω ) , ϑ ˜ ( Ω ) n m T m β 1 τ β ν y δ ( ω 3 Ω ) .
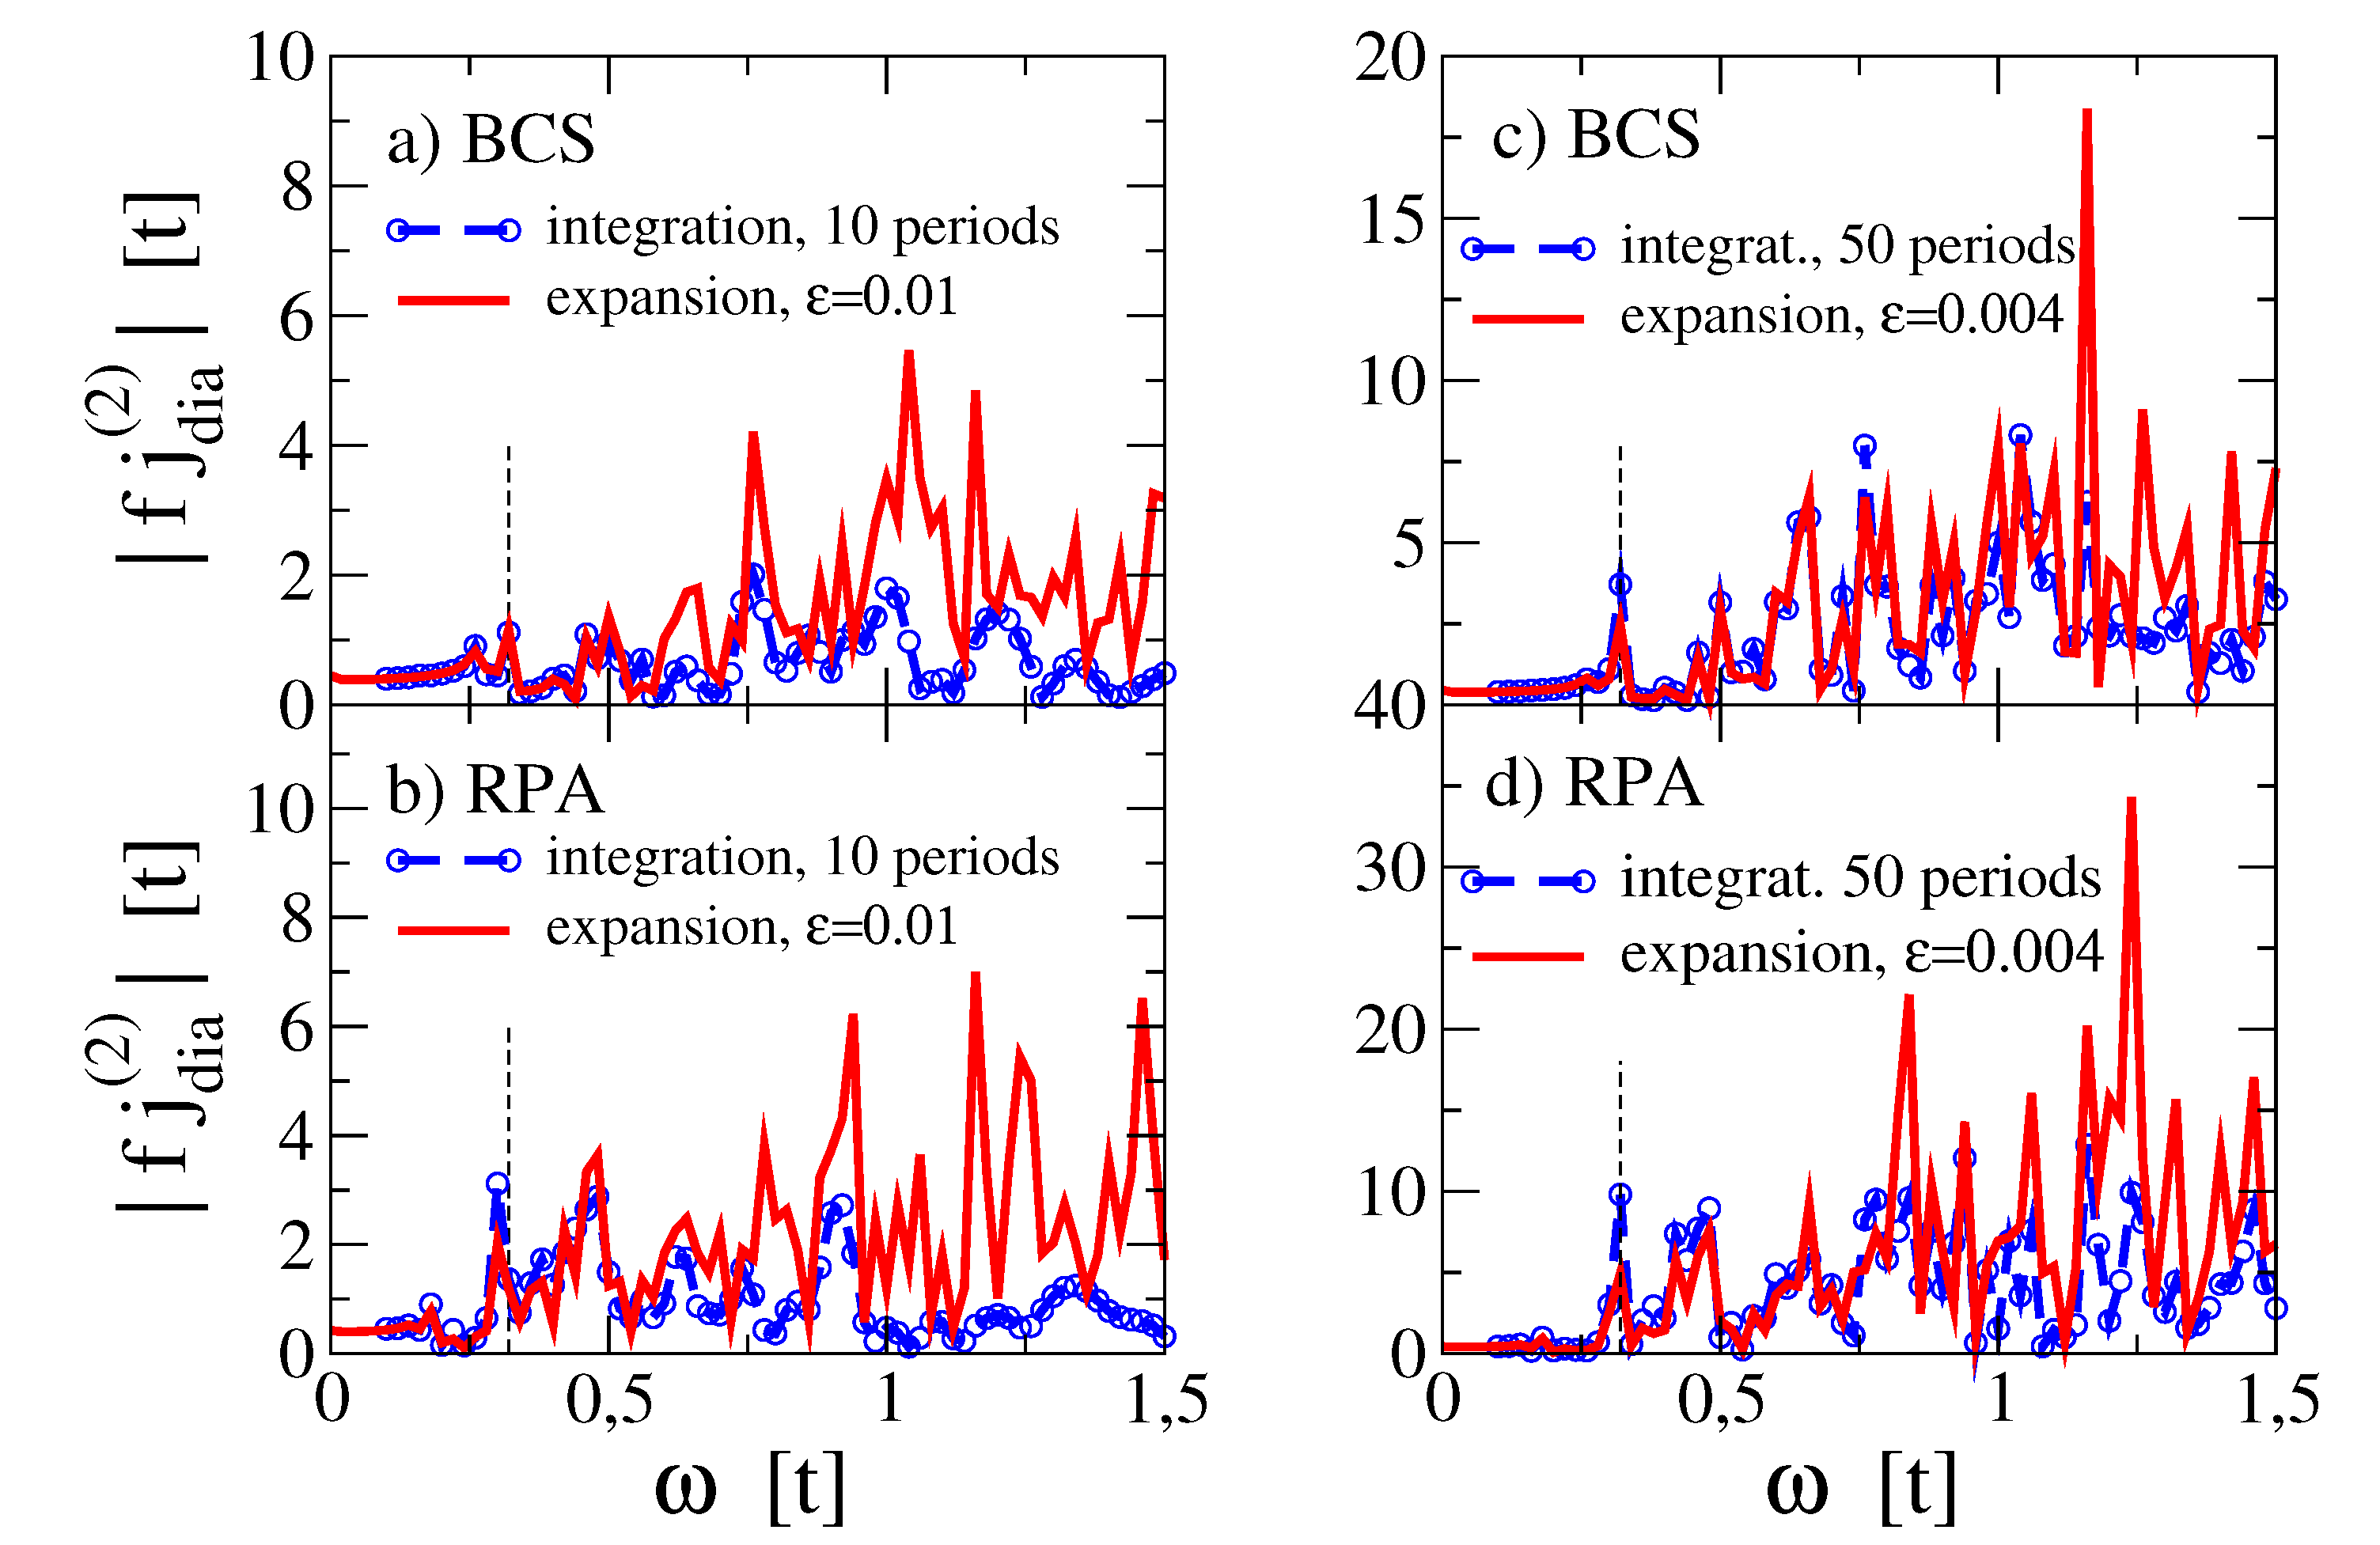
Figure 2 compares the second harmonic response from the direct time integration of Equation (6) with the expansion from Equations (32,33) for a particular disorder realization. As discussed in Ref. [19] disorder washes out the resonance at ω = Δ and collective modes only slightly increase the intensity of the diamagnetic response. One can also observe that a single parameter ϵ allows to adjust the response, evaluated from the expansion (red line) to the time integrated result (blue dotted line) at low energy, however, the agreement in intensity gets lost at larger values of ω . For larger time integration intervals (cf. panels c,d) the agreement is pushed to higher energies.

3.3. Third order

Finally, we evaluate the paramagnetic contribution to the third harmonic current j p a r a x , ( 3 ) . Collecting all terms A 0 3 in the equation of motion Equation (6) results in the following equation for the third order correction to the density matrix
i R ˙ ̲ ̲ ( 3 ) ( t ) = R ̲ ̲ ( 3 ) ( t ) , H ̲ ̲ ( 0 ) + R ̲ ̲ ( 2 ) ( t ) , V ̲ ̲ f ( t ) + 1 2 R ̲ ̲ ( 1 ) , C ̲ ̲ f 2 ( t ) 1 6 R ̲ ̲ ( 0 ) ( t ) , V ̲ ̲ f 3 ( t ) | U | R ̲ ̲ ( 0 ) , D ̲ ̲ ( 3 ) | U | R ̲ ̲ ( 1 ) , D ̲ ̲ ( 2 ) | U | R ̲ ̲ ( 2 ) , D ̲ ̲ ( 1 ) .
Fourier transformation yields
ω R 3 ̲ ̲ ( ω ) = R ̲ ̲ ( 3 ) ( ω ) , H ̲ ̲ ( 0 ) + d ω 1 R ̲ ̲ ( 2 ) ( ω 1 ) , V ̲ ̲ f ( ω ω 1 ) + 1 2 d ω 1 d ω 2 R ̲ ̲ ( 1 ) ( ω 1 ) , C ̲ ̲ f ( ω 2 ) f ( ω ω 1 ω 2 ) 1 6 R ̲ ̲ ( 0 ) , V ̲ ̲ d ω 1 d ω 2 f ( ω 1 ) f ( ω 2 ) f ( ω ω 1 ω 2 ) | U | R ̲ ̲ ( 0 ) , D ̲ ̲ ( 3 ) ( ω ) | U | d ω 1 R ̲ ̲ ( 1 ) ( ω 1 ) , D ̲ ̲ ( 2 ) ( ω ω 1 ) | U | d ω 1 R ̲ ̲ ( 2 ) ( ω 1 ) , D ̲ ̲ ( 1 ) ( ω ω 1 ) .
Defining
D ̲ ̲ ( 2 ) ( ω ) d ν d ̲ ̲ ( 2 ) ( ω , ν ) f ( ν ) f ( ω ν )
R ̲ ̲ ( 2 ) ( ω ) d ν r ̲ ̲ ( 2 ) ( ω , ν ) f ( ν ) f ( ω ν )
and transforming to diagonal states, Equation (35) becomes
R ˜ n m ( 3 ) ( ω ) = 1 6 χ ˜ ( 0 ) ( ω ) V ˜ n m d ω 1 d ω 2 f ( ω 1 ) f ( ω 2 ) f ( ω ω 1 ω 2 ) + 1 ω + E n n E m m d ω 1 d ω 2 r ˜ ( 2 ) ( ω 1 + ω 2 , ω 2 ) , V ˜ | U | d ˜ ( 1 ) ( ω ω 1 ω 2 ) = ϑ ˜ ( ω ω 1 ω 2 ) n m × f ( ω 1 ) f ( ω 2 ) f ( ω ω 1 ω 2 ) + 1 ω + E n n E m m d ω 1 d ω 2 r ˜ ( 1 ) ( ω 1 ) , 1 2 C ˜ | U | d ˜ ( 2 ) ( ω ω 1 , ω 2 ) n m × f ( ω 1 ) f ( ω 2 ) f ( ω ω 1 ω 2 ) | U | χ ˜ n m ( 0 ) ( ω ) D ˜ n m ( 3 ) ( ω ) .
Now we follow the usual procedure and write Equation (38) in terms of the diagonal elements, i.e. D ν ρ ( 3 ) which yields
D ρ σ ( 3 ) ( ω ) = 1 6 M ρ σ , ν ρ 1 K ν ρ ( ω ) d ω 1 d ω 2 f ( ω 1 ) f ( ω 2 ) f ( ω ω 1 ω 2 ) M ρ σ , ν ρ 1 ( ω ) τ μ α y T α , n 1 ω + E n n E m m d ω 1 d ω 2 r ˜ ( 2 ) ( ω 1 + ω 2 , ω 2 ) , ϑ ˜ ( ω ω 1 ω 2 ) n m × T m β 1 τ β ν y f ( ω 1 ) f ( ω 2 ) f ( ω ω 1 ω 2 ) M ρ σ , ν ρ 1 ( ω ) τ μ α y T α , n 1 ω + E n n E m m d ω 1 d ω 2 r ˜ ( 1 ) ( ω 1 ) , 1 2 C ˜ | U | d ˜ ( 2 ) ( ω ω 1 , ω 2 ) n m × T m β 1 τ β ν y f ( ω 1 ) f ( ω 2 ) f ( ω ω 1 ω 2 ) .
and which upon inserting into Equation (38) yields the 3rd order correction to the density matrix.
We consider again a harmonic external field with f ( ω ) = δ ( ω Ω ) + δ ( ω + Ω ) . The contribution of R ˜ n m ( 3 ) ( ω ) δ ( ω 3 Ω ) is then given by
R ˜ n m ( 3 ) ( ω ) = 1 6 χ ˜ ( 0 ) ( 3 Ω ) V ˜ n m δ ( ω 3 Ω ) + 1 3 Ω + E n n E m m r ˜ ( 2 ) ( 2 Ω , Ω ) , ϑ ( Ω ) n m δ ( ω 3 Ω ) + 1 3 Ω + E n n E m m r ˜ ( 1 ) ( Ω 1 ) , 1 2 C ˜ | U | d ˜ ( 2 ) ( 2 Ω , Ω ) n m δ ( ω 3 Ω ) | U | χ ˜ n m ( 0 ) ( 3 Ω ) d ˜ n m ( 3 ) ( 3 Ω ) δ ( ω 3 Ω ) .
with
r ˜ n m ( 2 ) ( 2 Ω , Ω ) = 1 2 χ ˜ n m ( 0 ) ( 2 Ω ) C ˜ n m + 1 2 Ω + E n n E m m r ˜ ( 1 ) ( Ω ) , ϑ ˜ ( Ω ) n m | U | χ ˜ n m ( 0 ) ( 2 Ω ) d ˜ n m ( 2 ) ( 2 Ω , Ω ) .
d ˜ n m ( 2 ) ( 2 Ω , Ω ) = M ρ σ , ν μ 1 ( 2 Ω ) G ν μ ( 2 Ω ) M ρ σ , ν μ 1 ( 2 Ω ) τ μ α y T α , n 1 2 Ω + E n n E m m r ˜ ( 1 ) ( Ω ) , ϑ ˜ ( Ω ) n m T m β 1 τ β ν y
d ˜ n m ( 3 ) ( 3 Ω ) = 1 6 M ρ σ , ν ρ 1 ( 3 Ω ) K ν ρ ( 3 Ω ) M ρ σ , ν ρ 1 ( 3 Ω ) τ μ α y T α , n 1 3 Ω + E n n E m m r ˜ ( 2 ) ( 2 Ω , Ω ) , ϑ ˜ ( Ω ) n m T m β 1 τ β ν y M ρ σ , ν ρ 1 ( 3 Ω ) τ μ α y T α , n 1 3 Ω + E n n E m m r ˜ ( 1 ) ( Ω ) , 1 2 C ˜ | U | d ˜ ( 2 ) ( 2 Ω , Ω ) n m T m β 1 τ β ν y .
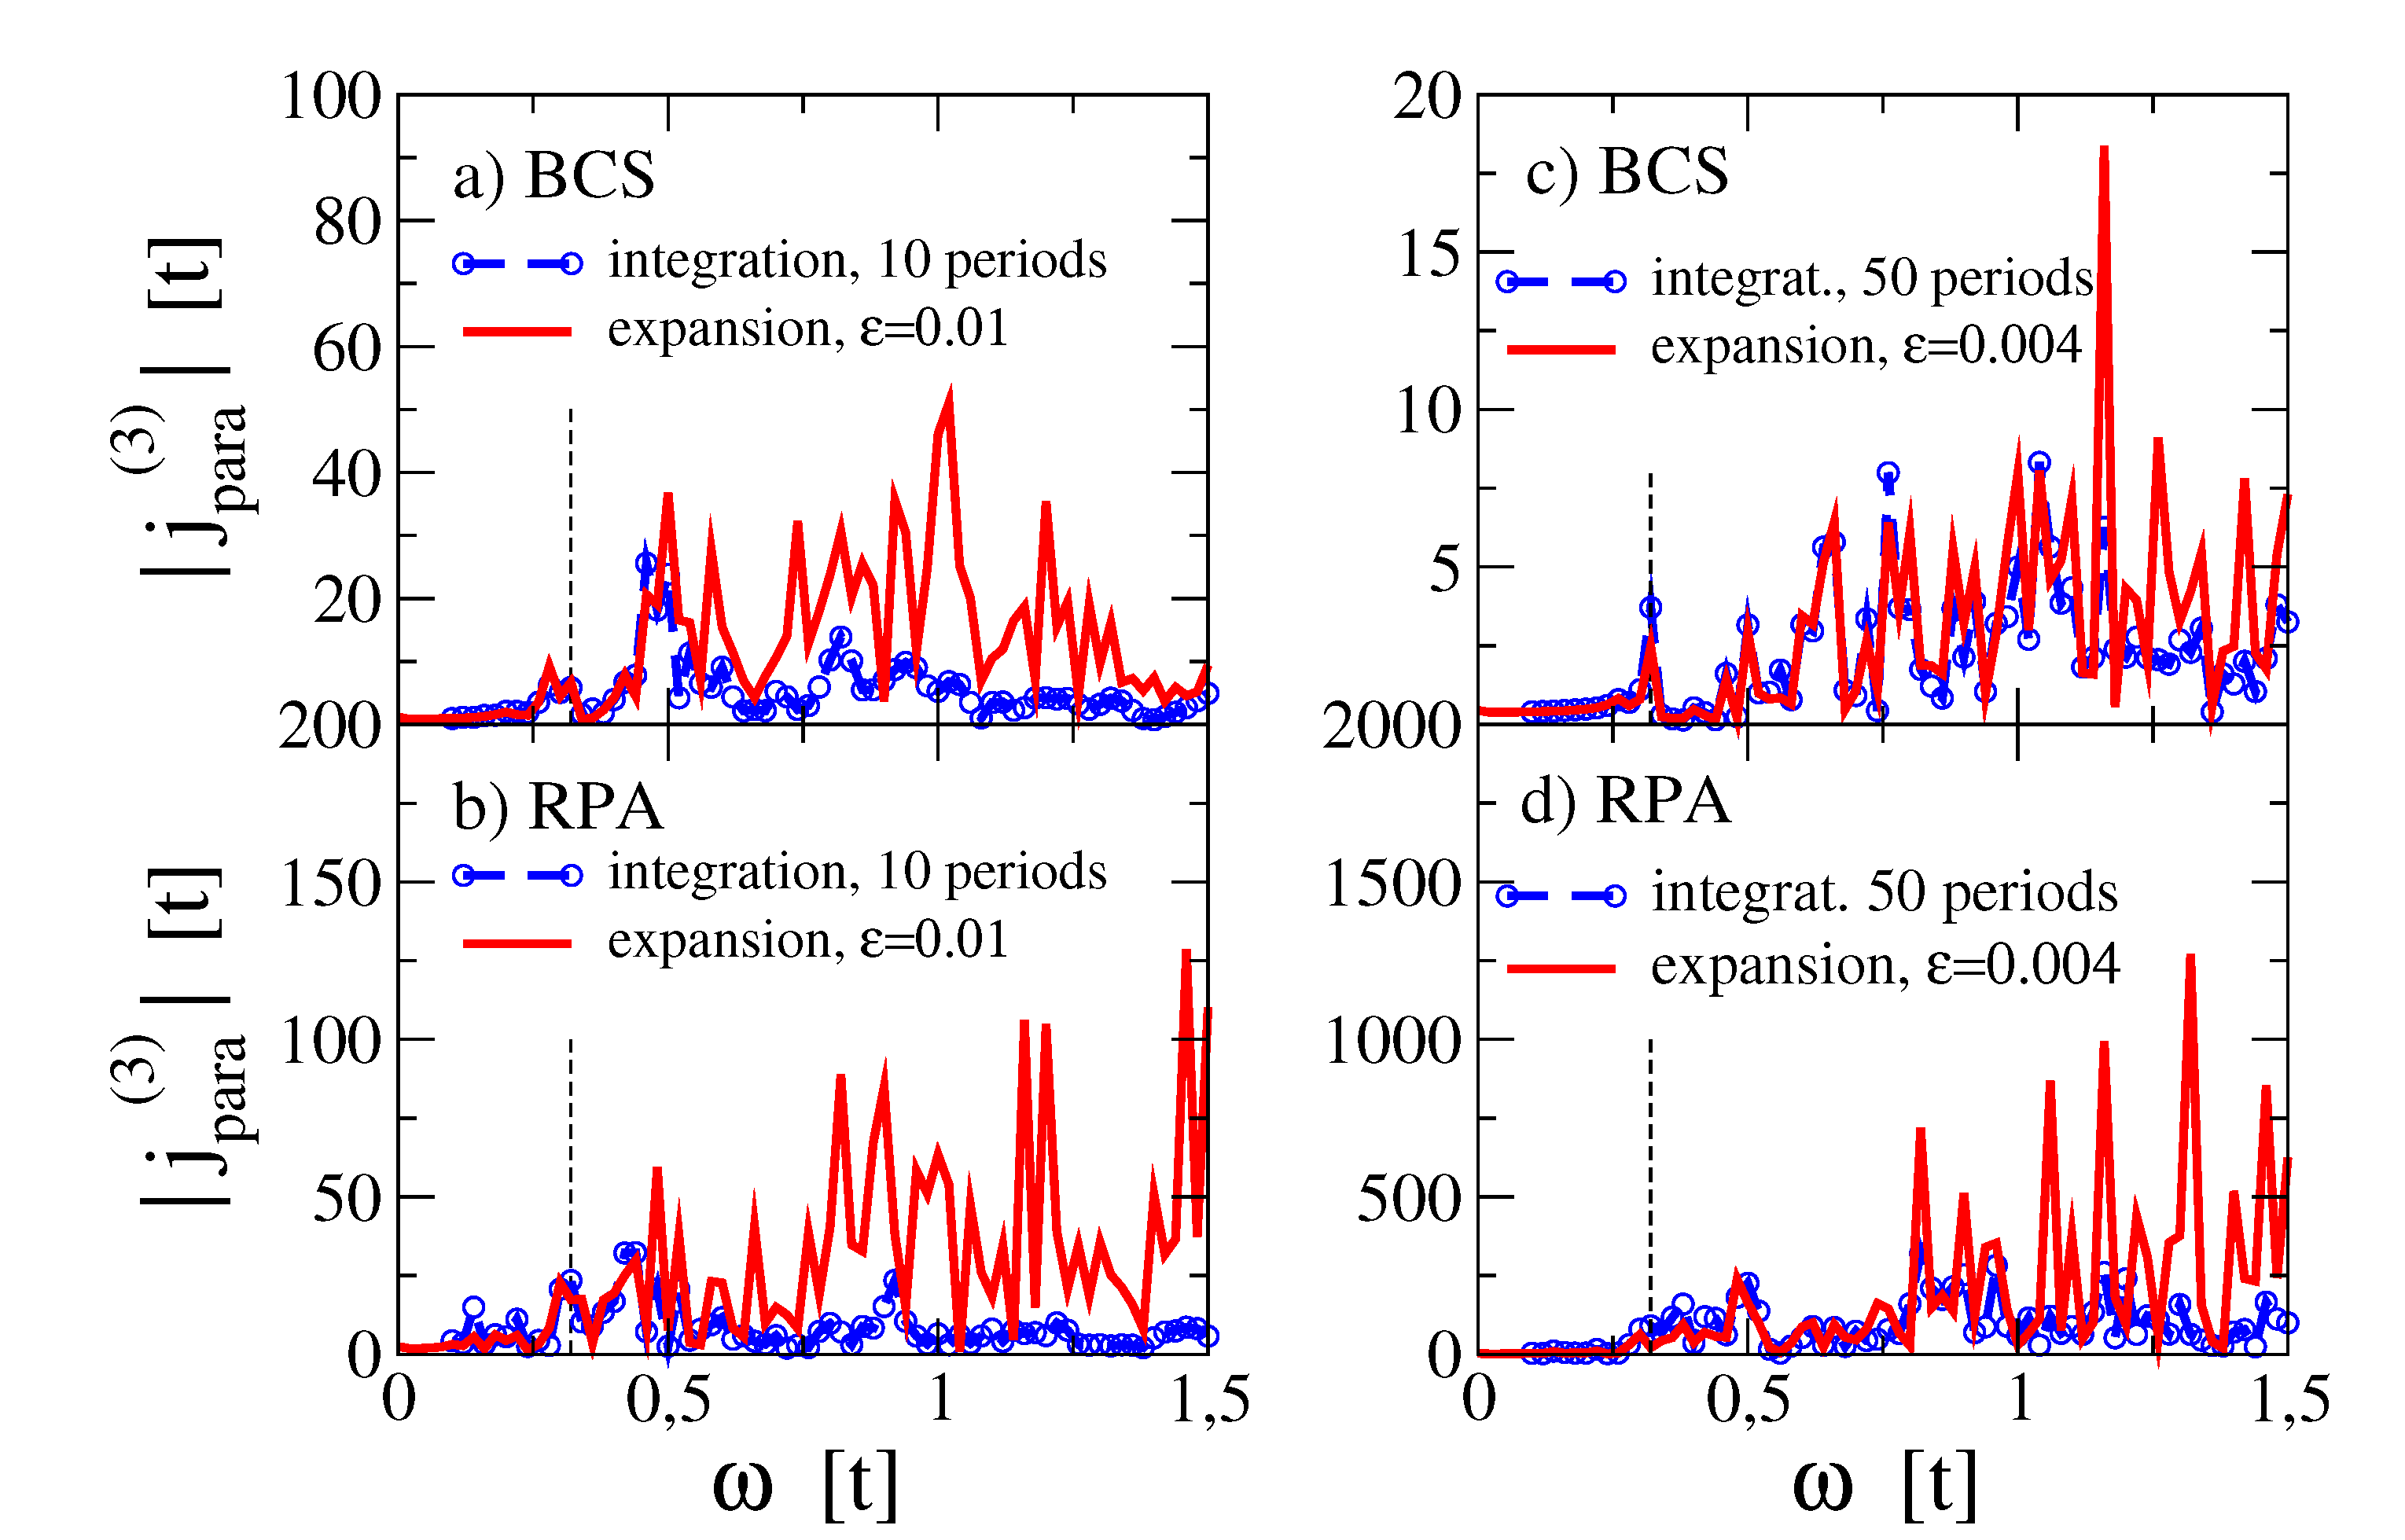
For the same disorder configuration as has been used for Figure 1, Figure 2 we show in Figure 3 third harmonic response from Equations (17,25) as compared to the direct time integration of Equation (6). Consistent with our previous results [19] the strongly disordered ordered sample displays a low paramagnetic energy response at ω = Δ , both in BCS and RPA, where the latter is enhanced by the contribution from collective modes. As in case of the diamagnetic contribution, cf. Figure 2, the ’expansion result’ (red) for a fixed ϵ parameter can be adjusted to the time integrated spectrum (blue dotted line) at low energies, but with decreasing number of periods in the time integration the agreement in intensity gets lost at higher energies. This is particularly visible in Figure 3d where the contribution from band excitations leads to significantly larger intensities for the small ϵ = 0.004 as compared to the time integration over 50 periods of the applied vector potential.

4. Conclusions

We have presented a detailed comparison of two approaches to evaluate the higher harmonic current response to an applied electromagnetic field for disordered and superconducting systems on a lattice. The first method is based on the direct time integration of the equation of motion Equation (6) as has been used in Ref. [19] for the investigation of the influence of collective modes in disordered s-wave superconductors. Since in this case the higher harmonic contribution has to be extracted numerically from the total response, the calculation has to be performed for at least three different magnitudes of the vector potential for each frequency. Together with the fact, that in order to obtain a reasonable frequency resolution, the integration has to be performed over a significant number of periods of the applied vector potential, this method is limited to a small number of lattice sites. On the other hand, it is rather flexible with regard to the simulation of different pump-probe protocols which can be easily implemented into the formalism.
Alternatively, one can compute the THG from an expansion of the density matrix in powers of the applied vector potential. As we have demonstrated in the present paper, the equations of motion for the individual components can be directly solved in frequency space from which the currents in the various orders are obtained. In Ref. [26] this approach has been applied to the evaluation of the third harmonic response in d-wave superconductors, where at least in the BCS limit one could treat much larger systems than via the direct time integration of the density matrix. In this paper we have shown how RPA corrections can be included into the formalism. An open issue is the problem, how these RPA corrections can be separated into contributions from amplitude, phase and charge modes, which, on the other hand, can be easily accomplished within the time integration method.
Funding

This research was funded by the Deutsche Forschungsgemeinschaft under SE806/20-1.

Acknowledgments

I’m deeply indebted to Lara Benfatto and Claudio Castellani for the stimulating discussions on this topic.

References

  1. Tajima, S. Optical studies of high-temperature superconducting cuprates. Rep. Prog. Phys. 2016, 79, 094001. [Google Scholar] [CrossRef]
  2. Giannetti, C.; Capone, M.; Fausti, D.; Fabrizio, M.; Parmigiani, F.; Mihailovic, D. Ultrafast optical spectroscopy of strongly correlated materials and high-temperature superconductors: a non-equilibrium approach. Advances in Physics 2016, 65, 58. [Google Scholar] [CrossRef]
  3. Matsunaga, R.; Tsuji, N.; Makise, K.; Terai, H.; Aoki, H.; Shimano, R. Polarization-resolved terahertz third-harmonic generation in a single-crystal superconductor NbN: Dominance of the Higgs mode beyond the BCS approximation. Phys. Rev. B 2017, 96, 020505(R). [Google Scholar] [CrossRef]
  4. Tsuji, N.; Nomura, Y. Higgs-mode resonance in third harmonic generation in NbN superconductors: Multiband electron-phonon coupling, impurity scattering, and polarization-angle dependence. Phys. Rev. Research 2020, 2, 043029. [Google Scholar] [CrossRef]
  5. Wang, Z.-X.; Xue, J.-R.; Shi, H.-K.; Jia, X.-Q.; Lin, T.; Shi, L.-Y.; Dong, T.; Wang, F.; Wang, N.-L. Transient Higgs oscillations and high-order nonlinear light-Higgs coupling in a terahertz wave driven NbN superconductor. Phys. Rev. B 2022, 105, L100508. [Google Scholar] [CrossRef]
  6. Kovalev, S.; Dong, T.; Shi, L.-Y.; Reinhoffer, C. Xu, T.-Q.; Wang, H.-Z.; Wang, Y.; Gan, Z.-Z.; Germanskiy, S.; Deinert, J.-C.; Ilyakov, I.; van Loosdrecht, P. H. M.; Wu, D.; Wang, N.-L.; Demsar, J.; Wang, Z. Band-selective third-harmonic generation in superconducting MgB2: Possible evidence for the Higgs amplitude mode in the dirty limit. Phys. Rev. B 2021, 104, L140505. [Google Scholar] [CrossRef]
  7. Reinhoffer, C.; Pilch, P.; Reinold, A.; Derendorf, P.; Kovalev, S.; Deinert, J.-C.; Ilyakov, I.; Ponomaryov, A.; Chen, M.; Xu, T.-Q.; Wang, Y.; Gan, Z.-Z.; Wu, D.-S.; Luo, J.-L.; Germanskiy, S.; Mashkovich, E.A.; van Loosdrecht, P. H. M.; Eremin, I. M.; Wang, Z. High-order nonlinear terahertz probing of the two-band superconductor MgB2: Third- and fifth-order harmonic generation. Phys. Rev. B 2022, 106, 214514. [Google Scholar] [CrossRef]
  8. Grasset, R.; Katsumi, K.; Massat, P.; Wen, H.-H.; Chen, X.-H.; Gallais, Y.; Shimano, R. Terahertz pulse-driven collective mode in the nematic superconducting state of Ba1-xKxFe2As2. Quantum Materials 2022, 7, 4. [Google Scholar] [CrossRef]
  9. Katsumi, K.; Tsuji, N.; Hamada, Y. I.; Matsunaga, R.; Schneeloch, J.; Zhong, R. D.; Gu, G. D.; Aoki, H.; Gallais, Y.; Shimano, R. Higgs Mode in the d-Wave Superconductor Bi2Sr2CaCu2O8+x Driven by an Intense Terahertz Pulse. Phys. Rev. Lett. 2018, 120, 117001. [Google Scholar] [CrossRef]
  10. Katsumi, K.; Li, Z. Z.; Raffy, H.; Gallais, Y.; Shimano, R. Superconducting fluctuations probed by the Higgs mode in Bi2Sr2CaCu2O8+x thin films. Phys. Rev. B 2020, 102, 054510. [Google Scholar] [CrossRef]
  11. Chu, H.; Kim, M. J.; Katsumi, K.; et al. Phase-resolved Higgs response in superconducting cuprates. Nature Communications 2020, 11, 1793. [Google Scholar] [CrossRef]
  12. Yuan, J. Y.; Shi, L. Y.; Yue, L.; Li, B. H.; Wang, Z. X.; Xu, S. X.; Xu, T. Q.; Wang, Y.; Gan, Z. Z.; Chen, F. C.; Lin, Z. F.; Wang, X.; Jin, K.; Wang, X. B.; Luo, J. L.; Zhang, S. J.; Wu, Q.; Liu, Q. M.; Hu, T. C.; Li, R. S.; Zhou, X. Y.; Wu, D.; Dong, T.; Wang, N. L. Revealing strong coupling of collective modes between superconductivity and pseudogap in cuprate superconductor by terahertz third harmonic generation arXiv:2211.06961. arXiv:2211.06961.
  13. Cea, T.; Castellani, C.; Benfatto, L. Nonlinear optical effects and third-harmonic generation in superconductors: Cooper pairs versus Higgs mode contribution. Phys. Rev. B 2016, 93, 180507. [Google Scholar] [CrossRef]
  14. Cea, T.; Barone, P.; Castellani, C.; Benfatto, L. Polarization dependence of the third-harmonic generation in multiband superconductors. Phys. Rev. B 2018, 97, 094516. [Google Scholar] [CrossRef]
  15. Silaev, M. Nonlinear electromagnetic response and Higgs-mode excitation in BCS superconductors with impurities. Phys. Rev. B 2019, 99, 224511. [Google Scholar] [CrossRef]
  16. Murotani, Y.; Shimano, R. Nonlinear optical response of collective modes in multiband superconductors assisted by nonmagnetic impurities. Phys. Rev. B 2019, 99, 224510. [Google Scholar] [CrossRef]
  17. Schwarz, L.; Manske, D. Theory of driven Higgs oscillations and third-harmonic generation in unconventional superconductors. Phys. Rev. B 2020, 101, 184519. [Google Scholar] [CrossRef]
  18. Schwarz, L.; Fauseweh, B.; Tsuji, N.; Cheng, N.; Bittner, N.; Krull, H.; Berciu, M.; Uhrig, G. S.; Schnyder, A. P.; Kaiser, S.; Manske, D. Classification and characterization of nonequilibrium Higgs modes in unconventional superconductors. Nature Communications 2020, 11, 287. [Google Scholar] [CrossRef]
  19. Seibold, G.; Udina, M.; Castellani, C.; Benfatto, L. Third harmonic generation from collective modes in disordered superconductors. Phys. Rev. B 2021, 103, 014512. [Google Scholar] [CrossRef]
  20. Müller, M. A.; Eremin, I. M. Signatures of Bardasis-Schrieffer mode excitation in third-harmonic generated currents. Phys. Rev. B 2021, 104, 144508. [Google Scholar] [CrossRef]
  21. Haenel, R.; Froese, P.; Manske, D.; Schwarz, L. Time-resolved optical conductivity and Higgs oscillations in two-band dirty superconductors. Phys. Rev. B 2021, 104, 134504. [Google Scholar] [CrossRef]
  22. Fiore, J.; Udina, M.; Marciani, M.; Seibold, G.; Benfatto, L. Contribution of collective excitations to third harmonic generation in two-band superconductors: The case of MgB2. Phys. Rev. B 2022, 106, 094515. [Google Scholar] [CrossRef]
  23. Udina, M.; Fiore, J.; Cea, T.; Castellani, C.; Seibold, G.; and Benfatto, L. THz non-linear optical response in cuprates: predominance of the BCS response over the Higgs mode Faraday Discussion (2022), 237, 168.
  24. Fan, B.; Samanta, A.; García-García, A M. Characterization of collective excitations in weakly coupled disordered superconductors. Phys. Rev. B 2022, 105, 094515. [Google Scholar] [CrossRef]
  25. Mattis, D. C.; Bardeen, J. Theory of the anomalous skin effect in normal and superconducting metals. Phys. Rev. 1958, 111, 412. [Google Scholar] [CrossRef]
  26. Benfatto, L.; Castellani, C.; Seibold, G. Linear and non-linear current response in disordered d-wave superconductors arXiv:2307.07202, accepted for publication in Phys. Rev. B.
  27. Ghosal, A.; Randeria, M.; Trivedi, N. Inhomogeneous pairing in highly disordered s-wave superconductors. Phys. Rev. B 2001, 65, 014501. [Google Scholar] [CrossRef]
  28. Dubi, Y.; Meir, Y.; Avishai, Y. Nature of the superconductor–insulator transition in disordered superconductors. Nature 2007, 449, 876. [Google Scholar] [CrossRef]
  29. Samanta, A.; Ratnakar, A.; Trivedi, N.; Sensarma, R. Two-particle spectral function for disordered s-wave superconductors: Local maps and collective modes. Phys. Rev. B 2020, 101, 024507. [Google Scholar] [CrossRef]
  30. Cea, T.; Bucheli, D.; Seibold, G.; Benfatto, L.; Lorenzana, J.; Castellani, C. Optical excitation of phase modes in strongly disordered superconductors. Phys. Rev. B 2014, 89, 20174506. [Google Scholar] [CrossRef]
  31. Seibold, G.; Benfatto, L.; Castellani, C. Application of the Mattis-Bardeen theory in strongly disordered superconductors. Phys. Rev. B 2017, 96, 144507. [Google Scholar] [CrossRef]
Figure 1. Magnitude of the first harmonic response for BCS (a,c) and RPA (b,d). The paramagnetic current obtained from the direct time integration Equation (6) is shown by the blue dotted line and integration has been performed over 10 (a,b) and 50 (c,d) periods of the applied vector potential. The current evaluated from the expansion Equations (17,25) is shown in red. Here we have used ε = 0.03 t (a,b) and ε = 0.005 t (c,d) in order to shift the energy into the complex plane, ω ω + i ε . The vertical dashed line marks the optical gap 2 Δ . Further parmeters: 8 × 8 lattice with 56 electrons. t / t = 0 ; V 0 / t = 1 .
Preprints 88212 g001
Figure 2. Magnitude of the second harmonic response (Fourier transform of f ( f ) j d i a 2 ( t ) ) for BCS (a,c) and RPA (b,d). The diamagnetic current obtained from the direct time integration Equation (6) is shown by the blue dotted line and integration has been performed over 10 (a,b) and 50 (c,d) periods of the applied vector potential. The current evaluated from the expansion Equations (32,33) is shown in red. Here we have used ε = 0.01 t (a,b) and ε = 0.004 t (c,d) in order to shift the energy into the complex plane, ω ω + i ε . The vertical dashed line marks the energy at Δ . Further parmeters: 8 × 8 lattice with 56 electrons. t / t = 0 ; V 0 / t = 1 .
Preprints 88212 g002
Figure 3. Magnitude of the third harmonic response (Fourier transform of j p a r a 3 ( t ) ) for BCS (a,c) and RPA (b,d). The diamagnetic current obtained from the direct time integration Equation (6) is shown by the blue dotted line and integration has been performed over 10 (a,b) and 50 (c,d) periods of the applied vector potential. The current evaluated from the expansion Equations (17,25) is shown in red. Here we have used ε = 0.01 t (a,b) and ε = 0.004 t (c,d) in order to shift the energy into the complex plane, ω ω + i ε . The vertical dashed line marks the gap Δ . Further parmeters: 8 × 8 lattice with 56 electrons. t / t = 0 ; V 0 / t = 1 .
Preprints 88212 g003
Disclaimer/Publisher’s Note: The statements, opinions and data contained in all publications are solely those of the individual author(s) and contributor(s) and not of MDPI and/or the editor(s). MDPI and/or the editor(s) disclaim responsibility for any injury to people or property resulting from any ideas, methods, instructions or products referred to in the content.
Copyright: This open access article is published under a Creative Commons CC BY 4.0 license, which permit the free download, distribution, and reuse, provided that the author and preprint are cited in any reuse.
Prerpints.org logo

Preprints.org is a free preprint server supported by MDPI in Basel, Switzerland.

Subscribe

© 2024 MDPI (Basel, Switzerland) unless otherwise stated