Submitted:
19 October 2023
Posted:
20 October 2023
You are already at the latest version
Abstract
Keywords:
1. Introduction
2. Materials and Methods
Data Quality Control
Trend Analysis
Spatial Interpolation of Extreme Temperature and Rainfall Indices
3. Results
3.1. Extreme Temperature Variability
- Tropical Nights (TR20)
- 2.
- Trends on the Minimum (Tmin) and Maximum (Tmin) Temperatures
- 3.
- Diurnal temperature range (DTR)
- 4.
- Warm spell (WSDI) and cold spell duration indicator (CSDI)
- 5.
- Cold days (TX10p) and cold nights (TN10p)
- 6.
- Warm days (TX90p) and warm nights (TN90p)
Annual and Inter-Annual Rainfall Variability
- Total rainfall (mm)
- 2.
- Simple daily intensity index (SDII)
- 3.
- Rx1day and Rx5 day (mm)
4. Discussion
4.1. Changes in extreme temperature
4.2. Changes in extreme rainfall
5. Conclusions
Author Contributions
Funding
Data Availability Statement
Acknowledgments
Conflicts of Interest
References
- Alexander, L. V., X. Zhang, T. C. Peterson, J. Peterson, J. Caesar, B. Gleason, A. M. G. Klein Tank, et al. 2006. Global Observed Changes in Daily Climate Extremes of Temperature and Precipitation. Journal of Geophysical Research (American Geophysical Union) 111: 1-22. [CrossRef]
- Frich, P., L. V. Alexander, P. Della-Marta, B. Gleason, M. Haylock, A.M.G. Klein Tank, and T. Peterson. 2002. Observed Coherent Changes in Climatic Extremes During the Second Half of the Twentieth Century. Climate Research 19: 193-212. [CrossRef]
- Adeyeri, O.E. E. Lawin, P. Laux, K.A. Ishola, and S.O. Ige. 2019. Analysis of climate extreme indices over the Komadugu-Yobe basin, Lake Chad region: Past and future occurrences. Weather and Climate Extremes, 23, 1–21. [CrossRef]
- Barry, A. A., J. Caesar, A. M. G. Klein Tank, E. Aguilar, Carol McSweeney, Ahmed M. Cyrrille, M. P. Nikeima, et al. 2018. West Africa Climate Extremes and Climate Change Indices. International Journal of Climatology 38 (1): 921-938. [CrossRef]
- Byakatonda, Jimmy, B P Parida, Piet K Kenabatho, and D B Moalafhi. 2018. Analysis of rainfall and temperature time series to detect long-term climatic trends and variability over semi-arid Botswana. Journal of Earth System Science 127 (25): 1-20. [CrossRef]
- Halimatou, Toure A., Traore Kalifa, and N. Kyei-Baffour. 2017. Assessment of Changing Trends of Daily Precipitation and Temperature Extremes in Bamako and Segou in Mali from 1961- 2014. Weather and Climate Extremes (ELSEVIER) 18: 8-16.
- IPCC. 2014. Climate Change: Synthesis Report. Fifth Assessment Synthesis Report.
- Gebrechorkos, Solomon H., Stephan Hülsmann, and Christian Bernhofer. 2019. Long-term trends in rainfall and temperature using high-resolution climate datasets in East Africa. Scientific Reports 9: 1-9. [CrossRef]
- Haile, Gebremedhin Gebremeskel, Quihong Tang, Siao Sun, Zhongwei Huang, Xuejun Zhang, and Xingcai Lie. 2019. Droughts in East Africa: Causes, impacts and resilience. Earth Science Reviews (ELSEVIER) 193: 146-161. [CrossRef]
- Adhikari, Umesh, A. Pouyan Nejadhashemi, and Sean A. Woznicki. 2015. Climate change and eastern Africa: a review of impact on major crops. Food and Energy Security 4 (2): 110-132.
- IPCC. 2018. Global Warming of 1.5 0C: Summary for Policy Makers. Switherland: Inter-Governmental Panel on Climate Change.
- Gebrechorkos, Solomon H., Stephan Hulsmann, and Chritian Bemofer. 2018. Changes in Temperature and Precipitation Extremes in Ethiopia, Kenya and Tanzania. International Journal of Climatology (Royal Meteorological Society (RMetS)) 39: 18-30. [CrossRef]
- Kassie, B. T. , Rötter, R. P., Hengsdijk, H., Asseng, S., Ittersum, M. K., Kahiluoto, H., & Keulen, H. V. (2014). Climate variability and change in the Central Rift Valley of Ethiopia: challenges for rainfed crop production. Journal of Agricultural Science, 152. [CrossRef]
- Ayalew, D., Tesfaye, K., Mamo, G., Yitaferu, B., & Bayu, W. (2012). Variability of rainfall and its current trend in Amhara region, Ethiopia. African Journal of Agricultural Research, 7(10), 1475-1486.
- Thornton, Philip K., Polly J. Ericksen, Mario Herrero, and Andrew J. Challinor. 2014. Climate Variability and Vulnerability to Climate: A Review. Global Change Biology 20: 3313-3328. [CrossRef]
- Asfaw, Amogne, Belay Simane, Ali Hassen, and Amare Bantider. 2018. Variability and Time Series Trend Analysis of Rainfall and Temperature in North central Ethiopia: A Case Study in Woleka Sub-basin. Weather and Climate Extremes (ELSEVIER) (19): 29-41.
- Dalle, D. , Gecho, Y., & Bedeke, S. B. (2023). Spatiotemporal Variability and Trends in Rainfall and Temperature in South Ethiopia: Implications for Climate Change Adaptations in Rural Communities. Advances in Meteorology, 2023, 1-21. [CrossRef]
- Gedefaw, M. , Yan, D., Wang, H., Qin, T., & Wang, K. (2019). Analysis of the Recent Trends of Two Climate Parameters over Two Eco-Regions of Ethiopia. Water, 11(161), 1-12. [CrossRef]
- Kiros, Gebremedhin, Amba Shetty, and Lakshman Nandagiri. 2017. Extreme rainfall signatures under changing climate in semi-arid northern highlands of Ethiopia. Cogent Geoscience 3: 1-20. [CrossRef]
- Hayelom, B., Chen, Y., Marsie, Z., & Birega, M. (2017). Temperature and Precipitation Trend Analysis over the last 30 years in Southern Tigray regional State, Ethiopia. Journal of Atmospheric Pollution, 5(1), 18-23. [CrossRef]
- Addisu, Solomon, Yihenew G.Selassie, Getachew Fissha, and Birhanu Gedif. 2015. Time series trend analysis of Temperature and Rainfall in Lake Tana Sub-basin, Ethiopia. Environmental Systems Research 4 (25): 1-12.
- Berhe, Amdom Gebremedhin, Solomon Habtu Misgna, Girmay Gebre-Samuel Abraha, and Amanuel Zenebe Abraha. 2023. Variability and trend analysis of temperatures, rainfall, and characteristics of crop-growing season in the eastern zone of Tigray region, northern Ethiopia. Theoretical and Applied Climatology 152: 25-43. [CrossRef]
- Mekonnen, A., Tessema, A., Ganewo, Z., & Haile, A. (2021). Climate change impacts on household food security and farmers adaptation strategies. Journal of Agriculture and Food Research, 6, 1-9. [CrossRef]
- Alemu, M. M., & Bawoke, G. T. (2020). Analysis of spatial variability and temporal trends of rainfall in Amhara region, Ethiopia. 11(4), 1505–1520. [CrossRef]
- Tarkegn, G. B., & Jury, M. R. (2020). Changes in the Seasonality of Ethiopian Highlands Climate and Implications for Crop Growth. Atmosphere, 11(892), 1-17. [CrossRef]
- Alemu, Tadesse, and Alemayohu Mengistu. 2019. Impacts of climate change on food security in Ethiopia: Adaptation and Mitigation options: A Review. In Climate Change-Resilient Agriculture and Agroforestry. Climate Change Management, edited by P. Castro, A. Azul and U. Azeiteiro W. Leal Filho. Springer, Cham. [CrossRef]
- Hadgu, Gebre, Kindie Tesfaye, Girma Mamo, and Belay Kassa. 2013. Trend and Variability of Rainfall in Tigray, Northern Ethiopia: Analysis of Meteorological data and Farmers’ Perception. Academia Journal of Agricultural Research 1 (6): 88-100.
- Wiebe, Keith, Sherman Robinson, and Andrea Cattaneo. 2019. Climate Change, Agriculture, and Food Security: Impacts the Potential for Adaptation and Mitigation. In Sustainable Food and Agriculture, by Clayton Cam-panhola and Shivaji Pandey, 55-74. Academic Press. [CrossRef]
- FAO. 2015. Climate change and Food Security: Risks and Responnses. FAO.
- Gebrehiwot, Tagel, and Anne van der Veen. 2013. Climate change vulnerability in Ethiopia: disaggregation of Tigray Region. Journal of Eastern African Studies (Tylor and Fransis Online) 7: 607-629.
- Asaminew, T G, A Araya, G Atkilt, and H Solomon. 2017. Modeling the Potential Impact of Climate Change on Cotton (Gossypium hirsutum) Production in Northeastern Semi-Arid Afar and Western Tigray Regions of Ethiopia. Journal of Earth Science and Climatic Change 8 (3): 1-7. [CrossRef]
- Niguse, Awetehegn, and Araya Alemie. 2015. Climate Characterization of the Western Zone of Tigray Region, Humera. Journal of Environment and Earth Science 5 (17): 24-29.
- 33. Berhane, Abadi, Gebre Hadgu, Walelign Worku, and Berhanu Abrha. 2020. Trends in extreme temperature and rainfall indices in the semi-arid areas of Western Tigray, Ethiopia. Environmental Systems Research. [CrossRef]
- Wart, Justin Van, Patricio Grassini, Haishun Yang, Lieven Claessens, Andrew Jarvis, and Kenneth G. Cassman. 2015. Creating long-term Weather Data from Thin Air for Crop Simulation Modeling. Agricultural Water Meteorology (ELSEVIER) 209-210: 49-58. [CrossRef]
- White, Jeffrey W., Gerrit Hoogenboom, Paul W. Jr. Stackhouse, and James M. Hoell. 2008. Evaluation of NASA Satellite and Assimilation Model-derived Long-term Daily Temperature Data over the Continental US. Agricultural and Forest Meteorology (ELSEVIER) 148: 1574-1584.
- Stackhouse, Paul W., Jr David Westberg, William S. Chandler, Taiping Zhang, and James M. Hoell. 2017. Prediction of Worldwide Energy Resource (POWER): Agro-climatology Methodology (1.0o Latitude by 1.0o Longitude Spatial Resolution). 1-52.
- Abbas, Farhat. 2013. Analysis of a Historical (1981-2010) Temperature Record of the Punjab Province of Pakistan. Earth Interactions 17: 1-15.
- Zhang, Xuebin, and Feng Yang. 2004. RClimDex (1.0) User Manual. Climate Research Branch, Environment Canada, Ontario (Canada).
- Yue, Sheng, and Chunyuan Wang. 2004. The Mann-Kendall Test Modified by Effective Sample Size to Detect Trend in Serially Correlated Hydrological Series. Water Resources Management (Kluwer Academic Publishers) 18: 201-218.
- Kendall, M. (1975). Rank Correlation Methods (4th ed.). London: Charles Grifin.
- Partal, Turgay, and Ercan Kahya. 2006. Trend Analysis in Turkish Precipitation Data. Hydrological Processes 20: 2011-2026.
- Yenigun, K., v. Gums, and H. Mulut. 2008. Trends in Streamflow of the Euphrates basin, Turkey.Water Management: Proceedings of the Institution of Civil Engineering. 189-198. [CrossRef]
- Sen, K. K. (1968). Estimates of the Regression Coefficient Based on Kendall's Tau. American Journal of Statistical Association, 63(324), 1379-1389. [CrossRef]
- Panigrahi, N. n.d. Inverse Distance Weight. In Encyclopedia of Mathematical Geosciences. Encyclopedia of Earth Sciences Series., edited by B. Daya Sagar, Q. Cheng, J. McKinley and F. Agterberg. Springer, Cham. [CrossRef]
- Maleika, Wojciech. 2020. Inverse distance weighting method optimization in the process of digital terrain model creation based on data collected from a multibeam echosounder. Applied Geomatics 12: 397-407. [CrossRef]
- Worku, Gebrekidan, Ermias Teferi, Amare Bantidere, and Yihun T. Dile. 2019. "Observed changes in extremes of daily rainfall and temperature in Jemma Sub-basing, Upper Blue Nile Basin, Ethiopia." Theoretical and Applied Climatology 135: 839-854. [CrossRef]
- Cattani, Elsa, Andrés Merino, José A. Guijarro, and Vincenzo Levizzani. 2018. East Africa Rainfall Trends and Variability 1983–2015 Using Three Long-Term Satellite Products. Remote Sensing 10 (931): 2-26. [CrossRef]
- Rahimzadeh, Fatemeh, Ahmad Asgari, and Ebrahim Fattahi. 2009. Variability of extreme temperature and precipitation in Iran during recent decades. International Journal of Climatology (Royal Meteorological Sciety) 29: 329-343. [CrossRef]
- Birara, H., Pandey, R. P., & Mishra, S. K. (2018). Trend and Variability Analysis of Rainfall and Temperature in the Tana basin region. Journal of Water and Climate Change, 9, 555-569. [CrossRef]
- Mekasha, Aklilu, Kinde Tesfaye, and Alan J. Duncan. 2014. Trends in Daily Observed Temperature and Precipitation Extremes over Three Ethiopian Eco-envirnments. International Journal of Climatology (Royal Meteorological Society) 34: 1990-1999. [CrossRef]
- IPCC. 2013. The Physical Science Bais. Contribution of Working Group I to the Fifth Assessment Report of the Intergovernmental Panel on Climate Change. Cambridge UK and New York, USA: Cambridge University press, 1552.
- Hatfield, Jerry L., and John H. Prueger. 2015. Temperature Extremes: Effect on Plant Growth and Development. Weather and Climate Extremes 10: 4-10.
- P.V.V. Prasad, Maduraimuthu Djanaguiraman, Ramasamy Perumal, and Ignacio A. Ciampitti. 2015. Impact of high temperature stress on floret fertility and individual grain weight of grain sorghum: Sensitive stages and thresholds for temperature and duration. Frontiers in Plant Science 6 (820): 2-11. [CrossRef]
- Tacarindua, Custodio R.P., Tatsuhiko Shiraiwa, Koki Homma, Etsushi Kumagai, and Ryoji Sameshima. 2012. The response of soybean seed growth characteristics to increased temperature under near-field conditions in a temperature chamber. Field Crops Research (ELSEVIER) 131: 26-31. [CrossRef]
- Tedla, Dawit gebremichael, Fshatsion Hailemariam Bariagabr, and Hagos Hadgu Abreha. 2018. Incidence and Trends of Leishmaniasis and Its Risk Factors in Humera, Western Tigray. Journal of Parasitology Research 10: 1-9. [CrossRef]
- Cardenas, Rocio, Claudia M. Sandoval, Alfonso J. Rodriguez-Morales, and Carlos Franco-Paredes. 2006. Impact of Climate Variability in the Occurrence of Leishmaniasis in Northern Colombia. American Journal of Tropical Medicine and Hygiene 72 (2): 273-277.
- Blanford, J. I., Blanford, S., Crane, R. G., Mann, M. E., Paaijmans, K. P., Schreiber, K. V., & Thomas, M. B. (2013). Implications of temperature variation for malaria parasite development across Africa. Scientific Reports, 3, 1-11. [CrossRef]
- Gummadi, Srdhar, K. P.C. Rao, Jemal Seid, Gizachew Legesse, M. D. M. Kadiyala, Robel Takele, Tilahun Amede, and Anthony Whitbread. 2017. Spatio-temporal Variability and Trends of Precipitation and Extreme Rainfall Events in Ethiopia in 1980-2010. Theoretical and Applied Climatology (Springer Link) 134 (3-4): 1315-1328. [CrossRef]
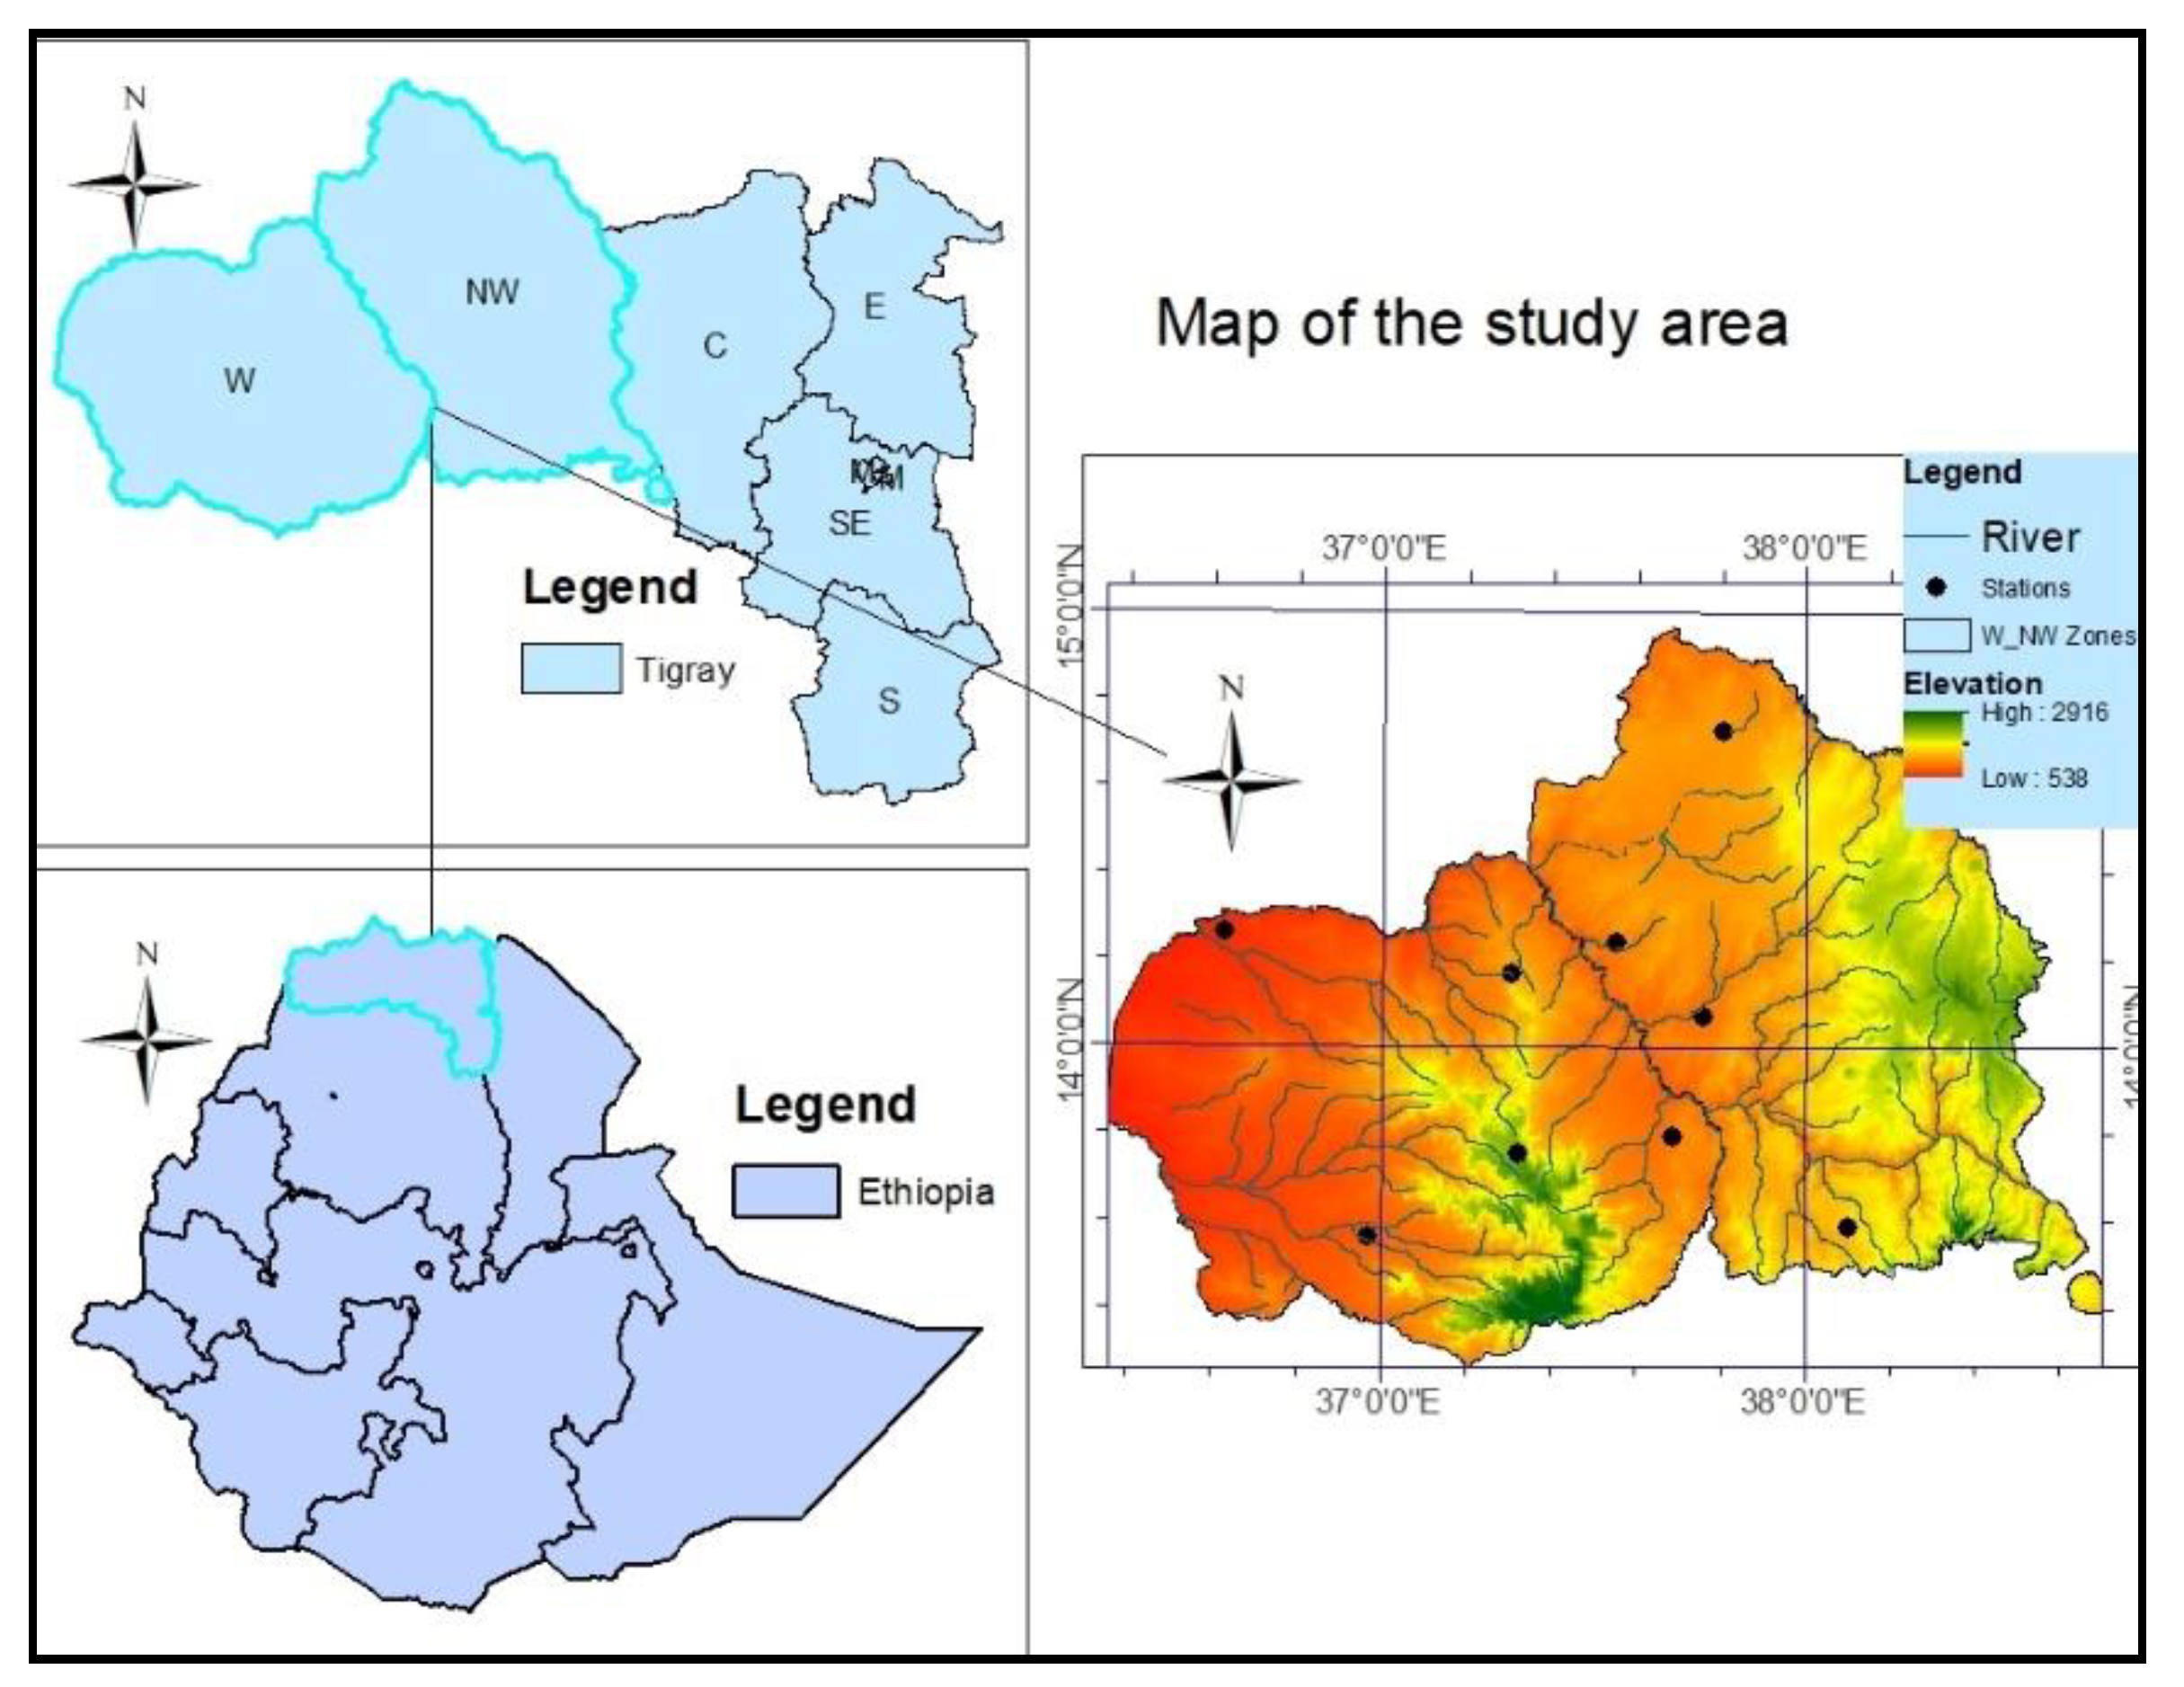
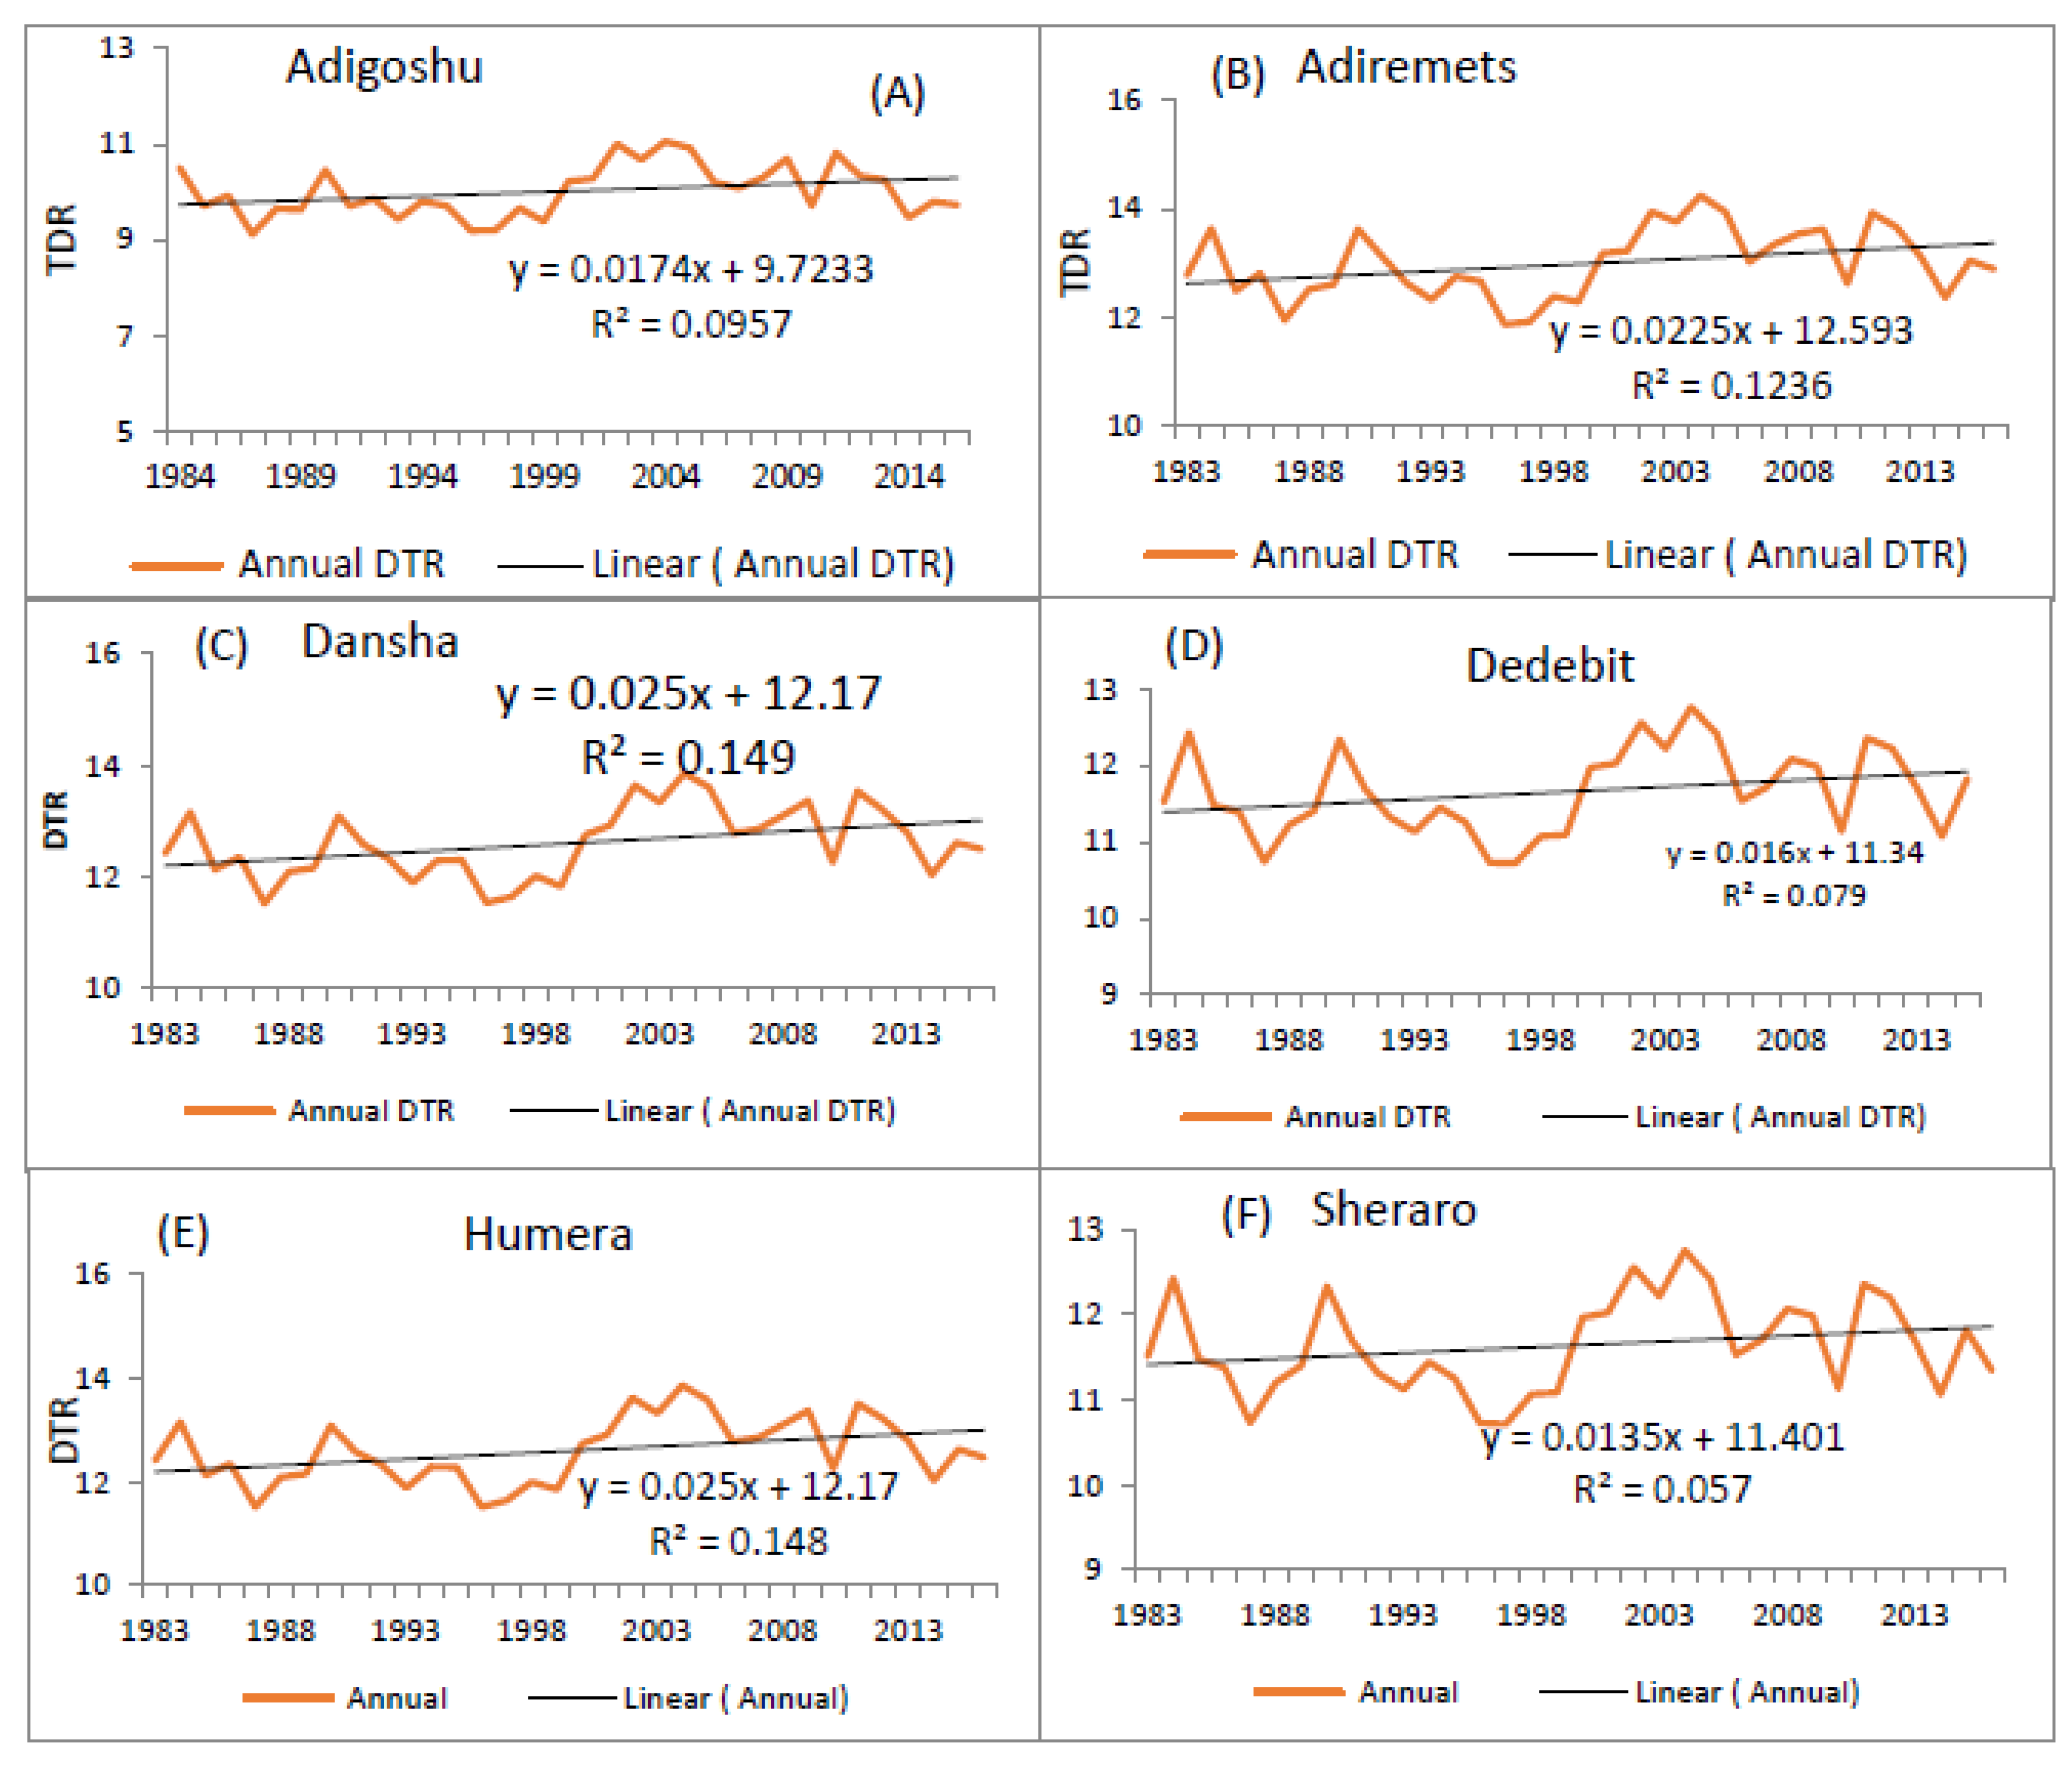
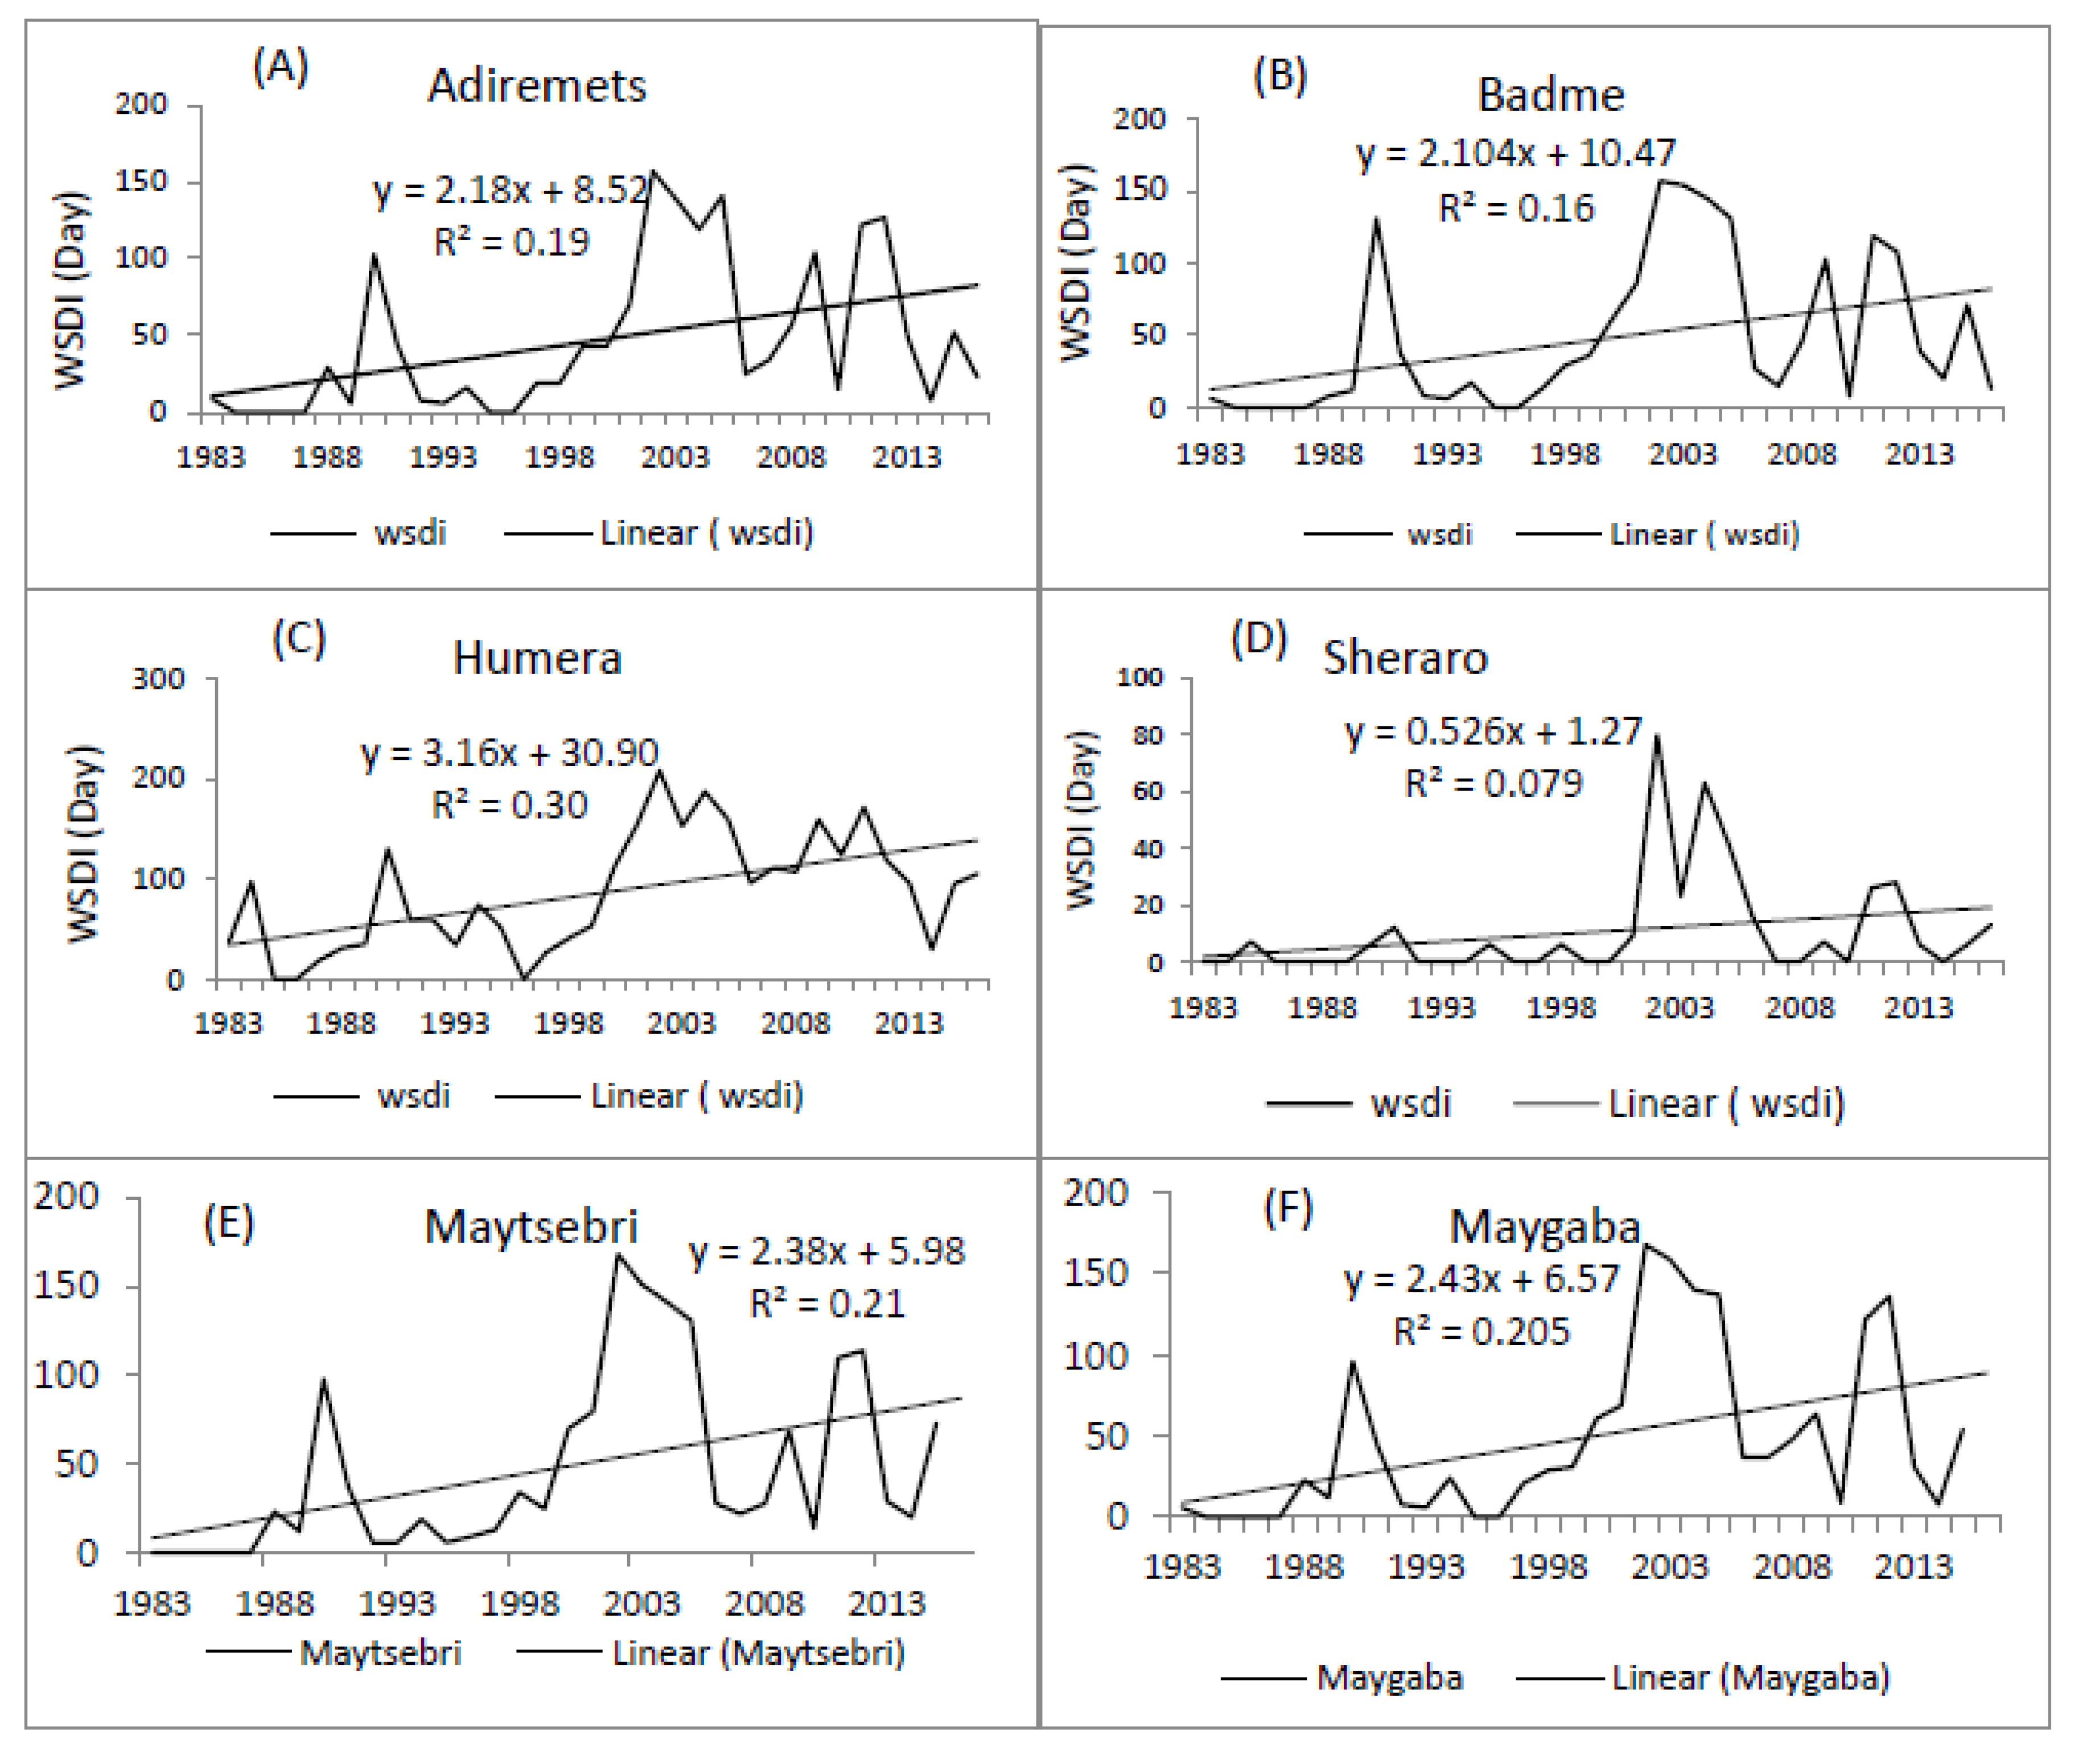
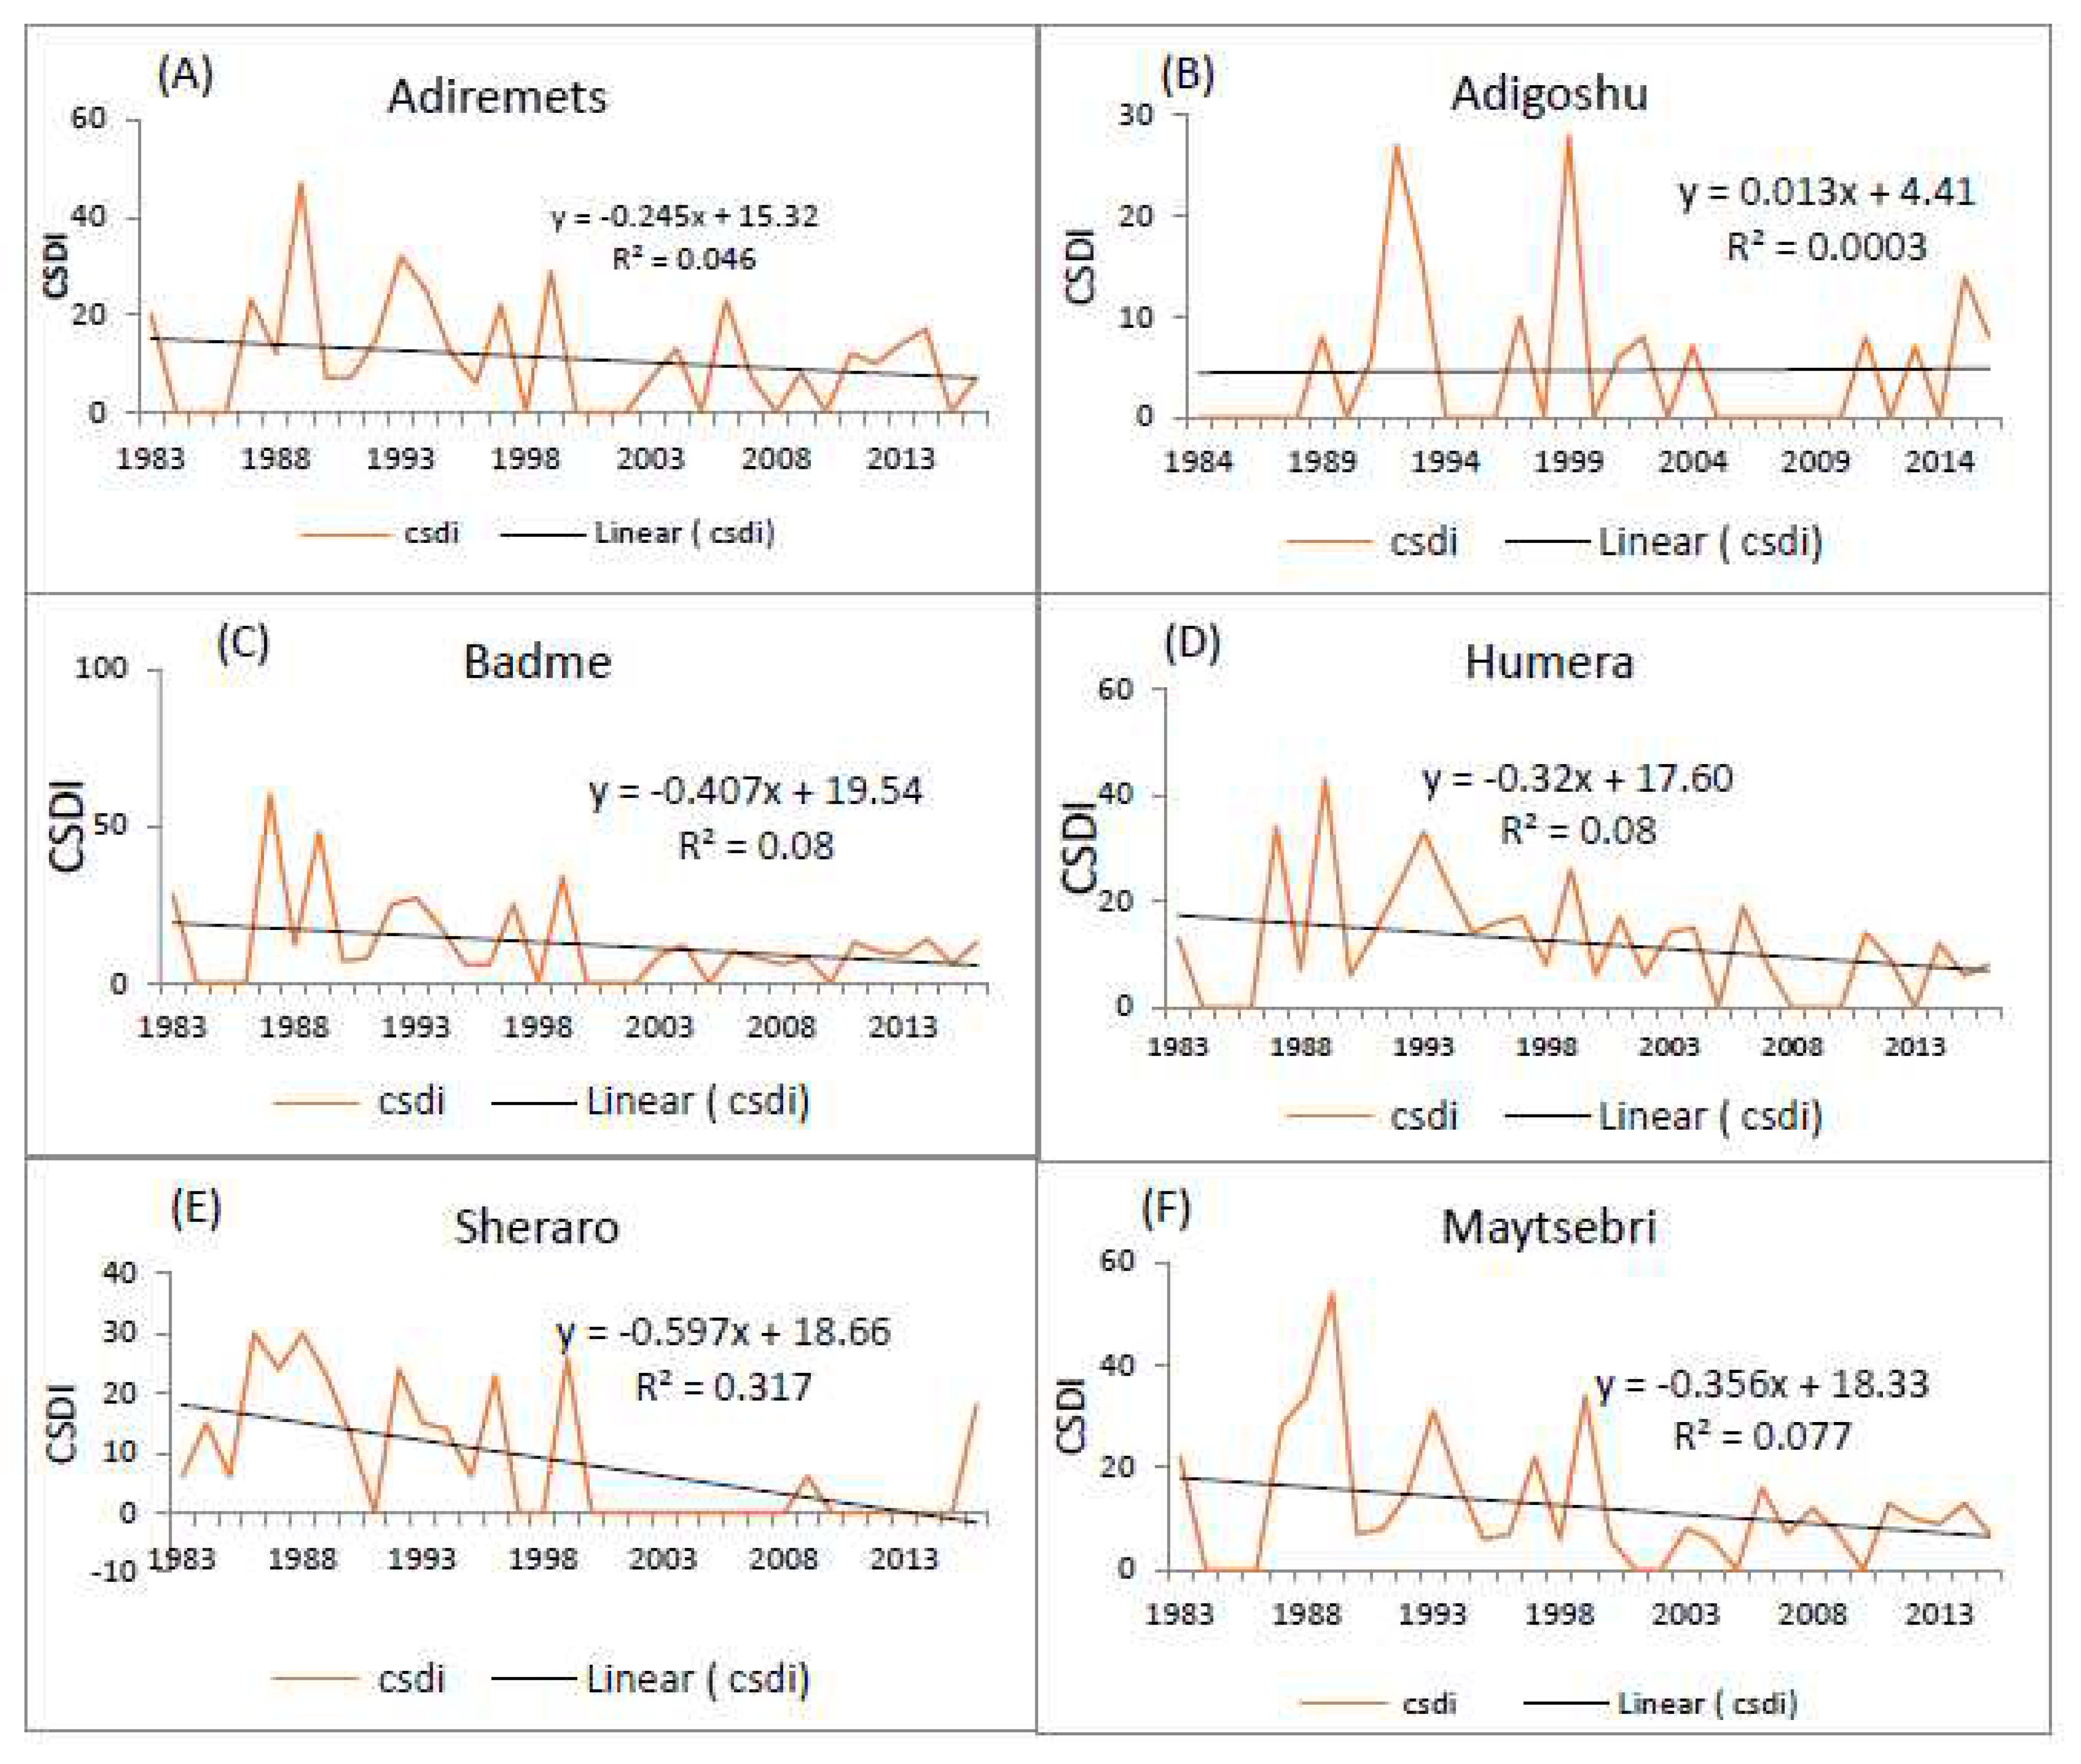
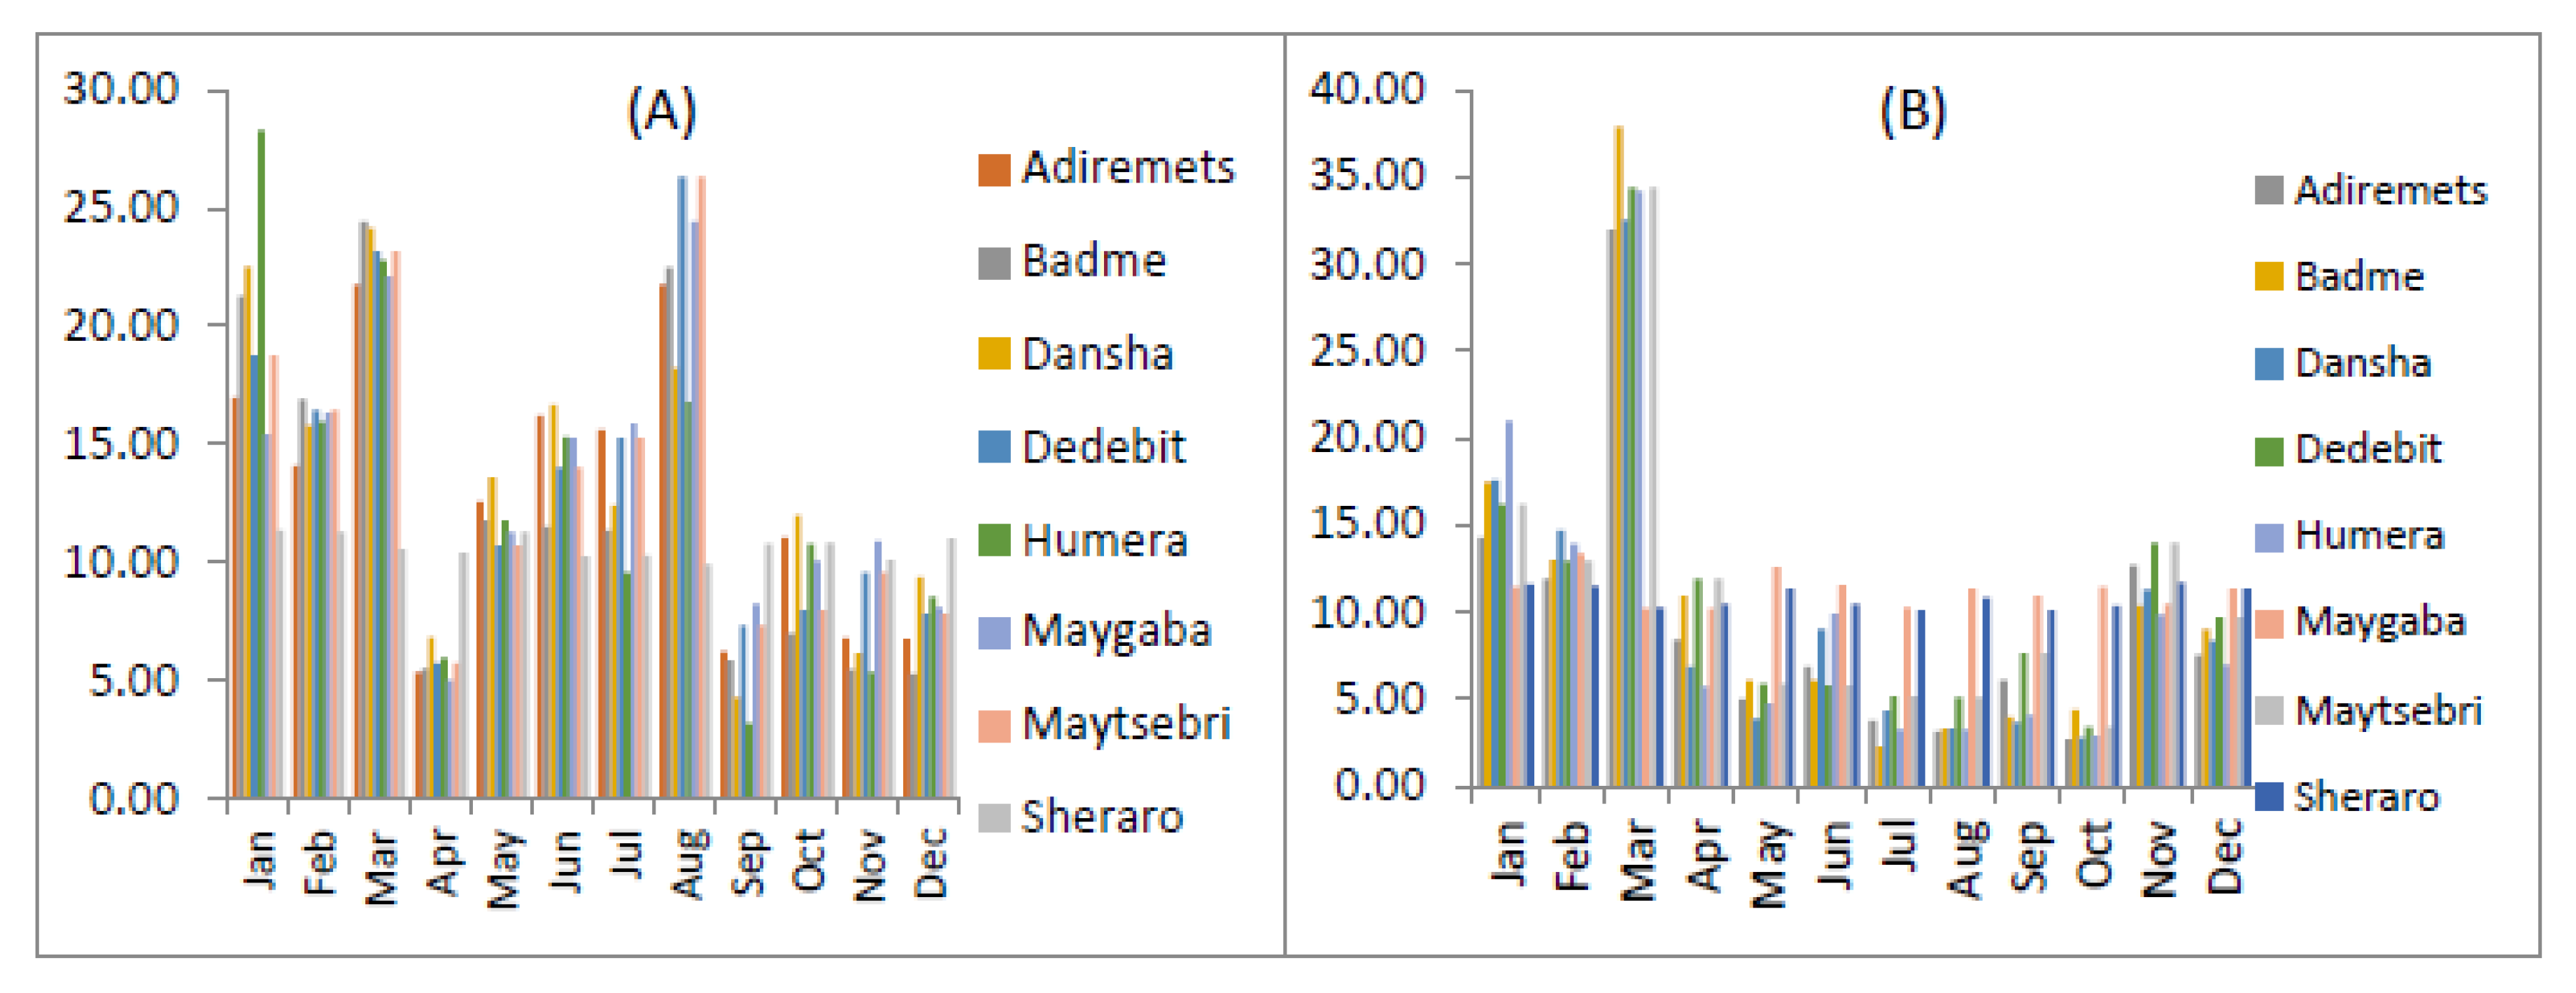
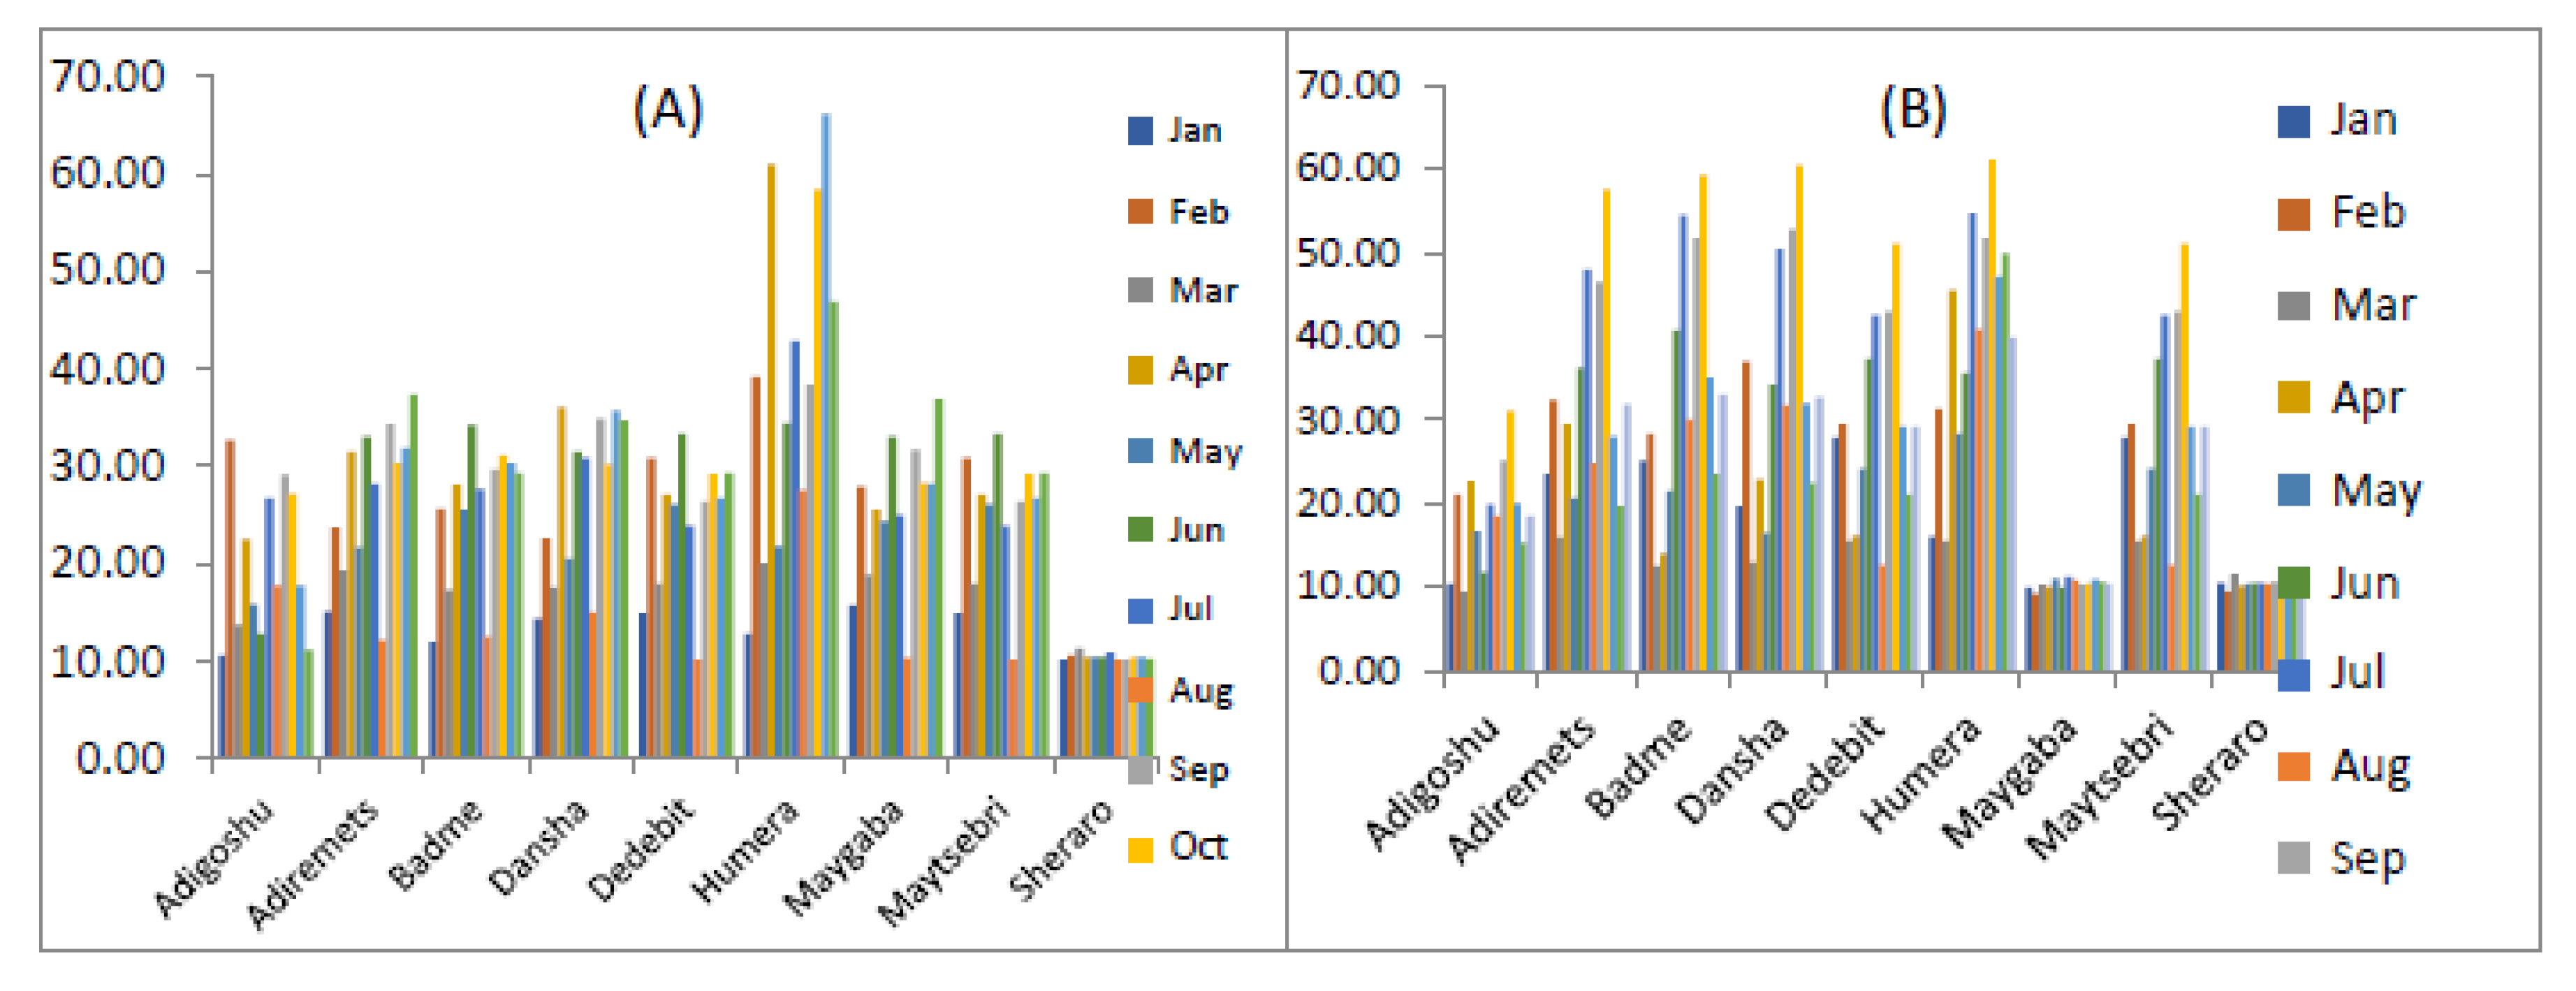
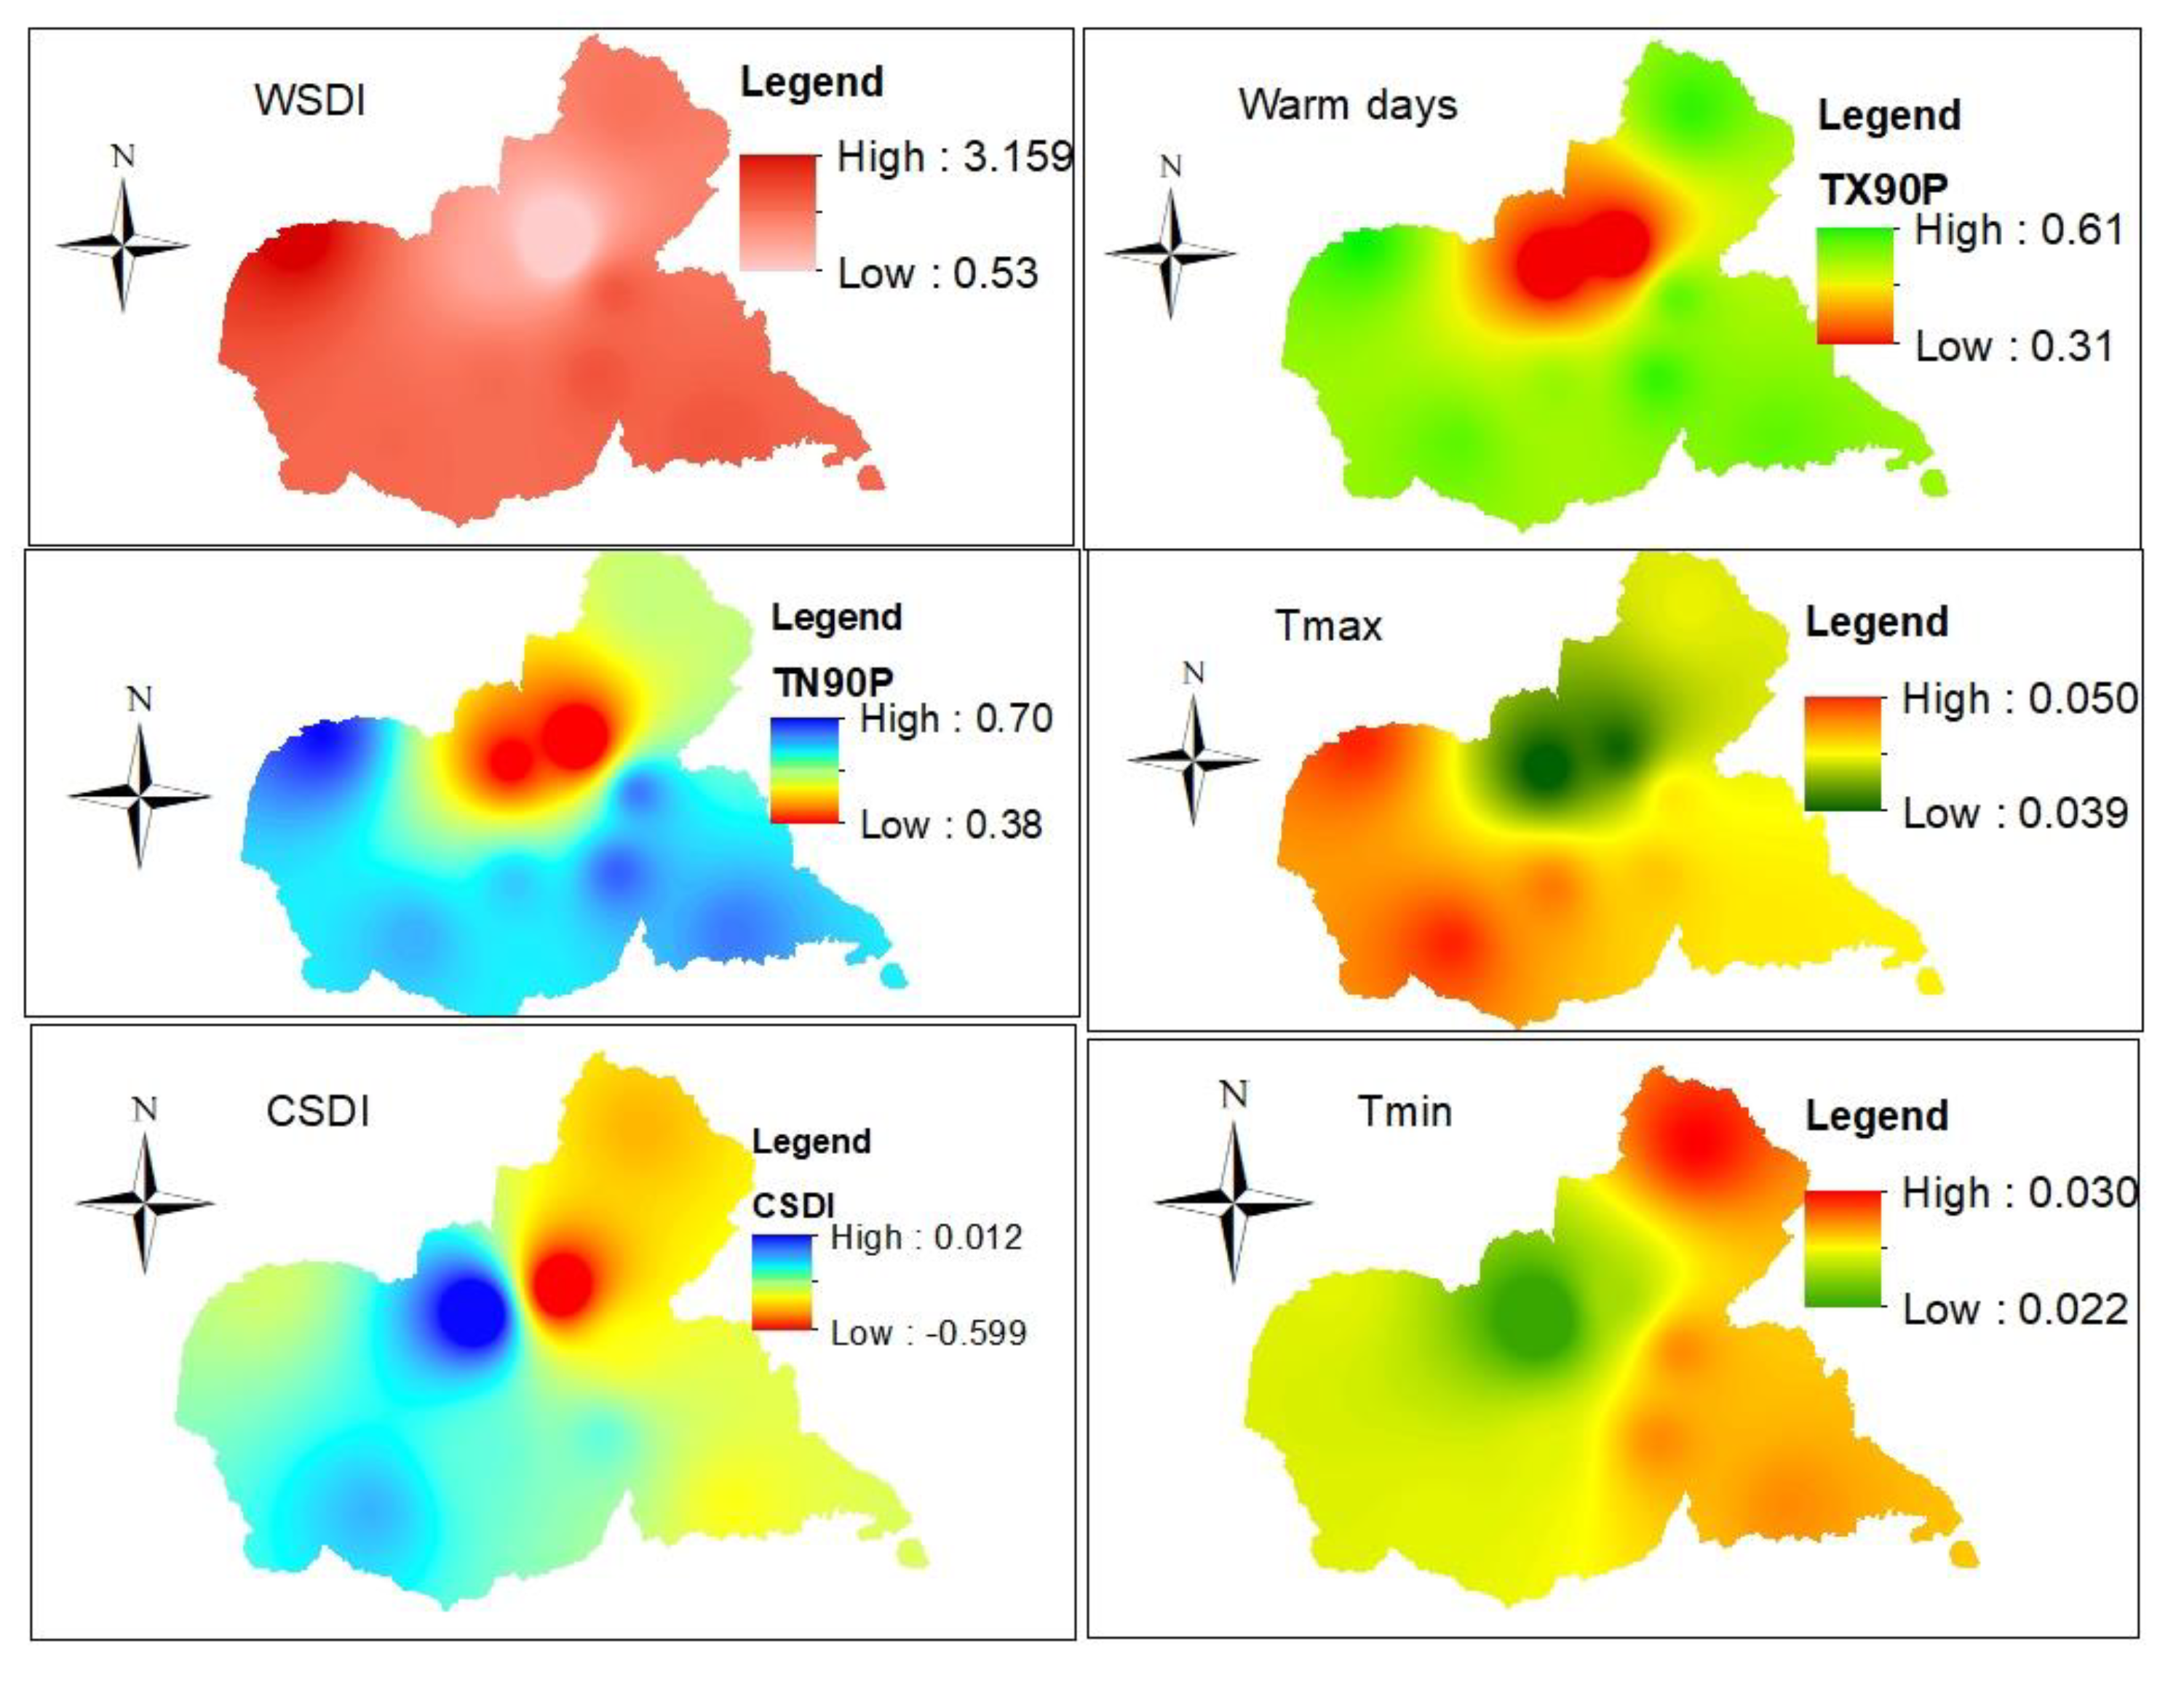
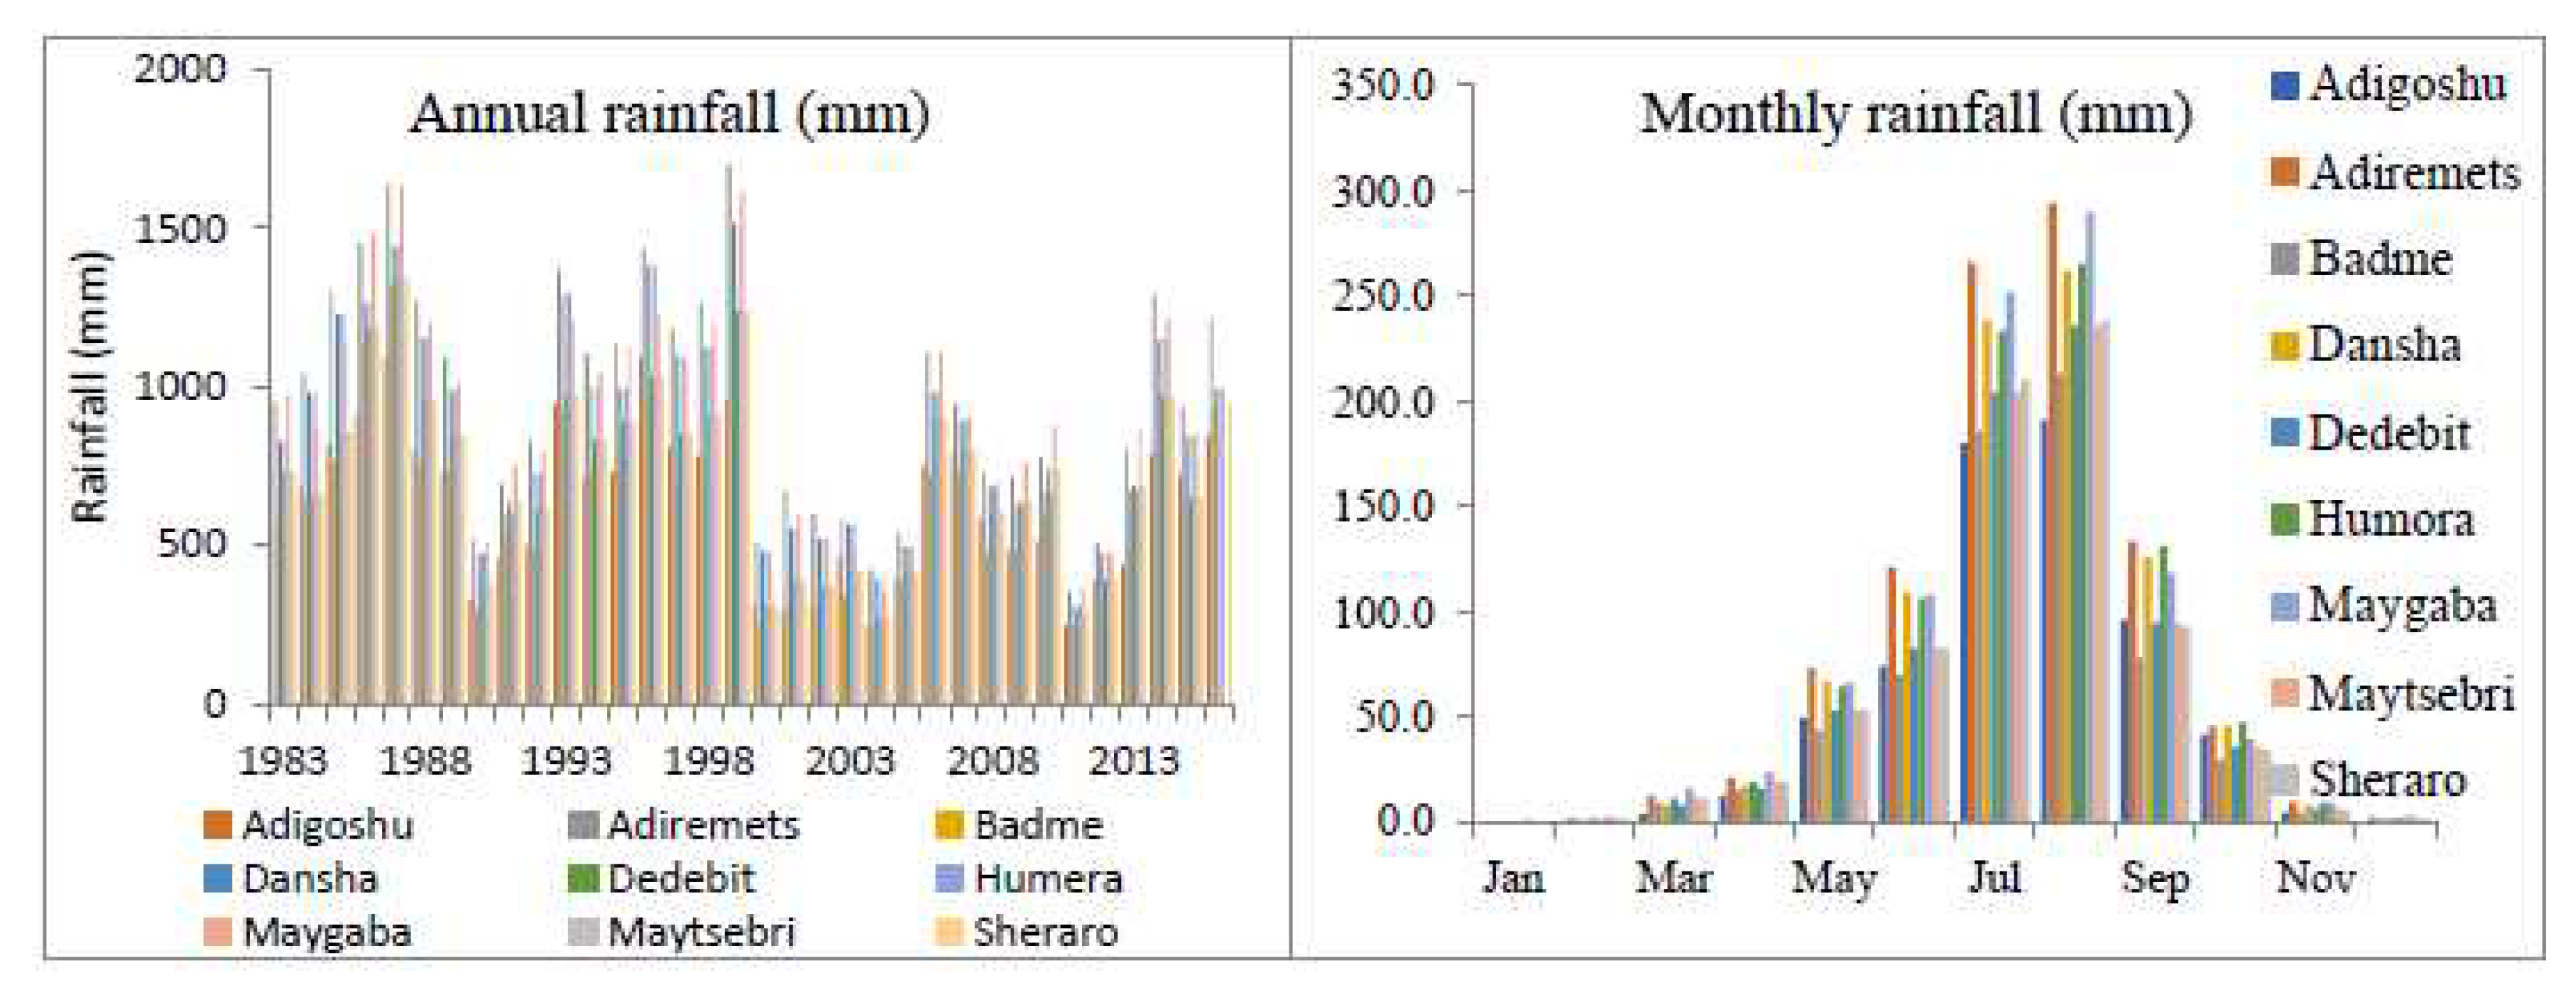
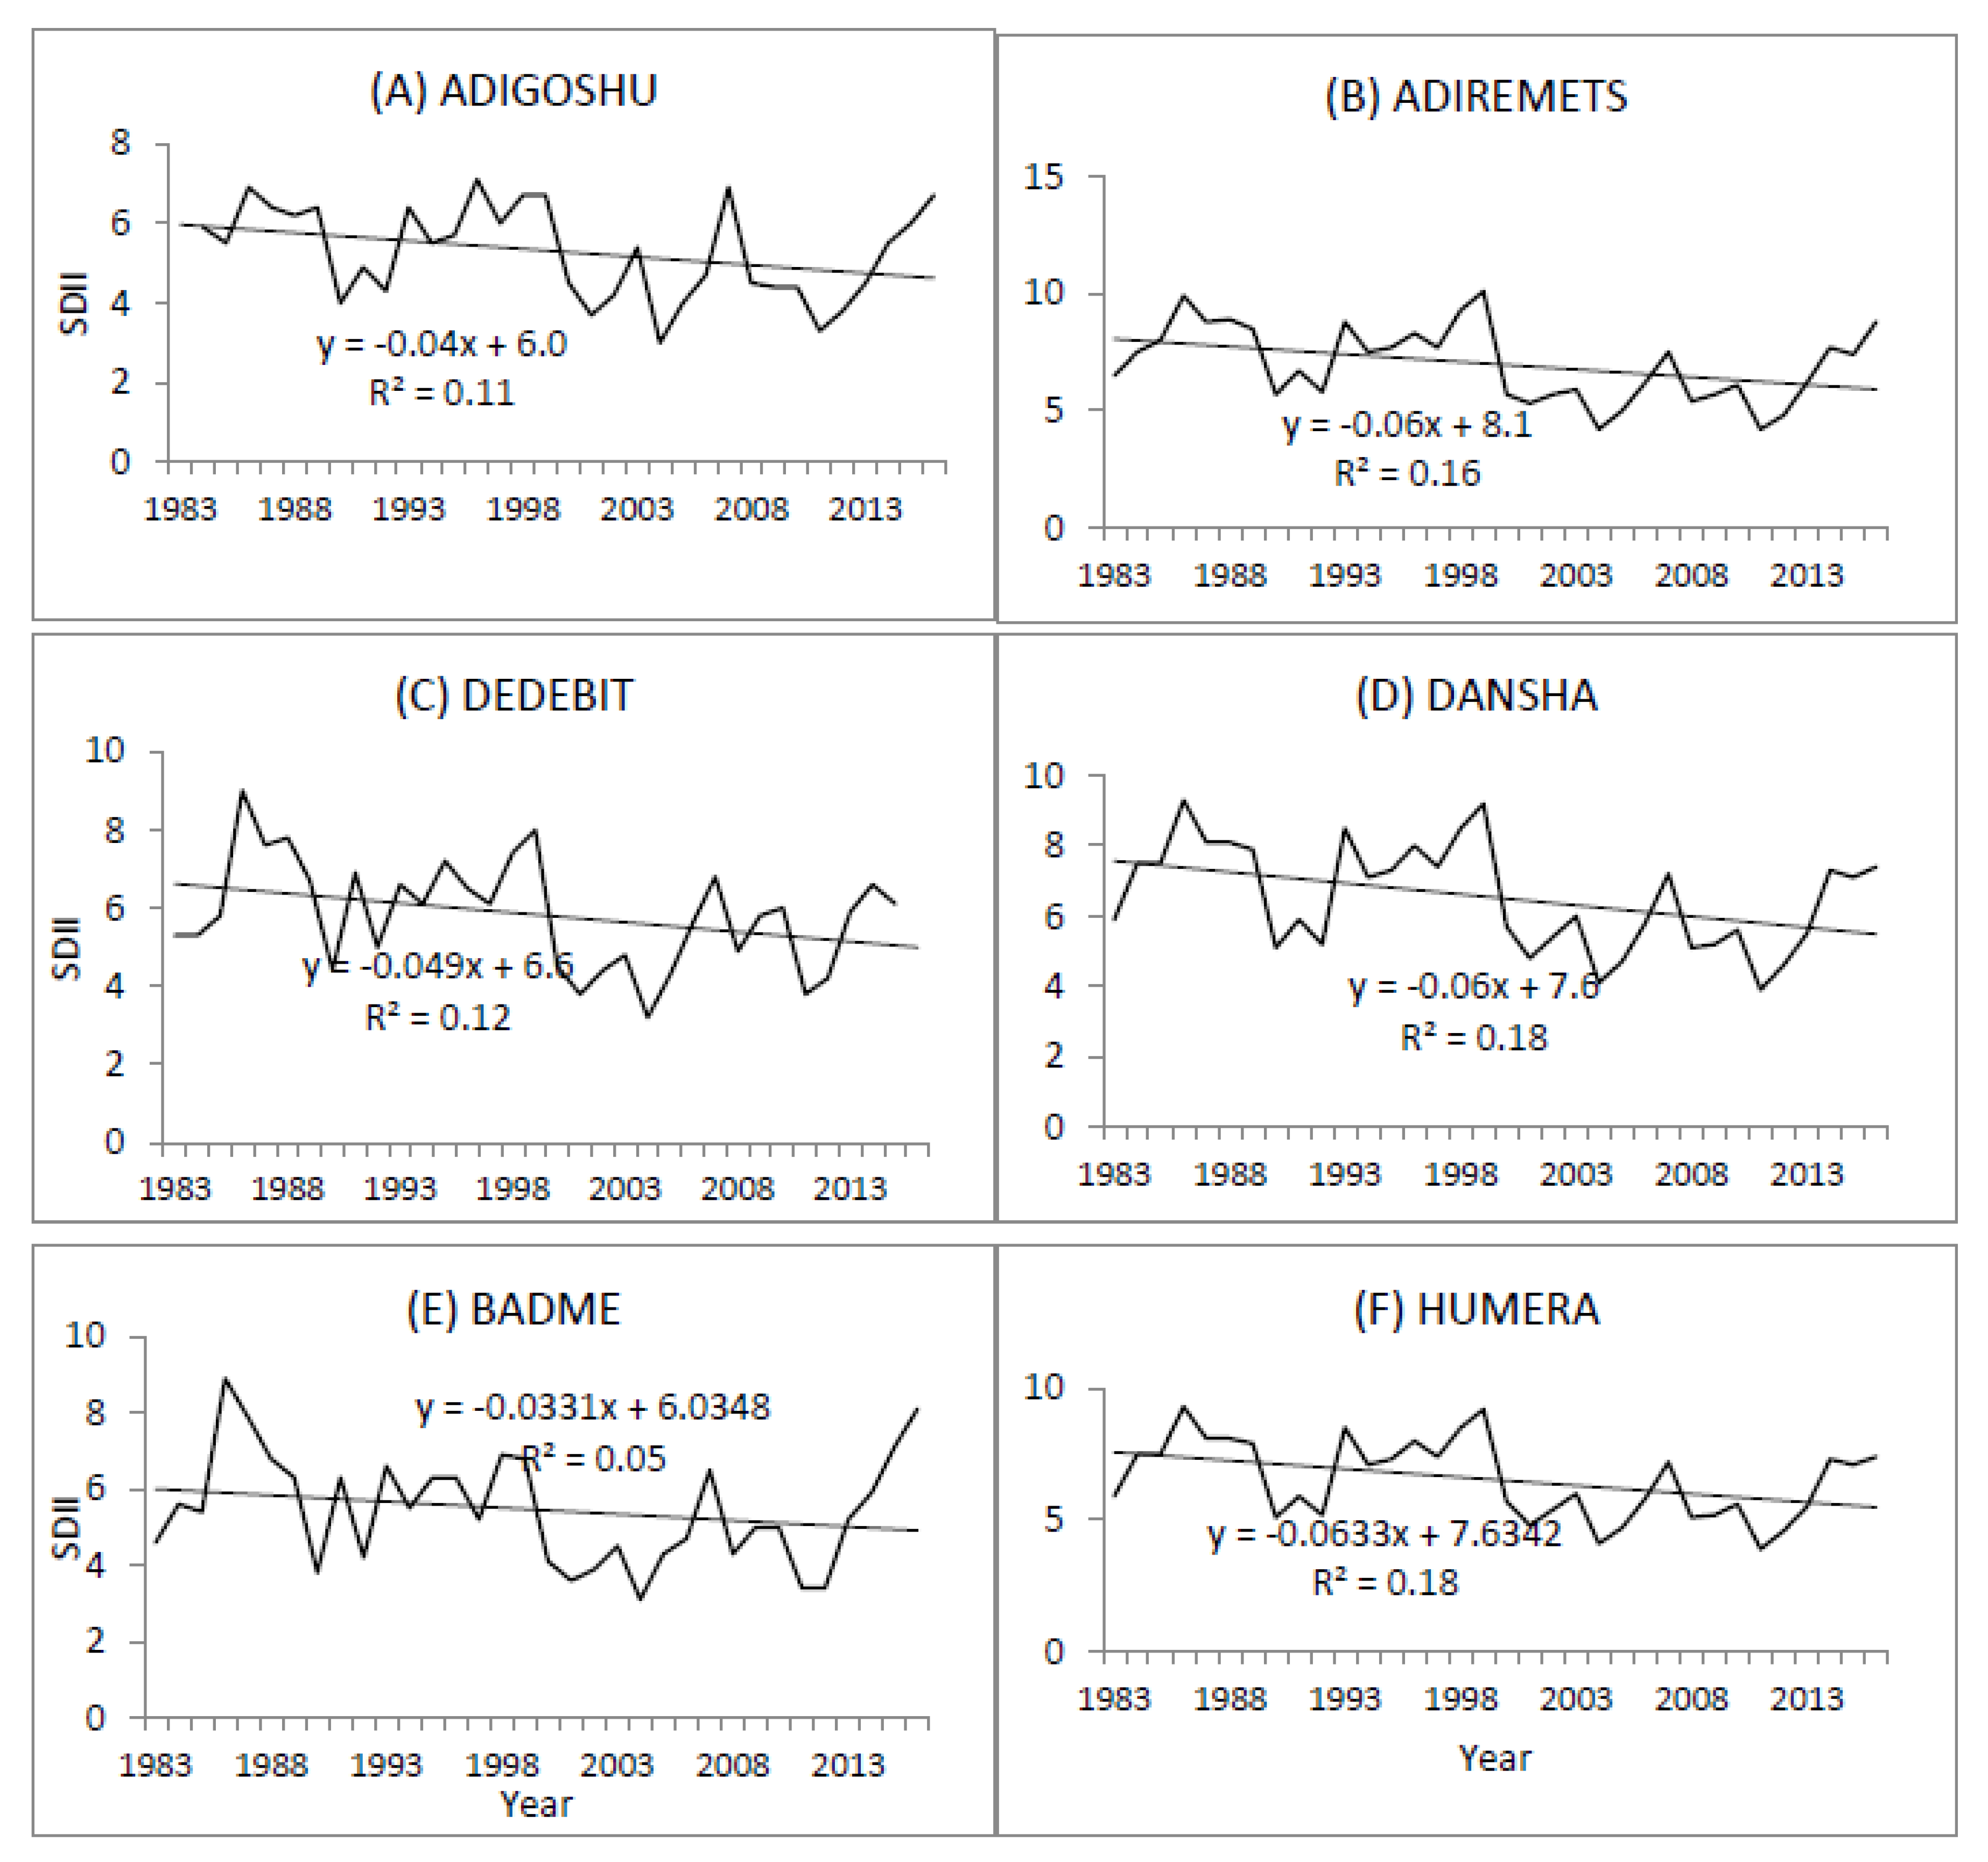
| Weather station | Elevation (m) | Latitude (Decimal) |
Longitude (Decimal) |
Data Availability |
| Sheraro | 1031 | 14.240 | 37.555 | 1983-2016 |
| Badme | 1080 | 14.725 | 37.804 | 1983-2016 |
| Humera | 600 | 14.580 | 36.62 | 1983-2016 |
| Adiremets | 2014 | 13.751 | 37.324 | 1983-2016 |
| Dansha | 780 | 13.540 | 36.969 | 19832016 |
| Adigoshu | 1115 | 14.167 | 37.306 | 1984-2016 |
| Dedebit | 897 | 14.068 | 37.760 | 1983-2015 |
| Maytsebri | 1350 | 13.586 | 38.143 | 1983-2015 |
| Maygaba | 914 | 13.793 | 37.690 | 1983-2015 |
| ID | Indicator name | Definition | Units |
| Temperature indices | |||
| TXx | Max Tmax | Monthly maximum value of daily maximum temperature | 0C |
| TNx | Max Tmin | Monthly maximum value of daily minimum temperature | 0C |
| TXn | Min Tmax | Monthly minimum value of daily maximum temperature | 0C |
| TNn | Min Tmin | Monthly minimum value of daily minimum temperature | 0C |
| TN10p | Cool nights | Percentage of days when TN<10th percentile | Day |
| TX10p | Cool days | Percentage of days when TX<10th percentile | Day |
| TN90p | Warm nights | Percentage of days when TN>90th percentile | Day |
| TX90P | Warm days | Percentage of days when TX>90th percentile | Day |
| WSDI | Warm spell duration indicator | Annual count of days with at least 6 consecutive days when TX >90th percentile | Day |
| DTD | Diurnal temperature range | Monthly mean difference between the maximum and minimum temperatures | 0C |
| CSDI | Cold spell duration indicator | Annual count of days with at least 6 consecutive days when TN<10th percentile | Day |
| Rainfall indices | |||
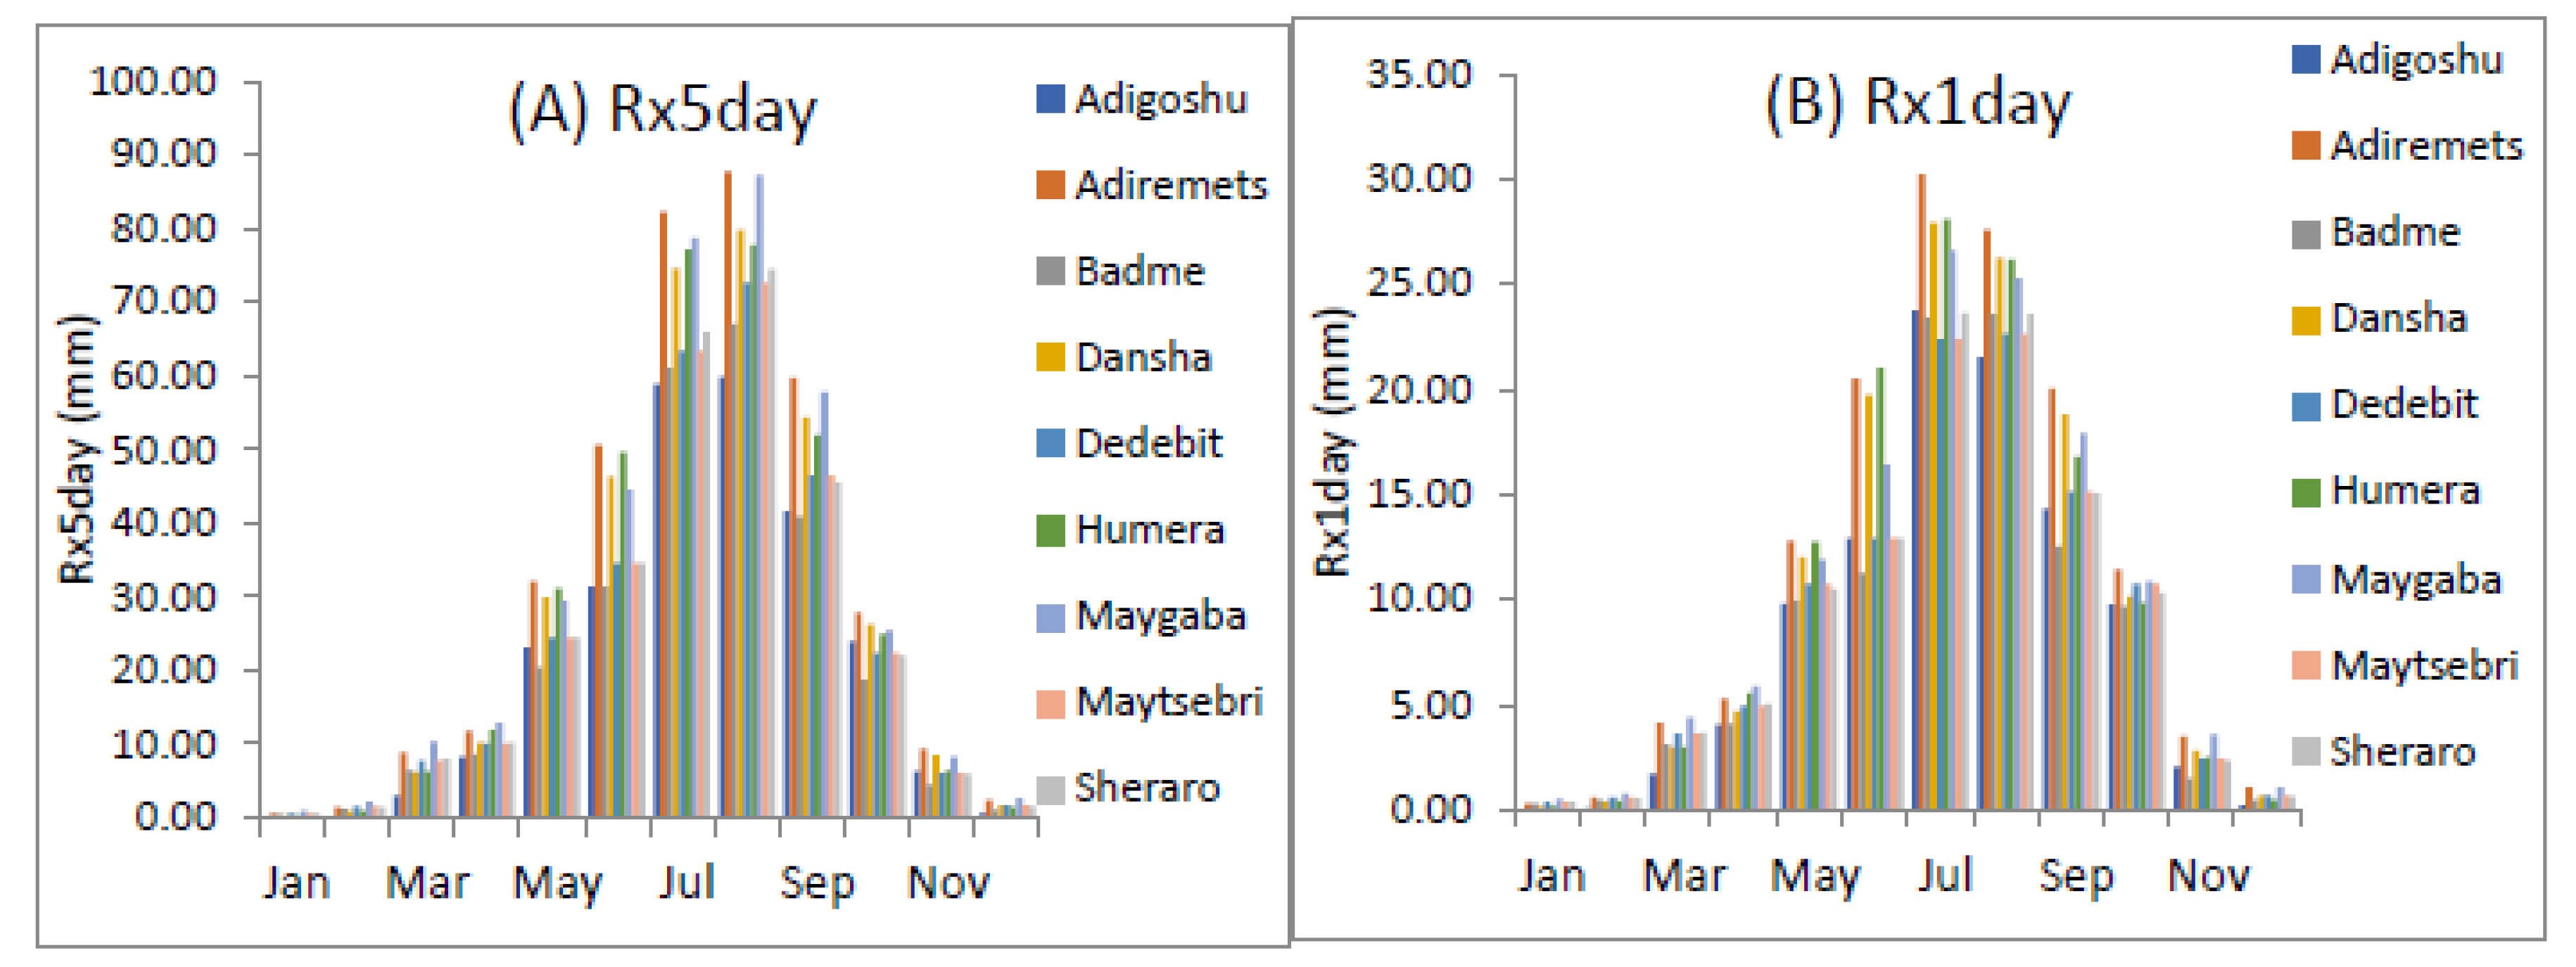
| RX1day | Max 1-day precipitation amount | Monthly maximum 1-day precipitation | mm |
| RX5day | Max-5day precipitation amount | Monthly maximum consecutive 5-day precipitation | mm |
| R10mm | Number of heavy precipitation days | Annual count of days when PRCP=10mm | Day |
| R20mm | Number of very heavy precipitation days | Annual count of days when PRCP=20mm | Day |
| CDD | Consecutive dry days | Maximum number of consecutive days with RR>=1mm | Day |
| CWD | Consecutive wet days | Maximum number of days with RR>=1mm | Day |
| R95p | Very wet days | Annual total PRCP when RR>95th percentile | Day |
| PRCPTOT | Total precipitation | Annual total PRCP in wet days (RR>=1mm) | mm |
| Station | TR20 | TN10P | TX10P | TN90P | TX90P | WSDI | CSDI | DTR |
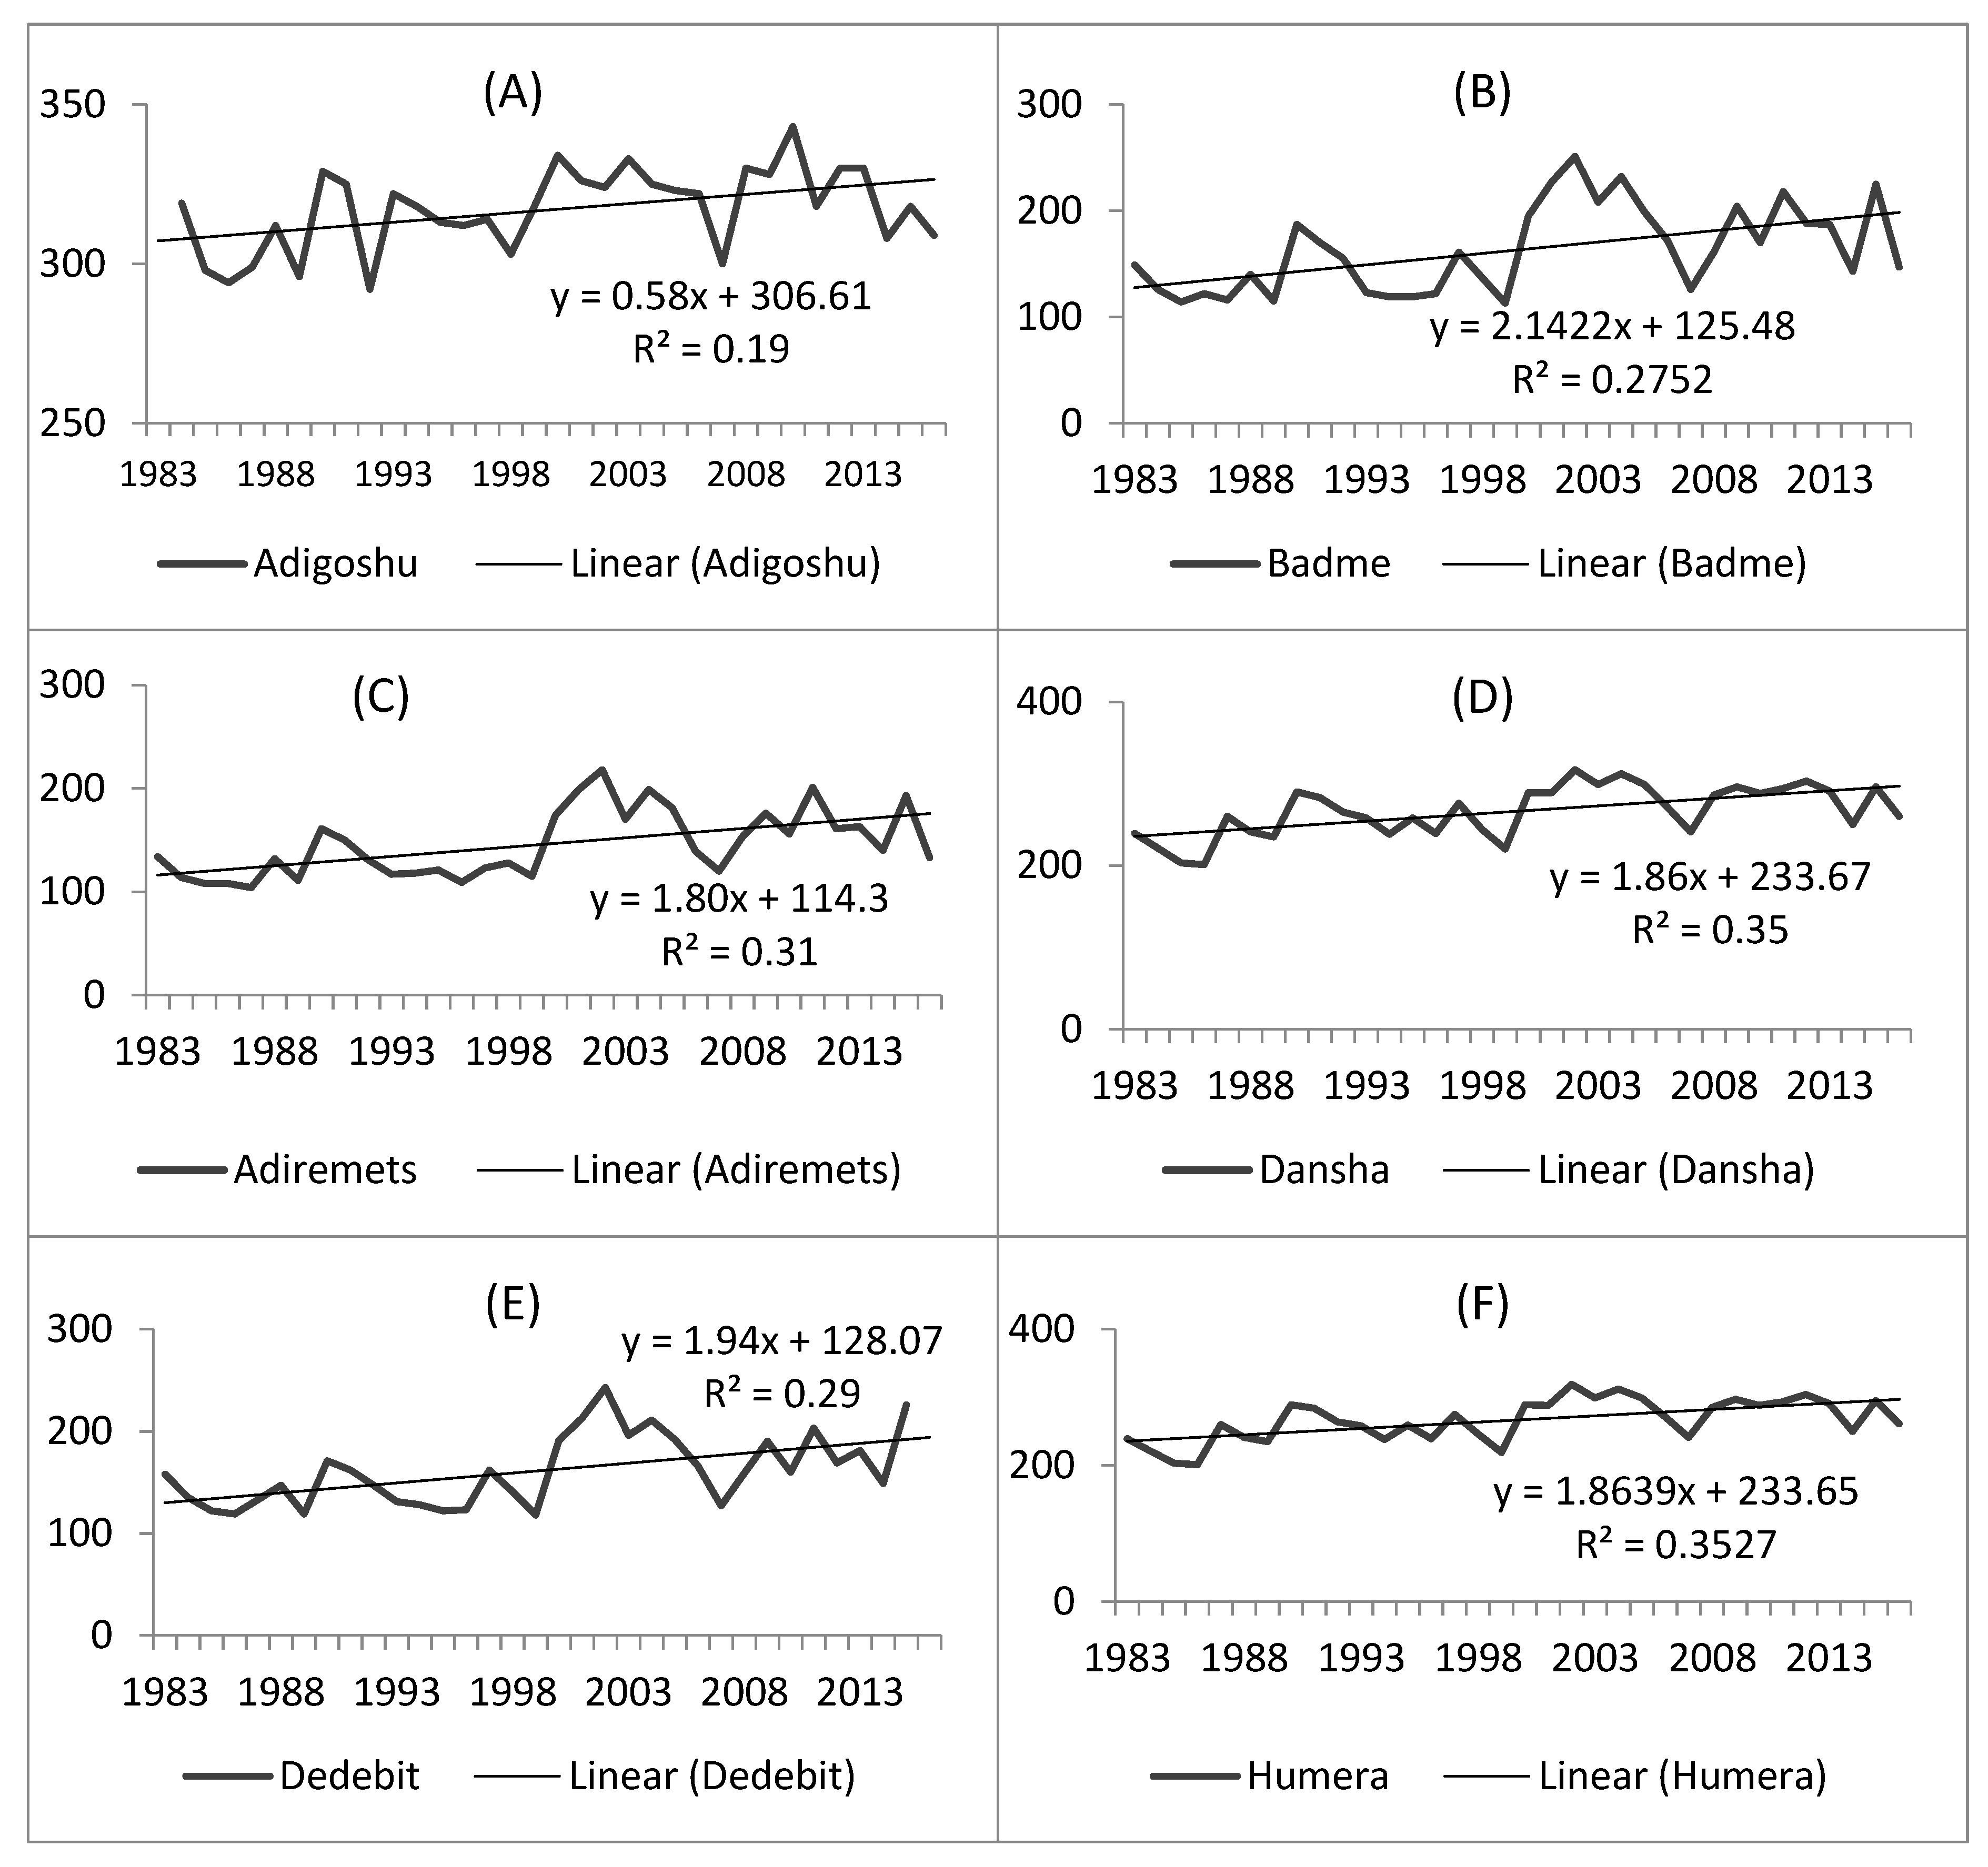
| Adigoshu | 0.58 | -0.29 | -0.23 | 0.33 | 0.43 | 1.52 | 0.013 | 0.017 |
| Adiremets | 1.8 | -0.31 | -0.41 | 0.56 | 0.64 | 2.18 | -0.25 | 0.023 |
| Badime | 2.14 | -0.36 | -0.44 | 0.61 | 0.57 | 2.1 | -0.41 | 0.014 |
| Dansha | 1.86 | -0.33 | -0.39 | 0.59 | 0.65 | 2.23 | -0.19 | 0.025 |
| Dedebit | 1.9 | -0.38 | -0.45 | 0.59 | 0.67 | 2.39 | -0.36 | 0.016 |
| Humera | 1.86 | -0.38 | -0.37 | 0.62 | 0.71 | 3.16 | -0.32 | 0.024 |
| Maygaba | 0.99 | -0.35 | -0.46 | 0.61 | 0.68 | 2.43 | -0.25 | 0.018 |
| Maytsebri | 1.9 | -0.38 | -0.46 | 0.59 | 0.67 | 2.39 | -0.36 | 0.016 |
| Sheraro | 1.69 | -0.44 | -0.32 | 0.31 | 0.38 | 0.53 | -0.60 | 0.013 |
| Station | Tmax (0C) | Tmin (0C) | ||
| Adigoshu | 0.040* | 0.022** | ||
| Adiremets | 0.049** | 0.027** | ||
| Badme | 0.045* | 0.031** | ||
| Dansha | 0.051** | 0.027** | ||
| Dedebit | 0.046** | 0.029** | ||
| Humera | 0.051** | 0.027** | ||
| Maygaba | 0.047** | 0.029** | ||
| Maytsebri | 0.046** | 0.029** | ||
| Sheraro | 0.040* | 0.026** | ||
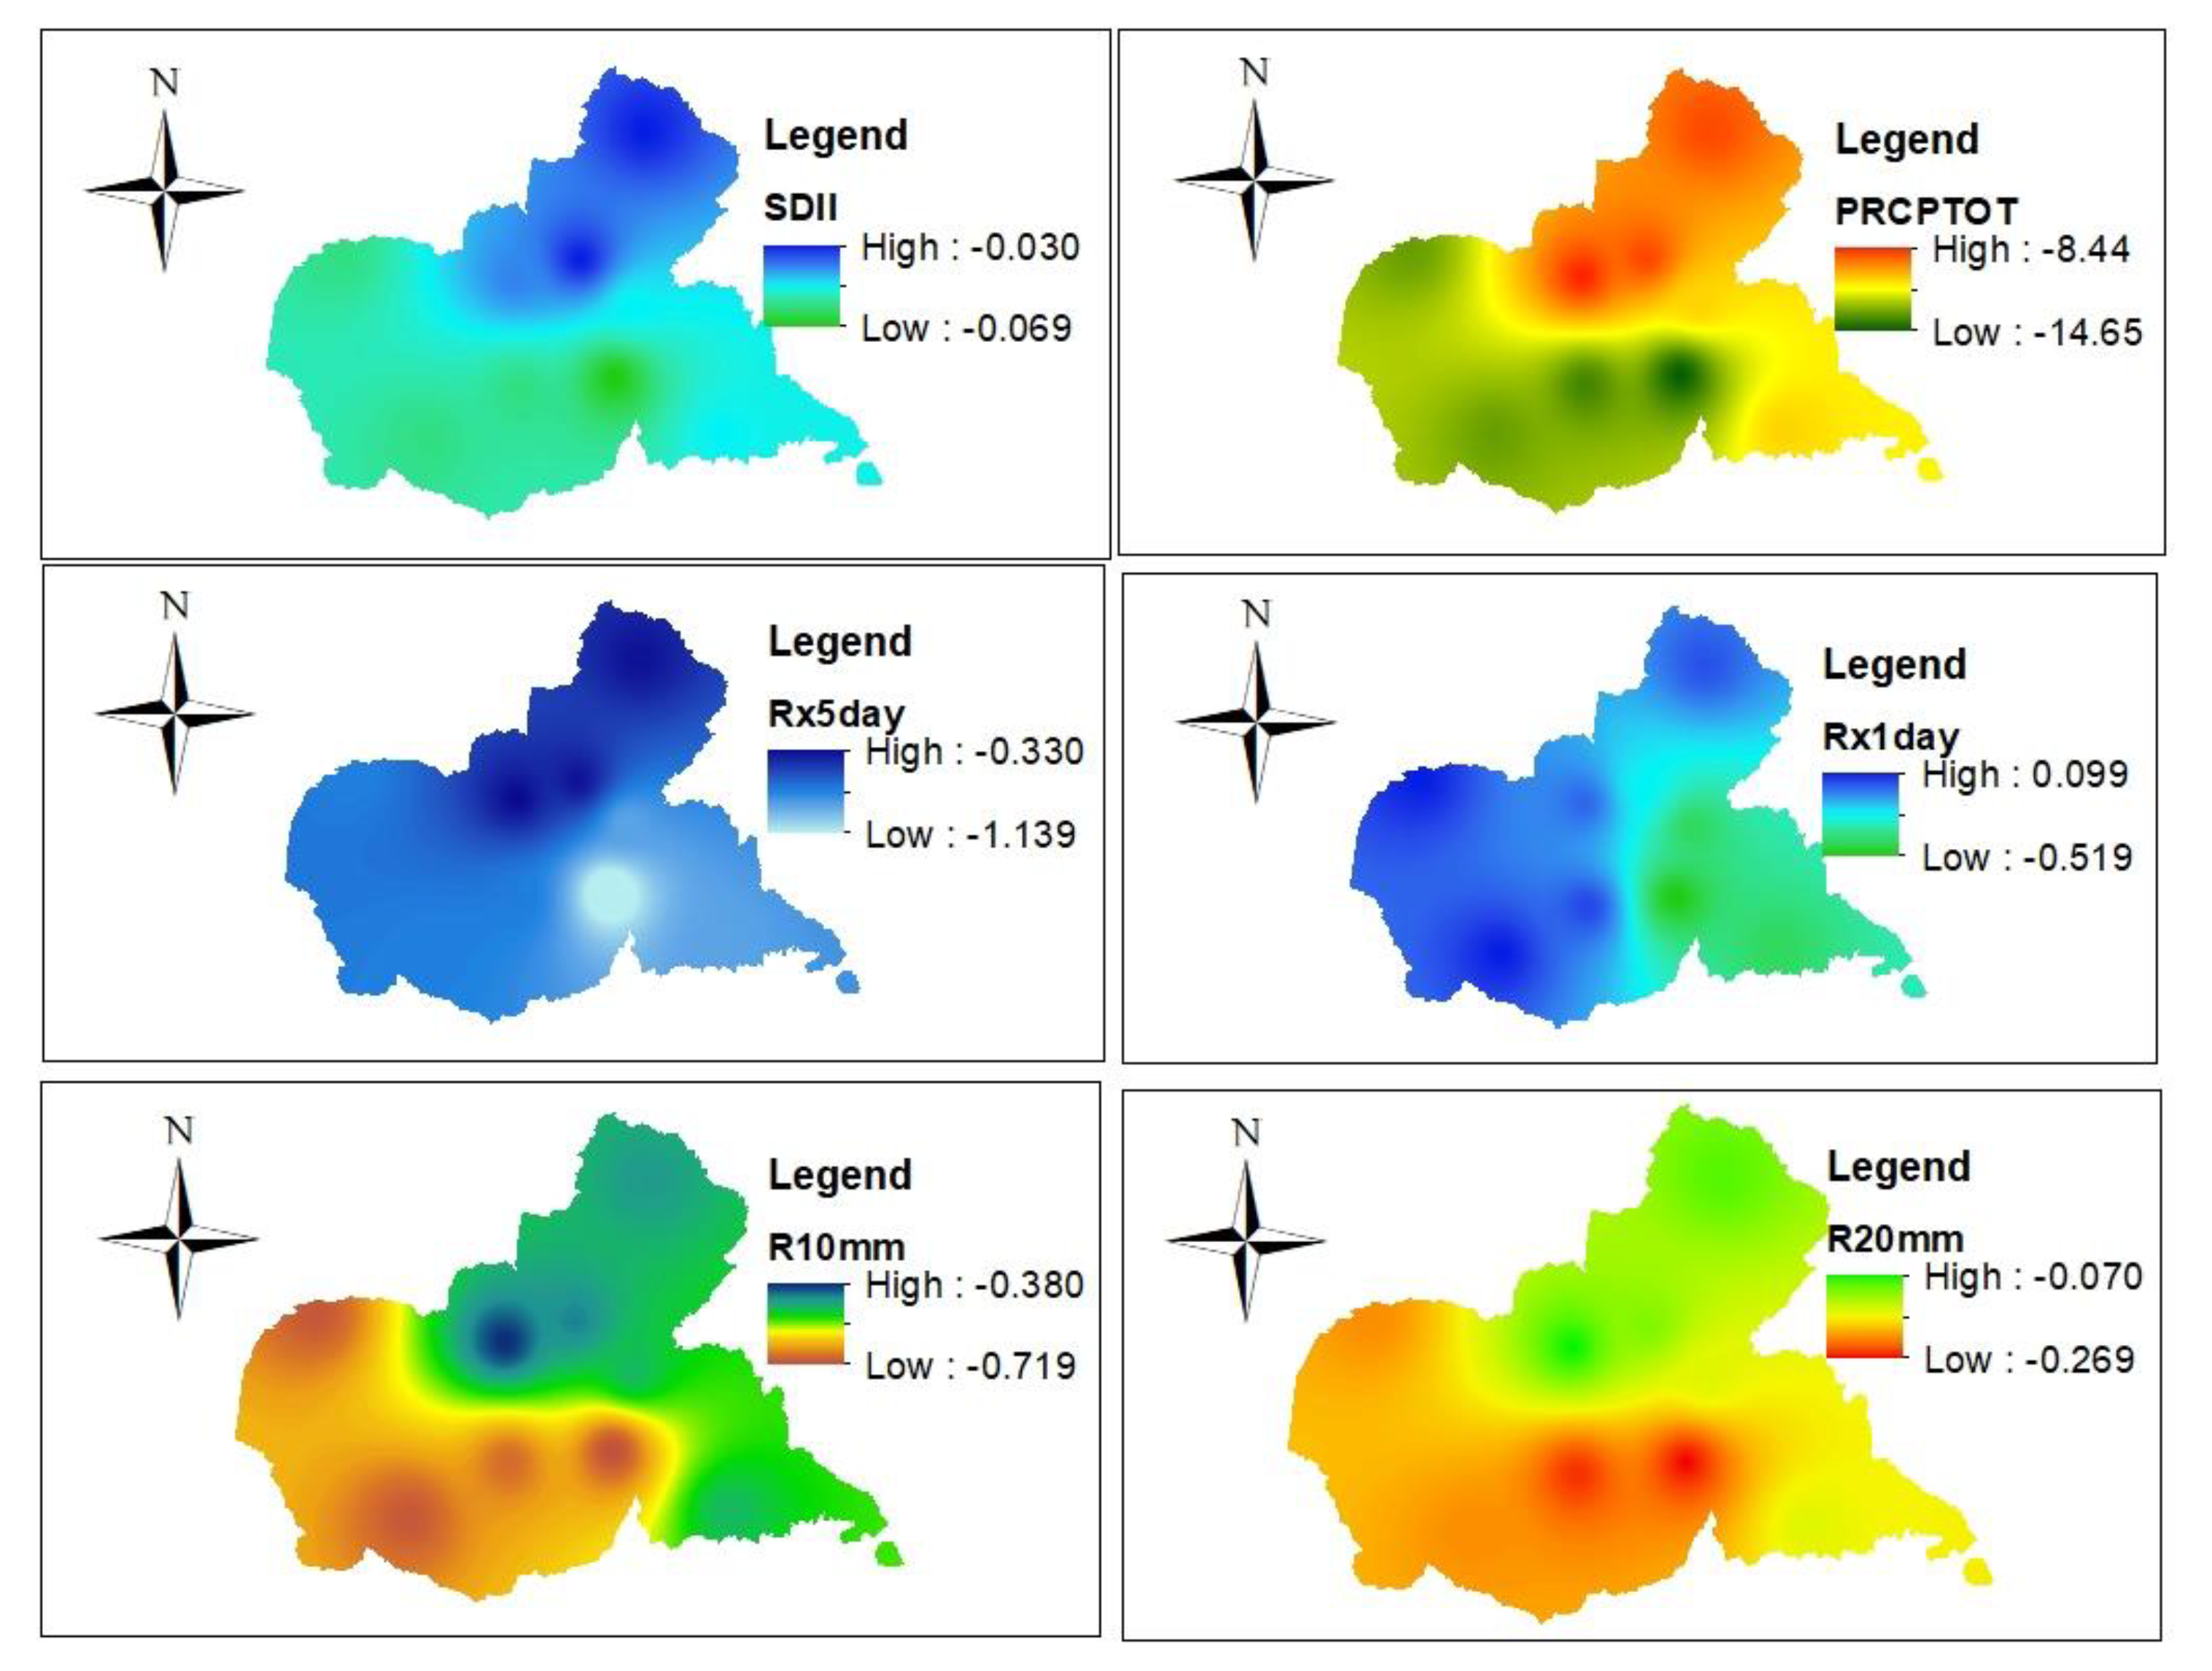
| Station | PRCPTOT | SDII | Rx1day | Rx5day |
| Adigoshu | -8.4ns | -0.04ns | -0.013 | -0.33 |
| Adiremets | -13.8* | -0.06* | 0.037 | -0.65 |
| Badme | -8.8ns | -0.03ns | 0.02 | -0.35 |
| Dansha | -13.3* | -0.06* | 0.10 | -0.66 |
| Dedebit | -10.9* | -0.05* | -0.42 | -0.78 |
| Humera | -13.3* | -0.06* | 0.10 | -0.66 |
| Maygaba | -14.6* | -0.07* | -0.52* | -1.14* |
| Maytsebri | -10.9* | -0.05* | -0.42 | -0.78 |
| Sheraro | -8.826ns | -0.03ns | -0.21 | -0.35 |
Disclaimer/Publisher’s Note: The statements, opinions and data contained in all publications are solely those of the individual author(s) and contributor(s) and not of MDPI and/or the editor(s). MDPI and/or the editor(s) disclaim responsibility for any injury to people or property resulting from any ideas, methods, instructions or products referred to in the content. |
© 2023 by the authors. Licensee MDPI, Basel, Switzerland. This article is an open access article distributed under the terms and conditions of the Creative Commons Attribution (CC BY) license (http://creativecommons.org/licenses/by/4.0/).


