Preprint
Article

Angular-Momentum Modes in a Bosonic Condensate Trapped in the Inverse-Square

Altmetrics

Downloads

97

Views

28

Comments

0

A peer-reviewed article of this preprint also exists.

This version is not peer-reviewed

Submitted:

20 October 2023

Posted:

20 October 2023

You are already at the latest version

Alerts
Abstract
In the mean- field approximation, the well-known effect of the critical quantum collapse in a 3D gas of particles pulled to the center by potential U(r) = -U_0/(2r^2) is suppressed by repulsive interparticle interactions, which create the otherwise non-existing s-wave ground state. Here, we address excited bound states carrying the angular momentum, with the orbital and magnetic quantum numbers, l and m. They exist above a threshold value of the potential's strength, U_0 > l(l+1). The sectoral, tesseral, and zonal modes, which correspond to m = l, 0 < m < l, and m = 0, respectively, are found in an approximate analytical form for relatively small values of U_0 - l(l + 1). Explicit results are produced for the p- and d-wave states, with l = 1 and 2, respectively. In the general form, the bound states are obtained numerically, confirming the accuracy of the analytical approximation.
Keywords: 
Subject: Physical Sciences  -   Theoretical Physics

1. Introduction and the Model

It is well known that attractive potential U ( r ) = U 0 / 2 r 2 , with U 0 > 0 , plays a special role in quantum mechanics [1]. Indeed, unlike the classical equation of motion in the same potential, which gives rise to equivalent solutions for all values of U 0 , due to the scaling invariance of the equation, U 0 cannot be scaled out in the corresponding Schrödinger equation, written in the normalized form,
i ψ t = 1 2 2 + U 0 r 2 ψ ,
where U 0 is an irreducible parameter. It is known that the three-dimensional (3D) equation (1) gives rise to the spherically symmetric ground state (GS) if the strength of the pull to the center does not exceed a critical value,
U 0 < U 0 cr = 1 / 4 ,
while at U 0 > 1 / 4 Eq. (1) does not maintain the GS, leading, instead, to the quantum collapse of wave function ψ (called “fall onto the center" of the quantum particle in the book by Landau and Lifshitz [1]). Exact solutions of Eq. (1) for the developing collapse, as well as the respective solutions for the classical equation of motion, were recently analyzed in Ref. [2]. Such a difference between the classical and quantum behavior under the action of the same potential is considered as the quantum anomaly, alias “dimensional transmutation" [3,4] (quantum anomalies for particles trapped in an external potential are also known in the 2D geometry [5]).
A physical realization of the Schrödinger equation (1) is possible for a particle with a permanent electric dipole moment (such as a small polar molecule) pulled to the electric charged fixed at the center. If the particle minimizes its energy by aligning the polarization of the dipole moment with the local electric field, the attraction potential takes precisely the form adopted in Eq. (1) [7]. In this case, for the particle with the mass 100 proton masses and the elementary electric charge set at the center, the critical value U 0 = 1 / 4 corresponds to a very small dipole moment, 10 6 Debye. Therefore, the overcritical case of U 0 > 1 / 4 is relevant in the actual physical context.
A possible solution of the quantum-collapse problem, i.e., restoration of the missing GS in the case of U 0 > 1 / 4 , was proposed in terms the secondary quantization, replacing the Schrödinger equation (1) by the corresponding linear quantum-field theory [3,4]. However, the solution does not predict the size of the so introduced GS. Instead, the renormalization-group technique, on which the field-theory formulation is based, postulates the existence of a GS with an arbitrary spatial size, in terms of which all other spatial scales are measured in the framework of the theory.
A completely different, many-body, solution of the collapse problem was proposed in Ref. [7]. Instead of addressing the single particle, it deals with an ultracold gas of particles pulled to the center, in the form of a Bose-Einstein condensate (BEC). In particular, ultracold gases of polar molecules such as LiCs [8] and KRb [9] are available to the experiment, and it was demonstrated too that a fixed electric charge (ion) can be embedded in BEC and held at a fixed position by means of an optical trapping scheme [10].
The suppression of the quantum collapse in this setting is secured by repulsive collisional interactions between the particles. The analysis was performed in the framework of the mean-field (MF) approximation [11], using the Gross-Pitaevskii equation (GPE) including the same potential as in Eq. (1):
i ψ t = 1 2 2 + U 0 r 2 ψ + ψ 2 ψ .
In the framework of the MF approximation, the cubic term in Eq. (3) represents the self-repulsion in the gas. The coefficient in front of this term is set equal to 1 by means of normalization. Dipole-dipole interactions between the particles were also taken into account, applying another version of the MF approximation. It considered the interaction of a given dipole with the collective electric potential created by all other dipoles, and amounted to renormalization of coefficient U 0 .
For a mixture of two species of particles, a two-component extension of Eq. (3) was introduced in Ref. [12]. The respective system of nonlinearly coupled GPEs also provides the suppression of the quantum collapse and creation of the GS [12].
Solutions of Eq. (3) for stationary states with chemical potential μ < 0 , in the form of
ψ = e i μ t u x , y , z ,
with steady-state wave function u satisfying the equation
μ u = 1 2 2 + U 0 r 2 u + u 2 u .
These states are characterized by their norm,
N = u x , y , z 2 d x d y d z ,
and angular momentum,
M = i ψ * x , y , z r × ψ x , y , z d x d y d z ,
where * stands for the complex conjugate. N and M are dynamical invariants of GPE (3). It also conserves the Hamiltonian,
E = 1 2 ψ 2 U 0 r 2 ψ 2 + ψ 4 d x d y d z .
The linearized version of Eq. (3) produces exact, although unnormalizable (with diverging norm (6)), pairs of eigenmodes with μ = 0 and orbital and magnetic quantum numbers l , m [7],
u = u 0 r σ ± Y l m θ , φ , σ ± = 1 2 ± 1 4 U l ,
which are written in spherical coordinates r , θ , φ . Here u 0 is an arbitrary amplitude, Y l m are the spherical harmonics, and
U l U 0 l l + 1 .
Solution (9) implies that these eigenstates exists at U l < 1 / 4 , cf. Eq. (2), while the collapse occurs at U l > 1 / 4 .
The suppression of the collapse and recreation of the GS (with a normalizable wave function, unlike the unnormalizable one (9)) in the framework of the full nonlinear GPE (3) was demonstrated for the spherically isotropic state, corresponding to l = m = 0 in expression (9) (i.e., the s-wave orbital, in terms of atomic physics [1]). To this end, Eq. (5) is converted, by substitution
u r = r 1 v ( r )
with real function v ( r ) , into a radial equation
μ v = 1 2 d 2 d r 2 + U 0 r 2 v + v 3 r 2 .
An asymptotic solution to Eq. (12) at r 0 is
v ( r ) = U 0 / 2 + const · r s / 2 , s 1 + 1 + 8 U 0
(here, const is not determined by the asymptotic expansion). At r , the bound-state wave function with μ < 0 decays exponentially, v exp 2 μ r . A global approximation for the GS can be constructed as an interpolation, juxtaposing the asymptotic forms which are valid at r 0 and r :
ψ GS ( r , t ) interpol U 0 2 e i μ t r 1 e 2 μ r .
Singularity r 1 of wave function (14) at r 0 is acceptable, as the corresponding 3D norm integral (6) converges at r 0 . In particular, the approximate wave function (14) gives rise to the following relation between the chemical potential and norm,
μ GS 1 2 π U 0 N interpol 2 .
Actually, scaling μ 1 / N 2 , which is produced by Eq. (15), is an exact property of solutions to Eq. (5), irrespective of validity of the approximation. In the limit of μ 0 , Eq. (14) produces an exact solution of Eq. (3), ψ μ = 0 ( r ) = U 0 / 2 r 1 , with a divergent norm.
The numerical solution of Eq. (5) corroborates the conclusion following from Eqs. (13) – (15): GPE (3) does not give rise to the collapse at U 0 > 1 / 4 , and maintains the well-defined GS at all values of U 0 . For the setting with the elementary electric charge fixed at the center, and particles with the mass 100 proton masses and electric dipole moment 1 Debye, the radius of the newly predicted GS, which replaces the collapsing regime in the gas of 10 5 particles, is r GS 3 μ m [7]. Note that the MF approximation is relevant for states characterized by such a length scale. Furthermore, beyond the framework of the MF approximation, the many-body theory demonstrates that the predicted state persists as a meta-stable one, separated by a tall potential barrier from the collapsing state (the many-body analysis does not allow full suppression of the collapse) [13].
Relation (15) satisfies the anti-Vakhitov-Kolokolov criterion, d μ / d N > 0 , which is a necessary condition for stability of families of bound states supported by a self-repulsive nonlinearity [14] (the Vakhitov-Kolokolov criterion per se, d μ / d N < 0 , pertains to the case of the self-attraction [15,16]), Full stability of the GS created by Eq. (3) for all considered values of U 0 was corroborated by systematic simulations of the perturbed evolution of the bound states [7].
An obviously interesting extension of the analysis outlined above, which is the subject of the present work, is to develop it for bound states with reduced symmetry, which carry angular momentum. Previously, states with embedded vorticity, which is directly related to the angular momentum, were considered in a modified setting, with the polarization of dipole moments fixed by an external uniform electric field, directed along the z axis [17]. In that case, the spherically symmetric pulling potential in Eq. (3) is replaced by an axially symmetric one, U 0 / 2 r 2 cos θ . Critical values of U 0 above which the linear axially-symmetric model gives rise to the quantum collapse of states with magnetic quantum numbers (vorticities) m = 0 (i.e., GS), 1 and 2 are, respectively, U 0 cr ( m ) = 1.28 , 7.58 , and 19.06 . For comparison, Eqs. (2) and (33) yield the set of smaller critical values, viz. U 0 cr ( l ) = 0.25 , 2.25 , and 6.25 for l = 0 , 1, and 2, respectively. The nonlinear model with the axisymmetric potential also suppresses the collapse and creates stable bound states with vorticity m at U 0 > U 0 cr ( m ) .
Vortex states were also addressed in the 2D version of the setting, whose linear version gives rise to the collapse at all U 0 > 0 . In that case, the cubic self-repulsion in GPE is not sufficient to suppress the collapse [7]. A physically relevant alternative is provided by the quartic term, which is produced by the Lee-Huang-Yang effect, i.e., a correction to the MF theory induced by quantum fluctuations [18]. To this end, one may consider a binary BEC in which the MF self-repulsion in each component is (almost) precisely balanced by the inter-component attraction [19,20]. The resulting amended GPE predicts self-trapped states in the form of quantum droplets, which have been observed experimentally with quasi-2D [21,22] and full 3D [23,24] shapes in binary BECs with the contact interactions, as well as in dipolar BECs with long-range interactions between atomic magnetic dipole moments [25,26].
In the present context, the corresponding 2D GPE takes the form of Eq. (3), with term | ψ | 2 ψ replaced by | ψ | 3 ψ [27], leading to the solution for the wave function with the following asymptotic form at r 0 , which replaces the collapsing solution of the 2D linear equation:
ψ 1 2 U m + 4 9 1 / 3 e i μ t i m φ r 2 / 3 , U m U 0 m 2
(cf. expression (14) at r 0 and Eq. (10)), where r , φ are the 2D polar coordinates, and integer m is the vorticity. Note that the 2D norm of this wave function with the acceptable singularity  r 2 / 3 converges at r 0 . A nontrivial problem is stability of the 2D vortex bound states corresponding to the asymptotic form (16), which exist under the condition of U 0 > m 2 4 / 9 U 0 min . Surprisingly, this problem admits an exact solution: the vortex states with m 1 are stable provided that U 0 > ( 7 / 9 ) 3 m 2 1 U 0 stability , the GS with m = 0 being stable too [27]. Note that, for all m 1 , U 0 stability exceeds U 0 min , hence the 2D vortex states are unstable in the interval of m 2 4 / 9 < U 0 < ( 7 / 9 ) 3 m 2 1 . The dominant instability mode is one which leads to slow drift of the vortex’ pivot off the central point, along a spiral trajectory [27].
The objective of the present work is to construct 3D states, carrying angular momentum, as solutions of GPE (3 with nonzero orbital quantum number, l 1 , and the magnetic quantum number taking values 0 m l . Essential results for this problem can be obtained in an analytical form, as shown below in Section 2. In particular, an exact existence threshold is found for all nonlinear states with l 1 , viz.,
U 0 U 0 ( l ) thr = l ( l + 1 )
(it does not depend on m). Numerical results, which essentially corroborate the analytical predictions, are reported in Section 3, and the paper is concluded by Section 4. To the best of our knowledge, considerations of GPE-based models in similar 3D settings have not been reported before.

2. Analytical Considerations

2.1. The Framework for the Analysis of the Gross-Pitaevskii Equation

It is relevant to explicitly write the underlying 3D equation (3) in the spherical coordinates:
i ψ t = 1 2 2 r 2 + 2 r r + 1 r 2 2 θ 2 + cot θ · θ + U 0 + 1 sin 2 θ 2 φ 2 ψ + ψ 2 ψ .
Stationary solutions to Eq. (18), with chemical potential μ < 0 and vorticity which is represented by the magnetic quantum number m, are looked for as
ψ = exp i μ t + i m φ u ( m ) r , θ ,
cf. Eq. (4), with real function u ( m ) r , θ satisfying the stationary equation,
μ u ( m ) = 1 2 2 r 2 + 2 r r + 1 r 2 2 θ 2 + cot θ · θ + U 0 m 2 sin 2 θ u ( m ) + u ( m ) 3 .
To eliminate the singularity, 1 / r , of the solution, we perform substitution (11), i.e.,
u ( m ) r , θ r 1 V ( m ) r , θ ,
in Eq. (20), which leads to an equation for V ( m ) r , θ [cf. Eq. (12)],
2 μ r 2 V ( m ) = r 2 2 V ( m ) r 2 2 θ 2 + cot θ · θ + U 0 m 2 sin 2 θ V ( m ) + 2 V ( m ) 3 .
To analyze the form of eigenmodes in the limit of r 0 , one may define, straightforwardly,
V ( m ) r = 0 , θ v ( m ) ( θ ) ,
and directly set r = 0 in Eq. (22), which leads, without any approximation, to the angular ordinary differential equation:
d 2 v ( m ) d θ 2 + cot θ · d v ( m ) d θ + U 0 m 2 sin 2 θ v ( m ) = 2 v ( m ) 3 .
Equation (24) should be solved in the natural region of 0 θ π . In fact, Eq. (23) implies that relevant solutions to Eq. (24) provide the boundary condition for solutions to Eq. (22) at r 0 . The boundary condition at r amounts to the exponential decay of the wave function:
V ( m ) r , θ exp 2 μ r .
The artificial singularity of Eq. (24) at θ = 0 and π suggests a possibility of the existence of singular solutions with the asymptotic form
v sin g ( m ) ( θ ) v 0 ( m ) θ 1 , or v sin g ( m ) ( θ ) v 0 ( m ) ( π θ ) 1 .
The substitution of this ansatz in Eq. (24) yields
v 0 ( m ) 2 = 1 2 1 m 2 .
Obviously, it follows from Eq. (27) that the singular solution may exist only at m = 0 (in particular, for m = 0 and U 0 = 0 Eq. (24) has an exact singular solution, v ( 0 ) U 0 = 0 = 2 sin θ 1 ). Actually, the singular solution (26) is irrelevant, as the respective normalization integral includes a divergent factor, 0 π v sin g ( m = 0 ) ( θ ) 2 sin θ d θ = .

2.2. Identifying Vortex (Sectoral) States with Equal Magnetic and Orbital Quantum Numbers, m = l

Vortex-state solutions of Eq. (22) with m = l , also known as sectoral ones, are determined by Eq. (24) with boundary conditions at θ = 0 and π
v ( m ) θ m , v ( π θ ) m
(by definition, m does not take negative integer values). Equation (24) with these boundary conditions admits an exact solution, suggested by the form of spherical harmonic Y l l , in the form of
v ( m = l ) ( θ ) = v 0 ( m = l ) sin θ m ,
with an infinitesimal amplitude v 0 ( m ) , at the threshold value of the strength of the pulling potential,
U 0 ( m = l ) thr = m ( m + 1 ) l ( l + 1 ) ,
which is an example of the general threshold value (17). Above the threshold, i.e., at
U 0 > m ( m + 1 ) ,
amplitude v 0 ( m ) in Eq. (29) grows from infinitesimal to finite values. This fact has a simple explanation: because the orbital kinetic energy of the state with quantum numbers l = m is
E kin = m ( m + 1 ) / 2 r 2 ,
condition (31) implies that the energy of pulling to the center exceeds the kinetic (centrifugal) energy.
In the simplest case, m = l = 1 (the p-wave sectoral state, in terms of atomic physics), one can substitute expression (29),
v ( m = l = 1 ) ( θ ) = v 0 ( m = l = 1 ) sin θ ,
as an approximation, in the nonlinear term of Eq. (24), which yields
sin θ 3 = 1 4 3 sin θ sin ( 3 θ ) .
Neglecting, as usual, the third harmonic in Eq. (34) and keeping the term sin θ , for small values of the distance from the threshold, viz.,
U 0 U 0 ( m = l = 1 ) thr U 0 2 1 ,
the so approximated Eq. (24) predicts the squared amplitude of the approximate solution (29) as
v 0 ( m = l = 1 ) 2 2 3 U 0 2 .
Similarly, for the vortex (sectoral) state with m = l = 2 (the d-wave orbital, in terms of atomic physics), the exact solution (29) with an infinitesimal amplitude v 0 ( m = l = 2 ) ,
v ( m = l = 2 ) ( θ ) = v 0 ( m = l = 2 ) sin 2 θ ,
exists at U 0 = 6 , as given by Eq. (30) with l = 2 . To predict the amplitude of this state above the threshold, one can use the following approximation:
sin 6 θ 15 16 sin 2 θ 3 8 sin 2 ( 2 θ ) + 1 16 sin 2 ( 3 θ ) 15 16 sin 2 θ ,
where the second and third harmonics are omitted. The substitution of ansatz (37) and approximation (38) in the nonlinear term in Eq. (24) for m = 2 produces the squared amplitude of the solution,
v 0 ( m = l = 2 ) 2 8 15 U 0 6 ,
in the case of
U 0 U 0 ( m = l = 2 ) U 0 6 1 .

2.3. Identifying the States with m < l

For the case of l = 1 (the p state, in terms of atomic orbitals) and m = 0 , Eq. (24) produces a zonal mode, which is shaped as a dipole along the z direction. In the limit case of the infinitesimal amplitude, an exact solution of this type, suggested by the form of the Y 10 spherical harmonic,
v ( l = 1 , m = 0 ) ( θ ) = v 0 ( l = 1 , m = 0 ) cos θ ,
exists at the same threshold value, U 0 ( l = 1 , m = 0 ) = 2 , which is given by Eq. (30) for l = 1 . Above the threshold, viz., at small U 0 2 , the squared amplitude of the mode (41) is
v 0 ( l = 1 , m = 0 ) 2 2 3 U 0 2 .
It coincides with the one given Eq. (36) for l = m = 1 , which also represents the p-wave orbital.
Further, in the case of l = 2 (the d-wave state, in terms of atomic orbitals) and m = 1 , an appropriate ansatz for the respective dipole-vortex state (also known as a tesseral mode) is suggested by the form of spherical harmonic Y 21 :
v ( l = 2 , m = 1 ) ( θ ) = v 0 ( l = 2 , m = 1 ) sin 2 θ .
For l = 2 , the threshold value of the strength of the pull to the center is U 0 ( l = 2 , m = 0 ) = 6 , as given, once again, by Eq. (30) with l = 2 . Above the threshold, i.e., at 0 < U 0 6 1 (cf. Eq. (40)), the squared amplitude of solution (43) is predicted as
v 0 ( l = 2 , m = 1 ) 2 2 3 U 0 6 ,
cf. Eq. (39).
For the set of quantum numbers l = 2 and m = 0 , the “sandwich-shaped" ansatz (with structure + along the z axis, alias the zonal mode)), as suggested by the corresponding spherical harmonic Y 20 , is
v ( l = 2 , m = 0 ) ( θ ) = v 0 ( l = 2 , m = 0 ) 1 3 cos 2 θ .
This expression with an infinitesimal amplitude gives an exact solution of Eq. (24) at the same threshold, U 0 = 6 , which corresponds to l = 2 and m = 2 or m = 1 , see above. Finally, above the threshold, i.e., at 0 < U 0 6 1 , the approximation similar to that elaborated above predicts the squared amplitude of solution (45) as
v 0 ( l = 2 , m = 0 ) 2 4 11 U 0 6 ,
cf. Eqs. (39) and (44).
Similarly, for l > 2 , the sectoral, tesseral, and zonal states, with m = l , 0 < m < l , and m = 0 , respectively, exist at U 0 > l ( l + 1 ) . Above the existence threshold, amplitudes of these states scale as U 0 l ( l + 1 ) , cf. Eqs. (36), and (42) for l = 1 , and Eqs. (39), (44), and (46) for l = 2 .

2.4. The Global Approximation for the States with l 1

Similar to the interpolation approximation for the GS, represented by Eqs. (14) and (15), an approximation for the states carrying the angular momentum can be constructed by juxtaposing expressions (29), or (37), or (41), or (43), or (45) for r 0 , and Eq. (25) for r in Eqs. (19) and (21):
ψ interpol = exp i μ t + i m φ r 1 V l , m r , θ , V l , m r , θ v l , m ( θ ) exp 2 μ r
The family of the bound states is characterized by their norm, considered as a function of μ , cf. Eq. (15). In terms of the interpolation approximation (47), the norm is written as
N interpol = I ( l , m ) 2 μ , I ( l , m ) π 0 π v l , m ( θ ) 2 sin θ d θ .
As well as its GS counterpart (15), this relation satisfies the anti-Vakhitov-Kolokolov criterion, which is a necessary stability condition for these bound states.
Comparison of this approximation with numerical results demonstrates that it provides reasonable accuracy for the vortex (sectoral) states with m = l , while for the tesseral and zonal states, with m < l , a discrepancy with the numerical solutions is too large. For the sectoral states, the substitution of the angular wave function (29) in Eq. (48) yields the following result:
N interpol ( m = l ) ( μ ) = 2 π ( 2 m ) ! ! ( 2 m + 1 ) ! ! 2 μ v 0 ( m = l ) 2 .
In this expression, coefficients v 0 ( m = l ) 2 should be substituted as per Eqs. (36) and (39). Note that the scaling
N 1 / μ ,
featured by Eq. 49,is an exact property of solutions generated by Eq. (20), irrespective of the applicability of any approximation.

2.5. The Thomas-Fermi (TF) Approximation

In the case of a large strength of the pull-to-the-center potential, U 0 1 , the angular equation (24) admits the application of the Thomas-Fermi (TF) approximation, which neglects the derivatives in that equation, yielding
v TF ( m ) ( θ ) 2 = 1 2 U 0 m 2 sin 2 θ , at arcsin m U 0 < θ < π arcsin m U 0 , 0 , at 0 θ < arcsin m U 0 and π arcsin m U 0 < θ π .
The TF approximation is relevant in the case of U 0 > m 2 , when arcsin m / U 0 exists. As any TF approximation, expression (51) is continuous, featuring discontinuities of the first derivative, d v / d θ , at points θ = arcsin m / U 0 and θ = π arcsin m / U 0 . The largest squared value of the approximate solution (51) is
v TF ( m ) θ = π 2 2 = 1 2 U 0 m 2 .
For large U 0 , the TF approximation applies to the full equation (22) as well: neglecting both the radial and angular derivatives in it, one obtains
V TF ( m ) ( r , θ ) 2 = 1 2 U 0 m 2 sin 2 θ | μ | r 2 , at m 2 2 sin 2 θ + | μ | r 2 < U 0 2 , 0 , at m 2 2 sin 2 θ + | μ | r 2 > U 0 2 .
In this solution, it is taken into account that μ is negative for bound states. As well as the TF approximation (51), the result (53) is relevant for U 0 > m 2 .
Further, if the TF approximation is used at r 0 , in the form of Eq. (51), but not globally, the corresponding interpolation-type approximation, similar to Eq. (47), is
u interpom ( m ) r , θ TF = v TF ( m ) ( θ ) r exp 2 μ r .

3. Numerical Results

To produce stationary wave functions of the bound states in the numerical form, it is relevant, first, to substitute ansatz (19) into the underlying GPE (18), where u ( m ) is written as per Eq. (21), but with time-dependent V ( m ) r , θ , t . The substitution leads to a time-dependent version of Eq. (22), viz.,
2 i r 2 V ( m ) t = r 2 2 V ( m ) r 2 2 θ 2 + cot θ · θ + U 0 m 2 sin 2 θ V ( m ) + 2 V ( m ) 2 V ( m ) .
The use of the reduced wave function V ( m ) r , θ makes it possible to present the results free from the singular factor r 1 (see Eq. (19)).
Stationary solutions of Eq. (22) were found by means of the imaginary-time simulations [28] of Eq. (55), performed with the help of the split-step Fourier algorithm, using a set of 1024 × 128 spatial modes in the r , θ domain. The above-mention scaling invariance of Eq. (20) suggest that it is sufficient to generate the results for a fixed norm, which we set here to be N 1 , while the chemical potential μ is adjusted to keep this value of the norm, as per Eq. (50).

3.1. The Stationary Vortex (Sectoral) Modes with m = l

First, Figure 1 and Figure 2 display essential results for the vortex (sectoral) bound state with quantum numbers m = l = 1 , and compares them to the analytical predictions reported in the previous section. For the strength of the pulling potential U 0 = 2.5 , the chemical potential of the bound state corresponding to the fixed norm, N = 1 , which is presented in Figure 1, is μ = 1.64 . In this case, the r-dependence of the numerically found value of V ( m = l = 1 ) r , θ = π / 2 , which is the maximum of wave function V ( m = l = 1 ) r , θ for fixed r, is presented by the solid line in Figure 1(a). The dashed line in the same panel displays an exponential fit to the numerical result, viz.,
V ( m = l = 1 ) r , θ = π / 2 0.549 exp 2 μ r .
The respective interpolation approximation, produced by Eqs. (33), (36), and (47), is
V ( m = l = 1 ) r , θ = π / 2 2 3 U 0 2 exp 2 μ r 0.577 exp 2 μ r ,
being quite close to its numerically found counterpart. Further, the numerically obtained profile of v ( 1 , 1 ) ( θ ) V ( 1 , 1 ) r = 0 , θ for the same U 0 = 2.5 is displayed by the solid curve in Figure 1(b), while the dashed one shows the corresponding analytical approximation suggested by Eq. (33), with the same coefficient as used for the fitting curve in panel Figure 1(a) (see Eq. (56)), viz., v ( 1.1 ) ( θ ) 0.549 sin θ . It is seen that the fit profile is virtually identical to the numerical one. If the fit coefficient 0.549 , taken from Eq. (56), is replaced by its analytically predicted counterpart, ( 2 / 3 ) U 0 2 0.577 [see Eq. (57)], the agreement between the numerical findings and analytical predictions remains very accurate.
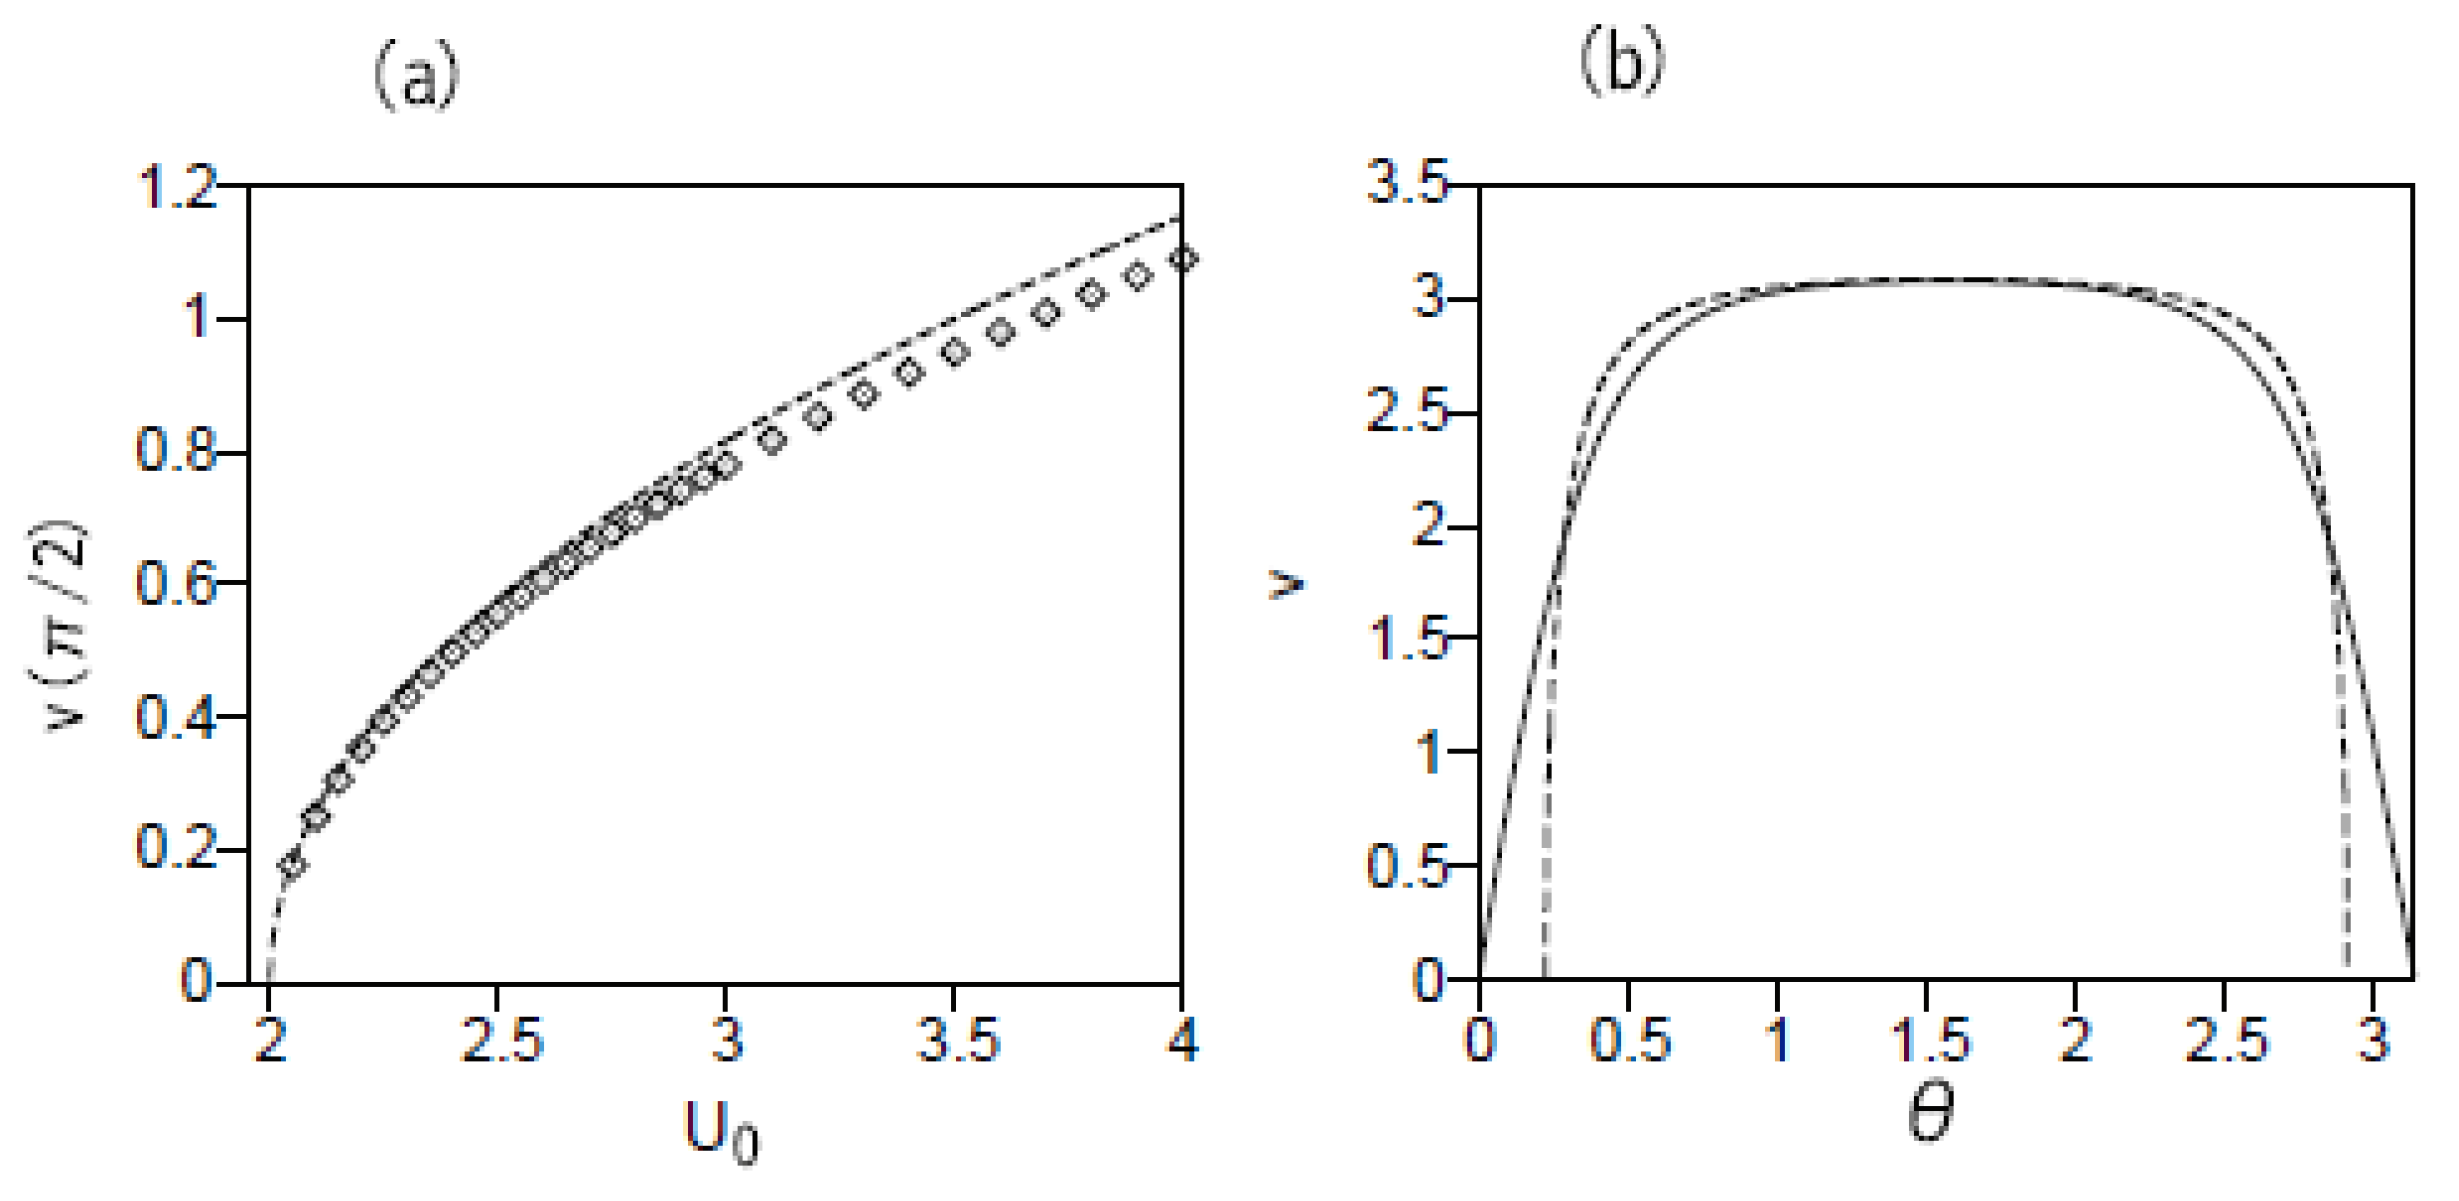
The family of the bound states with m = l = 1 is characterized in Figure 2(a) by the numerically found dependence of the largest value of their wave function, V ( 1 , 1 ) r = 0 , θ = π / 2 v ( m = l = 1 ) ( θ = π / 2 ) , on the potential strength U 0 , plotted along with the analytical prediction (36). Although the prediction was derived under the condition of 0 < U 0 2 1 , it is seen that, even for U 0 = 4 , the analytical result remains a highly accurate one.
The adequacy of the TF approximation for large values of the potential’s strength U 0 is corroborated by Figure 2(b), which displays a numerically generated profile of v ( 1 ) ( θ ) for U 0 = 20 , along with its TF-predicted counterpart, given by Eq. (51). It is observed that the approximation is reasonable. In particular, the largest value of the wave function, given by expression (52), is practically identical to its numerically obtained counterpart.
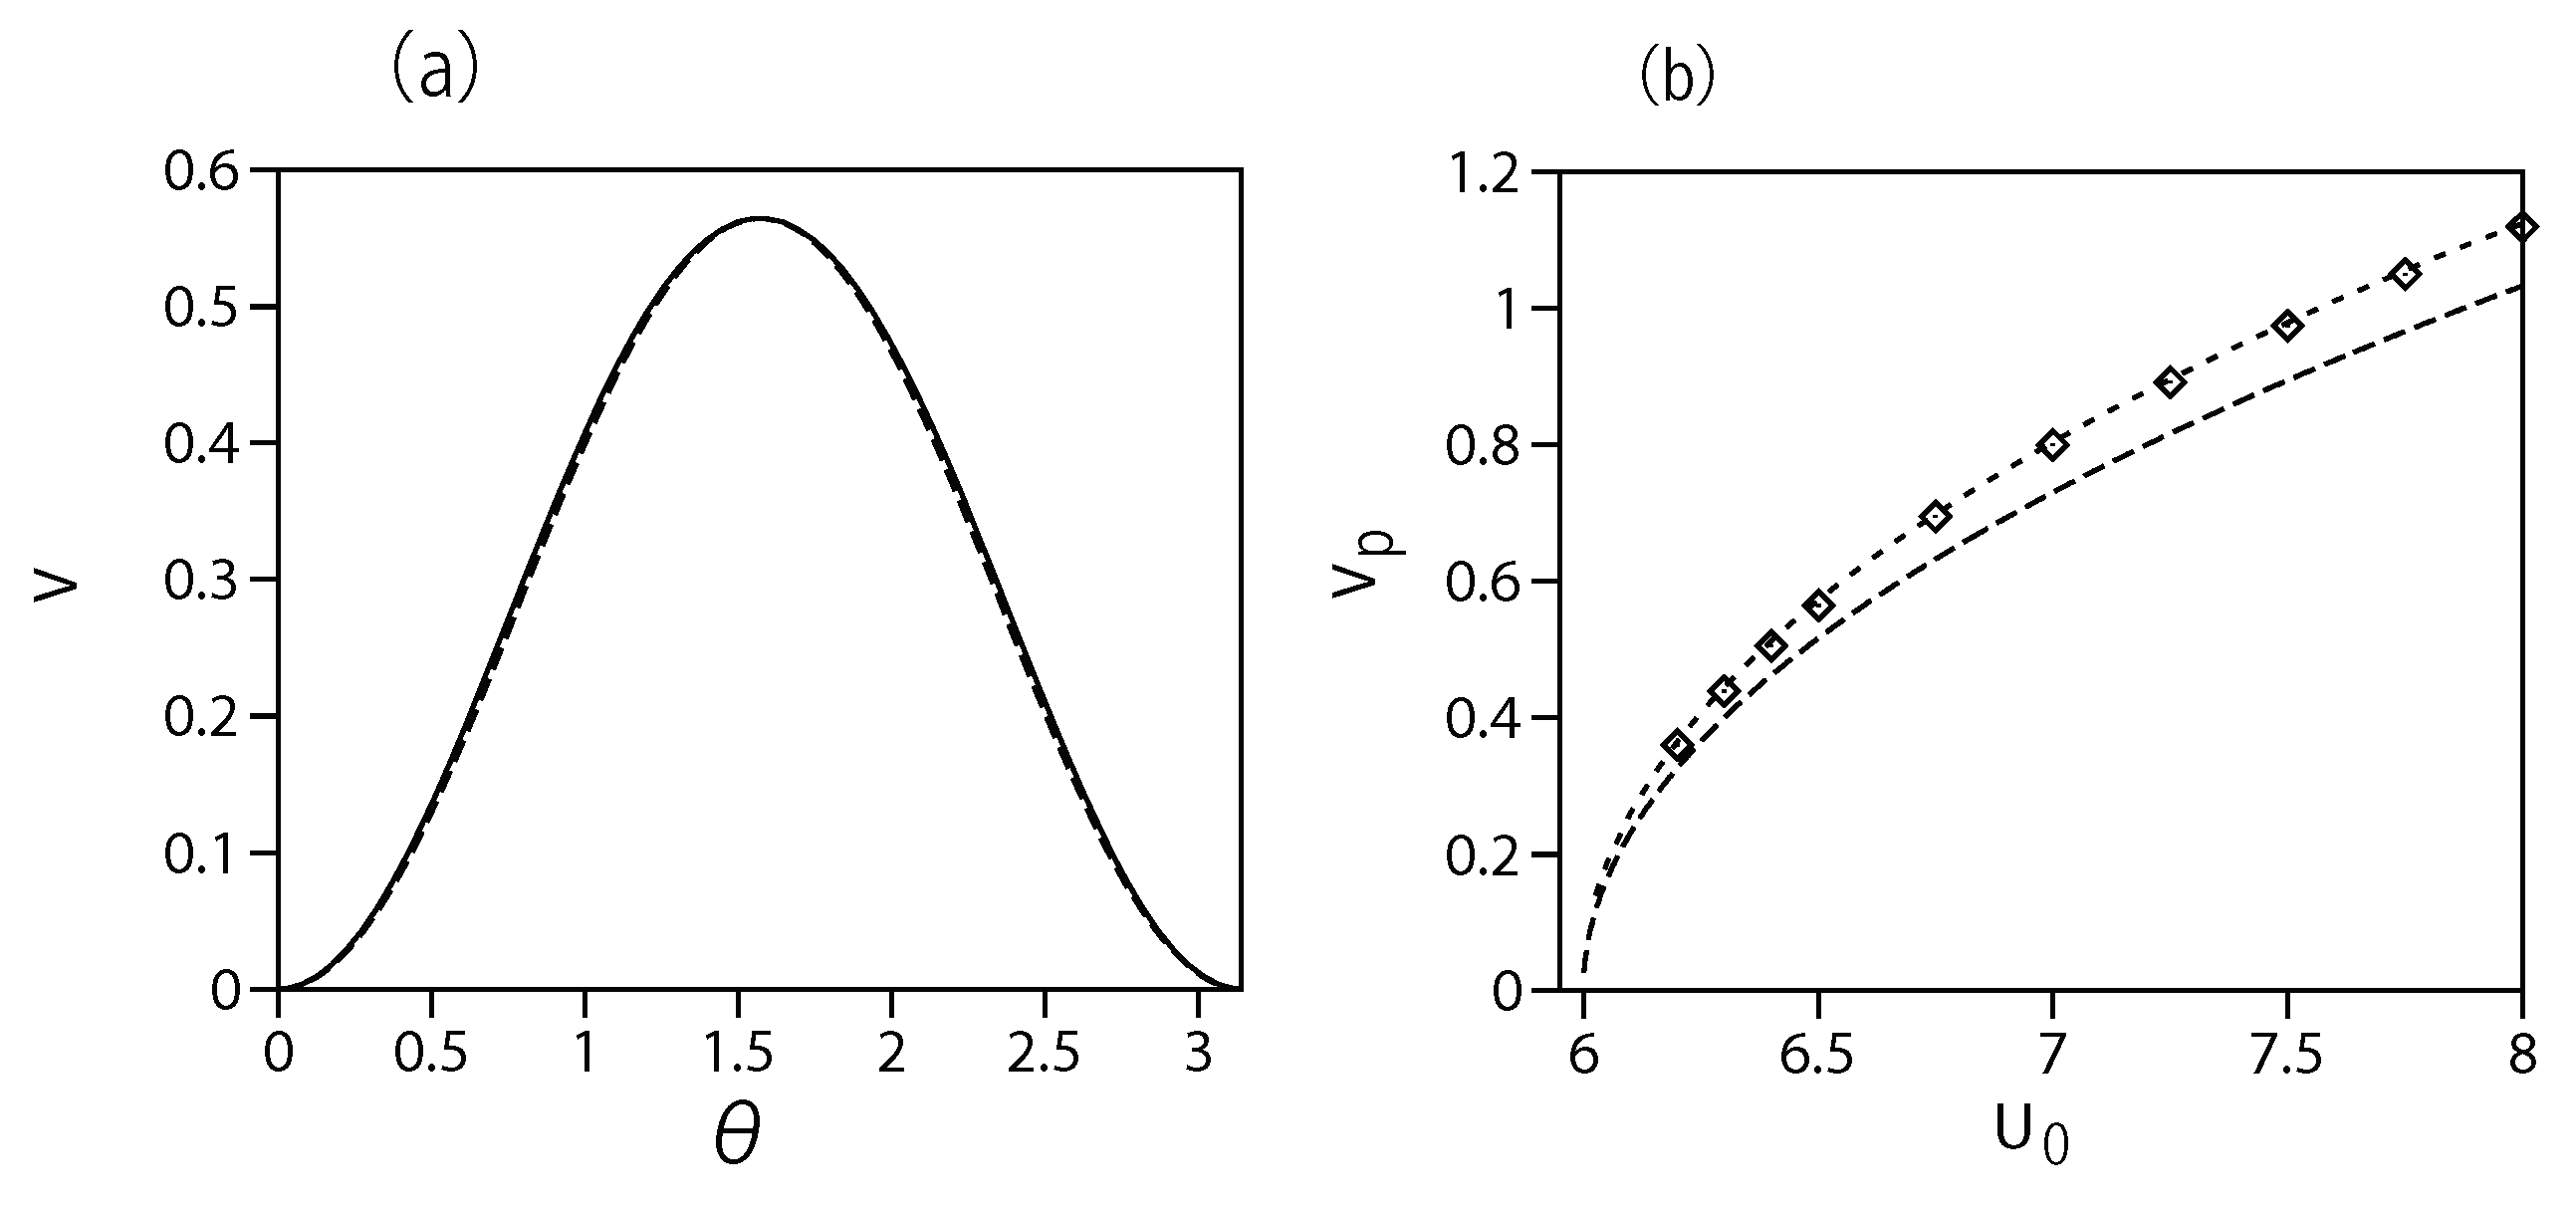
For the higher-order vortex (sectoral) mode with m = l = 2 , an example of the numerically found profile, V ( 2 , 2 ) r = 0 , θ v ( 2 , 2 ) ( θ ) , is displayed in Figure 3(a) for U 0 = 6.5 , along with the analytically predicted profile, 0.564 sin 2 θ (see Eq. (39)), with the coefficient produced by the fit procedure. The chemical potential of this state is μ = 1.44 . The analytical prediction is reproduced by the numerical solution practically exactly.
The family of the vortex modes with m = l = 2 is represented in Figure 3(b) by the dependence of V ( m = l = 2 ) r = 0 , θ = π / 2 v ( m = l = 2 ) ( θ = π / 2 ) on the potential’s strength U 0 , as found from the numerical solution and predicted by Eq. (39). In comparison with the similar dependences shown in Figure 2(a) for m = l = 1 , the discrepancy between the numerical and analytical results is somewhat larger, but the analytical approximation is still quite reasonable even for U 0 = 8 , when the formal applicability condition (40) does not hold.

3.2. The Bound States with m < l

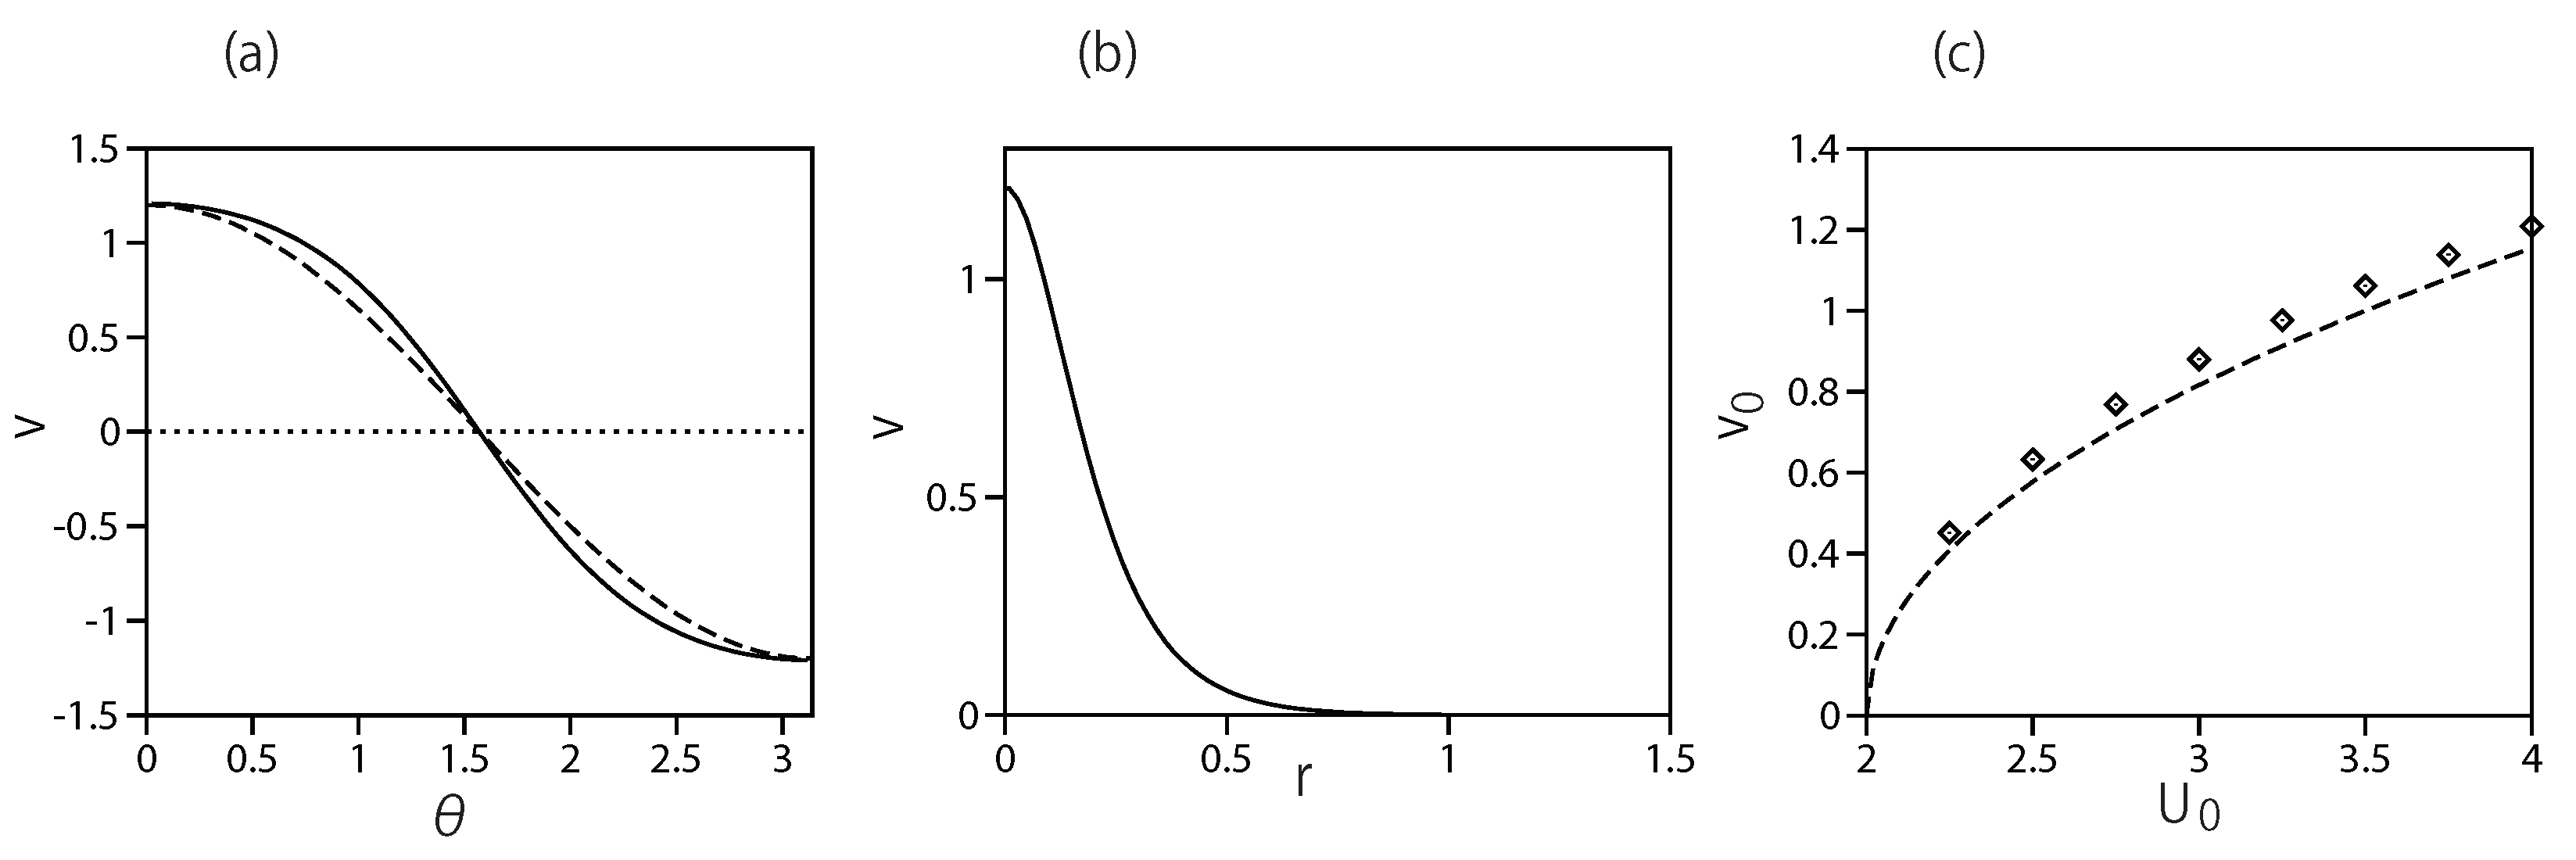
An example of the numerically found angular profile of the dipole (zonal) mode, with l = 1 , m = 0 and U 0 = 4 , is plotted by the solid curve in Fig. Figure 4(a). The dashed line is its analytically predicted counterpart (41), with the fit coefficient v 0 ( 1 , 0 ) = 1.209 , while the respective analytical expression (42) yields a close value, v 0 ( 1 , 0 ) 1.155 . The chemical potential of this bound state is μ = 36 . The radial dependence V ( r , θ = 0 ) is shown in Figure 4(b) (the solid line). The family of the dipole-shaped (zonal) states is characterized in Figure 4(c) by dependences of V ( l = 1 , m = 0 ) r = 0 , θ = π / 2 v l = 1 , m = 0 ) ( θ = π / 2 ) on strength U 0 of the pulling potential, as found from the numerical solution, and as predicted analytically by Eq. (39). It is seen from these figures that the accuracy of the analytical approximation is reasonable, even for values of U 0 2 which are not small.
Further, the solid and dashed curves in Figure 5(a) show, respectively, an example of the numerically obtained profile of the vortex-dipole (tesseral) mode, with l = 2 , m = 1 and U 0 = 8 , and its analytical counterpart, produced by Eq. (43) with the fit coefficient v 0 ( 2 , 1 ) = 1.13 (the chemical potential of this state is μ = 51 ). Note that Eq. (44) gives the analytical approximation for the latter coefficient as v 0 ( 2 , 1 ) = 1.155 , which is very close to the fit value which makes the numerical and analytical profiles virtually identical in Figure 5(a). Figure 5(b) shows the numerically found radial dependence V ( r , θ = π / 4 ) at U 0 = 8 . The family of the tesseral states is characterized in Figure 5(c) by dependences of V ( l = 2 , m = 1 ) r = 0 , θ = π / 2 v ( l = 2 , m = 1 ) ( θ = π / 2 ) on the potential’s strength U 0 , as given by numerical solution, and as predicted by Eq. (44). It is seen from these figures that the accuracy of the analytical approximation is reasonable, even for values of U 0 2 which are not small.
Finally, numerical results for the “sandwich-shaped" (zonal) state with l = 2 , m = 0 are presented in Figure 6. An example of the respective profile of v ( l = 2 , m = 0 ) ( θ ) is plotted in Figure 6(a) for U 0 = 8 and chemical potential μ = 30.97 , along with its analytically-predicted counterpart (45), with coefficient v 0 ( l = 2 , m = 0 ) = 0.852 , which is predicted by Eq. (46). Figure 6(b) shows the numerically found radial dependence V ( r , θ = π / 2 ) at U 0 = 8 . The family of the zonal states is characterized by the dependence of V ( l = 2 , m = 0 ) r = 0 , θ = π / 2 v ( l = 2 , m = 0 ) ( θ = π / 2 ) on the potential’s strength U 0 , which is plotted in Figure 6(c), along with the respective analytical prediction given by Eq. (46). In this case too, the accuracy of the analytical approximation is reasonable.

4. Conclusion

A solution for the problem of the quantum collapse in the gas of particles pulled to the center by the well-known potential, U ( r ) = U 0 / 2 r 2 , was reported in Ref. [7]. Repulsive collisions between the particles, represented by the cubic term in the respective GPE (Gross-Pitaevskii equation), suppress the collapse and create the otherwise missing spherically symmetric GS (ground state), alias the s-wave orbital, in terms of atomic physics. However, the previous analysis did not address bound states with reduced symmetry, which carry angular momentum. The present work reports results of the systematic analysis of such states, which are labeled, as usual, by the orbital and magnetic quantum numbers, l and m. These states exist when the strength of the potential exceeds a threshold value, U 0 > l ( l + 1 ) , which does not depend on m. At a relatively small distance from the threshold, the sectoral, tesseral, and zonal states, with m = l , 0 < m < l , and m = 0 , respectively, are found in the approximate analytical form for l = 1 and 2 (alias the p- and d-wave orbitals). In the general case, these states are found in the numerical form, which corroborates the accuracy of the analytical approximation.
As an extension of this work, it may also be interesting to analyze dynamical excitation of the states with angular momentum from the GS by pulses of an incident vortex field, and to consider Rabi oscillations between different bound states driven by an ac field. Also relevant is a possibility to consider the p- and d-wave orbitals in the framework of the many-body theory, instead of the mean-field approximation, following the lines of Ref. [13].

Author Contributions

H.S.: numerical and analytical calculations, production of figures, drafting the manuscript. B.A.M.: concept of the work, analytical calculations, drafting the paper.

Funding

The work of B.A.M. is supported, in part, by the Israel Science Foundation through Grant No. 1695/22.

Conflicts of Interest

The authors declare no conflicts of interests related to this paper.

References

  1. L. D. Landau and E. M.; Lifshitz, Quantum Mechanics: Nonrelativistic Theory (Nauka publishers, Moscow, 1974).
  2. M. I. Tribelsky, Exact solutions to fall of particle to singular potential: classical versus quantum cases.. Proc. R. Soc A. 2023; 479, 20230366. [CrossRef]
  3. K. S. Gupta and S. G. Rajeev, Renormalization in quantum mechanics, Phys. Rev. D 48, 5940-5945 (1993).
  4. H. E. Camblong, L. N. Epele, H. Fanchiotti, and C. A. García Canal, Renormalization of the inverse square potential, Phys. Rev. Lett. 85, 1590 (2000). [CrossRef]
  5. M. Olshanii, H. Perrin, and V. Lorent, Example of a quantum anomaly in the physics of ultracold gases, Phys. Rev. Lett. 105, 095302 (2010). [CrossRef]
  6. M. Ávila-Aoki, C. Cisneros, R. P. Martínez-y-Romero, H. N. Núñez-Yepez, and A. L. Salas-Brito, Classical and quantum motion in an inverse square potential, Phys. Lett. A 373, 418-421 (2009). [CrossRef]
  7. H. Sakaguchi, and B. A. Malomed, Suppression of the quantum-mechanical collapse by repulsive interactions in a quantum gas, Phys. Rev. A 83, 013607 (2000). [CrossRef]
  8. J. Deiglmayr, A. Grochola, M. Repp, K. Mörtlbauer, C. Glück, J. Lange, O. Dulieu, R. Wester, and M. Weidemüller, Formation of ultracold polar molecules in the rovibrational ground state, Phys. Rev. Lett. 101, 133004 (2008). [CrossRef]
  9. S. Ospelkaus, K.-K. Ni, G. Quéméner, B. Neyenhuis, D. Wang, M. H. G. de Miranda, J. L. Bohn, J. Ye, and D. S. Jin, Controlling the hyperfine state of rovibronic ground-state polar molecules, Phys. Rev. Lett. 104, 030402 (2010). [CrossRef]
  10. S. Schmid, A. Härter, J. H. Denschlag, Dynamics of a cold trapped ion in a Bose-Einstein condensate, Phys. Rev. Lett. 105, 133202 (2010). [CrossRef]
  11. L. Pitaevskii, and S. Stringari, Bose-Einstein Condensation (Clarendon, Oxford, UK, 2003).
  12. H. Sakaguchi and B. A. Malomed, Suppression of the quantum collapse in binary bosonic gases, Phys. Rev. A 88, 043638 (2013). [CrossRef]
  13. G. E. Astrakharchik and B. A. Malomed, Quantum versus mean-field collapse in a many-body system, Phys. Rev. A 92, 043632 (2015). [CrossRef]
  14. H. Sakaguchi and B. A. Malomed, Solitons in combined linear and nonlinear lattice potential, Phys. Rev. A 81, 013624 (2010). [CrossRef]
  15. M. Vakhitov and A. Kolokolov, Stationary solutions of the wave equation in a medium with nonlinearity saturation, Radiophys. Quantum Electron. 16, 783-789 (1973).
  16. L. Bergé, Wave collapse in physics: principles and applications to light and plasma waves, Phys. Rep. 303, 259-370 (1998). [CrossRef]
  17. H. Sakaguchi and B. A. Malomed, Suppression of the quantum collapse in an anisotropic gas of dipolar bosons, Phys. Rev. A 84, 033616 (2011). [CrossRef]
  18. T. D. Lee, K. Huang, and C. N. Yang, Eigenvalues and eigenfunctions of a Bose system of hard spheres and its low-temperature properties, Phys. Rev. 106, 1135-1145 (1957).
  19. D. S. Petrov, Quantum mechanical stabilization of a collapsing Bose-Bose mixture, Phys. Rev. Lett. 115, 155302 (2015).
  20. D. S. Petrov and G. E. Astrakharchik, Ultradilute low-dimensional liquids, Phys. Rev. Lett. 117, 100401 (2016). [CrossRef]
  21. C. R. Cabrera, L. Tanzi, J. Sanz, B. Naylor, P. Thomas, P. Cheiney, and L. Tarruell, Quantum liquid droplets in a mixture of Bose-Einstein condensates, Science 359, 301-304 (2018). [CrossRef]
  22. P. Cheiney, C. R. Cabrera, J. Sanz, B. Naylor, L. Tanzi, and L. Tarruell, Bright soliton to quantum droplet transition in a mixture of Bose-Einstein condensates, Phys. Rev. Lett. 120, 135301 (2018).
  23. G. Semeghini, G. Ferioli, L. Masi, C. Mazzinghi, L. Wolswijk, F. Minardi, M. Modugno, G. Modugno, M. Inguscio, and M. Fattori, Self-bound quantum droplets of atomic mixtures in free space?, Phys. Rev. Lett. 120, 235301 (2018). [CrossRef]
  24. C. D’Errico, A. Burchianti, M. Prevedelli, L. Salasnich, F. Ancilotto, M. Modugno, F. Minardi, and C. Fort, Observation of quantum droplets in a heteronuclear bosonic mixture, Phys. Rev. Res. 1, 033155 (2019).
  25. L. Chomaz, S. Baier, D. Petter, M. J. Mark, F. Wachtler, L. Santos, and F. Ferlaino, Quantum-fluctuation-driven crossover from a dilute Bose-Einstein condensate to a macrodroplet in a dipolar quantum fluid, Phys. Rev. X 6, 041039 (2016).
  26. M. Schmitt, M. Wenzel, F. Bottcher, I. Ferrier-Barbut, and T. Pfau, Self-bound droplets of a dilute magnetic quantum liquid, Nature 539, 259-262 (2016). [CrossRef]
  27. E. Shamriz, Z. Chen, and B. A. Malomed, Suppression of the quasi-two-dimensional quantum collapse in the attraction field by the Lee-Huang-Yang effect, Phys. Rev. A 101, 063628 (2020). [CrossRef]
  28. X. Antoine, W. Bao and C. Besse, Computational methods for the dynamics of the nonlinear Schrödinger/Gross–Pitaevskii equations, Computer Physics Communications 184, 2621–2633 (2013).
  29. M. Quiroga-Teixeiro and H. Michinel, Stable azimuthal stationary state in quintic nonlinear optical media, J. Opt. Soc. Am. B 14, 2004-2009 (1997). [CrossRef]
  30. R. L. Pego and H. A. Warchall, Spectrally stable encapsulated vortices for nonlinear Schrödinger equations, J. Nonlinear Sci. 12, 347-394 (2002).
  31. B. A. Malomed, (INVITED) Vortex solitons: Old results and new perspectives, Physica D 399, 108-137 (2019). [CrossRef]
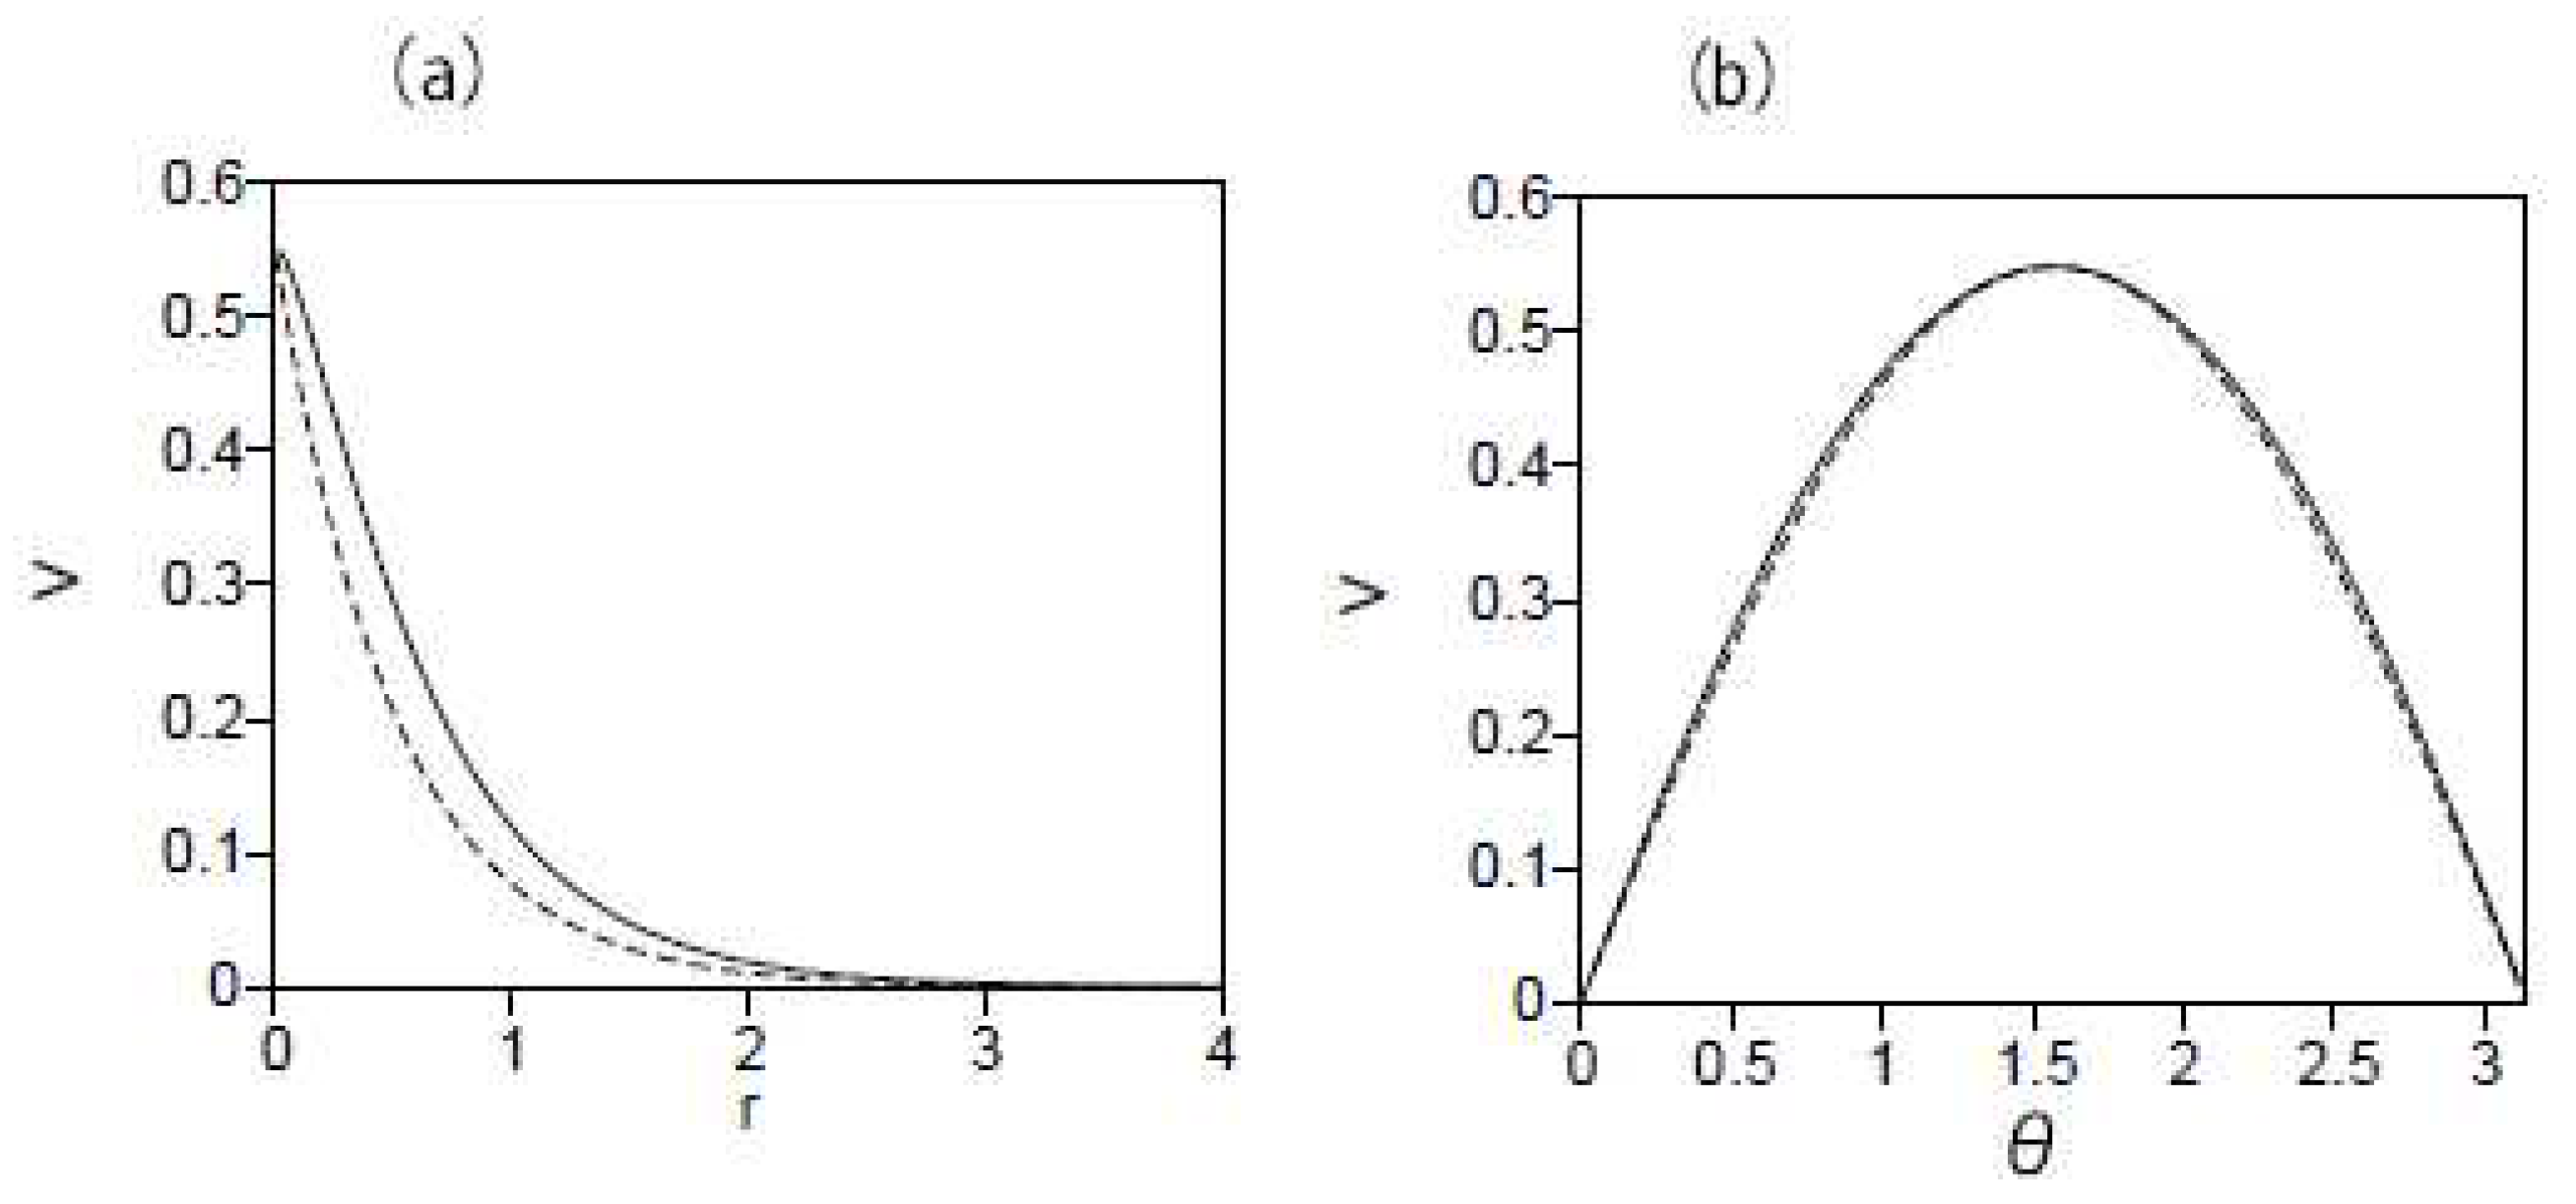
Figure 1. (a) The value of the wave function V ( m = l = 1 ) ( r ) (the one in which the singular factor r 1 is removed, see Eqs. (19) and (21)) at θ = π / 2 , as obtained from the numerical solution of Eq. (22) (the solid line), and as produced by the exponential fit to it, see Eq. (56) (the dashed line). (b) The solid line: the numerically produced profile of v ( 1 , 1 ) ( θ ) V ( 1 , 1 ) r = 0 , θ (see Eq. (23)), for U 0 = 2.5 . The chemical potential of this bound state is μ = 1.64 . The dashed line shows the analytical prediction for the same profile, produced by Eq. (33), with coefficient v 0 ( m = l = 1 ) replaced by the same fit value, 0.549 , as in panel (a) (see Eq. (56)).
Preprints 88299 g001
Figure 2. (a) The solid curve shows the maximum value of v ( 1 , 1 ) ( θ ) V 1 , 1 r = 0 , θ (see Eq. (23)), at θ = π / 2 , vs. strength U 0 of the pull-to-the-center potential. The dashed curve shows the analytical prediction for this dependence, as given by Eq. (36). (b) The solid curve shows the numerically produced profile of v ( 1 ) ( θ ) for Eq. (24) at U 0 = 20 , while the dashed one is its counterpart predicted by the TF approximation (51).
Preprints 88299 g002
Figure 3. (a) The solid line: the numerically found profile of the vortex (sectoral) state, v ( 2 , 2 ) ( θ ) V ( 2 , 2 ) r = 0 , θ (see Eq. (23)), for U 0 = 6.5 . The chemical potential of this bound state is μ = 1.44 . The analytical prediction for the same profile, as produced by Eq. (37), is shown by the dashed line. (b) The solid curve: the maximum value of v ( 2 , 2 ) ( θ ) V 2 , 2 r = 0 , θ (see Eq. (23)), at θ = π / 2 , vs. the potential’s strength U 0 . The dashed curve: the analytical prediction for the same dependence, as given by Eq. (39).
Preprints 88299 g003
Figure 4. (a) The solid line: the numerically found profile of the dipole-shaped (zonal) state with l = 1 , m = 0 , i.e.. v ( 1 , 0 ) ( θ ) V ( 1 , 0 ) r = 0 , θ (see Eq. (23)), for U 0 = 4 . The chemical potential of this bound state is μ = 36.0 . The analytical prediction for the same profile, as produced by Eq. (41), is shown by the dashed line. (b) The radial profile V ( r , θ = 0 ) (the solid line) produced by the numerical solution. (c) The solid curve: the maximum value of v ( 1 , 0 ) ( θ ) V ( l , 0 ) r = 0 , θ [see Eq. (23)], at θ = π / 2 , vs. the potential’s strength U 0 . The dashed curve: the analytical prediction for the same dependence, as given by Eq. (42).
Preprints 88299 g004
Figure 5. (a) The solid line: the numerically found profile of the dipole-vortex (tesseral) state with l = 2 , m = 1 , i.e.. v ( 2 , 1 ) ( θ ) V ( 2 , 1 ) r = 0 , θ (see Eq. (23)), for U 0 = 8 . The chemical potential of this bound state is μ = 51 . The analytical form of the same profile is given by Eq. (43), as shown by the dashed line. (b) The solid line is the numerically found radial profile V ( r , θ = π / 4 ) at U 0 = 8 . (c) The solid curve: the maximum value of v ( 2 , 1 ) ( θ ) V ( 2 , 1 ) r = 0 , θ = π / 2 (see Eq. (23)) vs. the potential’s strength U 0 . The dashed curve: the analytical prediction for the same dependence, as given by Eq. (44).
Preprints 88299 g005
Figure 6. (a) The solid line: the numerically found profile of the “sandwich-shaped" (zonal) state with l = 2 , m = 0 , i.e., v ( 2 , 1 ) ( θ ) V ( 2 , 1 ) r = 0 , θ (see Eq. (23)), for U 0 = 8 . The chemical potential of this bound state is μ = 30.97 . The analytical form of the same profile is predicted by Eq. (45), as shown by the dashed line. (b) The solid liine: the numerically found radial profile V ( r , θ = π / 2 ) at U 0 = 8 . (c) The solid curve: the maximum value of v ( 2 , 0 ) ( θ ) V ( 2 , 0 ) r = 0 , θ = π / 2 (see Eq. (23)) vs. the potential’s strength U 0 . The dashed curve: the analytical prediction for the same dependence, as given by Eq. (46).
Preprints 88299 g006
Disclaimer/Publisher’s Note: The statements, opinions and data contained in all publications are solely those of the individual author(s) and contributor(s) and not of MDPI and/or the editor(s). MDPI and/or the editor(s) disclaim responsibility for any injury to people or property resulting from any ideas, methods, instructions or products referred to in the content.
Copyright: This open access article is published under a Creative Commons CC BY 4.0 license, which permit the free download, distribution, and reuse, provided that the author and preprint are cited in any reuse.
Prerpints.org logo

Preprints.org is a free preprint server supported by MDPI in Basel, Switzerland.

Subscribe

© 2024 MDPI (Basel, Switzerland) unless otherwise stated