
Submitted:
20 October 2023
Posted:
23 October 2023
You are already at the latest version
Abstract
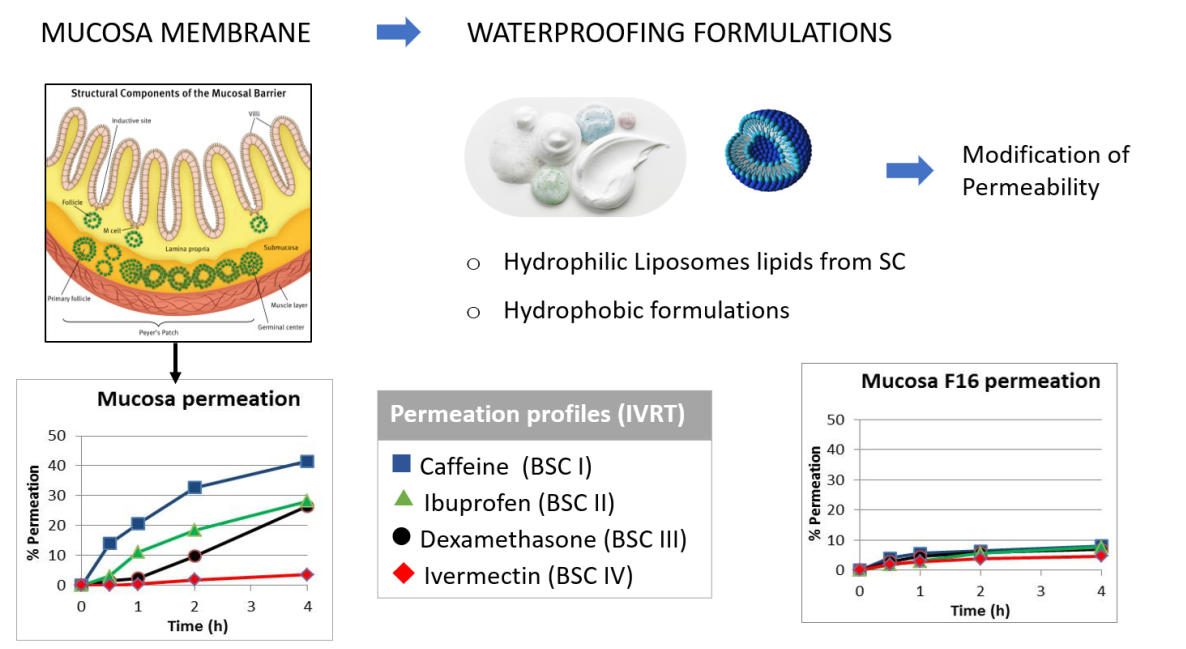
The permeability of the oral or nasal mucosa is higher than that of the skin. Mucosa permeability depends mainly on the thickness and keratinization degree of the tissues. Their permeability barrier is conditioned by the presence of certain lipids. This work has the main aim of reinforcing the barrier effect of oral mucosa with a series of formulations. Sixty-three initial formulations were evaluated for transmembrane water loss, with 16 formulations selected to test on sublingual mucosa. In vitro release tests of caffeine, ibuprofen, dexamethasone and ivermectin were carried out on porcine skin, mucosa and modified mucosa in order to compare the effectiveness of the formulations. A similar permeation profile was obtained in the different membranes: caffeine > ibuprofen ~ dexamethasone > ivermectin. The most efficient formulation was a liposomal formulation composed of lipids that are present in the skin stratum corneum. Impermeability provided by this formulation was really notable mainly for the low molecular weight compounds, decreasing their permeability coefficient between 40-80%. The reinforcement of the barrier function of mucosa provides a reduction or prevention of the permeation of different actives such as viruses, contaminants, toxins, etc.
Keywords:
Mucosa
; protection
; permeability
; kinetic permeation
1. Introduction
The oral mucosa is composed of three layers: the surface layer of oral epithelium, the connective tissue of lamina propria and the deepest layer of submucosa. The oral epithelium is a squamous stratified layer that covers the entire surface of the oral mucosa. This layer is a highly organized with a maturation pattern similar to that of the skin, with thickness and degree of keratinization changes depending on the location in the oral cavity. This layer acts as a semipermeable tissue that prevents loss of material from the underlying layer. The oral epithelium acts as a protective barrier against endogenous and exogenous aggression and prevents the permeation of bacterial flora of the oral cavity.
Permeation across the oral epithelium is mainly by passive diffusion. It is well known that the permeation of actives through the nasal or oral mucosa is greater than that through the keratinized, stratum corneum (SC) tissue of the skin [1]. This main difference in the penetration is due to the different lipid compositions as well as their packing structures. It has been shown that the principal factor of skin barrier function is the lipid content in the stratum corneum. The quantity of corneocyte layers or the epidermal thickness is not expected to play a significant role in the skin function barrier [2,3]. The major lipids present in the skin stratum corneum are ceramides, fatty acids, and cholesterol (Chol) which condition the permeability barrier [4,5]. As stated before, ceramides are one of the main lipids of the skin and play a crucial role in its barrier function [19,20]. In particular, decreased ceramide content can be observed in skin dermatoses [21,22]. Ceramides alone are not able to form liposomal structures [23,24]. However, together with other lipids within the SC lipid matrix such as, fatty acids, cholesterol and cholesterol sulfate, they form the stable lipid bilayer intercellular lipid matrix [25].
Currently, semisynthetic ceramides, particularly ceramide 3 (a shorter analogue of natural ceramide NP) and ceramide 6 (a shorter analogue of natural ceramide AP), are often used in skin care products [26] due to their relatively uncomplicated synthesis and therefore affordability. Ceramide treatment is most effective when the lipids are administered in a form similar to the lipid bilayers of the SC lipid matrix [23,27,28]. One or more such bilayers can be formed in liposomes that possess a hollow spherical vesicular structure well suited to the skin repair process. Because the actual SC lipid matrix is based on a mixture of ceramides, fatty acids and Chol in a near-equimolar ratio [29,30,31], this ratio was kept in our formulations [32]. Formulations were prepared with Cer3 and the stratum corneum lipids as well as with Cer 3 and Cer 6 and the stratum corneum lipids both at two concentrations of 1% and 10%.
The diffusion resistance of the oral/nasal mucosa is primarily associated with the intercellular lipids of the outer layers of the tissue. Then, the permeability of the oral epithelium is conditioned by the intercellular material. The lipid components of keratinized oral epithelia are similar to those of the epidermis. The major components are neutral lipids formed mainly of ceramides and acyl-ceramides derived from the lamellae of the membrane-coating granules. The epithelium of nonkeratinized oral regions does not contain acylceramides or acylglycosylceramides and small amounts of ceramide but contains relatively high amounts of glycosylceramide. Ceramides are present only in small amounts in nonkeratinized epithelia and there is no mechanism to convert glycosylceramide to ceramide, as occurs in keratinized epithelium. Other physiological characteristics that distinguish mucosal tissues from skin, such as an extensive vasculature, their moist surface and the presence of mucus, should also be taken into account. The surface of mucosal membrane is covered with mucus, which contains large glycoproteins (mucins) and is negatively charged. Mucus and saliva have a relevant role in the permeation process and they are contributing factors in the barrier layer of mucosal tissues [6,7,8].
Much work has been done on increasing the permeability of mucous membranes to favour the penetration of drugs, however, there is little work aimed at their partial impermeability. Thus, the main objective of the present study is to obtain a formulation that can reinforce the mucosa, increase its barrier effect, and decrease its permeability to reduce or prevent the penetration of different active ingredients such as viruses, contaminants, toxins, etc.
2. Materials and Methods
Materials
Two types of membranes were used: porcine sublingual mucosa as a biological membrane and Whatman® Nuclepore™ as an artificial membrane, made of polycarbonate and with a pore size of 0.05 µm (Cytiva, Buckinghamshire, UK). This artificial membrane has been shown to have a similar permeability to human mucous membranes, and porcine sublingual mucosa [9]. The pig tongues were supplied by the Facultat de Farmàcia i Ciències de l’alimentació of the Universitat de Barcelona from the Hospital de Bellvitge campus with the protocols of the ethics committee and the supervision of said stable. Dermatomed oral mucosa was obtained with a thickness of 500 µm (Dermatome GA630, Aesculap, Germany). Therefore, portions of the sublingual oral mucosa were prepared in such a way as to fit the Franz diffusion cells. In addition, to determine the specific thickness, each mucosal portion was measured with a digital micrometer (MAHR, Göttingen, Germany). Porcine skin membrane was supplied by the Department of Cardiology of the Hospital Clínic of Barcelona. Skin from the unboiled back of a Landrace large white pig was dermatomed at 500 ± 50 µm (Dermatome GA630, Aesculap, Germany). Animal handling was approved by the Institutional Review Board and Ethics Committee of Institut d’Investigacions Biomèdiques August Pi i Sunyer (IDIBAPS), and the management of the animals conformed to the Guide for the Care and Use of Laboratory Animals.
Caffeine (CAF), ibuprofen (IBU), dexamethasone (DEX) and ivermectin (IVE) were purchased from Sigma (Sigma─Aldrich, St Louis, MO, USA). The absorption kinetics of four solutions of these active substances at 1% in MeOH (Merck, Darmstadt, Germany) were tested. The physicochemical properties and Biopharmaceutic Classification System (BSC) classification of the 4 drugs are detailed in Table 1.
Waterproofing formulations
The tested formulations fall into three categories: hydrophobic, hydrophilic and liposomal formulations. Ingredients for the formulations were supplied by Sigma (Sigma─Aldrich, St Louis, MO, USA), except for the cases provided under below. Water preservation was performed with methylparaben (0.18%), propylparaben (0.02%) and propylene glycol (0.85%). All compounds were purchased from Sigma Aldrich (St Louis, MO, USA).
Formulation descriptions are detailed in the following tables: Table 2 for hydrophobic formulations, Table 3 for hydrophilic formulations and Table 4 for liposomal formulations.
Water permeability test
A water permeability test was carried out in order to determine the barrier function of membranes: artificial (Whatman® Nuclepore™) and biological (porcine sublingual mucosa) membranes. The water permeability parameter was obtained as the transmucosal/transmembranal water loss (TMWL) using a Tewameter TM 300 (Courage-Khazaka, Cologne, Germany).
Transmucosal/transmembranal water loss (TMWL) was measured on the membranes placed in vertical static Franz diffusion cells (3 mL, 1.86 cm2, Lara-Spiral, Couternon, France). Franz cells consist of two chambers (donor and receptor chambers) separated by the tested membrane (skin, mucosa or artificial membrane). The receptor chamber was completely filled with receptor fluid, ensuring that is was free of bubbles of air. The receptor fluid was a phosphate saline buffer (pH 7.6) (Sigma─Aldrich, St Louis, MO, USA) and ethanol (Merck, Darmstadt, Germany) mixed at 1:1 (PBS:EtOH, 1:1). The cells were acclimatized in a thermostatic bath (Julabo, Seelbach, Germany) by continuous stirring of the receptor fluid. After one hour of stabilization, the temperature on the membrane was controlled (32 ± 1 °C) and a first measure of TMWL was made for each membrane. Afterwards, a volume of 70 µL of formulation was applied on the membranes in triplicate and a second measure of TWML was determined at 1 h of this deposition. Additionally, one cell of each type of membrane without any application was used as a control.
In vitro release assay
The in vitro release test was conducted with artificial membrane (Whatman® Nuclepore™) and porcine sublingual mucosa as well as pig skin membrane as a reference. Biological membranes (mucosa and skin) were dermatomed at 500 ± 50 µm of thickness. Membranes were placed in vertical Franz diffusion cells and conditioned in a thermostatic bath at 43 °C to assure a membrane surface temperature of 32 ± 1 °C as in the previous TMWL study. The receptor solution used was the same PBS:EtOH (1:1) as before. Data on the TWML, temperature and humidity of the membrane were obtained before initiating the test with the Tewameter TM300 (Courage-Khazaka, Cologne, Germany).
On the modified mucosas, a volume of 70 µL of each formulation was applied and after one hour an infinite dose (300 µL) of tested solution was applied. The tested solution was prepared with caffeine (CAF), ibuprofen (IBU), dexamethasone (DEX) and ivermectin (IVE) at 1% in methanol (Merck, Darmstadt, Germany). Receptor fluid was collected at different times (30 min, 1 h, 2 h, 4 h) and the same volume was immediately replaced with fresh fluid. The aliquots were appropriately diluted and filtered (0.45 µm, Cameo, Sigma─Aldrich, St Louis, USA) before their analysis with HPLC/DAD.
The release of the active substances was determined with the cumulative amount released (Qn, μg/cm2), which represents the cumulative amount of the active substances quantified in the receptor fluid per area of the sample [12]. The equation is as follows (1).
where Qn is the cumulative amount of active substance released at time n (μg/cm2); Cn is the concentration of active substance in the collected sample (μg/mL); Vc is the volume of the Franz diffusion cell (3 mL); is the sum of the active substance concentrations (µg/mL) determined in sampling intervals 1 to n − 1; Vs is the volume of the collected sample and A is the surface area of the applied membrane (1.86 cm2).
The best absorption model to describe the release of active substances was obtained from the graphic representation of data release (values/time), as described by Mallandrich et al [13]. All data collected were processed over time to obtain the best fit equation for each membrane using the nonlinear regression software STATGRAPHICS® plus 5 (Statgraphics Technologies, Inc. Virginia, USA). Selection of the best equation was made in accordance with the highest correlation coefficient corrected for the number of degrees of freedom (R2). Following that analysis, the parameters of the flow (J, µg/mL/h), the permeability coefficient (Kp, cm/h), the delay time (Tl, h), the maximum concentration (Cmax, µg/mL), the maximum time (tmax, h) and the area under the curve (AUC) were calculated for each membrane.
HPLC/DAD analytical measurements
The collected samples were analysed by reverse-phase HPLC, using the Agilent 1620 Infinity II LC System (Waldbronn, Germany) equipped with a quaternary pump (G7111B), autoinjector (G7167A), multicolumn thermostat (G7116A), and WR diode-array detector (G7115A). The software was OpenLab. A LiChrocart250-4/LiChrosorb RP-18 (5 µm) column (Merck, Darmstadt, Germany) was used to quantify the active substances, at 25 °C with an injection volume of 40 µL. The elution conditions were methanol/water (Merck, Darmstadt, Germany) at a gradient from 60:40 to 90:10 in 15 min, constant at 90:10 for 15 min and the last 60:40 in 10 min with a flow of 1 ml/min. Detection for caffeine (CAF) was 280 nm, for ibuprofen (IBU) was 221 nm and for dexamethasone (DEX) and ivermectin (IVE) was 240 nm. Methanol (Merck, Darmstadt, Germany) was used as an extraction solvent for all active substances. All analytical procedures were validated following the guidelines developed by the International Conference on Harmonization (ICH) [14]. The calibration curve, limit of quantification (LoQ), and limit of detection (LoD) were obtained and are detailed in Table 5.
Statistical Analysis
Statistical treatment was performed using STATGRAPHICS plus 5 nonlinear regression software (Statgraphics Technologies, Inc., Virginia, USA). The nonparametric Krukall-Wallis test was used due to the abnormal distribution of the data. The permeation parameters of the active substances obtained for each membrane were compared with of porcine skin. A probability level of 0.05 (p) was considered statistically significant. All results are expressed as the mean ± standard deviation (SD).
3. Results
3.1. Water permeability test (TMWL)
Screening of 63 formulations was carried out to evaluate the TMWL on the synthetic membrane Nuclepore. The formulations that were found to be more impermeable to this membrane were also evaluated with sublingual mucosa. In the Table 6, the results of the water permeability of the artificial membrane and the mucous membrane are indicated.
As seen in the TMWL results, the permeability of the sublingual mucosa (control) was high (72 g/m·h2), similar to that of the synthetic membrane (control) (80 g/h·m2). Both values are significantly higher than the water permeability of healthy skin, which is usually between 5 and 10 g/h·m2 [15]. All formulations increase the barrier function of the membrane. Hydrophobic formulations are those that promote a decrease in permeability to a greater degree, followed by liposomal and hydrophilic formulations.
3.2. In vitro drug release test
An in vitro release test was carried out with vertical diffusion cells with dermatomed porcine skin and sublingual mucosa. The parameters of TMWL, humidity and surface temperature were evaluated for both the membrane, skin and mucosa, before starting the test. A volume of 70 µL of the optimal formulation (Formulations 3, 6 and 16, according Table 6) was deposited on the sublingual mucosa. After 1 h, the TMWL was remeasured (Table 7), and the values corroborated those obtained previously.
To evaluate the barrier effect of the formulation, the permeation of the four drugs was determined. The selection of active substances was based on their different physico-chemical properties following the Biopharmaceutic Classification System (BSC). There are four BCS classes depending on the solubility and permeability of the active ingredient properties [16]:
BCS1: high solubility(hydrophilic)-high permeability, caffeine was selected
BSC2: low solubility (hydrophobic)-high permeability, ibuprofen was selected
BSC3: high solubility (hydrophilic)-low permeability, dexamethasone was selected
BSC4: low solubility (hydrophobic)-low permeability, ivermectin was selected
Permeation assays were performed in triplicate for the 4 active substances (CAF, IBU, DEX and IVE) on porcine skin, sublingual mucosa and modified sublingual mucosa with F3, F6 and F16. The release of the active pharmaceutical ingredient was determined by the cumulative amount (Qn, μg/cm2), which corresponded to the total amount of API quantified in the receptor liquid per unit of applied area at the different sampling times. From these values, the rest of the kinetic parameters (such as Flux, J, and C max) were determined as detailed in the experimental section. The percentage and cumulative amount of drug released over time were measured for each of the four active ingredients, obtaining the permeation properties of each ingredient. The results are shown in Figure 1 (exposed to active substances) and expressed in Table 8.
Note the high permeability for caffeine, an intermediate permeability for ibuprofen and dexamethasone, and the extremely low permeability for ivermectin. It can also be noted that while hydrophilic formulation 6 presents permeability values equal to or greater than those of the mucosa, hydrophobic formulation 3 and especially the liposomal formulation 16 decrease permeability, providing a barrier effect similar in some cases to that of the skin.
In Figure 2, the results from the release assay of the 4 drugs are plotted by type of membrane: skin, unmodified mucosa and mucosa modified with formulations F3 and F16. The similar profile of the 4 compounds in skin and mucosa modified with the liposomal formulation F16 is remarkable.
4. Discussion
4.1. Water permeability test (TMWL)
Biological membranes, animal or human, are the gold standard for research on the barrier function of tissue (oral or nasal mucosa). However, due to the high cost and practical difficulties in obtaining these biological membranes as well as preservation, makes necessary to replace them with synthetic membranes with similar properties to those of biological membranes. Moreover, the use of these synthetic membranes would eliminate the previous limitations and will obviate the intra- and intervariability.
This work provides a comparative study between the biological membrane of the sublingual mucosa and an artificial membrane evaluating the barrier function of the membrane. The most widely used test for measuring the integrity of barrier function is the transepidermal water loss [17]. To reinforce the barrier function of both membranes, a first series of 63 formulations was prepared and applied on artificial membranes as well as on sublingual mucosa. The transepidermal water loss (TEWL) or transmembrane water loss (TMWL) was evaluated and those formulations with more favourable barrier protection were selected (Table 6).
Hydrophobic formulations showed a superior barrier effect decreasing the water permeability (TMWL) in both membranes (artificial and biological membranes) after one hour of application. Among them lipophilic formulations number 3 (F3, Lipophilic Base MI) and number 4 (F4, Lipophilic Base TGC) stand out, in which the value of TWML decreases by more than 90% [10].
Although the application of hydrophilic formulations was easier and more pleasant than the preceding formulations, water permeability did not decrease in the same order. Formulations number 6 (F6, SCMC gel 4%) and number 9 (F9, PLX-CBP gel) decreased the permeability between 21 and 24%.
Liposomal formulations have been chosen because their constituents have the ability to structure lipids in aqueous environments. Moreover, formulations F13 to F16 have lipids such as cholesterol, palmitic acid and ceramides, which are present in the skin and contribute to the protective barrier effect on the skin. The following liposomal formulations can be underlined: formulations 15 (F15) and 16 (F16) with two ceramides, which reduce the water permeability by approximately 40% increasing the barrier effect in both membranes [11].
4.2. In vitro drug release test
To evaluate the changes in permeation through the protected and unprotected membranes to the diffusion of active ingredients, four drugs were tested. In addition, the permeation of the same active substances in porcine skin was studied. As mentioned in the introduction, the barrier structure of mucosa differs greatly from that of the skin. With this in mind, the different formulations were applied to mucous membranes to mimic the skin stratum corneum and contribute with a barrier effect similar to that of the skin. To evaluate the effect of this barrier modification, the permeation of four drugs was determined. The drugs were caffeine (CAF), ibuprofen (IBU), dexamethasone (DEX) and ivermectin (IVE) dissolved in methanol at 1% for each substance active (Table 1). The criteria considered in choosing these drugs were the different physicochemical characteristics of solubility and permeability which are directly related to drug absorption and release. Each active ingredient belongs to a different Biopharmaceutical Classification system (SCB) group [16]. There are four BCS classes depending on the solubility and permeability of the active ingredient properties. These two properties are crucial in the drug permeation through keratin tissues such as skin or mucous membranes.
Permeation tests were carried out with sublingual mucosa and porcine skin. Once they were conditioned and the TEWL parameter determined, the formulations F3, F6 and F16 were applied and their barrier effect was evaluated (Table 7). Formulation F3 was one that decreased water permeability to a greater degree as previously observed in Table 6, followed by the liposomal formulation F16 and to a lesser degree, the hydrophilic formulation F6. The next step was the application of an infinite dose of the drug solution to determine their release parameters. The cumulative percentage of each drug over time was determined (Figure 1). The kinetic parameters of area under the curve (AUC), flux (J), coefficient of permeability (Kp), and maximum concentration (Cmax) were calculated for the 4 active substances (caffeine, ibuprofen, dexamethasone and ivermectin) (Table 8). The comparison of these parameters for caffeine shows, as expected, an area under the curve, a flux and a permeability through the unmodified mucosa approximately 4 times higher than through the skin. Application of the waterproofing formulations indicates that although F6 did not promote mucosal impermeability, both F3 and F16 inferred mucosal impermeability very similar to that of skin. Thus, for a low molecular weight hydrophilic compound indicating high permeability such as caffeine, it exhibited skin-like impermeability when F3 and F16 formulations were applied to mucosa, with F16 giving even more impermeable values than skin.
Ibuprofen presented an even more pronounced difference in the area under the curve, flow and permeability, 14 times higher through the unmodified mucosa compared to the skin. The application of the waterproofing formulations indicates, in this case, that neither F3 nor F6 promoted mucosal impermeability. However, it is worth noting that F16 inferred mucosal impermeability very similar to that of skin. Therefore, for a low molecular weight hydrophobic compound with high permeability such as ibuprofen, it exhibits skin-like impermeability when the F16 formulation is applied to the mucosa.
For dexamethasone, it is noteworthy to highlight the pronounced difference in the area under the curve, flow and permeability between the unmodified mucosa and the skin (50 times higher). No significant changes were observed in the mucosal impermeability when the waterproofing formulations of F3 and F6 were applied. However, it must be noted that the effectiveness of F16 which modified the impermeability of the mucosa, was 5 times lower than that of virgin mucosa. Therefore, dexamethasone which is a hydrophilic compound of high molecular weight that indicates low skin permeation, presented a very marked inhibition of its diffusion to mucosa when the F16 formulation was applied, although it did not reach the impermeability of skin.
Ivermectin, as expected, was the active ingredient with the lowest permeability in both skin and mucosa. Moreover, the difference between skin and mucosa was not as marked as for the dexamethasone. In this case, the permeability of ivermectin through the unmodified mucosa was 20 times higher than that through the skin. The application of waterproofing formulations seemed to have less effect. However, it should be noted that F16 inferred an impermeability 1.5 times lower than that of the virgin mucosa to the mucosa without reaching, in any case, the values of the skin. Ivermectin presented a low permeation in skin as a hydrophobic compound with very high molecular weight but it showed a slight decrease in permeation through mucosa with application of the F16 formulation.
4.3. Rank order penetration of drugs
The penetration order of the different compounds through the different membranes always followed a similar profile, with caffeine being the most permeated and ivermectin the least permeated. Ibuprofen and dexamethasone showed a similar intermediate permeation. In all cases, the most waterproofing formulation was F16 composed of lipids that are present in the stratum corneum formed by two types of ceramides structured as liposomes in an aqueous medium. Figure 2 compares the permeation of the 4 compounds in the porcine skin, unmodified mucosa and modified mucosa with F3 and F16 formulations. The similar profile of the 4 compounds in skin and in mucosa modified with F16 is remarkable.
Moreover, the F16 formulation promoted a decrease of approximately 80% in the permeability coefficient of caffeine, ibuprofen and dexamethasone and approximately 40% for ivermectine, as its high molecular weight favours an ever decreasing permeation. It is particularly important to highlight the skin-like impermeability provided by this formulation for the compounds with low molecular weights (caffeine and ibuprofen) preventing their penetration. This indicates the preferential effect on potentially more toxic small permeating compounds via the skin and mucosal membrane.
This innovation could, a priori, protect people in general and health care workers in particular from being infected by small viruses, such as SARS-CoV-2. Permeation of a virus model with physicochemical properties similar to SARS-CoV-2 has been studied to determine the effect of these formulations [11,18]. These formulations will probably not provide complete protection, however, the decrease in the permeability coefficient will partially prevent the penetration of the virus at the systemic level.
The projection of the application is directed towards its implementation as a tool in the development of new formulations, new drugs, and in the design and development of drugs or sanitary products suitable to protect from COVID, other viruses or other toxicants such as biocides.
5. Conclusions
The high permeation of actives through the nasal or oral mucosa in contrast to the low penetration through the keratinized stratum corneum of the skin is widely known. This is mainly due to the different lipid compositions and the packing structures they form. Certain lipids determine the permeability barrier. However, they are present only in small amounts in nonkeratinized epithelia. The main objective is to obtain a formulation that can reinforce the mucosa, increase its barrier effect, and reduce or prevent the penetration of different active ingredients such as viruses, contaminants, toxins, etc.
Screening was carried out to evaluate the transmucosal water loss (TMWL) of several formulations on the synthetic membrane and on porcine sublingual mucosa. The kinetic permeation assay was performed for caffeine, ibuprofen, dexamethasone and ivermectin on porcine skin, mucosa and modified mucosa after depositing 3 formulations. The release of the active pharmaceutical ingredient was evaluated through different parameters, and the waterproofing of formulations was determined.
It is worth noting the great permeability of both the artificial membrane (80 g/h·m2) and the sublingual mucosa (72 g/h·m2) compared to the permeability of the skin (5-10 g/h·m2). Hydrophobic formulations are those that decrease permeability to water to a greater degree. However, some hydrophilic formulations were also evaluated for being more palatable. Liposomal formulations were chosen because of their ability to structure lipids in an aqueous environment, particularly with certain lipids that confer a barrier effect. The penetration order of the different compounds in the different membranes allways follows a similar profile, caffeine being the most permeable and ivermectin the least permeable with ibuprofen and dexamethasone with a similar intermediate permeability. In all cases, the most waterproofing formulation is the one composed of lipids present in the stratum corneum with two types of ceramides structured as liposomes in an aqueous medium. This formulation promotes a decrease of approximately 80% in the permeability coefficient of caffeine, ibuprofen and dexamethasone and approximately 40% of ivermectin, and its high molecular weight promotes even lower permeability. It is also important to highlight the skin-like impermeability provided by this formulation to the low molecular weight compounds (caffeine and ibuprofen), indicating their preferential effect on the possible dermal most toxic compounds through skin and mucosa penetration.
This innovation could, a priori, protect people in general and health care workers in particular from being infected by SARS-CoV-2. These formulations will probably provide a limited protection; however, the decrease in permeability will partially prevent the penetration of the virus at the systemic level. This work is directed towards its implementation as a tool in the development of new formulations and new drugs and in the design and development of drugs or sanitary products suitable to protect against COVID-19, other viruses or other toxicants such as biocides.
6. Patents
This work led to three patents:
Alonso, C.; Martí, M.; Coderch, L.; Calpena, A.C.; Mallandrich, M.; Pérez-García, M.L.; Clares, B.; Pérez, N. Lipophilic-based composition. N. Sol: EP23382737.7 (2023) N. Ref: ES1641.1822. CSIC, UB, UGR.
Alonso, C.; Martí, M.; Coderch, L.; Calpena, A.C.; Pérez-García, M.L.; Clares, B. Liposomal-based composition N. de Sol: EP23382651.0 (2023) N. Ref: ES1641.1823. CSIC, UB, UGR.
Alonso, C.; Martí, M.; Coderch, L.; Calpena, A.C.; Pérez-García, M.L.; Giraldo, S.; Bagherpour, S.; Clares, B. Virus model nanoparticle and use thereof. N. de Sol: EP23382736.9 (2023) N. Ref: ES1641.1833. CSIC, UB, UGR.
Author Contributions
Methodology, investigation and validation, A.R. and C.A.; software, M.M.; investigation, A.C., B.C. and L.P.-G.; writing—original draft preparation and supervision, L.C.; writing—review and editing, L.C. and M.M. All authors have read and agreed to the published version of the manuscript.
Funding
This research received no external funding.
Institutional Review Board Statement
The management of animals used in these experiments followed the Guide for the Care and Use of Laboratory Animals, published by the United States National Institutes of Health. The Institutional Review Board and Animal Ethics Committee of the University of Barcelona, Barcelona, Spain, approved the protocol (28 January 2013). Animal handling was approved by our Institutional Review Board and Ethics Committee (approval reference number: DMAH 5605).
Informed Consent Statement
Not applicable.
Data Availability Statement
Not applicable.
Acknowledgments
The present work could not be performed without the collaboration and contribution of the Service of Dermocosmetic Assessment from IQAC-CSIC. The authors are also grateful to Montserrat Rigol Muxart and Núria Solanes Batlló from the Department of Cardiology (Institut d’Investigacions Biomèdiques August Pi I Sunyer (IDIBAPS) Hospital Clínic, Universitat de Barcelona, Spain) for supplying the porcine skin biopsies. This work was supported by the Consejo Superior de Investigaciones Científicas “Modificación de la mucosa como protección frente al SARS-COV-2” (CSIC-COV19-130) and by the project PID2020-115663GB-C3-2 funded by MCIN/AEI/10.13039/501100011033. L.P.-G. and A.C. thank AGAUR (Generalitat de Catalunya), for a grant to consolidated research groups 2021 SGR 01085.
Conflicts of Interest
The authors declare no conflict of interest.
References
- Lee, J.; Kil, S.; et al. The effect of storage conditions on the permeability of porcine buccal mucosa. Arch Pharm Res 2002, 25, 546–549. [Google Scholar] [CrossRef]
- White, S.H.; Mirejovsky, D.; et al. Structure of Lamellar Lipid Domains and Corneocyte Envelopes of Murine Stratum Corneum. An X-ray Diffraction Study. Biochem 1998, 27, 3725–3732. [Google Scholar] [CrossRef]
- Bouwstra, J.; Pilgram, G.; et al. New aspects of the skin barrier organization. Skin Pharmacol Appl Skin Physiol 2001, 14 (Suppl. 1), 52–62. [Google Scholar] [CrossRef]
- Janůšová, B.; Zbytovská, J.; et al. Effect of ceramide acyl chain length on skin permeability and thermotropic phase behavior of model stratum corneum lipid membranes. Biochim Biophys Acta 2011, 1811, 129–137. [Google Scholar] [CrossRef]
- Kessner, D.; Ruettinger, A.; et al. Properties of ceramides and their impact on the stratum corneum structure: A review—Part 2: Stratum corneum lipid model systems. Skin Pharmacol Physiol 2008, 21, 58–74. [Google Scholar] [CrossRef]
- Kinikoglu, B.; Damour, O.; et al. Tissue engineering of oral mucosa: A shared concept with skin. J Artif Organs 2015, 18, 8–19. [Google Scholar] [CrossRef]
- Shojael, A.H. Buccal mucosa as a route for systemic drug delivery: A Review. J Pharm Pharm Sci 1988, 1, 15–30. [Google Scholar]
- Winning, T.A.; Townsend, G.C. Oral mucosal embryology and histology. Clin Dermatol 2000, 18, 499–511. [Google Scholar] [CrossRef]
- Alonso, C.; Martí, M.; Ramos, A.; Calpena, A.C.; Clares-Naveros, B.; Coderch, L. A Synthetic Model of the Mucosa for Oral Penetration Studies. Membranes 2023, 13, 905. [Google Scholar] [CrossRef]
- Alonso, C.; Martí, M.; Coderch, L.; Calpena, A.C.; Mallandrich, M.; Pérez, L.; Clares, B.; Pérez, N. Lipophilic-based composition. N. Sol: EP23382737.7 (2023) N. Ref: ES1641.1822. CSIC, UB, UGR.
- Alonso, C.; Martí, M.; Coderch, L.; Calpena, A.C.; Pérez, L.; Clares, B. Liposomal-based composition N. de Sol: EP23382651.0 (2023) N. Ref: ES1641.1823. CSIC, UB, UGR.
- Thakker, K.D.; Chern, W.H. Development and validation of in vitro release tests for semisolid dosage forms—Case study. Dissolution Technol 2003, 10, 10–15. [Google Scholar] [CrossRef]
- Mallandrich, M.; Fernández-Campos, F.; et al. Developing Transdermal Applications of Ketorolac Tromethamine Entrapped in Stimuli Sensitive Block Copolymer Hydrogels. Pharm Res 2017, 34, 1728–1740. [Google Scholar] [CrossRef]
- ICH Guideline. Validation of Analytical Procedures: Text and Methodology. International Conference on Harmonization (ICH). Q2(R1) 2005, 1–17. [Google Scholar]
- Rubio, L.; Alonso, C.; et al. Barrier function of intact and impaired skin: Percutaneous penetration of caffeine and salicylic acid. Int J Dermatol 2011, 50, 881–889. [Google Scholar] [CrossRef]
- Ku, M.S. Use of the Biopharmaceutical Classification System in early drug development. AAPS J. 2008, 10, 208–212. [Google Scholar] [CrossRef]
- Antonov, D.; Schliemann, S.; et al. Methods for the Assessment of Barrier Function. In Skin Barrier Function; Agner, T., Ed.; Current Problems in Dermatology; Karger: Basel, Switzerland, 2016; Volume 46. [Google Scholar]
- Alonso, C.; Martí, M.; Coderch, L.; Calpena, A.C.; Pérez-García, M.L.; Giraldo, S.; Bagherpour, S.; Clares, B. Virus model nanoparticle and use thereof. N. de Sol: EP23382736.9 (2023) N. Ref: ES1641.1833. CSIC, UB, UGR.
- Harding, C.R. The stratum corneum: Structure and function in health and disease. Dermatol. Ther. 2004, 17 (Suppl. 1), 6–15. [Google Scholar] [CrossRef]
- Lai-cheong, J.E.; McGrath, J.A. Structure and function of skin, hair and nails. Medicine 2013, 41, 317–320. [Google Scholar] [CrossRef]
- Shao, M.; Hussain, Z.; Thu, H.E.; Khan, S.; Katas, H.; Ahmed, T.A.; Tripathy, M.; Leng, J.; Qin, H.L.; Bukhari, S.N.A. Drug nanocarrier, the future of atopic diseases: Advanced drug delivery systems and smart management of disease. Colloids Surf. B 2016, 147, 475–491. [Google Scholar] [CrossRef]
- Wolf, R.; Wolf, D. Abnormal epidermal barrier in the pathogenesis of atopic dermatitis. Clin. Dermatol. 2012, 30, 329–334. [Google Scholar] [CrossRef]
- Abdelgawad, R.; Nasr, M.; Moftah, N.H.; Hamza, M.Y. Phospholipid membrane tubulation using ceramide doping “Cerosomes”: Characterization and clinical application in psoriasis treatment. Eur. J. Pharm. Sci. 2017, 101, 258–268. [Google Scholar] [CrossRef]
- Khazanov, E.; Priev, A.; Shillemans, J.P.; Barenholz, Y. Physicochemical and biological characterization of ceramide-containing liposomes: Paving the way to ceramide therapeutic application. Langmuir 2008, 24, 6965–6980. [Google Scholar] [CrossRef]
- van Smeden, J.; Janssens, M.; Gooris, G.S.; Bouwstra, J.A. The important role of stratum corneum lipids for the cutaneous barrier function. Biochim. Biophys. Acta (BBA)-Mol. Cell Biol. Lipids 2014, 1841, 295–313. [Google Scholar] [CrossRef]
- Meckfessel, M.H.; Brandt, S. The structure, function, and importance of ceramides in skin and their use as therapeutic agents in skin-care products. J. Am. Acad. Dermatol. 2014, 71, 177–184. [Google Scholar] [CrossRef]
- Draelos, Z.D. The effect of ceramide-containing skin care products on eczema resolution duration. Cutis 2008, 81, 87–91. [Google Scholar]
- Zeichner, J.A.; Del Rosso, J.Q. Multivesicular emulsion ceramide-containing moisturizers: An evaluation of their role in the management of common skin disorders. J. Clin. Aesthet. Dermatol. 2016, 9, 26–32. [Google Scholar]
- Coderch, L.; López, O.; de la Maza, A.; Parra, J.L. Ceramides and skin function. Am. J. Clin. Dermatol. 2003, 4, 107–129. [Google Scholar] [CrossRef]
- van Smeden, J.; Hoppel, L.; van der Heijden, R.; Hankemeier, T.; Vreeken, R.J.; Bouwstra, J.A. LC/MS analysis of stratum corneum lipids: Ceramide profiling and discovery. J. Lipid Res. 2011, 52, 1211–1221. [Google Scholar] [CrossRef]
- Rabionet, M.; Gorgas, K.; Sandhoff, R. Ceramide synthesis in the epidermis. Biochim. Biophys. Acta Mol. Cell. Biol. Lipids 2014, 1841, 422–434. [Google Scholar] [CrossRef]
- Vovesná, A.; Zhigunov, A.; Balouch, M.; Zbytovská, J. Ceramide liposomes for skin barrier recovery: A novel formulation based on natural skin lipids. Int J Pharm 2021, 596, 120264. [Google Scholar] [CrossRef]
Figure 1.
Mean percentage of caffeine (CAF), ibuprofen (IBU), dexamethasone (DEX) and ivermectin (IVE) release applied to the skin (◆), mucosa (▲) and mucosa modified by formulations F3 (●), F6 (◆) and F16 (■).
Figure 1.
Mean percentage of caffeine (CAF), ibuprofen (IBU), dexamethasone (DEX) and ivermectin (IVE) release applied to the skin (◆), mucosa (▲) and mucosa modified by formulations F3 (●), F6 (◆) and F16 (■).
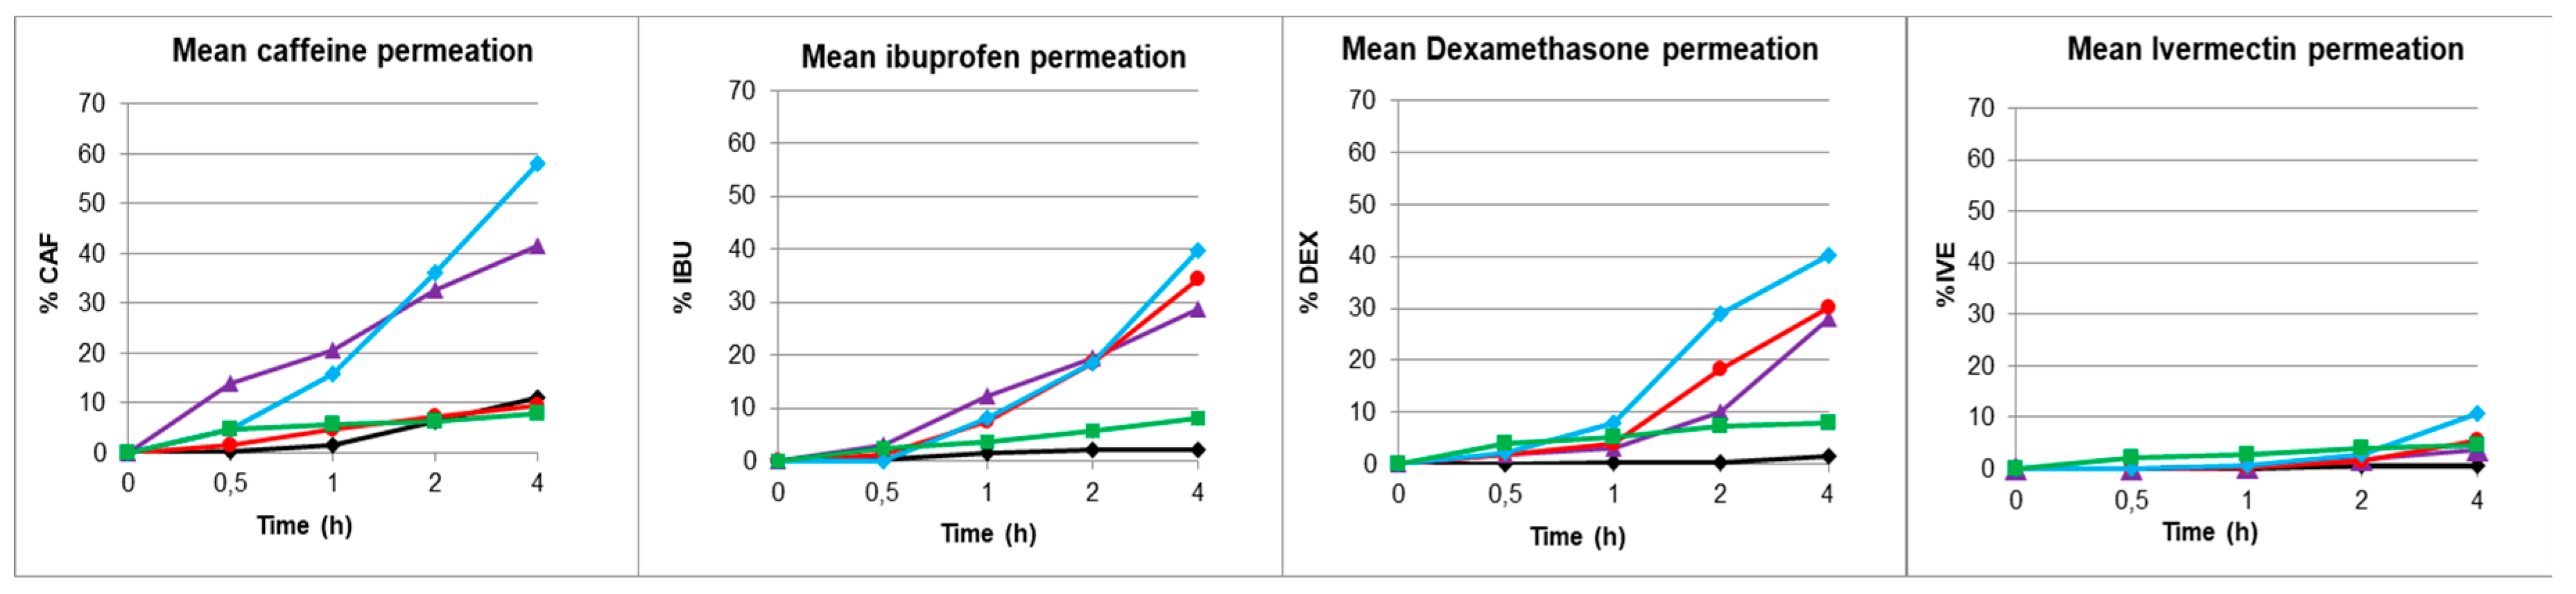
Figure 2.
Mean percentage of release of caffeine (■), ibuprofen (■), dexametasone (●) and ivermectine (◆) applied to the skin, mucosa and mucosas modified by formulations F3 and F16.
Figure 2.
Mean percentage of release of caffeine (■), ibuprofen (■), dexametasone (●) and ivermectine (◆) applied to the skin, mucosa and mucosas modified by formulations F3 and F16.
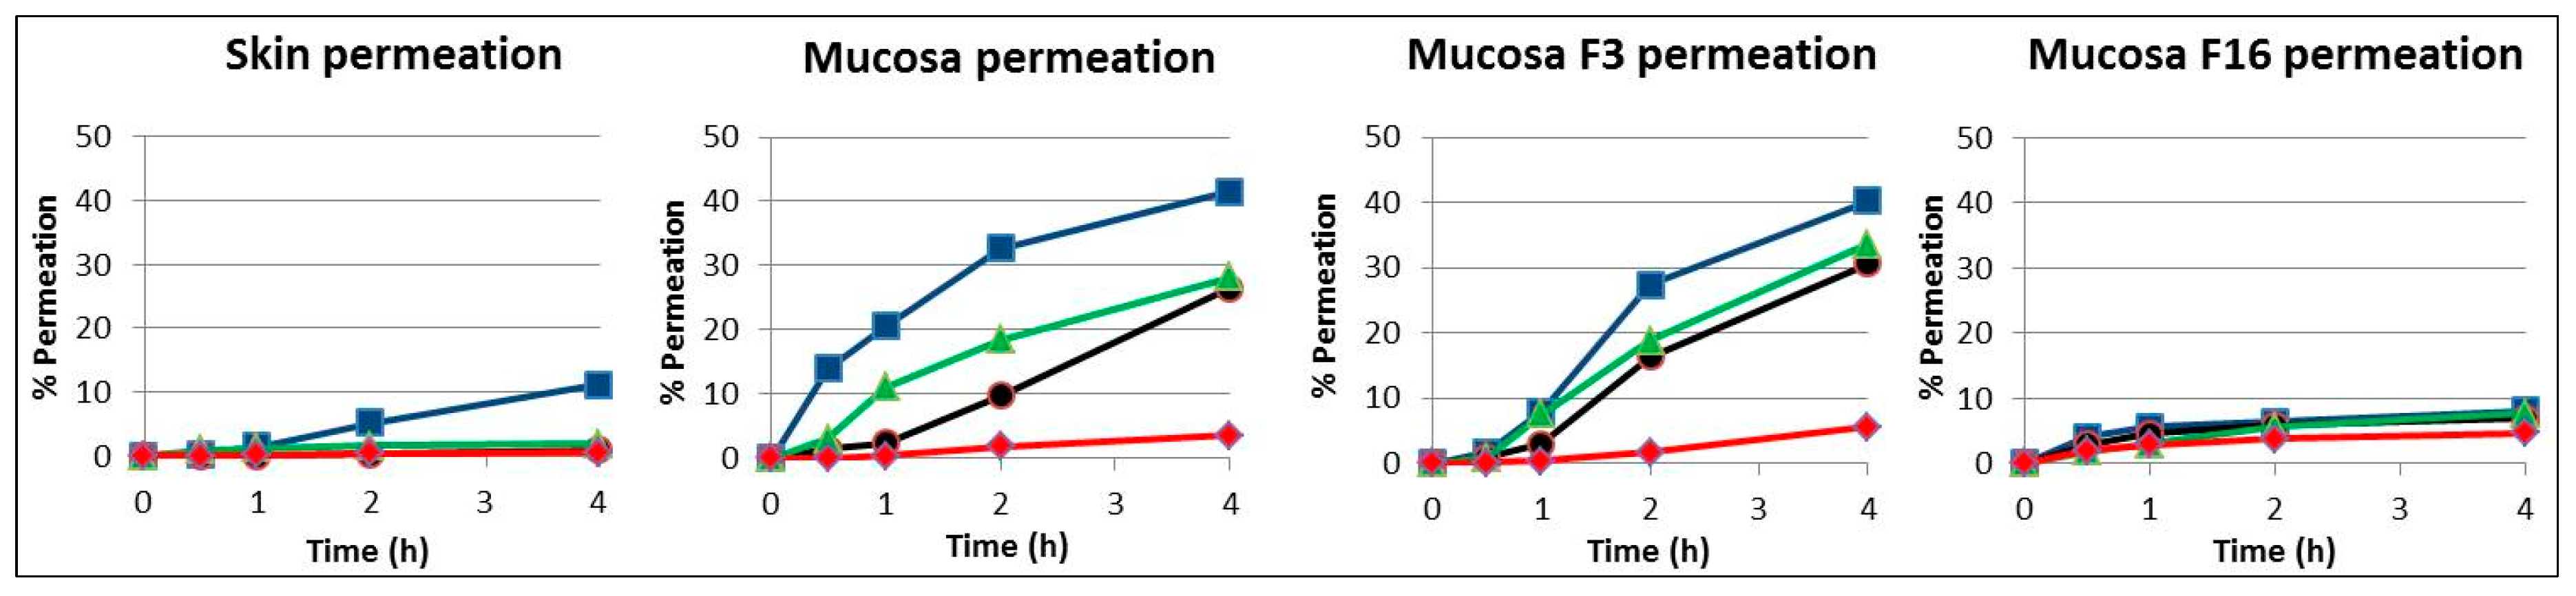

Table 1.
Physicochemical properties and BSC classification of active substances evaluated.
| Active substances (API) | pKa | LogP (pH7.4) | MW | BSC Group |
|---|---|---|---|---|
| Caffeine (CAF) | 10.4 | -0.07 | 194.2 | 1 |
| Ibuprofen (IBU) | 5.30 | 3.97 | 206.3 | 2 |
| Dexamethasone (DEX) | 12.1 | 1.74 | 392.5 | 3 |
| Ivermectin (IVE) | 12.47 | 5.83 | 875.1 | 4 |
Table 2.
Description of hydrophobic formulations [10].
Table 2.
Description of hydrophobic formulations [10].
| Formulation number | Formulation name | Composition |
|---|---|---|
| 1 | Tea tree oil mouthwash | Glycerin 15%, sorbitol 4.5%, Lauryl sulfate sodium 3%, ethanol 10% (Merck, Darmstadt, Germany) and Tea tree oil (Acofarma, Terrassa, Spain) |
| 2 | Semi-solid anhydrous absorption base | Lecithin 50% in liquid Vaseline |
| 3 | Lipophilic base MI | Isopropyl myristate 10% in Filant Vaseline |
| 4 | Lipophilic base TGM | Propyl glycol 10%, medium chain triglycerides 10% in Filant Vaseline |
| 5 | Fluid anhydrous absorption base | Soy lecithin 50% in Isopropyl palmitate. |
Table 3.
Description of hydrophilic formulations.
| Formulation number | Formulation name | Composition |
|---|---|---|
| 6 | SCMC gel 4% | Sodium carboxymethylcellulose 4%, Glycerin 10% in water |
| 7 | SHYL gel 2% | Sodium hyaluronate 2% in water |
| 8 | CHIT gel 2% | Chitosan 2%, lactic acid 1% in water |
| 9 | ALG gel 4% | Alginate sodium 4%, calcium chloride 4% in water |
| 10 | PLX-CBP gel | Poloxamer 26%, Carbopol 940 1% in water |
Table 4.
Description of liposomal formulations [11].
Table 4.
Description of liposomal formulations [11].
| Formulation number | Formulation name | Composition |
|---|---|---|
| 11 | PC 10% | Soy Phosphatidylcholine 10% (Lipoid Ludwigshafen, Germany) |
| 12 | HPC 10% | Soy Hydrogenated Phosphatidylcholine 10% (Lipoid Ludwigshafen, Germany) |
| 13 | Cer3 1% | Ceramide3 46.9 % (Evonik, Essen, Germany), Cholesterol 30.8%, Palmitic acid 22.4%. Total lipid concentration 1% |
| 14 | Cer3 10% | Ceramide3 46.8 % (Evonik, Essen, Germany), Cholesterol 31.6%, Palmitic acid 23.0%. Total lipid concentration 10% |
| 15 | Cer3Cer6 1% | Ceramide3 24.6 % (Evonik, Essen, Germany), Ceramide6 26.5% (Evonik, Essen, Germany), Cholesterol 35.5%, Palmitic acid 22.8%. Total lipid concentration 1% |
| 16 | Cer3Cer6 10% | Ceramide3 23.7 % (Evonik, Essen, Germany), Ceramide6 24.0% (Evonik, Essen, Germany), Cholesterol 31.6%, Palmitic acid 23.0%. Total lipid concentration 10% |
Table 5.
Linear equation and limit parameters of quantification (LoQ) and detection (LoD) from the HPLC/DAD analysis for caffeine, ibuprofen, dexamethasone and ivermectin.
Table 5.
Linear equation and limit parameters of quantification (LoQ) and detection (LoD) from the HPLC/DAD analysis for caffeine, ibuprofen, dexamethasone and ivermectin.
| Caffeine (CAF) | Ibuprofen (IBU) | Dexamethasone (DEX) | Ivermectin (IVE) | |
|---|---|---|---|---|
| Linear Reg. Eq. (R2) | ||||
| LoD / LoQ (µg/mL) | 0.82 / 2.49 | 0.50 / 1.52 | 0.23 / 0.70 | 0.55 / 1.66 |
Table 6.
Transmembrane water loss (TMWL) of the artificial membrane, the porcine sublingual mucosa and these membranes modified by the application of the different formulations.
Table 6.
Transmembrane water loss (TMWL) of the artificial membrane, the porcine sublingual mucosa and these membranes modified by the application of the different formulations.
| Formulations | Nuclepore TMWL 1h (g/h·m2) |
Sublingual Mucosa TMWL 1h (g/h·m2) |
|---|---|---|
| Nuclepore control | 80.8 | -- |
| Sublingual mucosa control | -- | 72.4 |
| Hydrophobic formulations | ||
| F1 Tea tree mouthwash | 71.3 | 58.5 |
| F2 Semi-solid anhydrous absorption base | 15.98 | 23.6 |
| F3 Lipophilic base MI | 2.6 | 6.5 |
| F4 Lipophilic base TGCM | 3.6 | 3.0 |
| F5 Fluid anhydrous absorption base | 22.5 | 34.2 |
| Hydrophilic formulations | ||
| F6 SCMC gel 4% | 64.6 | 53.8 |
| F7 SHYL gel 2% | 75.4 | 59.3 |
| F8 CHIT gel 2% | 75.2 | 63.0 |
| F9 ALG gel 4% | 74.5 | 62.9 |
| F10 PLX-CBP gel | 74.8 | 57.0 |
| Liposomal formulations | ||
| F11 PC 10% | 57.8 | 66.1 |
| F12 HPC 10% | 68.0 | 63.7 |
| F13 Cer3 1% | 59.3 | 65.6 |
| F14 Cer3 10% | 57.2 | 60.8 |
| F15 Cer3Cer6 1% | 49.2 | 47.2 |
| F16 Cer3Cer6 10% | 50.4 | 45.1 |
Table 7.
Application of formulations 3, 6 and 16 and evaluation of the transmucosal water loss, of the skin, of the porcine sublingual mucosa and of the same modified by the application of the different formulations before applying the drugs.
Table 7.
Application of formulations 3, 6 and 16 and evaluation of the transmucosal water loss, of the skin, of the porcine sublingual mucosa and of the same modified by the application of the different formulations before applying the drugs.
| Sample | Amount applied | TMWL (g/m2/h) |
|---|---|---|
| Skin | --- | 13.68 ± 1.22 |
| Sublingual mucosa | --- | 84.72 ± 4.44 |
| Sublingual mucosa + F3 (Lipophilic base MI) | 51.87 mg | 4.17 ± 1.73 |
| Sublingual mucosa + F6 (SCMC gel 4%) | 70 µL | 57.63 ± 4.72 |
| Sublingual mucosa + F16 (Cer3Cer6 10%) | 70 µL | 45.05 ± 2.35 |
Table 8.
Mean values of area under the curve (AUC), flux (J), coefficient of permeability (Kp) and maximum concentration (Cmax) for active ingredients through the skin, sublingual mucosa and sublingual mucosa with the protective waterproofing formulations.
Table 8.
Mean values of area under the curve (AUC), flux (J), coefficient of permeability (Kp) and maximum concentration (Cmax) for active ingredients through the skin, sublingual mucosa and sublingual mucosa with the protective waterproofing formulations.
| API | Parameter | SKIN | MUCOSA | MUCOSA F3 | MUCOSA F6 | MUCOSA F16 |
|---|---|---|---|---|---|---|
| CAF | AUC ((mg/cm2)·h) | 0.41 ± 0.27 | 2.19 ± 0.93 | 0.49 ± 0.13 | 2.51 ± 0.58 | 0.45 ± 0.09 |
| Flux. J (µg/cm2/h) | 75.09 ± 51.32 | 428.40 ± 81.41 | 102.73 ± 30.73 | 611.08 ± 85.12 | 78.93 ± 11.05 | |
| Permeability Coef. Kp (10−3 cm/h) | 6.06 ± 4.12 | 34.55 ± 0.01 | 8.28 ± 2.48 | 49.28 ± 0.01 | 6.37 ± 0.89 | |
| Lag Time. TL (h) | 0.65 ± 0.24 | 0.04 ± 0.34 | 0.10 ± 0.08 | 0.28 ± 0.08 | -0.18 ± 0.03 | |
| Maximal Conc. Cmax (µg/mL) | 107.23 ± 57.73 | 514.46 ± 119.97 | 118.25 ± 34.84 | 719.67 ± 92.99 | 99.33 ± 8.49 | |
| IBU | AUC ((mg/cm2)·h) | 0.10 ± 0.01 | 1.27 ± 0.49 | 1.32 ± 0.16 | 1.68 ± 0.47 | 0.37 ± 0.0002 |
| Flux. J (µg/cm2/h) | 24.79 ± 2.75 | 346.91 ± 5.87 | 498.25 ± 49.45 | 451.01 ± 98.04 | 74.41 ± 0.16 | |
| Permeability Coef. Kp (10−3 cm/h) | 2.05 ± 0.23 | 28.67 ± 0.49 | 41.18 ± 4.09 | 37.27 ± 8.10 | 6.15 ± 0.001 | |
| Lag Time. TL (h) | -0.24 ± 0.19 | 0.17 ± 0.07 | 0.23 ± 0.01 | 0.35 ± 0.06 | 0.15 ± 0.003 | |
| Maximal Conc. Cmax (µg/mL) | 21.93 ± 1.98 | 340.76 ± 63.62 | 406.04 ± 36.48 | 545.68 ± 114.46 | 96.52 ± 0.08 | |
| DEX | AUC ((mg/cm2)·h) | 0.03 ± 0.01 | 0.83 ± 0.19 | 1.10 ± 0.18 | 1.38 ± 0.55 | 0.38 ± 0.06 |
| Flux. J (µg/cm2/h) | 5.84 ± 3.46 | 335.25 ± 61.25 | 330.43 ± 11.68 | 289.38 ± 99.51 | 68.26 ± 1.67 | |
| Permeability Coef. Kp (10−3 cm/h) | 0.49 ± 0.29 | 28.17 ± 5.15 | 27.77 ± 0.98 | 24.32 ± 8.36 | 5.74 ± 0.14 | |
| Lag Time. TL (h) | 0.62 ± 0.16 | 0.31 ± 0.13 | 0.36 ± 0.04 | 0.64 ± 0.36 | -0.11 ± 0.27 | |
| Maximal Conc. Cmax (µg/mL) | 67.41 ± 95.05 | 315.34 ± 87.38 | 363.51 ± 41.15 | 493.36 ± 131.99 | 82.14 ± 9.84 | |
| IVE | AUC ((mg/cm2)·h) | 0.026 ± 0.002 | 0.13 ± 0.02 | 0.17 ± 0.01 | 0.31 ± 0.24 | 0.27 ± 0.24 |
| Flux. J (µg/cm2/h) | 3.13 ± 0.86 | 63.75 ± 1.57 | 87.23 ± 21.83 | 144.86 ± 29.93 | 41.70 ± 5.67 | |
| Permeability Coef. Kp (10−3 cm/h) | 0.25 ± 0.07 | 5.06 ± 0.13 | 6.92 ± 1.73 | 11.50 ± 2.38 | 3.17 ± 1.62 | |
| Lag Time. TL (h) | 0.59 ± 0.28 | 0.24 ± 0.001 | 0.28 ± 0.02 | 0.32 ± 0.10 | -0.09 ± 0.46 | |
| Maximal Conc. Cmax (µg/mL) | 7.38 ± 0.13 | 44.45 ± 1.68 | 69.66 ± 18.61 | 134.92 ± 79.36 | 59.13 ± 40.84 |
Disclaimer/Publisher’s Note: The statements, opinions and data contained in all publications are solely those of the individual author(s) and contributor(s) and not of MDPI and/or the editor(s). MDPI and/or the editor(s) disclaim responsibility for any injury to people or property resulting from any ideas, methods, instructions or products referred to in the content. |
© 2023 by the authors. Licensee MDPI, Basel, Switzerland. This article is an open access article distributed under the terms and conditions of the Creative Commons Attribution (CC BY) license (http://creativecommons.org/licenses/by/4.0/).
Copyright: This open access article is published under a Creative Commons CC BY 4.0 license, which permit the free download, distribution, and reuse, provided that the author and preprint are cited in any reuse.


