Preprint
Article

Wavelet Analysis for Image Denoising: A Multiscale Approach for Enhancing Visual Clarity

Altmetrics

Downloads

161

Views

86

Comments

0

Meng Wu  *

This version is not peer-reviewed

Submitted:

18 October 2023

Posted:

20 October 2023

You are already at the latest version

Alerts
Abstract
This paper explores the application of wavelet analysis, a multiscale approach for enhancing visual clarity, in the context of image denoising, which reduces the impact of noisy pixels, caused by various factors such as electronic sensor limitations, low-light conditions, or transmission errors in digital imaging systems. This paper introduces some common noise types like Gaussian noise and processes of image denoising, eliciting the strength of wavelet analysis. As a powerful image denoising technology, wavelet analysis needs five steps to process the image, and the key step is thresholding. There are many kinds of wavelet, and each wavelet has different advantages and functions, which makes it suitable for different applications. Hence, wavelet analysis also makes a contribution in various fields beyond signal processing and data analysis, such as Biomedical Imaging and Geophysics and Seismology, where preserving image quality is essential for accurate analysis and interpretation. In short, this research highlights the promise of wavelet analysis, emphasizing the use of high- quality image data.
Keywords: 
Subject: Computer Science and Mathematics  -   Applied Mathematics

Introduction of Image Denoising

Image denoising [1,2] is a process of reducing or removing unwanted noise or random variations from a digital image to improve its quality and make it visually clearer and more useful for various applications. Noise in an image typically appears as random, irregular patterns of brightness and color that were not present in the original scene when the image was captured. It can result from various factors such as electronic sensor limitations, low-light conditions, or transmission errors in digital imaging systems.
One common approach to image denoising is filtering where mathematical algorithms are applied to the image to selectively smooth or blur areas that are likely to contain noise while preserving important image details. Filters like Gaussian filters and median filters are commonly used for this purpose. These filters work by averaging pixel values in the vicinity of each pixel to reduce the impact of noisy pixels.
In recent years, machine learning techniques [3], particularly deep learning models [4] like convolutional neural networks (CNNs), have made significant advancements in image denoising. These models can learn complex patterns in noisy images and effectively remove noise while preserving image details. They are trained on large datasets of noisy and clean images, allowing them to generalize and perform well on a wide range of denoising tasks.
Image denoising has a broad range of practical applications, including improving the quality of photographs, enhancing medical images for diagnosis, enhancing satellite and surveillance imagery, and improving the performance of computer vision systems by providing cleaner input data. Effective image denoising plays a crucial role in various fields where image quality [5] is vital for accurate analysis and decision-making. Figure 1 is shown below.

Noise Types

Noise in digital images [6] refers to unwanted and random variations in pixel values that distort the original information or degrade the image quality. Understanding different types of noise is essential for effectively applying denoising techniques. Here are some common types of noise in images:
Gaussian Noise [7]: Gaussian noise is one of the most common types of noise encountered in digital images. It follows a Gaussian (normal) distribution and appears as random variations that resemble the classic bell curve. Gaussian noise is often caused by electronic sensor limitations, fluctuations in light, and other random factors. Denoising Gaussian noise is relatively straightforward, and Gaussian filters are commonly used for this purpose.
Salt and Pepper Noise [8]: Salt and pepper noise, also known as impulse noise, appears as random, isolated bright and dark pixels in an image. It is typically caused by malfunctioning pixels in the image sensor or transmission errors. Denoising salt and pepper noise [9] can be challenging because it involves identifying and replacing or interpolating these outlier pixels.
Speckle Noise: Speckle noise is a granular noise that appears as random graininess in an image. It is often found in medical images like ultrasound and radar imagery. Speckle noise is caused by interference patterns [10] in the image formation process [11]. Denoising speckle noise [12] usually involves applying filters that preserve edge information while smoothing the noise.
Poisson Noise: Poisson noise is commonly found in images where the number of photons detected at each pixel follows a Poisson distribution [13]. It is particularly relevant in low-light conditions and is often seen in astronomical and microscopy images [14]. Denoising Poisson noise [15] requires specialized methods that take into account the statistical properties of the noise.
Quantization Noise: Quantization noise [16] occurs when an analog signal [17] is digitized with limited precision, resulting in rounding errors. It manifests as a fixed pattern of discrete values [18] or steps in the image. Dithering techniques [19] are often used to mitigate quantization noise during the digitization process.
Color Noise: In color images, noise can affect individual color channels [20], leading to color distortion [21] or artifacts. Color noise may result from sensor limitations, compression artifacts [22], or other factors. Denoising color noise often requires specialized algorithms that consider the correlation between color channels [23]. Table 1 is shown below.

Procedures of Image Denoising

Image denoising is a crucial image processing task that aims to remove or reduce noise while preserving important image details. The procedures for image denoising typically involve the following key steps:
Noise Characterization [24] and Estimation: The first step in image denoising is to understand and characterize the type of noise present in the image [25]. This involves estimating the noise statistics, such as its distribution and intensity. Different noise types require different denoising approaches. Common noise estimation techniques include analyzing local neighborhoods in the image, using statistical methods, or leveraging prior knowledge about the imaging system [26] and noise sources.
Filtering or Denoising Algorithm Selection: Once the noise characteristics are understood, the next step is to choose an appropriate denoising algorithm [27,28] or filter. The choice depends on factors such as the type and intensity of noise, the desired level of noise reduction, and the importance of preserving image details. Common denoising techniques include: (i) Linear Filters: Gaussian filters, mean filters, and bilateral filters [29] are examples of linear filters that smooth the image while reducing noise. (ii) Non-linear Filters: Median filters, adaptive filters [30], and wavelet-based methods are non-linear approaches that are effective in handling various noise types. (iii) Deep Learning: Convolutional neural networks (CNNs) [31] and other machine learning models have shown remarkable performance in image denoising by learning noise patterns from training data.
Denoising Implementation: After selecting the denoising algorithm, it is applied to the noisy image. The filter or algorithm processes the image to reduce noise while trying to preserve the image's essential features and details. In some cases, multiple denoising stages or techniques may be used in succession to achieve the desired level of noise reduction without over-smoothing the image [32].
Quality Assessment and Fine-Tuning: It's essential to evaluate the denoised image's quality to ensure that it meets the desired objectives. Metrics like peak signal-to-noise ratio (PSNR) [33], structural similarity index (SSIM) [34], and visual inspection can be used to assess the denoising performance. Depending on the results, fine-tuning of denoising parameters or algorithm selection may be necessary to strike a balance between noise reduction and preservation of image details. Iterative approaches may also be employed, where the denoising process is repeated until the desired image quality is achieved.
Image denoising procedures can vary significantly depending on the specific noise characteristics and the chosen denoising method. The goal is to achieve a noise-free or visually improved image while minimizing the loss of important image details, ensuring the final result is suitable for its intended application, whether it be in photography, medical imaging, remote sensing, or computer vision. Figure 2 is shown below.
Wavelet Analysis for Image Denoising
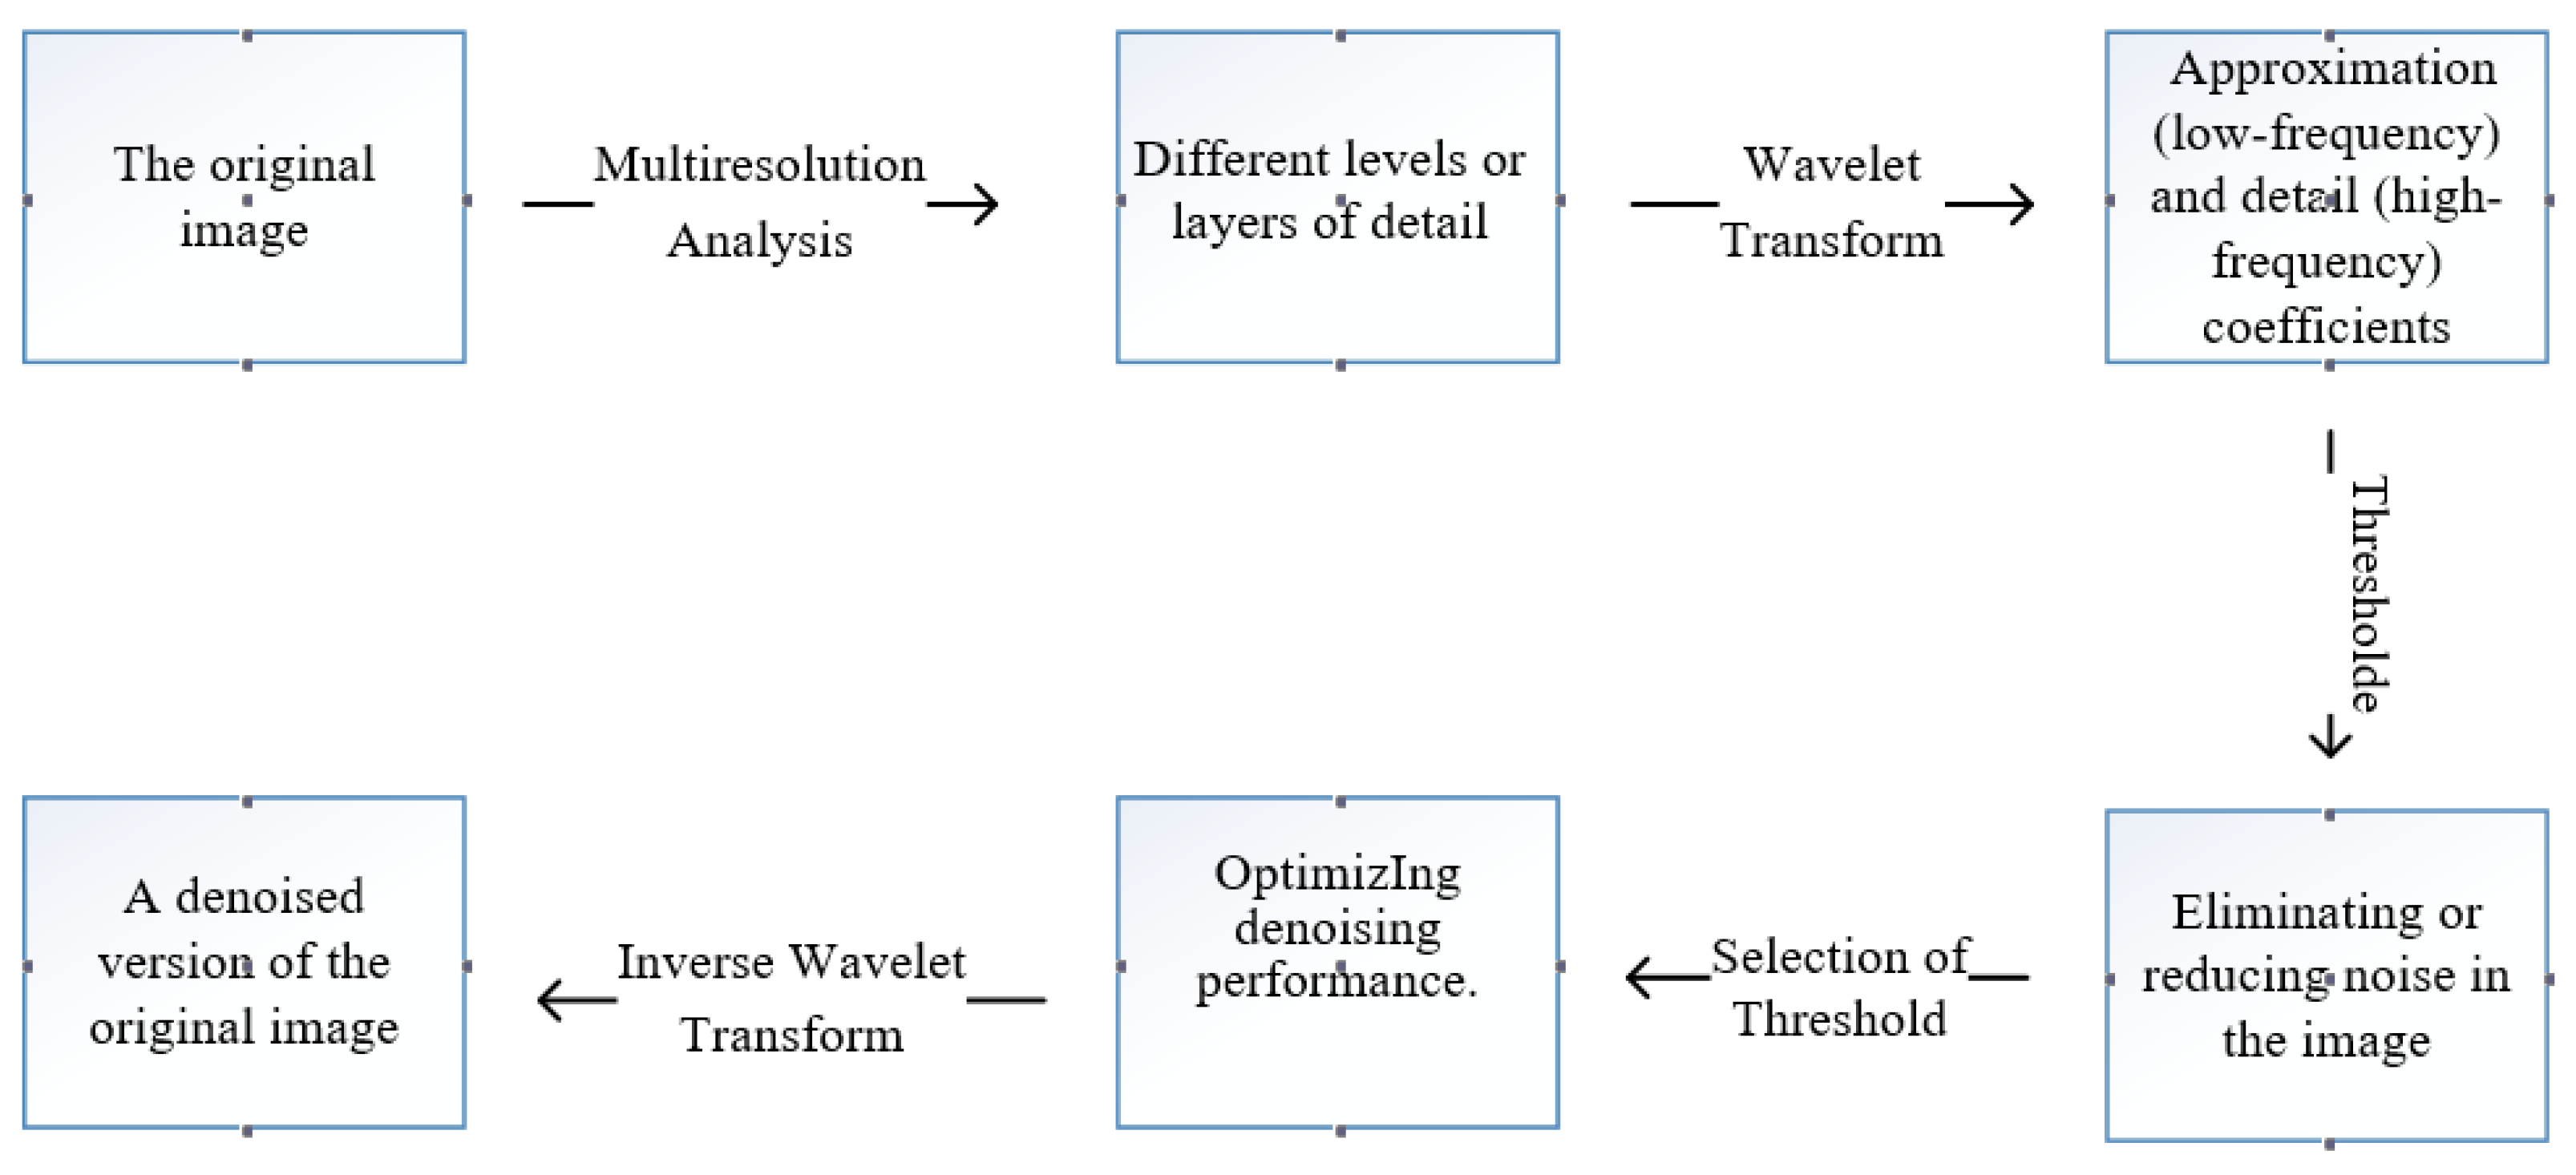
Wavelet analysis is a powerful technique used in image denoising to effectively remove noise while preserving important image features [35]. It relies on the mathematical concept of wavelets, which are functions that can be scaled and shifted to analyze different frequency components of an image. Here's how wavelet analysis works for image denoising:
Multiresolution Analysis [36]: Wavelet analysis is based on the idea of multiresolution analysis, which means examining an image at multiple scales or resolutions. In this context, the original image is decomposed into different levels or layers of detail. High-frequency components, which often correspond to noise, are separated from the low-frequency components representing image structure.
Wavelet Transform: The discrete wavelet transform (DWT) [37] is a fundamental tool in wavelet analysis for image denoising. It involves convolving the image with a set of wavelet functions at different scales and positions. The result is a decomposition of the image into approximation (low-frequency) and detail (high-frequency) coefficients for each level of resolution.
Thresholding: In image denoising using wavelet analysis, the key step is thresholding [38]. Thresholding involves setting small wavelet coefficients (which correspond to noise) to zero while retaining or modifying the larger coefficients (which correspond to image features). This effectively eliminates or reduces noise in the image.
Selection of Threshold: The choice of the threshold value is critical in wavelet-based image denoising. Various thresholding techniques can be employed, such as hard thresholding (setting coefficients below the threshold to zero) or soft thresholding [39] (shrinking coefficients toward zero). The threshold can be selected based on statistical properties of the noise or using techniques like Stein's Unbiased Risk Estimate (SURE) to optimize denoising performance.
Inverse Wavelet Transform: After thresholding the wavelet coefficients, the denoised image is reconstructed by performing the inverse wavelet transform. This combines the modified detail and approximation coefficients from each resolution level to produce a denoised version of the original image.
Wavelet analysis for image denoising has several advantages. It can effectively remove noise while preserving image details and structures at different scales, making it suitable for a wide range of noise types. Additionally, wavelet-based denoising can be adaptive, as it can vary the thresholding strategy and levels of decomposition to suit the specific characteristics of the image and noise [40].
Overall, wavelet analysis is a versatile and powerful tool for image denoising, finding applications in fields like medical imaging, transportation [41], satellite imagery processing, and digital photography, where preserving image quality is essential for accurate analysis and interpretation [42]. Figure 3 is shown below.

Common Wavelet Types

Wavelets are mathematical functions used in signal processing and image analysis to analyze and represent signals and data at multiple scales [43]. There are several types of wavelets, each with its own properties and characteristics [44]. Here are some common wavelet types:
Haar Wavelet: The Haar wavelet is one of the simplest wavelets and serves as the foundation for understanding wavelet analysis. It is a piecewise constant function with a simple step shape and is often used for educational purposes. The Haar wavelet can efficiently represent abrupt changes or discontinuities in data.
Daubechies Wavelets (db) [45]: Daubechies wavelets, often denoted as dbN, where N represents the number of vanishing moments, are widely used in practical applications. They come in different orders, such as db1, db2, db3, etc., each with increasing levels of smoothness and vanishing moments. Daubechies wavelets are popular for image compression and denoising due to their good localization properties in both time and frequency domains.
Symlet Wavelets (sym): Symlet wavelets are similar to Daubechies wavelets but offer better symmetry and smoothness properties. They are denoted as symN, where N specifies the number of vanishing moments [46]. Symlet wavelets are commonly used in applications where a compromise between smoothness and compact support is required.
Biorthogonal Wavelets (bior): Biorthogonal wavelets come in pairs: one for decomposition and one for reconstruction. They offer flexibility in adapting to specific signal characteristics. Biorthogonal wavelets are used in image compression [47], denoising, and feature extraction.
Coiflet Wavelets (coif): Coiflet wavelets are known for their high smoothness and compact support. They are suitable for analyzing signals with a high degree of smoothness, such as medical images. Coiflet wavelets are denoted as coifN, where N represents the number of vanishing moments.
Each type of wavelet has its advantages and is suited for different applications. The choice of wavelet depends on factors such as the characteristics of the signal or image being analyzed [48], the desired level of time-frequency localization, and the specific task at hand, such as compression, denoising, or feature extraction. Wavelet analysis has found widespread use in various fields, including image processing, signal processing [49], data compression, and pattern recognition, due to its ability to capture and represent information at different scales. Table 2 is shown below.

Advantages of Wavelet Analysis

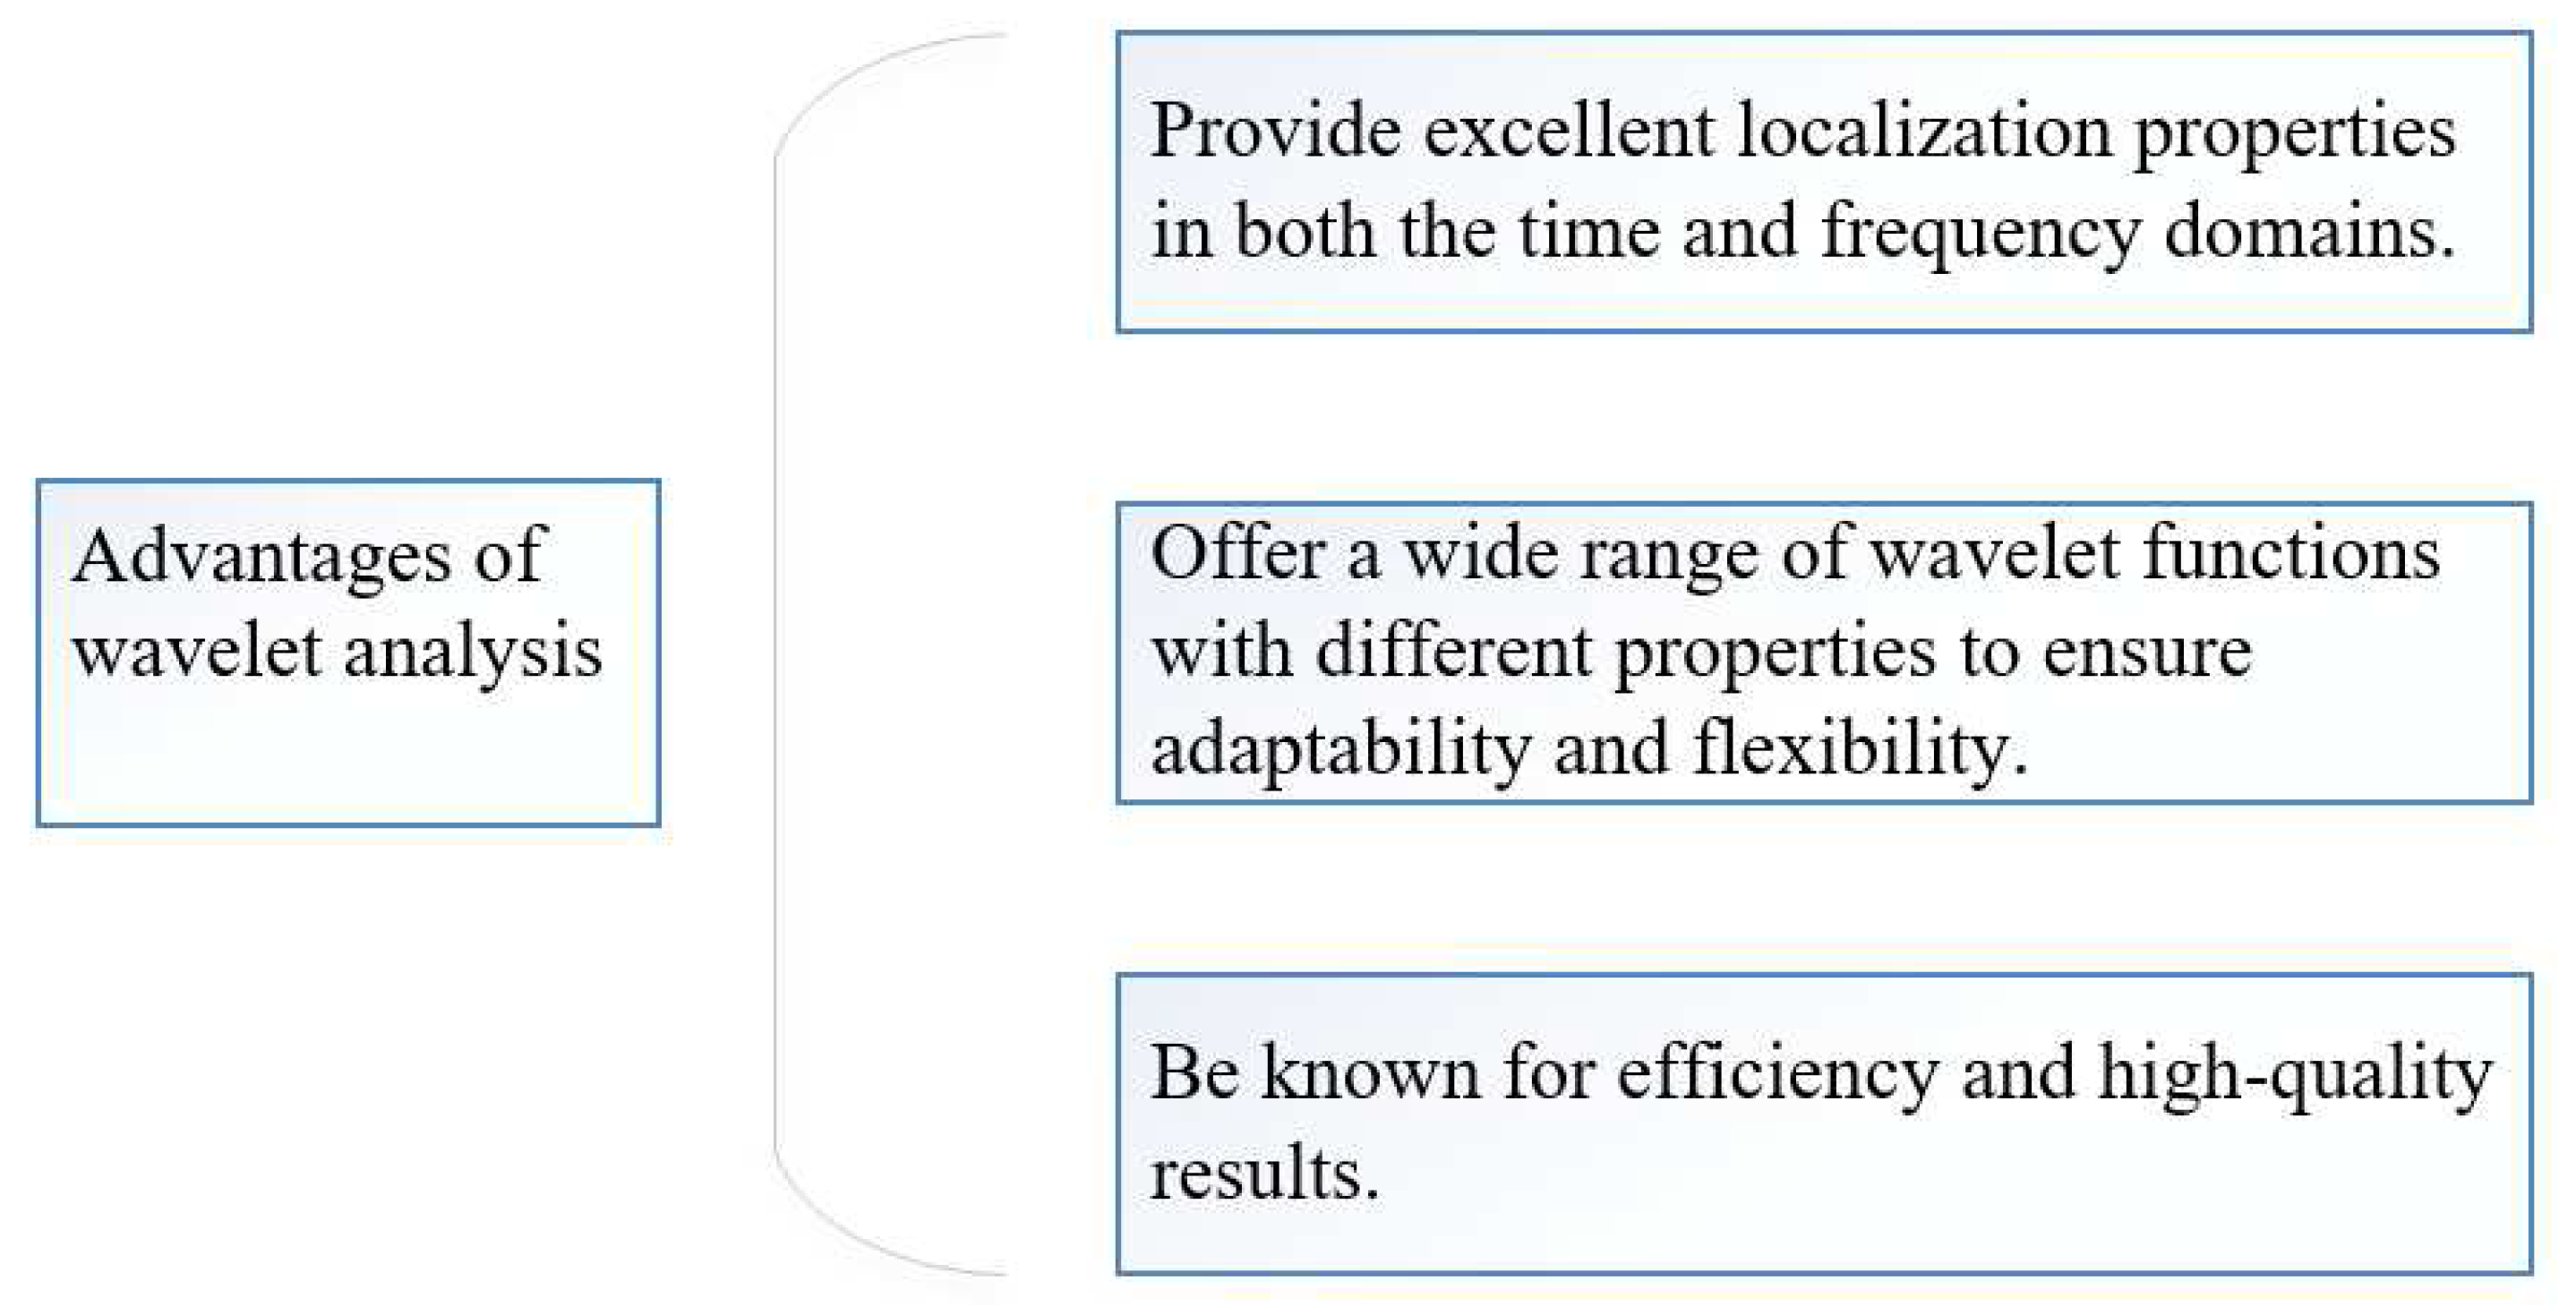
Localization in Time and Frequency: Wavelets provide excellent localization properties in both the time and frequency domains. Unlike traditional Fourier analysis [50], which offers precise frequency information but lacks time localization, wavelets allow you to pinpoint the occurrence of features in both time and frequency. This feature is crucial in applications where knowing when an event happens is as important as its frequency content [51].
Adaptability and Flexibility: Wavelet analysis offers a wide range of wavelet functions with different properties. This allows you to choose a wavelet that best suits the characteristics of your data or signal [52]. For example, you can select a wavelet that emphasizes smoothness, compact support, or vanishing moments depending on your specific analysis requirements [53]. This adaptability makes wavelets suitable for a broad spectrum of applications.
Efficient Compression and Denoising: Wavelet analysis is widely used in data compression, classification, and denoising [54]. The multiresolution representation of data makes it possible to remove noise or reduce data size while preserving essential features and details. Wavelet-based compression methods, such as JPEG 2000 for images and wavelet-based audio compression [55], are known for their efficiency and high-quality results. Figure 4 is shown below.

Disadvantages of Wavelet Analysis

Wavelet analysis, like any analytical technique, possesses several disadvantages that merit academic consideration. These drawbacks include:
The choice of an appropriate wavelet basis is non-trivial and often requires a deep understanding of the data characteristics. Selecting an inappropriate wavelet can lead to misleading results, making the analysis highly dependent on user expertise.
Wavelets are sensitive to both scale and translation, which can make it challenging to compare features at different scales or positions. This can complicate the interpretation of results, particularly in multiresolution analysis.
While wavelet analysis can capture non-stationary signals [60], the decomposition process may introduce artifacts [61], and it may not always provide an intuitive way to interpret non-stationary components [62] effectively. The finite extent of data often leads to boundary effects [63] or artifacts in the wavelet analysis. This issue can impact the accuracy of features extracted from signals, especially at the edges of the data.
The computation of wavelet transforms, particularly for large datasets, can be computationally intensive and time-consuming. This aspect may hinder its practical application in real-time or high-throughput analysis. Table 3 is shown below.

Other Application Fields of Wavelet Analysis

Wavelet analysis, with its ability to capture and represent data at multiple scales, has found applications in various fields beyond signal processing and data analysis [56]. Here are some additional application fields of wavelet analysis:
Biomedical Imaging: Wavelet analysis is widely used in biomedical imaging , including MRI (Magnetic Resonance Imaging) and CT (Computed Tomography) scans [57]. It helps enhance image quality, reduce noise, and improve image reconstruction. In electroencephalography (EEG) and electrocardiography (ECG), wavelet analysis aids in the detection of subtle patterns and anomalies in brain and heart signals, which is essential for diagnosis and monitoring of neurological and cardiac conditions.
Geophysics and Seismology: Seismologists use wavelet analysis to analyze seismic signals and identify earthquake events. Wavelet transforms can help extract information about the timing and frequency content of seismic waves, contributing to earthquake prediction and hazard assessment. In exploration geophysics, wavelet analysis assists in processing and interpreting seismic data to locate underground oil and gas reservoirs [58].
Image and Video Compression: In addition to its use in image denoising, wavelet analysis plays a vital role in image and video compression. Wavelet-based compression algorithms, such as JPEG 2000 and the wavelet transform in video codecs, achieve high compression ratios with minimal loss of image quality.
Finance and Econometrics: Wavelet analysis is applied in finance to analyze financial time series data [59]. It helps identify patterns, trends, and irregularities in stock prices, currency exchange rates, and other financial data. Econometric studies often use wavelet analysis to investigate the relationship between economic variables across different time scales, providing insights into long-term trends and short-term fluctuations.
Environmental Science and Remote Sensing: Wavelet analysis aids in processing and analyzing environmental data, including remote sensing data from satellites and ground-based sensors. It can help detect changes in land use, monitor environmental variables like soil moisture and vegetation, and analyze climate data to identify patterns and trends at various temporal and spatial scales. Table 4 is shown below.

Conclusions

In conclusion, wavelet analysis has emerged as a highly effective and versatile tool for image denoising, offering several advantages and techniques that make it a preferred choice in many applications.
First and foremost, wavelet analysis excels in its ability to perform multiresolution analysis, allowing it to capture and represent image information at various scales. This capability is crucial when dealing with images that contain both fine details and global structures, as it permits the selective removal of noise while preserving essential image features [64].
Moreover, wavelets provide excellent localization properties in both the time and frequency domains. Unlike traditional Fourier-based methods, wavelet analysis enables precise pinpointing of noise and image details, which is invaluable when the temporal and spectral localization of features is essential.
Wavelet analysis is adaptable and flexible, offering a range of wavelet functions with different properties, such as Daubechies, Symlet, and Coiflet wavelets. This flexibility allows practitioners to choose the most suitable wavelet for their specific denoising task and image characteristics.
Furthermore, wavelet-based denoising methods have demonstrated their effectiveness in various applications, including medical imaging, satellite image processing, and digital photography. These techniques have played a crucial role in enhancing image quality for accurate analysis and interpretation, making them indispensable in many fields [65].
In summary, wavelet analysis for image denoising is a powerful and versatile approach that leverages its multiresolution analysis, localization properties, adaptability, and proven effectiveness to remove noise while preserving image details. As the demand for high-quality image data continues to grow across various domains, wavelet-based image denoising techniques will remain a valuable tool for researchers, engineers, and practitioners striving to extract meaningful information from noisy images.

Funding

This research did not receive any grants.

Acknowledgment

We thank all the anonymous reviewers for their hard reviewing work.

References

  1. S. Hu, G. S. Hu, G. Hang, W. Xiaoyu, and L. Pengjie, "Two families of self-adjusting spectral hybrid DL conjugate gradient methods and applications in image denoising," Applied Mathematical Modelling, vol. 118, pp. 393-411, 2023.
  2. Y. Ning, H. Y. Ning, H. Libo, Z. Daming, and S. Weiwei, "Research on Image Denoising in Edge Detection Based on Wavelet Transform," Applied Sciences, vol. 13, no. 3, p. 1837, 2023.
  3. Kotwal, S.; Rani, P.; Arif, T.; Manhas, J. Machine Learning and Deep Learning Based Hybrid Feature Extraction and Classification Model Using Digital Microscopic Bacterial Images. SN Comput. Sci. 2023, 4, 1–13. [Google Scholar] [CrossRef]
  4. Arshad, T.; Zhang, J.; Ullah, I.; Ghadi, Y.Y.; Alfarraj, O.; Gafar, A. Multiscale Feature-Learning with a Unified Model for Hyperspectral Image Classification. Sensors 2023, 23, 7628. [Google Scholar] [CrossRef]
  5. B. Brittney, "Computed tomography acquisition for veterinary diagnostic imaging," The Veterinary Nurse, vol. 13, no. 8, pp. 378-382, 2022.
  6. Paul, E.; R. S., S. Modified convolutional neural network with pseudo-CNN for removing nonlinear noise in digital images. Displays 2022, 74. [Google Scholar] [CrossRef]
  7. M. Vicky, K. M. Vicky, K. Minseok, and C. Sewoon, "Prospects of Structural Similarity Index for Medical Image Analysis," Applied Sciences, vol. 12, no. 8, pp. 6308-6308, 2022.
  8. S. Piyush, S. S. Piyush, S. Vaibhav, and G. Bharat, "DIBS: distance- and intensity-based separation filter for high-density impulse noise removal," Signal, Image and Video Processing, vol. 17, no. 8, pp. 4181-4188, 2023.
  9. Zhang, Q.; Huang, C.; Yang, L.; Yang, Z. Salt and pepper noise removal method based on graph signal reconstruction. Digit. Signal Process. 2023, 135. [Google Scholar] [CrossRef]
  10. L. Xiaoyang, Y. L. Xiaoyang, Y. Xu, W. Shengqian, L. Bincheng, and X. Hao, "Performance Comparison of Piston Error Extraction Methods from Interference Patterns," Journal of Russian Laser Research, vol. 43, no. 5, pp. 634-643, 2022.
  11. F. Ying, S. F. Ying, S. Xia, L. Bangquan, and L. Hongli, "Optical coherence tomography image despeckling based on tensor singular value decomposition and fractional edge detection," Heliyon, vol. 9, no. 7, pp. e17735-e17735, 2023.
  12. Amarnath, A.; Manoharan, P.; Natarajan, B.; Alroobaea, R.; Alsafyani, M.; Baqasah, A.M.; Keshta, I.; Raahemifar, K. Medical Image Despeckling Using the Invertible Sparse Fuzzy Wavelet Transform with Nature-Inspired Minibatch Water Wave Swarm Optimization. Diagnostics 2023, 13, 2919. [Google Scholar] [CrossRef] [PubMed]
  13. S. Ping, "Identification of parameters of Poisson distributions by the extreme order statistics," Communications in Statistics - Simulation and Computation, vol. 52, no. 7, pp. 3156-3162, 2023.
  14. F. Saskia et al., "Sub-to-super-Poissonian photon statistics in cathodoluminescence of color center ensembles in isolated diamond crystals," Nanophotonics, vol. 12, no. 12, pp. 2231-2237, 2023.
  15. X. Jianhong, X. X. Jianhong, X. Hao, and W. Linyu, "Poisson noise image restoration method based on variational regularization," Signal, Image and Video Processing, vol. 17, no. 4, pp. 1555-1562, 2022.
  16. Alrwashdeh, M.; Kollár, Z. Analysis of quantization noise in FBMC transmitters. Digit. Signal Process. 2022, 131. [Google Scholar] [CrossRef]
  17. Ling, Y. Design and implementation of an analog signal isolation conditioning circuit. J. Physics: Conf. Ser. 2022, 2338. [Google Scholar] [CrossRef]
  18. Alevizakos, V. Process Capability and Performance Indices for Discrete Data. Mathematics 2023, 11, 3457. [Google Scholar] [CrossRef]
  19. W. Junjie, X. W. Junjie, X. Honglin, C. Xu, and L. Tao, "A 16-Bit 120 MS/s Pipelined ADC Using a Multi-Level Dither Technique," Electronics, vol. 11, no. 23, pp. 3979-3979, 2022.
  20. Huang, X.; Liu, J.; Xu, S.; Li, C.; Li, Q.; Tai, Y. A 3D ConvLSTM-CNN network based on multi-channel color extraction for ultra-short-term solar irradiance forecasting. Energy 2023, 272. [Google Scholar] [CrossRef]
  21. K. Hyun, "Adversarial image perturbations with distortions weighted by color on deep neural networks," Multimedia Tools and Applications, vol. 82, no. 9, pp. 13779-13795, 2022.
  22. S. Xin, Q. S. Xin, Q. Linbo, Z. Mozhi, S. Weiheng, and H. Xiaohai, "A video compression artifact reduction approach combined with quantization parameters estimation," The Journal of Supercomputing, vol. 78, no. 11, pp. 13564-13582, 2022.
  23. D. Lianrong, W. D. Lianrong, W. Yuhang, C. Langning, and Z. Tiange, "The Role of the Hidden Color Channel in Some Interesting Dibaryon Candidates," Symmetry, vol. 15, no. 2, pp. 446-446, 2023.
  24. Naderi, K.; Kosary, M.; Sharifi, M.A.; Farzaneh, S. A Novel Time–Frequency Approach Based on the Noise Characterization for Structural Health Monitoring (SHM) Using GNSS Observations. J. Surv. Eng. 2023, 149. [Google Scholar] [CrossRef]
  25. Li, F.; Fang, F.; Li, Z.; Zeng, T. Single image noise level estimation by artificial noise. Signal Process. 2023, 213. [Google Scholar] [CrossRef]
  26. Wang, Z.; Huang, M.; Qian, L.; Sun, Y.; Lu, X.; Zhao, W.; Zhang, Z.; Wang, G.; Zhao, Y. Near-Space Wide-Area and High-Resolution Imaging System Design and Implementation. Sensors 2023, 23, 6454. [Google Scholar] [CrossRef] [PubMed]
  27. Zhang, B.; Li, M.; Zhou, C.; Yang, Q.; Wang, L.; Yuan, B. Endoscopic Image Denoising Algorithm Based on Spatial Attention UNet. J. Physics: Conf. Ser. 2022, 2400, 012026. [Google Scholar] [CrossRef]
  28. Dutta, S.; Dutta, S.; Basarab, A.; Basarab, A.; Georgeot, B.; Georgeot, B.; Kouamé, D.; Kouamé, D. A Novel Image Denoising Algorithm Using Concepts of Quantum Many-Body Theory. Signal Process. 2022, 201. [Google Scholar] [CrossRef]
  29. Nabahat, M.; Khiyabani, F.M.; Navmipour, N.J. Optimization of bilateral filter parameters using a whale optimization algorithm. Res. Math. 2022, 9. [Google Scholar] [CrossRef]
  30. Jia, M.; Xu, J.; Yang, R.; Li, Z.; Zhang, L.; Wu, Y. Three filters for the enhancement of the images acquired from fluorescence microscope and weak-light-sources and the image compression. Heliyon 2023, 9, e20191. [Google Scholar] [CrossRef]
  31. Lam, C.-N.; Niculescu, S.; Bengoufa, S. Monitoring and Mapping Floods and Floodable Areas in the Mekong Delta (Vietnam) Using Time-Series Sentinel-1 Images, Convolutional Neural Network, Multi-Layer Perceptron, and Random Forest. Remote. Sens. 2023, 15, 2001. [Google Scholar] [CrossRef]
  32. Shahtahmassebi, A.R.; Liu, M.; Li, L.; Wu, J.; Zhao, M.; Chen, X.; Jiang, L.; Huang, D.; Hu, F.; Huang, M.; et al. De-noised and contrast enhanced KH-9 HEXAGON mapping and panoramic camera images for urban research. Sci. Remote. Sens. 2023, 7. [Google Scholar] [CrossRef]
  33. R, N.; B, L. Development of Wavelet Transform-Based Image Fusion Technique with Improved PSNR for CT and PET Images in Comparison with Discrete Cosine Transform-Based Image Fusion Technique. ECS Trans. 2022, 107, 13185–13193. [Google Scholar] [CrossRef]
  34. M. Vicky, K. M. Vicky, K. Minseok, and C. Sewoon, "Prospects of Structural Similarity Index for Medical Image Analysis," Applied Sciences, vol. 12, no. 8, pp. 3754-3754, 2022.
  35. Wang, S.-H.; Wu, X.; Zhang, Y.-D.; Tang, C.; Zhang, X. Diagnosis of COVID-19 by Wavelet Renyi Entropy and Three-Segment Biogeography-Based Optimization. Int. J. Comput. Intell. Syst. 2020, 13, 1332–1344. [Google Scholar] [CrossRef]
  36. Regaya, Y.; Amira, A.; Dakua, S.P. Towards developing a segmentation method for cerebral aneurysm using a statistical multiresolution approach. Egypt. J. Neurosurg. 2023, 38, 1–14. [Google Scholar] [CrossRef]
  37. Jin, Y.; Qin, C.; Liu, J.; Liu, Y.; Li, Z.; Liu, C. A novel deep wavelet convolutional neural network for actual ECG signal denoising. Biomed. Signal Process. Control. 2024, 87. [Google Scholar] [CrossRef]
  38. X. Fusong, Z. X. Fusong, Z. Zhiqiang, L. Yun, and Z. Jian, "Image thresholding segmentation based on weighted Parzen-window and linear programming techniques," Scientific Reports, vol. 12, no. 1, pp. 13635-13635, 2022.
  39. Wang, H.; Yang, S.; Liu, Y.; Li, Q. Compressive sensing reconstruction for rolling bearing vibration signal based on improved iterative soft thresholding algorithm. Measurement 2023, 210. [Google Scholar] [CrossRef]
  40. Wang, S.-H.; Zhang, Y.-D.; Yang, M.; Liu, B.; Ramirez, J.; Gorriz, J.M. Unilateral sensorineural hearing loss identification based on double-density dual-tree complex wavelet transform and multinomial logistic regression. Integr. Comput. Eng. 2019, 26, 411–426. [Google Scholar] [CrossRef]
  41. Yuan, S.; Ende, M.v.D.; Liu, J.; Noh, H.Y.; Clapp, R.; Richard, C.; Biondi, B. Spatial Deep Deconvolution U-Net for Traffic Analyses With Distributed Acoustic Sensing. IEEE Trans. Intell. Transp. Syst. 2023, 25, 1913–1924. [Google Scholar] [CrossRef]
  42. Zhang, Y.; Wang, S.; Sui, Y.; Yang, M.; Liu, B.; Cheng, H.; Sun, J.; Jia, W.; Phillips, P.; Gorriz, J.M. Multivariate Approach for Alzheimer’s Disease Detection Using Stationary Wavelet Entropy and Predator-Prey Particle Swarm Optimization. J. Alzheimer's Dis. 2018, 65, 855–869. [Google Scholar] [CrossRef]
  43. Alimardani, R.; Rahideh, A.; Kia, S.H. Mixed Eccentricity Fault Detection for Induction Motors Based on Time Synchronous Averaging of Vibration Signals. IEEE Trans. Ind. Electron. 2023, 71, 3173–3181. [Google Scholar] [CrossRef]
  44. Wang, S.-H.; Zhang, Y.; Li, Y.-J.; Jia, W.-J.; Liu, F.-Y.; Yang, M.-M.; Zhang, Y.-D. Single slice based detection for Alzheimer’s disease via wavelet entropy and multilayer perceptron trained by biogeography-based optimization. Multimedia Tools Appl. 2016, 77, 10393–10417. [Google Scholar] [CrossRef]
  45. C. S. Ayala et al., "Why Daubechies wavelets are so successful," Journal of Intelligent & Fuzzy Systems, vol. 43, no. 6, pp. 6933-6938, 2022.
  46. D. Chenzhe, H. D. Chenzhe, H. Bin, and L. Ran, "Generalized matrix spectral factorization with symmetry and applications to symmetric quasi-tight framelets," Applied and Computational Harmonic Analysis, vol. 65, pp. 67-111, 2023.
  47. Li, X.; Zhang, B.; Wang, K.; Li, Z. A multi-image encryption-then-compression scheme based on parallel compressed sensing. Optik 2023, 290. [Google Scholar] [CrossRef]
  48. Wang, S.-H.; Muhammad, K.; Lv, Y.; Sui, Y.; Han, L.; Zhang, Y.-D. Identification of Alcoholism Based on Wavelet Renyi Entropy and Three-Segment Encoded Jaya Algorithm. Complexity 2018, 2018, 1–13. [Google Scholar] [CrossRef]
  49. K. Lana and L. Helena, "Wavelet analysis of laser Doppler microcirculatory signals: Current applications and limitations," Frontiers in Physiology, vol. 13, pp. 1076445-1076445, 2023.
  50. J. Yang and L. Zili, "Mitigating speckle noise in a laser Doppler vibrometer using Fourier analysis," Optics letters, vol. 47, no. 18, pp. 4742-4745, 2022.
  51. Kim, J.; Hasanien, H.M.; Tagayi, R.K. Investigation of noise suppression in experimental multi-cell battery string voltage applying various mother wavelets and decomposition levels in discrete wavelet transform for precise state-of-charge estimation. J. Energy Storage 2023, 73. [Google Scholar] [CrossRef]
  52. Wang, S.-H.; Phillips, P.; Dong, Z.-C.; Zhang, Y.-D. Intelligent facial emotion recognition based on stationary wavelet entropy and Jaya algorithm. Neurocomputing 2018, 272, 668–676. [Google Scholar] [CrossRef]
  53. Raj, N. An Improved Accuracy and Efficiency Based Defect Detection Method for Industrial Signal Processing. 2023 3rd Asian Conference on Innovation in Technology (ASIANCON). LOCATION OF CONFERENCE, IndiaDATE OF CONFERENCE; pp. 1–7.
  54. Wang, S.; Li, P.; Chen, P.; Phillips, P.; Liu, G.; Du, S.; Zhang, Y. Pathological Brain Detection via Wavelet Packet Tsallis Entropy and Real-Coded Biogeography-based Optimization. Fundam. Informaticae 2017, 151, 275–291. [Google Scholar] [CrossRef]
  55. Mineo, T.; Shouno, H. Improving sign-algorithm convergence rate using natural gradient for lossless audio compression. EURASIP J. Audio, Speech, Music. Process. 2022, 2022, 1–15. [Google Scholar] [CrossRef]
  56. Zhang, Y.; Nayak, D.; Yang, M.; Yuan, T.-F.; Liu, B.; Lu, H.; Wang, S. Detection of Unilateral Hearing Loss by Stationary Wavelet Entropy. CNS Neurol. Disord. - Drug Targets 2017, 16, 122–128. [Google Scholar] [CrossRef] [PubMed]
  57. J. Nishant, Y. J. Nishant, Y. Arvind, K. S. Yogesh, and B. Arun, "Analysis of Discrete Wavelet Transforms Variants for the Fusion of CT and MRI Images," The Open Biomedical Engineering Journal, vol. 15, no. Suppl-2, M9, pp. 204-212, 2021.
  58. Zhang, Y.-D.; Yang, Z.-J.; Lu, H.-M.; Zhou, X.-X.; Phillips, P.; Liu, Q.-M.; Wang, S.-H. Facial Emotion Recognition Based on Biorthogonal Wavelet Entropy, Fuzzy Support Vector Machine, and Stratified Cross Validation. IEEE Access 2016, 4, 8375–8385. [Google Scholar] [CrossRef]
  59. Lee, K.; Jeong, Y.; Joo, S.; Yoon, Y.S.; Han, S.; Baik, H. Outliers in financial time series data: Outliers, margin debt, and economic recession. Mach. Learn. Appl. 2022, 10. [Google Scholar] [CrossRef]
  60. S. Nicoletta, L. S. Nicoletta, L. Jonatan, M. Siniša, and T. Željka, "Block-Adaptive Rényi Entropy-Based Denoising for Non-Stationary Signals," Sensors, vol. 22, no. 21, pp. 8251-8251, 2022.
  61. H. Sebastian and H. Gerhard, "[Cardiovascular magnetic resonance imaging in patients with cardiac devices : Useful tool or just artifacts?]," Herzschrittmachertherapie & Elektrophysiologie, vol. 33, no. 3, pp. 278-282, 2022.
  62. Sun, Z.; Lu, H.; Chen, J.; Jiao, J. An Efficient Noise Elimination Method for Non-stationary and Non-linear Signals by Averaging Decomposed Components. Shock. Vib. 2022, 2022, 1–11. [Google Scholar] [CrossRef]
  63. Nagar, J.; Chaturvedi, S.K.; Soh, S.; Singh, A. A machine learning approach to predict the k-coverage probability of wireless multihop networks considering boundary and shadowing effects. Expert Syst. Appl. 2023, 226. [Google Scholar] [CrossRef]
  64. Agnes, S.A.; Solomon, A.A.; Karthick, K. Wavelet U-Net++ for accurate lung nodule segmentation in CT scans: Improving early detection and diagnosis of lung cancer. Biomed. Signal Process. Control. 2024, 87. [Google Scholar] [CrossRef]
  65. N. , S.; Buch, J.; Prince, A.A.; Pathak, S. De-noising of microwave reflectometry signal using maximal overlap discrete wavelet packet transform for plasma density measurement. Measurement 2023, 222. [Google Scholar] [CrossRef]
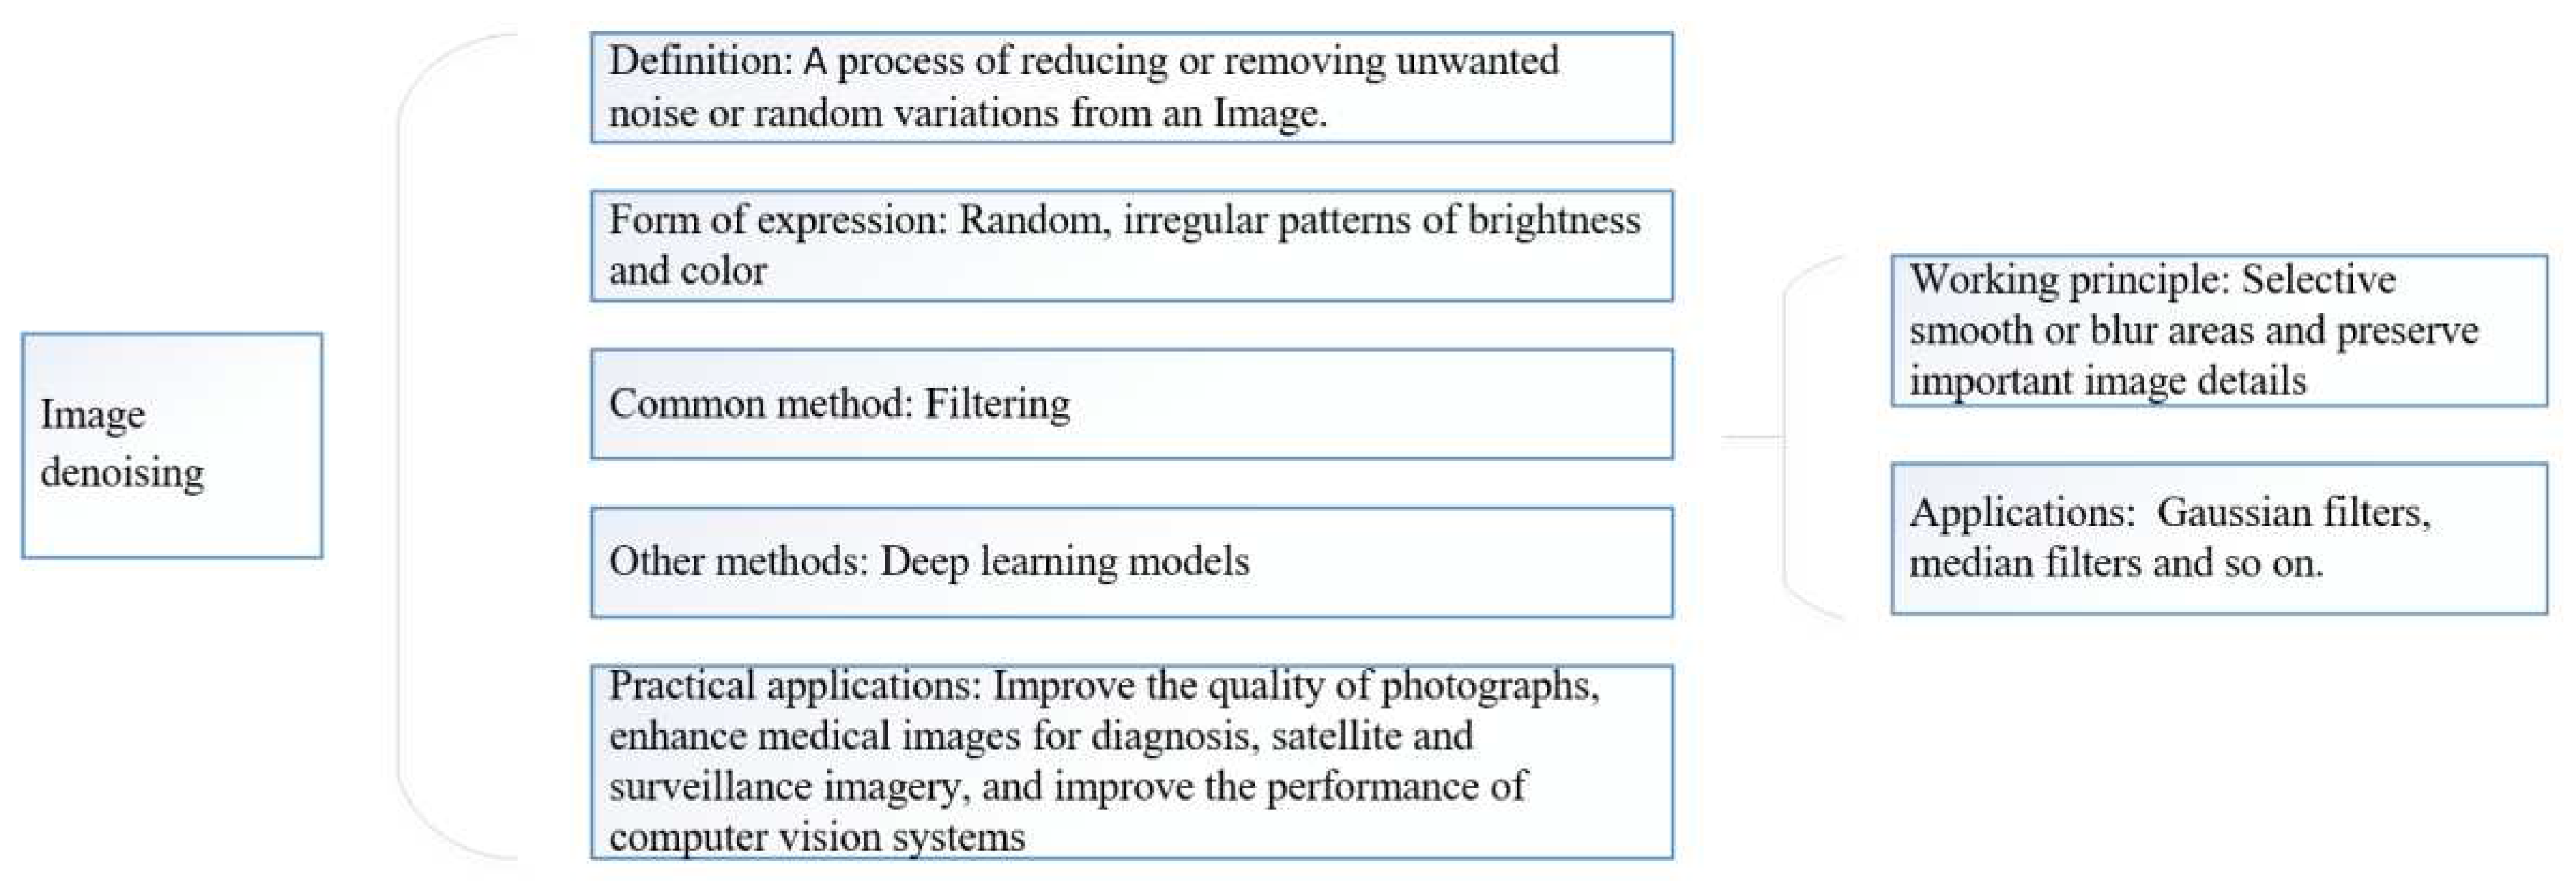
Figure 1. Introduction of image denoising.
Preprints 88101 g001
Figure 2. The workflow of image denoising.
Preprints 88101 g002
Figure 3. The workflow of Wavelet Analysis.
Preprints 88101 g003
Figure 4. The advantages of wavelet analysis.
Preprints 88101 g004
Table 1. Comparison of noise types.
Noise Types Noise Characteristics Cause of Noise Method of Noise Removal
Gaussian Noise Follows a Gaussian (normal) distribution Electronic sensor limitations, fluctuations in light, and other random factors Gaussian filters
Salt and Pepper Noise Random, isolated bright and dark pixels Malfunctioning pixels in the image sensor or transmission errors Difficulty
Speckle Noise Random graininess Interference patterns in the image formation process Preserve edge information while smoothing the noise
Poisson Noise Follows a Poisson distribution Low-light conditions Consider statistical properties of the noise
Quantization Noise A fixed pattern of discrete values or steps An analog signal is digitized with limited precision Dithering techniques
Color Noise Lead to color distortion or artifacts Sensor limitations, compression artifacts, or other factors Consider the correlation between color channels
Table 2. Comparison of common wavelet types.
Wavelet Types Wavelet Characteristics Wavelet Functions
Haar Wavelet A piecewise constant function Represent abrupt changes or discontinuities in data
Daubechies Wavelets (db) Come in different orders Good localization properties
Symlet Wavelets (sym) Offer better symmetry and smoothness properties Be used in applications where a compromise between smoothness and compact support is required
Biorthogonal Wavelets (bior) Come in pairs,offer flexibility Be used in image compression, denoising, and feature extraction
Coiflet Wavelets (coif) High smoothness and compact support Analyze signals with a high degree of smoothness
Table 3. The disadvantages of Wavelet Analysis.
Disadvantages Reasons Consequences of advantages
The analysis is highly dependent on user expertise. The choice of an appropriate requires a deep understanding of the data characteristics. Lead to misleading results.
Make it challenging to compare features at different scales or positions Wavelets are sensitive to both scale and translation. Complicate the interpretation of results
Capture non-stationary signals The finite extent of data. Impact the accuracy of features extracted from signals
The computation of wavelet transforms may be intensive and time-consuming. Large amount of data. Hinder its practical application in real-time or high-throughput analysis.
Table 4. More application fields of Wavelet Analysis.
Application fields Functions Concrete examples
Biomedical Imaging Enhance image quality, reduce noise, and improve image reconstruction Diagnose and monitor of neurological and cardiac conditions
Geophysics and Seismology Help extract information about the timing and frequency content of seismic waves Locate underground oil and gas reservoirs
Image and Video Compression Play a vital role in image and video compression Achieve high compression ratios with minimal loss of image quality
Finance and Econometrics Identify patterns, trends, and irregularities in stock prices, currency exchange rates, and other financial data Provide insights into long-term trends and short-term fluctuations
Environmental Science and Remote Sensing Aid in processing and analyzing environmental data Detect changes in land use, monitor environmental variables and analyze climate data to identify patterns
Disclaimer/Publisher’s Note: The statements, opinions and data contained in all publications are solely those of the individual author(s) and contributor(s) and not of MDPI and/or the editor(s). MDPI and/or the editor(s) disclaim responsibility for any injury to people or property resulting from any ideas, methods, instructions or products referred to in the content.
Copyright: This open access article is published under a Creative Commons CC BY 4.0 license, which permit the free download, distribution, and reuse, provided that the author and preprint are cited in any reuse.
Prerpints.org logo

Preprints.org is a free preprint server supported by MDPI in Basel, Switzerland.

Subscribe

© 2024 MDPI (Basel, Switzerland) unless otherwise stated