Submitted:
21 October 2023
Posted:
23 October 2023
You are already at the latest version
Abstract
Keywords:
Introduction
Methodology
Data Analysis
- 1)
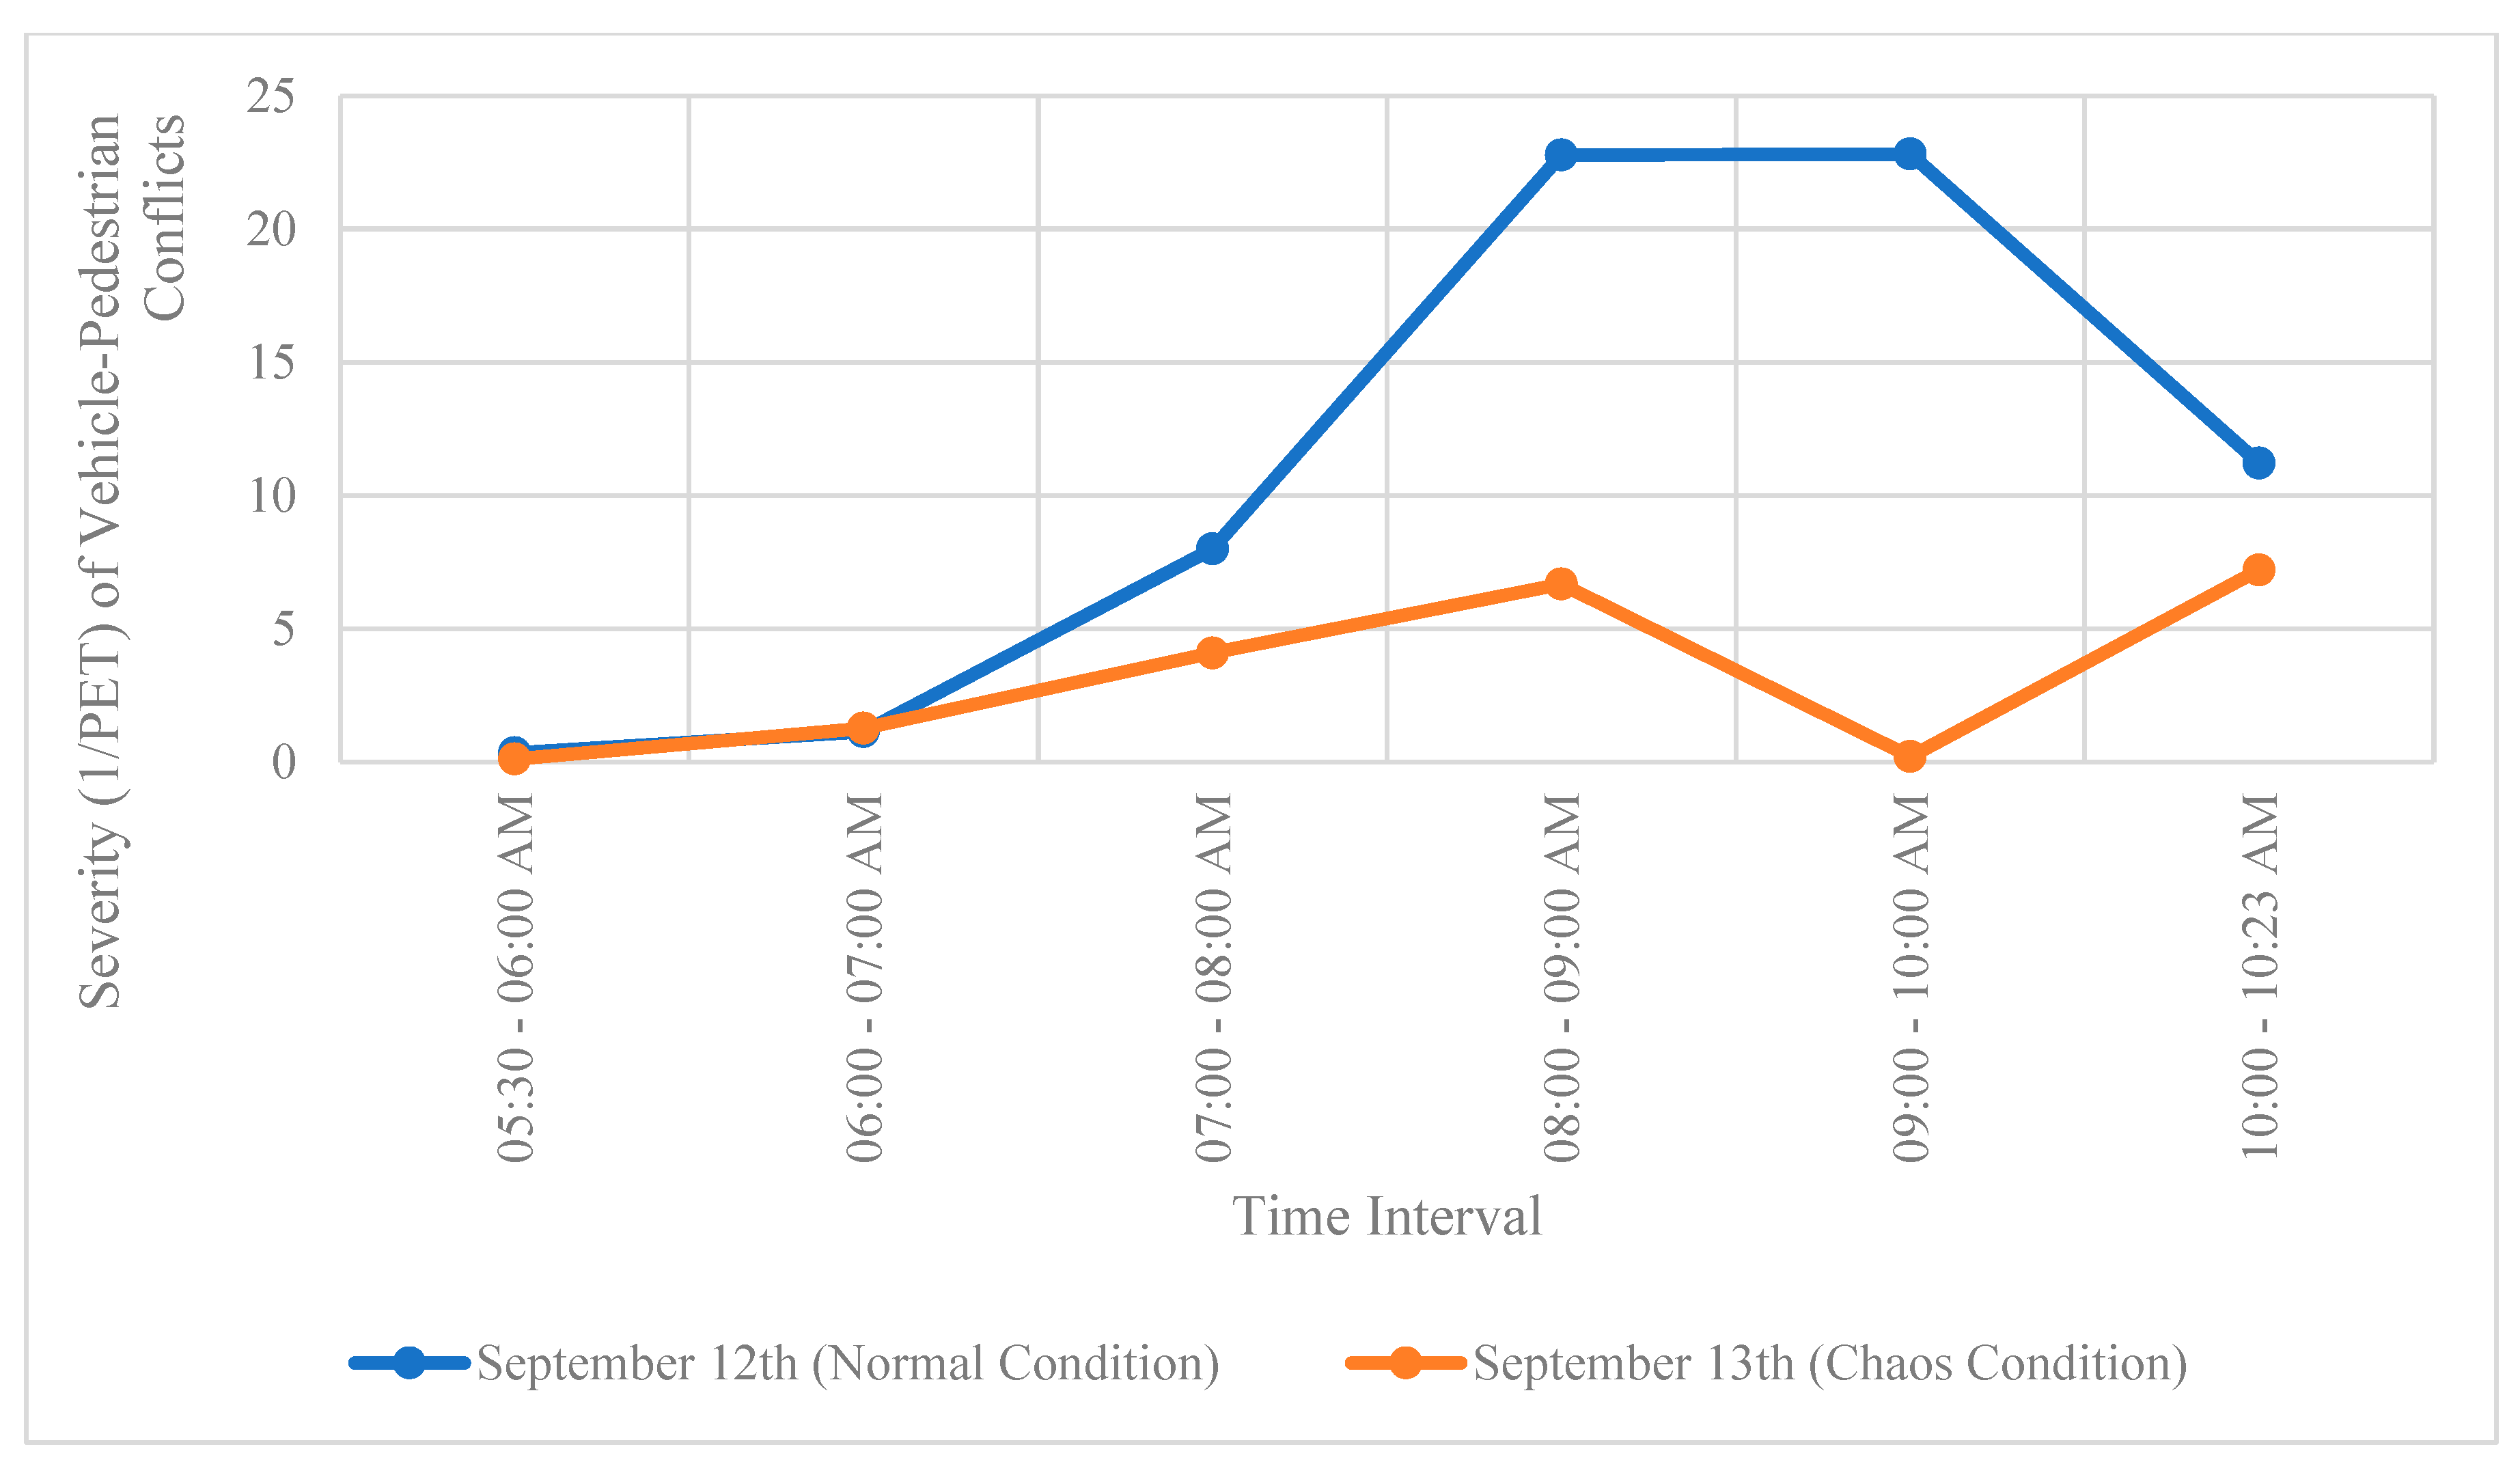
- Safety Consideration: PET is primarily a safety metric designed to minimize the risk of intersection-related accidents. It aims to provide a buffer for vehicles to clear the intersection safely, even if they are already in the intersection or approaching it when the signal changes to yellow.
- 2)
- Calculation: PET is typically calculated as the time difference between the onset of the yellow signal phase (when the signal changes from green to yellow) and the time when the rear of a vehicle completely clears the stop line or the intersection boundary.
- 3)
- Factors Influencing PET:
- Vehicle Speed: The speed at which a vehicle approaches and traverses the intersection directly affects its PET. Faster-moving vehicles have less PET.
- Intersection Size: The physical dimensions of the intersection, including the width of the lanes and the length of the crosswalk, influence how long it takes a vehicle to clear the intersection.
- Driver Behavior: Driver perception-reaction time and decision-making play a crucial role in PET. A vigilant driver is more likely to clear the intersection safely.
- Signal Timing: The duration of the yellow signal phase as well as the amber clearance time (the period between red and green signals when all directions are briefly red) are critical factors in determining PET.
- 4)
- Intersection Type: The type of signalized intersection can influence PET requirements. For instance, intersections with higher traffic volumes or complex geometries may require longer PET to ensure safe clearance.
- 5)
- Traffic Engineering Analysis: Traffic engineers use PET data to optimize signal timing plans. They aim to strike a balance between allowing vehicles to clear the intersection safely and maximizing traffic throughput.
- 1)
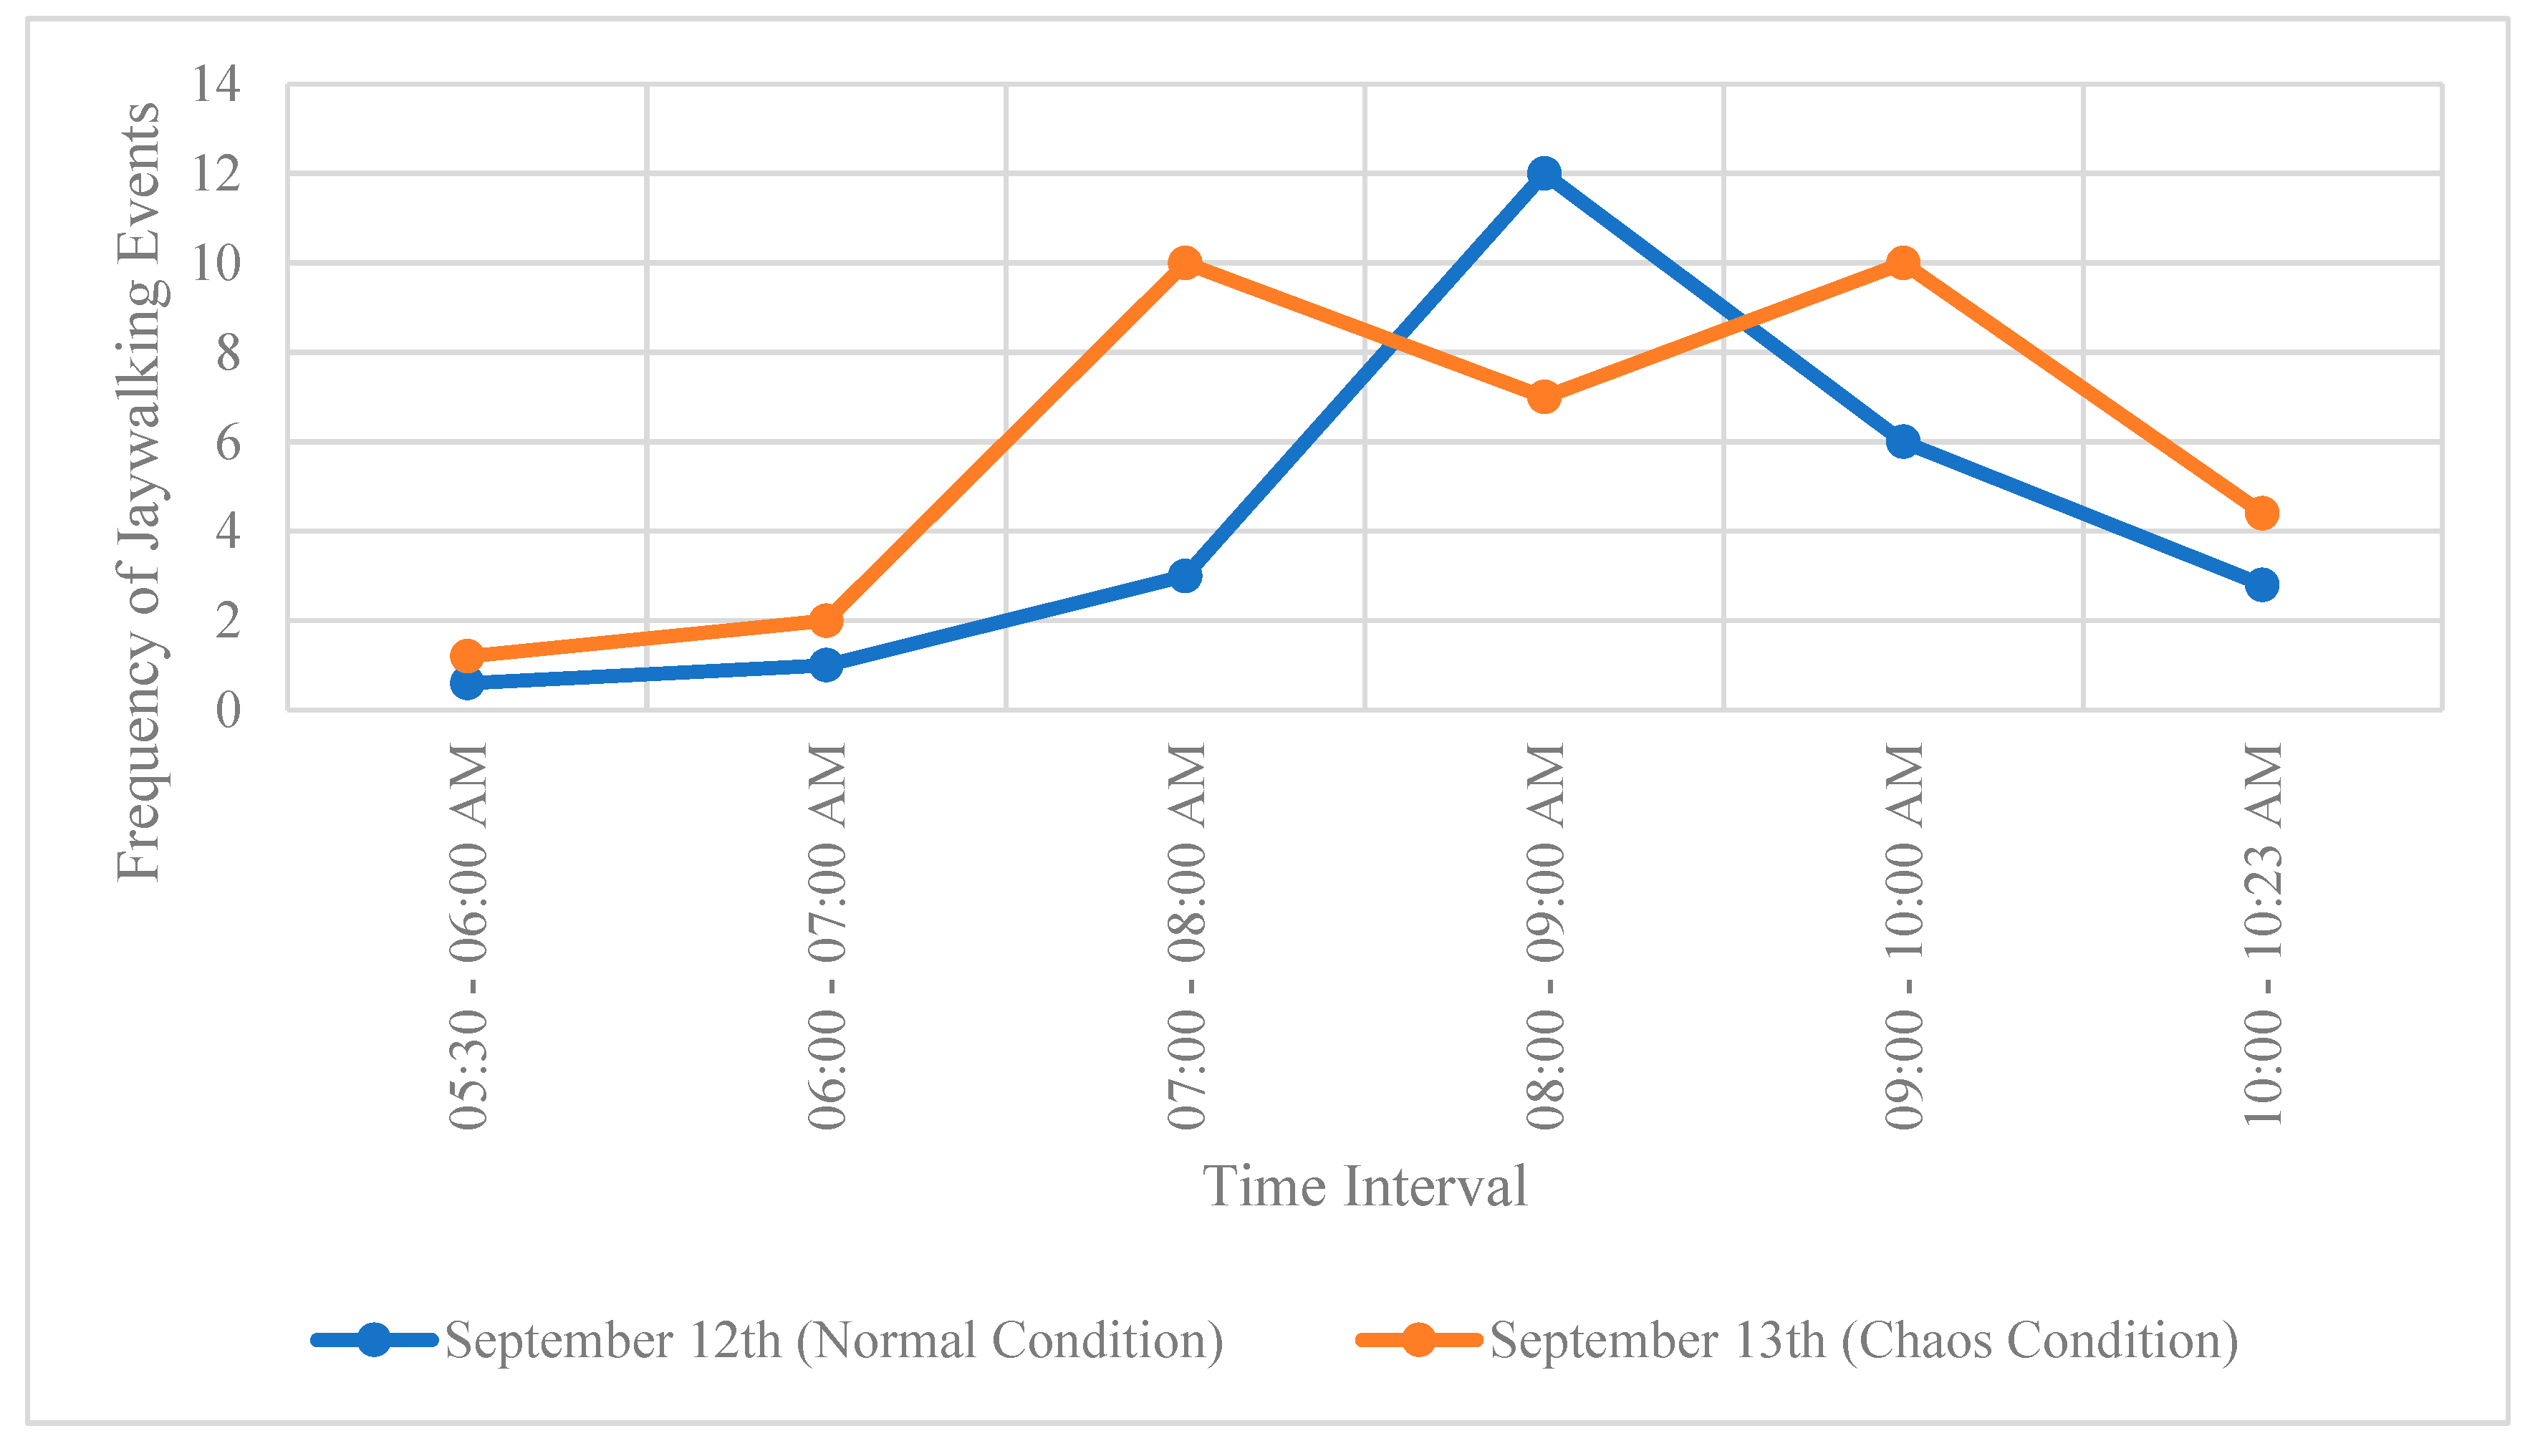
- Pedestrian Behavior: Jaywalking often occurs due to pedestrians' disregard for traffic signals, impatience, or a desire for more direct routes. Some may underestimate the risks associated with crossing outside of crosswalks.
- 2)
- Signal Timing: Inadequate signal timing, such as long pedestrian wait times or short crossing times, can lead pedestrians to ignore traffic signals and cross against the light.
- 3)
- Infrastructure: Lack of clearly marked crosswalks, poorly designed pedestrian facilities, and insufficient signage can encourage jaywalking behavior.
- 4)
- Safety Perception: Pedestrians may perceive certain intersections as unsafe due to high traffic crash rates or inadequate lighting, leading them to cross outside designated areas.
- 1)
- Increased Crash Risk: Jaywalking pedestrians are at a higher risk of being struck by vehicles, leading to injuries or fatalities.
- 2)
- Traffic Disruptions: Vehicles may be forced to brake suddenly or swerve to avoid jaywalkers, leading to traffic disruptions and potential rear-end collisions.
- 3)
- Legal Implications: Both pedestrians and drivers involved in jaywalking conflicts may face legal consequences, including fines, penalties, or liability in civil cases.
- 1)
- Education and Awareness: Public awareness campaigns can inform pedestrians about the risks of jaywalking and promote adherence to traffic signals and crosswalks.
- 2)
- Improved Infrastructure: Designing pedestrian-friendly infrastructure with well-marked crosswalks, countdown timers, and proper lighting can discourage jaywalking.
- 3)
- Signal Timing Adjustments: Signal timings should be optimized to minimize pedestrian wait times and ensure adequate crossing opportunities.
- 4)
- Enforcement: Law enforcement efforts, including issuing citations for jaywalking, can act as a deterrent and promote compliance with traffic rules.
- 5)
- Technological Solutions: Implementing pedestrian detection systems or pedestrian-activated signals can enhance pedestrian safety at high-risk intersections.
- 6)
- Urban Planning: Consideration of pedestrian safety in urban planning, including the placement of crosswalks and traffic calming measures, can reduce jaywalking conflicts.
Findings
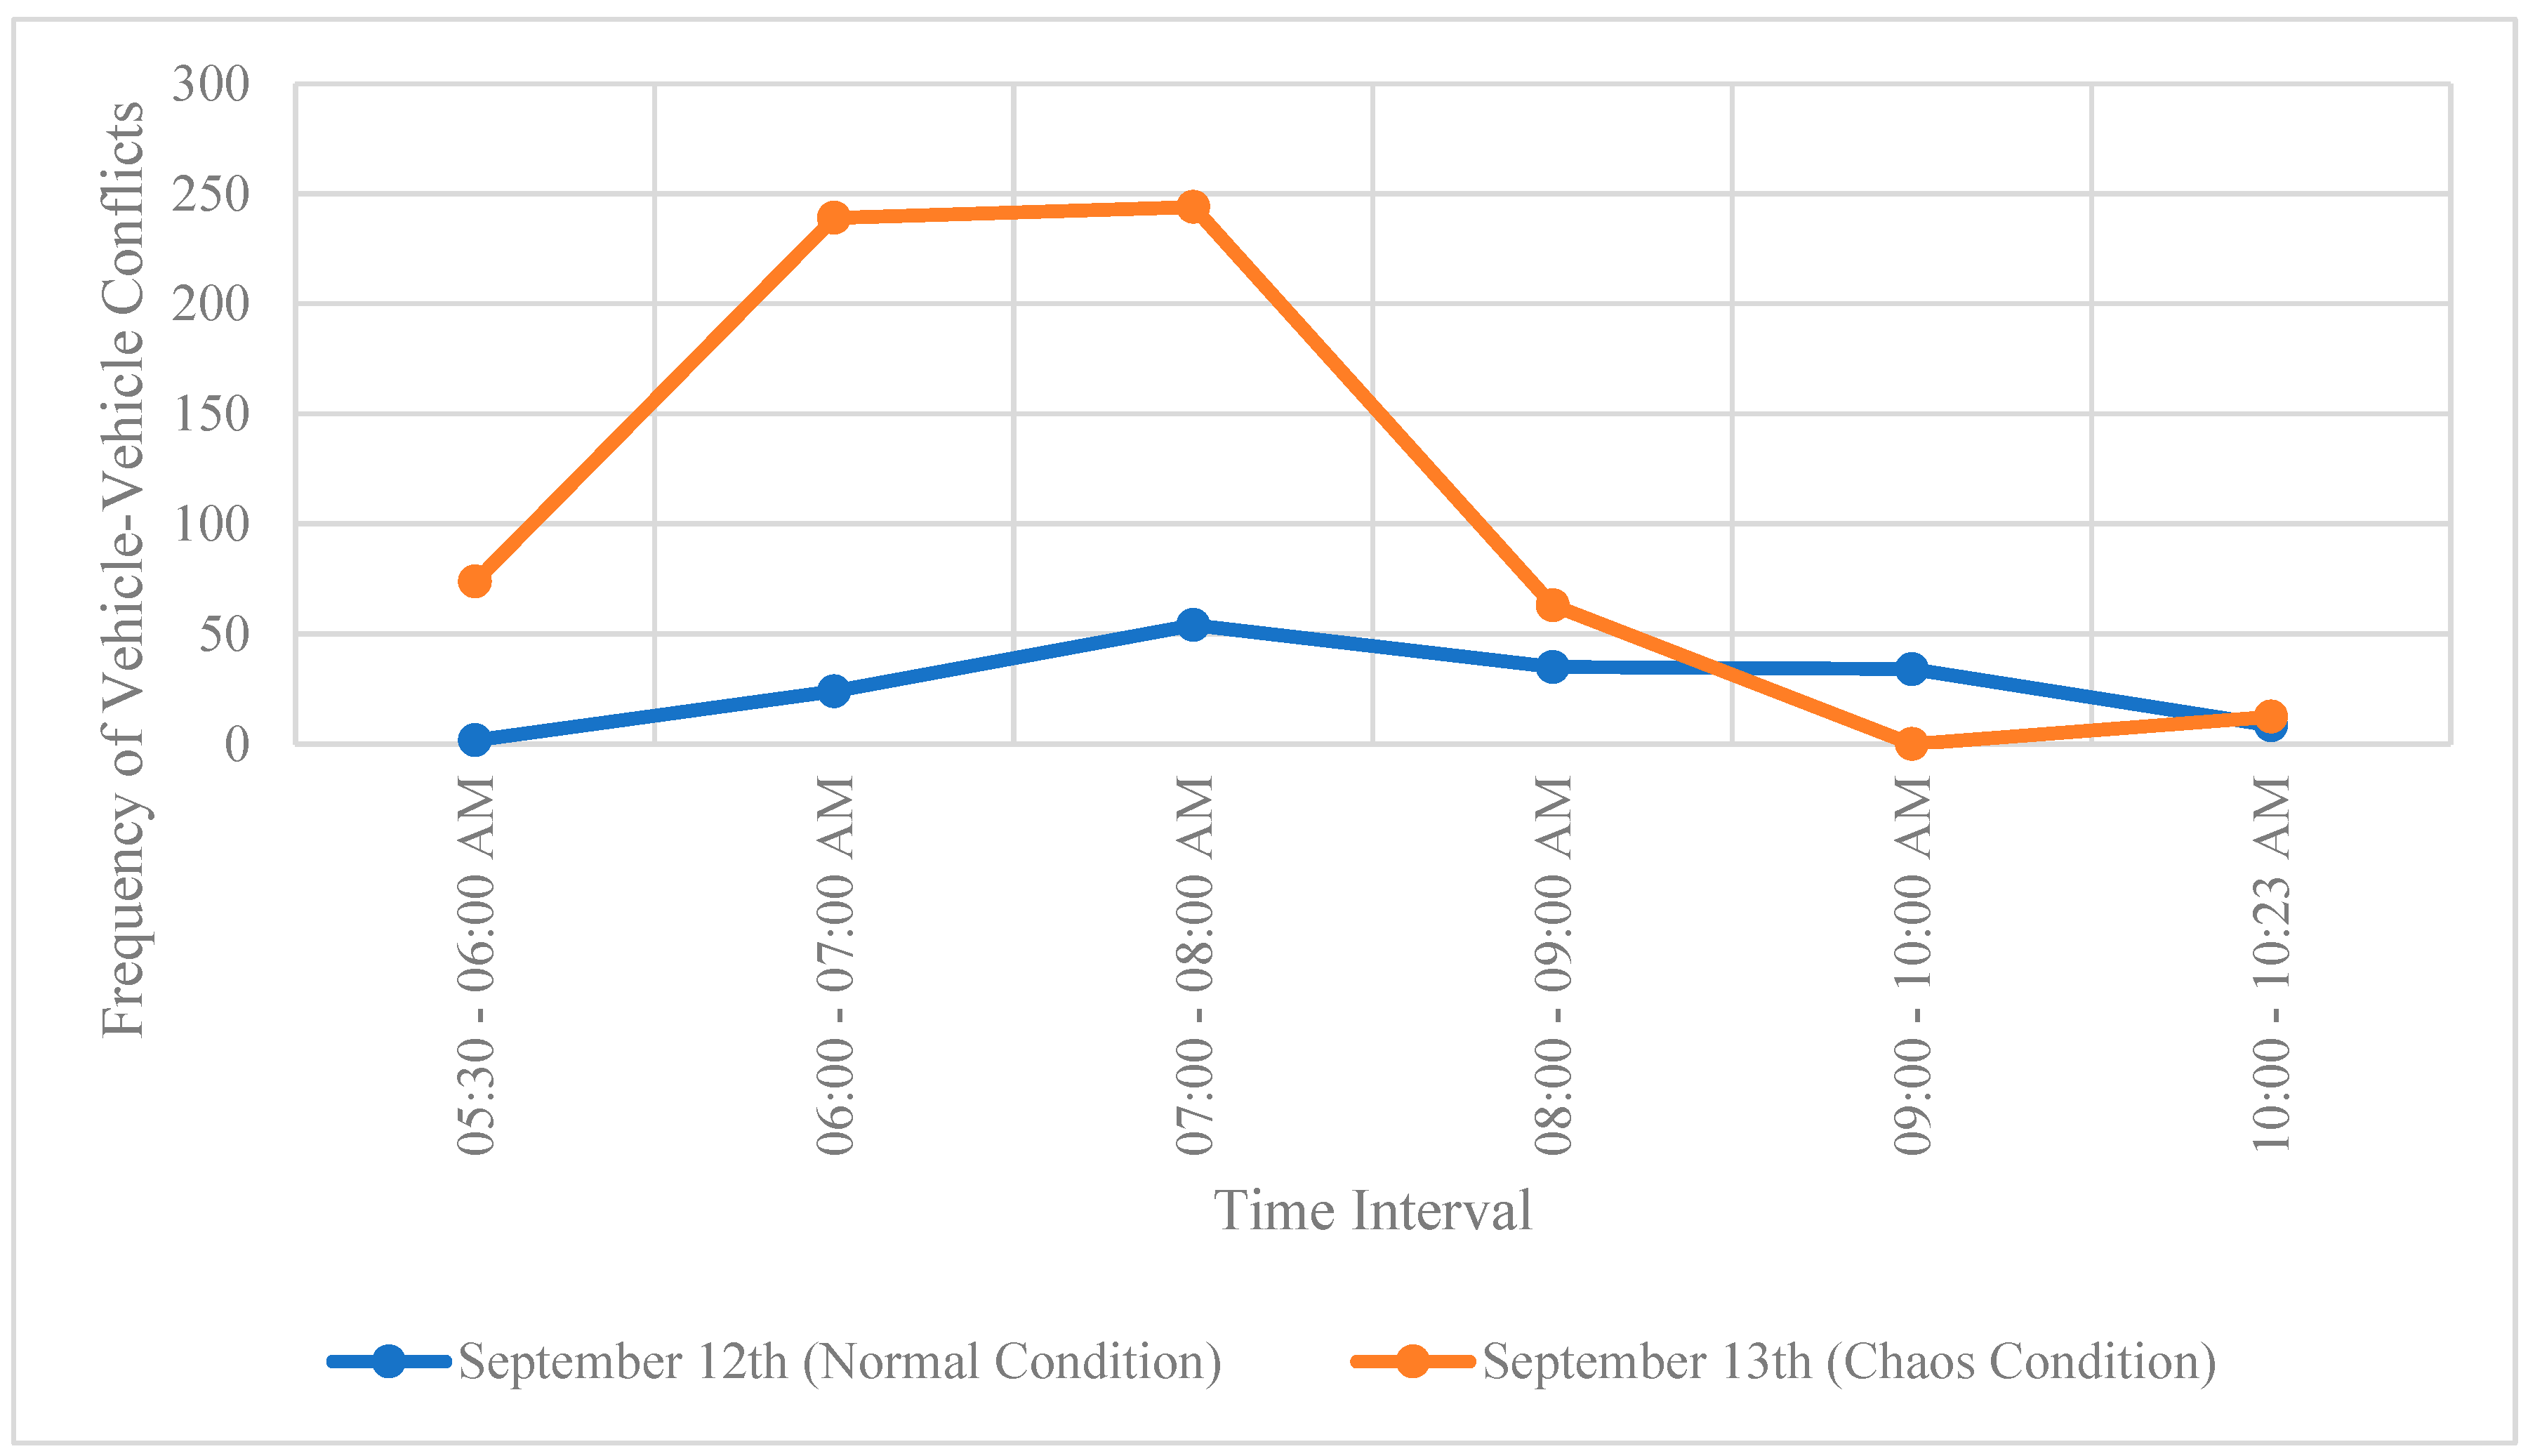
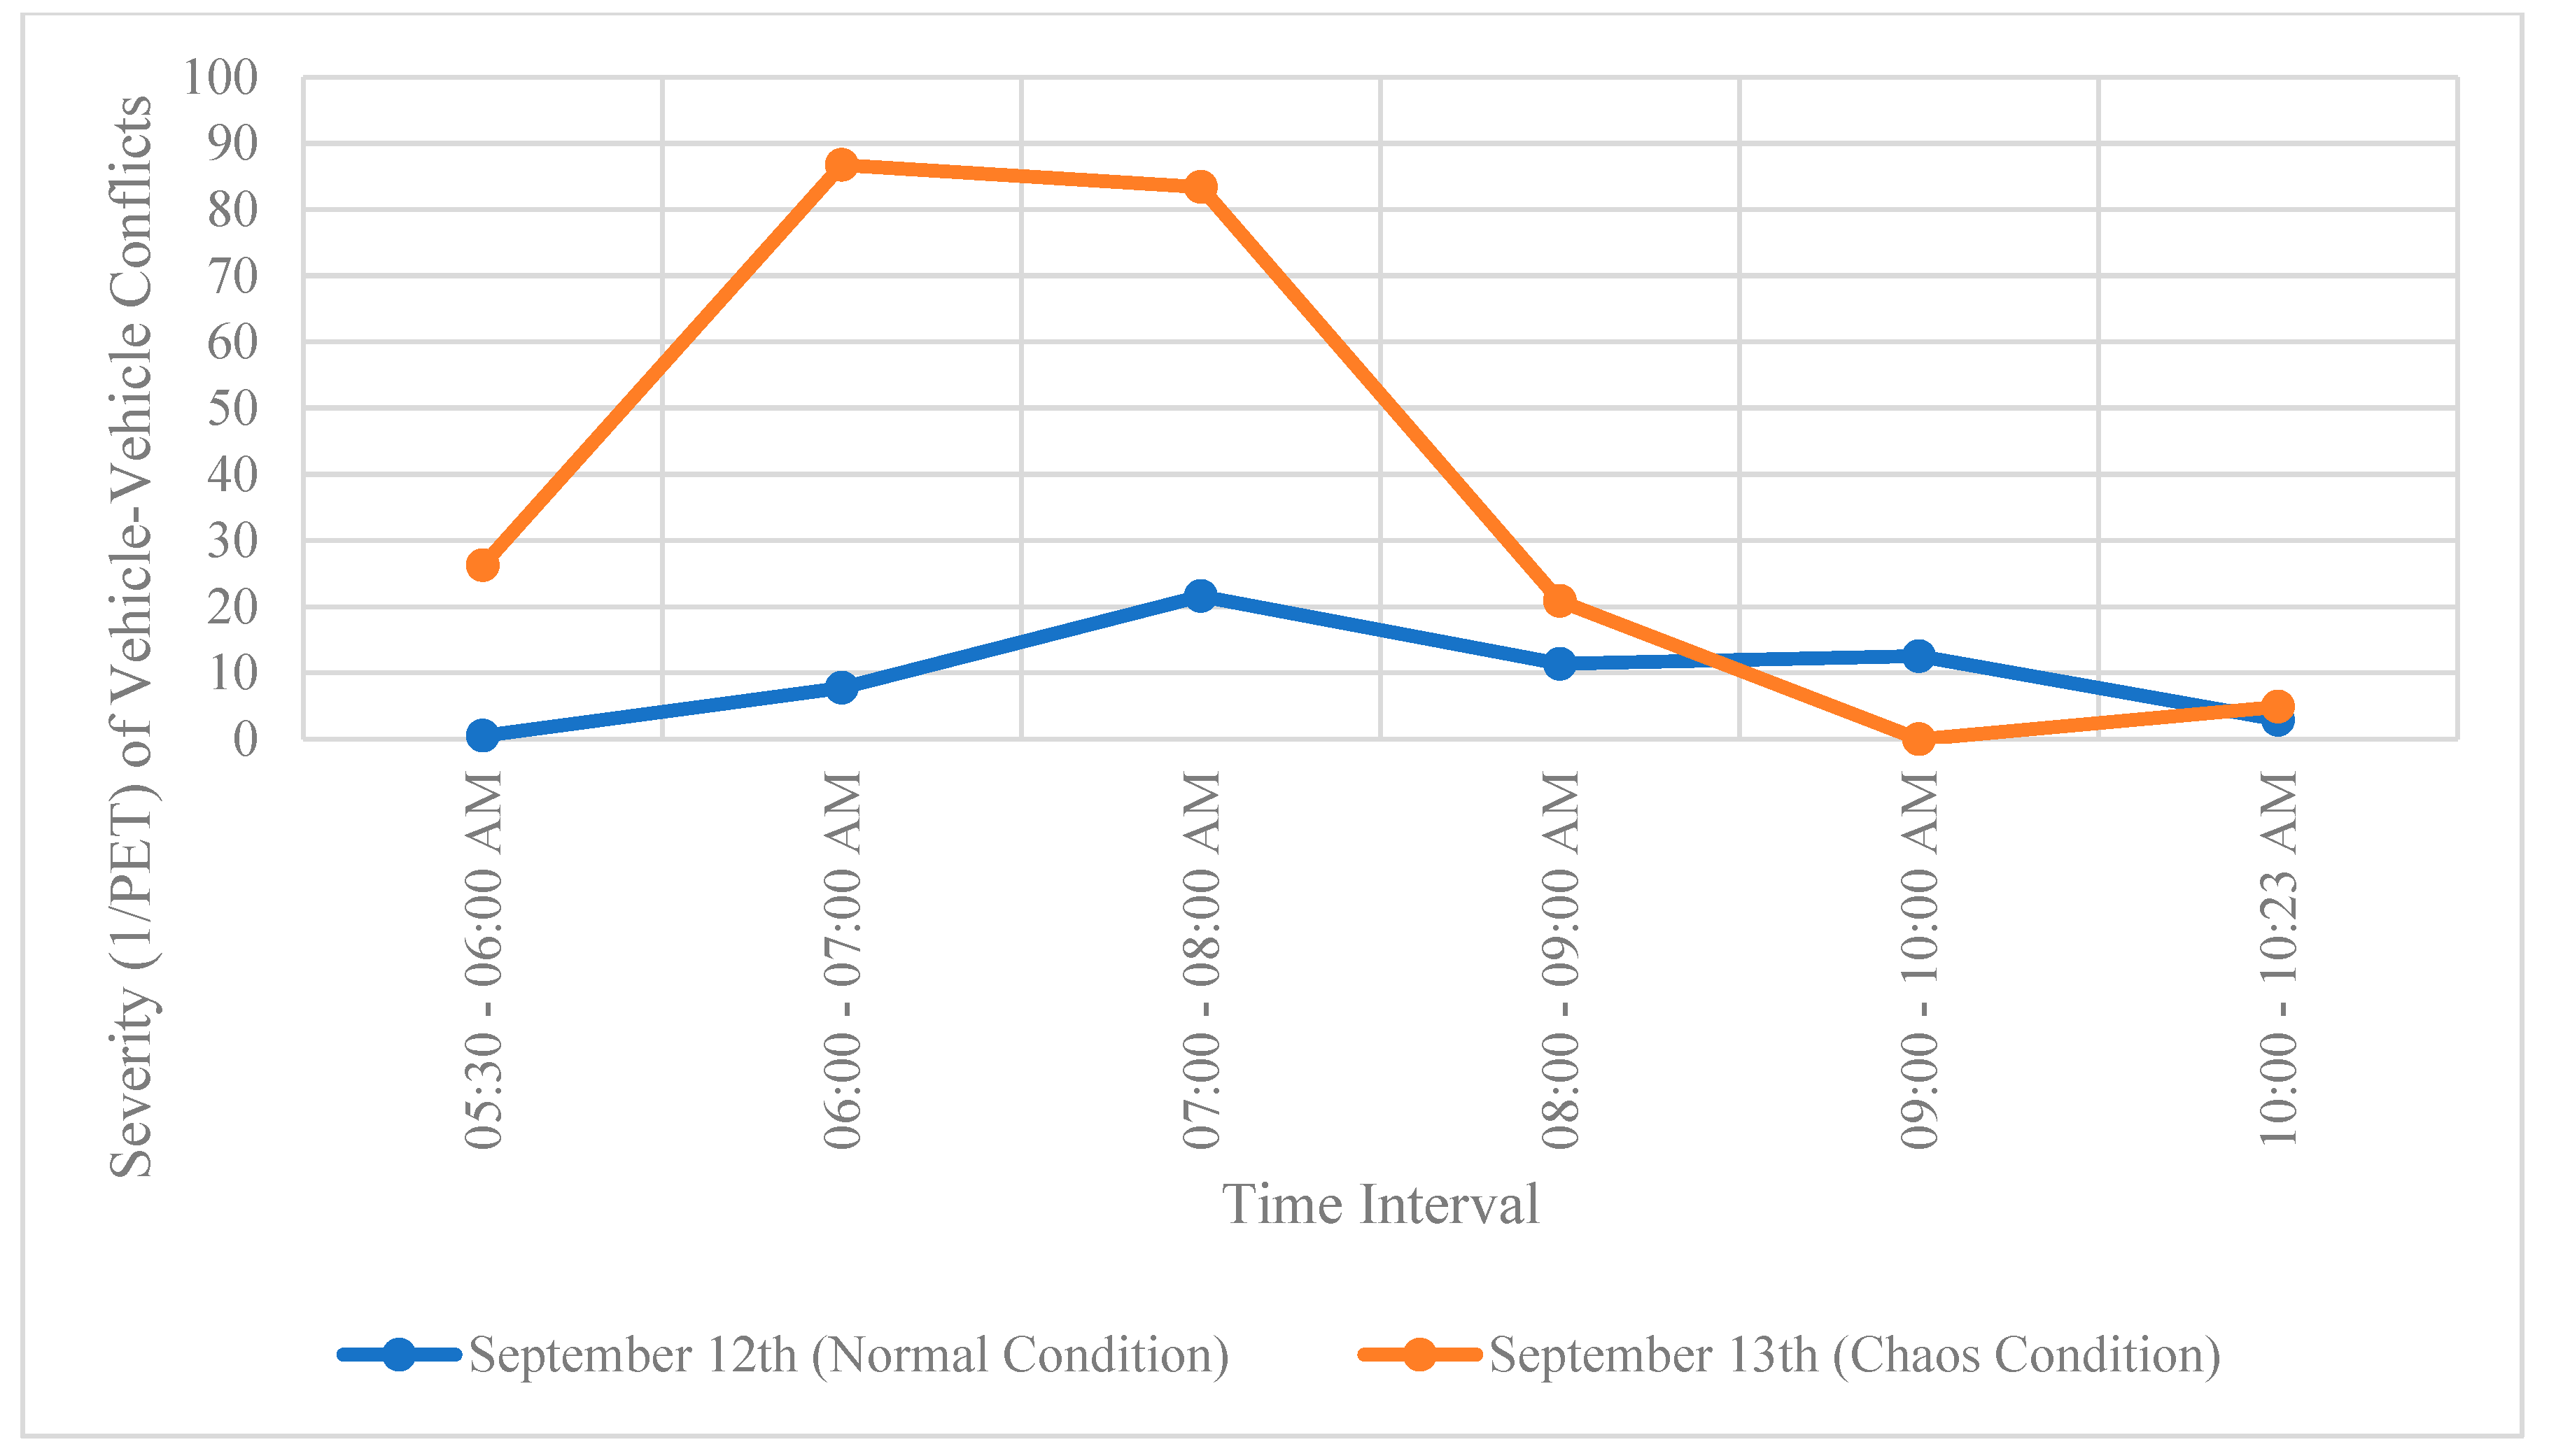
- Lack of Right-of-Way Clarity: Without functioning traffic signals, drivers may have difficulty determining who has the right of way at the intersection, especially in situations with multiple lanes or complex traffic patterns. This ambiguity can result in conflicts as drivers make decisions based on their perceptions.
- Increased Driver Stress: The absence of working signals can create confusion and stress among drivers, particularly in high-traffic areas. This stress can lead to impulsive or aggressive driving behaviors, which can escalate conflicts.
- Variation in Vehicle Speeds: Drivers may not adhere to speed limits or maintain consistent speeds when signals are not regulating traffic. This variation in vehicle speeds can increase the chances of rear-end collisions or conflicts at intersections.
- Reduced Predictability: Traffic signals provide a predictable and synchronized flow of vehicles, helping drivers anticipate when it's safe to proceed or stop. Without this predictability, drivers may not react uniformly, leading to conflicts.
- Intersection Blockage: When drivers approach an intersection without functioning signals, there is a risk of gridlock or intersection blockage if drivers from different directions attempt to enter the intersection simultaneously. This can result in conflicts as vehicles become trapped or struggle to maneuver around each other.
- Failure to Yield: In the absence of traffic signals, some drivers may fail to yield to other vehicles as required by traffic laws, leading to conflicts at the intersection.
- Increased Vigilance: Pedestrians are more alert and attentive to oncoming vehicular traffic, as they can no longer rely on signal indications for safe crossing. They pay closer attention to gaps in traffic and may wait for longer durations to find a suitable opportunity to cross safely.
- Hesitation: Due to the absence of clear right-of-way indications, pedestrians often hesitate before stepping into the intersection. They may make eye contact with drivers or seek non-verbal cues to assess whether it's safe to cross.
- Longer Crossing Times: Pedestrians may take more time to assess the traffic situation, which can lead to longer crossing times as they wait for larger gaps in traffic or for vehicles to come to a complete stop.
- Group Behavior: In some cases, pedestrians may choose to cross in groups, believing that there is safety in numbers. They might follow other pedestrians who appear confident in their crossing decisions.
- Use of Alternate Routes: In situations where signal failures persist or are perceived as dangerous, pedestrians may opt to use alternate routes, such as pedestrian overpasses or underpasses, if available, to avoid crossing at ground level.
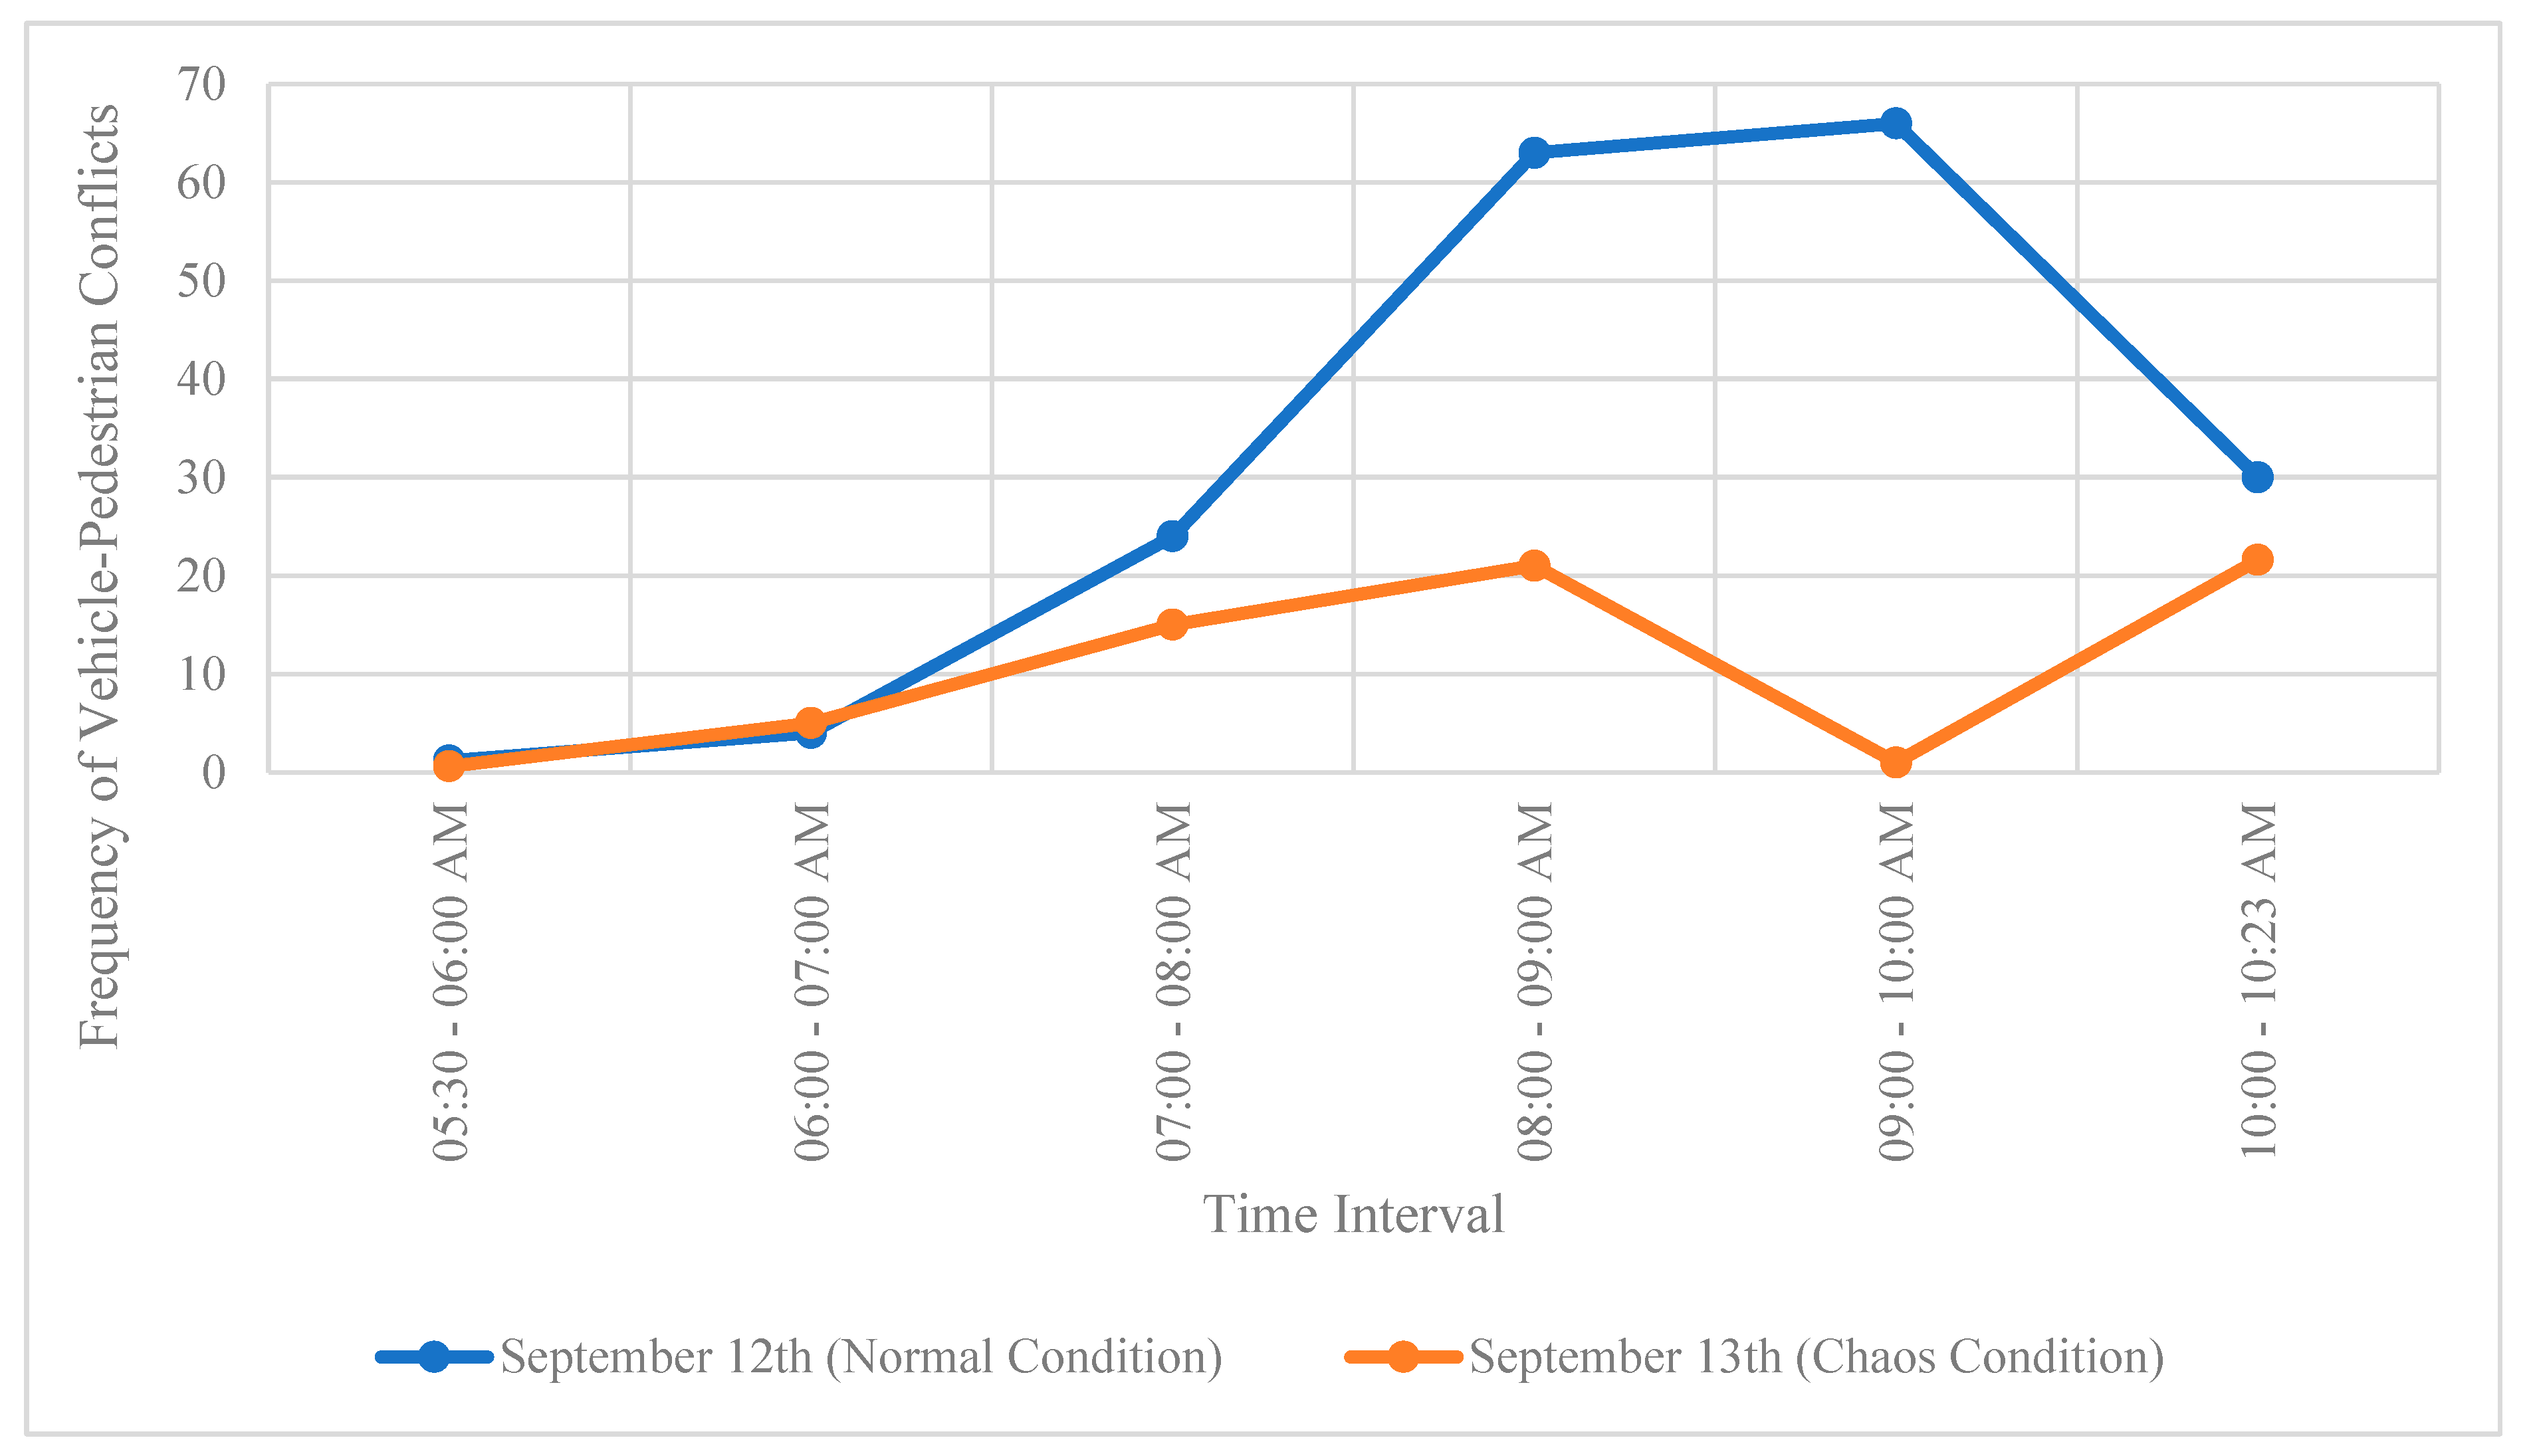
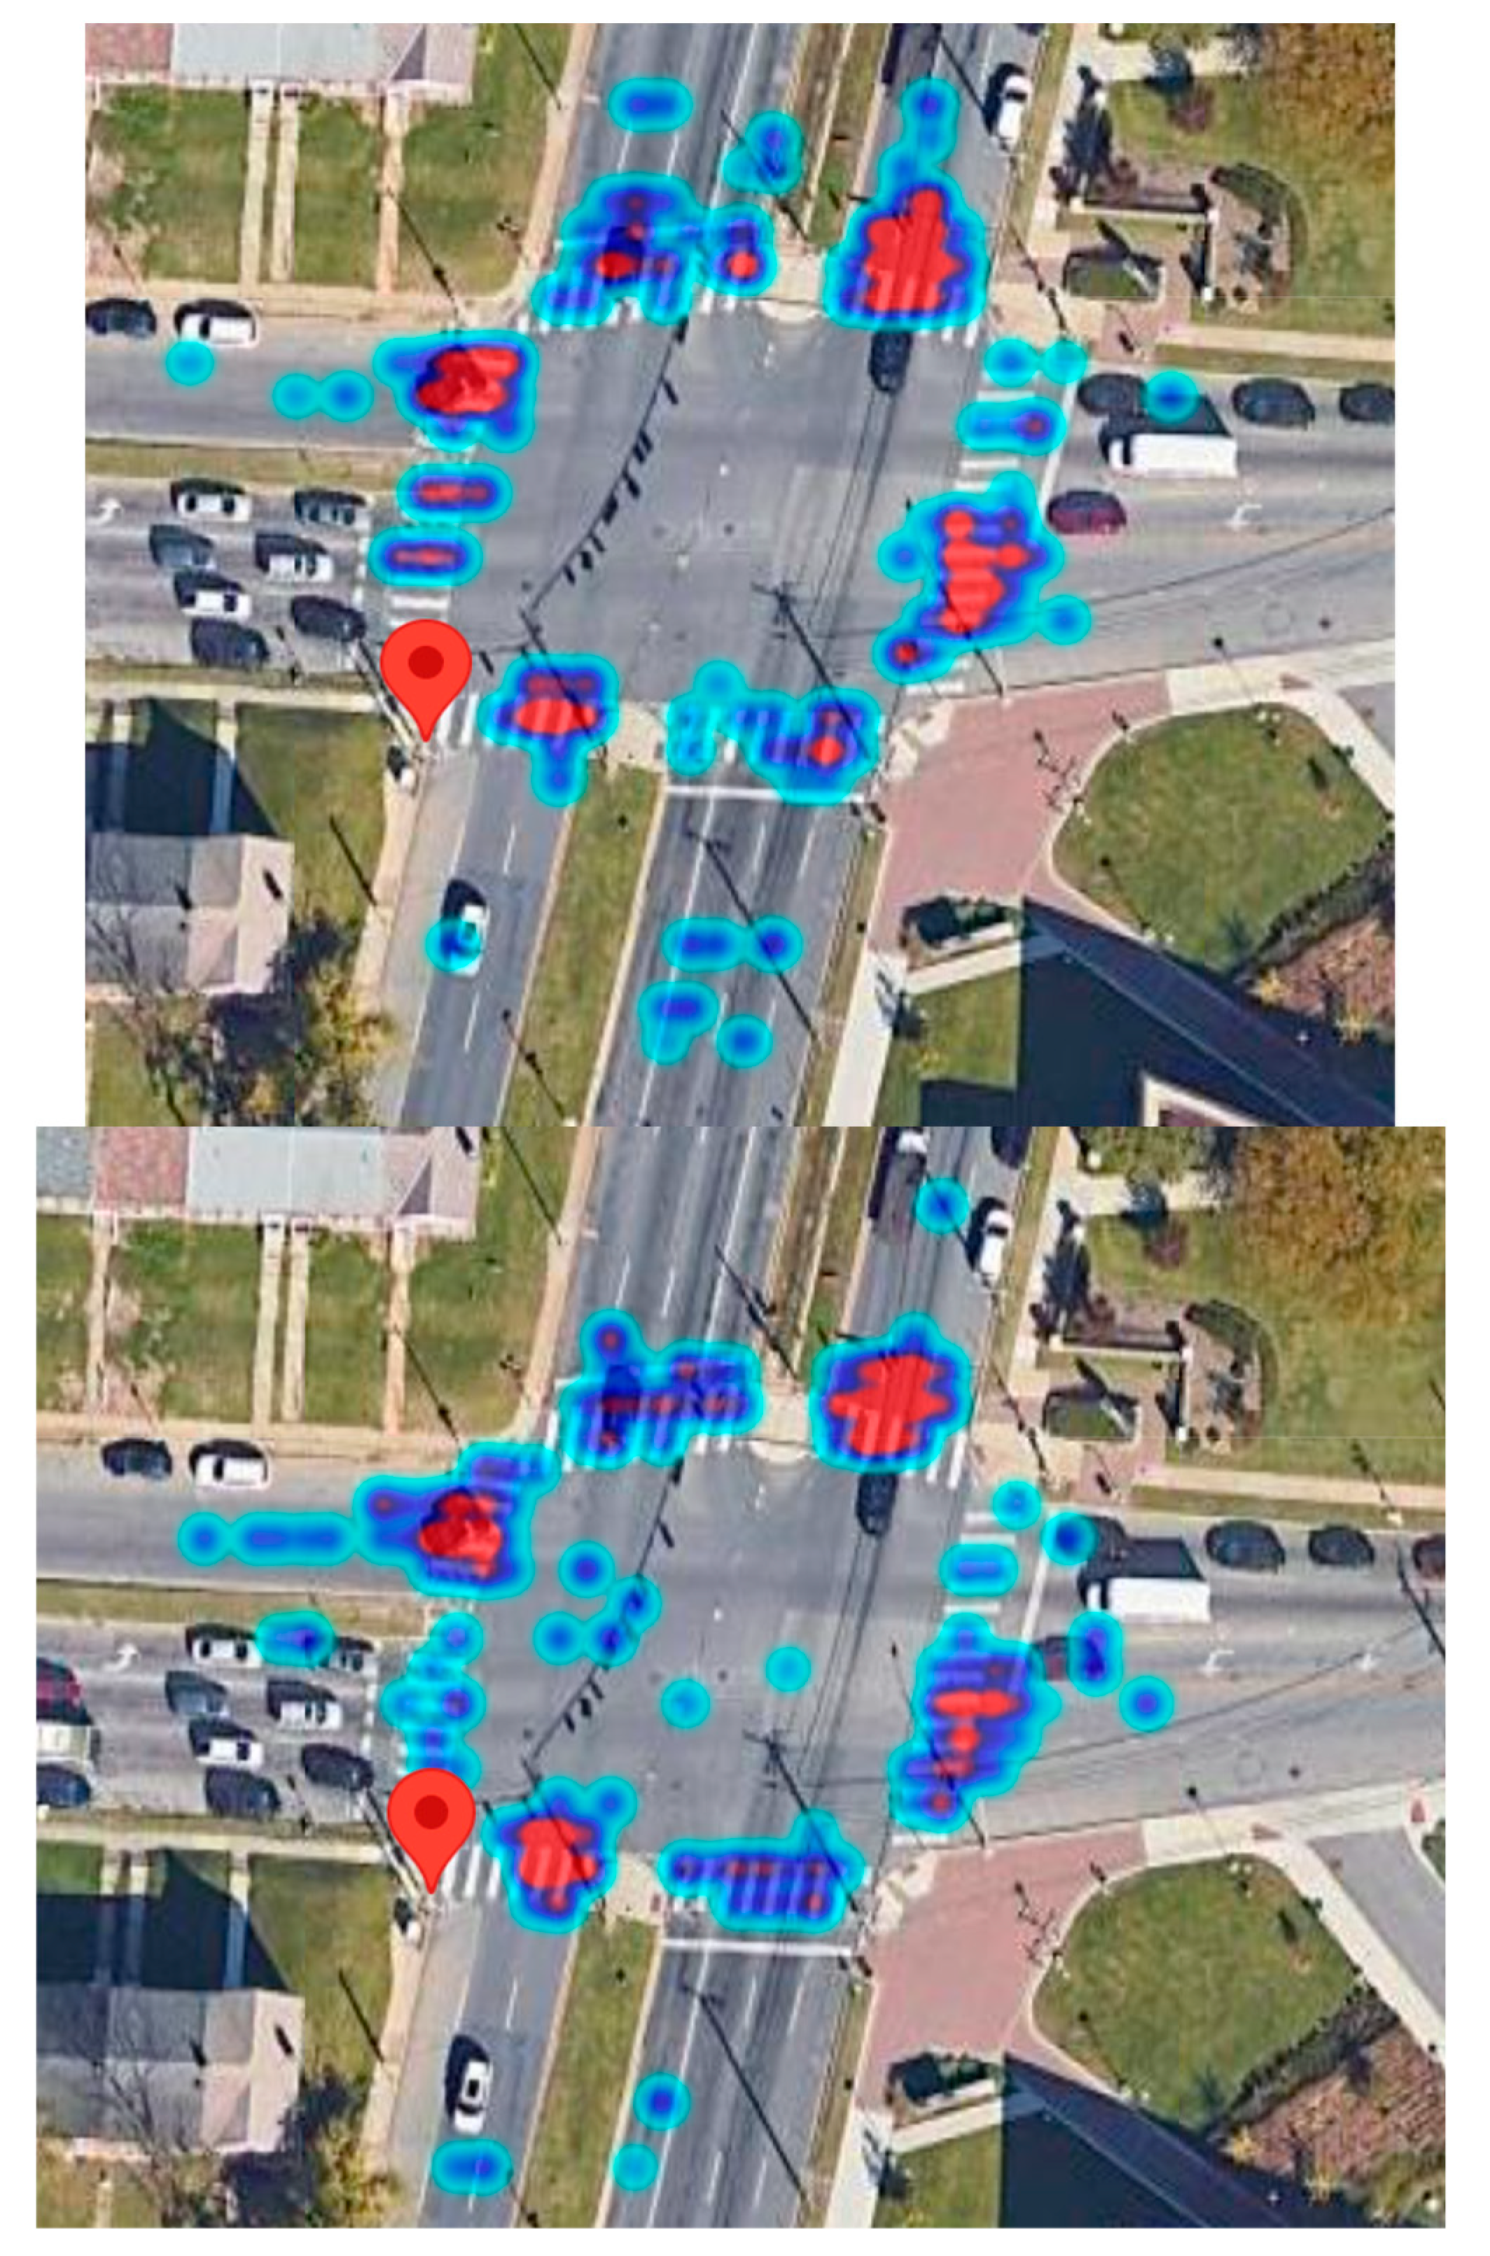
- Lack of Signalized Crossings: Pedestrians are accustomed to relying on traffic signals to safely cross intersections. When signals fail, pedestrians may still attempt to cross at designated crosswalks, assuming that drivers will yield as they typically would at signalized crossings. However, without functioning signals, drivers may not be aware of the pedestrian's intention, leading to conflicts.
- Ambiguity in Right-of-Way: The absence of working traffic signals can create confusion regarding right-of-way. Pedestrians may not know when it is safe to cross, and drivers may not know when to yield. This uncertainty can result in hesitations and misunderstandings that lead to conflicts.
- Driver Distraction and Impatience: In situations where signals are not functioning, drivers may become more distracted or impatient. This can lead to reduced attention to pedestrian crossings or aggressive driving behaviors, increasing the risk of conflicts with pedestrians.
- Reduced Visibility: Signal malfunctions can occur in various lighting and weather conditions, reducing visibility for both pedestrians and drivers. Reduced visibility makes it more challenging for pedestrians to assess oncoming traffic and for drivers to see pedestrians, increasing the likelihood of conflicts.
- Inconsistent Driver Behavior: In the absence of traffic signals, some drivers may not adhere to pedestrian right-of-way rules or may fail to yield to pedestrians. This inconsistency in driver behavior can lead to conflicts as pedestrians attempt to cross.
- Lack of Safe Alternatives: When signals fail, pedestrians may have limited alternatives for crossing the intersection safely, especially in densely populated urban areas. This can lead to pedestrians taking unnecessary risks to navigate the intersection, increasing the potential for conflicts.
- Increased Complexity of Intersections: At some signalized intersections, traffic signals are crucial for managing complex traffic patterns, multiple lanes, or turning movements. When signals fail, the intersection's complexity can overwhelm both pedestrians and drivers, making it difficult to anticipate and avoid conflicts.
- Lack of Signal Guidance: Traffic signals provide clear and organized guidance for both pedestrians and drivers. When signals malfunction or go dark, pedestrians may not have the usual visual cues indicating when it is safe to cross. This uncertainty can lead to pedestrians attempting to cross at inappropriate times.
- Impatience: In situations where signals are not functioning, pedestrians may become impatient due to longer wait times or confusion about when to cross. Impatient pedestrians may decide to jaywalk to save time or because they believe it is safe to cross when it may not be.
- Convenience: Pedestrians may choose to jaywalk simply for convenience, especially if the malfunctioning signal causes significant delays. They may not want to wait for a signal to turn green and opt to cross where it is more convenient for them.
- Habitual Behavior: Some pedestrians have the habit of jaywalking, regardless of signal conditions. The absence of a functioning signal may provide them with an opportunity to continue their customary behavior.
- Lack of Alternative Crossings: In densely populated urban areas, there may be limited opportunities for pedestrians to cross safely at locations other than signalized intersections. When the signal malfunctions, pedestrians may have no other choice but to jaywalk to reach their destination.
- Misunderstanding of Traffic Laws: Some pedestrians may not fully understand or be aware of local traffic laws and regulations regarding crossing at signalized intersections. This lack of knowledge can lead to jaywalking conflicts.
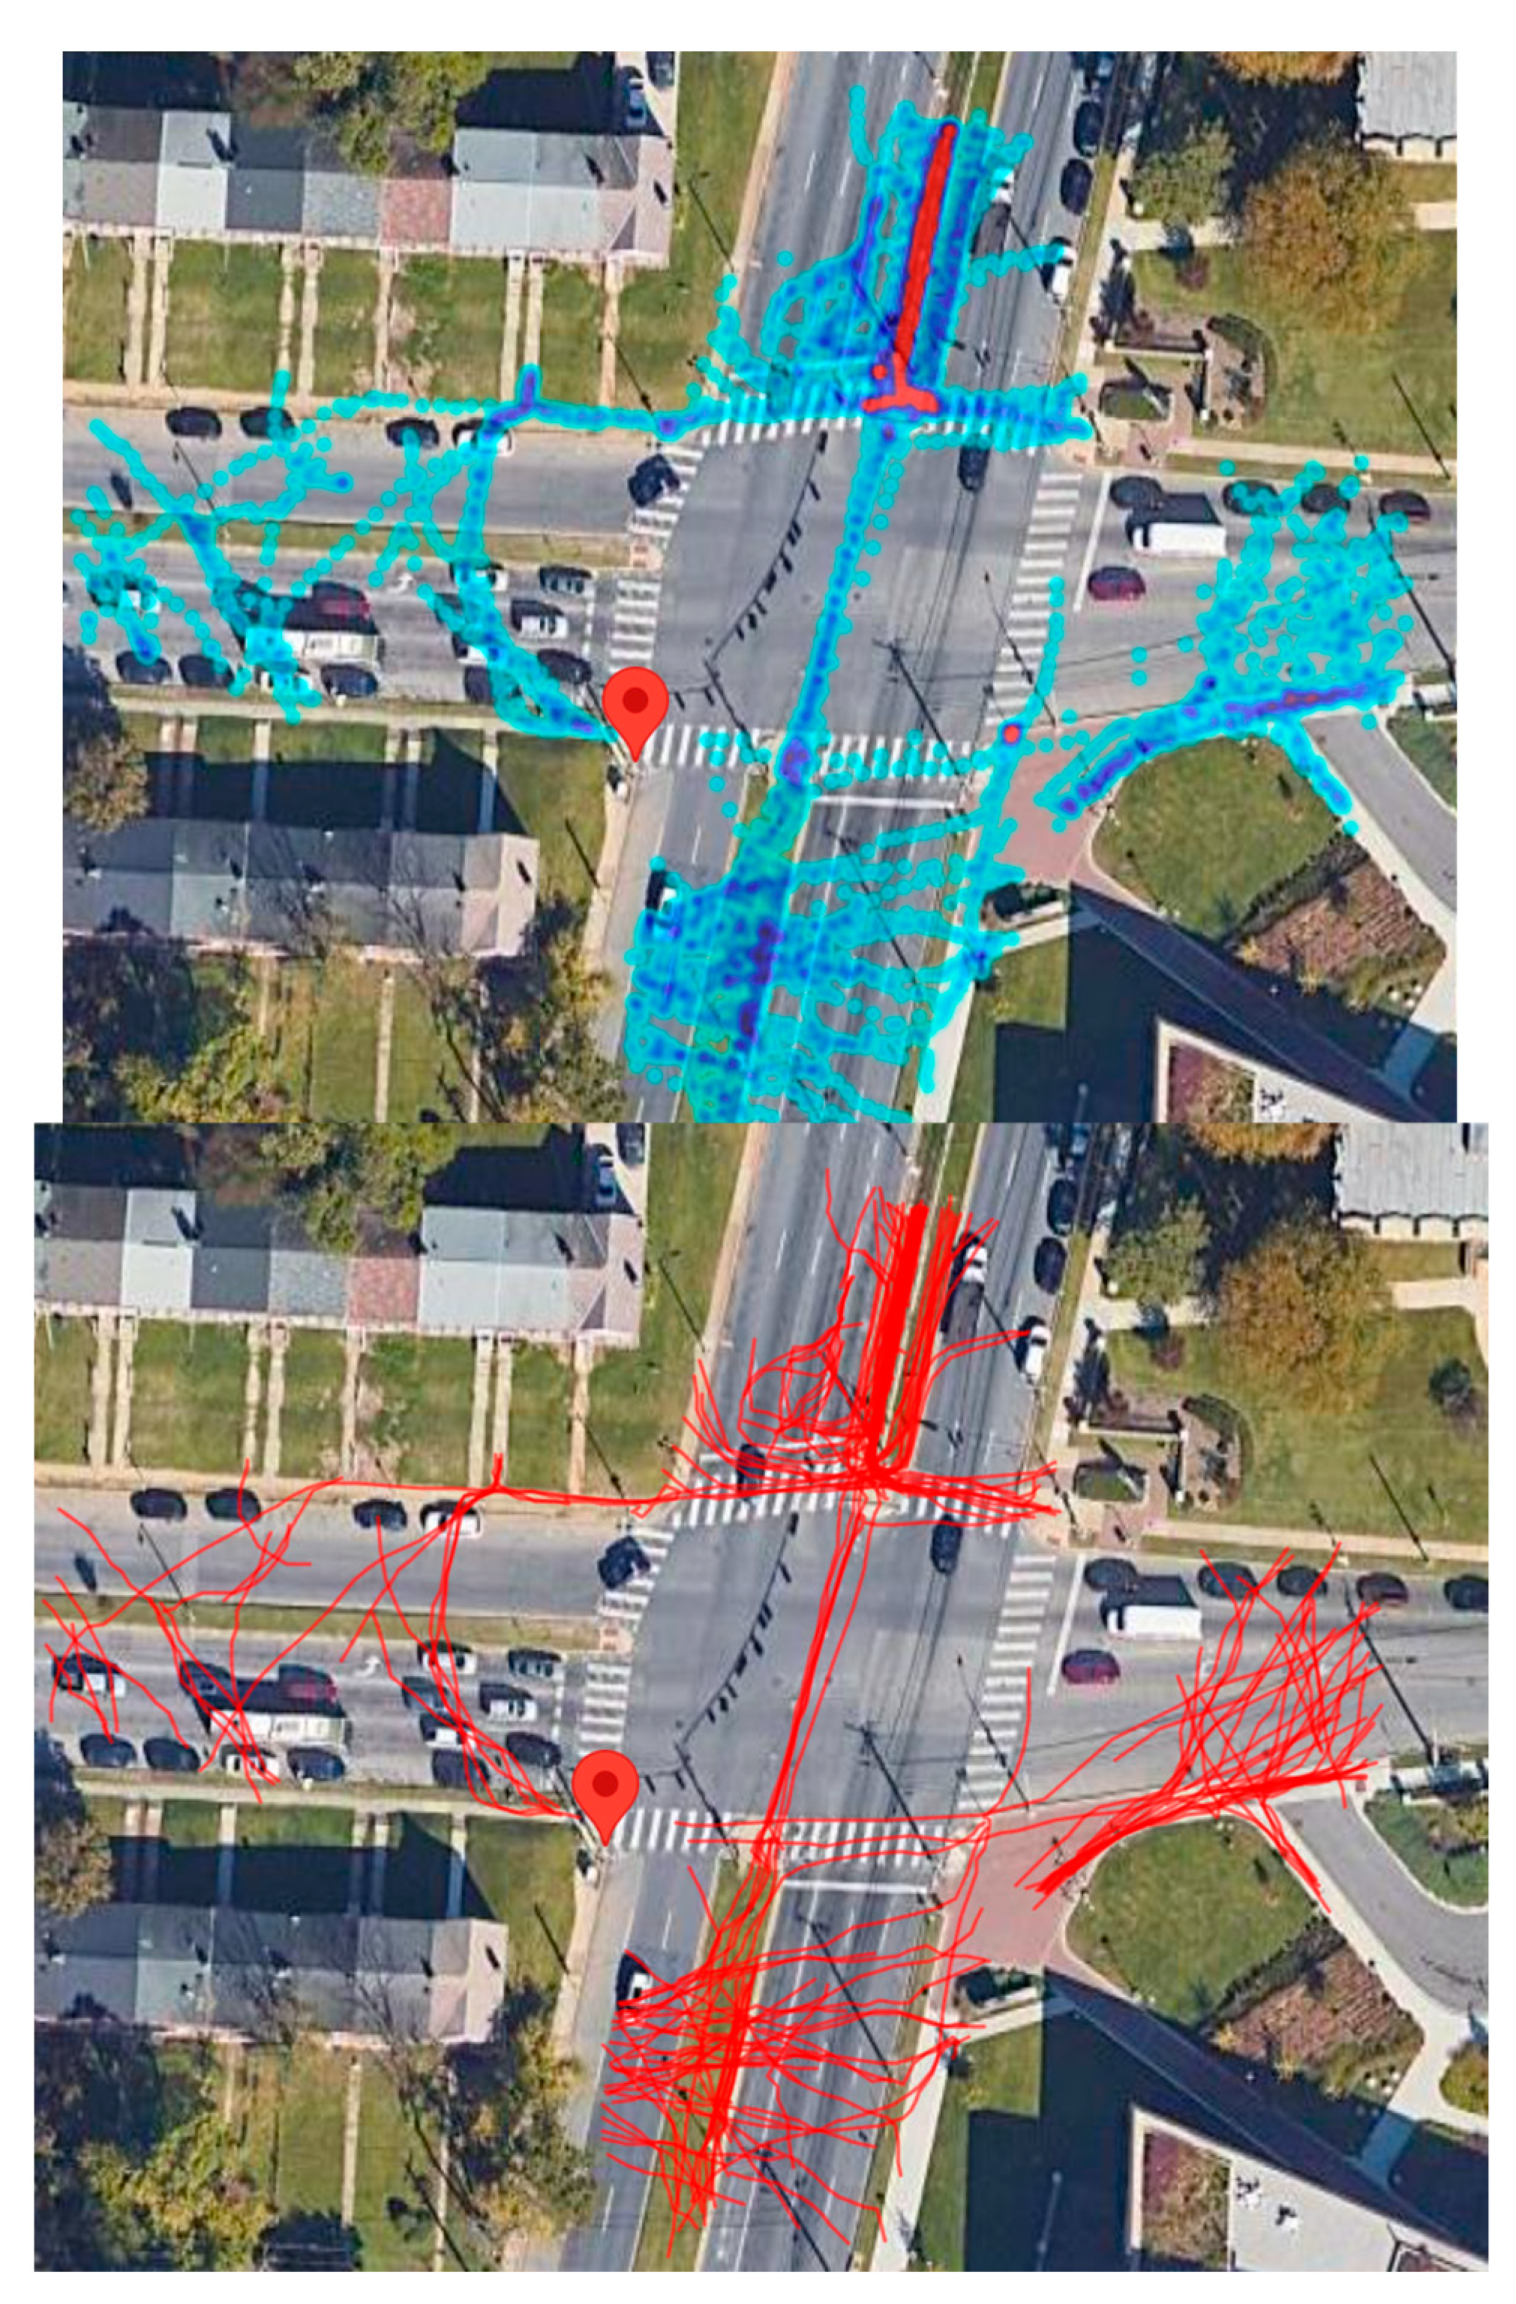
- Traffic Flow Disruption: When pedestrians jaywalk, it can disrupt the flow of vehicular traffic, especially if drivers are not expecting pedestrians to cross at non-designated locations. This disruption can lead to conflicts and potential safety hazards.
Conclusion
- Traffic Adaptation during Signal Failures: LiDAR data analysis revealed that when traffic signals fail, vehicles tend to adapt their behavior to the uncontrolled environment. This adaptation includes cautious approaches to intersections, increased yield compliance, and a reduction in aggressive maneuvers. These adaptive behaviors contribute to enhanced safety during signal failures.
- Congestion and safety Patterns: The study identified patterns of congestion and safety during signal failures, with queues forming at intersections. However, the analysis also demonstrated that the adoption of appropriate driving behaviors and the use of advanced signal control strategies can help minimize congestion and mitigate delays during such events.
- Safety Enhancements: LiDAR technology facilitated the detection of potential safety incidents during signal failures, enabling the identification of near-miss events and contributing to a better understanding of intersection safety in these situations. This information can inform safety measures and interventions.
- Advanced Signal Control Strategies: Simulations based on LiDAR data highlighted the potential benefits of advanced signal control strategies, such as adaptive signal control and dynamic lane management. These strategies, when applied during signal failures, demonstrated the ability to significantly reduce congestion and delays, further emphasizing the importance of proactive signal control measures.
- Policy and Engineering Implications: The findings of this study have direct policy and engineering implications. They underscore the need for redundancy and backup systems in signalized intersections, as well as the importance of implementing adaptive control systems that can seamlessly manage traffic during signal failures.
- Integration of LiDAR with Autonomous Vehicles: Future studies should explore how LiDAR sensor technology can be seamlessly integrated with autonomous vehicles to enhance safety and traffic management during signal failures. Investigate how self-driving cars can communicate with signalized intersections and adapt their behavior in real-time, potentially reducing congestion and delays.
- Machine Learning for Predictive Analytics: Utilize machine learning algorithms to predict the likelihood of traffic signal failures based on historical data, weather conditions, and intersection-specific factors. This proactive approach can help authorities implement preventive measures and deploy resources more effectively.
- Dynamic Signal Control Optimization: Develop advanced traffic signal control algorithms that can dynamically adapt to signal failures by analyzing real-time LiDAR data. Investigate how these adaptive control systems can optimize signal timings, reduce congestion, and enhance intersection efficiency.
- Pedestrian and Cyclist Safety: Extend LiDAR sensor technology's application to study pedestrian and cyclist behavior and safety during signal failures. Analyze how LiDAR-equipped vehicles and infrastructure can improve crosswalk safety and reduce conflicts.
- Human-Machine Interaction: Explore the human-machine interaction aspects of LiDAR-equipped vehicles and traffic signal systems. Investigate how drivers, pedestrians, and cyclists perceive and respond to LiDAR-based safety features and signal control strategies during signal failures.
- Real-world Pilot Implementations: Conduct real-world pilot implementations of LiDAR-based traffic signal management systems in select urban areas. Evaluate their effectiveness in reducing congestion, minimizing delays, and enhancing safety during signal failures.
- Scalability and Cost-effectiveness: Assess the scalability and cost-effectiveness of deploying LiDAR technology at signalized intersections. Investigate how advancements in sensor technology can make it more accessible for widespread adoption by municipalities of varying sizes.
- Resilience Testing: Conduct resilience testing of LiDAR-based signal systems by simulating various failure scenarios, including power outages, equipment malfunctions, and cyberattacks. Evaluate the robustness of these systems in ensuring uninterrupted traffic flow.
- Public Awareness and Education: Explore strategies to raise public awareness and educate drivers, pedestrians, and cyclists about LiDAR-equipped traffic signal systems. Analyze how informed road users contribute to safer and more efficient intersection operations during signal failures.
- Environmental Impact Assessment: Study the environmental impact of LiDAR technology, considering factors such as energy consumption, materials used, and recyclability. Evaluate its overall sustainability compared to traditional signal control systems.
- Regulatory and Legal Frameworks: Examine the development of regulatory and legal frameworks for LiDAR-equipped traffic signal systems, addressing issues such as data privacy, liability, and standardization.
References
- Rahman, M.S.; Abdel-Aty, M.; Hasan, S.; Cai, Q. Applying machine learning approaches to analyze the vulnerable road-users' crashes at statewide traffic analysis zones. Journal of safety research 2019, 70, 275–288. [Google Scholar] [CrossRef] [PubMed]
- Ansariyar, A. (2022). "Investigating the Car-Pedestrian Conflicts Based on an Innovative Post Encroachment Time Threshold (PET) Classification." Available at SSRN 4377745, Available at SSRN: https://ssrn.com/abstract=4377745. [CrossRef]
- Ansariyar, A.; Taherpour, A. Statistical analysis of vehicle-vehicle conflicts with a LIDAR sensor in a signalized intersection. Advances in Transportation Studies 2023, 60. [Google Scholar]
- Arun, A.; Haque, M.M.; Bhaskar, A.; Washington, S.; Sayed, T. A systematic mapping review of surrogate safety assessment using traffic conflict techniques. Accident Analysis & Prevention 2021, 153, 106016. [Google Scholar]
- Ansariyar, A.; Jeihani, M. Statistical Analysis of Jaywalking Conflicts By a LiDAR Sensor. Scientific Journal of Silesian University of Technology. Series Transport 2023, 120, 17–36. [Google Scholar]
- Astarita, V.; et al. Surrogate safety measures from traffic simulation models a comparison of different models for intersection safety evaluation. Transportation research procedia 2019, 37, 219–226. [Google Scholar] [CrossRef]
- Ansariyar, A.; & Jeihani, M. (2023, June). Investigating the Vehicle-Bicyclists Conflicts using LIDAR sensor technology at signalized intersections. In ICTTE 2023: International Conference on Transportation and Traffic Engineering https://publications. waset. org/abstracts/166804/investigating-the-vehicle-bicyclists-conflicts-using-lidar-sensor-technology-at-signalized-intersections, Available at SSRN: https://ssrn.com/abstract=4473399. [CrossRef]
- Soo, H.Y.; Teodorovic, D.; Collura, J. A DSS framework for advanced traffic signal control system investment planning. Journal of Public Transportation 2006, 9, 87–106. [Google Scholar] [CrossRef]
- Ansariyar, A.; Ardeshiri, A.; Vaziri, E.; & Jeihani, M. (2022). Investigating the Traffic Behavior of Bicyclists in Interaction with Car Users on Shared Bike Lanes Without Physical Barriers. In Transportation Research Board 102nd Annual Meeting Location: Washington DC, United States, Available at SSRN: https://ssrn.com/abstract=4377734. [CrossRef]
- Stylianou, K.; Dimitriou, L. Analysis of rear-end conflicts in urban networks using Bayesian networks. Transportation research record 2018, 2672, 302–312. [Google Scholar] [CrossRef]
- Ansariyar, A.; Taherpour, A. Investigating the accuracy rate of vehicle-vehicle conflicts by LIDAR technology and microsimulation in VISSIM and AIMSUN. Advances in Transportation Studies 2023, 61. [Google Scholar]
- Sun, Y.; Xu, H.; Wu, J.; Hajj, E.Y.; Geng, X. Data processing framework for development of driving cycles with data from SHRP 2 naturalistic driving study. Transportation Research Record 2017, 2645, 50–56. [Google Scholar] [CrossRef]
- Suzuki, K.; Ito, H. Empirical analysis on risky behaviors and pedestrian-vehicle conflicts at large-size signalized intersections. Transportation research procedia 2017, 25, 2139–2152. [Google Scholar] [CrossRef]
- Ansariyar, A.; Ardeshiri, A.; Jeihani, M. Investigating the collected vehicle-pedestrian conflicts by a LIDAR sensor based on a new Post Encroachment Time Threshold (PET) classification at signalized intersections. Advances in Transportation Studies 2023, 61, 103–118. [Google Scholar]
- Suzuki, S.; P. Raksincharoensak, I. Shimizu, M. Nagai and R. Adomat (2010). Sensor fusion-based pedestrian collision warning system with crosswalk detection. 2010 IEEE Intelligent Vehicles Symposium, IEEE.
- Thakur, R. Scanning LIDAR in Advanced Driver Assistance Systems and Beyond: Building a road map for next-generation LIDAR technology. IEEE Consumer Electronics Magazine 2016, 5, 48–54. [Google Scholar] [CrossRef]
- Uzondu, C.; S. Jamson and F. Lai Exploratory study involving observation of traffic behaviour and conflicts in Nigeria using the Traffic Conflict Technique. Safety science 2018, 110, 273–284. [Google Scholar] [CrossRef]
- Van der Horst, A.R. A. (1991). "A time-based analysis of road user behaviour in normal and crucial encounters.".
- Vanlaar, W.; Hing, M.M.; Brown, S.; McAteer, H.; Crain, J.; McFaull, S. Fatal and serious injuries related to vulnerable road users in Canada. Journal of safety research 2016, 58, 67–77. [Google Scholar] [CrossRef] [PubMed]
- Vasconcelos, L.; Neto, L.; Seco, Á.M.; Silva, A.B. Validation of the surrogate safety assessment model for assessment of intersection safety. Transportation Research Record 2014, 2432, 1–9. [Google Scholar] [CrossRef]
- Vogel, K. A comparison of headway and time to collision as safety indicators. Accident analysis & prevention 2003, 35, 427–433. [Google Scholar]
- Wang, D.Z.; I. Posner and P. Newman (2012). What could move? finding cars, pedestrians and bicyclists in 3d laser data. 2012 IEEE International Conference on Robotics and Automation, IEEE.
- Wang, Y.; Yang, X.; Liang, H.; Liu, Y. A review of the self-adaptive traffic signal control system based on future traffic environment. Journal of Advanced Transportation 2018, 2018. [Google Scholar] [CrossRef]
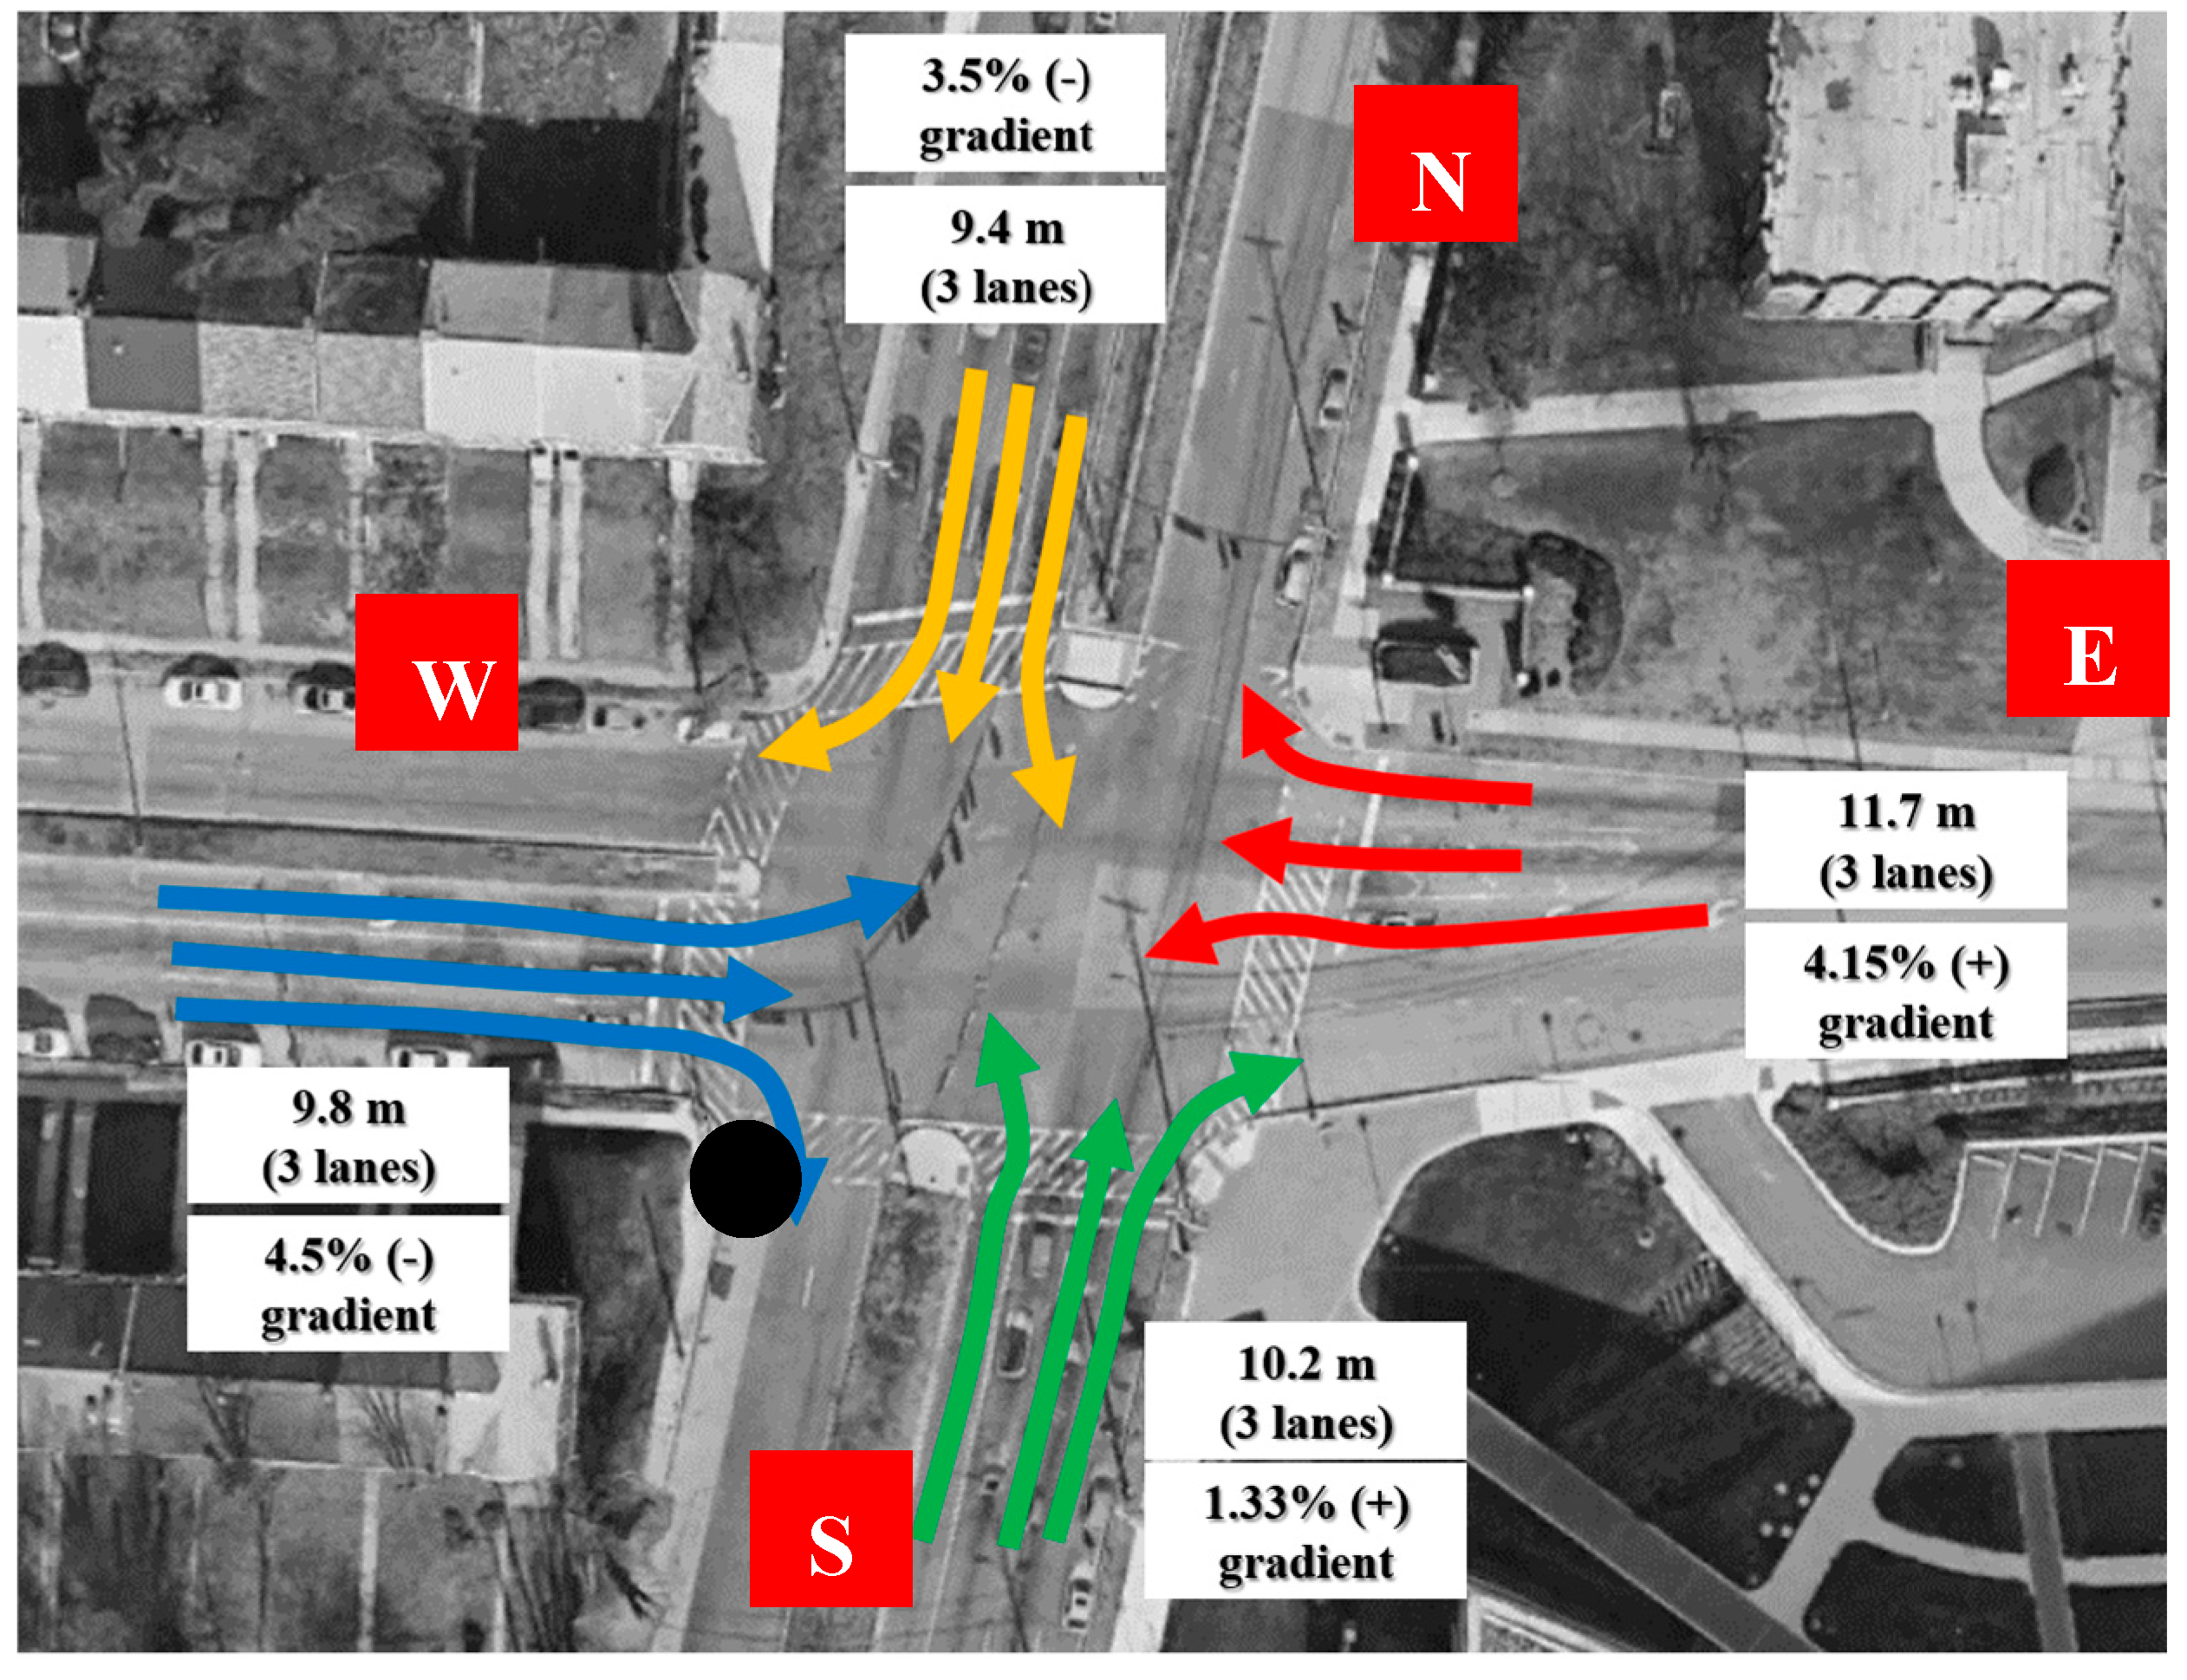
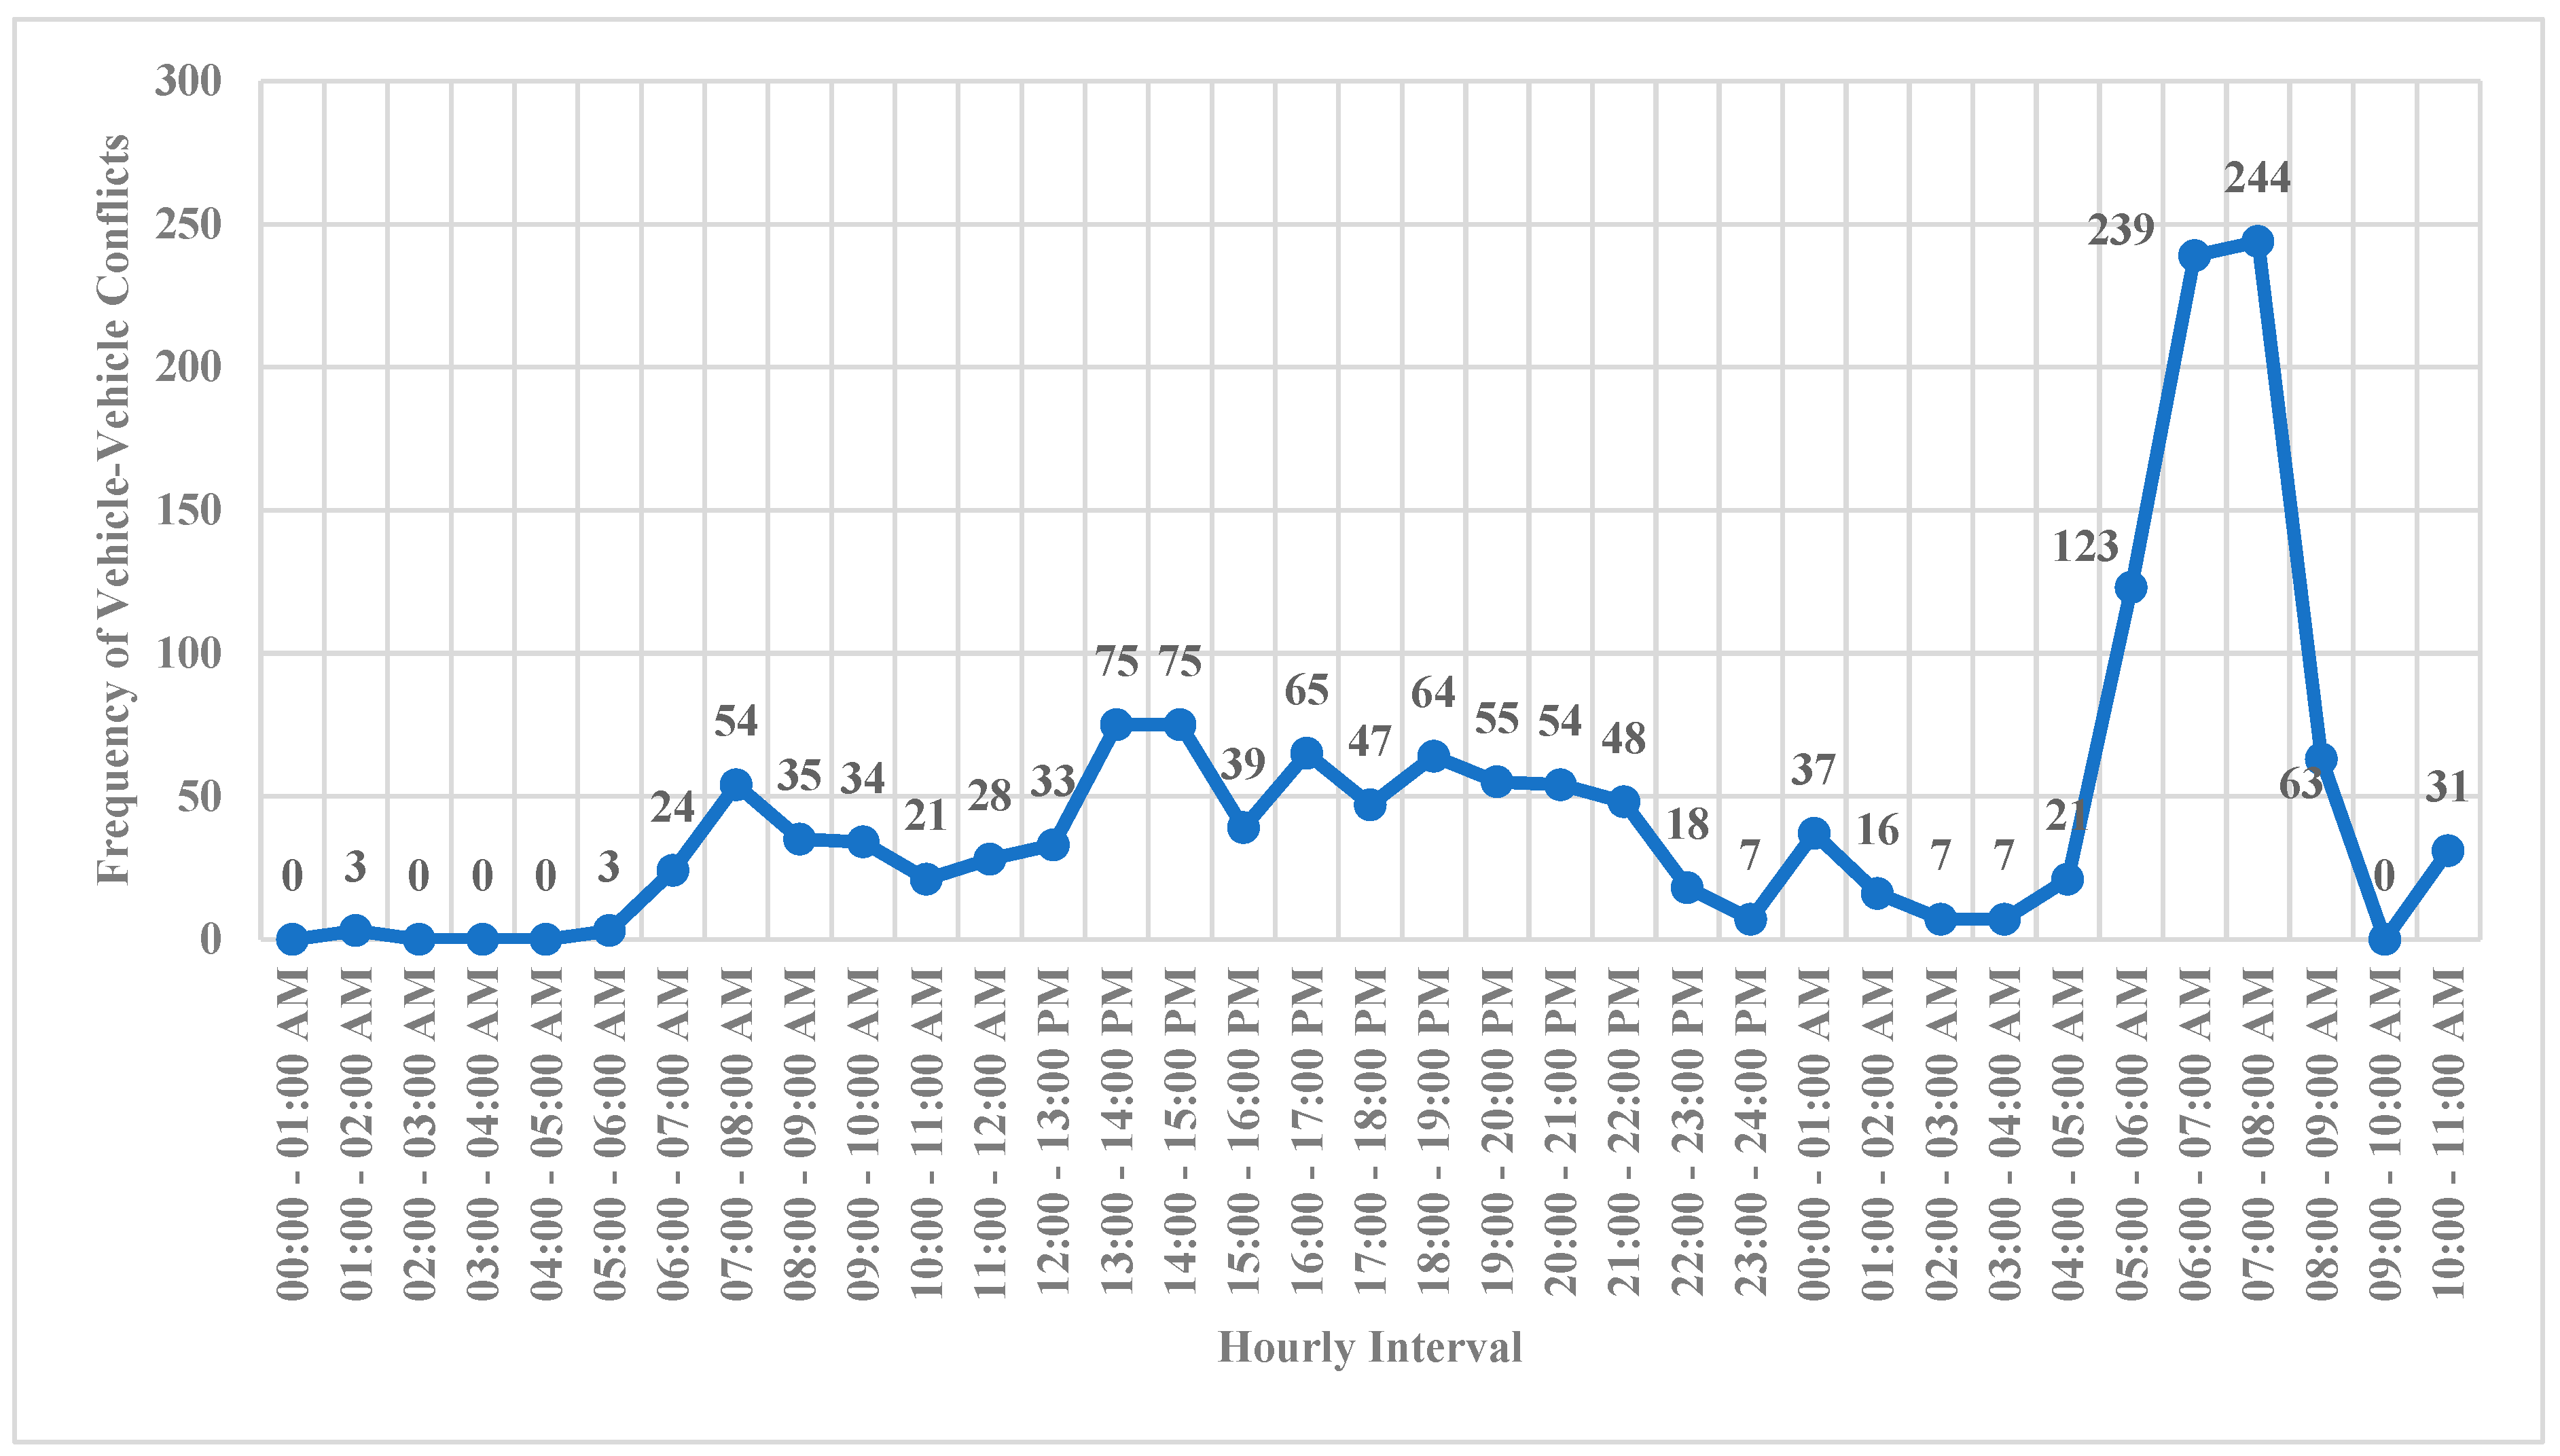
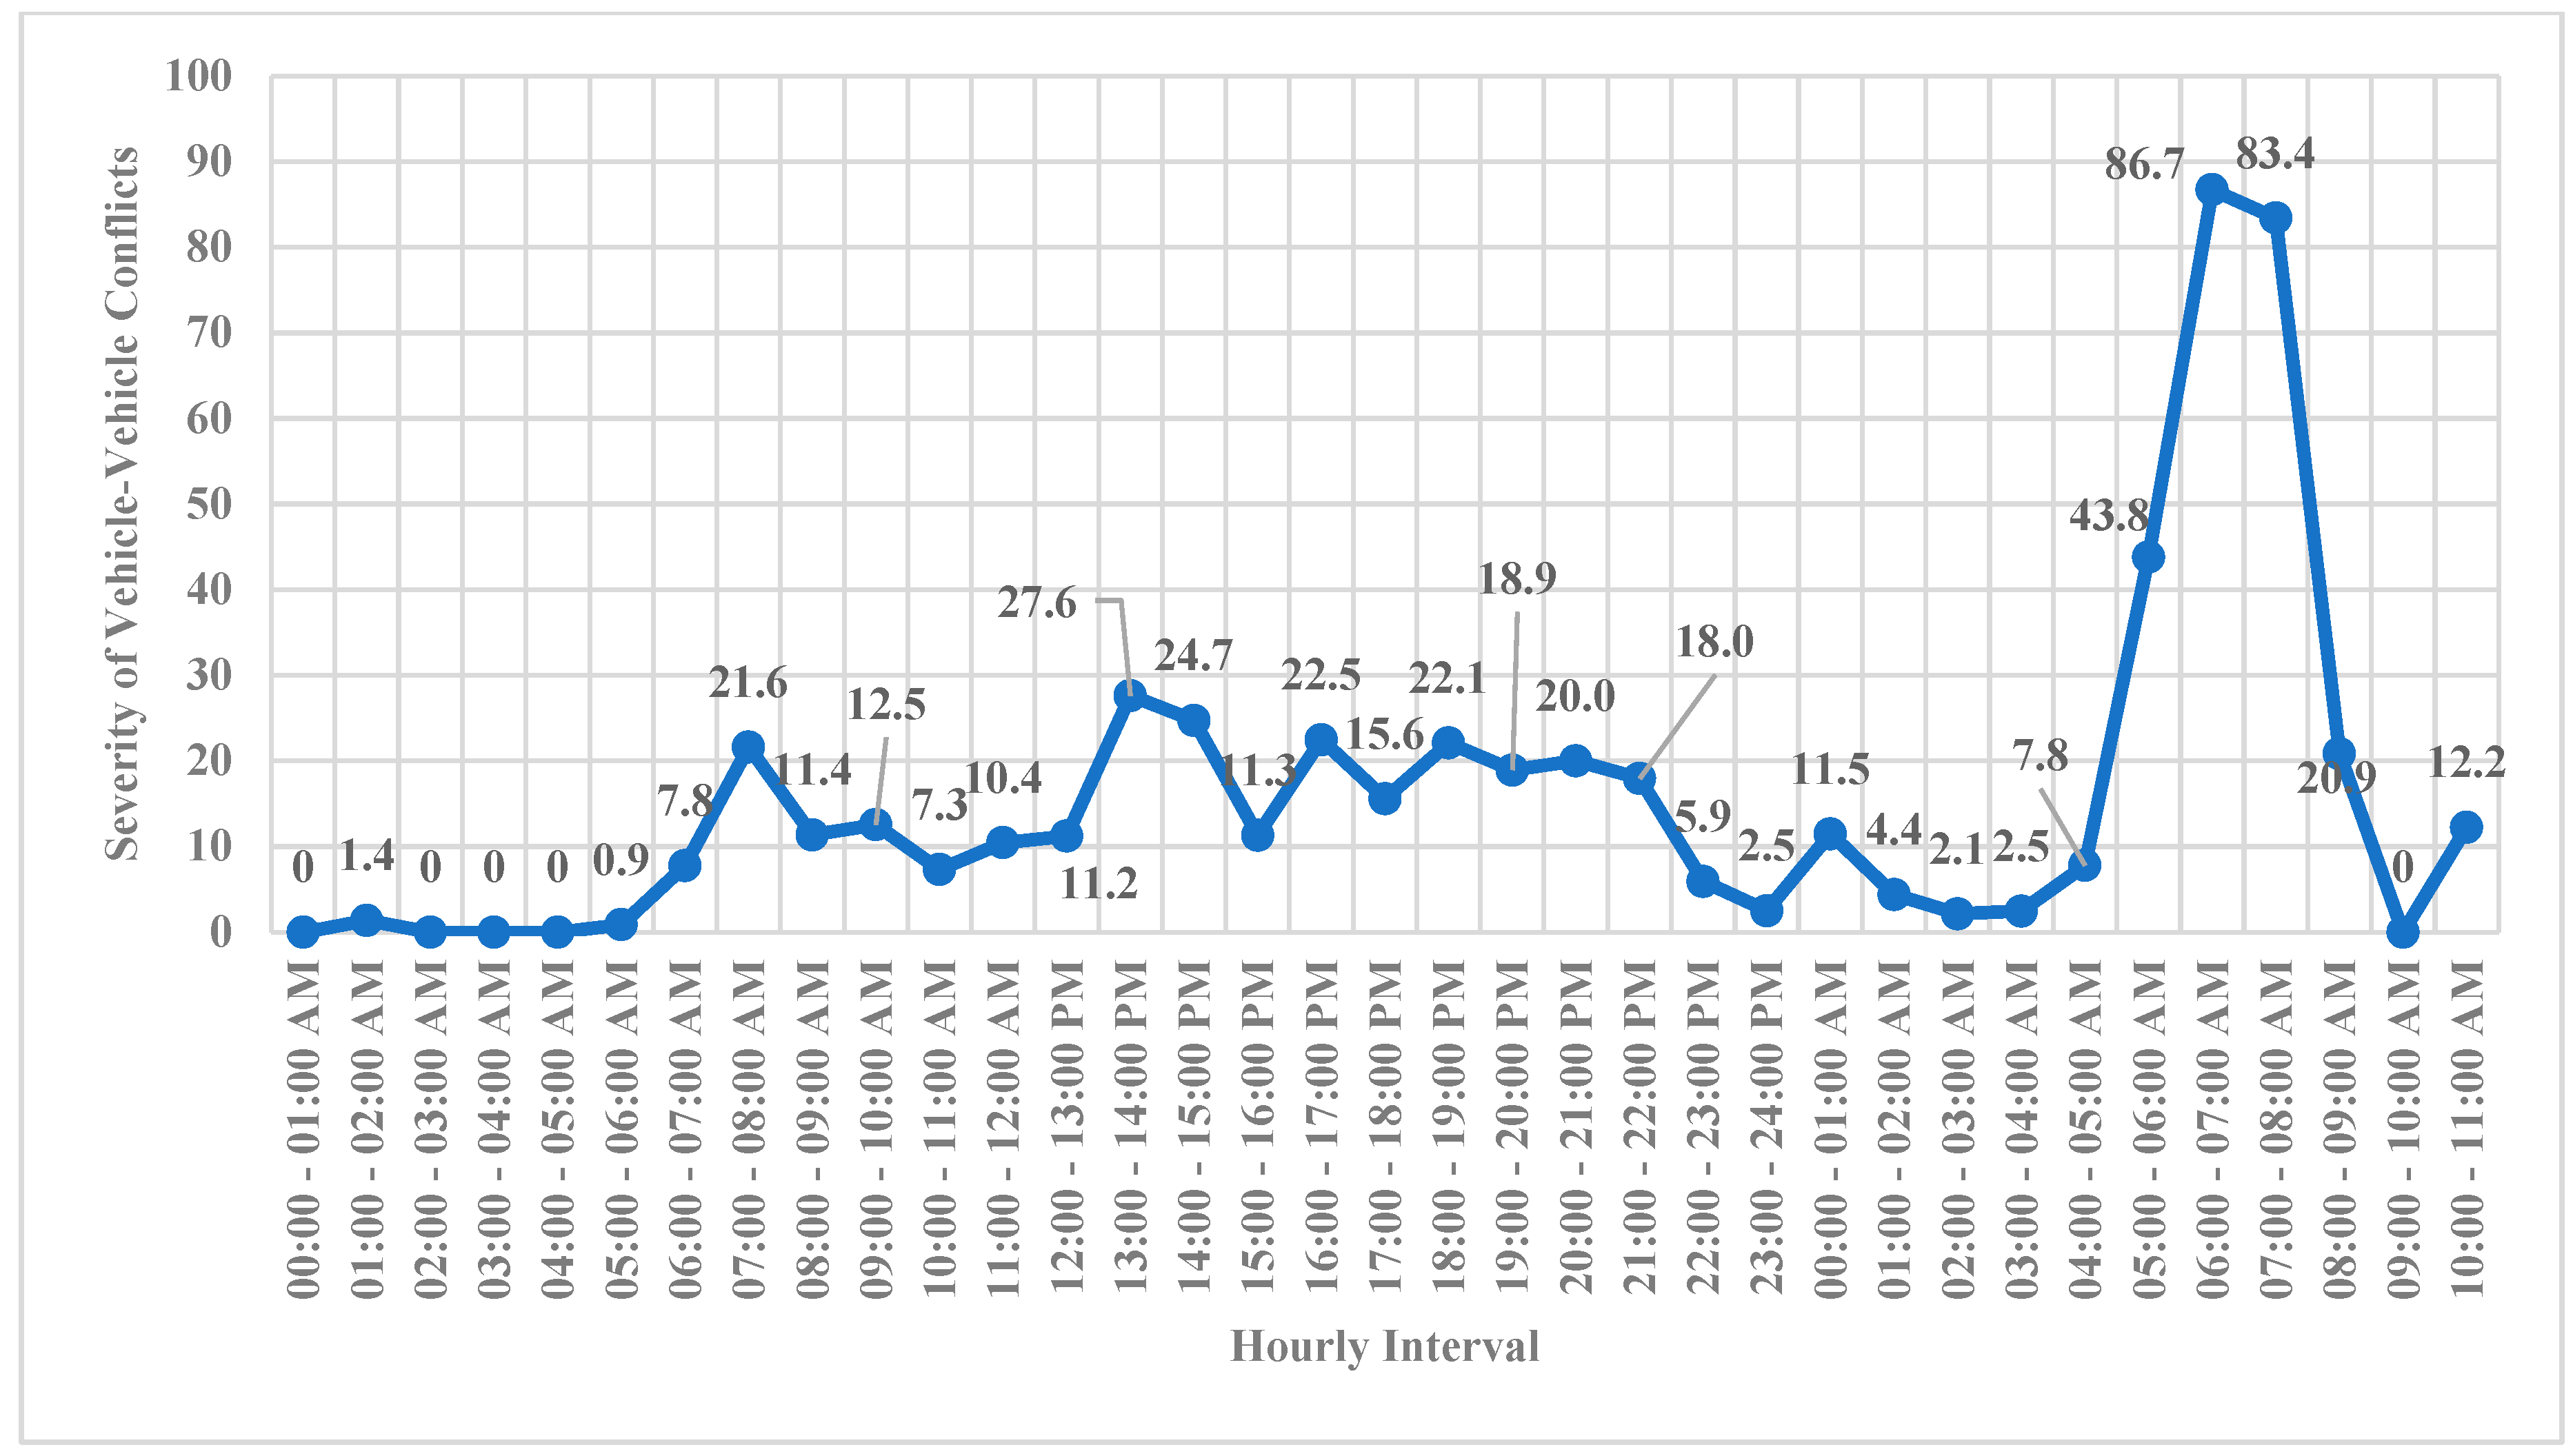
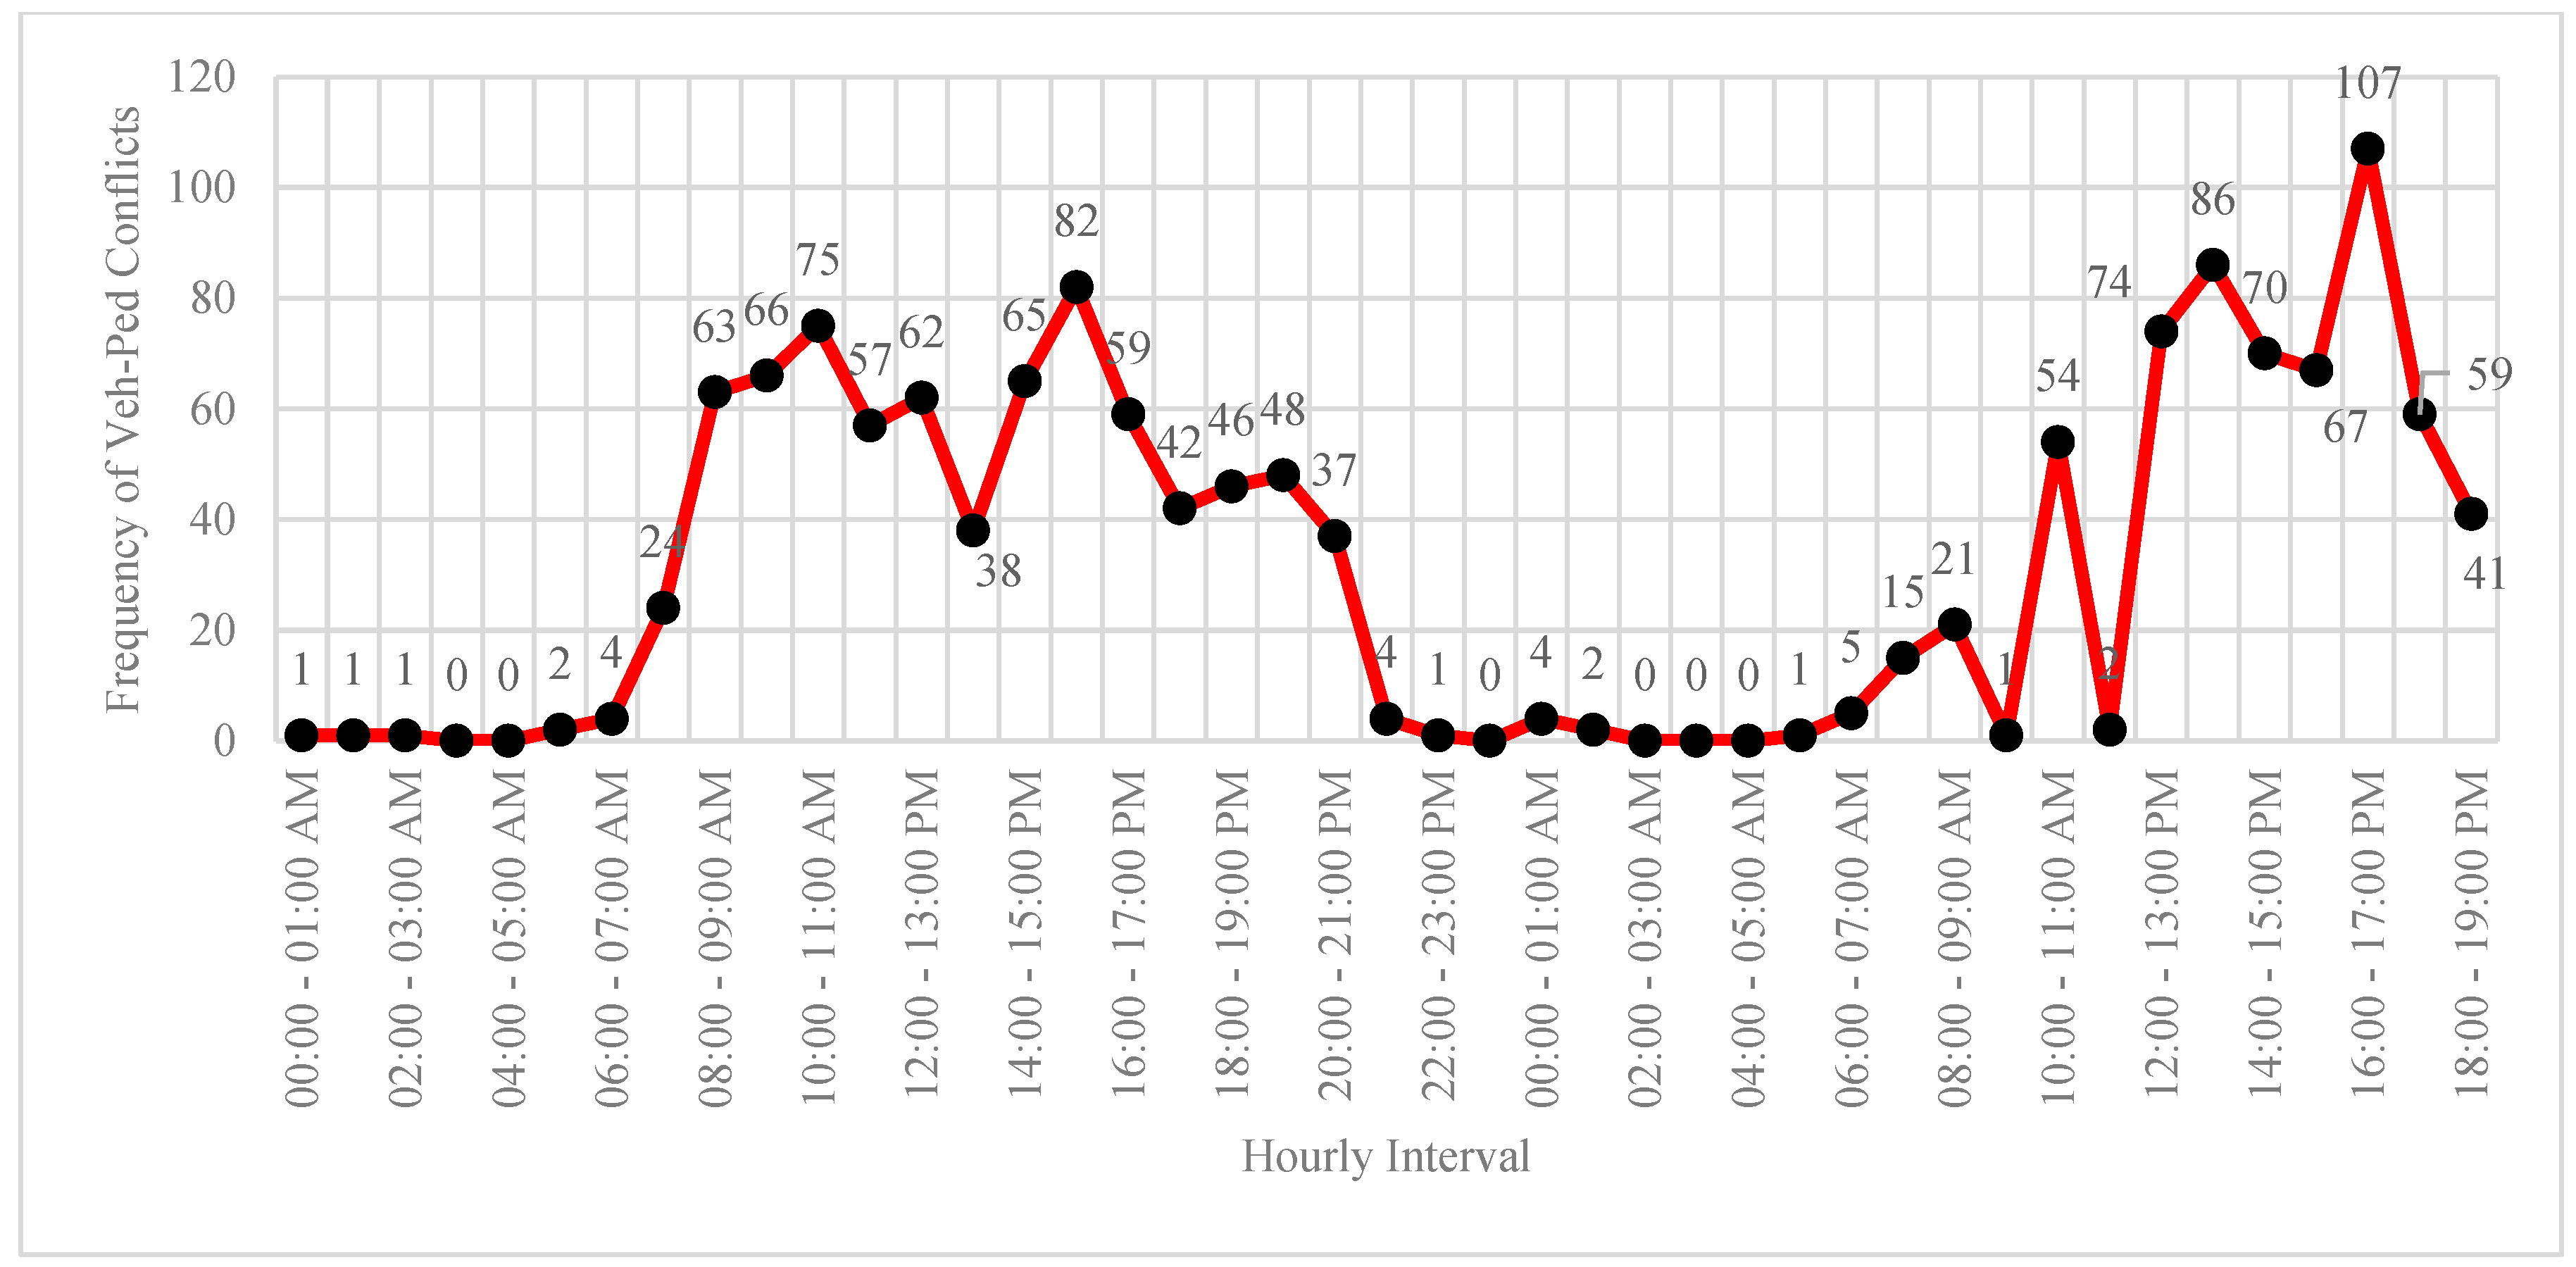
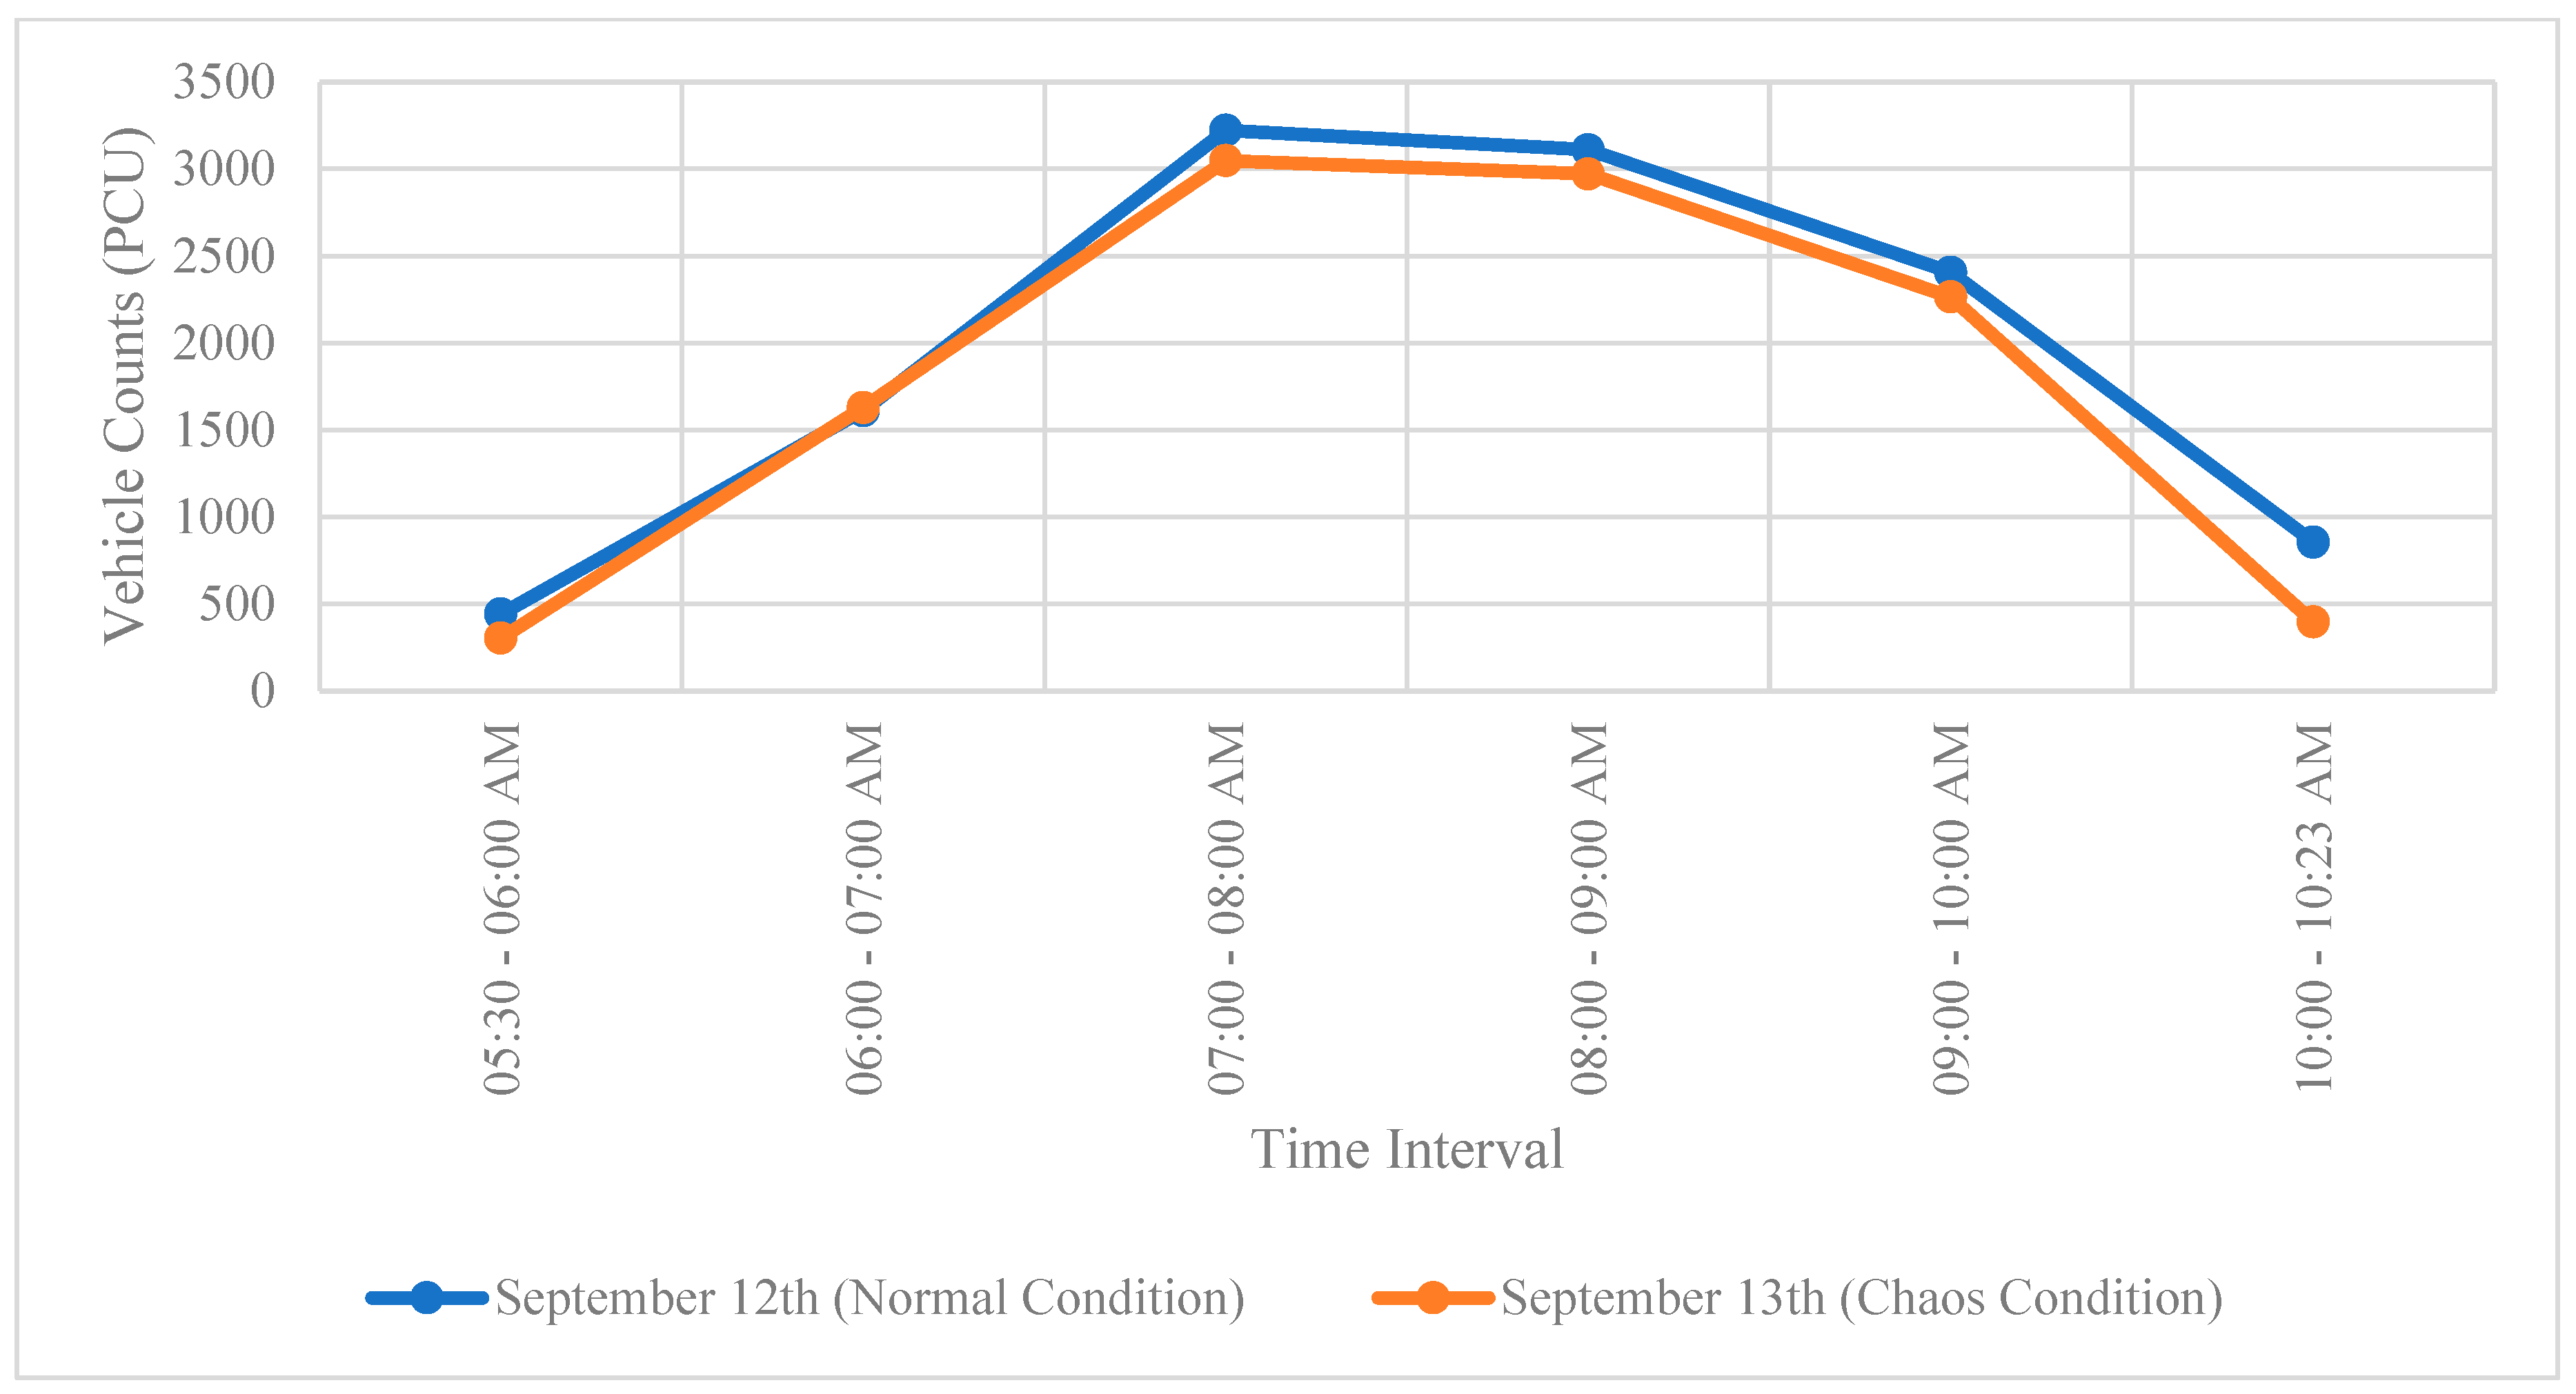

| Date | Hour | NE | NS | NW | ES | EW | EN | SW | SN | SE | WN | WE | WS | SUM |
| September 12th | 00:00 - 01:00 AM | 16 | 101 | 43 | 13 | 54 | 21 | 13 | 141 | 5 | 28 | 47 | 1 | 483 |
| 01:00 - 02:00 AM | 9 | 60 | 19 | 6 | 35 | 14 | 3 | 68 | 3 | 21 | 37 | 0 | 275 | |
| 02:00 - 03:00 AM | 6 | 46 | 8 | 3 | 19 | 10 | 3 | 50 | 4 | 13 | 15 | 0 | 177 | |
| 03:00 - 04:00 AM | 6 | 59 | 6 | 2 | 18 | 1 | 2 | 53 | 1 | 7 | 14 | 2 | 171 | |
| 04:00 - 05:00 AM | 11 | 114 | 19 | 3 | 22 | 11 | 1 | 61 | 2 | 12 | 26 | 0 | 282 | |
| 05:00 - 06:00 AM | 50 | 346 | 34 | 18 | 70 | 24 | 6 | 82 | 4 | 31 | 73 | 0 | 738 | |
| 06:00 - 07:00 AM | 71 | 726 | 113 | 43 | 150 | 69 | 13 | 219 | 18 | 59 | 127 | 3 | 1611 | |
| 07:00 - 08:00 AM | 61 | 1159 | 189 | 114 | 484 | 143 | 37 | 508 | 53 | 153 | 320 | 0 | 3221 | |
| 08:00 - 09:00 AM | 120 | 995 | 188 | 93 | 393 | 161 | 40 | 563 | 65 | 171 | 316 | 4 | 3109 | |
| 09:00 - 10:00 AM | 110 | 606 | 139 | 80 | 315 | 152 | 34 | 476 | 71 | 162 | 257 | 4 | 2406 | |
| 10:00 - 11:00 AM | 109 | 537 | 142 | 66 | 223 | 126 | 29 | 486 | 64 | 141 | 211 | 4 | 2138 | |
| 11:00 - 12:00 AM | 131 | 561 | 102 | 75 | 192 | 116 | 40 | 479 | 70 | 141 | 228 | 6 | 2141 | |
| 12:00 - 13:00 PM | 129 | 574 | 116 | 80 | 223 | 144 | 36 | 536 | 100 | 182 | 261 | 7 | 2388 | |
| 13:00 - 14:00 PM | 125 | 593 | 142 | 62 | 214 | 158 | 38 | 575 | 64 | 130 | 240 | 14 | 2355 | |
| 14:00 - 15:00 PM | 121 | 718 | 136 | 75 | 346 | 155 | 59 | 718 | 74 | 198 | 273 | 16 | 2889 | |
| 15:00 - 16:00 PM | 126 | 654 | 168 | 62 | 306 | 191 | 64 | 925 | 81 | 245 | 414 | 2 | 3238 | |
| 16:00 - 17:00 PM | 119 | 663 | 173 | 68 | 309 | 180 | 59 | 1130 | 94 | 286 | 438 | 4 | 3523 | |
| 17:00 - 18:00 PM | 122 | 661 | 191 | 65 | 348 | 199 | 59 | 1106 | 80 | 258 | 456 | 3 | 3548 | |
| 18:00 - 19:00 PM | 77 | 597 | 162 | 72 | 313 | 152 | 48 | 795 | 55 | 217 | 385 | 1 | 2874 | |
| 19:00 - 20:00 PM | 117 | 487 | 167 | 44 | 218 | 116 | 42 | 629 | 15 | 157 | 251 | 2 | 2245 | |
| 20:00 - 21:00 PM | 88 | 412 | 142 | 47 | 210 | 104 | 40 | 501 | 12 | 149 | 220 | 1 | 1926 | |
| 21:00 - 22:00 PM | 65 | 300 | 93 | 38 | 163 | 79 | 29 | 373 | 10 | 113 | 151 | 2 | 1416 | |
| 22:00 - 23:00 PM | 40 | 239 | 64 | 19 | 87 | 52 | 8 | 216 | 22 | 48 | 91 | 2 | 888 | |
| 23:00 - 24:00 PM | 21 | 102 | 38 | 4 | 24 | 35 | 10 | 119 | 11 | 30 | 66 | 2 | 462 | |
| September 13th | 00:00 - 01:00 AM | 22 | 59 | 20 | 8 | 43 | 31 | 6 | 82 | 9 | 55 | 63 | 1 | 399 |
| 01:00 - 02:00 AM | 13 | 36 | 10 | 7 | 34 | 20 | 3 | 72 | 5 | 22 | 32 | 0 | 254 | |
| 02:00 - 03:00 AM | 7 | 52 | 9 | 3 | 16 | 5 | 1 | 40 | 2 | 11 | 16 | 0 | 162 | |
| 03:00 - 04:00 AM | 8 | 67 | 3 | 3 | 18 | 7 | 4 | 45 | 4 | 18 | 22 | 0 | 199 | |
| 04:00 - 05:00 AM | 9 | 119 | 25 | 12 | 32 | 9 | 0 | 47 | 1 | 17 | 28 | 0 | 299 | |
| 04:00 - 05:30 AM | 19 | 219 | 20 | 11 | 43 | 12 | 3 | 62 | 3 | 26 | 38 | 0 | 457 | |
| 05:30 - 06:00 AM | 12 | 146 | 13 | 8 | 29 | 8 | 2 | 42 | 2 | 18 | 25 | 0 | 304 | |
| 06:00 - 07:00 AM | 75 | 720 | 83 | 42 | 177 | 67 | 16 | 213 | 19 | 75 | 135 | 7 | 1629 | |
| 07:00 - 08:00 AM | 76 | 1129 | 214 | 101 | 412 | 166 | 25 | 498 | 34 | 118 | 271 | 4 | 3048 | |
| 08:00 - 09:00 AM | 114 | 991 | 213 | 109 | 309 | 165 | 30 | 516 | 83 | 147 | 286 | 8 | 2971 | |
| 09:00 - 10:00 AM | 113 | 655 | 170 | 67 | 209 | 114 | 29 | 471 | 46 | 167 | 222 | 1 | 2264 | |
| 10:00 - 10:23 AM | 30 | 100 | 19 | 20 | 36 | 22 | 6 | 92 | 17 | 29 | 23 | 2 | 396 | |
| 10:23 - 11:00 AM | 44 | 150 | 28 | 31 | 55 | 34 | 8 | 137 | 26 | 44 | 35 | 3 | 595 |
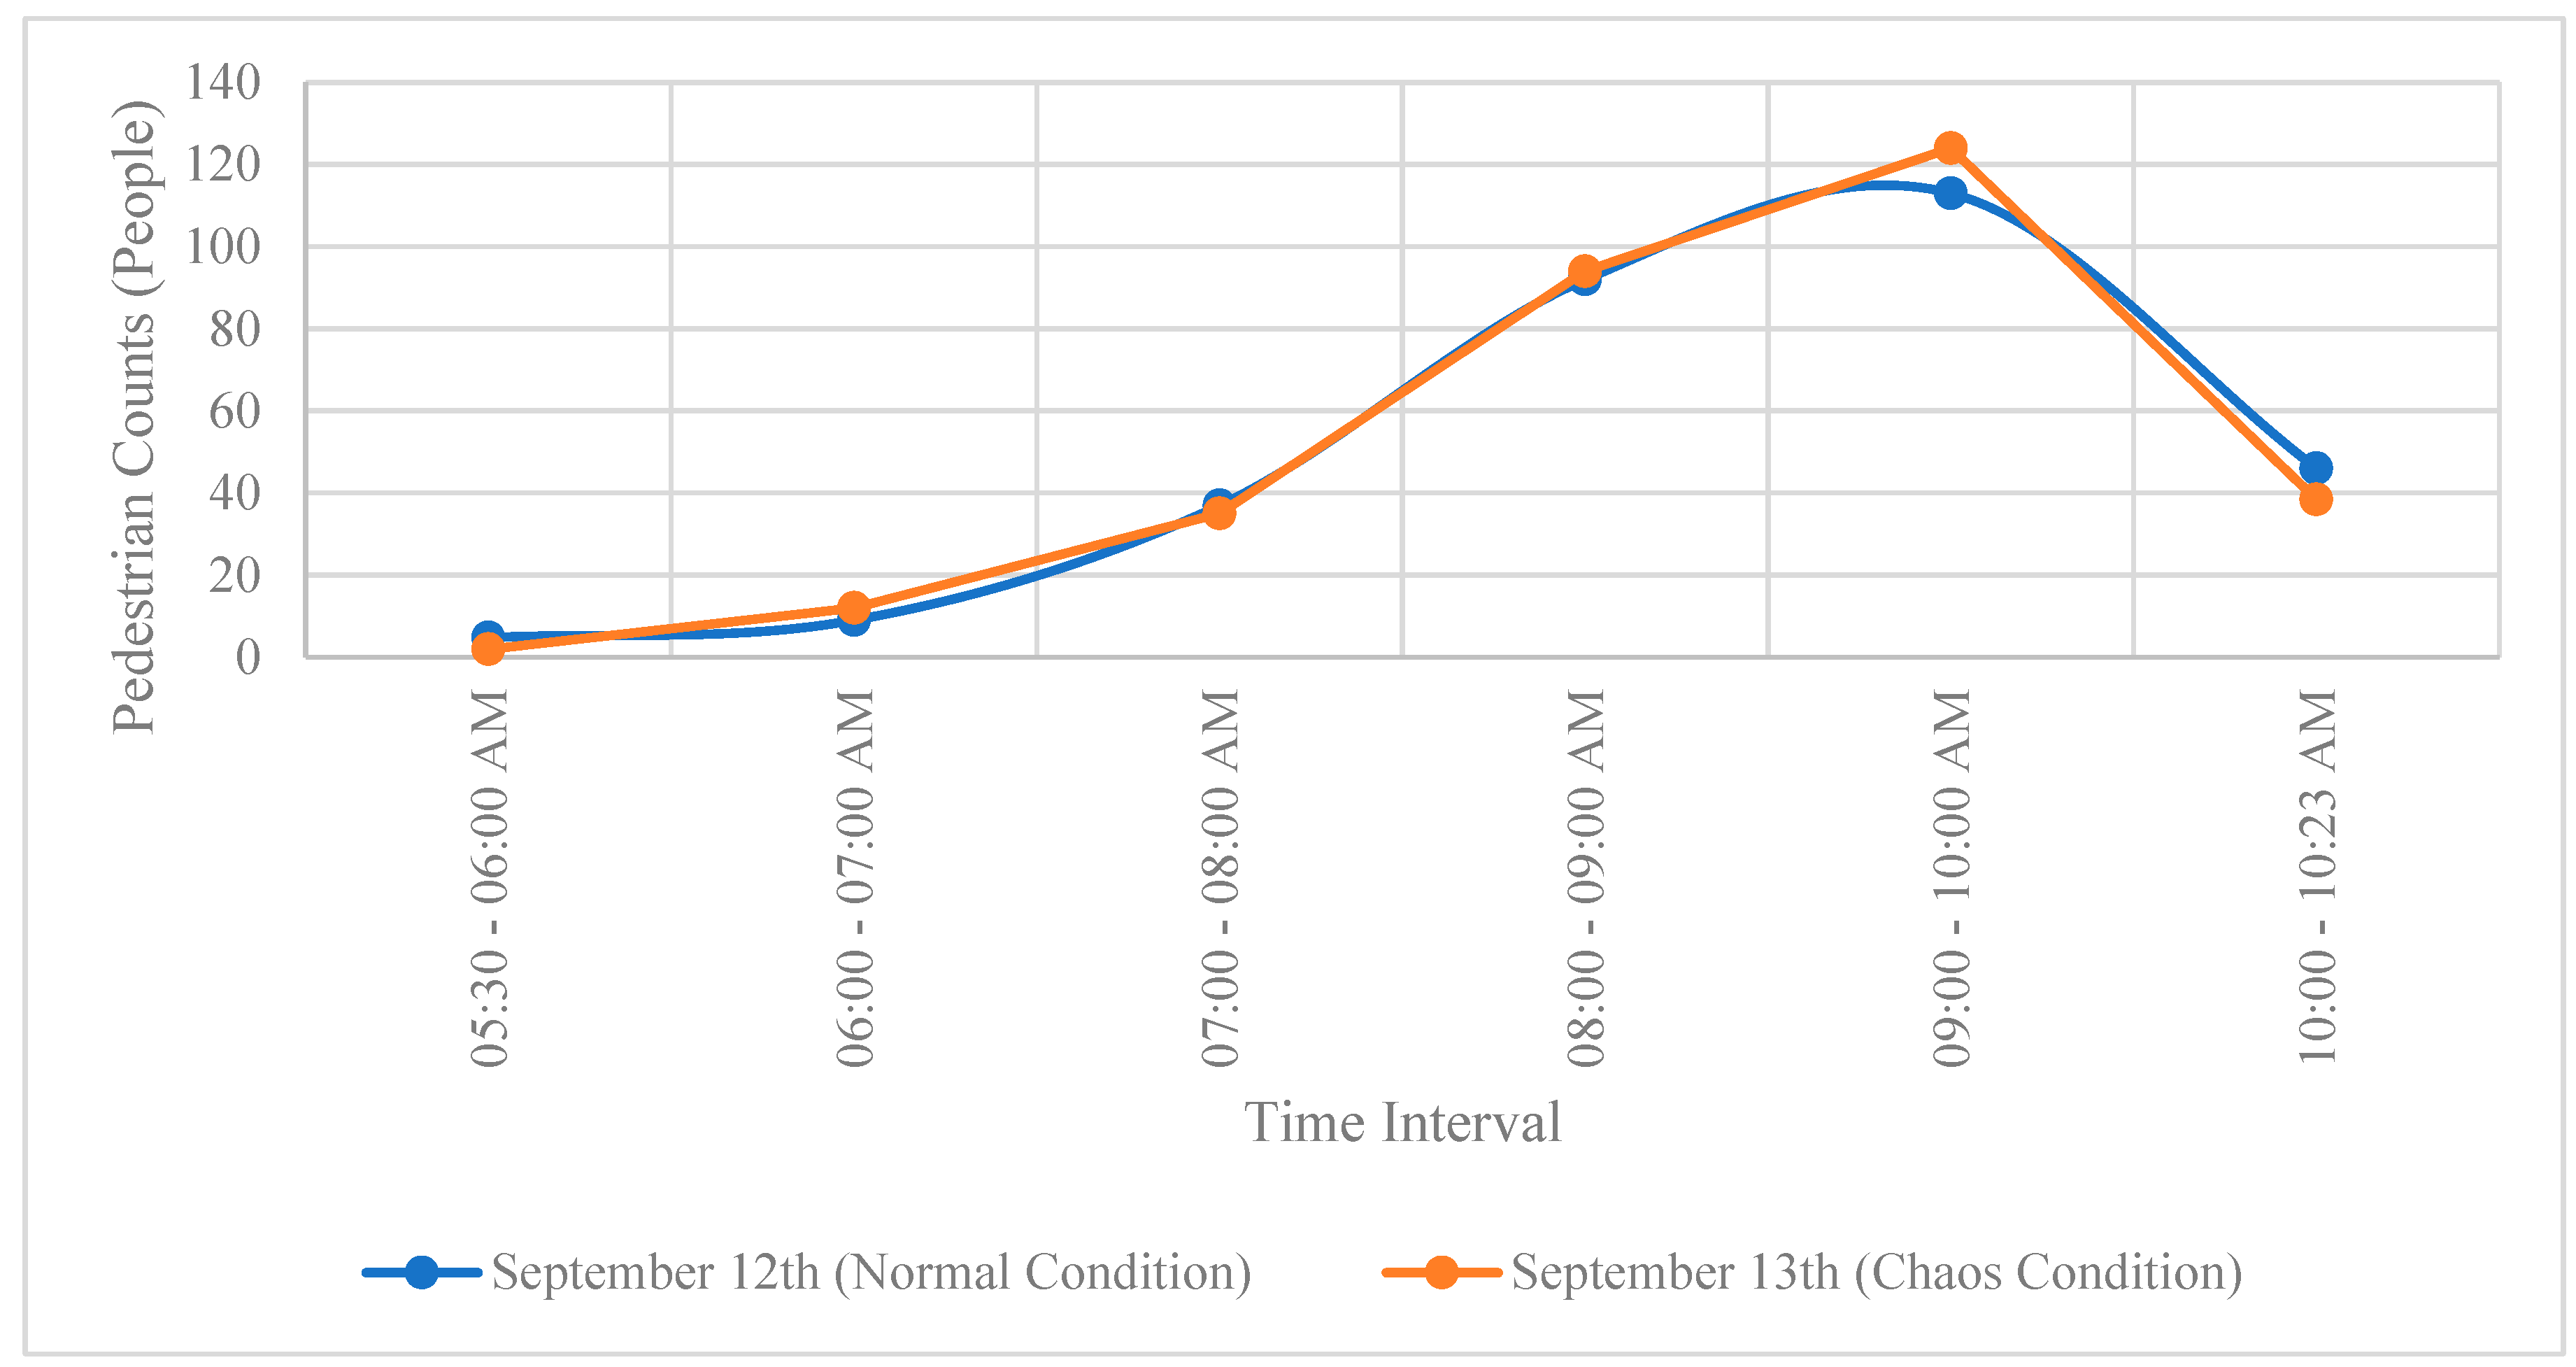
| Date | Hour | N | E | S | W | SUM |
| September 12th | 00:00 - 01:00 AM | 5 | 2 | 0 | 1 | 8 |
| 01:00 - 02:00 AM | 3 | 2 | 1 | 0 | 6 | |
| 02:00 - 03:00 AM | 0 | 0 | 1 | 0 | 1 | |
| 03:00 - 04:00 AM | 0 | 0 | 1 | 0 | 1 | |
| 04:00 - 05:00 AM | 0 | 1 | 0 | 0 | 1 | |
| 05:00 - 06:00 AM | 0 | 3 | 2 | 3 | 8 | |
| 06:00 - 07:00 AM | 0 | 2 | 7 | 0 | 9 | |
| 07:00 - 08:00 AM | 24 | 2 | 7 | 4 | 37 | |
| 08:00 - 09:00 AM | 33 | 15 | 26 | 18 | 92 | |
| 09:00 - 10:00 AM | 56 | 18 | 25 | 14 | 113 | |
| 10:00 - 11:00 AM | 47 | 25 | 31 | 12 | 115 | |
| 11:00 - 12:00 AM | 47 | 30 | 24 | 14 | 115 | |
| 12:00 - 13:00 PM | 46 | 22 | 28 | 13 | 109 | |
| 13:00 - 14:00 PM | 45 | 22 | 29 | 16 | 112 | |
| 14:00 - 15:00 PM | 39 | 26 | 24 | 18 | 107 | |
| 15:00 - 16:00 PM | 57 | 24 | 30 | 13 | 124 | |
| 16:00 - 17:00 PM | 47 | 29 | 46 | 16 | 138 | |
| 17:00 - 18:00 PM | 40 | 26 | 29 | 17 | 112 | |
| 18:00 - 19:00 PM | 44 | 12 | 19 | 13 | 88 | |
| 19:00 - 20:00 PM | 54 | 17 | 19 | 14 | 104 | |
| 20:00 - 21:00 PM | 27 | 14 | 17 | 13 | 71 | |
| 21:00 - 22:00 PM | 7 | 8 | 6 | 1 | 22 | |
| 22:00 - 23:00 PM | 4 | 1 | 0 | 2 | 7 | |
| 23:00 - 24:00 PM | 0 | 0 | 0 | 0 | 0 | |
| September 13th | 00:00 - 01:00 AM | 2 | 2 | 2 | 1 | 7 |
| 01:00 - 02:00 AM | 3 | 3 | 0 | 0 | 6 | |
| 02:00 - 03:00 AM | 2 | 0 | 0 | 0 | 2 | |
| 03:00 - 04:00 AM | 1 | 0 | 0 | 0 | 1 | |
| 04:00 - 05:00 AM | 0 | 0 | 0 | 1 | 1 | |
| 05:00 - 05:30 AM | 0 | 0 | 2 | 1 | 3 | |
| 05:30 - 06:00 AM | 0 | 0 | 1 | 1 | 2 | |
| 06:00 - 07:00 AM | 2 | 1 | 6 | 3 | 12 | |
| 07:00 - 08:00 AM | 15 | 7 | 5 | 8 | 35 | |
| 08:00 - 09:00 AM | 40 | 16 | 32 | 6 | 94 | |
| 09:00 - 10:00 AM | 55 | 22 | 36 | 11 | 124 | |
| 10:00 - 10:23 AM | 11 | 7 | 8 | 12 | 38 | |
| 10:23 - 11:00 AM | 16 | 11 | 12 | 19 | 58 |
Disclaimer/Publisher’s Note: The statements, opinions and data contained in all publications are solely those of the individual author(s) and contributor(s) and not of MDPI and/or the editor(s). MDPI and/or the editor(s) disclaim responsibility for any injury to people or property resulting from any ideas, methods, instructions or products referred to in the content. |
© 2023 by the authors. Licensee MDPI, Basel, Switzerland. This article is an open access article distributed under the terms and conditions of the Creative Commons Attribution (CC BY) license (http://creativecommons.org/licenses/by/4.0/).


