Submitted:
23 October 2023
Posted:
23 October 2023
You are already at the latest version
Abstract
Keywords:
1. Introduction
2. Results
2.1. Characterisation of time-dependent IFNα responses in WT and STAT1-KO cells
2.2. Genome-wide characterization of IFNα-induced transcription in WT vs. STAT1KO cells
2.3. Genome-wide binding of phosphorylated and unphosphorylated ISGF3 components to ISRE sites of IFNα upregulated genes in WT vs. STAT1KO cells
2.4. U-ISG expression correlates with pSTAT1 and pSTAT2 expression and long-term binding in wild type and STAT1KO cells
2.5. The role of phosphorylation of ISGF3 and STAT2/IRF9 in the regulation of prolonged ISG expression in wild type and STAT1KO cells
2.6. The role of unphosphorylated ISGF3 components in the regulation of basal ISG expression in cells overexpressing STAT1, STAT2 and IRF9
2.7. The role of unphosphorylated ISGF3 components in prolonged IFNα signalling in cells overexpressing STAT1, STAT2 and IRF9
3. Discussion
4. Materials and Methods
4.1. Cell lines
Cell culture and treatment
4.2. Western blotting
4.3. RNA isolation and qPCR
4.4. RNA-Seq library preparation and sequencing
4.5. RNA-Seq data analysis
4.5.1. Differential gene expression analysis (DEG)
4.5.2. Heatmap generation
4.5.3. Gene ontology term enrichment analysis
4.5.4. Selection of commonly upregulated genes
4.6. Chromatin immunoprecipitation (ChIP) and sequencing (ChIP-Seq)
4.7. ChIP-Seq data analysis
4.7.1. Visualization in the Integrative Genomics Viewer
4.7.2. Binding profiles
4.7.3. Binding site motifs identification
4.8. Deposited sequencing data
4.9. Antiviral assay
Supplementary Materials
Author Contributions
Funding
Acknowledgments
Conflicts of Interest
References
- Blaszczyk, K.; Nowicka, H.; Kostyrko, K.; Antonczyk, A.; Wesoly, J.; Bluyssen, H.A.R. The Unique Role of STAT2 in Constitutive and IFN-Induced Transcription and Antiviral Responses. Cytokine & growth factor reviews 2016, 29, 71–81. [CrossRef]
- Michalska, A.; Blaszczyk, K.; Wesoly, J.; Bluyssen, H.A.R. A Positive Feedback Amplifier Circuit That Regulates Interferon (IFN)-Stimulated Gene Expression and Controls Type I and Type II IFN Responses. Frontiers in Immunology 2018, 9, 1–17. [CrossRef]
- Levy, D.E.; Darnell, J.E. STATs: Transcriptional Control and Biological Impact. Nature Reviews Molecular Cell Biology 2002, 3, 651–662. [CrossRef]
- Bluyssen, H.A.R.; Levy, D.E. Stat2 Is a Transcriptional Activator That Requires Sequence-Specific Contacts Provided by Stat1 and P48 for Stable Interaction with DNA. Journal of Biological Chemistry 1997, 272, 4600–4605. [CrossRef]
- Blaszczyk, K.; Olejnik, A.; Nowicka, H.; Ozgyin, L.; Chen, Y.L.; Chmielewski, S.; Kostyrko, K.; Wesoly, J.; Balint, B.L.; Lee, C.K.; et al. STAT2/IRF9 Directs a Prolonged ISGF3-like Transcriptional Response and Antiviral Activity in the Absence of STAT1. Biochemical Journal 2015, 466, 511–524. [CrossRef]
- Lou, Y.J.; Pan, X.R.; Jia, P.M.; Li, D.; Xiao, S.; Zhang, Z.L.; Chen, S.J.; Chen, Z.; Tong, J.H. Ifr-9/Stat2 Functional Interaction Drives Retinoic Acid-Induced Gene g Expression Independently of Stat1. Cancer Research 2009, 69, 3673–3680. [CrossRef]
- Abdul-Sater, A.A.; Majoros, A.; Plumlee, C.R.; Perry, S.; Gu, A.-D.; Lee, C.; Shresta, S.; Decker, T.; Schindler, C. Different STAT Transcription Complexes Drive Early and Delayed Responses to Type I IFNs. The Journal of Immunology 2015, 195, 210–216. [CrossRef]
- Perry, S.T.; Buck, M.D.; Lada, S.M.; Schindler, C.; Shresta, S. STAT2 Mediates Innate Immunity to Dengue Virus in the Absence of STAT1 via the Type I Interferon Receptor. PLoS Pathogens 2011, 7. [CrossRef]
- Yamauchi, S.; Takeuchi, K.; Chihara, K.; Honjoh, C.; Kato, Y.; Yoshiki, H.; Hotta, H.; Sada, K. STAT1 Is Essential for the Inhibition of Hepatitis C Virus Replication by Interferon-λ but Not by Interferon-α. Scientific Reports 2016, 6, 1–11. [CrossRef]
- Kraus, T.A.; Lau, J.F.; Parisien, J.P.; Horvath, C.M. A Hybrid IRF9-STAT2 Protein Recapitulates Interferon-Stimulated Gene Expression and Antiviral Response. Journal of Biological Chemistry 2003, 278, 13033–13038. [CrossRef]
- Poat, B.; Hazari, S.; Chandra, P.K.; Gunduz, F.; Alvarez, X.; Balart, L.A.; Garry, R.F.; Dash, S. Intracellular Expression of IRF9 Stat Fusion Protein Overcomes the Defective Jak-Stat Signaling and Inhibits HCV RNA Replication. Virology Journal 2010, 7, 265. [CrossRef]
- Cheon, H.; Holvey-Bates, E.G.; Schoggins, J.W.; Forster, S.; Hertzog, P.; Imanaka, N.; Rice, C.M.; Jackson, M.W.; Junk, D.J.; Stark, G.R. IFNβ-Dependent Increases in STAT1, STAT2, and IRF9 Mediate Resistance to Viruses and DNA Damage. EMBO Journal 2013, 32, 2751–2763. [CrossRef]
- Sung, P.S.; Cheon, H.J.; Cho, C.H.; Hong, S.H.; Park, D.Y.; Seo, H.I.; Park, S.H.; Yoon, S.K.; Stark, G.R.; Shin, E.C. Roles of Unphosphorylated ISGF3 in HCV Infection and Interferon Responsiveness. Proceedings of the National Academy of Sciences of the United States of America 2015, 112, 10443–10448. [CrossRef]
- Sekrecka, A.; Kluzek, K.; Sekrecki, M.; Boroujeni, M.E.; Hassani, S.; Yamauchi, S.; Sada, K.; Wesoly, J.; Bluyssen, H.A.R. Time-Dependent Recruitment of GAF, ISGF3 and IRF1 Complexes Shapes IFNα and IFNγ-Activated Transcriptional Responses and Explains Mechanistic and Functional Overlap. Cell. Mol. Life Sci. 2023, 80, 187. [CrossRef]
- Wang, W.; Yin, Y.; Xu, L.; Su, J.; Huang, F.; Wang, Y.; Boor, P.P.C.; Chen, K.; Wang, W.; Cao, W.; et al. Unphosphorylated ISGF3 Drives Constitutive Expression of Interferon-Stimulated Genes to Protect against Viral Infections. Science Signaling 2017, 10, 1–13. [CrossRef]
- Platanitis, E.; Demiroz, D.; Schneller, A.; Fischer, K.; Capelle, C.; Hartl, M.; Gossenreiter, T.; Müller, M.; Novatchkova, M.; Decker, T. A Molecular Switch from STAT2-IRF9 to ISGF3 Underlies Interferon-Induced Gene Transcription. Nature Communications 2019, 10, 1–17. [CrossRef]
- Cheon, H.J.; Stark, G.R. Unphosphorylated STAT1 Prolongs the Expression of Interferon-Induced Immune Regulatory Genes. Proceedings of the National Academy of Sciences of the United States of America 2009, 106, 9373–9378. [CrossRef]
- Majoros, A.; Platanitis, E.; Szappanos, D.; Cheon, H.; Vogl, C.; Shukla, P.; Stark, G.R.; Sexl, V.; Schreiber, R.; Schindler, C.; et al. Response to Interferons and Antibacterial Innate Immunity in the Absence of Tyrosine-Phosphorylated STAT1. EMBO reports 2016, 17, 367–382. [CrossRef]
- Piaszyk-Borychowska, A.; Széles, L.; Csermely, A.; Chiang, H.C.; Wesoły, J.; Lee, C.K.; Nagy, L.; Bluyssen, H.A.R. Signal Integration of IFN-I and IFN-II with TLR4 Involves Sequential Recruitment of STAT1-Complexes and NFκB to Enhance pro-Inflammatory Transcription. Frontiers in Immunology 2019, 10, 1–20. [CrossRef]
- Willems, E.; Leyns, L.; Vandesompele, J. Standardization of Real-Time PCR Gene Expression Data from Independent Biological Replicates. Analytical Biochemistry 2008, 379, 127–129. [CrossRef]
- GraphPad Software, Inc. GraphPad Prism 7.01.
- Patro, R.; Duggal, G.; Love, M.I.; Irizarry, R.A.; Kingsford, C. Salmon Provides Fast and Bias-Aware Quantification of Transcript Expression. Nat Methods 2017, 14, 417–419. [CrossRef]
- Dobin, A.; Davis, C.A.; Schlesinger, F.; Drenkow, J.; Zaleski, C.; Jha, S.; Batut, P.; Chaisson, M.; Gingeras, T.R. STAR: Ultrafast Universal RNA-Seq Aligner. Bioinformatics (Oxford, England) 2013, 29, 15–21. [CrossRef]
- Liao, Y.; Smyth, G.K.; Shi, W. featureCounts: An Efficient General Purpose Program for Assigning Sequence Reads to Genomic Features. Bioinformatics (Oxford, England) 2014, 30, 923–930. [CrossRef]
- Andrews, S. FastQC: A Quality Control Tool for High Throughput Sequence Data [Online] 2010.
- Ewels, P.; Magnusson, M.; Lundin, S.; Käller, M. MultiQC: Summarize Analysis Results for Multiple Tools and Samples in a Single Report. Bioinformatics 2016, 32, 3047–3048. [CrossRef]
- Love, M.I.; Huber, W.; Anders, S. Moderated Estimation of Fold Change and Dispersion for RNA-Seq Data with DESeq2. Genome biology 2014, 15, 550. [CrossRef]
- R Core Team R: A Language and Environment for Statistical Computing 2021.
- Kolde, R. Pheatmap: Pretty Heatmaps. R Package Version 1.0. 12. CRAN. R-project. org/package= pheatmap 2019.
- Gu, Z.; Eils, R.; Schlesner, M. Complex Heatmaps Reveal Patterns and Correlations in Multidimensional Genomic Data. Bioinformatics 2016, 32, 2847–2849. [CrossRef]
- Wu, T.; Hu, E.; Xu, S.; Chen, M.; Guo, P.; Dai, Z.; Feng, T.; Zhou, L.; Tang, W.; Zhan, L.; et al. clusterProfiler 4.0: A Universal Enrichment Tool for Interpreting Omics Data. Innovation (Camb) 2021, 2, 100141. [CrossRef]
- Yu, G.; Wang, L.-G.; Han, Y.; He, Q.-Y. clusterProfiler: An R Package for Comparing Biological Themes Among Gene Clusters. OMICS 2012, 16, 284–287. [CrossRef]
- Wickham, H. Ggplot2: Elegant Graphics for Data Analysis; Springer-Verlag New York, 2016;
- Bardou, P.; Mariette, J.; Escudié, F.; Djemiel, C.; Klopp, C. Jvenn: An Interactive Venn Diagram Viewer. BMC Bioinformatics 2014, 15, 293. [CrossRef]
- Inkscape Project. Inkscape 2020.
- ENCODE Project consortium Transcription Factor ChIP-Seq Data Standards and Processing Pipeline – ENCODE Available online: https://www.encodeproject.org/chip-seq/transcription_factor/(accessed on 13 October 2023).
- Langmead, B.; Salzberg, S.L. Fast Gapped-Read Alignment with Bowtie 2. Nature Methods 2012, 9, 357–359. [CrossRef]
- Danecek, P.; Bonfield, J.K.; Liddle, J.; Marshall, J.; Ohan, V.; Pollard, M.O.; Whitwham, A.; Keane, T.; McCarthy, S.A.; Davies, R.M.; et al. Twelve Years of SAMtools and BCFtools. GigaScience 2021, 10, 1–4. [CrossRef]
- Jun, G.; Wing, M.K.; Abecasis, G.R.; Kang, H.M. An Efficient and Scalable Analysis Framework for Variant Extraction and Refinement from Population-Scale DNA Sequence Data. Genome Research 2015, 25, 918–925. [CrossRef]
- Zhang, Y.; Liu, T.; Meyer, C.A.; Eeckhoute, J.; Johnson, D.S.; Bernstein, B.E.; Nusbaum, C.; Myers, R.M.; Brown, M.; Li, W.; et al. Model-Based Analysis of ChIP-Seq (MACS). Genome Biology 2008, 9, R137. [CrossRef]
- Quinlan, A.R.; Hall, I.M. BEDTools: A Flexible Suite of Utilities for Comparing Genomic Features. Bioinformatics 2010, 26, 841–842. [CrossRef]
- Heinz, S.; Benner, C.; Spann, N.; Bertolino, E.; Lin, Y.C.; Laslo, P.; Cheng, J.X.; Murre, C.; Singh, H.; Glass, C.K. Simple Combinations of Lineage-Determining Transcription Factors Prime Cis-Regulatory Elements Required for Macrophage and B Cell Identities. Molecular Cell 2010, 38, 576–589. [CrossRef]
- Ramírez, F.; Ryan, D.P.; Grüning, B.; Bhardwaj, V.; Kilpert, F.; Richter, A.S.; Heyne, S.; Dündar, F.; Manke, T. deepTools2: A next Generation Web Server for Deep-Sequencing Data Analysis. Nucleic Acids Research 2016, 44, W160–W165. [CrossRef]
- Robinson, J.T.; Thorvaldsdóttir, H.; Winckler, W.; Guttman, M.; Lander, E.S.; Getz, G.; Mesirov, J.P. Integrative Genome Viewer. Nature Biotechnology 2011, 29, 24–26. [CrossRef]
- Carroll, T.; Barrows, D. Profileplyr: Visualization and Annotation of Read Signal over Genomic Ranges with Profileplyr 2021.
- Tremblay, B.J.-M. Universalmotif: Import, Modify, and Export Motifs with R 2021.
- Wang, W.-B.; Levy, D.E.; Lee, C.-K. STAT3 Negatively Regulates Type I IFN-Mediated Antiviral Response. The Journal of Immunology 2011, 187, 2578–2585. [CrossRef]
- Costa-Pereira, A.P.; Williams, T.M.; Strobl, B.; Watling, D.; Briscoe, J.; Kerr, I.M. The Antiviral Response to Gamma Interferon. 2002. [CrossRef]
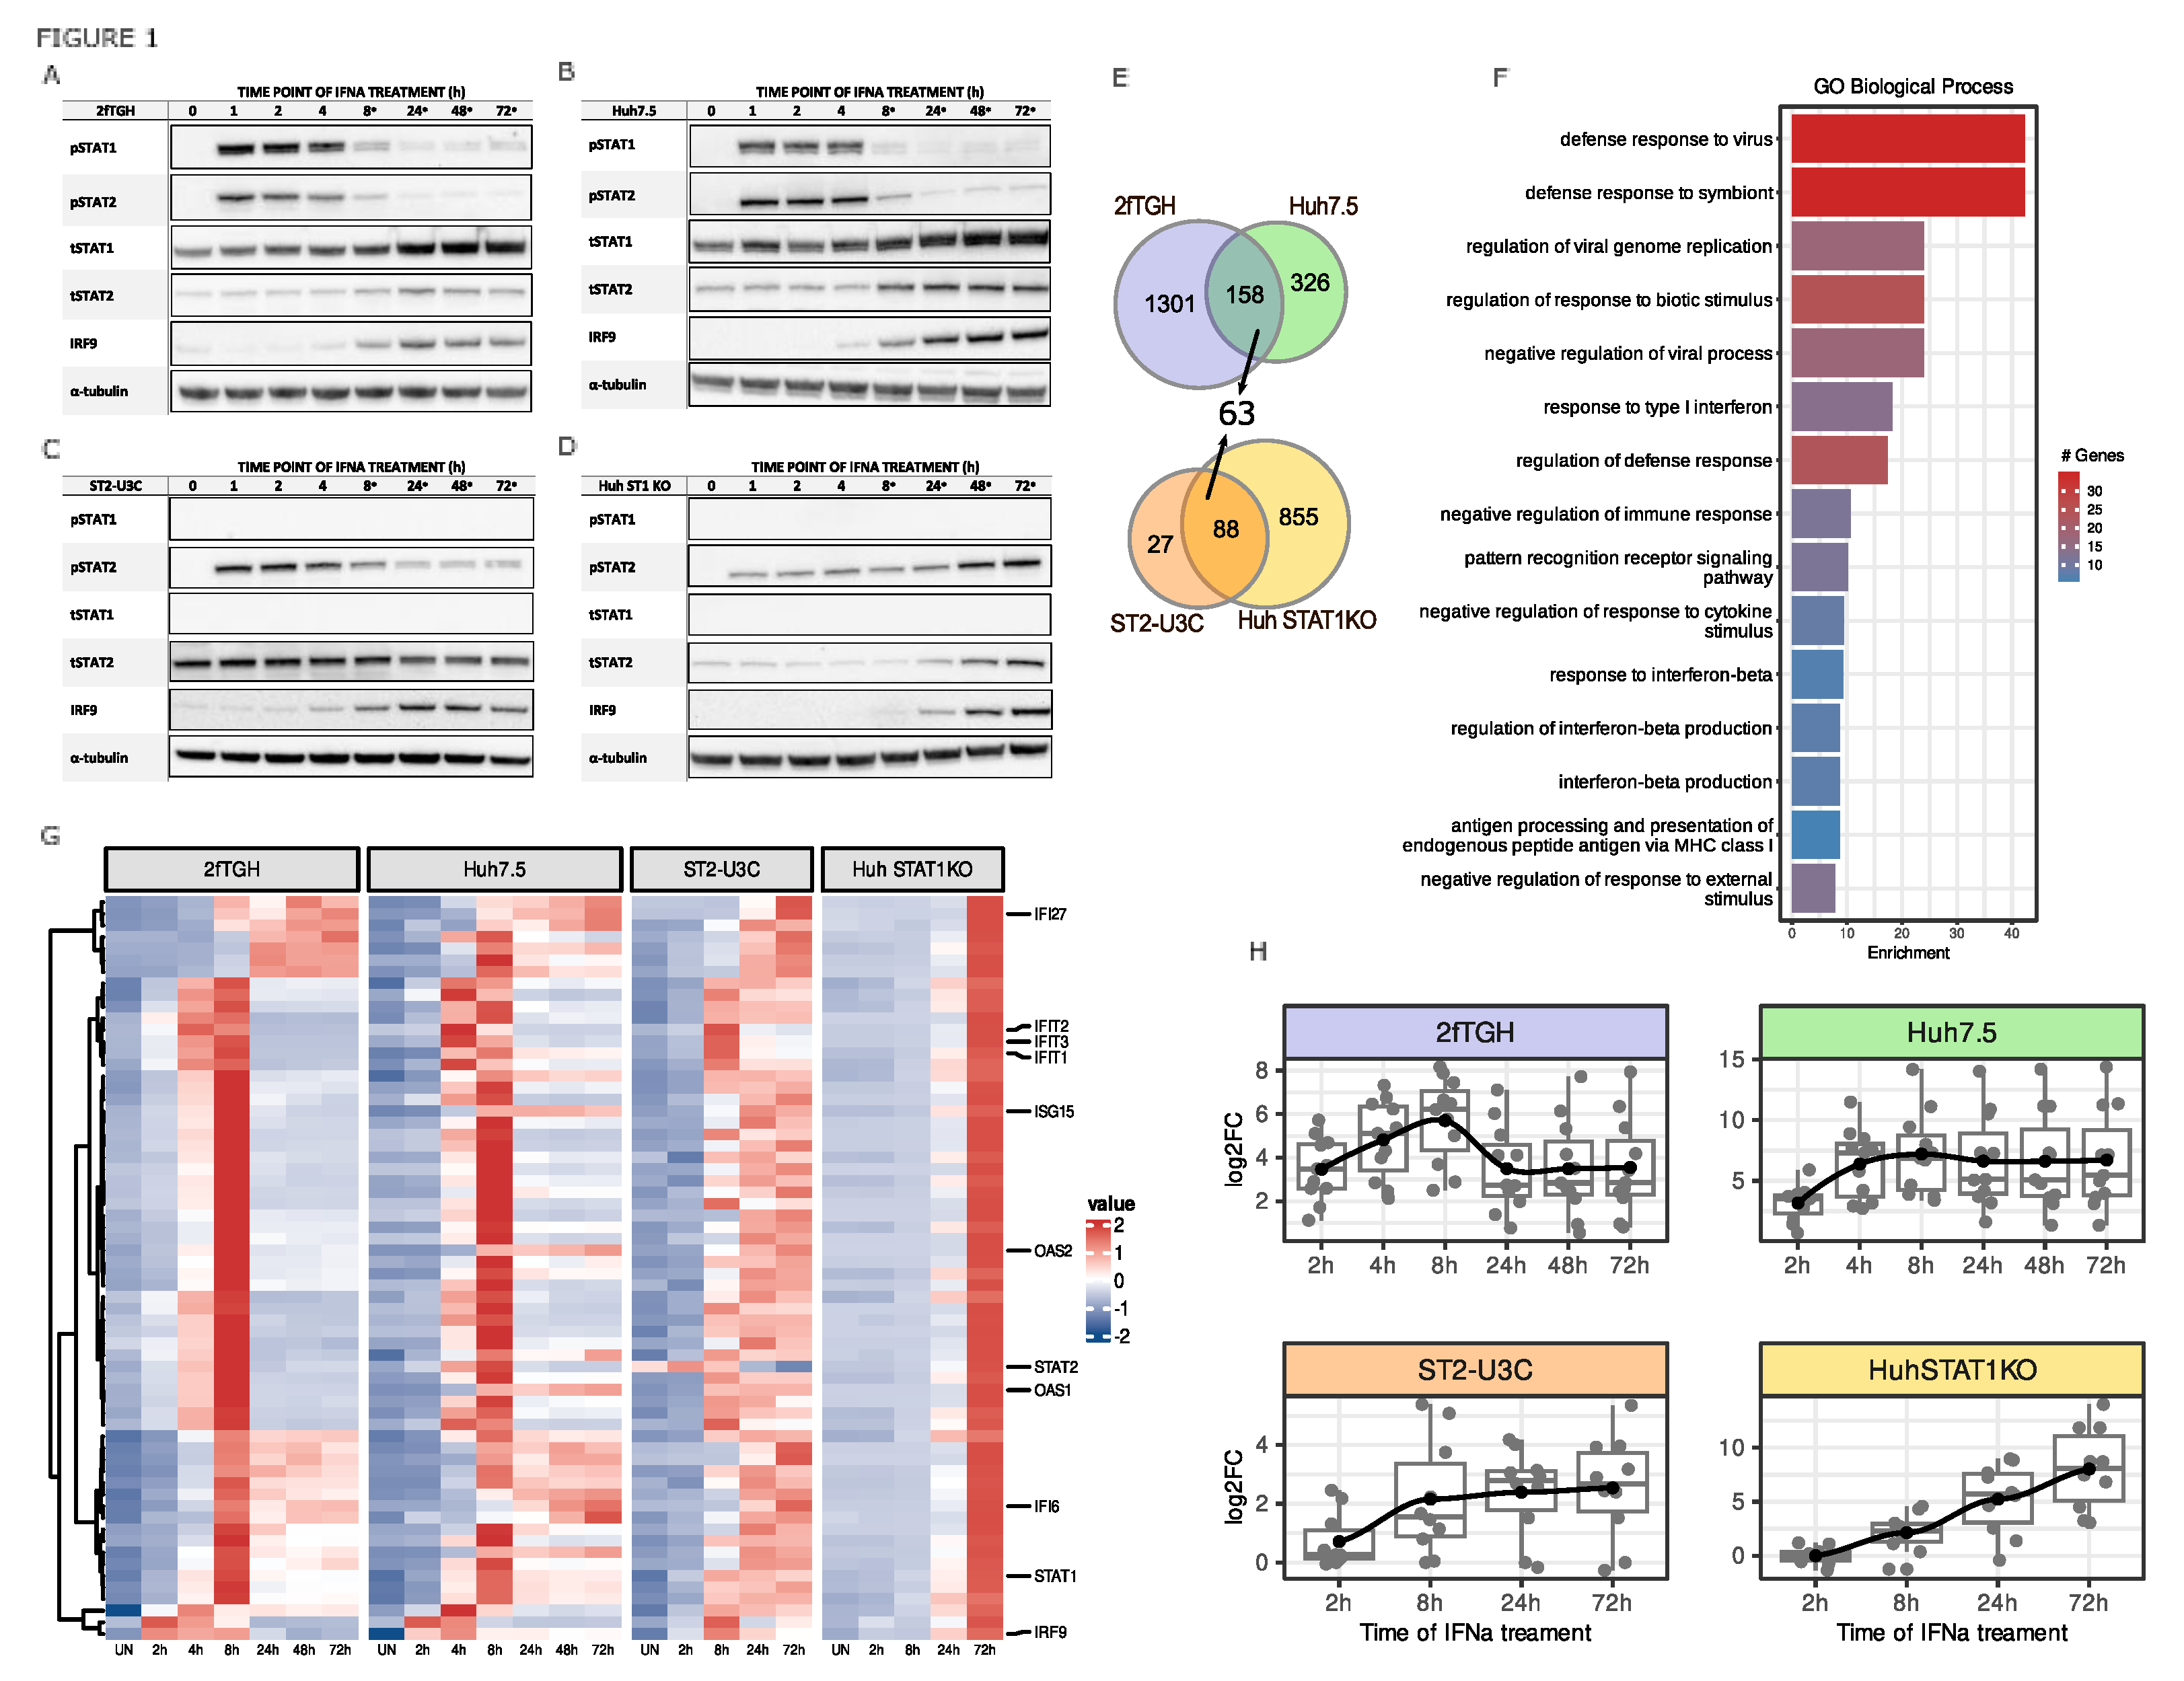
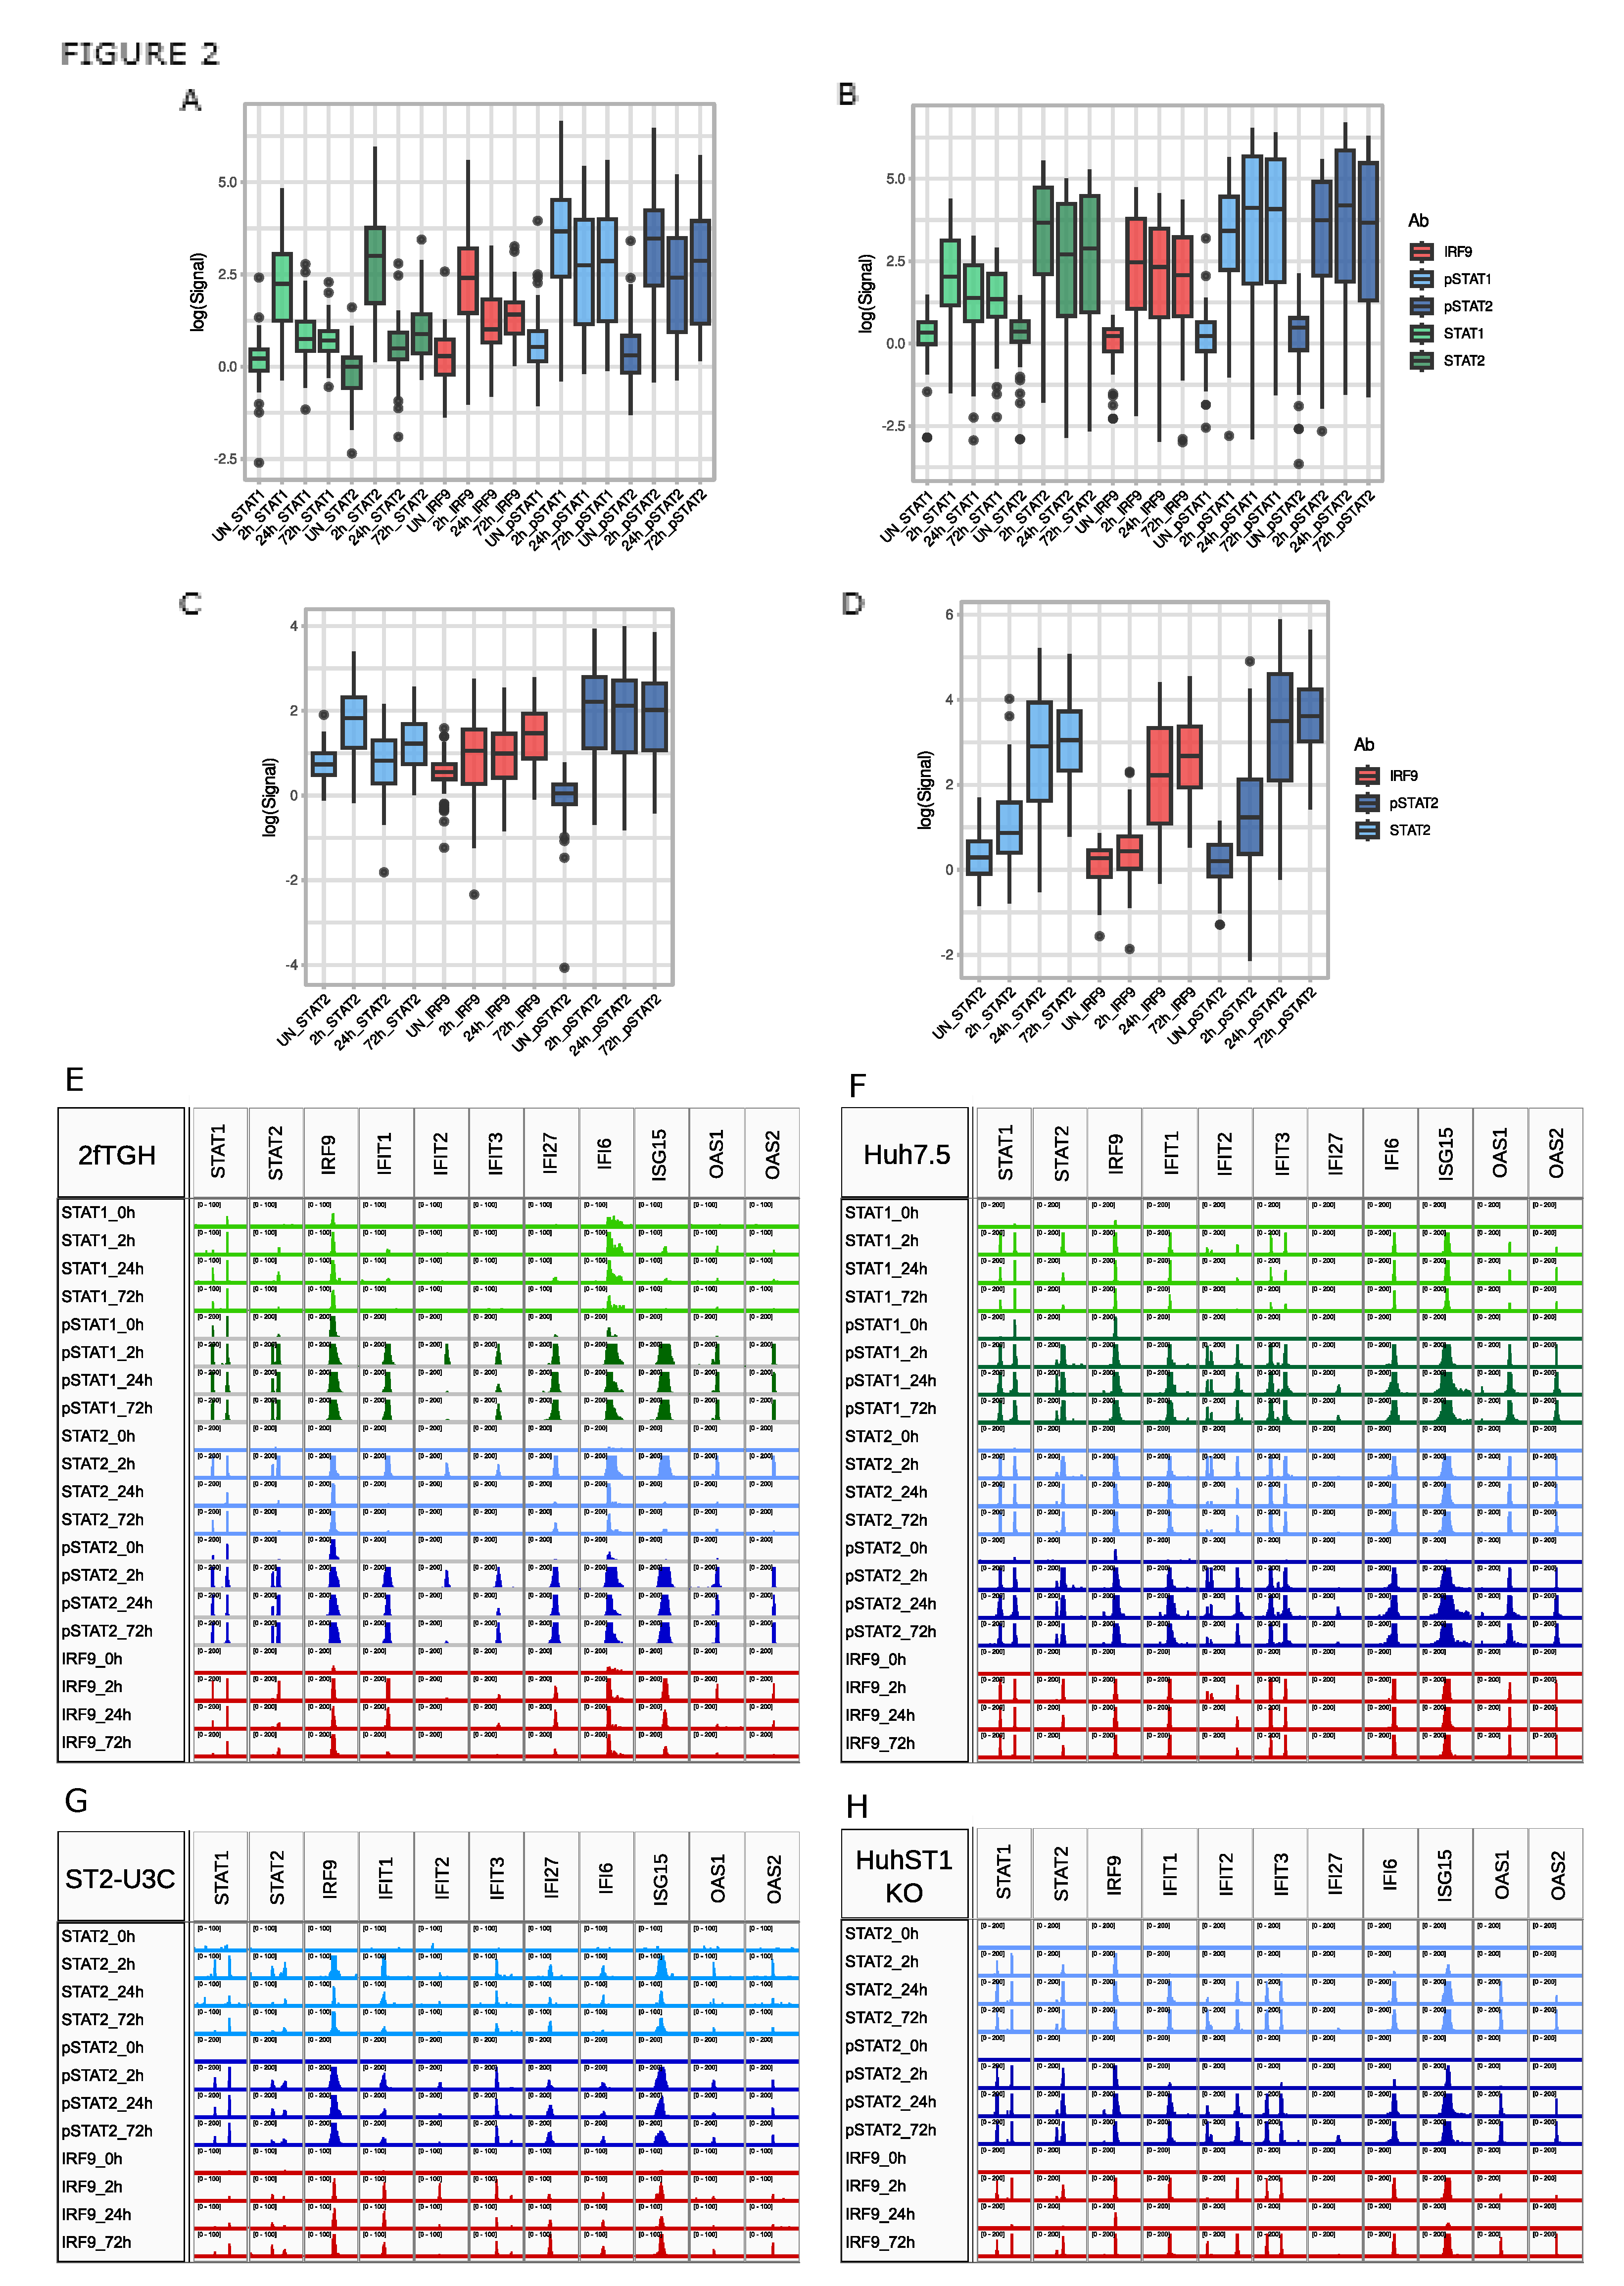
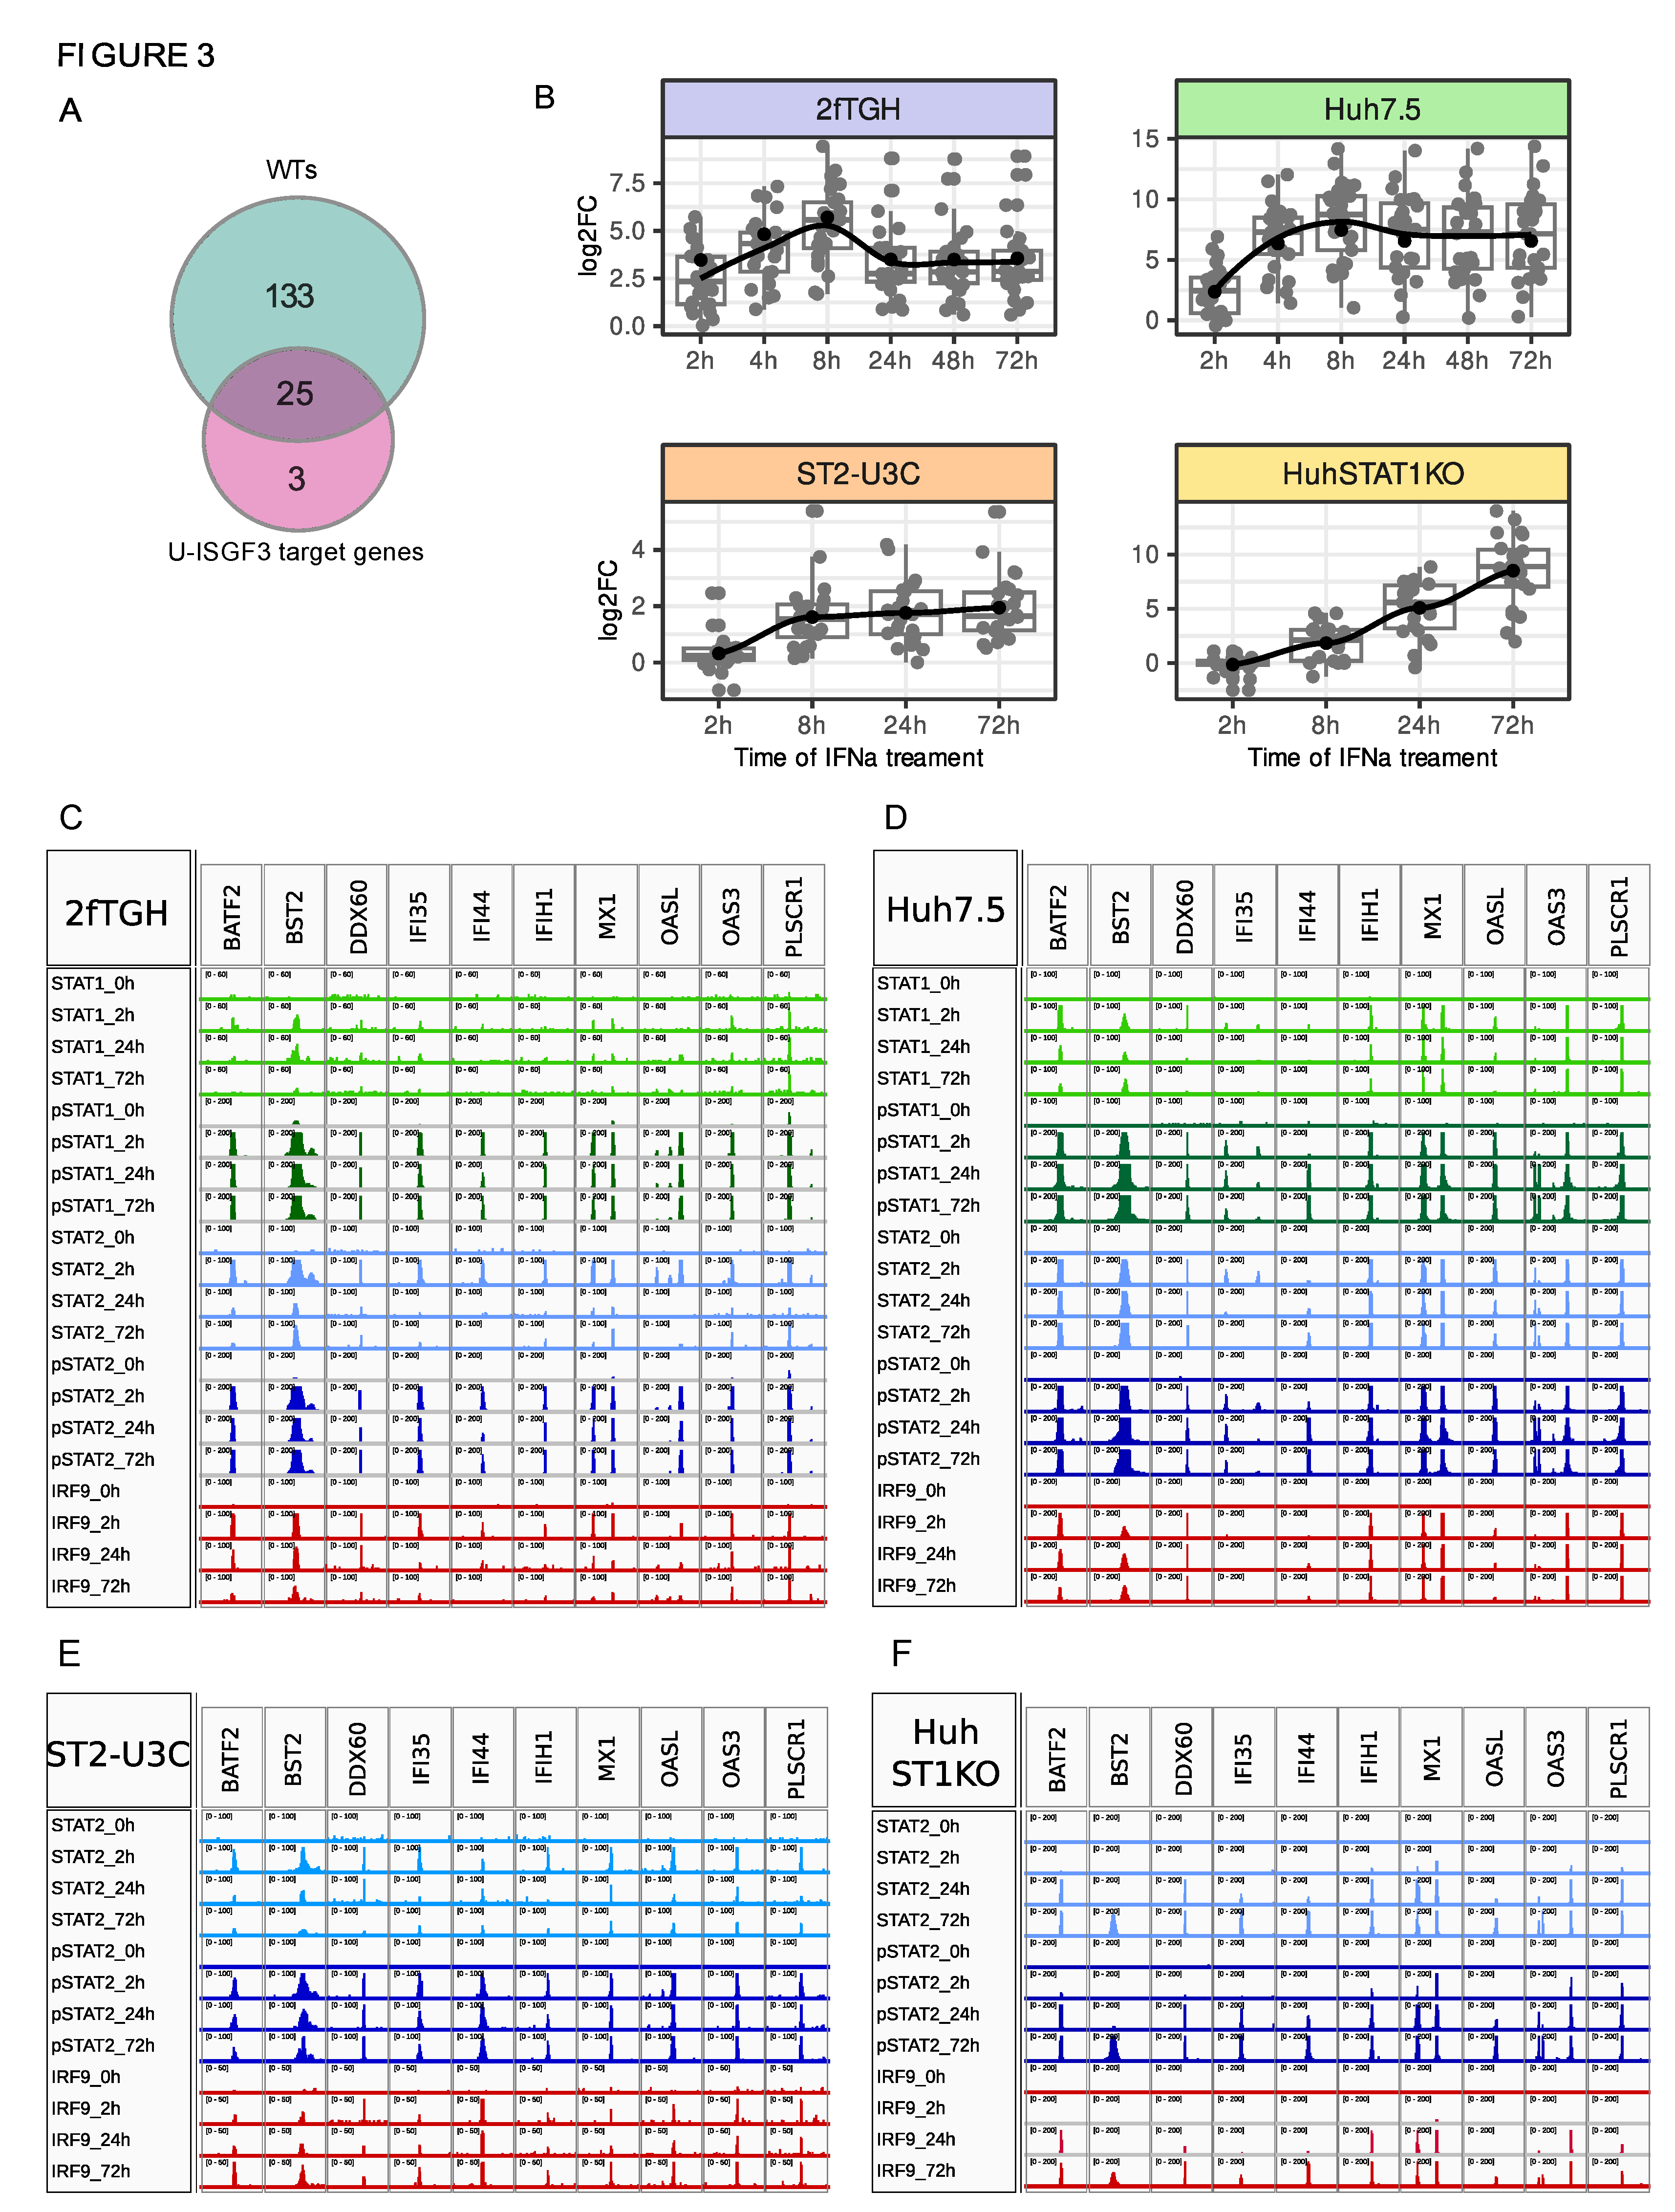
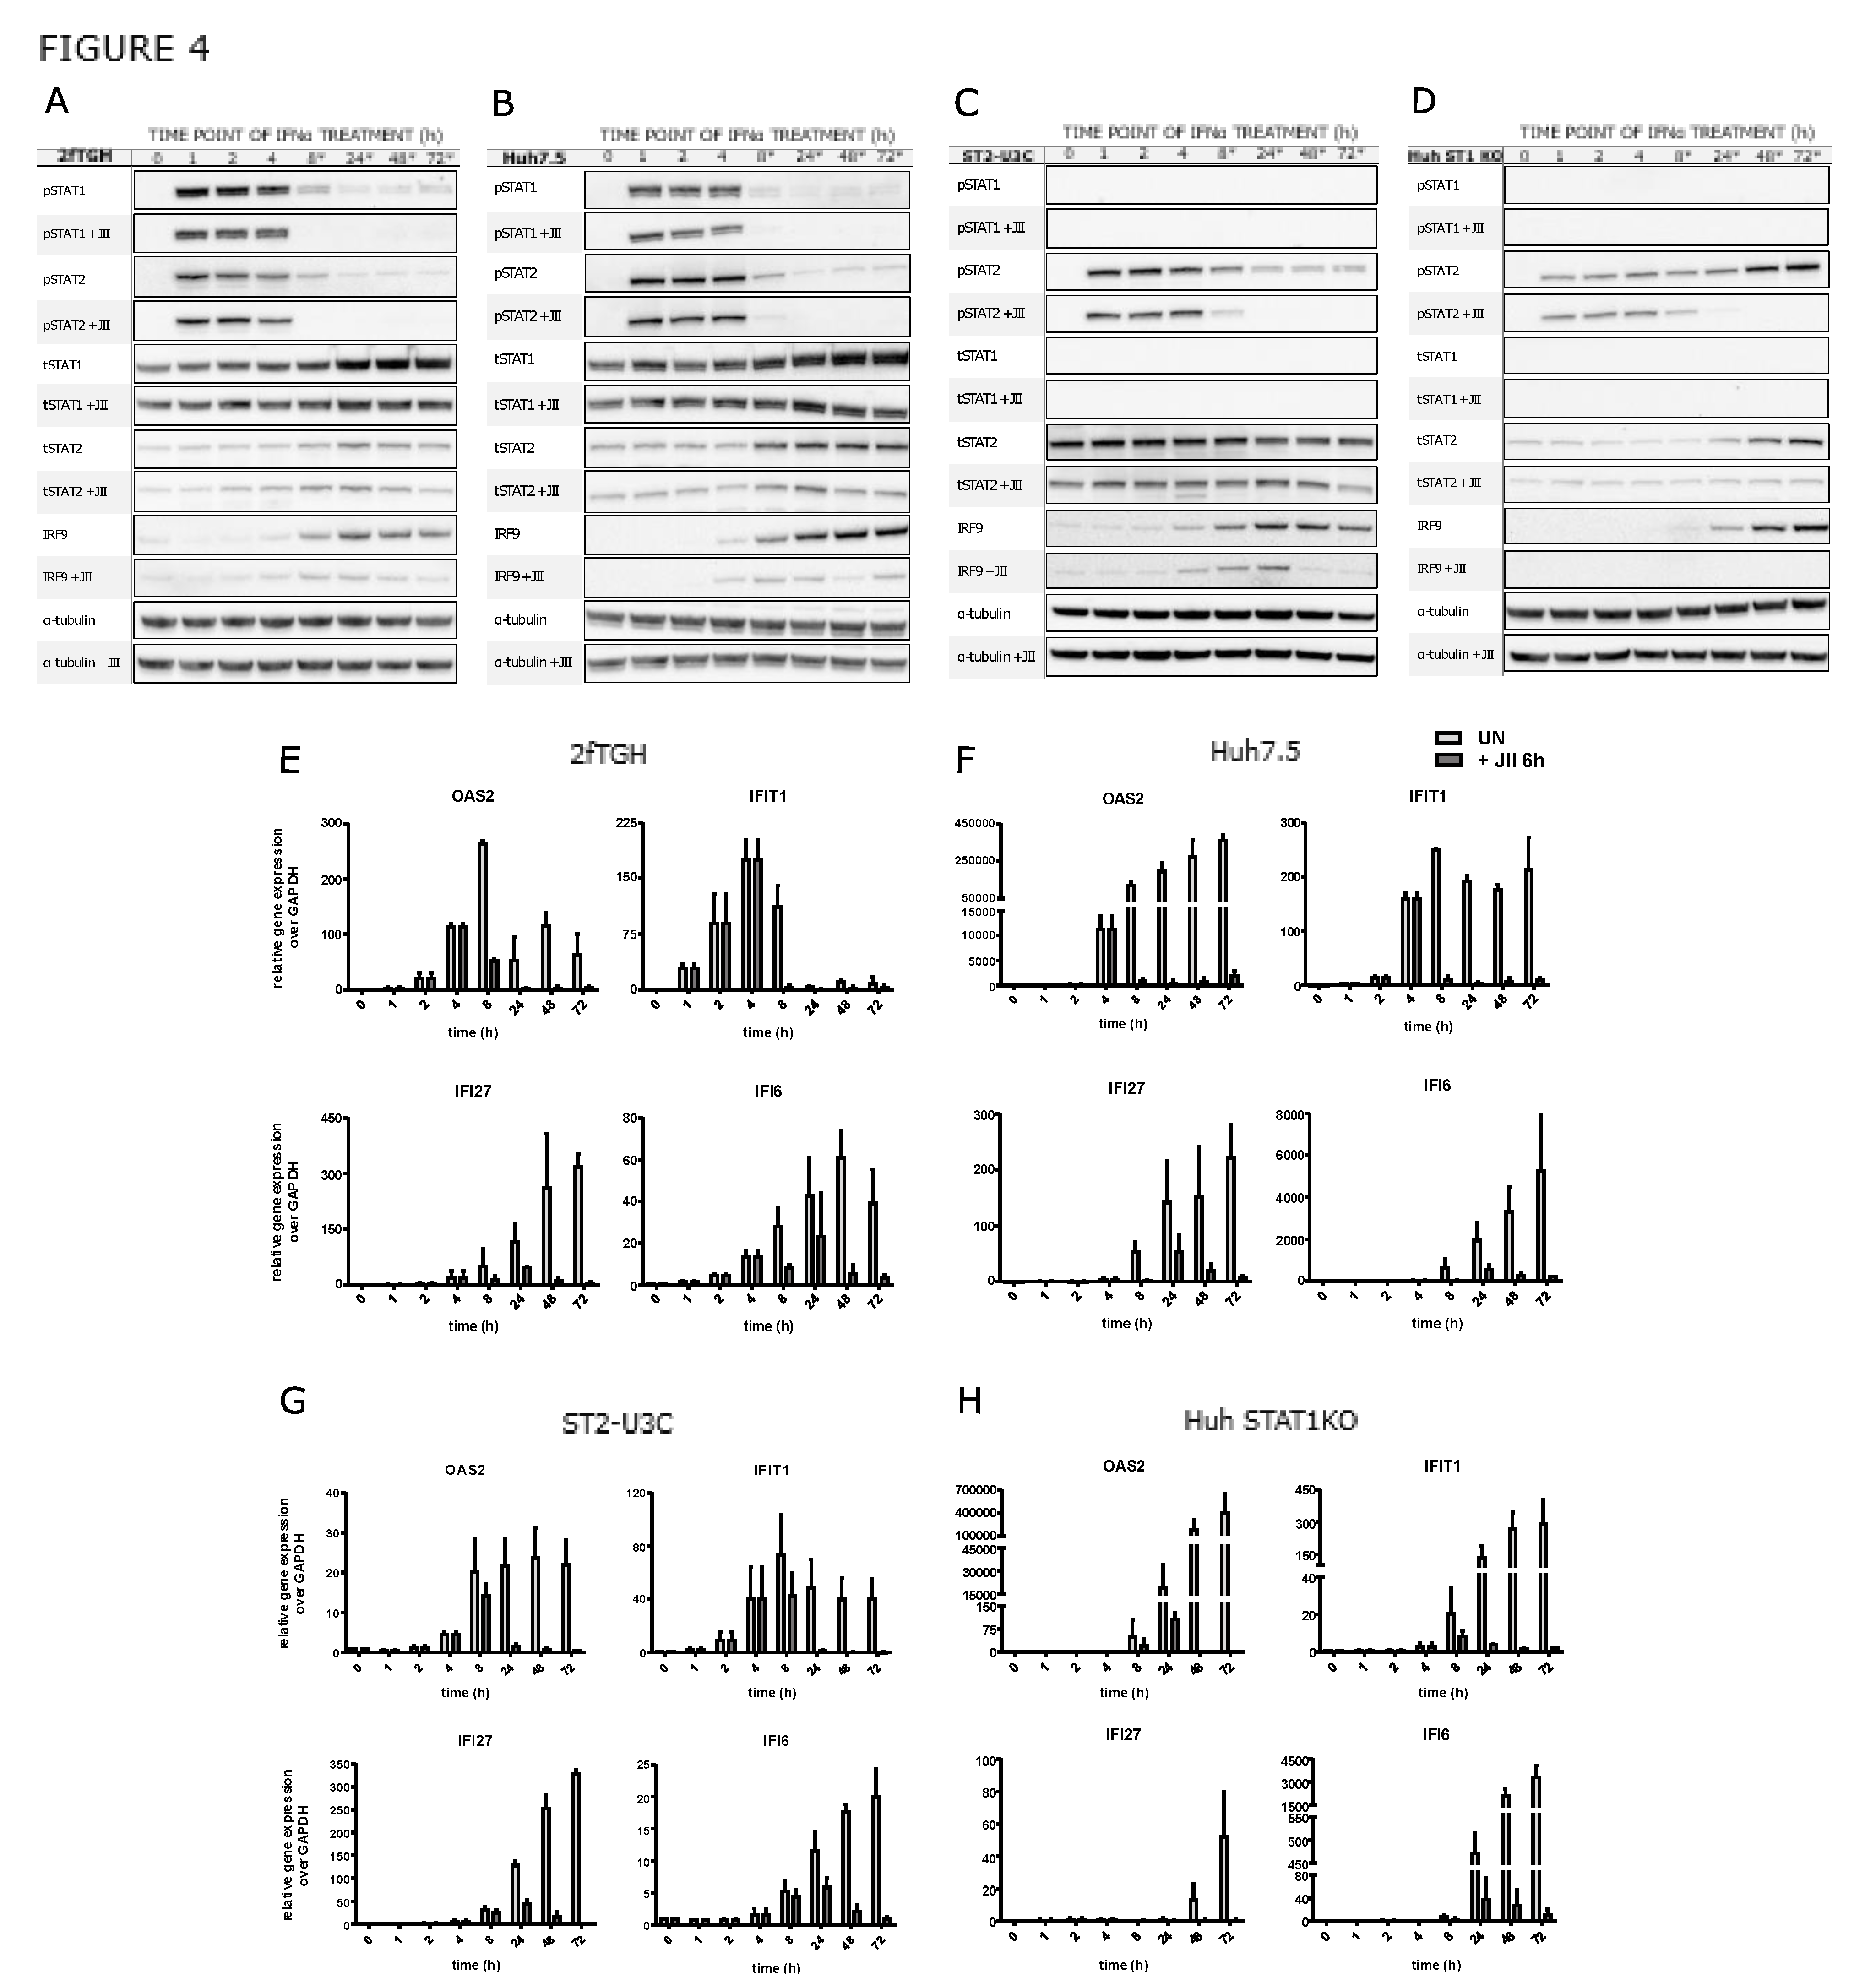
| Gene name | Log2FC | padj |
|---|---|---|
| APOL1 | 1,179548695 | 0,004684412 |
| APOL6 | 1,004077196 | 0,038984999 |
| BST2 | 6,135203905 | 1,35927E-50 |
| C1R | 1,408098465 | 0,031410471 |
| CASP1 | 1,910053199 | 0,015147452 |
| DDX60 | 1,821430803 | 0,000316359 |
| DENND2D | 2,789095461 | 0,048039125 |
| DTX3L | 1,352686939 | 0,000116872 |
| EIF2AK2 | 1,52332203 | 3,34411E-07 |
| ERAP1 | 0,965079469 | 0,000499671 |
| ERAP2 | 1,130778979 | 0,003692999 |
| HELZ2 | 0,96070728 | 0,014920517 |
| HERC6 | 1,618186178 | 0,000600321 |
| HLA-B | 1,178511842 | 0,001660318 |
| HLA-C | 1,456434161 | 1,75465E-07 |
| IFI27 | 4,788538368 | 0,000413159 |
| IFI6 | 4,034905117 | 3,7793E-25 |
| IFIT1 | 3,212109227 | 1,06397E-13 |
| IFIT2 | 2,829436266 | 5,97437E-05 |
| IFIT3 | 1,906823009 | 4,21176E-05 |
| IFITM1 | 2,733004839 | 5,38304E-20 |
| IFITM3 | 0,752739796 | 0,007072815 |
| IRF9 | 7,842346026 | 1,87668E-80 |
| ISG15 | 1,562830472 | 2,90124E-05 |
| NRP2 | 0,870136135 | 0,002302707 |
| OAS1 | 1,471623318 | 0,002759109 |
| OAS2 | 4,639318222 | 1,20916E-26 |
| OAS3 | 0,941039617 | 0,028400103 |
| PARP10 | 1,009511582 | 0,001614949 |
| PARP14 | 1,66043833 | 3,31686E-08 |
| PARP9 | 1,619836156 | 4,81902E-05 |
| PDGFRL | 2,314318252 | 0,013940482 |
| RTP4 | 3,339158993 | 0,001009013 |
| SAMHD1 | 1,619836156 | |
| STAT1 | 3,374870457 | 2,50965E-06 |
| STAT2 | 5,052303916 | 1,9208E-92 |
| THEMIS2 | 1,173305564 | 0,035610056 |
| TRANK1 | 2,347593899 | 1,32527E-06 |
| UBA7 | 1,029286496 | 0,013001475 |
| UBE2L6 | 1,165570135 | 0,00053531 |
| USP18 | 3,111223801 | 4,5583E-06 |
| XAF1 | 3,694263817 | 1,24333E-05 |
| ZBTB42 | 1,070772287 | 0,031039847 |
| Gene name | Primer sequence | |
| Forward | Reverse | |
| GAPDH | CAATATGATTCCACCCATGGCAA | GATCTCGCTCCTGGAAGATGG |
| IFI27 | GTCACTGGGAGCAACTGGAC | GGGCAGGGAGCTAGTAGAAC |
| IFI6 | ATCCTGAATGGGGGCGG | AGATACTTGTGGGTGGCGTAG |
| OAS2 | CAATCAGCGAGGCCAGTAAT | TCCAGGTTGGGAGAAGTCAA |
| IFIT1 | CTTGCAGGAAACACCCACTT | CCTCTAGGCTGCCCTTTTGT |
| Gene name | Primer sequence | |
| Forward | Reverse | |
| NANOG | TGGTAGACGGGATTAACTGAG | GAAGGCTCTATCACCTTAGA |
| OAS2 | CGCTGCAGTGGGTGGAGAGA | GCCGGCAAGACAGTGAATGG |
| IFI27 | CTTCTGGACTGCGCATGAGG | CCACCCCGACTGAAGCACTG |
| IFIT1 | GCAGGAATTCCGCTAGCTTT | GCTAAACAGCAGCCAATGGT |
| ISG15 | AGGGAAACCGAAACTGAAGC | TGAGGCACACACGTCAGG |
| STAT1 | CGCTCAGCCAATTAGACGC | GTAAACAGAACGCCAGTTCCC |
| STAT2 | TGTCACCAAGCAGGCTGTC | TCTGTTCTGTTAGGCTCAGGC |
| IRF9 | AGATGCTGCTGCCCTCTAGT | CCCCTTTCTACAGTCCCCA |
Disclaimer/Publisher’s Note: The statements, opinions and data contained in all publications are solely those of the individual author(s) and contributor(s) and not of MDPI and/or the editor(s). MDPI and/or the editor(s) disclaim responsibility for any injury to people or property resulting from any ideas, methods, instructions or products referred to in the content. |
© 2023 by the authors. Licensee MDPI, Basel, Switzerland. This article is an open access article distributed under the terms and conditions of the Creative Commons Attribution (CC BY) license (http://creativecommons.org/licenses/by/4.0/).


