1. Introduction
The ever growing or flourishing economy brought a massive increase in the number of motor vehicles, mainly private cars, which has affected the public space quality [
2]. This is particularly true of small towns and spa where public spaces play a specific role by defining the prestige and attractiveness of the place. However, this must not affect the well-being of the local community or compromise the safety of traffic or availability of transport means. Bearing in mind sustainable development of urban environment, these requirements should be considered and implemented in line with the accepted urban planning principles. As the first step of the process, the existing transport system of the town of spa should be analysed, paying attention to the designated functions [
3,
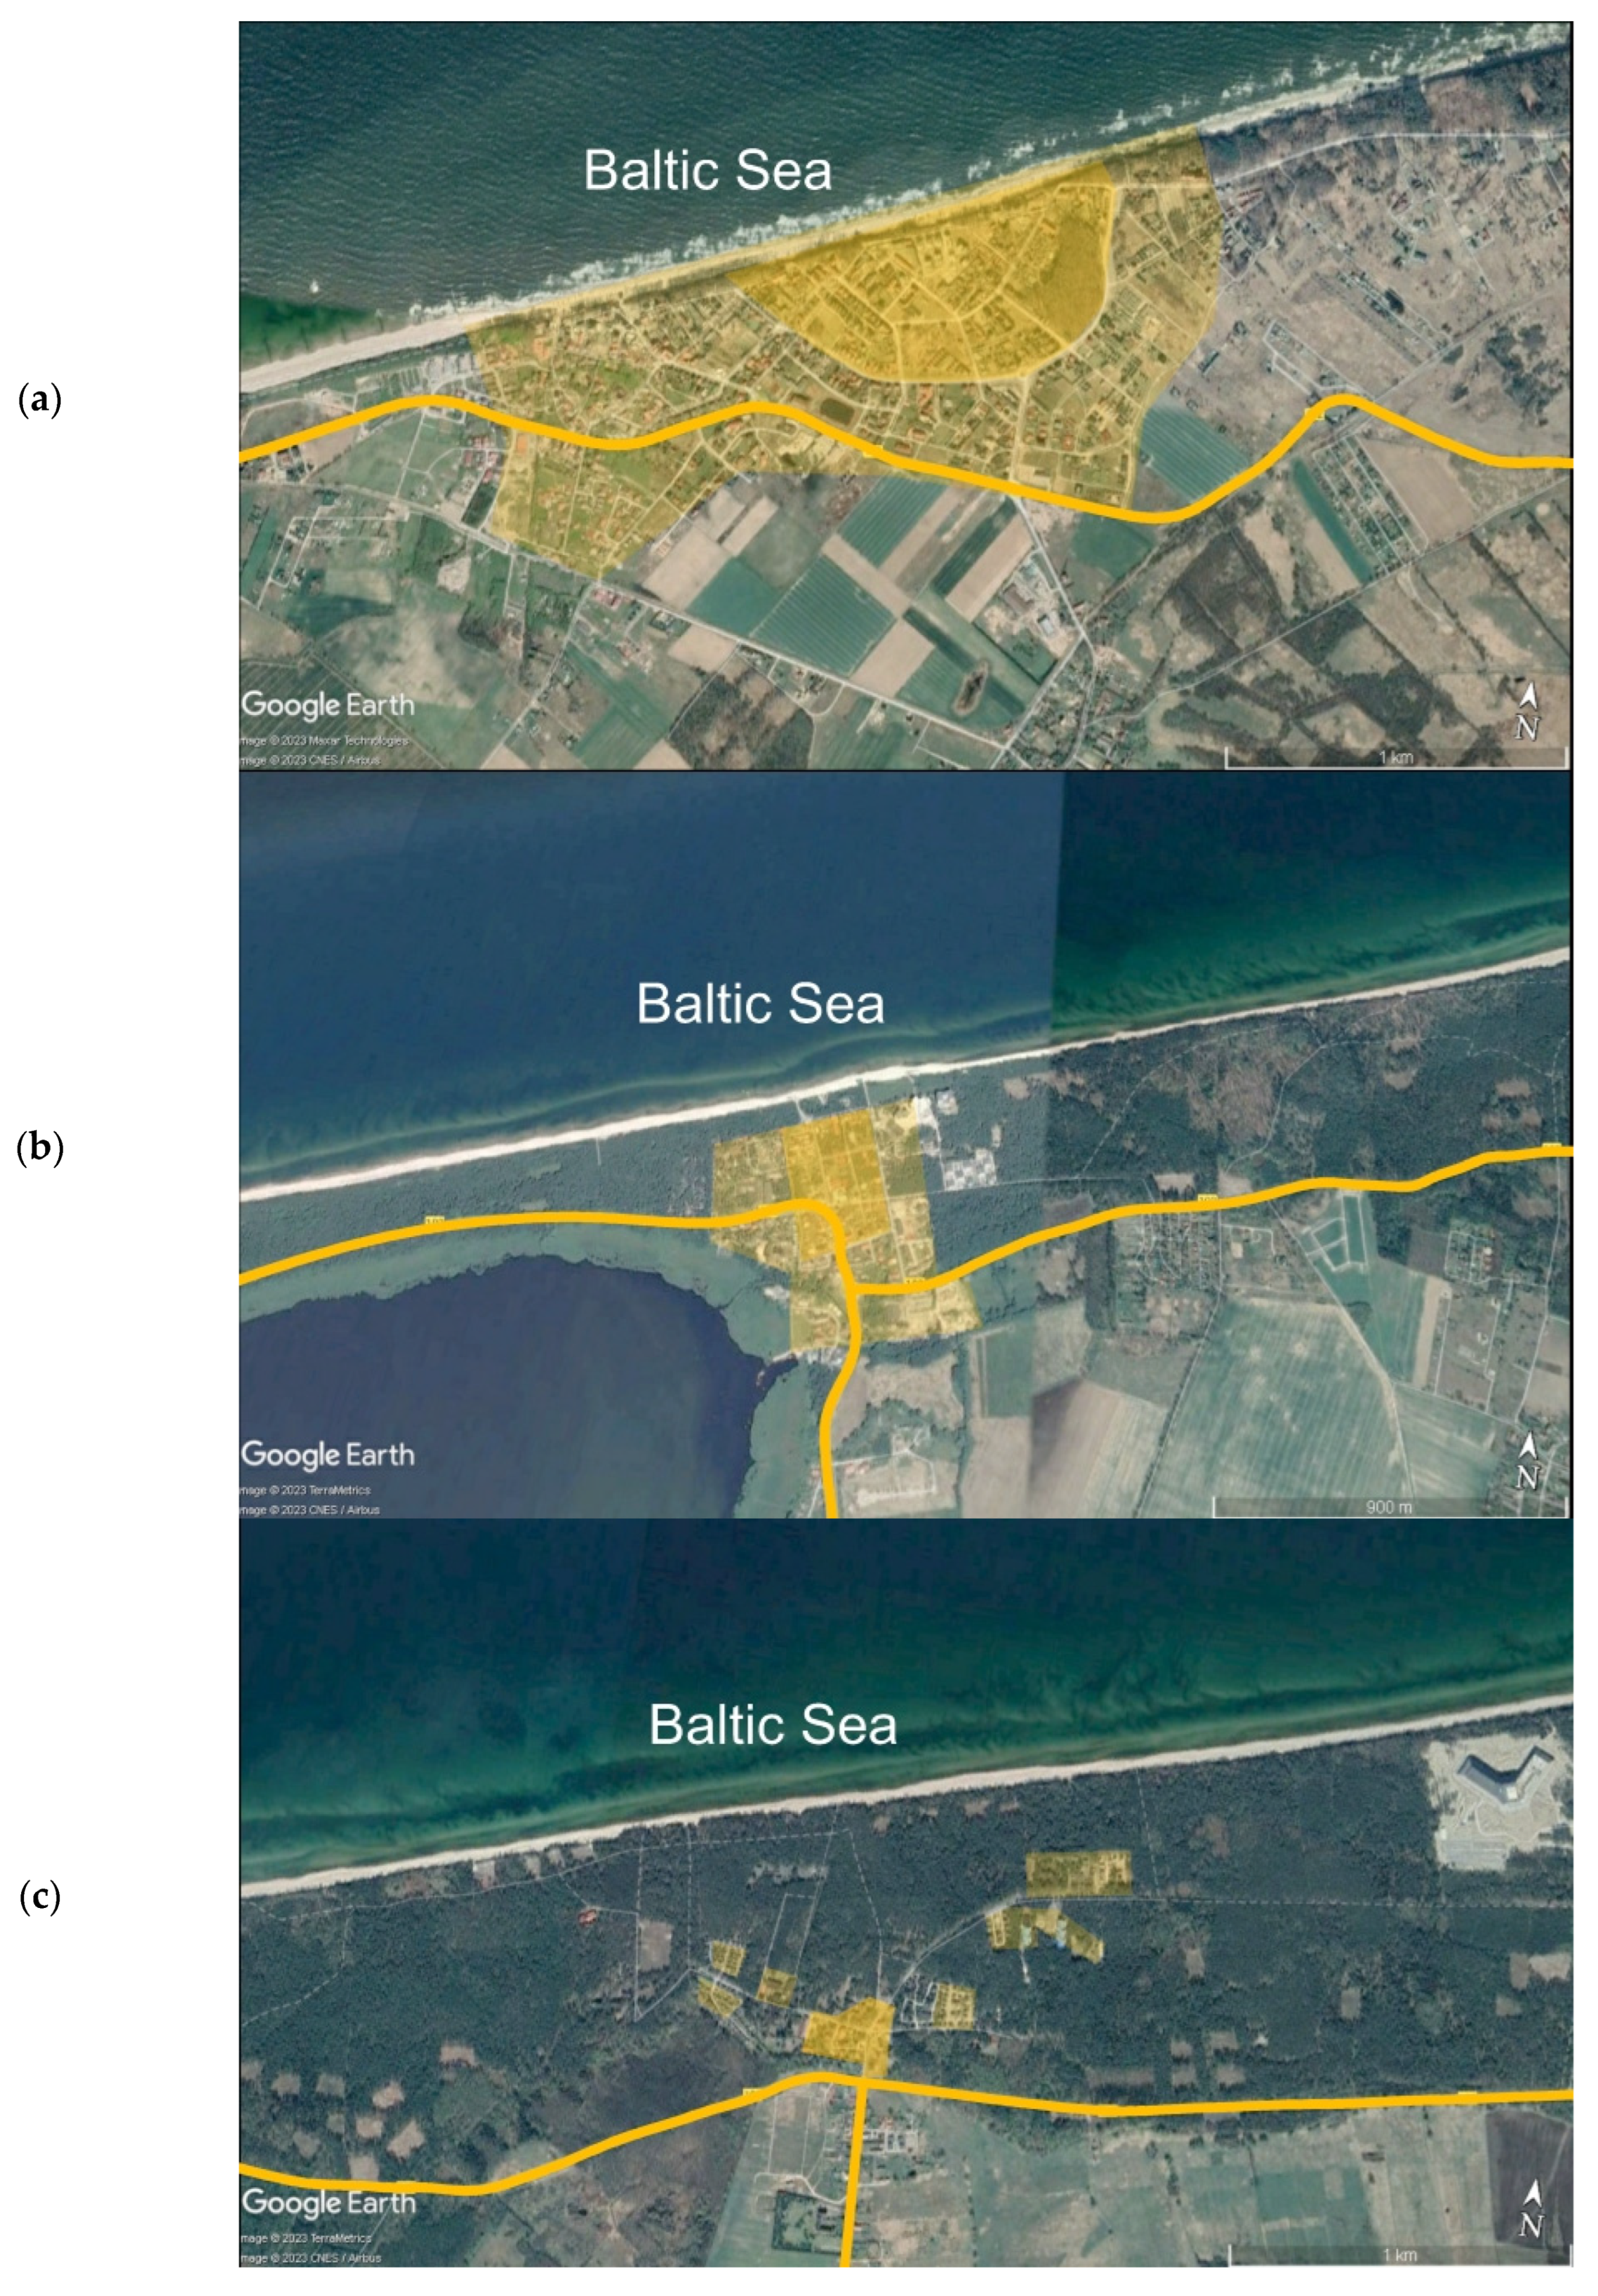
4]. This should include determination of the local residents’ and tourists’ needs, bearing in mind the intended use and function of a given public space. Towns can have one of the following spatial structures
Figure 1:
- -
monocentric, with a clear-cut centre both functionally and spatially and generally oblong, elliptical, square, rectangular or semi-circular shape (
Figure 1a and
Figure 1b),
- -
bipolar, made up of two or more distinctly bordered urban entities that may merge together into a rectangular or tubular system (
Figure 1c),
- -
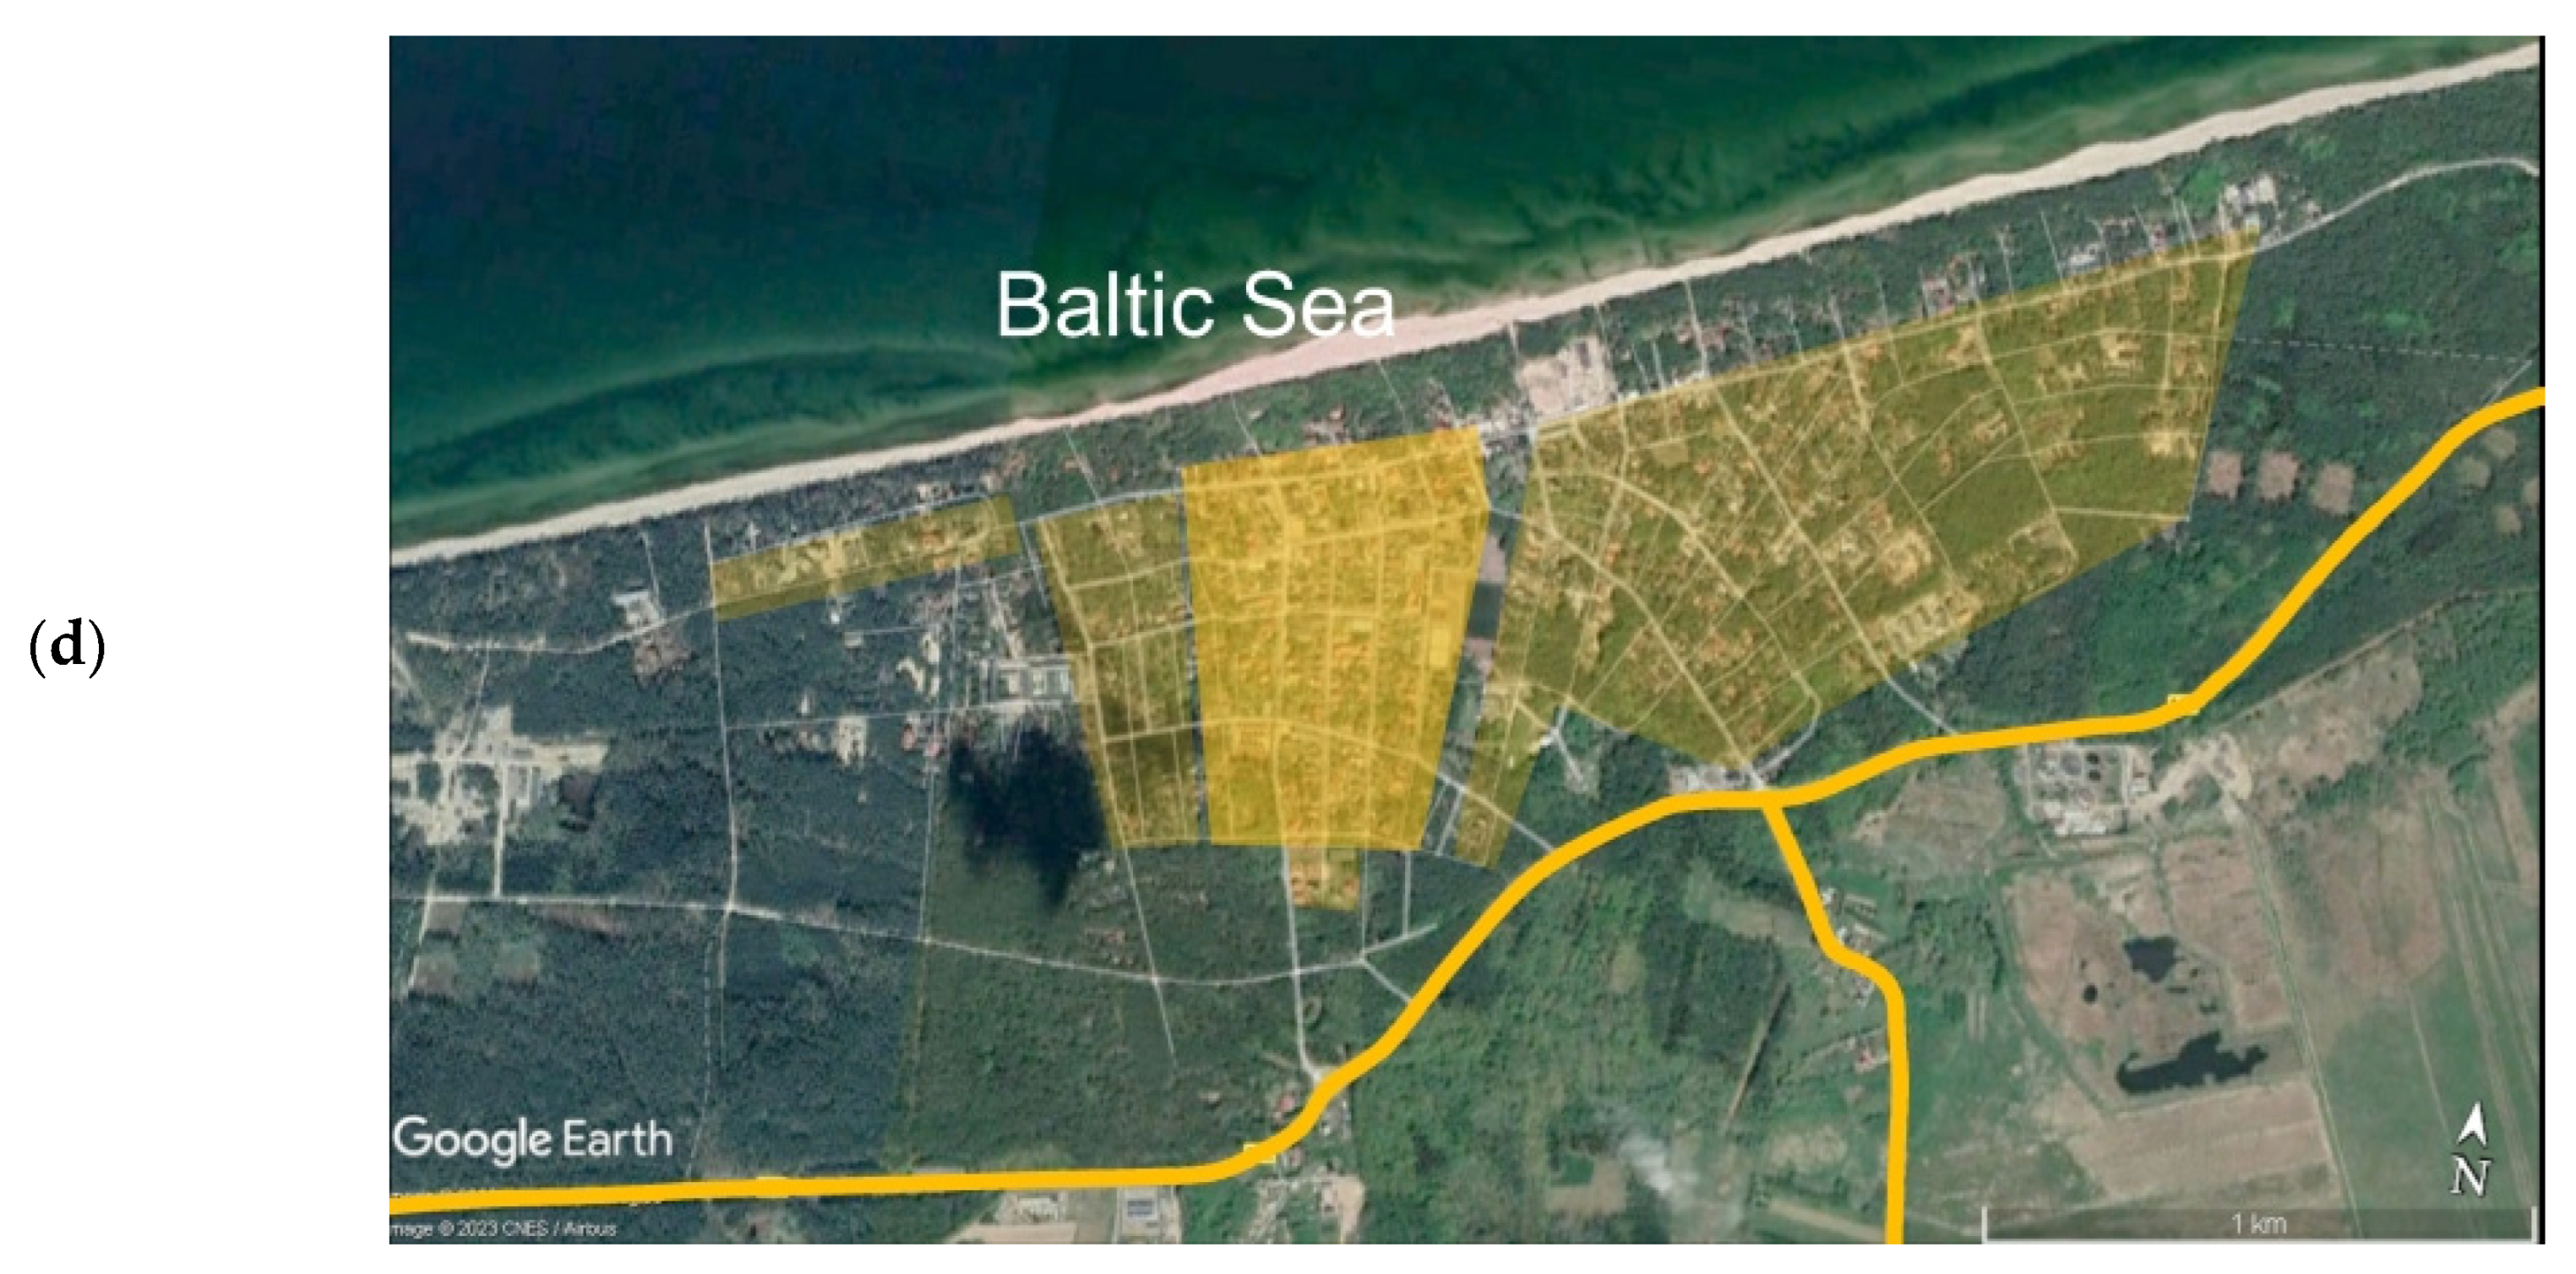
polycentric, formed through development and merging of smaller entities (
Figure 1d).
Figure 1.
Spatial structures of selected seaside settlements in Poland: (
a) monocentric semi-circular system of Pobierowo; (
b) rectangular monocentric system of Dziwnówek; (
c) bipolar system of Łukęcin; (
d) polycentric system Rewal. Source: own elaboration against the background of a satellite photo from Google Earth [
5].
Figure 1 shows some Polish seaside settlements where brighter orange areas are the historic centres and indigenous residents’ homes and paler orange areas are occupied by recently built resorts and homes of younger generations. The route of the provincial road running through these illustrative spas is also marked.
When contemplating projects intended to address transport issues and revive smaller settlements and spas in line with the sustainable development principles it is indispensable to consider the four above-mentioned sustainability pillars: human, social, economic and environmental. The first wave of urban sustainability projects aimed at public space, social or economic revival involved regeneration of urban green areas, planning of green streets and green infrastructure and care for the natural environment [
6,
7,
8,
9]. These factors should be taken collectively as the basis for preparation of traffic calming projects. In the case of public space revival projects it is also necessary to consider a factor related to the safety of pedestrians, cyclists and drivers or passengers because pedestrian fatalities constitute a high percentage of all urban road accidents [
10,
11,
12] (ca. 70% according to [
12]). Broken down by age, 9% of these fatalities are people up to 24 years of age, 42% are between 25 and 65 years old and 49% are older than 65 years [
11]. As reported in [
12], pedestrian fatalities constitute 36% of all urban road accident fatalities in urban areas, as compared to 14% cyclists, 19% motorised two wheelers, 26% car occupants, etc.
Other challenges of public space revival planning are air pollution issues (related to ever-increasing number of motor vehicles) and traffic noise pollution caused by road traffic in general and with consideration of effective traffic management strategies (TMS) [
13,
14,
15,
16]. The air pollution and traffic noise pollution issues are main considerations in selection of appropriate traffic calming measures and planning of traffic calming systems in urban areas [
17,
18]. These considerations may be addressed through appropriate modelling [
19] or field monitoring of existing traffic calming measures [
13]. A number of studies investigated the issue of air pollution in the vicinity of existing traffic calming measures as part of traffic calming studies [
13,
20,
21,
22]. Traffic calming measures generally cause sudden slowing of traffic making vertical and horizontal deflections an undesired option when considered from the air pollution and traffic noise pollution angle [
23]. Noteworthy, this resistance to this kind of traffic calming measures, as shown by the locals, road authorities, road and landscape engineers and urban planners is directed more towards vertical defections and less towards horizontal deflections.
Traffic calming may involve urban traffic management, functional classification of the streets and/or introduction of home or 30 km/h zones in the area concerned. Other than in larger towns where 30 km/h zones may be applied in combination with home zones, in smaller towns and spas home zones are the preferred option, bearing in mind pedestrian amenity improvements. This issue is particularly evident in spa villages and recreational resorts. Various traffic calming measures i.e. horizontal and vertical deflections can be used to slow down the traffic as part of traffic calming projects [
24,
25,
26,
27,
28,
29,
30,
31,
32,
33]. These include chicanes, road narrowings, speed tables or speed humps and mini roundabouts. Two-way to one-way conversions may also be implemented as part of a traffic calming project [
34].
Raised junctions, mini roundabouts or traffic circles are used quite often in home or 30 km/h zones. The differences between roundabout and traffic circle can be found in different publications [
35,
36]. However, they generally refer to older designs of these road components, covering larger surface areas [
36]. However, in traffic-calming areas, home zones in particular, there is a tendency to design traffic circle without reconstructing the approach legs, realigning of kerblines, etc. [
37] to cut the project cost. Then it is appropriate to refer to them with the term proposed in [
38], i.e. “mini traffic calming circle”.
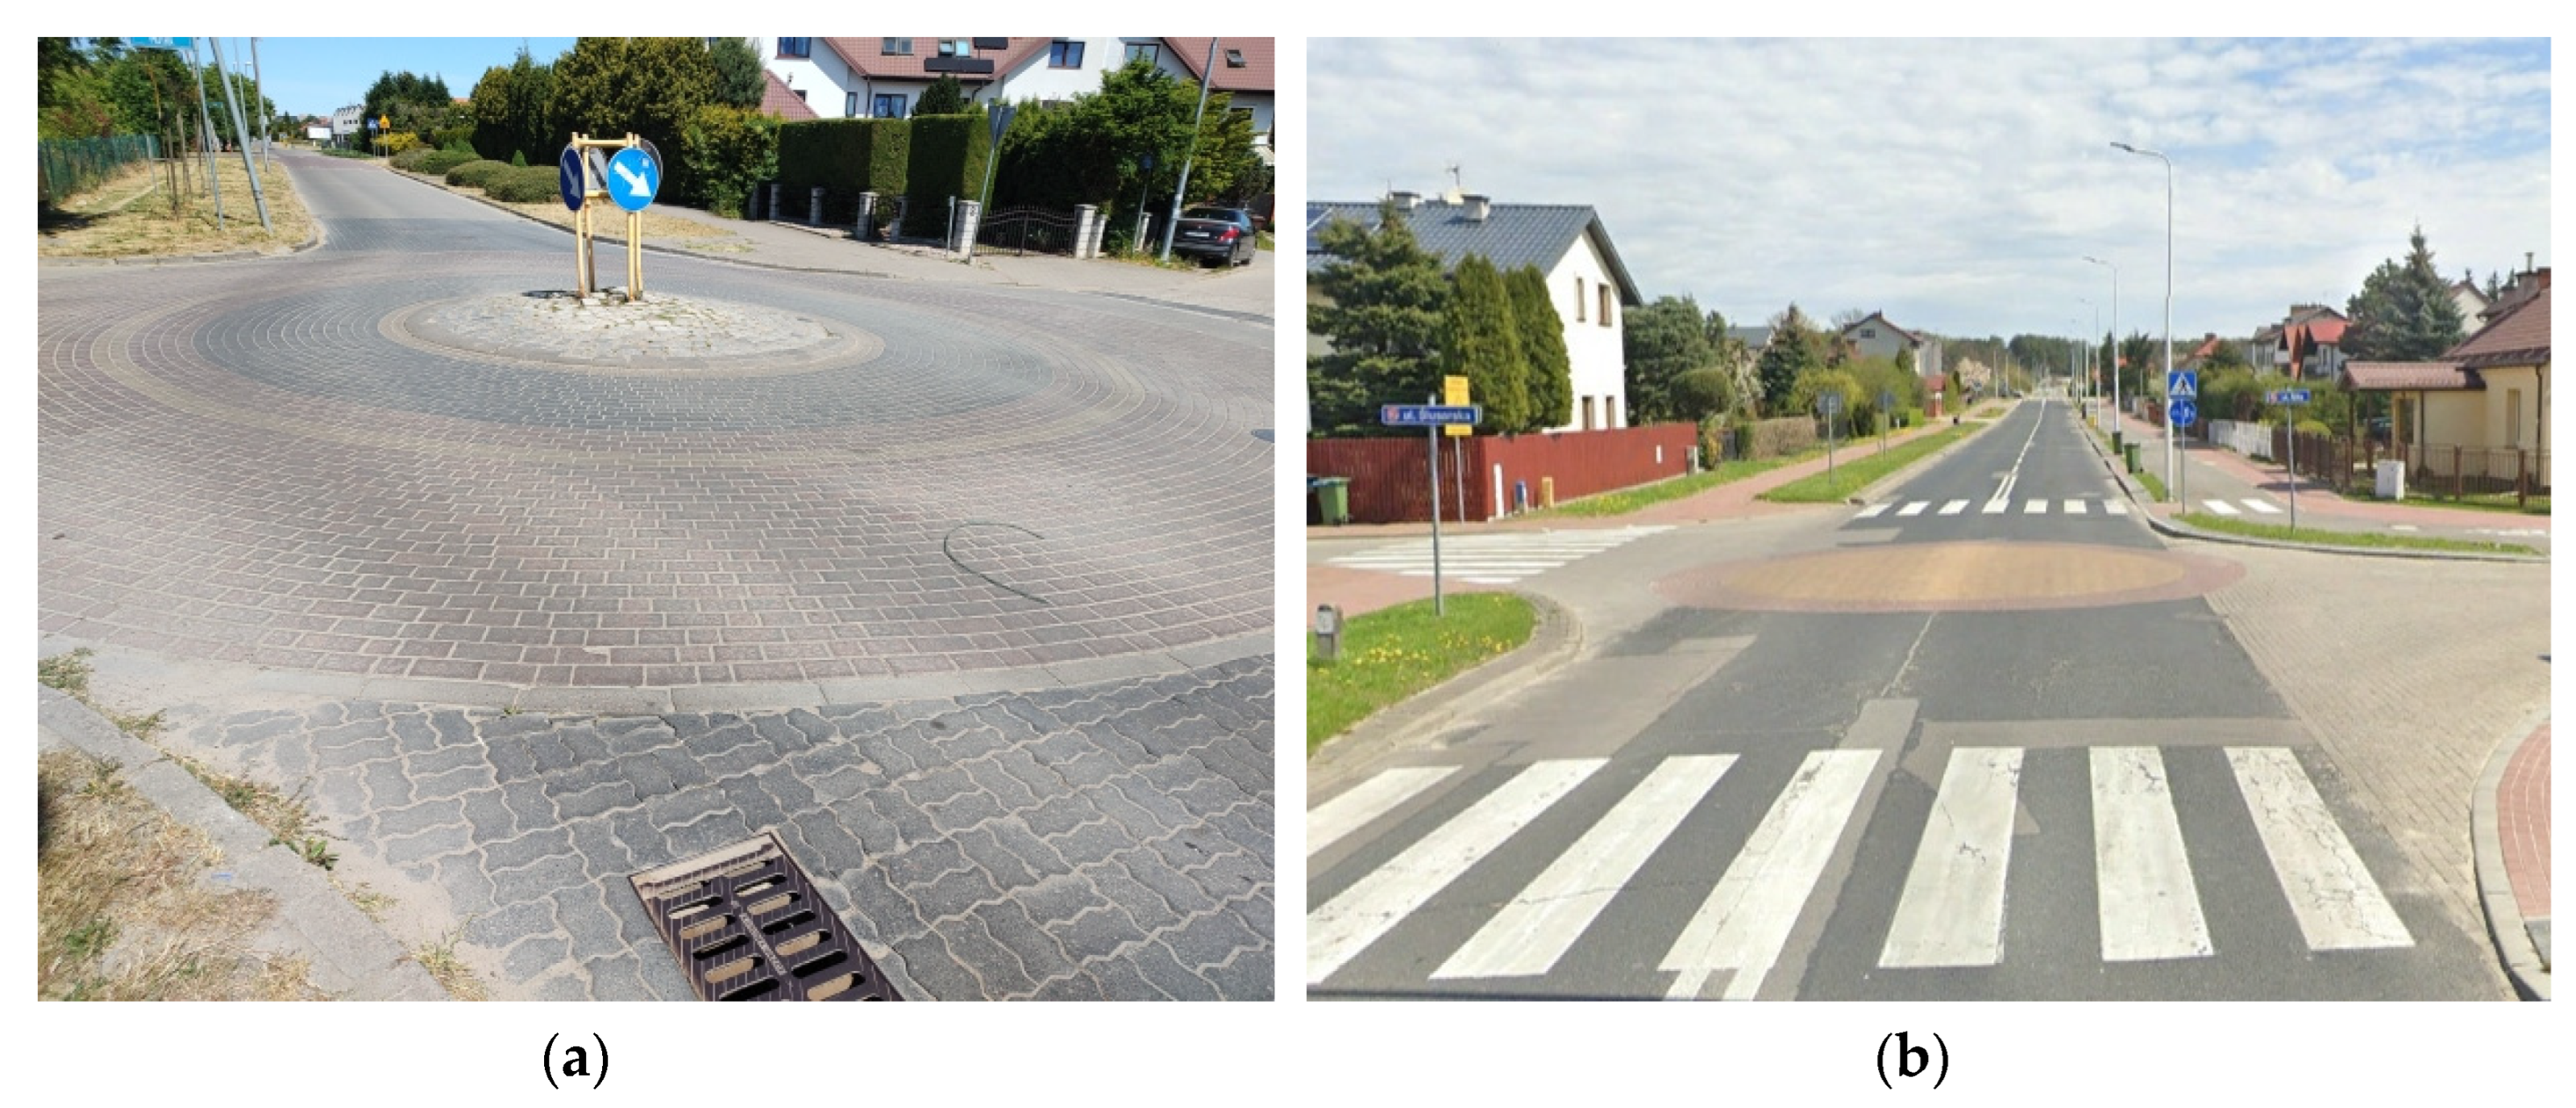
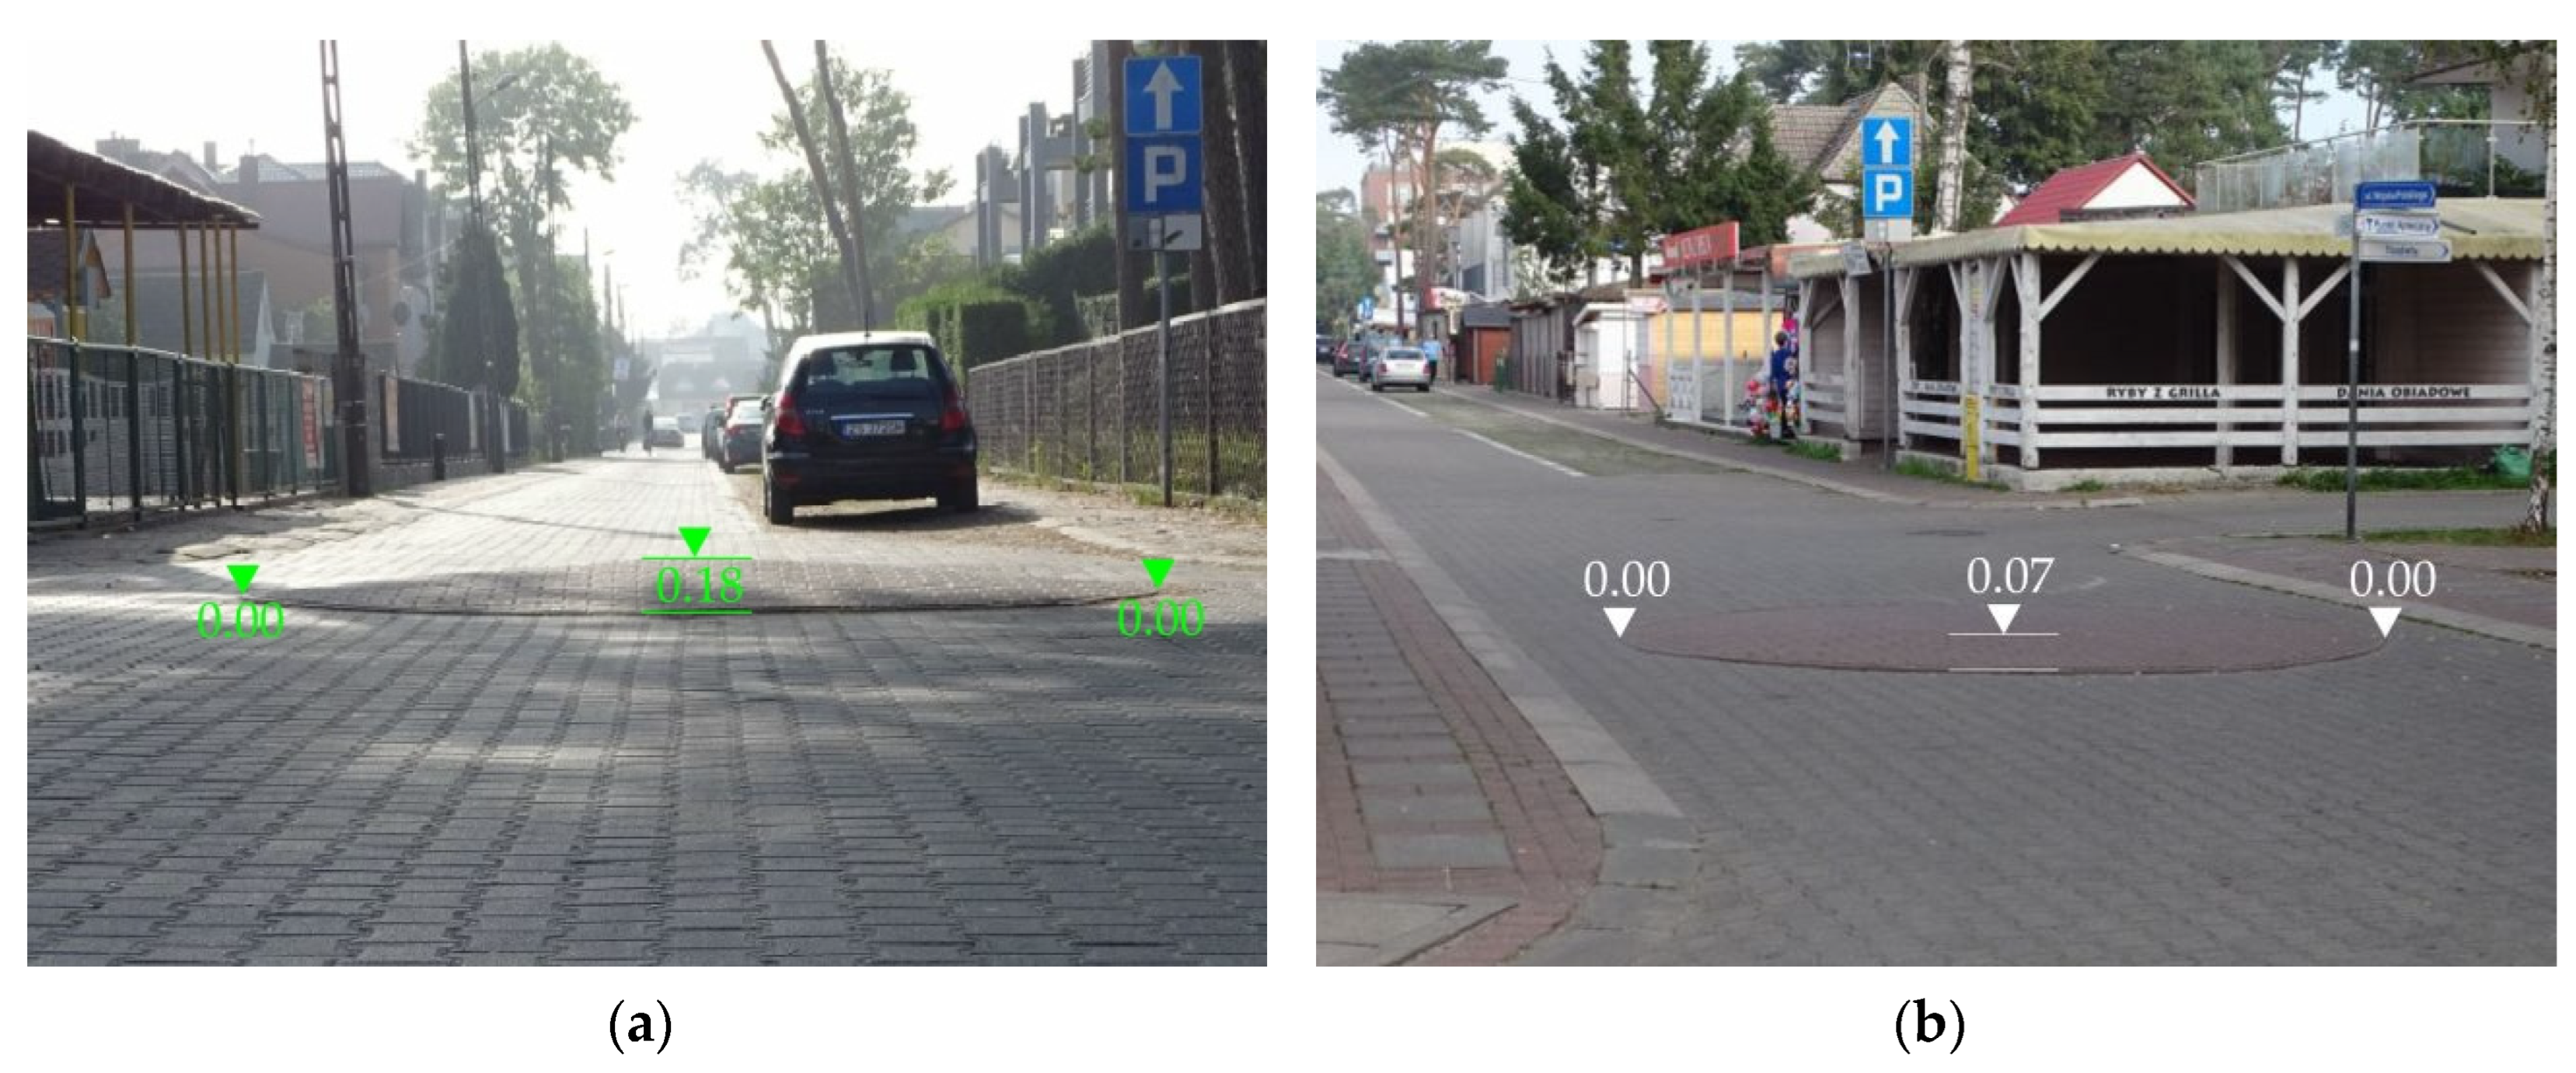
Figure 2 shows some examples of such traffic circles that can be found in traffic calming areas in Poland. The of traffic circles central island may be elevated above (
Figure 2a) or installed flush with the surrounding road surface (
Figure 2b). The central island may, but not necessarily, promote circular traffic. It may be imposed by appropriately used traffic signs and pavement markings. An example of traffic circle with traffic signs imposing circular traffic around the raised central island is shown in
Figure 2a. In
Figure 2b the traffic circle extends over the entire area between the kerblines and not imposing circular traffic as a result.
The effectiveness of traffic circle in traffic calming applications has not, as yet, been reported in the literature, as opposed to extensively covered experiments and evaluations to verify the effectiveness of speed tables. Where the central island does not impose circular traffic, traffic circles are similar to speed tables in terms of traversability. Among the key benefits of traffic circle retrofitting projects are calming of traffic, reduced travel delay, compact size making it possible to keep within the existing right-of-way, low project cost and improved traffic safety.
This motivated the authors to undertake the research described in this article, that is evaluation of the effectiveness of traffic circles as a traffic calming measure in home zones. The initial assumptions included a defined transverse profile of the traffic circles central island and relevance of pedestrian traffic volume in the home zone area. A small seaside spa town featuring a grid street pattern located on the Baltic coast in Poland was chosen as a study.
The following research hypotheses were defined:
Research hypothesis 1 (H1) – “Traffic circle has a significant traffic calming effect when located in a home zone of a spa village”.
Research hypothesis 2 (H2) – “The central island should have its transverse profile appropriate to the street function and location and the surrounding streetscape character”.
Research hypothesis 3 (H3) – “Provision of traffic circles in home zones of small spas should be considered as part of urban street and public space redesigning projects contemplated in these locations”.
Section 2 of this article describes the object of study which are seven traffic circles built about twenty years ago in a small seaside spa in Poland and the applied research methods. The study results are presented in
Section 3. The results are discussed in
Section 4 and the final conclusions of the study are given in
Section 5.
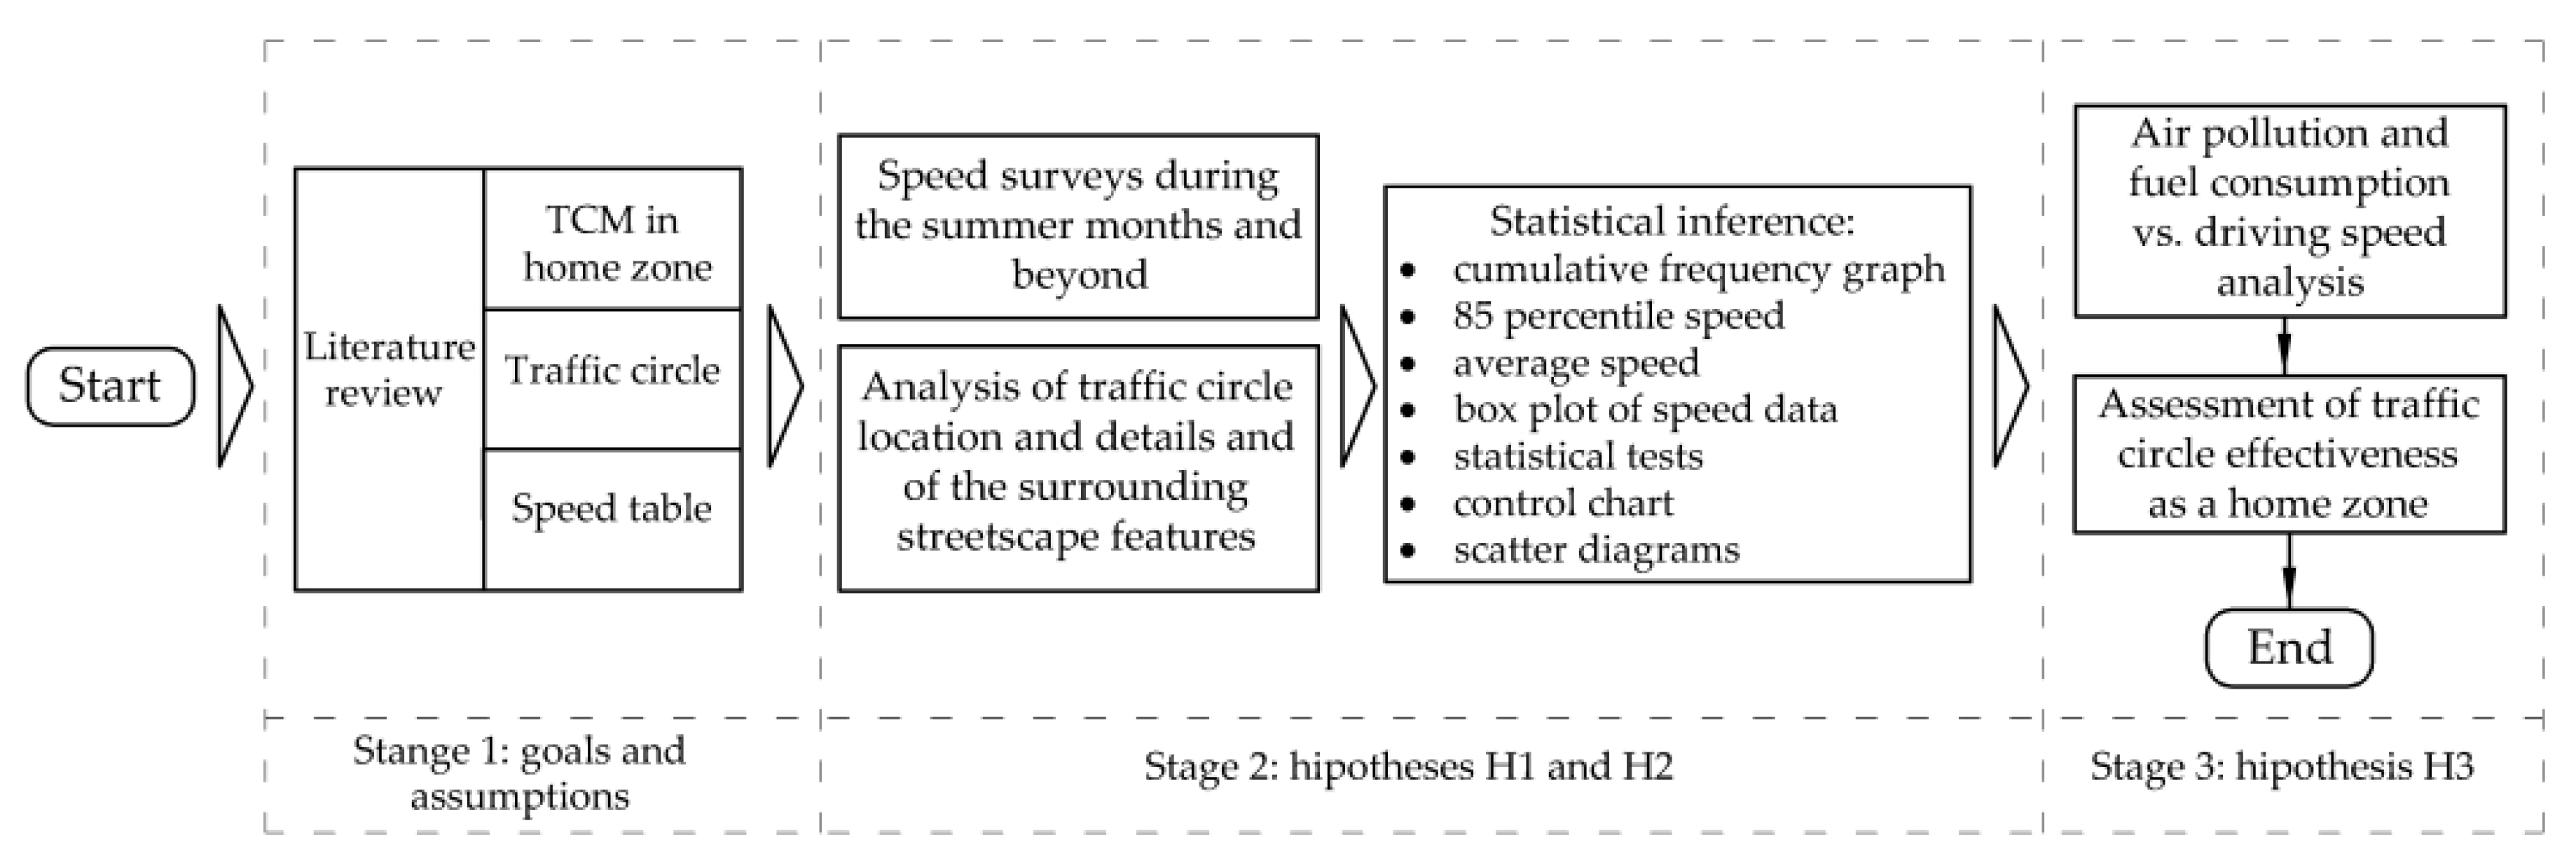
Figure 3 presents the stages of the study on traffic circle effectiveness as a traffic calming measure for home zone areas.
4. Discussion
The statistical inference method was adopted for processing the speed data obtained on all the traffic circles under analysis. The process started with the Kolmogorov-Smirnov Goodness-of-fit test, carried out to verify normality of distribution of the analysed speed populations (equation 1). Normality of speed distribution was confirmed on all the analysed traffic circles in both traffic survey periods.
where:
H0 – null hypothesis,
H1 – alternative hypothesis,
F(v) – empirical cumulative frequency curve,
F0(
v) – theoretical cumulative frequency curve,
λα – critical values,
α – adopted significance level.
Next, two of the three research hypotheses were verified using the obtained speed results research hypothesis: Research Hypothesis 1 (H1) and Research Hypothesis 2 (H2) (see
Section 1). Dealing with a non-measurable characteristic nonparametric tests were chosen to verify research hypotheses (H1 and H2).
4.1. Research hypothesis 1 – “Traffic circle has a significant traffic calming effect when located in a home zone of a spa village”
These were the two-sample K-S test (equation 2) and the median test (equation 3). In the case of Research Hypothesis 1 (H1), both statistical tests were performed for the summer and September “before” and “after” speed parameters for each of the analysed traffic circles. These tests revealed a significant difference between the “before” and “after” speed parameters for all the traffic circles except for that except for traffic circle No. 6, thus confirming the effect of traffic circle on the speed reduction on all the analysed traffic circles (Research Hypothesis 1 (H1)). Some statistical analysis results obtained on the traffic circle No. 1 and No. 2 are given in
Table 1 below.
where:
H0 – null hypothesis,
H1 – alternative hypothesis,
F(vbefore) – before speed cumulative distribution function,
F(
vafter) –after speed cumulative distribution function,
λα – critical values,
α – adopted significance level.
where:
H0 – null hypothesis,
H1 – alternative hypothesis,
F1(v50) – number of results below
v50 from both populations,
F2(
v50) – number of results above
v50 from both populations,
χ2α – critical values,
α – adopted significance level.
4.2. Research hypothesis 2 – “The central island should have its transverse profile appropriate to the street function and location and the surrounding streetscape character”
Since the Research Hypothesis 2 consists of three independent parts, three auxiliary hypotheses have been formulated:
Hypothesis No. 2A – “Are the “before” and “after” speeds and speed reductions influenced by pedestrian traffic?” – speed data from two traffic surveys carried out at two different times of the year were considered to test this hypothesis.
Hypothesis No. 2B – “Are the “before” and “after” speeds and speed reductions influenced by the traffic circle location and its place in the sequence along the streets or by the surrounding streetscape?” – only traffic circles located on the same street were considered.
Hypothesis No. 2C – “Are the “before” and “after” speeds and speed reductions influenced by the street function and surrounding streetscape?” – traffic circles with parallel locations on two analysed streets of different importance, function and streetscape were considered.
Auxiliary hypothesis No. 2A – “Are the “before” and “after” speeds and speed reductions influenced by pedestrian traffic?”
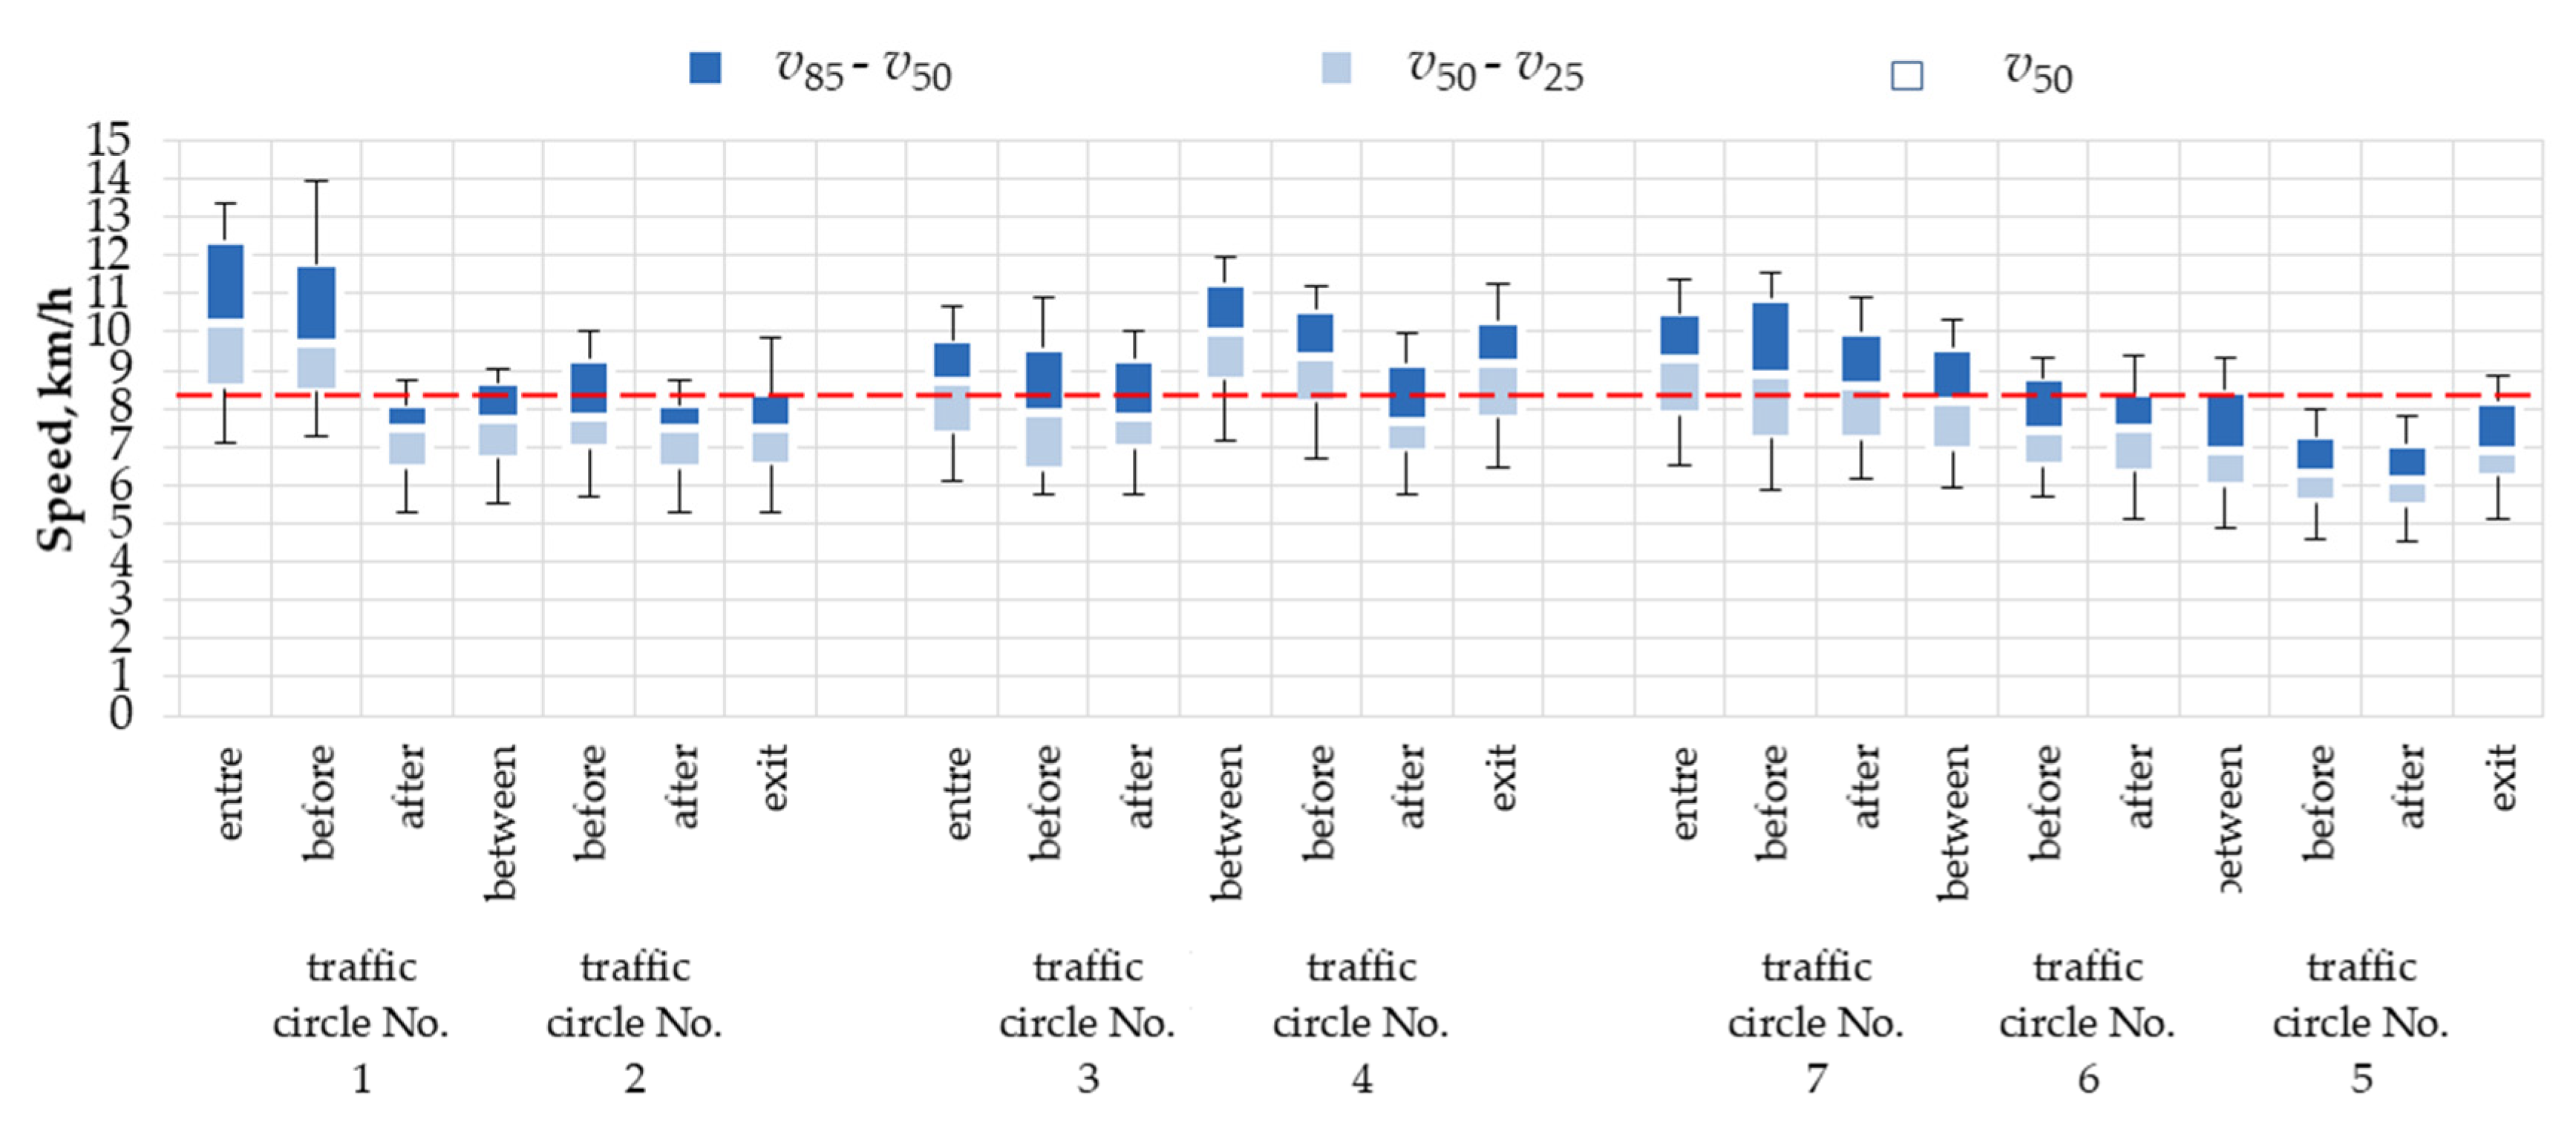
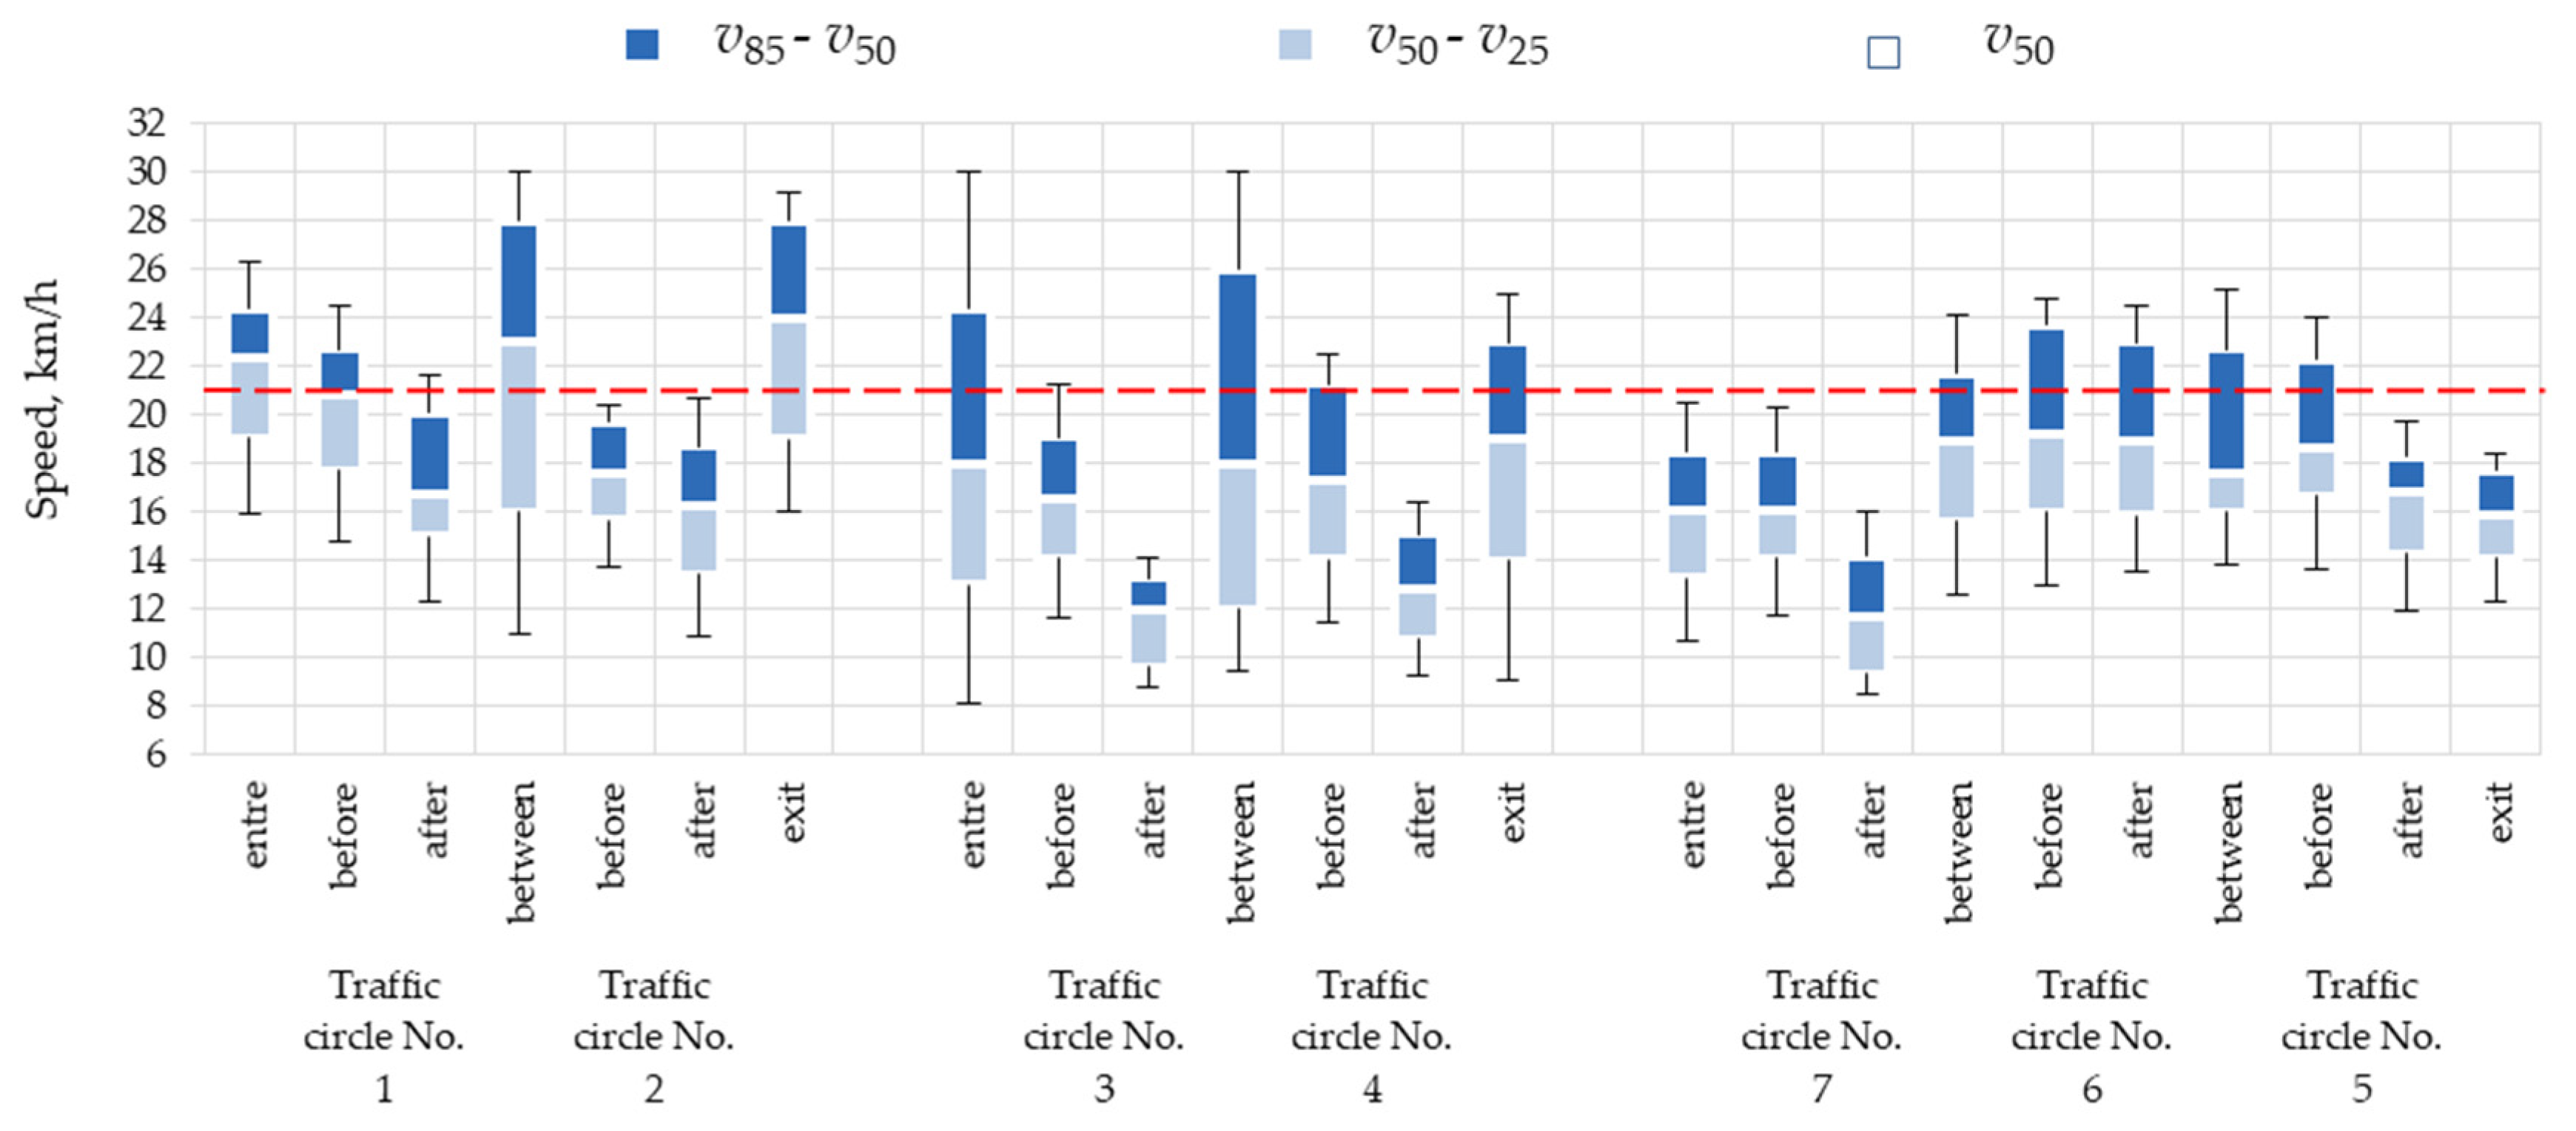
Since the speed variation analysis between the summer and September surveys (
Figure 10,
Figure 11 and
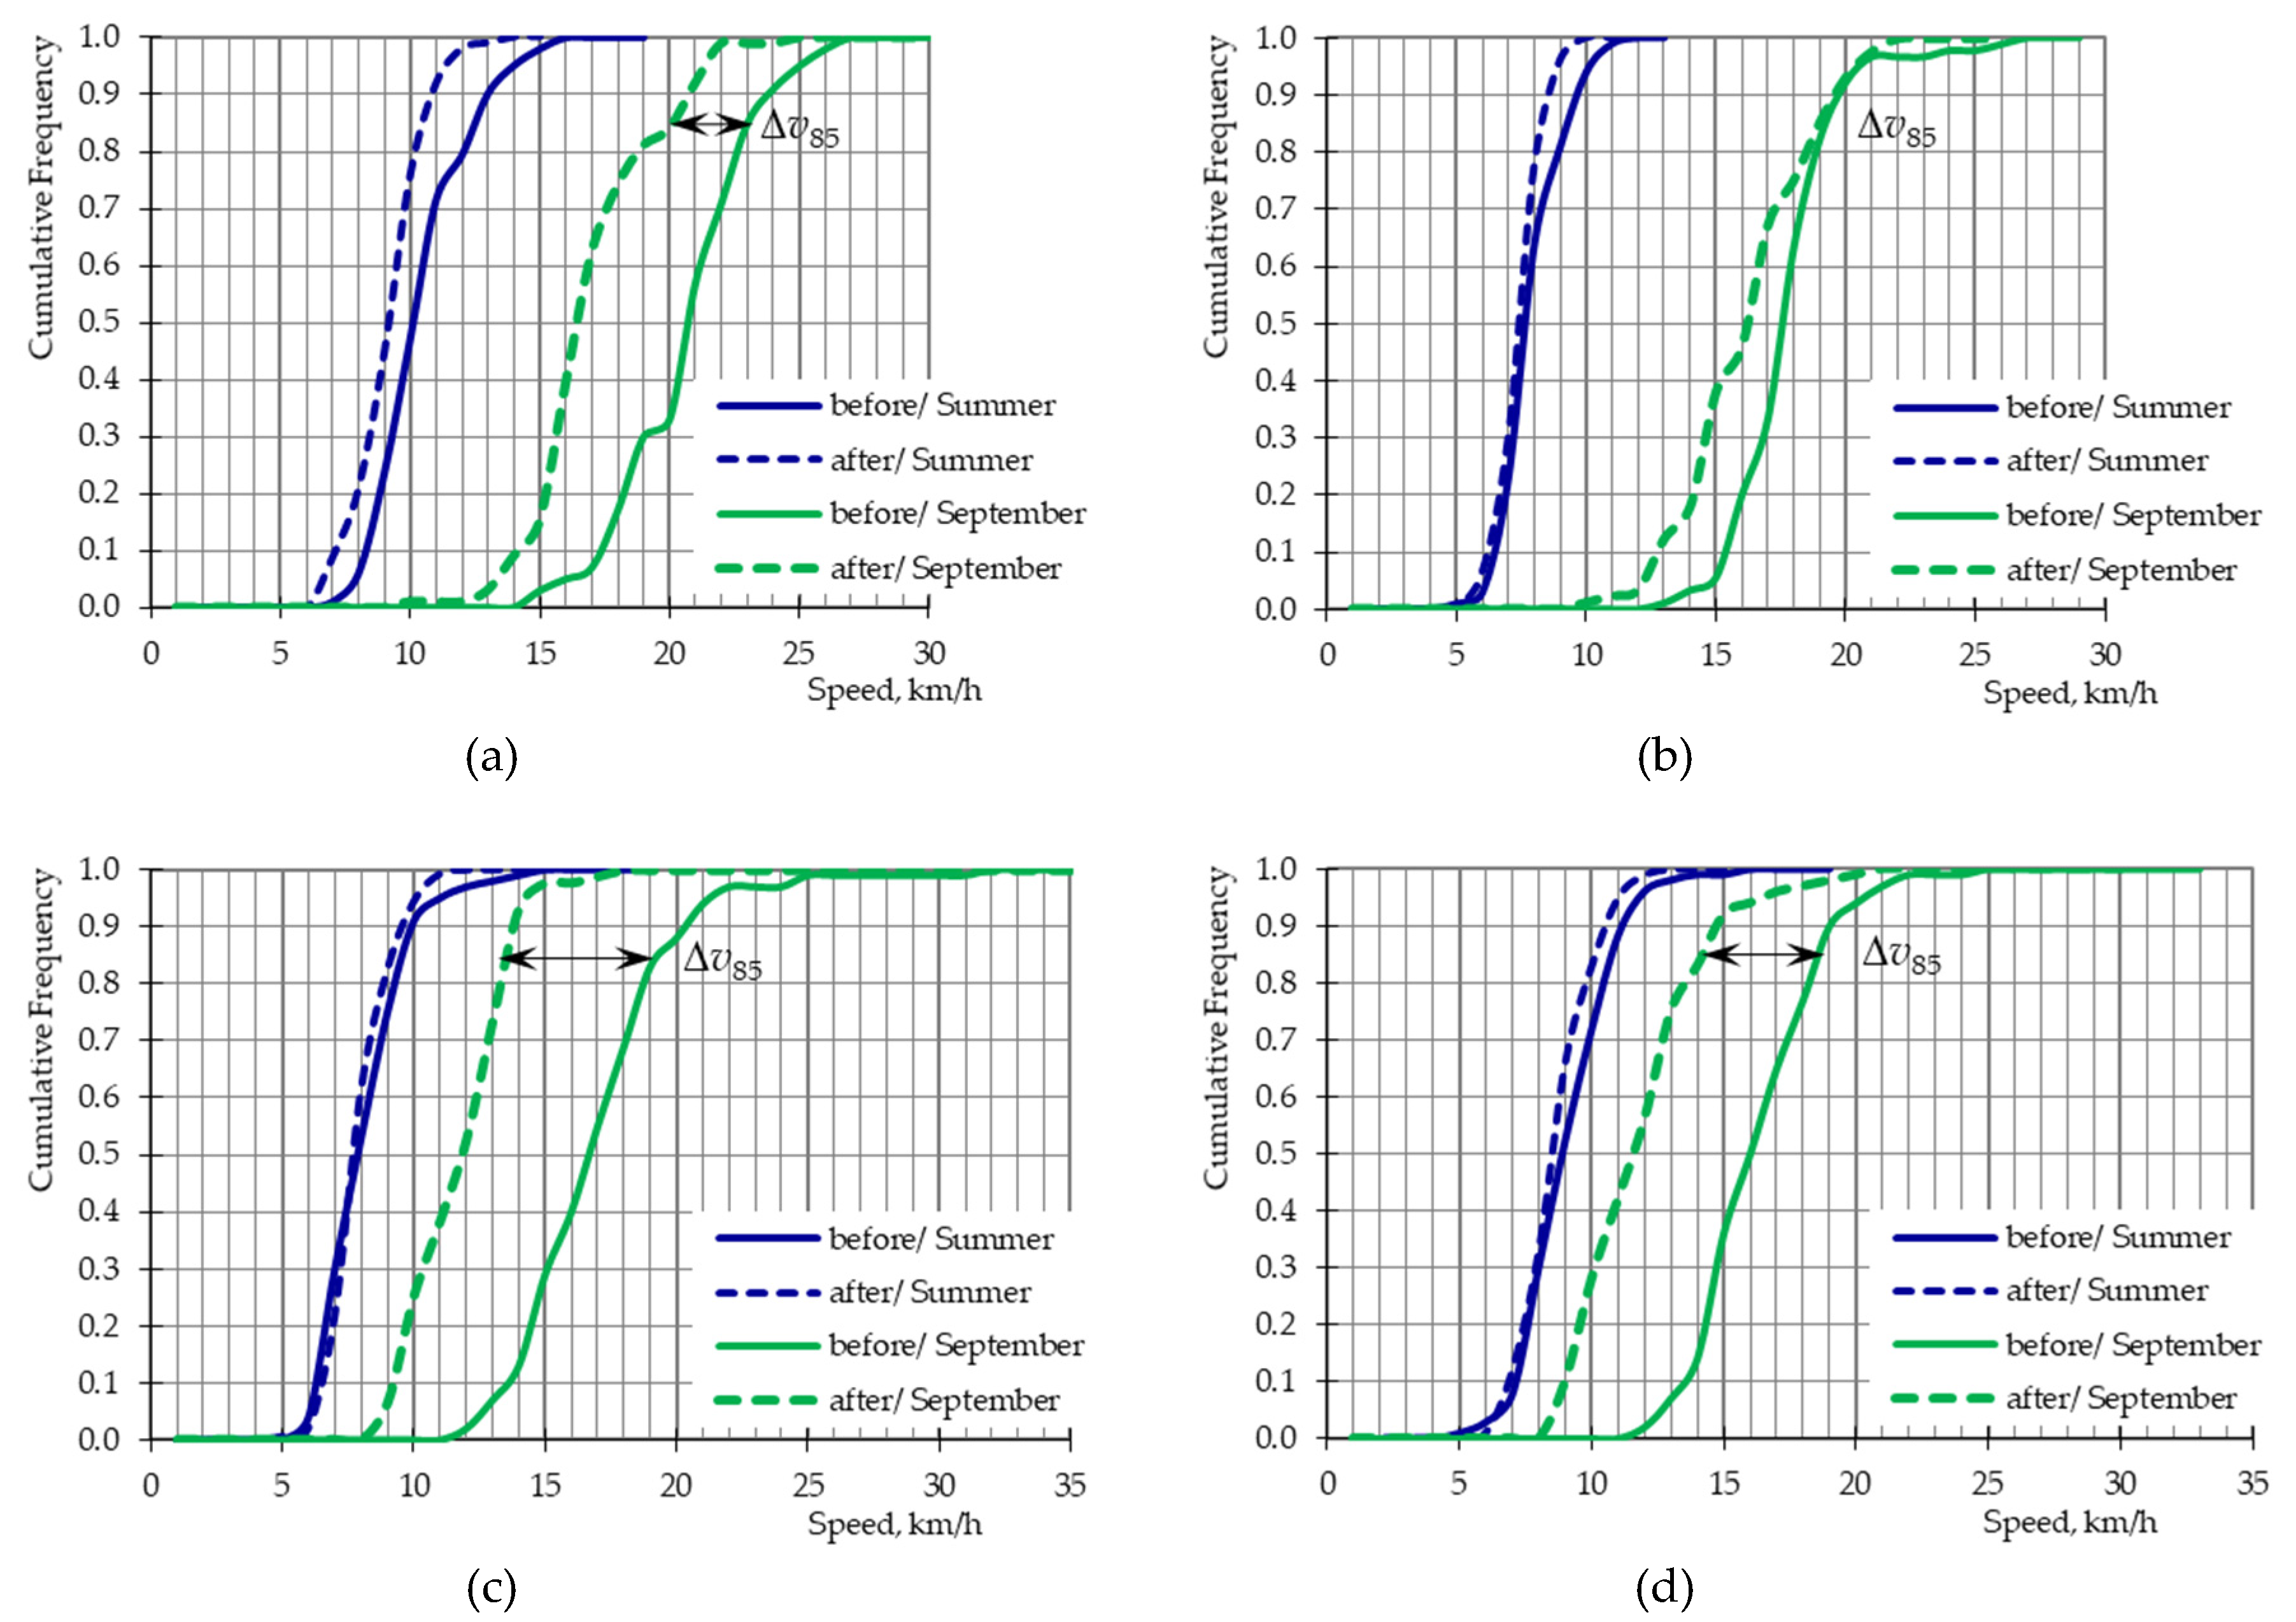
Figure 13) showed a considerable traffic slowing effect of the pedestrian crowds during the summer season, also this factor was subjected to the statistical tests comparing the summer and September data populations (equation 4 and 5). The results of both tests are given in
Table 2. Based on these results showing a difference between the “before” and ”after” speed data populations in almost all cases, we can conclude that the analysed factor has a statistically significant traffic slowing effect. This effect was not confirmed only for traffic circle No. 6, for which in a result close to the critical value was obtained for “before” speed in one test only. Traffic circle No. 6 is located on the staggered T-junction (
Figure 5 and
Figure 9b) without demarcated on-street parallel parking and no parked cars (
Figure 5 and
Figure 9b).
where:
H0 – null hypothesis,
H1 – alternative hypothesis,
F(vSummer) – summer speed cumulative distribution function,
F(
vSeptemer) – September speed cumulative distribution function,
λα – critical values,
α – adopted significance level.
where:
H0 – null hypothesis,
H1 – alternative hypothesis,
F1(v50) – number of results below
v50 from both populations,
F2(
v50) – number of results above
v50 from both populations,
χ2α – critical values,
α – adopted significance level.
Auxiliary hypothesis No. 2B – “Are the “before” and “after” speeds and speed reductions influenced by the traffic circle location and its place in the sequence along the streets or by the surrounding streetscape?”
In order to verify hypothesis No. 2B on the effect of traffic circle location and place in the sequence on a given street and the effect of the immediate surroundings two statistical tests were conducted for combined data for paired traffic circles (equation 6 and 7). The pairs were made up of consecutive traffic circles located on the same street (
Table 3 – equation 6 and 7). The test results for “before” traffic circle speeds in September are given in
Table 3. The obtained statistics show that populations of different traffic circles are different, i.e. must not be combined in one set. This confirms the hypothesis No. 2B on the statistically significant effect of traffic circle location (i.e. place in the traffic circle sequence when driving down the street), and of the surrounding streetscape character on the obtained speed reduction results.
where:
H0 – null hypothesis,
H1 – alternative hypothesis,
F(vNo. i) – speed cumulative distribution function on the traffic circle No.
i,
F(
vNo. i + 1) – speed cumulative distribution function on the traffic circle No.
i + 1,
i – traffic circle preceding,
i + 1 traffic circle following,
λα – critical values,
α – adopted significance level.
where:
H0 – null hypothesis,
H1 – alternative hypothesis,
F1(v50) – number of results below
v50 from both populations,
F2(
v50) – number of results above
v50 from both populations,
χ2α – critical values,
α – adopted significance level.
Auxiliary hypothesis No. 2C – “Are the “before” and “after” speeds and speed reductions influenced by the street function and surrounding streetscape?”
In order to verify hypothesis No. 2C two statistical tests were conducted for combined data for paired traffic circles (equation 7 and 8). The pairs were made up of traffic circles located on neighbouring streets at parallel locations (
Table 4 – equation 7 and 8). The test results for “before” traffic circle speeds in September are given in
Table 4. The obtained statistics show that populations of different traffic circles are different, i.e. must not be combined in one set. This confirms the hypothesis No. 2C on the statistically significant effect of traffic circle location, street function and of the surrounding streetscape character on the obtained speed reduction results.
where:
H0 – null hypothesis,
H1 – alternative hypothesis,
F(vNo. i) – speed cumulative distribution function on the traffic circle No.
i,
F(
vNo. i + 1) – speed cumulative distribution function on the traffic circle No.
i + 1,
i – traffic circle on the analysed street,
i + 1 – traffic circle on the adjacent street at a parallel location,
λα – critical values,
α – adopted significance level.
Now we can conclude both hypotheses were confirmed in the statistical inference process. Thus, whenever traffic circles are designed in home zones the location, street function and the surrounding streetscape features should be taken into account in the process and the traffic circle design parameters should be taken accordingly.
4.3. Trajectory and speed profile analysis
As mentioned, a traffic circle may but not necessarily promote circular movement. In this case, the only 3 m wide carriageway of the one-way street with demarcated on-street parallel parking past the traffic circle makes keeping the right-hand side impracticable. Instead, the drivers tended to pull left, navigating past the raised central island on its left-hand side. This makes the main difference between a traffic circle located on a one-way street and a mini roundabout located on a two-way carriageway.
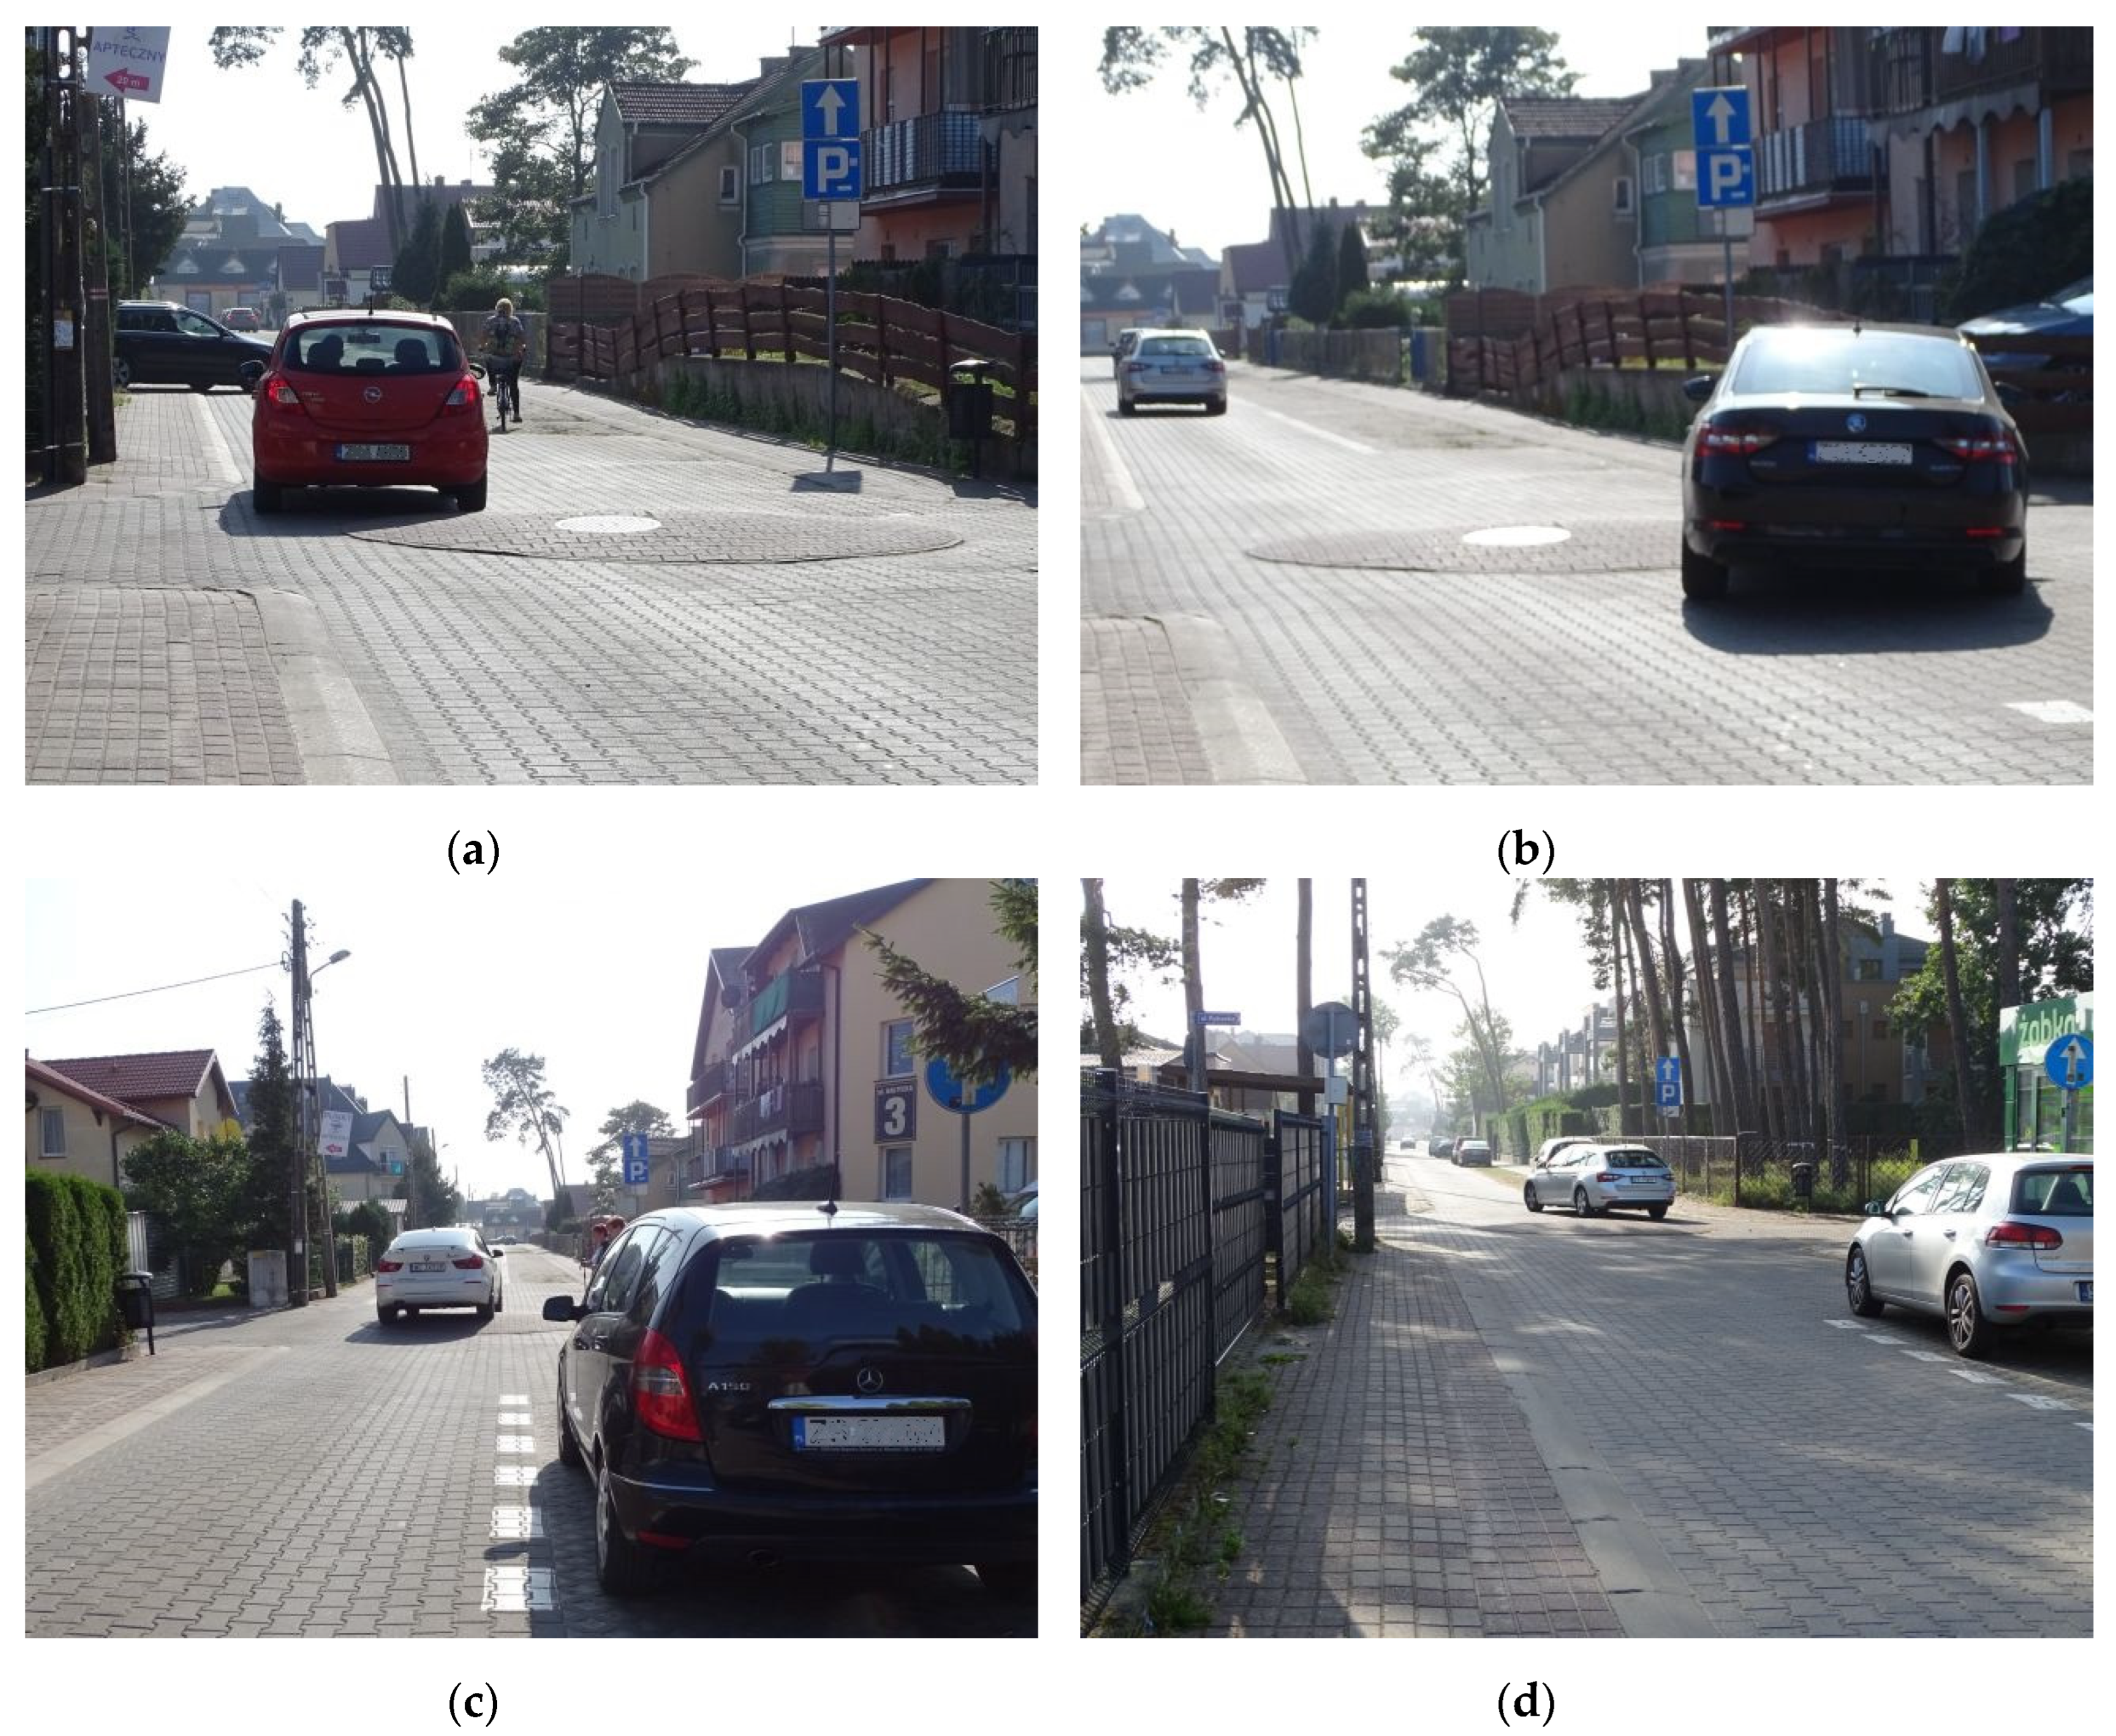
Figure 17 shows examples of different travel paths noted during the surveys. Driving through traffic circle depended on the driver’s skills and habits, difference of level of the central island, vehicle ground clearance and also the surrounding features including street stalls, buildings, various fences and dense shrubs that could obscure the view of the side road junctions (
Figure 12,
Figure 14c and
14d).
The
v85 and
vav profiles are presented in
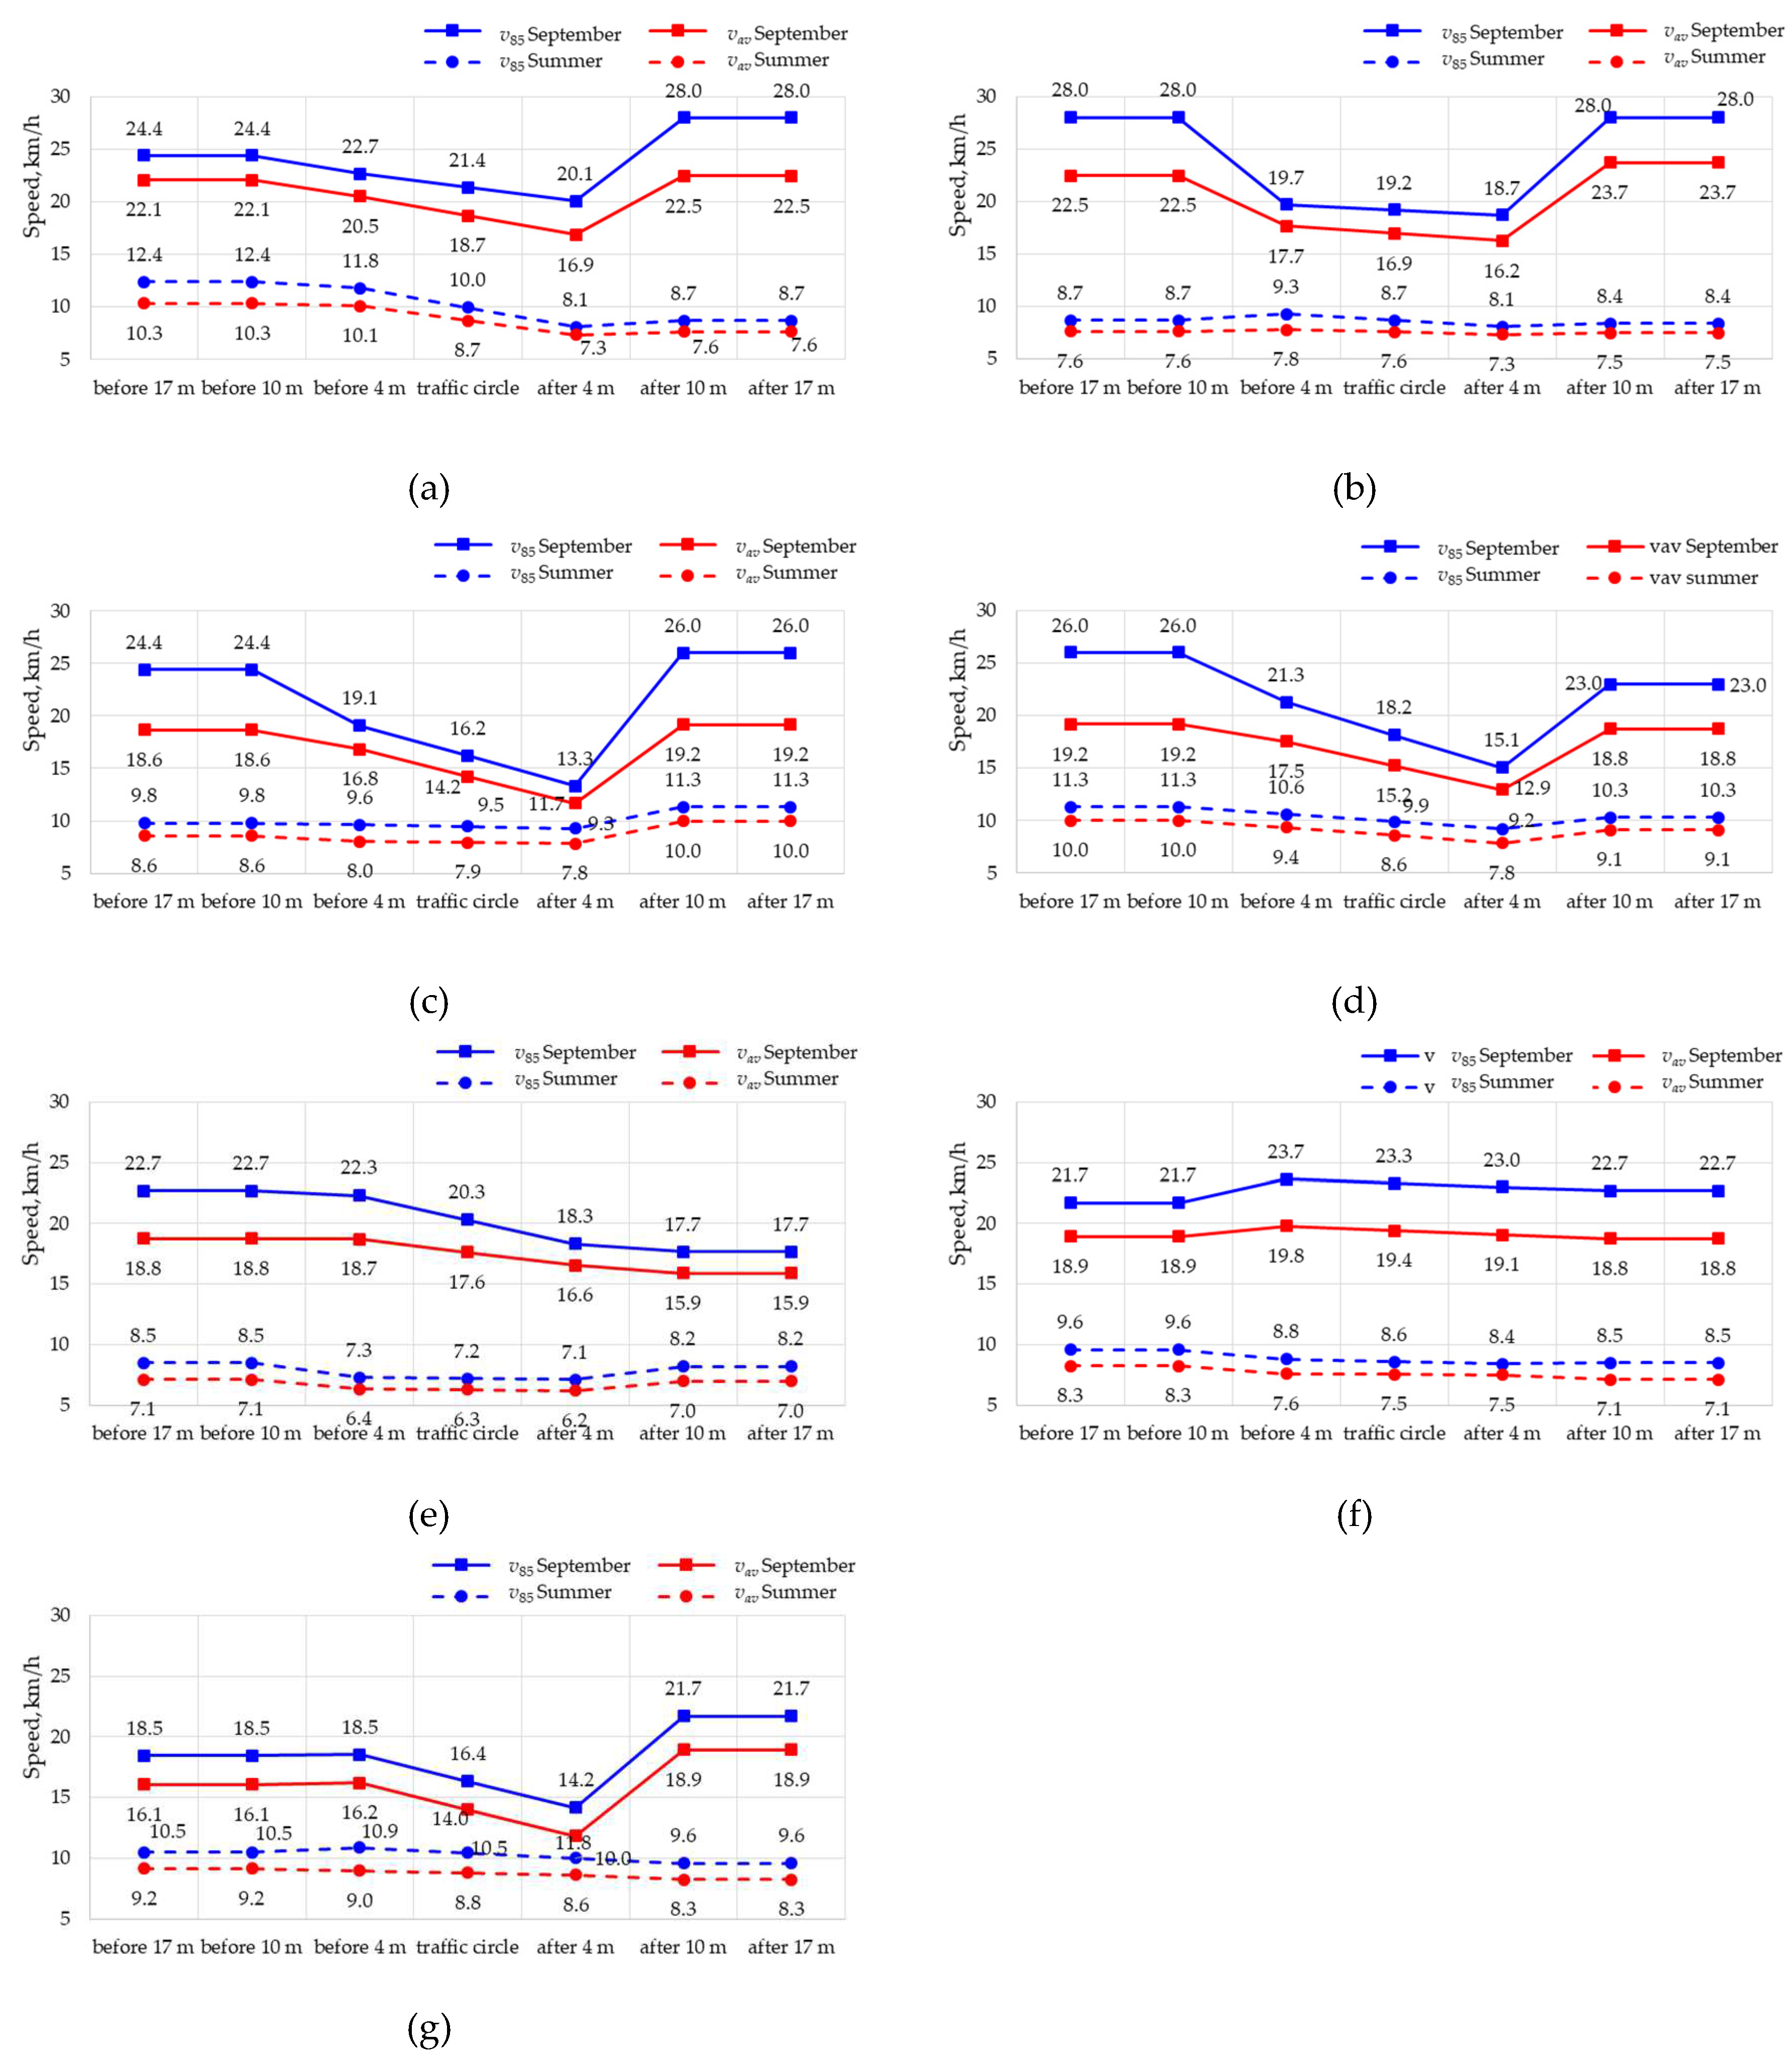
Figure 15 for different slopes of the traffic circle central islands, different longitudinal slopes on the way to and past the traffic circle and different surrounding streetscapes. In addition, these profiles include the speeds on the way to, immediately before, within and past the traffic circle, this in order to expose the actual speed variation. The results of both surveys were included.
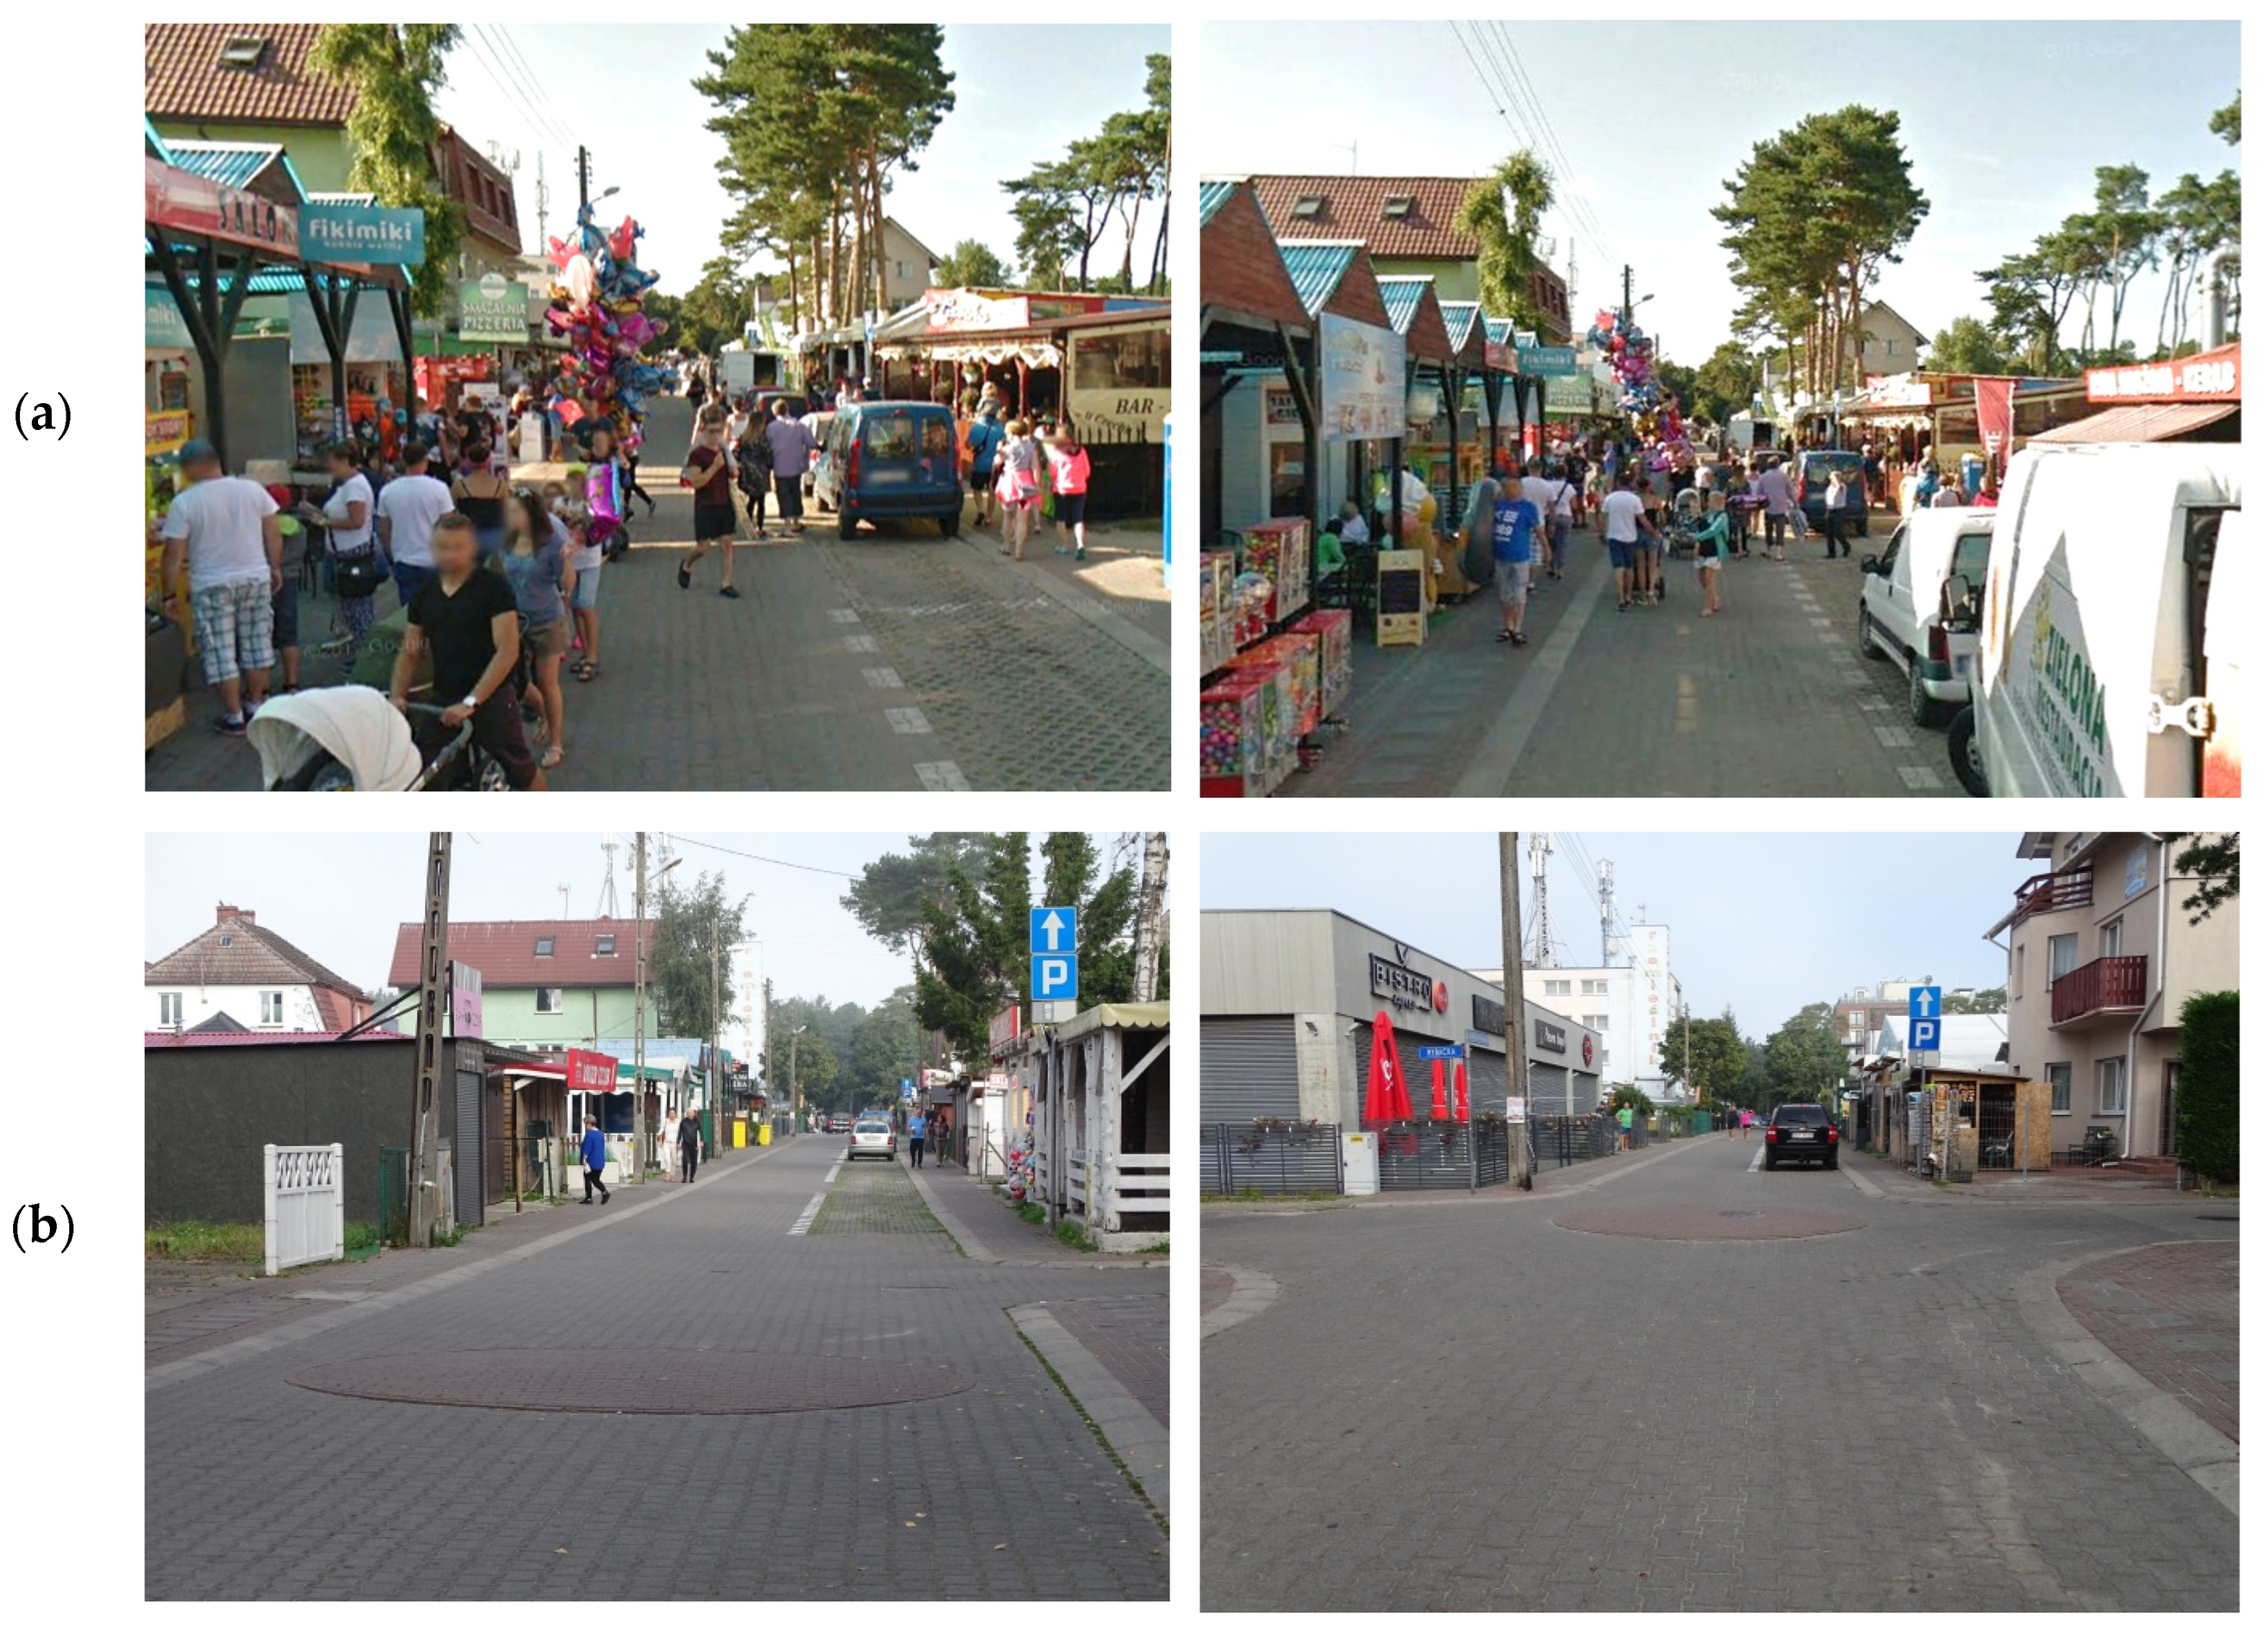
Firstly, the speed profile data reveal completely different traffic conditions at the times of the two surveys, i.e. in summer and in September (
Figure 15). In the former case, with crowds of tourists walking on the footpath and on the carriageway the traffic circles had some, though rather small slowing effect on the road traffic. Much higher speeds and a much more pronounced slowing effect of the traffic circles was noted in September when the pedestrian traffic is limited to the guests of the health resorts and spas of Międzywodzie. The greatest speed reductions were recorded at traffic circles No. 3 and No. 4 located on Kasztanowa St. The speed reduction differences between these two are attributed to different longitudinal slopes on the junction approach sections. The next in the order of speed reduction amount were the traffic circles located on Wojska Polskiego St. and Zwycięstwa St. with central island level difference of Δ
h = 0.11–0.12 m. Speed reductions of about 4 km/h were obtained on the traffic circles No. 5 and No. 7 depending on the approach and departure speeds and the surrounding streetscape features. For example, in the case of traffic circle No. 5 there are local markets and boutiques at the main legs and the demarcated on-street parking spaces start as close as 3–4 m from the secondary leg kerbline. These parking spaces are used by the spa house and are occupied also in autumn, prominently narrowing the travel lane. These are the main factors contributing to the obtained speed reductions. Traffic circle No. 7 is located 60 m from the home zone entry and this location defines the observed approach speeds. The home zone entry area and the junction corners are occupied by year-round open markets and public amenities, including post office, bank, pharmacy, etc., generating pedestrian traffic and frequent driving in and out of the parking spaces. The situation is different at traffic circles No. 1 and No. 2 with very few pedestrians or parked vehicles in autumn. This resulted in a smaller amounts of speed reduction in autumn in the order of 2 km/h.
The least traffic slowing effect was noted for traffic circle No. 6 that featured small difference of level of Δ
h = 0.07 m and no demarcated on-street parking next to it. To the right of the one-way street, behind the footpath, there is an urban park, and on the left-hand side there are year-round open small food outlets. The above factors mean that drivers practically have at their disposal the entire width of the road equal to 5 m and do not slow down when crossing traffic circle No. 6. Driving speeds become steady on the section between traffic circle No. 7 and traffic circle No. 5 due to low number of pedestrians in September and a small number of parked vehicles (
Figure 9b and
14).
4.4. Regression analysis
Summing up, we can say that speed reduction obtained with traffic circle depends on the central island difference of level, longitudinal slope of the approach section, effective carriageway width (whether or not limited by the vehicles parked in the demarcated parking spaces), presence of pedestrians, traffic circle location and the surrounding streetscape features.
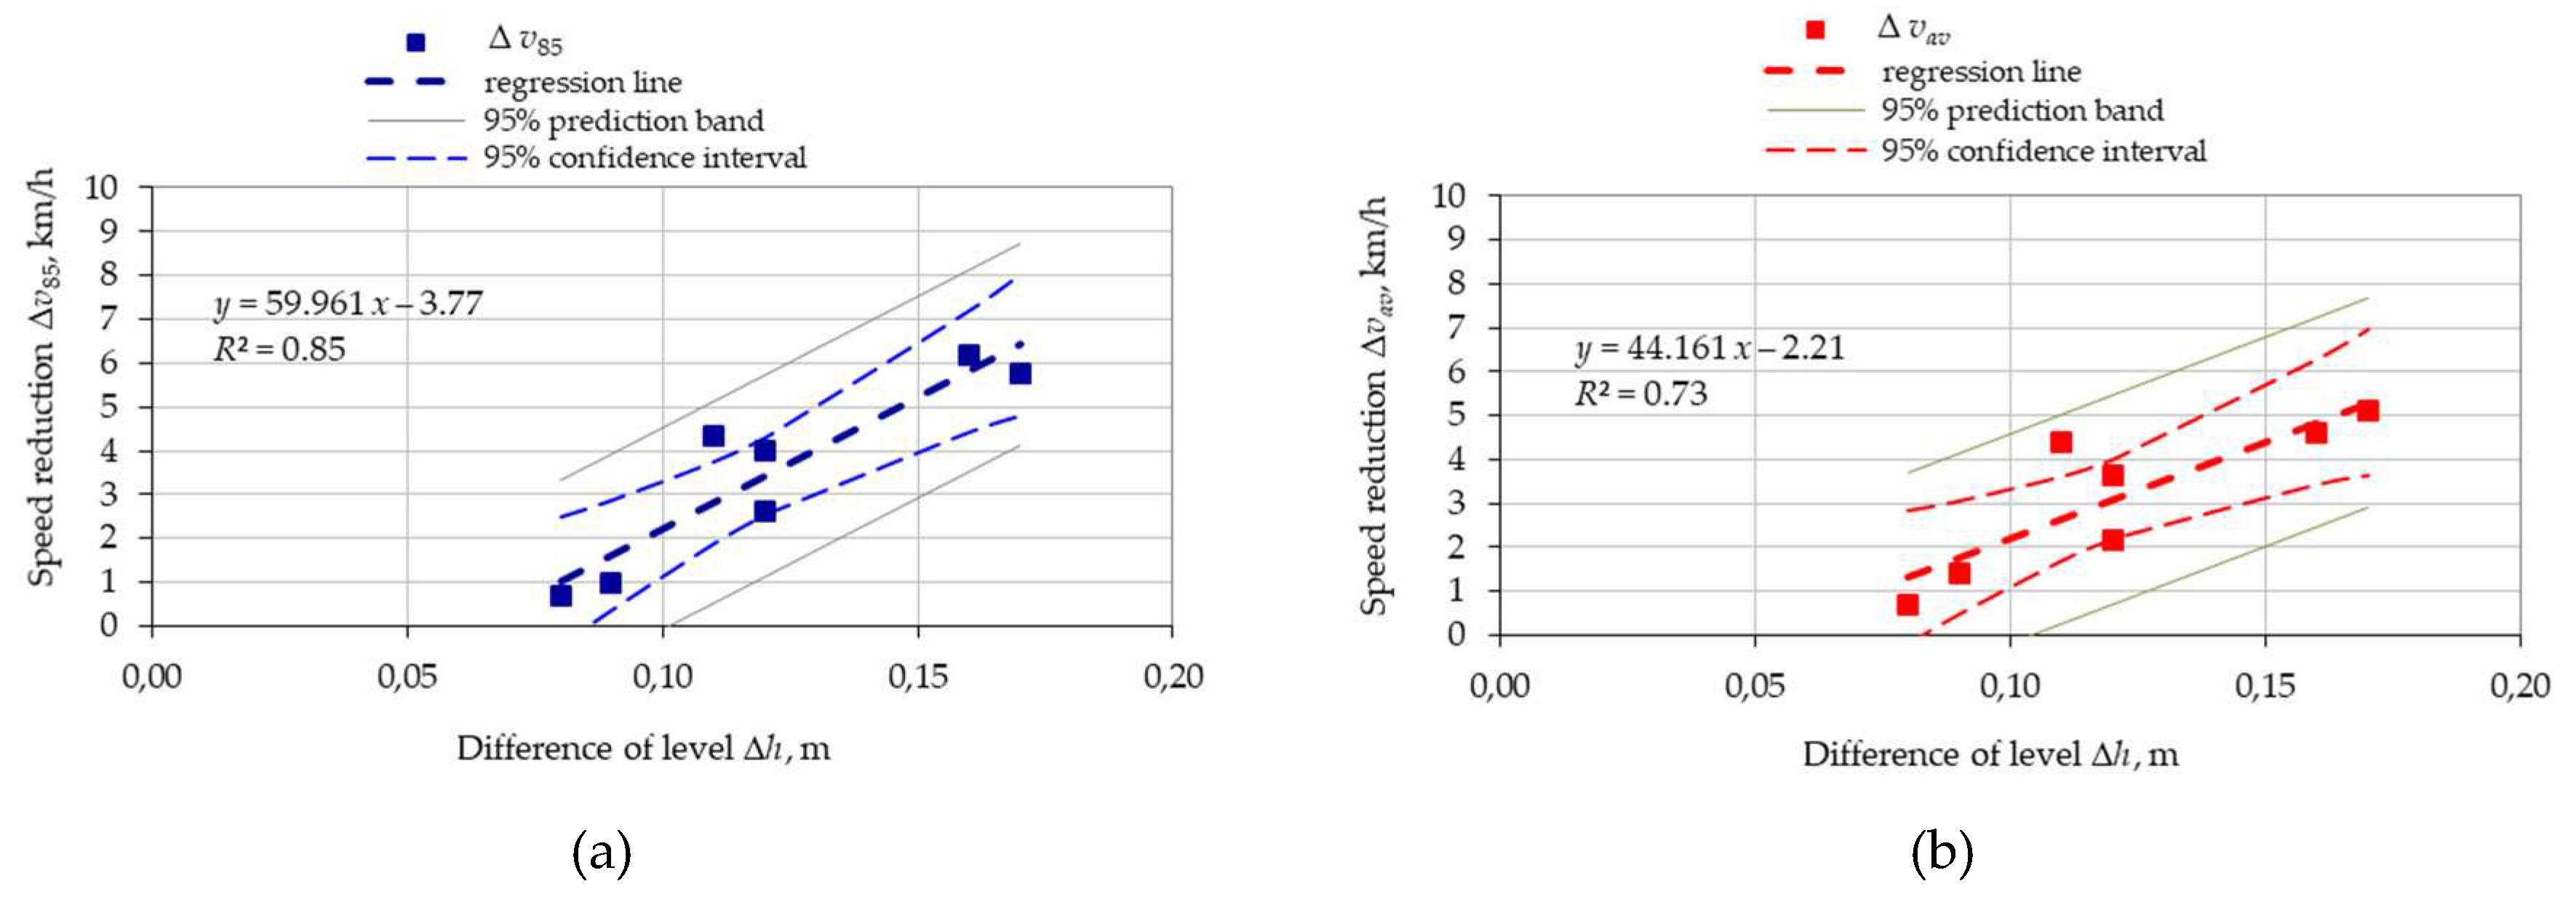
Figure 16 represents the relationship between the obtained speed reductions and the difference of level of the central island, based on the September survey data.
Therefore, in sustainable redesigning of urban streets and public spaces, which may include setting up home zones, it is important to select the appropriate traffic calming measures and use appropriate design parameters, matching the existing streetscape features, as the resulting speed reductions have a considerable bearing on the noise and air pollution in the area [
41]. These dependencies are related to the third of the research hypotheses, i.e. hypothesis No. 3. For sustainable home zone projects, it is therefore important to avoid sudden speed drops [
41] and consider the range of impact of traffic calming measures when planning their locations [
26,
42,
43,
44]. Bearing this in mind, when analysing the speed reductions obtained on the analysed traffic circles, references were made to the results obtained by other researchers reporting similar speed reductions obtained with speed tables [
22,
42]. The different traffic calming measures (speed table and traffic circle) have different applications and, for example speed tables are an option for places with 30 km/h or 40 km/h desired speed, and thus they are not appropriate for home zones requiring reduction to lower speeds. With similar climbing phase characteristics, driving on these two traffic calming measures differs due to inclined top surface in the case of traffic circle and level surface in the case of speed table. The literature does not, as yet give any experimental results comparing these two traffic calming measures in home zone applications. This being so, this article presents the results obtained on three one-way streets including seven traffic circles having different central island transverse slopes.
4.5. Air pollution in three traffic scenarios
The home zone speed recommendations differ between countries and guidelines, ranging from walking speed, as recommended by the Dutch guidelines [
45] through 16 km/h in England [
46] to 20 km/h in several other countries [
30,
33,
47,
48,
49,
50]. Therefore, air and traffic noise pollution estimations were based on the data obtained for driving through speed tables at speeds in the range of 10–30 km/h [
22,
42]. Considering the driving speeds measured between the junctions, which also did not exceed the specified speed range (
Figure 13 and
Figure 14), we can conclude that the analysed traffic circles did not cause abrupt accelerations and decelerations that could be considered undesired due to the impact on the surrounding environment, as per [
22,
42,
51,
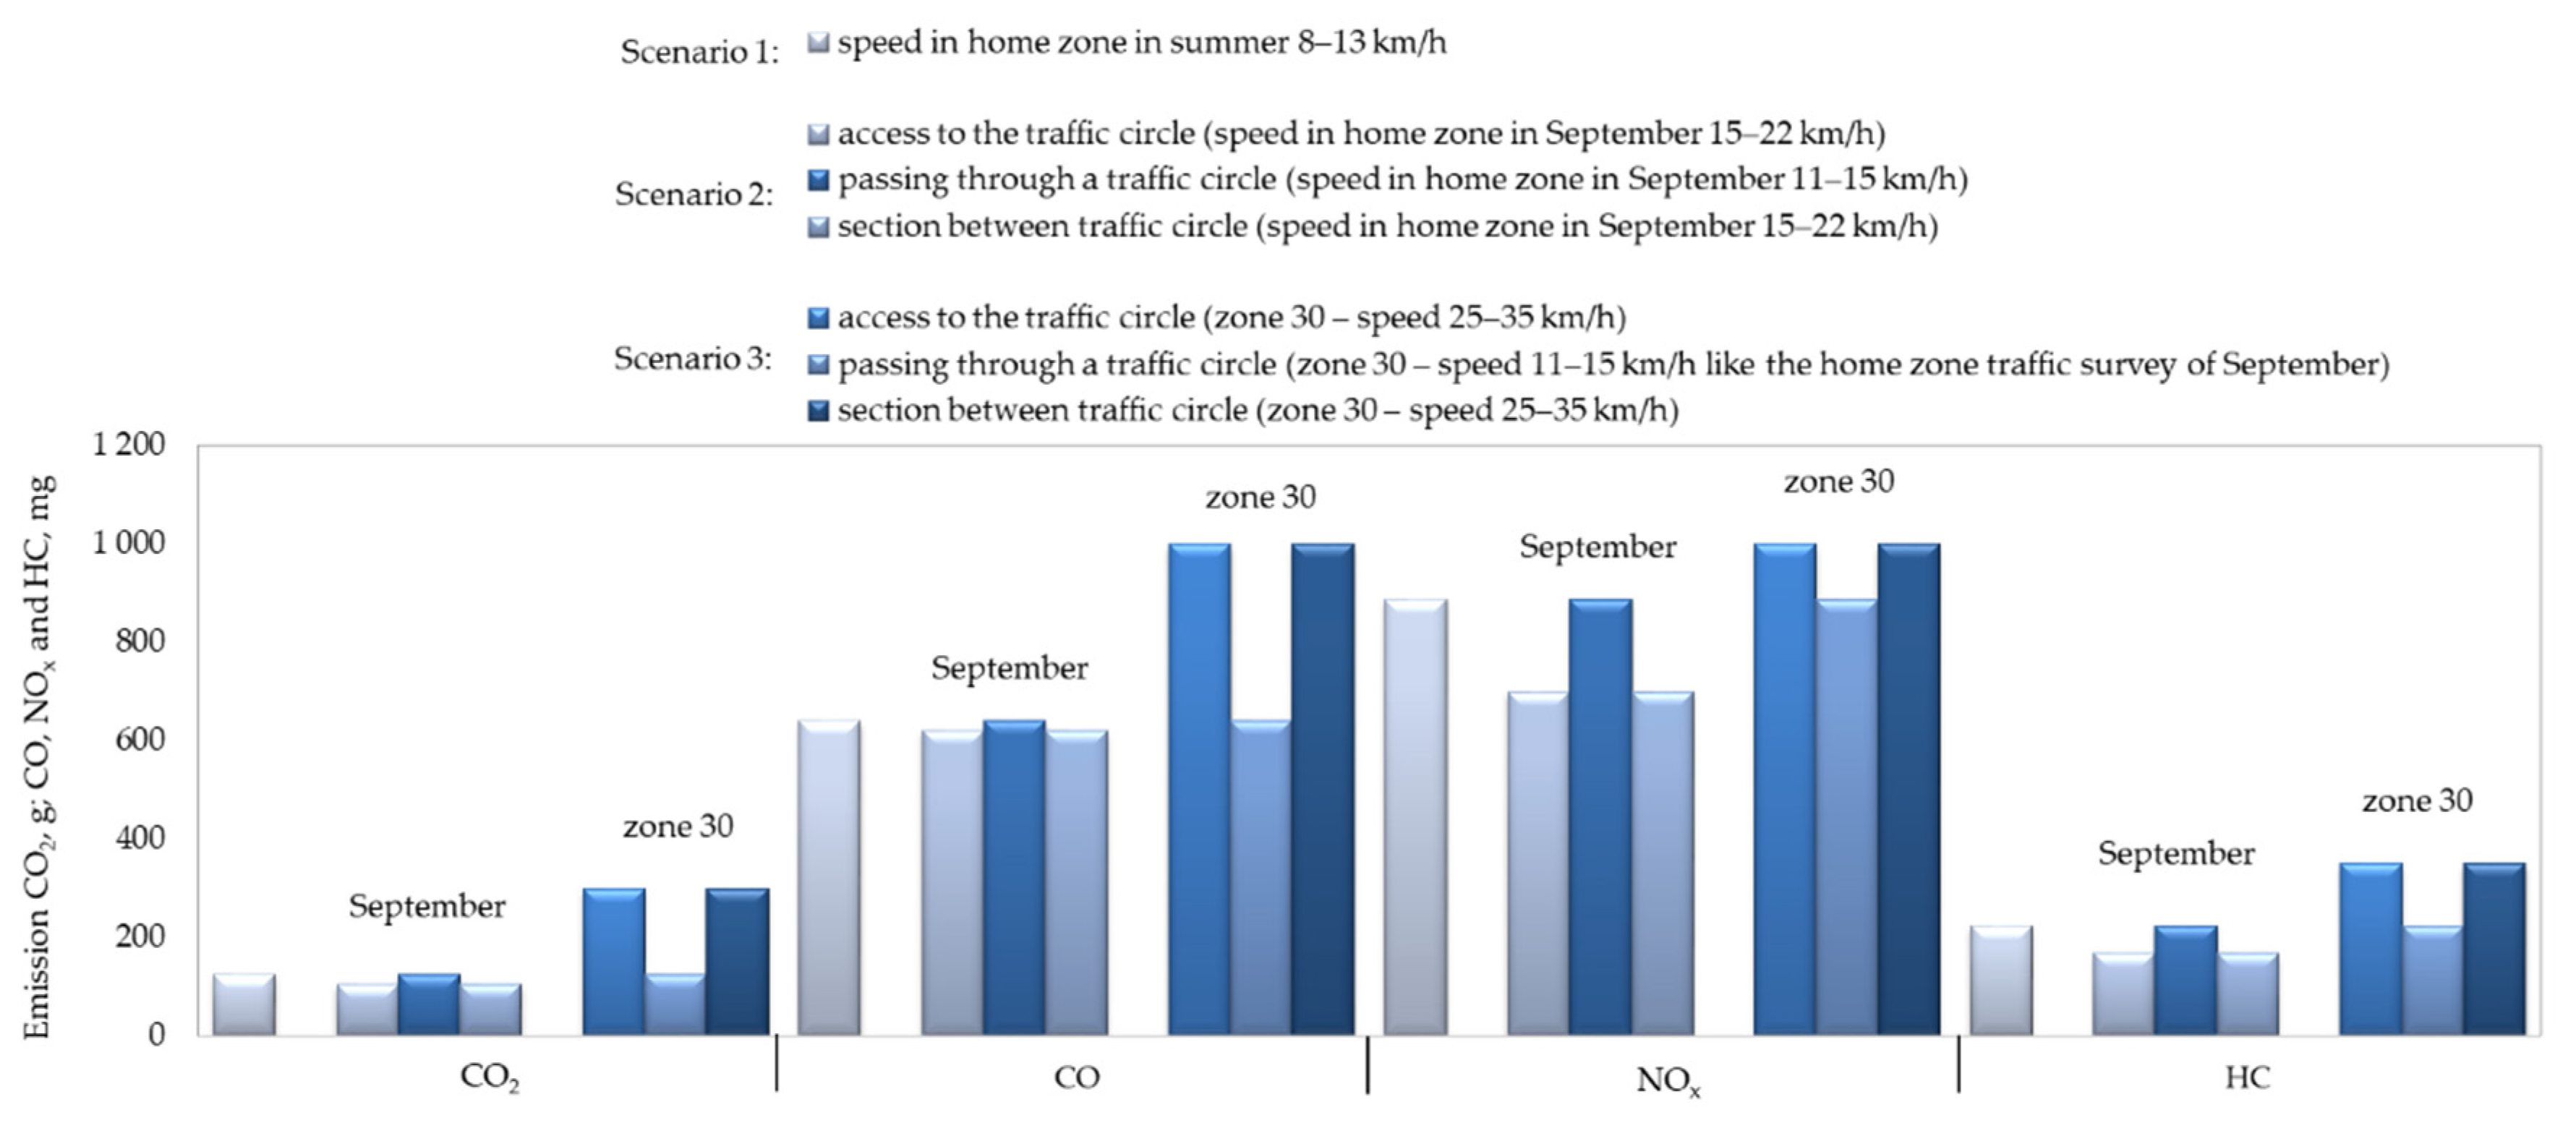
52]. The level of air pollution was estimated by comparing the three scenarios analysed in this article using for comparison the research data published by Merkisz et al. [
22]. In the first scenario a vehicle drove through a home zone traffic circle in summer at an almost steady speed of 8–10 km/h, as shown in
Figure 13. The second scenario concerned the speeds logged in the home zone September survey, as shown in
Figure 14 varying over a considerably wider range of 10–25 km/h. The third scenario was added for comparison in order to demonstrate the traffic circle effectiveness as a home zone traffic calming measures TCM. The simulated air pollution in the 30 km/h zone was based on the assumption that the raised central island of the traffic circle causes a speed reduction corresponding to that determined during the home zone traffic survey of September. And on the sections between the traffic circles driving speeds were assumed to vary between 25 and 30 km/h. The air pollution results for these three scenarios are given in
Figure 17 below, broken down to carbon dioxide (CO
2), carbon monoxide (CO), nitrogen oxide (NO
x) and hydrocarbons (HC).
Figure 17.
Air pollution in the three main street driving scenarios. Source: elaboration own.
Figure 17.
Air pollution in the three main street driving scenarios. Source: elaboration own.
The analysis of the home zone data given in
Figure 17 and the 30 km/h zone simulated data showed that the traffic circle related air pollution may be higher in the 30 km/h zone than in a home zone. Comparing the home zone air pollution data in summer and in September it is justified to conclude that carbon dioxide and carbon monoxide pollution along the street does not differ between the summer and September despite different driving speeds recorded in these period due to almost steady speed in summer of about 10 km/h (
Figure 13). The levels of nitrogen oxides and hydrocarbons were, in turn, different in the home zone under analysis. That said, the level of air pollution will definitely be lower in summer due to steadier driving speeds.
4.6. Fuel consumption in three traffic scenarios
Sudden speed variations would also influence fuel consumption. However, with the short distances between the subsequent traffic circles and small driving speed variations on the way, with the steady speeds of 8–10 km/h due to pedestrian traffic we can expect the drivers to shift to the second gear. In September, the driving speeds ranged from 20 to 25 km/h, depending on the number of pedestrians, decreasing only right at the traffic circle. Some drivers drove in the third gear, thus reducing fuel consumption. However, almost all the interviewed drivers confirmed shifting to the second gear on the approach to the traffic circle. Considering short distances of travel through the analysed streets and using the mean fuel consumption data in litre/100 km depending on gear, as given in [
53] we may expect only very slight differences in fuel consumption. For example, travelling at 8–10 km/h in the second gear in summer the car would use about 0.043 litre of petrol to reach the end of the street, and in September this amount would drop to 0.033 litres due to using third gear with 20–25 km/h travel speeds practicable on this section. However, was a 30 km/h zone implemented in this street, a car would use 0.035 litre of petrol driving between the traffic circles in third gear at 25–30 km/h.
The comparisons performed as part of this study, covering pedestrian safety (especially in summer), reduction of driving speed, air pollution and fuel consumption indicate suitability of traffic circle as an effective and economic traffic calming measure for use in home zone applications.
Author Contributions
Conceptualization, S.M, A.S.; methodology, S.M., A.S.; software, S.M.; formal analysis, S.M, A.S.; data curation, S.M, A.S.; writing—original draft preparation, S.M, A.S.; writing—review and editing, S.M., A.S.; visualization, S.M, A.S.; supervision, S.M.; project administration, S.M.
Figure 2.
Examples of traffic circles used in Poland on two-way streets: (
a) an example of a sectioned-off central island on a raised junction in Mierzyn, including traffic signs directing the traffic around the island. Source: photo by Alicja Sołowczuk; (
b) example of coloured/textured surface used on the central island of a raised junction in Puławy. Source: Google Earth [
5].
Figure 3.
Adopted stages of the research. Source: own elaboration.
Figure 3.
Adopted stages of the research. Source: own elaboration.
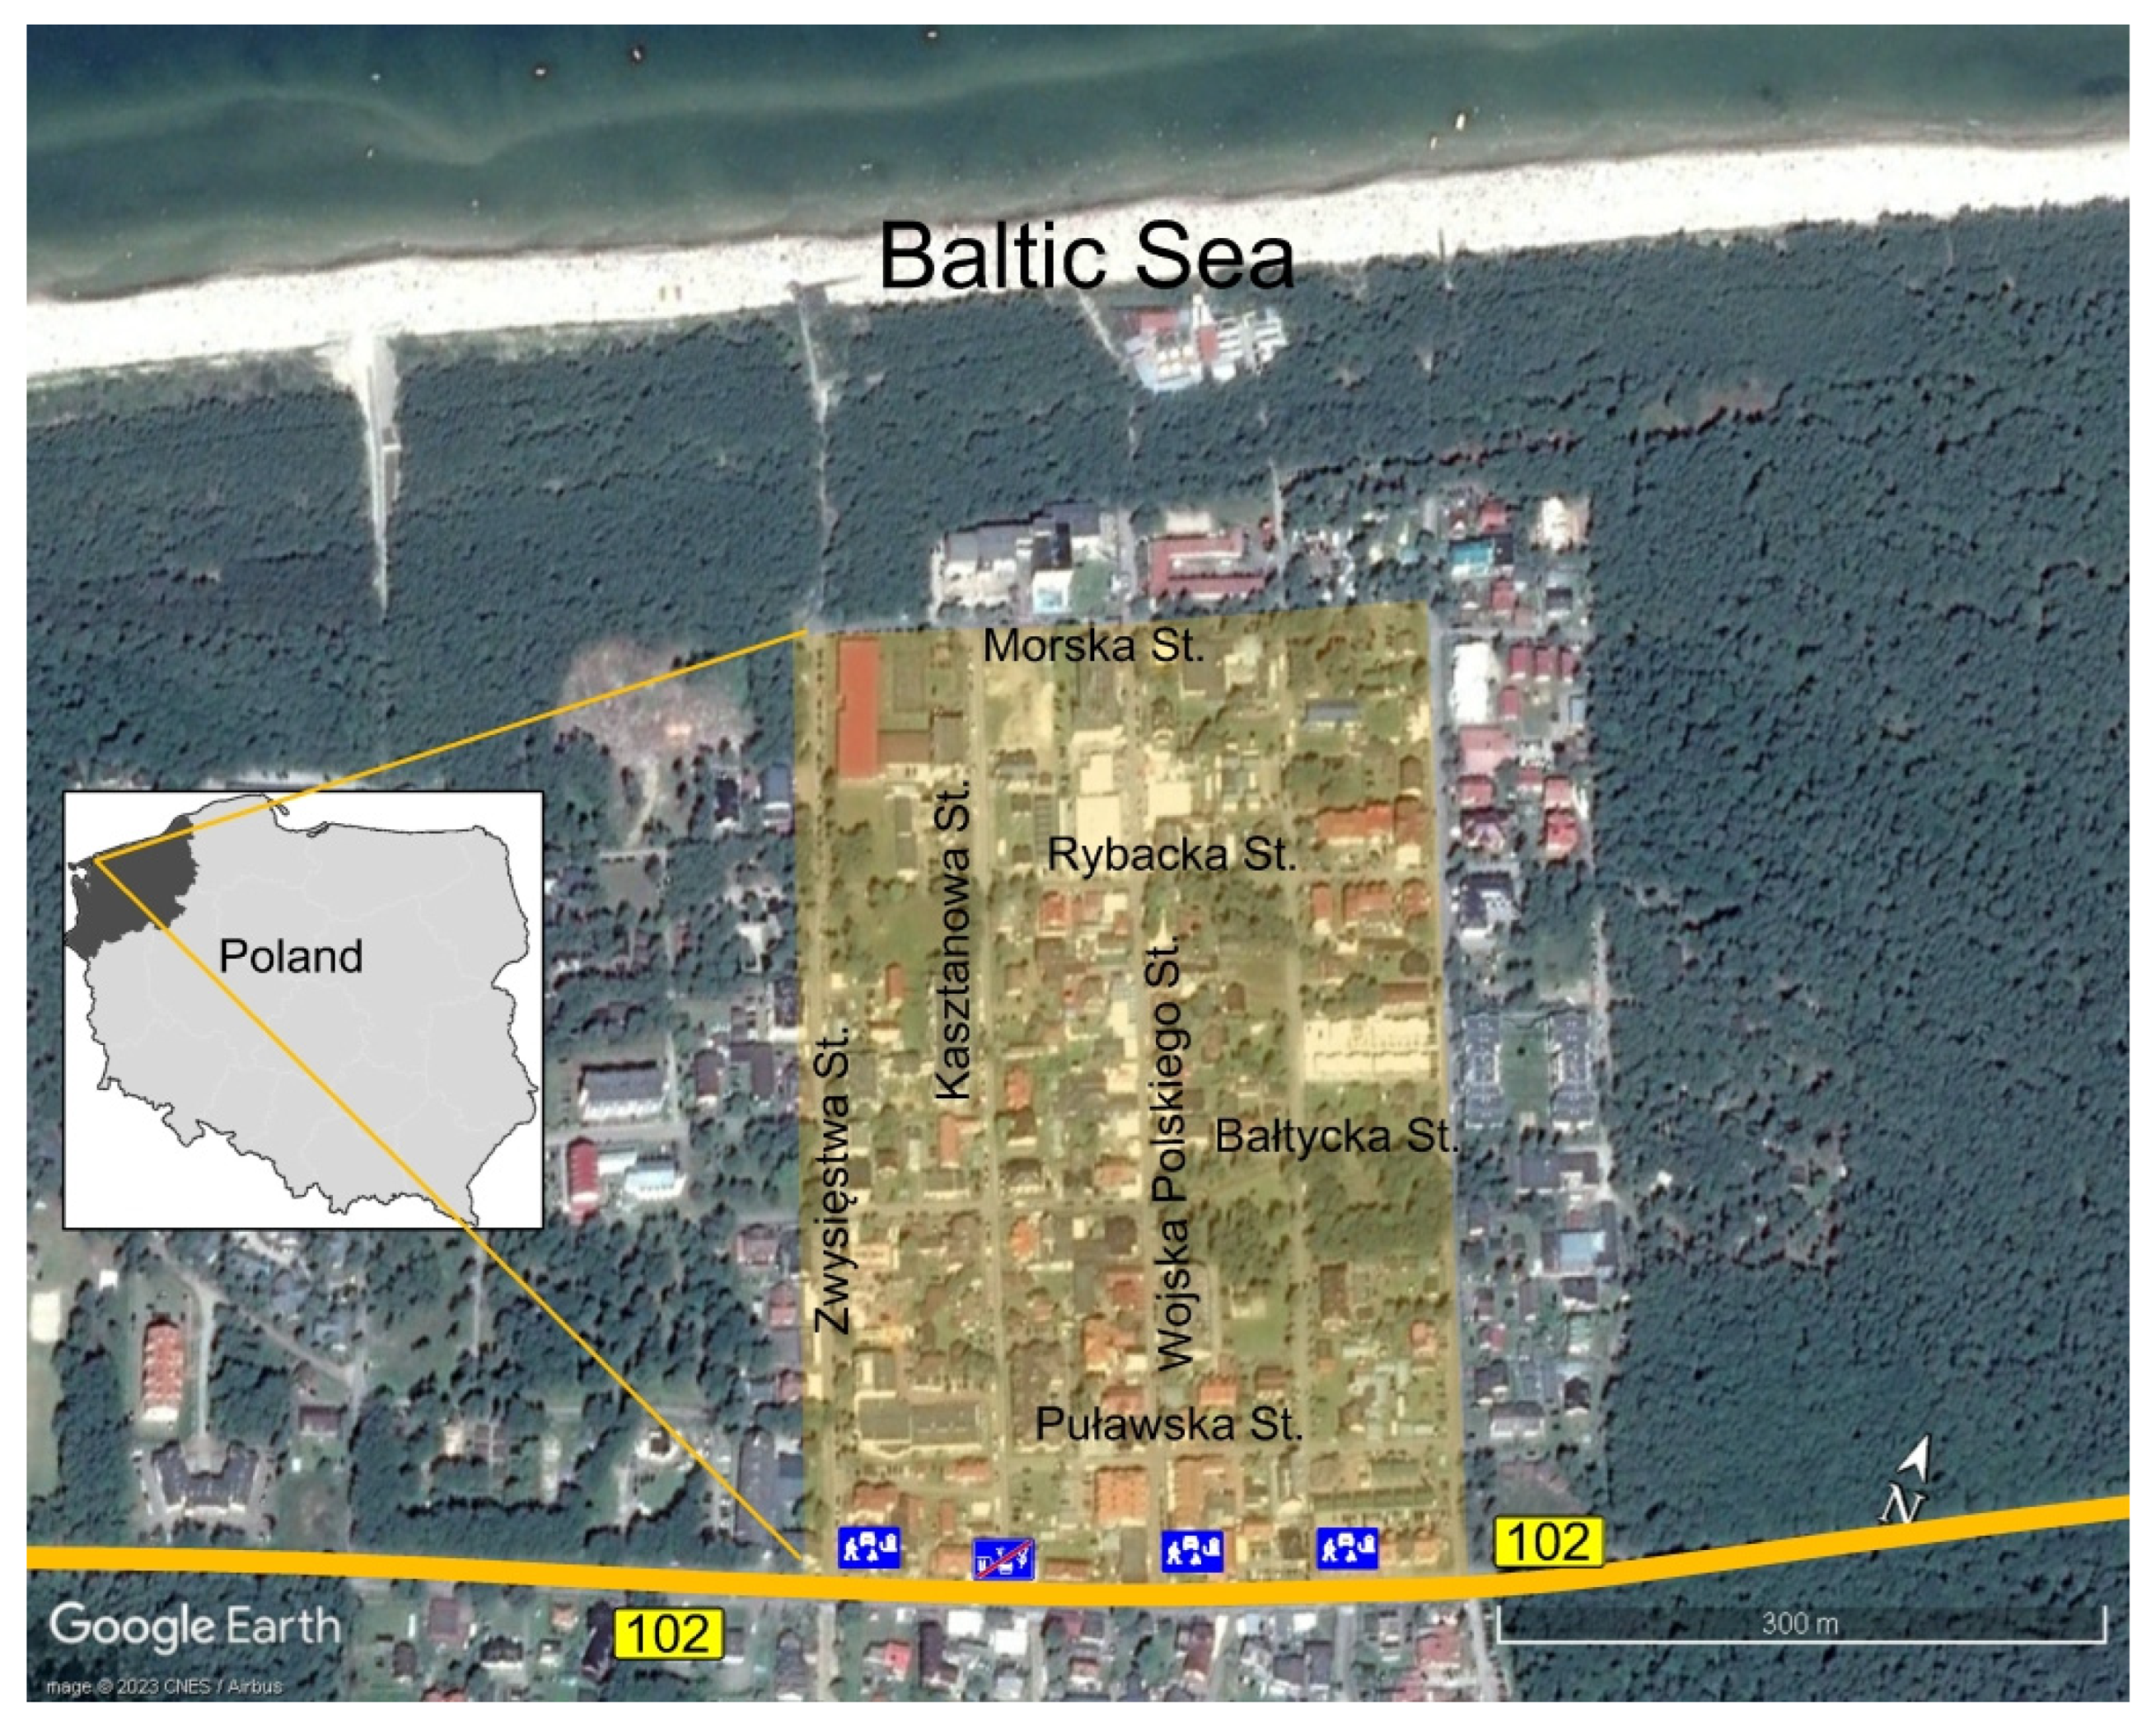
Figure 4.
Both the study area and the home zone (marked in orange) are located to the north of the DW102 road. Source: own elaboration against the background of a satellite photo from Google Earth [
5].
Figure 4.
Both the study area and the home zone (marked in orange) are located to the north of the DW102 road. Source: own elaboration against the background of a satellite photo from Google Earth [
5].
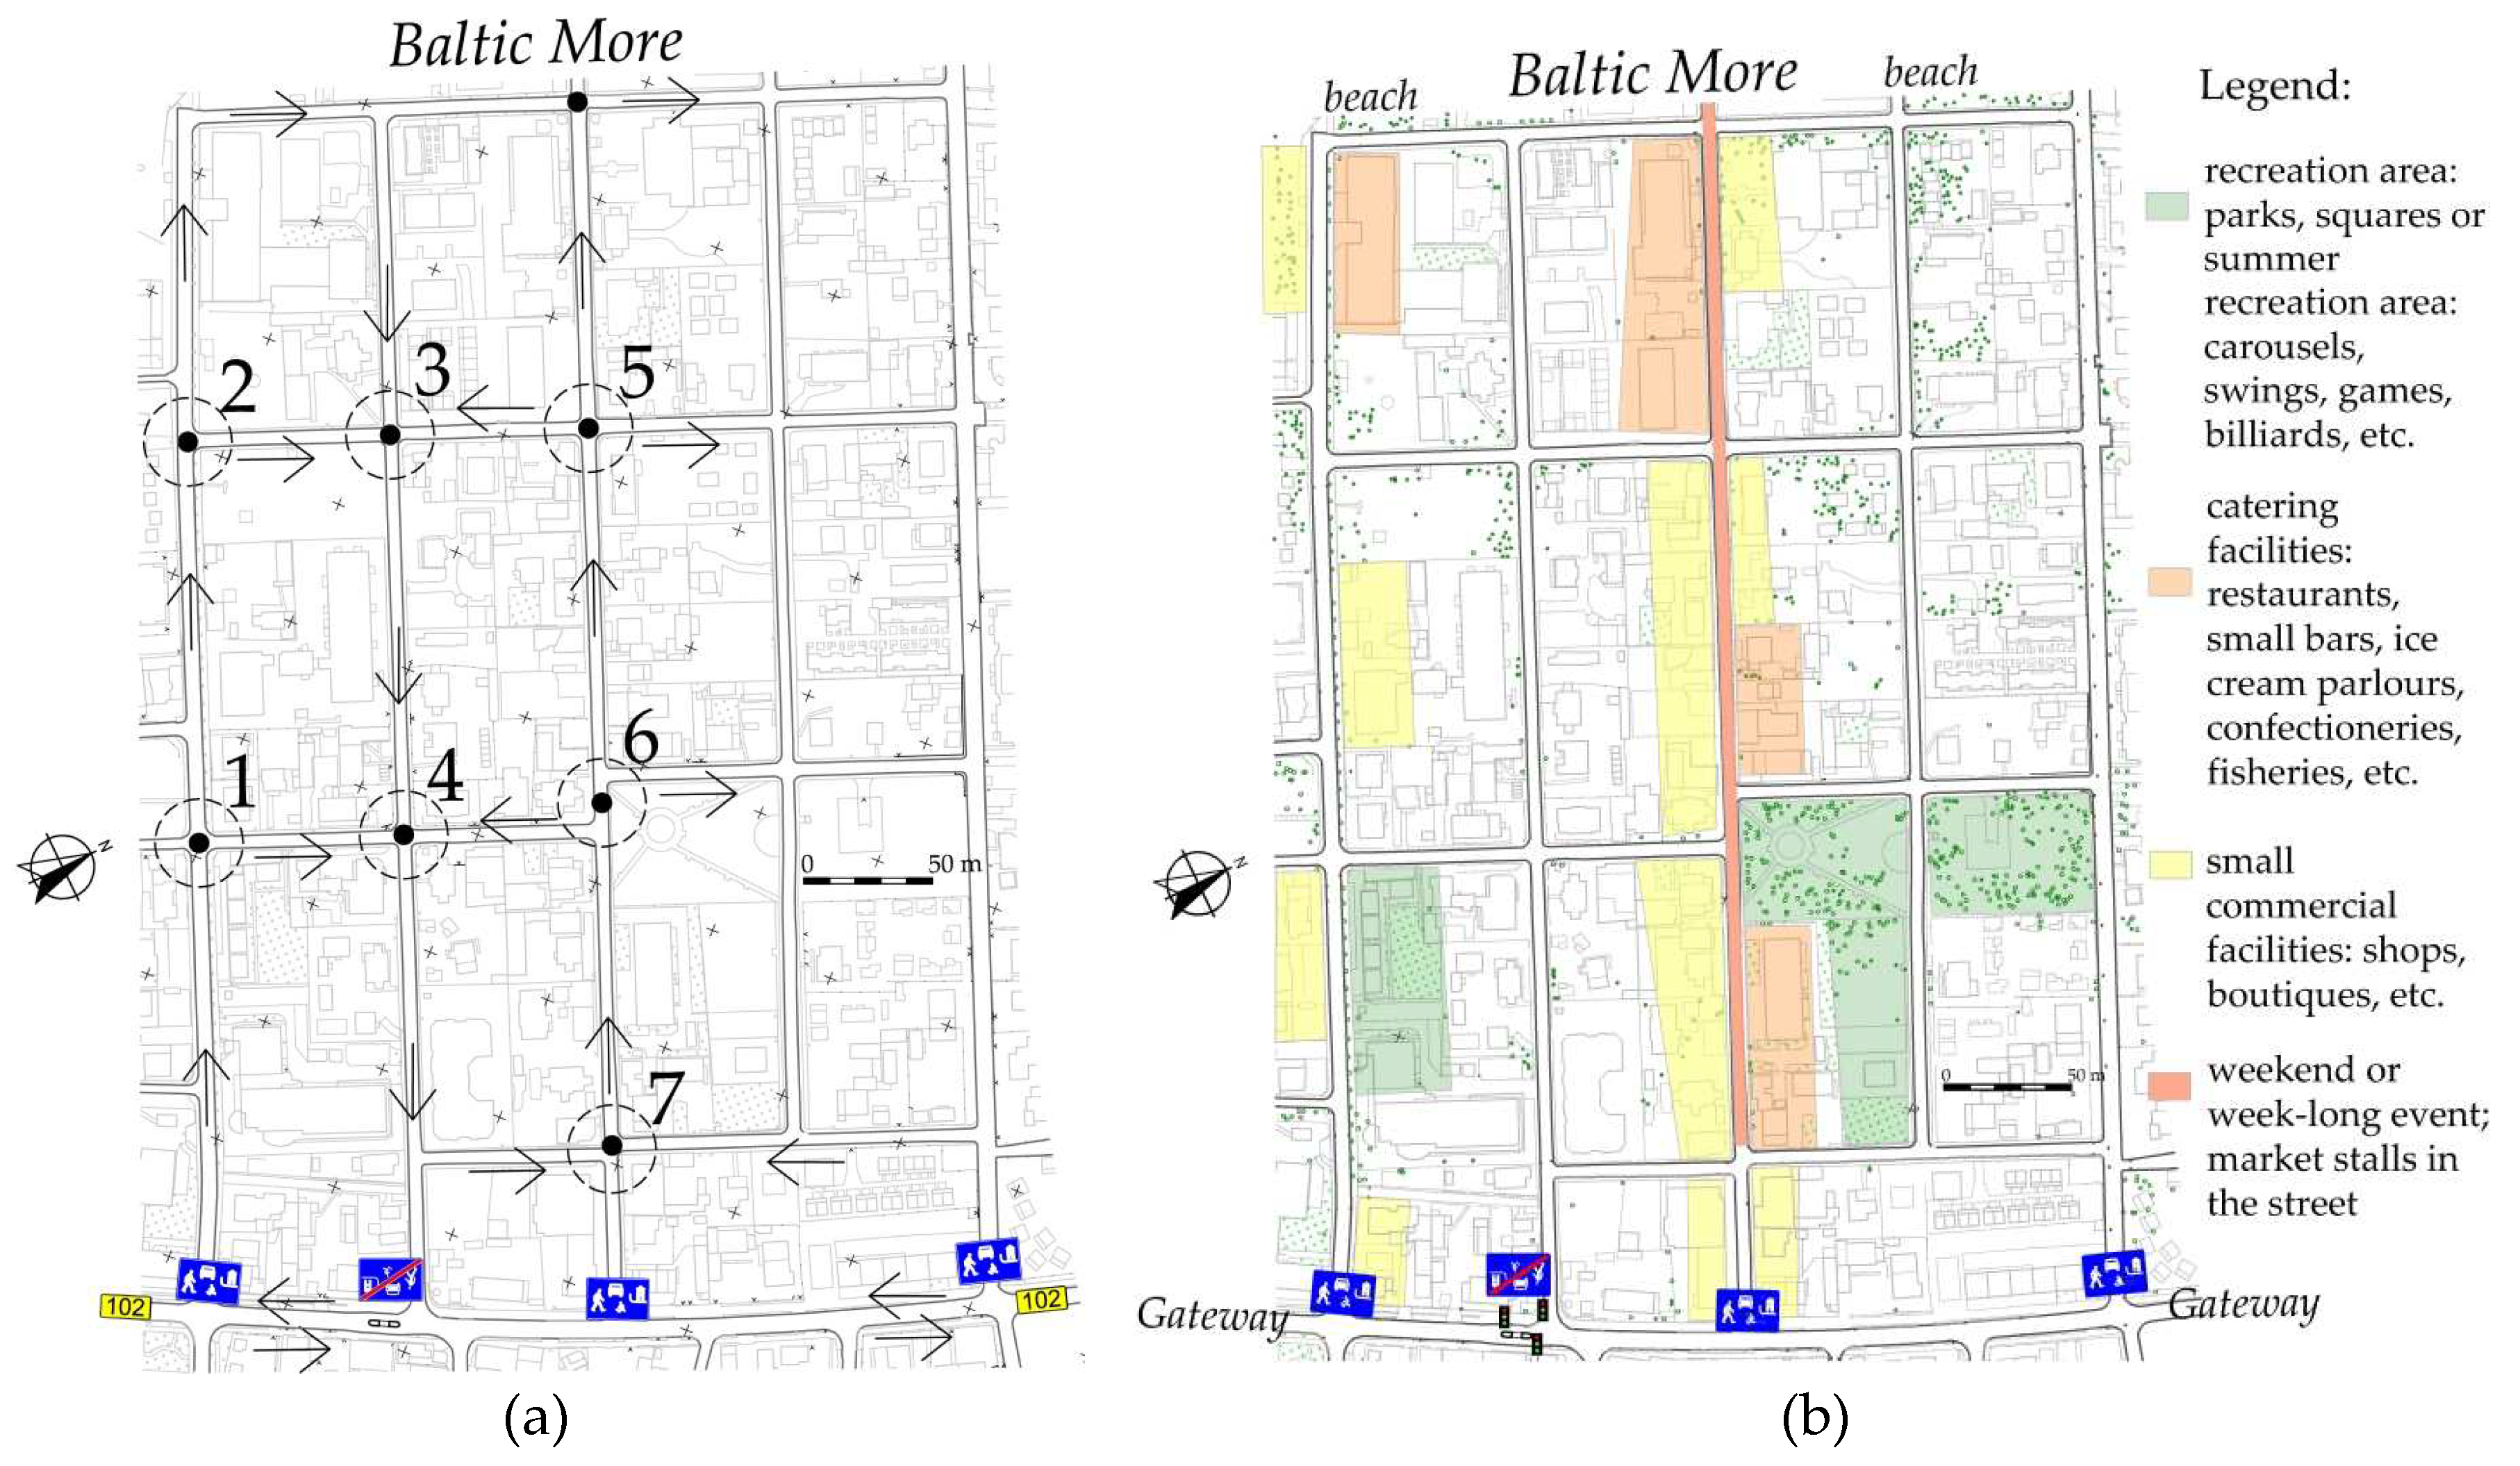
Figure 5.
Study area details: (a) traffic circles locations and numbering; (b) home zone divided into functional sub-areas. Source: own elaboration.
Figure 5.
Study area details: (a) traffic circles locations and numbering; (b) home zone divided into functional sub-areas. Source: own elaboration.
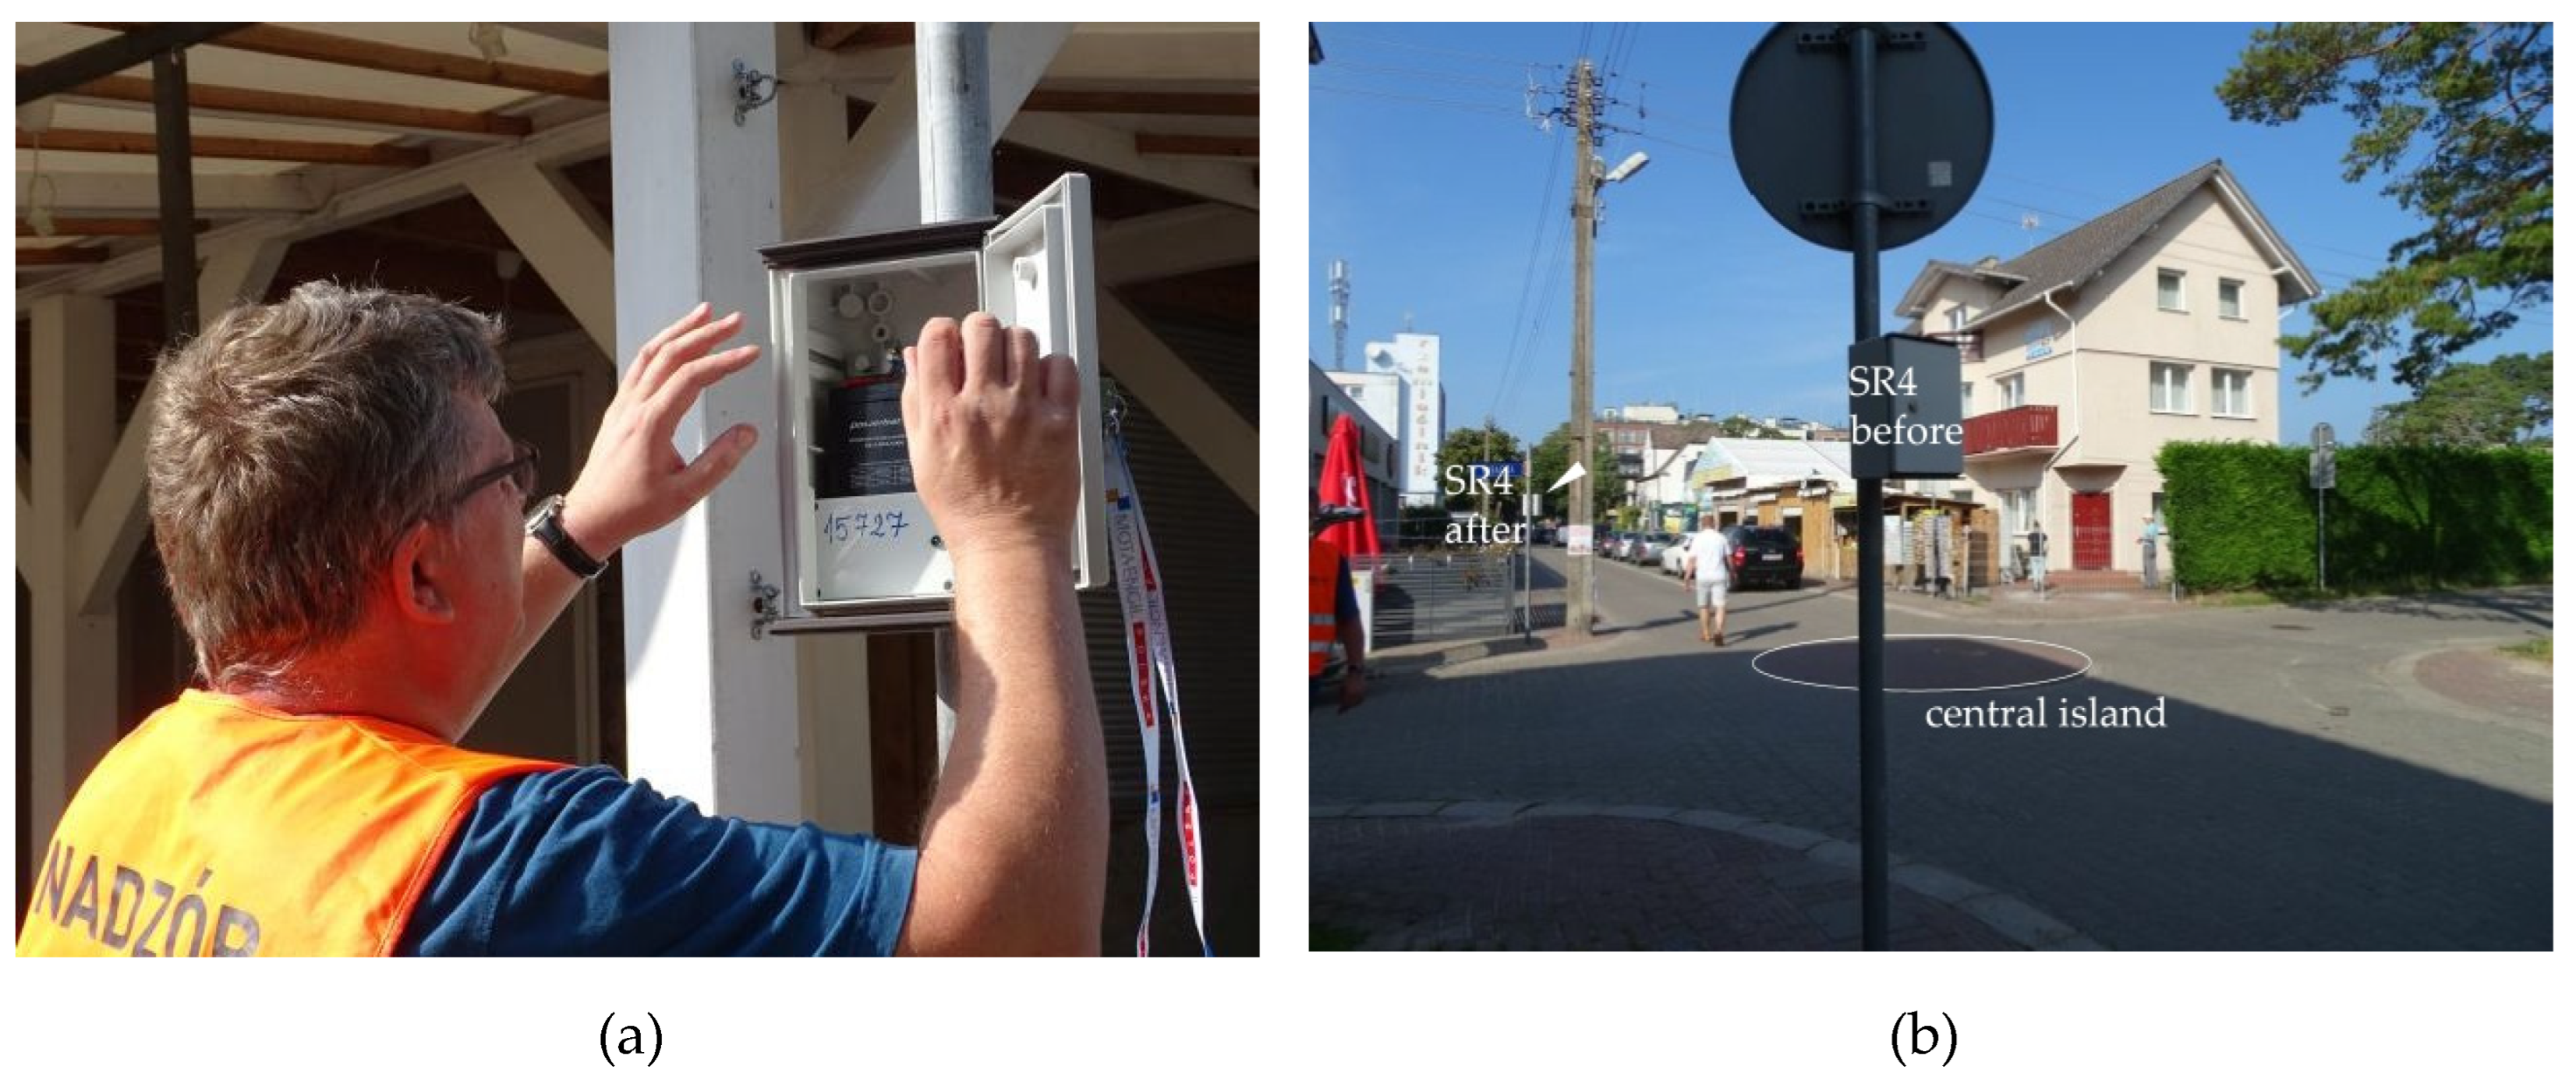
Figure 6.
Survey station equipment (SR4): (a) traffic detection device; (b) SR4 sited before and after traffic circle. Source: photo by Alicja Sołowczuk.
Figure 6.
Survey station equipment (SR4): (a) traffic detection device; (b) SR4 sited before and after traffic circle. Source: photo by Alicja Sołowczuk.
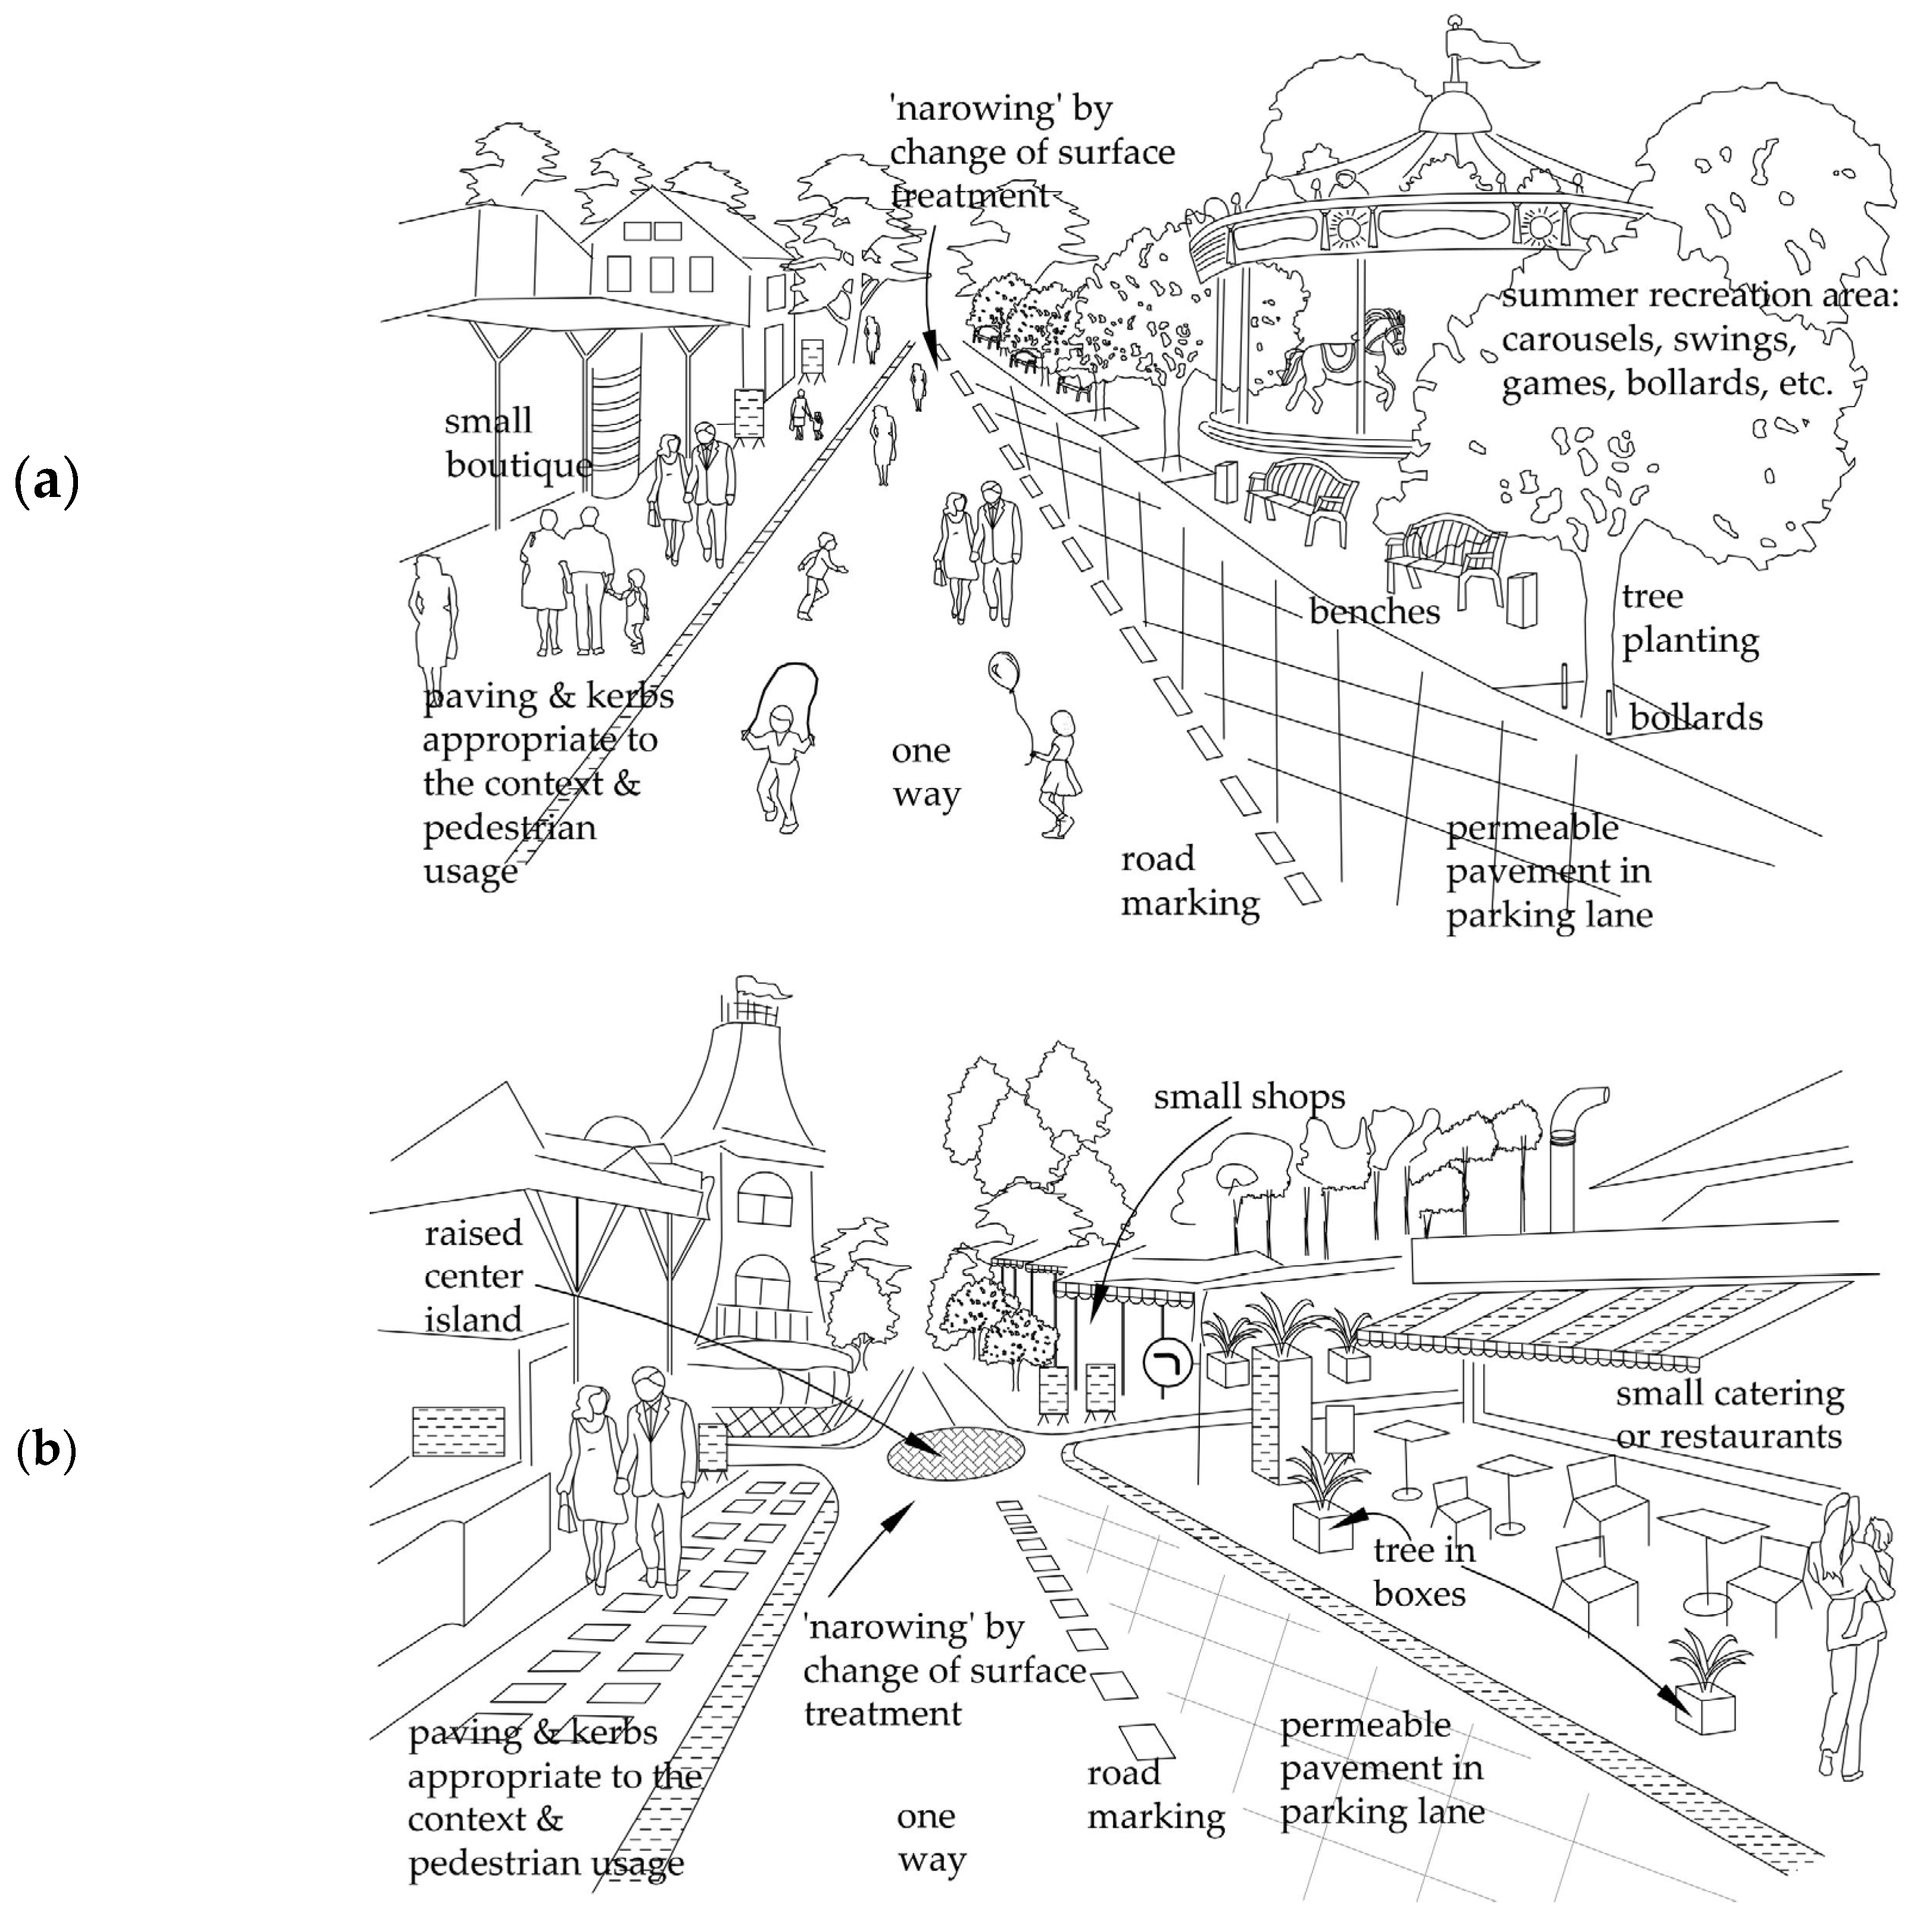
Figure 7.
Streetscape and traffic calming measurements visualisation of the analysed streets: (a) one-way street with parallel on-street parking on the right-hand side; (b) one-way main promenade hosting various weekend events. Source: drawings own.
Figure 7.
Streetscape and traffic calming measurements visualisation of the analysed streets: (a) one-way street with parallel on-street parking on the right-hand side; (b) one-way main promenade hosting various weekend events. Source: drawings own.
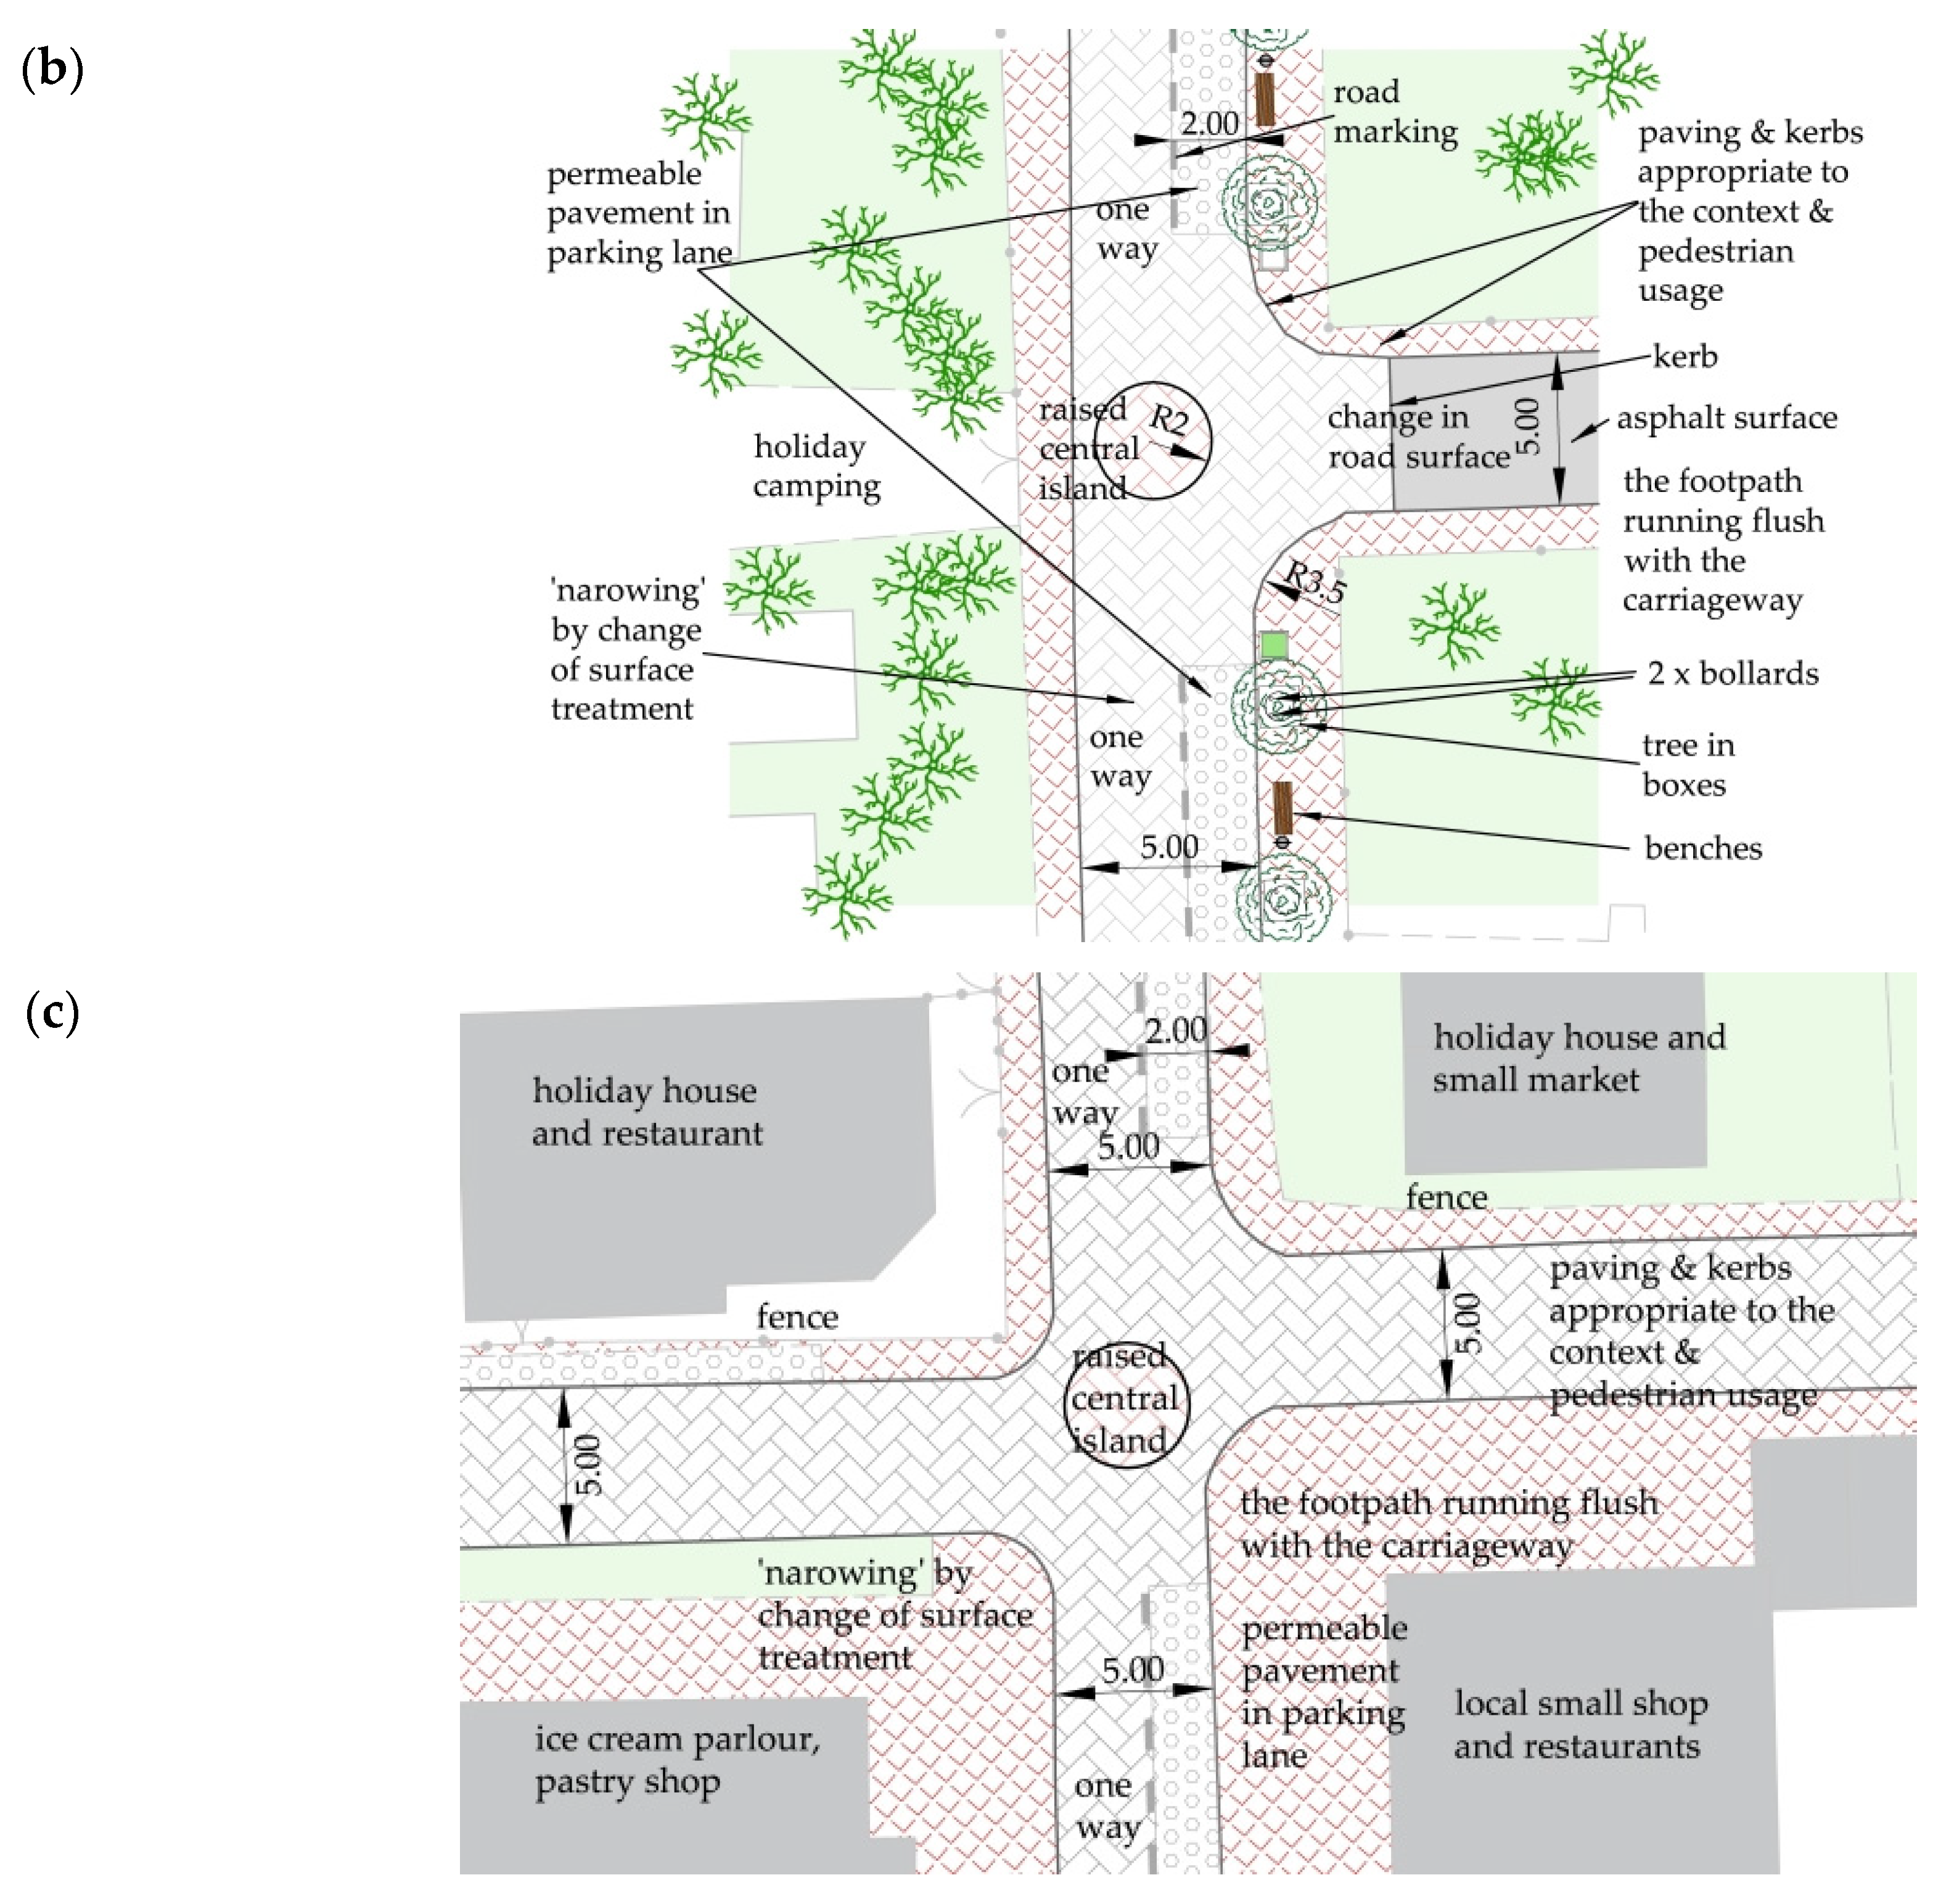
Figure 8.
Visualization of the analysed traffic circles: (a) transverse cross-section; (b) plan view of a traffic circle located on a T-junction; (c) plan view of traffic circle located on the main promenade (all dimensions in metres). Source: own elaboration.
Figure 8.
Visualization of the analysed traffic circles: (a) transverse cross-section; (b) plan view of a traffic circle located on a T-junction; (c) plan view of traffic circle located on the main promenade (all dimensions in metres). Source: own elaboration.
Figure 9.
Analysed traffic circles: (a) No. 3 – ∆h = 0.17 m; (b) No. 6 – ∆h = 0.08 m (all dimensions in metres). Source: photo by Alicja Sołowczuk.
Figure 9.
Analysed traffic circles: (a) No. 3 – ∆h = 0.17 m; (b) No. 6 – ∆h = 0.08 m (all dimensions in metres). Source: photo by Alicja Sołowczuk.
Figure 10.
Box plot of speed data measured in summer. The whiskers represent the minimum and maximum values; lower and upper edges of the boxes determine the first and third quartiles; the bold line designates the median value. Source: own elaboration.
Figure 10.
Box plot of speed data measured in summer. The whiskers represent the minimum and maximum values; lower and upper edges of the boxes determine the first and third quartiles; the bold line designates the median value. Source: own elaboration.
Figure 11.
Box plot of speed data measured in September. The whiskers represent the minimum and maximum values; lower and upper edges of the boxes determine the first and third quartiles; the bold line designates the median value. Source: own elaboration.
Figure 11.
Box plot of speed data measured in September. The whiskers represent the minimum and maximum values; lower and upper edges of the boxes determine the first and third quartiles; the bold line designates the median value. Source: own elaboration.
Figure 12.
Differences in pedestrian traffic on the main promenade in the home zone area: (
a) summer season (Source: Google Earth [
5]); (
b) September. (Source: photo by Alicja Sołowczuk).
Figure 12.
Differences in pedestrian traffic on the main promenade in the home zone area: (
a) summer season (Source: Google Earth [
5]); (
b) September. (Source: photo by Alicja Sołowczuk).
Figure 13.
Illustrative cumulative frequency graph of traffic circle crossing speeds: (a) No. 1; (b) No. 2; (c) No. 3; (d) No. 7. Source: own elaboration.
Figure 13.
Illustrative cumulative frequency graph of traffic circle crossing speeds: (a) No. 1; (b) No. 2; (c) No. 3; (d) No. 7. Source: own elaboration.
Figure 14.
Examples of passenger cars driving through traffic circles: (a) traversing the island on the left-hand side; (b) traversing the island on the right-hand side; (c) traversing through the central part of the island; (d) bypassing the island by pulling right. Source: photo by Alicja Sołowczuk.
Figure 15.
Traffic circle driving speed profiles: (a) No. 1 – Δh = 0.12 m; (b) No. 2 – Δh = 0.09 m; (c) No. 3 – Δh = 0.17 m; (d) No. 4 – Δh = 0.16 m; (e) No. 5 – Δh = 0.12 m; (f) No. 6 – Δh = 0.08 m; (g) No. 7 – Δh = 0.11 m. Source: elaboration own.
Figure 15.
Traffic circle driving speed profiles: (a) No. 1 – Δh = 0.12 m; (b) No. 2 – Δh = 0.09 m; (c) No. 3 – Δh = 0.17 m; (d) No. 4 – Δh = 0.16 m; (e) No. 5 – Δh = 0.12 m; (f) No. 6 – Δh = 0.08 m; (g) No. 7 – Δh = 0.11 m. Source: elaboration own.
Figure 16.
Speed reduction vs. central island difference of level ∆h: (a) v85; (b) vav. Source: elaboration own.
Figure 16.
Speed reduction vs. central island difference of level ∆h: (a) v85; (b) vav. Source: elaboration own.
Table 1.
Sample results of statistical tests – traffic circle No. 1 and No. 2. Source: own work.
Table 1.
Sample results of statistical tests – traffic circle No. 1 and No. 2. Source: own work.
| |
K–S Goodness-of-fit test 1
|
Two-sample K–S test 2
|
Median test 3
|
| Before |
After |
| Data from the Summer |
| Traffic circle No. 1 |
λ = 0.76 < λα = 1.36 |
λ = 0.34 < λα = 1.36 |
λ = 4.05 > λα = 1.36 |
χ2 = 30.3 > χα2 = 3.84 |
| Traffic circle No. 2 |
λ = 0.73 < λα = 1.36 |
λ = 0.58 < λα = 1.36 |
λ = 4.45 > λα = 1.36 |
χ2 = 38.2 > χα2 = 3.84 |
| Data from the September |
| Traffic circle No. 1 |
λ = 0.92 < λα = 1.36 |
λ = 1.00 < λα = 1.36 |
λ = 4.03 > λα = 1.36 |
χ2 = 83.8 > χα2 = 3.84 |
| Traffic circle No. 2 |
λ = 0.90 < λα = 1.36 |
λ = 0.75 < λα = 1.36 |
λ = 2.28 > λα = 1.36 |
χ2 = 27.2 > χα2 = 3.84 |
Table 2.
Results of statistical tests related to hypothesis 2A – effect of pedestrians on the “before” and ”after” traffic circle speeds measured in the summer season and in September. Source: own work.
Table 2.
Results of statistical tests related to hypothesis 2A – effect of pedestrians on the “before” and ”after” traffic circle speeds measured in the summer season and in September. Source: own work.
| Test |
Traffic circle |
| No. 1 |
No. 2 |
No. 3 |
No. 4 |
No. 5 |
No. 6 |
No. 7 |
| Data from Test K–S test 1
|
| Before (Summer and September) |
4.05 |
6.9 |
5.7 |
4.5 |
2.3 |
1.35 |
4.9 |
| After (Summer and September) |
7.00 |
7.2 |
7.5 |
7.7 |
7.1 |
7.3 |
7.1 |
| Data from Median test 2
|
| Before (Summer and September) |
26.6 |
167.9 |
165.5 |
174.4 |
179.7 |
166.0 |
164.5 |
| After (Summer and September) |
97.9 |
153.8 |
139.3 |
152.4 |
180.8 |
197.8 |
56.1 |
Table 3.
Statistics related to hypothesis No. 2B to verify the effect of the traffic circle location, place in the sequence and the surrounding streetscape features on the “before” speed measured in the September survey. Source: own work.
Table 3.
Statistics related to hypothesis No. 2B to verify the effect of the traffic circle location, place in the sequence and the surrounding streetscape features on the “before” speed measured in the September survey. Source: own work.
| Test |
Analysis of traffic circles located along the main streets |
| No. 1 and 2 |
No. 3 and 4 |
No. 5 and 6 |
No. 6 and 7 |
| Data from Test K–S test 1
|
4.1 |
1.1 |
1.6 |
3.3 |
| Data from Median test 2
|
48.4 |
3.6 |
8.0 |
67.6 |
Table 4.
Statistics related to hypothesis No. 2C to verify the effect of the traffic circle location and the surrounding streetscape features at a parallel location on the “before” speed measured in the September survey. Source: own work.
Table 4.
Statistics related to hypothesis No. 2C to verify the effect of the traffic circle location and the surrounding streetscape features at a parallel location on the “before” speed measured in the September survey. Source: own work.
| Test |
Analysis of traffic circle located on parallel side streets |
| No. 1 and 7 |
No. 2 and 5 |
No. 3 and 5 |
No. 4 and 7 |
| Data from Test K–S test 1
|
4.3 |
1.32 |
2.1 |
1.6 |
| Data from Median test 2
|
83.8 |
8.6 |
8.7 |
15.7 |
