Submitted:
23 October 2023
Posted:
24 October 2023
You are already at the latest version
Abstract
Tourism is an important industry that promotes national economic and social progress. All-for-one tourism is a new concept of regionally coordinated development that uses the tourism industry as an engine to boost resource integration, industrial integration, and social sharing. Tourism service is the main embodiment of cultural ecosystem services for all-for-one tourism cities. Taking Liyang in China as an example, this paper used a combination of GIS spatial analysis and big data text mining to evaluate the tourism service from three aspects: the quality of tourism resources, the comprehensiveness of tourism service facilities, and the satisfaction of tourists. The results show that (1) the tourism service is better in the northwestern and eastern areas of the city, while it is lower in the northeastern and southwestern parts; (2) the hotspot areas should focus on improving the tour routes, the transport capacity, and excessive charges; the cold spot areas should work on ecological restoration and creating new tourism attractions by combining the local industries; (3) rural tourism integrating agriculture and visitation should be highlighted as a key growth point to improve the city’s tourism service function.
Keywords:
tourism service evaluation
; ecosystem services (ES)
; AHP-entropy weight method
; GIS spatial analysis
; text mining
1. Introduction
Ecosystems are the foundation for human survival and development, providing the environmental conditions and material support necessary for human existence. The benefits that humans derive from the natural environment are defined as ecosystem services (ES) [1]. The basic ideas behind ES germinated in the late 1960s. The term "ecosystem services" was coined in 1982 by ecological scientist Walter Westman, bringing the concept into wider use [2]. In 1997, ecological economists Robert Costanza et al. published a landmark paper describing a methodology for valuing ecosystem service functions and estimating the annual economic value of the world's ecosystem services to be $33 trillion [3]. This research has led to the recognition that public environmental resources, such as clean water and biological resources, are limited and valuable, and has made people aware of the importance of the public goods provided by the ecological environment [4]. The Millennium Ecosystem Assessment, conducted in 2005, systematically studied the relationship between ES and human well-being and focused on the assessment of ecosystem service functions. The project classified ES into four categories: provisioning, regulating, cultural, and supporting services, and this classification system has since become widely used in environmental science, economics, and policy.
Cultural ecosystem service (CES) refers to the non-material well-being that humans obtain from ecosystems, including aesthetic inspiration, cultural identity, sense of home, and spiritual experiences [1]. Cultural ecosystem services (CESs) are directly experienced and subjectively valued by people who benefit from them [5]. They are more closely related to human well-being [6,7] and the ecosystem's sustainability [8]. However, it is difficult to identify and evaluate CESs, since the value of these intangible benefits depends not only on the physical landscape and infrastructure but also on public demand and social culture [9]. Because of this challenge, the evaluation of CESs has become a hot topic in recent years. The evaluation methods are generally divided into value accounting [10,11,12,13], land use matrix method [14,15,16], participatory method [17,18], and model simulation [19,20,21]. Currently, most evaluations of CESs focus on assessing the overall CES from the perspective of service supply and demand or synthesizing the overall results through simple evaluations of each service category.
Some studies focus on the evaluation of a particular type of CESs, mostly recreation service [22,23,24] and aesthetic service [25,26,27], which are easier to quantify. Very little of the literature deals with tourism service, even though tourism is a significant contributor to ecosystem services. A very important reason is that there is some controversy about whether the tourism service belongs to cultural services. Some authoritative institutional reports that serve as the basis of research provide relevant elaborations on tourism. The Millennium Ecosystem Assessment (MEA) report uses the term "recreation and ecotourism" as an example to illustrate the classification of cultural services [1] (p.7). The Economics of Ecosystems and Biodiversity (TEEB) report clearly lists “tourism” as a category under cultural services when describing the classification of ES [28] (p.4). Although the two reports classify tourism as a cultural service, the term "ecotourism" is predominantly used throughout the text, suggesting that only tourism closely related to the natural environment is recognized. Moreover, many statements consider tourism as an industry that depends on ES or describe it as a beneficiary of ES. As Josep Pueyo-Ros has stated in his paper, tourism is treated in a "schizophrenic" manner [29], being considered on the one hand as a cultural ecosystem service, and on the other hand as a "nature-based consumptive industry". In the SEEA (System of Environmental Economic Accounting) report, the services that benefit visitors/tourists are classified as recreation-related services, and tourism is not directly mentioned [30]. To support the SEEA revision, the European Environment Agency (EEA) has published the Common International Classification of Ecosystem Services (CICES). The classification of ES in this report is more systematic and complex. Although tourism is not directly mentioned in the category of cultural services, some of the elaborations in the report are instructive as to whether tourism can be considered as a cultural service. The report regards cultural services as "the environmental settings, locations or situations" that can involve "individual species, habitats, and whole ecosystems", which is a more specific and detailed definition [31] (p.10). According to this definition, especially for tourism cities, visitations are the most prominent and dominant setting of the city. In other words, tourism can exist as a cultural service for tourism-oriented cities. It also states that "The settings can be semi-natural as well as natural settings (i.e., can include cultural landscapes) providing they are dependent on in-situ living processes " [31] (p.10). This indicates that the report no longer emphasizes only completely natural environments, but that semi-natural environments, managed ecosystems and even cultural landscapes can provide cultural services. Therefore, tourism does not need to be limited to whether it is nature-based or not. For cities like Liyang that are striving to develop all-for-one tourism, all kinds of tourism attractions should be included in the evaluation of tourism service.
At present, there is not a complete theoretical framework or evaluation system for tourism service. Evaluations related to tourism service are often from the perspective of the tourism industry, focusing on tourism performance [32,33,34], tourist behavior preference [35,36,37], tourism resource potential [38,39,40], tourism service quality [41,42,43], and tourism service economic valuation [44,45,46]. The evaluation methods mainly include monetary approaches [44,47], questionnaire and interview surveys [36], evaluation by constructing an indicator system [32,33,48], model simulation [49,50], and social media data mining [51,52]. Although monetary quantification is popular and convenient, it is always subjective and difficult to capture non-use values, such as existence or bequest values, which are often important components of the total economic value [53]. Questionnaire and interview surveys are more conventional and are prone to random errors with small sample data. The model simulation approach draws mainly on the Recreation module of the InVEST model and the SolVES model. However, the InVEST model often cannot accurately reflect the actual situation of the study area. This is because the geotagged photos used in the "Recreation and Tourism" tool come only from the Flickr website, which is not universally used in all countries around the world, and the database only covers the period from 2005 to 2017. The SolVES model can create a statistical model between social survey data and natural environmental variables, but the model's single environmental parameter setting will cause different landscape types to use the same environmental variables, which ultimately leads to inaccurate results [54].
As tourism is an important driving force for integrated urban-rural development and an important platform for external communication, China has vigorously developed the tourism industry since the reform and opening up in the 1980s, becoming the largest domestic tourism market and one of the world's leading tourism economies. In 2015, the National Tourism Administration first proposed the concept of "all-for-one tourism". Since then, local governments across the country have been exploring ways to integrate tourism with various industries and utilize existing tourism resources to promote regional development [55,56]. As a typical city that relies on its natural resources to develop all-for-one tourism, Liyang's top priority is to ensure a good ecological environment, so it is necessary to evaluate ES by taking tourism service as the dominant type of cultural service. Taking Liyang as an example, this paper constructed a tourism service evaluation system from the perspective of service supply and tourist demand. Based on the evaluation results, tourism service improvement suggestions were proposed from the perspective of enhancing the city's ecosystem services, providing policy references and planning guidelines for the city's future development. The research also provided a case study for enriching the evaluation of cultural ecosystem services.
2. Materials and Methods
2.1. Study Area
Liyang in Changzhou City is a county-level city located at the intersection of Jiangsu, Zhejiang, and Anhui provinces in the Yangtze River Delta region (Figure 1). Covering an area of 1,535 km2, Liyang is rich in landscape resources and has a varied topography, including low mountains, hills, polders, plains, rivers and lakes. In addition to its natural resources, the city also has rich historical and cultural resources with a long history of more than 2,000 years.
As early as the 1990s, Liyang has begun to take tourism as a major industry. Up till now, with all-for-one tourism as the driving force and ecological innovation as the focus, urban and rural areas are coordinated to promote the whole region's integrated development. In 2020, it was successfully selected as the second batch of National All-for-one Tourism Demonstration Areas. The overall pattern of "three mountains and two lakes surrounding the central city" has been formed: Wawushan Scenic Area, Caoshan Tourist Resort and Changdang Lake in the north, while Nanshan Bamboo Sea and Tianmu Lake in the south [57]. The city's main tourism attractions are diverse and distinctive, with a general distribution of dispersal throughout the area and concentration in the central city, as shown in Figure 1. According to the national standard [58] and previous studies [40,59], these attractions are divided into three categories: natural resources, historical and cultural resources, and recreational resources. Liyang Route1 is a provincial scenic byway with a total length of 365 kilometers, connecting various scenic spots and attractions, and has initially formed the “grand tourism” ambition of “Variable views everywhere, unique landscape every path”.
2.2. Data Sources and Processing
The basic data for this research includes location data and big data of tourism reviews (Table 1). The location data obtained from Baidu Maps (accessed on 26 July 2023) and OpenStreetMap (accessed on 10 May 2023) were georeferenced as the Albers Conical Equal Area projection in ArcGIS. The big data for tourism reviews was collected using the Octopus web crawler, with a cut-off date of 20 July 2023. After classification, cleansing, and analysis, the processed data were geocoded to the corresponding spatial locations of tourism attractions using ArcGIS.
2.3. Methods
2.3.1. Determination of the Evaluation Unit
The landscape pattern has obvious scale dependence. Granularity is the smallest pixel constituting the landscape. Too small a granularity will easily produce local information redundancy and fail to reflect the overall characteristics of the landscape, while too large a granularity will produce information loss. Therefore, it is necessary to first determine the optimal granularity and use it as the evaluation unit. The evaluation of area information conservation uses the principle of minimum loss of landscape area in the scale transformation process to identify the optimal granularity domain. The improved area-change evaluation index model proposed by Xu et al. [60] was used to calculate the area loss index. The formulas are as follows:
where is the relative value of area loss, and are the area of the -th landscape before and after scale transformation, is the area loss index for the study area, and is the number of landscape types. The larger , the greater the area change, and the worse the accuracy of the area after scale transformation.
ArcGIS was used to generate a series of raster images with different resolutions from 50m to 1200m at 50m intervals based on the land use of the study area. Taking the granularities as the horizontal coordinate and the corresponding area loss indexes as the vertical coordinate, the relationship curve was plotted. From Figure 2, it can be seen that between granularities of 50m and 250m, the area loss index remains stable below 0.005. Between 250 to 800m, it fluctuates slightly between 0.005-0.05. After 800m, it fluctuates dramatically. Overall, the area loss index is at its lowest level (less than 0.02) at granularities of 50-250m, 400m, and 600m, which are the optimal granularity domains.
The analysis of the granularity effect of landscape pattern indexes is to determine the optimal granularity by identifying the inflexion points of index curves. By calculating the landscape pattern indexes at different granularities and based on the coefficient variation, six indexes that are sensitive to granularity changes were selected: number of patches (NP), patch density (PD), connectance index (CONNECT), proportion of like adjacencies (PLADJ), edge density (ED) and landscape-shape index (LSI). The values of landscape pattern indexes under different granularities were calculated using Fragstats 4.2 and the granularity effect curves were plotted. As shown in Figure 3, NP, PD, PLADJ, ED, and LSI decrease with increasing granularities, showing a trend of rapid decline from 50m to 400m, followed by a slow decline. The CONNECT value decreases rapidly from 50m to 150m, remains stable between 150m and 400m, and then fluctuates drastically up to 600m, after which it remains at 0.
Considering both the area loss and landscape pattern index granularity effect, 400m is the optimal granularity that can better reflect the spatial information of the landscape pattern. Therefore, the grid cell of 400m*400m was taken as the evaluation unit, and a grid network was created using the fishnet tool in ArcGIS, with a total of 9949 units overlapping with the study area (Figure 4). On this basis, the spatial visualization of the evaluation results was achieved by calculating the tourism service of each unit.
2.3.2. Construction of the Evaluation Indicator System for Tourism Service
- 1.
- Selection of evaluation indicators
The evaluation indicator system for tourism service provides a comprehensive framework for assessing service supply and tourist demand. Tourism service supply is reflected in the condition of tourism resources and tourism service facilities, while tourist demand is reflected in visitors’ sentiment tendencies and satisfaction levels. According to data availability and reference to previous research [39,40,61], seven factors were selected to construct the evaluation system (Table 2). The quality of tourism resources refers to the attributes and attractiveness that make the tourism sites appealing and worth visiting for tourists, including the density, fame, and popularity of the tourism resources. The comprehensiveness of tourism service facilities reflects the completeness of amenities and infrastructure to serve tourists at a destination, mainly consisting of tourism service POI density and transport accessibility. Tourist satisfaction is an index of the extent to which tourists' expectations and needs are met by their visitation to a destination, as measured by the number of check-in photos at attractions and the sentiment orientation of tourist reviews.
- 2.
- Calculation of Indicator Weights
The weights of indicators were determined by the AHP-Entropy method, which is a combination of the Analytic Hierarchy Process (AHP) and entropy weighting methods. Since it combines subjective judgment and objective data dispersal, the evaluation result is more realistic and reliable [62]. The AHP weights were calculated in yaahp10.1 with the following steps [62,63]: (1) define the goal and organize criteria into a hierarchy with the goal at the top; (2) pairwise comparisons to assign numerical values to the relative importance of criteria and alternatives in a decision problem, using a 1-9 scale and a comparison matrix; (3) calculate the consistency ratio to check whether the judgements are consistent enough to proceed. The tested consistency ratio is 0, which is less than 0.1, indicating that the results of the calculation of the model's indicator weights are reasonable. (4) calculate the weights of each criterion based on the results of the pairwise comparisons. The final weights of the seven individual factors were obtained as , where is the -th factor, is the -th grid.
The entropy weighting method is a way to calculate the weights of the factors based on the information theory. Entropy is a measure of the degree of disorder in a system and can be used to assess the degree of dispersion of an indicator. The lower the entropy of an indicator, the more information it provides, and the higher its weight should be. First, it is necessary to standardize each factor to obtain a dimensionless value [64,65]. The standardization formulas for positive and negative factors are as follows:
where is the standardized value of factor in grid , is the original value of factor in grid , and are the maximum and minimum values of factor in grid . The weight calculation formulas is as follows:
where is the linear combination coefficient and is equal to 0.5, and are the weights obtained from the APH and entropy weighting methods respectively.
2.3.3. Text Mining
Since tourist reviews, user ratings and other texts on travel websites can directly reflect tourists’ experiential perceptions, the text mining method was used to collect and analyze tourism big data, providing data sources for evaluating tourist satisfaction. The Octopus web crawler was used to collect travel review data from Ctrip (www.ctrip.com), Mafengwo (www.mafengwo.cn), and Tongcheng Travel (www.ly.com), including the information on review title, review content, ratings, time, and photos. The data collection period was until July 2023. After removing duplicates and filtering out invalid reviews, a total of 51,916 valid reviews were obtained.
ROST Content Ming 6.0 is a text mining software developed by the Virtual Learning Team from Wuhan University, which can help with word segmentation, word frequency statistics, sentiment analysis and social network visualization. First, the reviews of each attraction were segmented into words and word frequencies were counted. Then, the adjectives, adverbs, verbs and nouns that could reflect the tourists’ attitudes were filtered out and added to the HOWNET dictionary. On this basis, the sentiment analysis was carried out. In addition, high-frequency positive and negative words were visualized as word clouds to intuitively reflect tourists' attitudes.
2.3.4. Kernel Density Analysis
Kernel density analysis is a statistical method for estimating the probability density function of a given set of data points. It was used in this study to estimate the distribution of tourism attractions and tourism service infrastructures. The calculation formula is as follows:
where is the estimated density at point , is the number of points, is the bandwidth and is set as the default value by the algorithm in ArcGIS [66], is the -th data point, and is the kernel function.
2.3.5. Accessibility Measurement
The Accumulative Cost Distance model was used to measure accessibility by calculating the minimum cumulative cost from a cell to the source locations via a cost surface. The cost surface was a 400 m grid map with the rasterized road network. According to the Technical Standard of Highway Engineering of the People’s Republic of China (JTGB01-2014), the time cost values of the grids were calculated with the speed of different road levels (Table 3).
2.3.6. Hot Spot Analysis
Hot spot analysis is a spatial analysis and mapping technique that identifies clusters with high values (hot spots) and low values (cold spots). The Getis-Ord Gi* statistic in ArcGIS was used to identify the hot spots and cold spots of tourism service. The calculation formula is as follows:
where n is the total number of grids; is the attribute value for grid ; is the spatial weight between grid and grid based on distance .
3. Results
3.1. Evaluation of the Quality of Tourism Resource
High-quality destinations tend to attract more visitors, generate more revenue and increase visitor satisfaction and local pride. Figure 5 shows the assessment of the quality of tourism resources in the study area from three aspects. The density analysis shows the spatial distribution and the aggregation degree of tourism resources. By concentrating and combining different types of tourism attractions, destinations can offer a wide range of experiences and activities. Therefore, the denser the tourism attractions, the stronger the aggregation effect and the higher the quality of the destinations. Government departments at all levels, such as the Ministry of Culture and Tourism, Ministry of Agriculture and Rural Affairs, Provincial Housing and Urban-Rural Development, etc., have evaluated and leveled tourism attractions according to some specific criteria. The reputation indicator was scored according to the level of the attractions, with the following principles: national-level attractions scored 8-10', provincial-level attractions scored 7-8', city-level attractions scored 5-7', Internet hotspot attractions scored 2-5', and general attractions scored 1-2'. The popularity scores of the tourism resources were obtained from the tourism websites, which were comprehensively calculated by the number of user views and reviews.
3.2. Evaluation of the Comprehensiveness of Tourism Service Facilities
Tourism service facilities are important in providing a positive experience for visitors and supporting the tourism industry, covering the aspects of accommodation, medical care, catering, recreation, and transport. The distribution of tourism service POIs and the road network is shown in Figure 6. Accommodation facilities are hotels and other types of lodging facilities that provide overnight accommodation for visitors. Medical facilities are hospitals, clinics, pharmacies that provide medical treatment services to visitors. Catering facilities are restaurants, cafes, bars and other establishments that provide food and drink services. These tourism POIs are used for density analysis and the road network is used for transportation accessibility evaluation (Figure 7).
3.3. Evaluation of Tourist Satisfaction
The evaluation of tourist satisfaction was based on the reviews crawled from Ctrip, Mafengwo and Tongcheng Travel. The more willing the tourists were to visit, the more photos they would take, and the more comments they would make. Figure 8(a) shows the total number of check-in photos from the three online travel websites for each tourism attraction. Using ROST CM6.0 to analyze the sentiment orientation of tourist comments, the number and proportion of positive, neutral, and negative comments for each attraction were obtained. To make the results of the sentiment analysis more intuitive in spatial representation, the positive, neutral and negative sentiment orientations were first assigned scores of 2, 1, and -2, respectively. Then the proportion of each sentiment type at the specific attraction was multiplied by its corresponding score and summed up, resulting in the sentiment orientation score for each attraction, as shown in Figure 8(b). The higher the score, the more positive reviews there are.
3.4. Comprehensive Evaluation of Tourism Service
As the units of the indicators are different, the evaluation result of each indicator was first normalized. Then the normalized indicators were comprehensively superimposed according to the weight values obtained by AHP-entropy method. Finally, the overall evaluation was divided into five levels based on the natural breakpoint method, as shown in Figure 9. The high-value areas (areas at high and higher levels) are distributed in the north-western edge and the east of the city, while the low-value areas (areas at low and lower levels) are mainly distributed in the north-eastern and south-western parts of the city. According to the statistics of the area of each level, about 1/4 of the city area is at the low and lower levels, over 27% is at the high and higher levels, and 47.08% of the area is at the medium level.
From the area proportion of each administrative division (Table 4), it can be seen that Licheng Subdistrict, located in the main urban area, has the highest tourism service function, with more than 91% of its area at the high and higher levels. Guxian Subdistrict, also located in the main urban area, has the second highest tourism service, with a high-value area of more than 53% and a low-value area of less than 3%. This is due to the concentration of resources and convenient transport in the central urban area. Daibu Town and Daitou Town also have a relatively high tourism service, with the high-value area of about 57% and 48% respectively. Shezhu Town has the lowest tourism service, with only about 2% of its area at the high and higher levels and over 78% of its area at the low and lower levels, mainly due to its lack of tourism resources. Bieqiao Town is also in the same situation with a small proportion (11.66%) of high-value area and a large proportion (33.34%) of low-value area. The rest of the towns are at a medium level of tourism service.
To better understand the spatial clustering, the local spatial autocorrelation analysis was used to identify hot and cold spots. As shown in Figure 10, the hot spots are mainly concentrated in Wawushan Scenic Area and Bieqiao Village in the northern part of the city, Caoshan Resort in the west, Tianmu Lake and Nanshan Bamboo Sea in the south, and the central area of the city. The cold spots are mainly concentrated in the southwest.
Word cloud graphs can intuitively and clearly reflect tourists' perceptions of scenic spots. The higher the frequency of a word, the larger its font size and the closer it is to the center of the image. First, the positive and negative words corresponding to each hotspot area were summarized, then synonyms were merged and word frequencies were counted, and finally the words with the highest frequencies were extracted to generate word cloud graphs. As shown in Figure 12, the red word cloud graphs were generated from positive words, and the blue ones from negative words. Overall, the high-frequency positive words in each hotspot area are quite similar, mainly reflecting that the attractions in the area have beautiful scenery and fresh air, which are pleasing and worth visiting. The high-frequency negative words have different evaluation tendencies and reflect where the scenic areas need to be improved in the future. Wawushan Scenic Area has few negative words, mainly reflecting the fact that the mountain is too short and small to be particularly attractive. Currently, people mainly pass through to see the mountain forest scenery, and there is little potential for staying. In the future, it may be possible to expand the range of mountain resources and develop rural tourism by combining the surrounding farmlands and villages, in order to enrich the tourism offerings of this scenic area. Caoshan Resort, called Colorful Caoshan, is a provincial-level tourism resort that integrates ecological agriculture, rural culture, sports and leisure, health and wellness, and conference and exhibition. The high-frequency negative words reflect tourists’ dissatisfaction with the theme parks. The two amusement parks, one themed on cars and the other on trains, require not only an admission fee but also additional payment for each play item, which is expensive and makes tourists feel that they have been fooled. Tourism attractions in the central city are numerous but small, mainly consisting of urban parks and squares. The target audience is mainly local residents, with only a few visitors from other places. There is a high demand for the usability of these public spaces, and negative experiences of these attractions tend to focus on withered trees and dilapidated facilities. So, it is necessary to strengthen the management of greenery and the maintenance of service facilities in the central city. Negative reviews of Tianmu Lake focus on high fees and unreasonable tour routes. Many comments mention that the required ticket and boat ride alone cost up to 180 yuan, and other services such as parking, food, and storage are also expensive. The tour route is designed so that the islands around the lake can only be reached by boat. It takes a long time to queue for the boat, and the ticket only covers a one-way trip. The return trip involves a long walk up the mountain to get back to the entrance, leaving visitors exhausted. The negative comments about the Nanshan Bamboo Sea reflect problems such as high fees, insufficient transport capacity, and over-commercialization. In addition to the high entrance fee, visitors who travel by car also have to pay a parking fee of 10 yuan per hour. Some major attractions, such as the Panda Pavilion and the Jiming Village, can only be reached by transport within the scenic area, which requires a significant additional fee. Due to the limited transport capacity and large crowds, visitors often have to wait in long queues for up to two hours just to take a two-minute cable car ride. In addition, the commercial atmosphere is too strong, with many shops lining the route. Prices for food and souvenirs are often double those outside the scenic area. To achieve the strategic goal of making Liyang an "international city of good life resort destination", Tianmu Lake and Nanshan Bamboo Sea, as national 5A-level scenic areas, need to reform and improve their business philosophy and development mode.
The area shown as No. 6 in Figure 12 is the cold spot area in Tianmu Lake Town. As shown in Figure 13, the terrain here is hilly and wooded, with a good mountain forest landscape. At the same time, due to the rich mountain resources, there are several mining sites, which not only damage the ecological environment but also affect the scenic quality. Therefore, environmental governance and ecological restoration should be carried out. The waste rock, waste water, and waste gas generated during the mining process should be treated promptly. Measures such as vegetation restoration and land reclamation should be taken to restore the mountains. In this area, two reservoirs located at the top and the bottom of the mountain make up the Liyang Pumped Storage Power Station. During the night, when there is excess power in the power grid, water is pumped to the upper reservoir to store electricity. During the day, when electricity demand peaks, the water is released into the lower reservoir to generate electricity. Preparations for the power station began in 2002 and it was commissioned in October 2017. As the largest pumped storage plant in Jiangsu Province, it currently holds 86 invention and utility model patents and has won the National Gold Award for Quality Engineering. This power station is a successful example of promoting a low-carbon economy. It is a good opportunity to take advantage of this green ecological power station for tourism development. With ecological promotion and technology demonstration as highlights, it can open to the public for science education while promoting various activities around the mountain, such as hiking, cycling, and sightseeing.
No. 7 in Figure 12 shows the cold spot area of Shezhu Town. As shown in Figure 14, there is a large area of contiguous aquaculture ponds with beautiful scenery, providing good conditions for the development of agrotourism. For some ponds with poor-quality water, measures such as improving the substrate and strengthening water circulation should be taken for water treatment. In addition to the aquaculture function, the ponds can also be combined with leisure activities to create a tourism growth point that integrates agriculture and tourism, providing a rich experience for visitors. Platforms and walkways can be built on the aquaculture ponds to provide visitors with fishing and shrimping experiences. Larger ponds can be developed into artificial lakes to provide visitors with water entertainment such as canoeing, water skiing, and swimming. Villages around can provide support services, including food, drink, rest and accommodation. Within this cold spot area, there is a cement factory called Jinfeng Cement Group, which covers an area of about 2.5 km2 and is the largest cement production enterprise in Jiangsu Province. Since 2014, the cement plant has made great efforts for the coordinated development of industry and ecology, including equipment upgrading, environmental remediation, and relocation and resettlement of residents in the protection zone. Green production is an important task for industrial upgrading, and an effective way to achieve sustainable development. The Jinfeng cement factory should further control pollution and transform the plant into a green factory that can be opened to the public. At the same time, the development history and technical process of the factory can be displayed to the public by building a museum. The proposed programs will make the factory a new tourism attraction combining production, entertainment and technology.
4. Discussion
4.1. Practical Implications for Future Tourism Development
In order to promote the coordinated development of ecological environment and tourism in Liyang, it is necessary to take measures from the perspective of improving ecosystem services. Through the comprehensive evaluation and analysis, the following suggestions are proposed for the city’s future tourism development.
(1) For developed scenic spots and attractions, such as the hotspot areas shown in the previous analysis, a large number of online reviews have already been generated. This paper used social media data mining and sentiment analysis to obtain word clouds of tourist sentiment tendencies. The positive word clouds reflect the advantages that should be carried forward. The negative word clouds reflect the dissatisfaction of tourists, which needs to be targeted for improvement and enhancement. First, the tour routes within the scenic areas need to be more reasonable and flexible. Second, the transport capacity within the scenic areas needs to be expanded, especially during the peak season when there are large crowds, to eliminate long waiting times and crowded queues for tourists. In addition, the high fees charged by scenic spots are also a prominent issue, especially for the national 5A-level Tianmu Lake and Nanshan Bamboo Sea. The business model of seeking high profits from ticket sales and transport fees should be changed as soon as possible because tourists will not return. The excellent tourism resources should be fully utilized to develop advanced services and related industry chain, providing tourists with a variety of affordable and high-quality tourism experiences. This will in turn attract a continuous stream of tourists, creating a virtuous cycle and promoting the development of the whole city.
(2) As analyzed in the previous section, the cold spots of tourism service are located in the southwest of the city, where there are good mountain and forest landscapes, as well as large areas of farmland and ponds. It is therefore necessary to carry out mountain restoration and farmland system restoration. At the same time, tourism should be combined with the local industries such as the pumped storage power station, the cement factory, and shrimp farming. It is a good opportunity to develop new tourism projects with a beautiful ecological environment and unique characteristics.
(3) Rural tourism is a development approach that is highly integrated with new urbanization and all-for-one tourism. Since 2013, Liyang has been committed to creating a rural pattern of an “ecological home and leisure paradise”, through the development model of “rural areas as tourism destinations”. At present, it has more than 20 villages with national or provincial honors. However, these well-developed villages are small in scale and scattered in distribution, failing to form a clustering effect. In the future, it will be necessary to make greater efforts to build rural tourism destinations that are highly integrated with ecology, production, and life. It is also important to create a rural tour route that connects the villages, which will become an important aspect of all-for-one tourism.
4.2. Methodological Advantages
As there has been controversy over whether the tourism service belongs to cultural services, few articles have studied tourism from the perspective of ecosystem services. Through reviewing literature and authoritative reports, this paper argues that tourism service should be treated as a cultural service for tourism-oriented cities. Taking Liyang, a typical all-for-one tourism city in China, as an example, a tourism service evaluation indicator system was established from three aspects: the quality of tourism resources, the comprehensiveness of tourism service facilities, and tourist satisfaction. This study expands the boundary of cultural services and enriches the research cases of ecosystem service evaluation.
In terms of analyzing tourist satisfaction, this paper used the Octopus tool to collect big data of tourist check-in photos and comments from tourism websites and used ROST CM for text mining to identify tourists’ sentiment tendencies. When analyzing the hotspot areas, the big data for tourism reviews is segmented and processed to generate positive and negative word clouds, based on which the corresponding improvement suggestions were proposed. Instead of traditional questionnaires, the big data analysis method can collect multi-source data of larger volume, which is not only cost-effective, but also avoids the subjective bias caused by small sample size.
4.3. Limitations and Future Research Directions
Given the data availability, this study selected 7 indicators to develop the basic evaluation system, some other indicators should be further considered to improve the research framework. For example, the landscape aesthetic quality should also be included in the scope of tourism resource quality. Each aspect of tourism services, such as dining, accommodation, recreation and medical services, should be specified with indicators. In addition, when measuring tourism accessibility, not only objective accessibility should be considered, but also perceived accessibility, which emphasizes the ease of access to activities, should be considered [67].
Although big data analysis is more objective than questionnaires, there is still a sample representation issue. In general, social media users tend to be younger, more educated, and urban residents [68,69], which may lead to an overestimation of the perceptions of certain groups. In contrast, questionnaires and interviews have the advantage of being able to collect demographic information. Future research should organically combine conventional and innovative social survey methods for spatial and non-spatial data collection.
5. Conclusions
With many advantages, such as good economic benefits, low resource consumption, and low environmental impact, tourism is an important industry of the national economy and an important channel for expanding employment [70]. As a cross-regional activity, tourism plays a crucial role in promoting economic development, human well-being, and cultural awareness. At present, there is still no unified understanding of tourism service in ES research, and no evaluation method system for tourism service has been formed. This paper advocates that tourism service should be considered as a cultural service, at least for tourism cities. Liyang in China was taken as an example to evaluate tourism service using technical methods such as GIS spatial analysis, social media data mining and sentiment analysis. The research results show the following conclusions:
(1) The areas with higher tourism service are distributed in the north-western edge and the east of the city, while the areas with lower tourism service are mainly distributed in the north-eastern and south-western parts of the city. The hotspot areas are located in Wawushan Scenic Area and Bieqiao Village in the northern part of the city, Caoshan Resort in the west, Tianmu Lake and Nanshan Bamboo Sea in the south, and the central area of the city. The cold spot areas are concentrated in the southwest.
(2) The hotspot areas should focus on improving the tour routes, the transport capacity, and excess charges. The cold spot areas should work on ecological restoration, and meanwhile, create new tourism attractions by combining the local industries. Besides, rural tourism needs further development in the future.
(3) This paper has made a preliminary attempt to evaluate tourism service, and the research framework should be further improved by carefully considering indicators from other aspects and by adopting an integrated multi-method approach to data collection.
Author Contributions
Conceptualization, X.F. and Y.C.; methodology, validation, data curation, writing—original draft preparation, X.F.; project administration, Y.C.; software, X.F.; writing—review and editing, supervision, X.F. All authors have read and agreed to the published version of the manuscript.
Funding
No funding.
Data Availability Statement
Not applicable.
Acknowledgments
We would like to thank the reviewers for providing constructive comments on this manuscript.
Conflicts of Interest
The authors declare no conflict of interest.
References
- MEA (Millenium Ecosystems Assessment, 2005). Ecosystems and Human Well-Being: Synthesis; Sarukhan, J., Whyte, A., Board, M., Eds.; Island Press: Washington DC, USA, 2005. [Google Scholar]
- Ehrich, P.; Ehrlich, A. Extinction: The causes and consequences of the disappearance of species. Bioscience 1982, 53, 254–255. [Google Scholar]
- Costanza, R.; dArge, R.; de Groot, R.; Farber, S.; Grasso, M.; Hannon, B.; Limburg, K.; Naeem, Shahid. ; O’Neill, R.V.; Paruelo, J.; Raskin, R.G.; Sutton, P.; Van Den Belt, M. The value of the world's ecosystem services and natural capital. Nature 1997, 387, 253–260. [Google Scholar] [CrossRef]
- Yu, D.Y.; Hao, R.F. Research progress and prospect of ecosystem services. Adv. Earth Sci. 2020, 35, 804–815. [Google Scholar]
- Andersson, E.; Tengo, M.; McPhearson, T.; Kremer, P. Cultural ecosystem services as a gateway for improving urban sustainability. Ecosyst. Serv. 2015, 12, 165–168. [Google Scholar] [CrossRef]
- Daniel, T.C.; Muhar, A.; Arnberger, A.; Aznar, O.; Boyd, J.W.; Chan, K.M.A.; Costanza, R.; Elmqvist, T.; Flint, C.G.; Gobster, P.H.; Gret-Regamey, A.; Lave, R.; Muhar, S.; Penker, M.; Ribe, R.G.; Schauppenlehner, T.; Sikor, T.; Soloviy, I.; Spierenburg, M.; Taczanowska, K. , Tam, J.; von der Dunk, A. Contributions of cultural services to the ecosystem services agenda. Proc. Natl. Acad. Sci. 2012, 109, 8812–8819. [Google Scholar] [CrossRef]
- Plieninger, T.; Dijks, S.; Oteros-Rozas, E.; Bieling, C. Assessing, mapping, and quantifying cultural ecosystem services at community level. Land Use Policy 2013, 33, 118–129. [Google Scholar] [CrossRef]
- Yang, L.J.; Cao, K.J. Cultural Ecosystem Services Research Progress and Future Prospects: A Review. Sustainability 2022, 14, 11845. [Google Scholar] [CrossRef]
- Fish, R.; Church, A.; Winter, M. Conceptualising cultural ecosystem services: A novel framework for research and critical engagement. Ecosyst. Serv. 2016, 21, 208–217. [Google Scholar] [CrossRef]
- Christie, M.; Fazey, I.; Cooper, R.; Hyde, T.; Kenter, J.O. An evaluation of monetary and non-monetary techniques for assessing the importance of biodiversity and ecosystem services to people in countries with developing economies. Ecol. Econ. 2012, 83, 67–78. [Google Scholar] [CrossRef]
- Spangenberg, J.H.; Settele, J. Preciely incorrect? Moneisting the value of ecosystem services. Ecol. Complex 2010, 7, 327–337. [Google Scholar] [CrossRef]
- D'Amato, D.; Rekola, M.; Li, N.; Toppinen, A. Monetary valuation of forest eco-system services in China: a literature review and identification of future research needs. Ecol. Econ. 2016, 121, 75–84. [Google Scholar] [CrossRef]
- Ginsburgh, V. Contingent Valuation, Willingness to Pay, and Willingness to Accept. In Economic Ideas You Should Forget. Frey, B.; Iselin, D., Eds.; Springer, Cham, 2017; pp. 65–66. [CrossRef]
- Müller, F.; Bicking, S.; Ahrendt, K.; K. Bac, D.; Blindow, I.; Fürst, C.; Haase, P.; Kruse, M.; Kruse, T.; Ma, L.W.; et al. Assessing ecosystem service potentials to evaluate terrestrial, coastal and marine ecosystem types in Northern Germany–An expert-based matrix approach. Eco. Indic. 2020, 112, 106116. [Google Scholar] [CrossRef]
- Burkhard, B.; Kroll, F.; Müller, F.; Windhorst, W. Landscapes’ capacities to provide ecosystem services - A concept for land-cover based assessments. LO. 2009, 15, 1–22. [Google Scholar] [CrossRef]
- Vihervaara, P.; Kumpula, T.; Tanskanen, A.; Burkhard, B. Ecosystem services–A tool for sustainable management of human–environment systems. Case study Finnish Forest Lapland. Ecol. Complex 2010, 7, 410–420. [Google Scholar] [CrossRef]
- Dickinson, D.C.; Hobbs, R.J. Cultural ecosystem services: Characteristics, challenges and lessons for urban green space research. Ecosyst. Serv. 2017, 25, 179–194. [Google Scholar] [CrossRef]
- Cavallett, B.; Corsi, M.; Lagomarsino, E. Marine Sites and the Drivers of Wellbeing: Ecosystem vs. Anthropic Services. Sustainability 2021, 13, 12568. [Google Scholar] [CrossRef]
- Caro, C.; Marques, J.C.; Cunha, P.P.; Teixeira, Z. Ecosystem services as a resilience descriptor in habitat risk assessment using the InVEST model. Ecol. Ind. 2020, 115, 106426. [Google Scholar] [CrossRef]
- Meng, S.; Huang, Q.; Zhang, L.; He, C.; Inostroza, L.; Bai, Y.; Yin, D. Matches and mismatches between the supply of and demand for cultural ecosystem services in rapidly urbanizing watersheds: a case study in the Guanting Reservoir basin, China. Ecosyst. Serv. 2020, 45, 101156. [Google Scholar] [CrossRef]
- Zhao, Q.; Li, J.; Liu, J.; Cuan, Y.; Zhang, C. Integrating supply and demand in cultural ecosystem services assessment: a case study of Cuihua Mountain (China). Environ. Sci. Pollut. Res. 2019, 26, 6065–6076. [Google Scholar] [CrossRef]
- Zhao, D.; Xiao, M.; Huang, C.; Liang, Y.; An, Z. Landscape Dynamics Improved Recreation Service of the Three Gorges Reservoir Area, China. Int. J. Environ. Res. Public Health 2021, 18, 8356. [Google Scholar] [CrossRef]
- Nyelele, C.; Keske, C.; Ghung, M.G.; Guo, H.; N. Egoh, B. Using social media data and machine learning to map recreational ecosystem services. Eco. Indic. 2023, 154, 110606. [Google Scholar] [CrossRef]
- Byczek, C.; Longaretti, P-Y. ; Renaud, J.; Lavorel, S. Benefits of crowd-sourced GPS information for modeling the recreation ecosystem service. PLoS ONE 2018, 13. [Google Scholar] [CrossRef] [PubMed]
- Casado-Arzuaga, I.; Onaindia, M.; Madariaga, I.; Verburg, P.H. Mapping recreation and aesthetic value of ecosystems in the Bilbao Metropolitan Greenbelt (northern Spain) to support landscape planning. Landsc. Ecol. 2014, 29, 1393–1405. [Google Scholar] [CrossRef]
- van Zanten, B.T.; Verburg, P.H.; Scholte, S.S.K.; Tieskens, K. F. Using choice modeling to map aesthetic values at a landscape scale: Lessons from a Dutch case study. Ecol. Econ. 2012, 130, 221–231. [Google Scholar] [CrossRef]
- Schirpke, U.; Timmermann, F.; Tappeiner, U.; Tasser, E. Cultural ecosystem services of mountain regions: Modelling the aesthetic value. Ecol. Ind. 2016, 69, 78–90. [Google Scholar] [CrossRef] [PubMed]
- TEEB. The Economics of Ecosystems and Biodiversity in National and International Policy Making; Brink, P., Ed.; Earthscan: London, UK, 2011; ISBN 9781849712507. [Google Scholar]
- Pueyo-Ros, J. The Role of Tourism in the Ecosystem Services Framework. Land 2018, 7, 111. [Google Scholar] [CrossRef]
- SEEA, EA. System of Environmental-Economic Accounting—Ecosystem Accounting. White cover publication, 2021. https://seea.un.org/ecosystem-accounting.
- Haines-Young, R.; Potschin, M. Common International Classification of Ecosystem Services (CICES) Version 5.1 and Guidance on the Application of the Revised Structure. European Environment Agency: Copenhagen, Denmark, 2017. Available from www.cices.
- Yang, S. Analytic Hierarchy Process and Its Application in Rural Tourism Service Performance Evaluation. Disrete. Dyn. Nat. Soc. 5302. [Google Scholar] [CrossRef]
- Xu, B.; Abukhalifeh, A.N.; Lu, X.; Gao, B. Cui, H.; Wu, Y. Rural Tourism Public Service Performance Evaluation Based on Analytic Hierarchy Process. Math. Probl. Eng, 4189. [Google Scholar] [CrossRef]
- Zheng, Q.; Chen, Q.; Kong, D. Performance evaluation of the development of eco-cultural tourism in Fujian Province based on the method of fuzzy comprehensive evaluation. Front. Env. Sci. 2022. [Google Scholar] [CrossRef]
- Ghermand, A.; Camacho-Valdez, V.; Trejo-Espinosa, H. Social media-based analysis of cultural ecosystem services and heritage tourism in a coastal region of Mexico. Tourism Manage. 2020, 77, 104002. [Google Scholar] [CrossRef]
- Lee, M.T.; Liu, J.M.; Borazon, E.Q. Evaluating the Effect of Perceived Value of Ecosystem Services on Tourists’ Behavioral Intentions for Aogu Coastal Wetland. Sustainability 2020, 12, 5214. [Google Scholar] [CrossRef]
- Kang, N.; Xie, G.; Liu, C. Assessment of Society’s Perceptions on Cultural Ecosystem Services in a Cultural Landscape in Nanchang, China. Sustainability 2023, 15, 10308. [Google Scholar] [CrossRef]
- Ramírez-Guerrero, G.; García-Onetti, J.; Arcila-Garrido, M.; Chica-Ruiz, J.A. A Tourism Potential Index for Cultural Heritage Management through the Ecosystem Services Approach. Sustainability 2021, 13, 6415. [Google Scholar] [CrossRef]
- Zhang, T.; Wang, Y. Zhang, S.; Wang, Y.; Yu, H. Evaluation of ontological value of regional tourism resources: A case study of Hainan Island, China. J. Geogr. Sci. 2021, 31, 1015–1038. [Google Scholar] [CrossRef]
- Jiang, H.; Yang, Y.; Bai, Y. Evaluation of All-for-One Tourism in Mountain Areas Using Multi-Source Data. Sustainability 2018, 10, 4065. [Google Scholar] [CrossRef]
- Park, J.; Jeong, E.B. Service Quality in Tourism: A Systematic Literature Review and Keyword Network Analysis. Sustainability 2019, 11, 3665. [Google Scholar] [CrossRef]
- Wang, S.; Wang, J.; Shen, W.; Wu, H. The evaluation of tourism service facilities in Chinese traditional villages based on the living protection concept: theoretical framework and empirical case study. J. Asian. Archit. Build. 2023, 22, 14–31. [Google Scholar] [CrossRef]
- Chen, X.; Zhong, Y. The Evaluation on Rural Tourism Service Quality-A Case Study of Changsha City. Chin. Sci. Bull. 2012, 28, 311–316. [Google Scholar]
- Li, Y.; Dai, Y.; Han, J; Zou, T. Evolution of Landscape Pattern and Tourism Service Value in Zhangjiakou City. J. Resour. Ecol. 2022, 13, 1098–1108. [Google Scholar]
- van Berkel, D.B.; Verburg, P.H. Spatial quantification and valuation of cultural ecosystem services in an agricultural landscape. Ecol. Indic. 2014, 37, 163–174. [Google Scholar] [CrossRef]
- Zhou, J.; Tong, Y.; Ding, Q.; Zhang, J.; Yang, W. Economic evaluation of ecotourism service in “One Village Ten Thousand Trees” area of Kecheng District,Quzhou City using travel cost method. Acta Ecol. Sin. 2021, 41, 6440–6450. [Google Scholar]
- Christie, M.; Fazey, I.; Cooper, R.; Hyde, T.; O. Kenter. J. An evaluation of monetary and non-monetary techniques for assessing the importance of biodiversity and ecosystem services to people in countries with developing economies. Ecol. Econ. 2012, 83, 67–78. [Google Scholar] [CrossRef]
- Guo, Y.; Yang, F.; Wang, J.; Wu, R. Assessment of the tourism and recreation cultural ecosystem services in Three Parallel Rivers Region. Acta Ecol. Sin. 2020, 40, 4351–4361. [Google Scholar]
- Pan, J.; Ma, Y.; Cai, S.; Chen, Y.; Chen, M. Application of SolVES Model to Social Values Evaluation for Ecosystem Services. World For. Res. 2023, 36, 20–25. [Google Scholar]
- Neill, A.M.; O’Donoghue, C.; Stout, J.C. Spatial analysis of cultural ecosystem services using data from social media: A guide to model selection for research and practice. One Ecosyst. 2023, 8, e95685. [Google Scholar] [CrossRef]
- Li, Q.; Li, S.; Zhang, S.; Hu, J.; Hu, J. A Review of Text Corpus-Based Tourism Big Data Minining. Appl. Sci. 2019, 9, 3300. [Google Scholar] [CrossRef]
- Zhang, H.; Huang, R.; Zhang, Y.; Buhalis, D. Cultural ecosystem services evaluation using geolocated social media data: a review. Tourism Geogr. 2022, 24, 646–668. [Google Scholar] [CrossRef]
- Zandebasiri, M.; Jahanbazi Goujani, H.; Iranmanesh, Y.; Azadi, H.; Viira, A.H.; Habibi, M. Ecosystem services valuation: a review of concepts, systems, new issues, and considerations about pollution in ecosystem services. Environ. Sci. Pollut. Res. 2023, 30, 83051–83070. [Google Scholar] [CrossRef] [PubMed]
- Huo, S.; Huang, L.; Yan, L. Valuation of cultural ecosystem services based on SolVES: a case study of the South Ecological Park in Wuyi County, Zhejiang Province. Acta Ecol. Sin. 2018, 38, 3682–3691. [Google Scholar]
- Yang, Z. The connotation of all-for-one tourism and its development stages. Tourism Tribune 2016, 31, 1–3. [Google Scholar]
- Wen, C.; Cha, J.; Xu, L.; Xu, H. Spatial Potential of Recreational Services in Western Hubei Region in Light of the “All-for-One Tourism” Development—A Machine Learning Approach Based on Ensemble Model. Landsc. Archit. Front. 2022, 10, 8–31. [Google Scholar] [CrossRef]
- Ji, S.; Duan, J.; Lin, L. Research on the Overall Urban Design Method under the Background of Territorial Spatial Planning: A Case Study of Liyang City, Jiangsu Province. Planners 2022, 1, 104–110. [Google Scholar]
- General Administration of Quality Supervision, Inspection and Quarantine of the People’s Republic of China (CN-GB). Classification, Investigation and Evaluation of Tourism Resources (GB/T 18972-2017). Available online: http://www.cssn.net.cn/ (accessed on 16 October 2023).
- Zhu, H.; Liu, J.; Tao, H.; Zhang, J. Evaluation and Spatial Analysis of Tourism Resources Attraction in Beijing Based on the Internet Information. J. Nat. Resour. 2015, 30, 2081–2094. [Google Scholar]
- Xu, Z.; Hu, Y.; Liu, Y.; Yan, Y. A Review on the Accuracy Analysis of Spatial Scaling Data. Prog. Geog. 2012, 31, 1574–1582. [Google Scholar]
- Ren, L.; Lei, W. Research on the Evaluation of Ecotourism Resources: Based on the AHP Model. Math. Probl. Eng. 2022. [Google Scholar] [CrossRef]
- Xu, J.; Feng, P.; Yang, P. Research of development strategy on China’s rural drinking water supply based on SWOT–TOPSIS method combined with AHP-Entropy: a case in Hebei Province. Environ. Earth Sci. 2015, 75, 58. [Google Scholar] [CrossRef]
- Singh, J.; Sharma, S.K.; Srivastava, R. AHP-Entropy based priority assessment of factors to reduce aviation fuel consumption. Int. J. Syst. Assur. Eng. Manag. 2019, 10, 212–227. [Google Scholar] [CrossRef]
- Liu, D.; Gong, W.; Xing, W.; Li, X.; Ma, X.; Yu, Y. Comprehensive method for determining the weights of vulnerability assessment indexes on islands and the coastal zone based on the AHP weight method and entropy weight method. Mar. Environ. Res. 2015, 34, 462–467. [Google Scholar]
- Tian, Z.; Chu, J.; Lin, Y.; Zhou, Z. Multi-scale urban waterlogging risk assessment method in Xining City. Water Resour. Res. 2022, 38, 72–79. [Google Scholar] [CrossRef]
- How Kernel Density Works. Available online: http://pro.arcgis.com/en/pro-app/tool-reference/spatial-analyst/how-kernel-density-works.htm (accessed on 16 October 2023).
- Lättman, K.; Olsson, L.E.; Friman, M. A new approach to accessibility–Examining perceived accessibility in contrast to objectively measured accessibility in daily travel. Res. Transp. Econ. 2018, 69, 501–511. [Google Scholar] [CrossRef]
- Keeler, B.L.; Wood, S.A.; Polasky, S.; Kling, C.; Filstrup,C. T.; Downing, J.A. Recreational demand for clean water: evidence from geotagged photographs by visitors to lakes. Front. Ecol. Eviron. 2015, 13, 76–81. [Google Scholar] [CrossRef] [PubMed]
- Tenerelli, P.; Demsar, U.; Luque, S. Crowdsourcing indicators for cultural ecosystem services: A geographically weighted approach for mountain landscapes. Ecol. Indic. 2016, 64, 237–248. [Google Scholar] [CrossRef]
- Navío-Marco, J.; Ruiz-Gómez, L.M.; Sevilla-Sevilla, C. Progress in information technology and tourism management: 30 years on and 20 years after the internet-Revisiting Buhalis & Law’s landmark study about eTourism. Tour. Manag. 2018, 69, 460–470. [Google Scholar]
Figure 1.
Location of the study area and distribution of tourism resources.
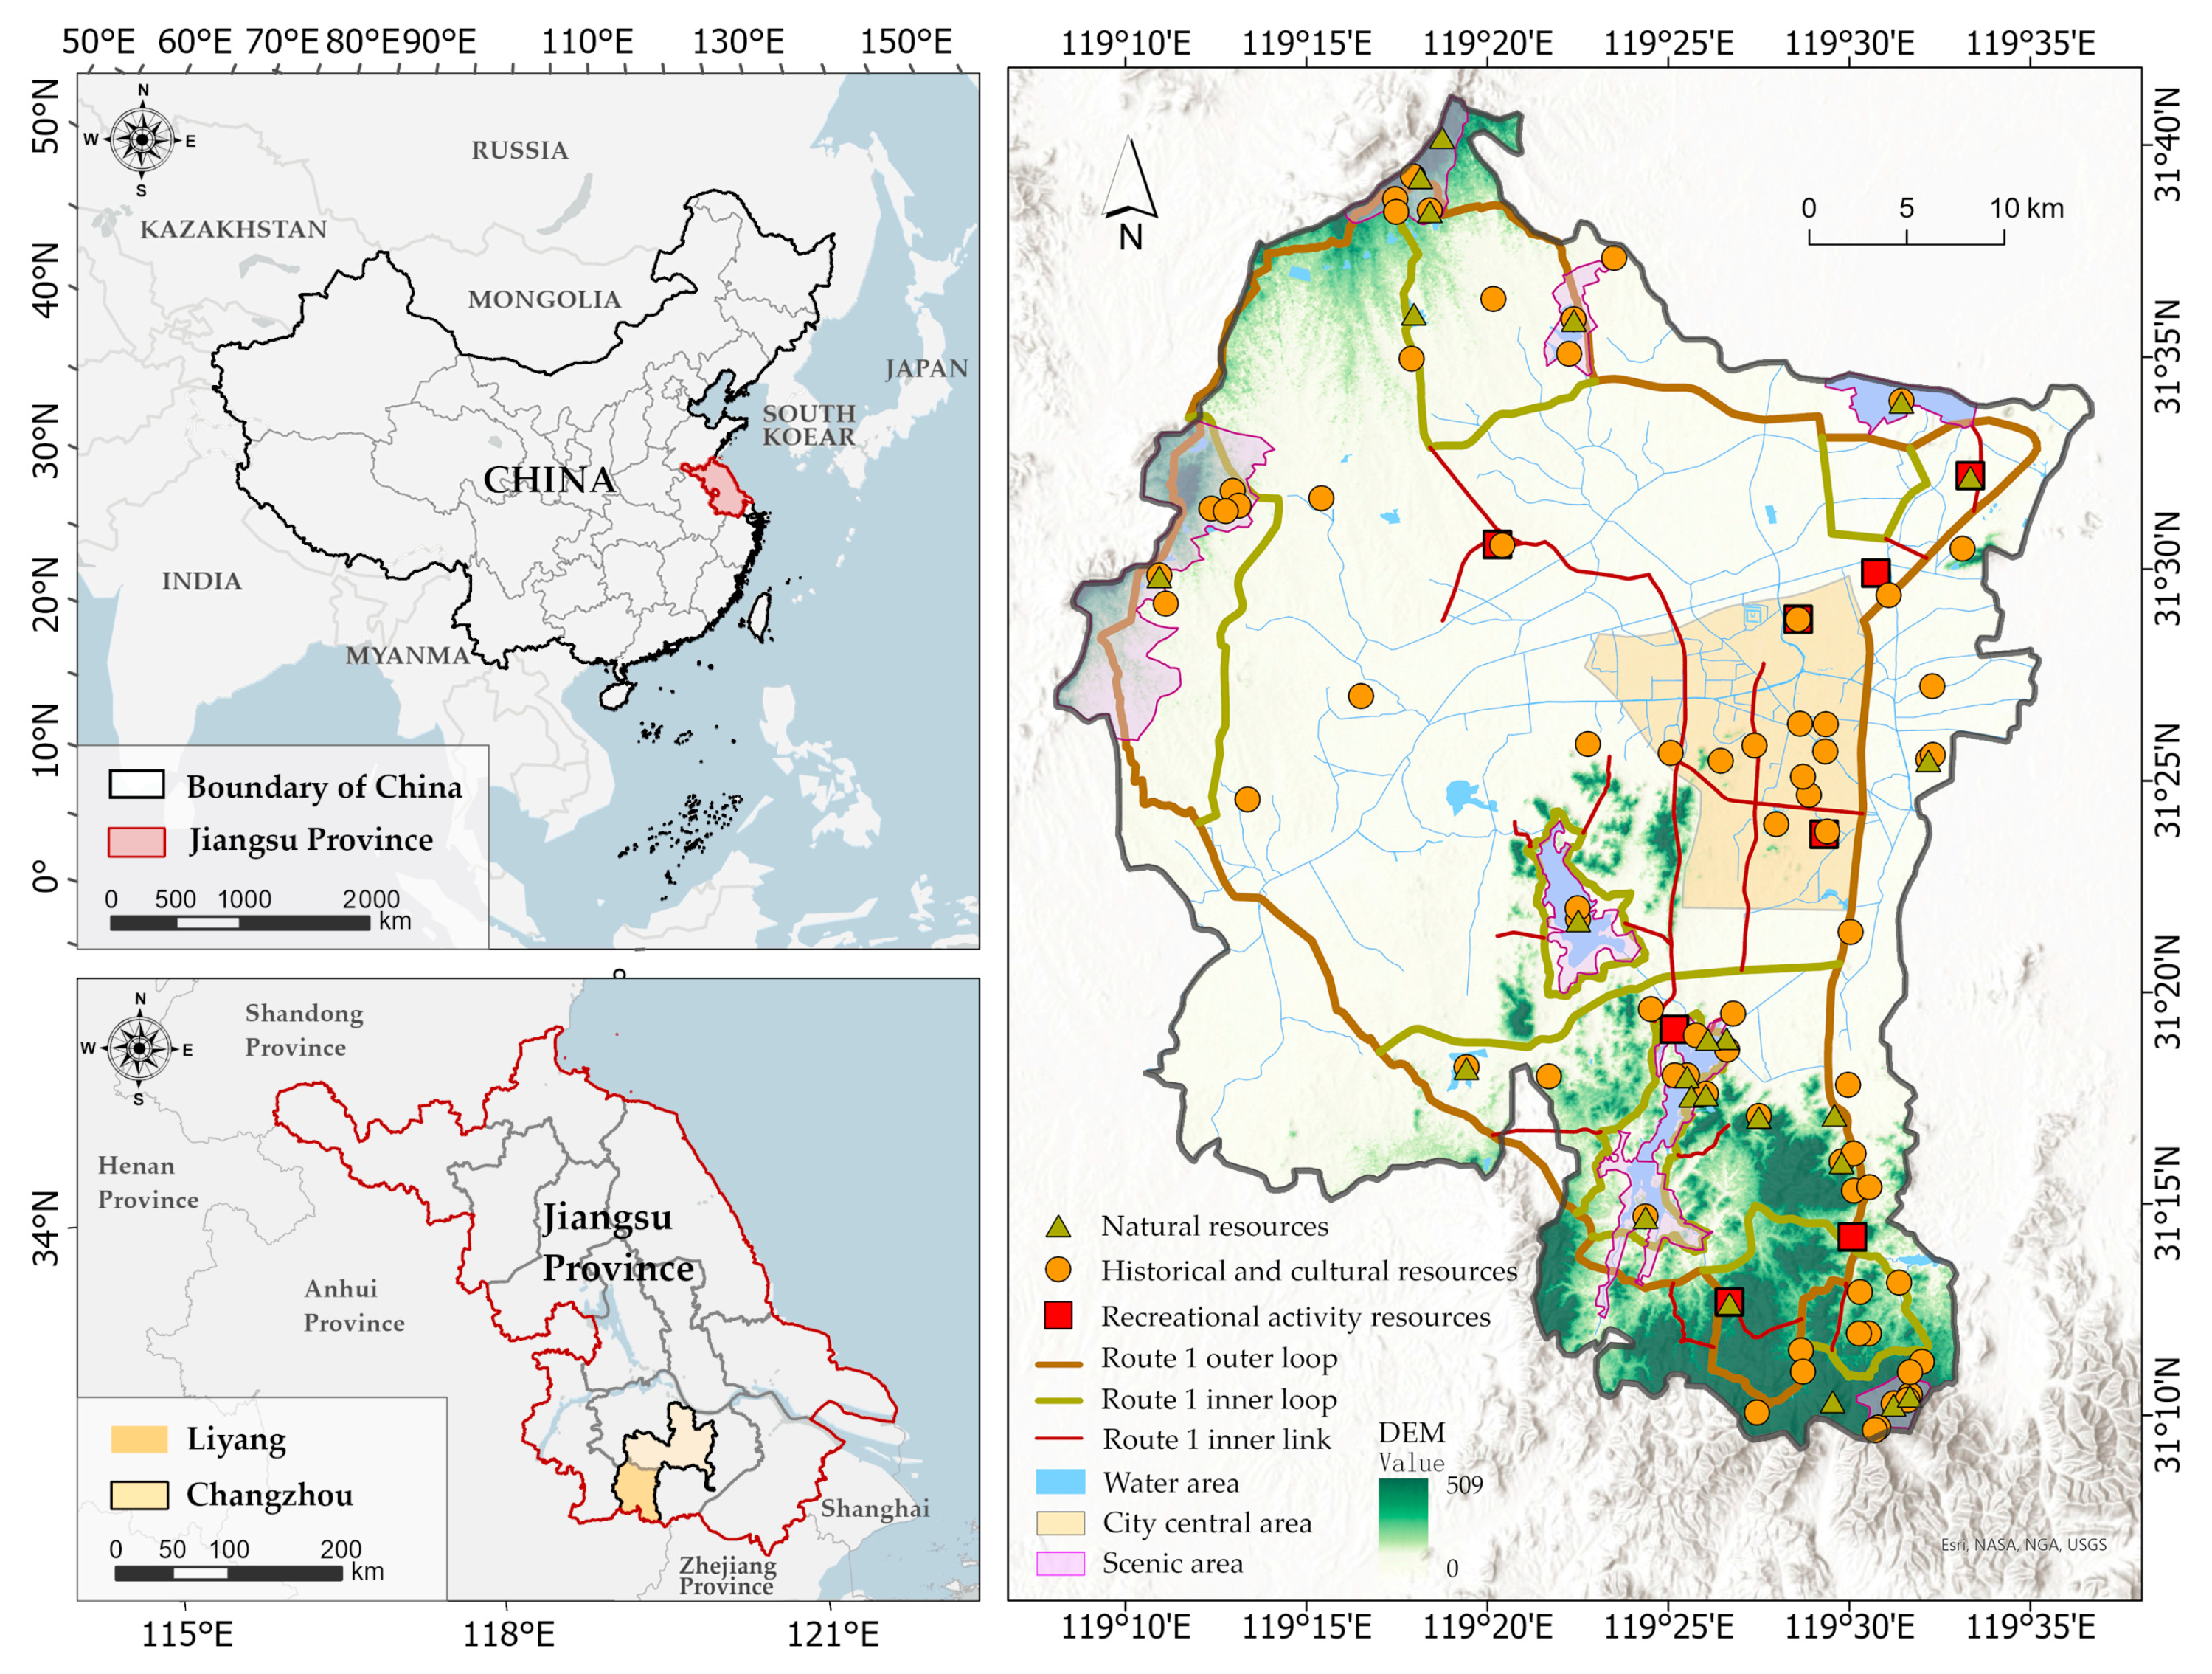
Figure 2.
Landscape area loss index at different granularities.
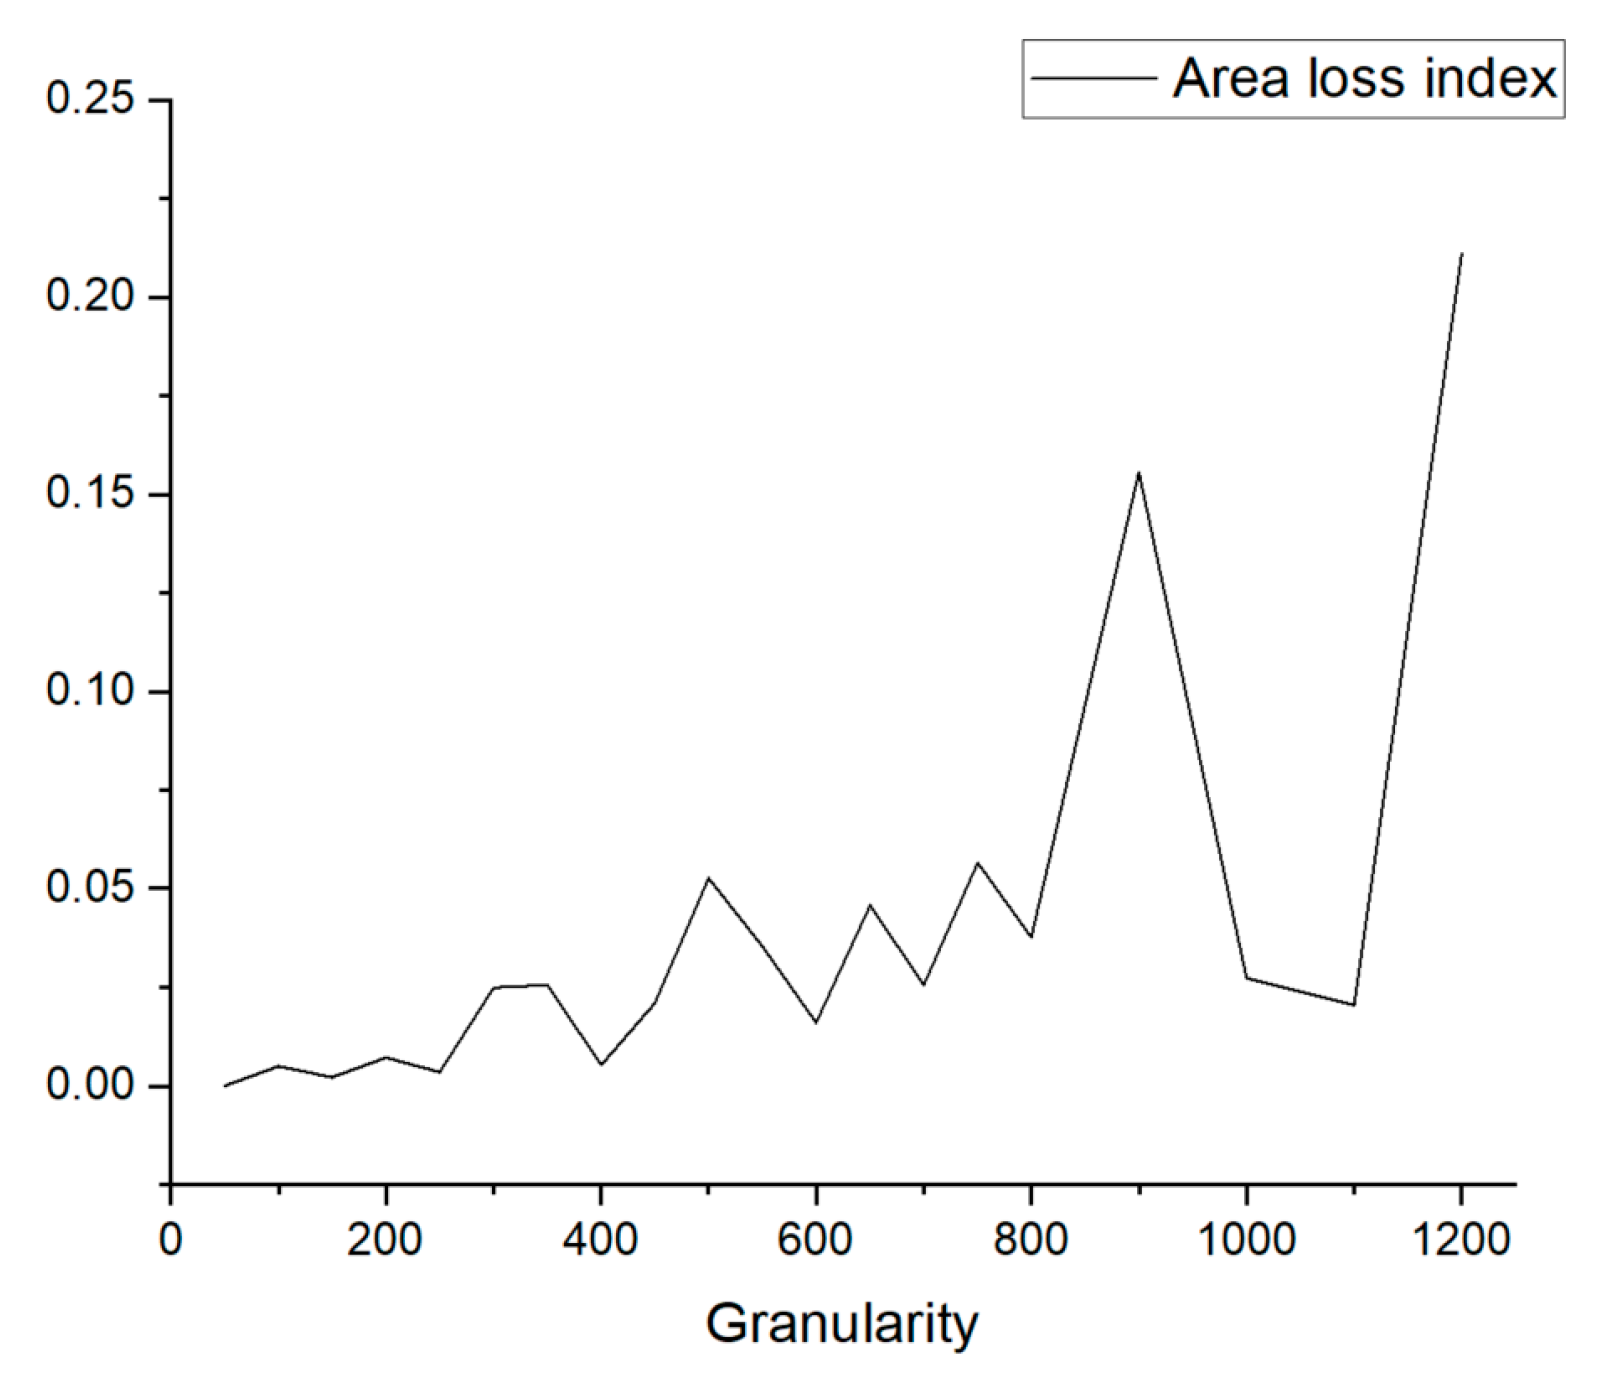
Figure 3.
Landscape indexes at different granularities.
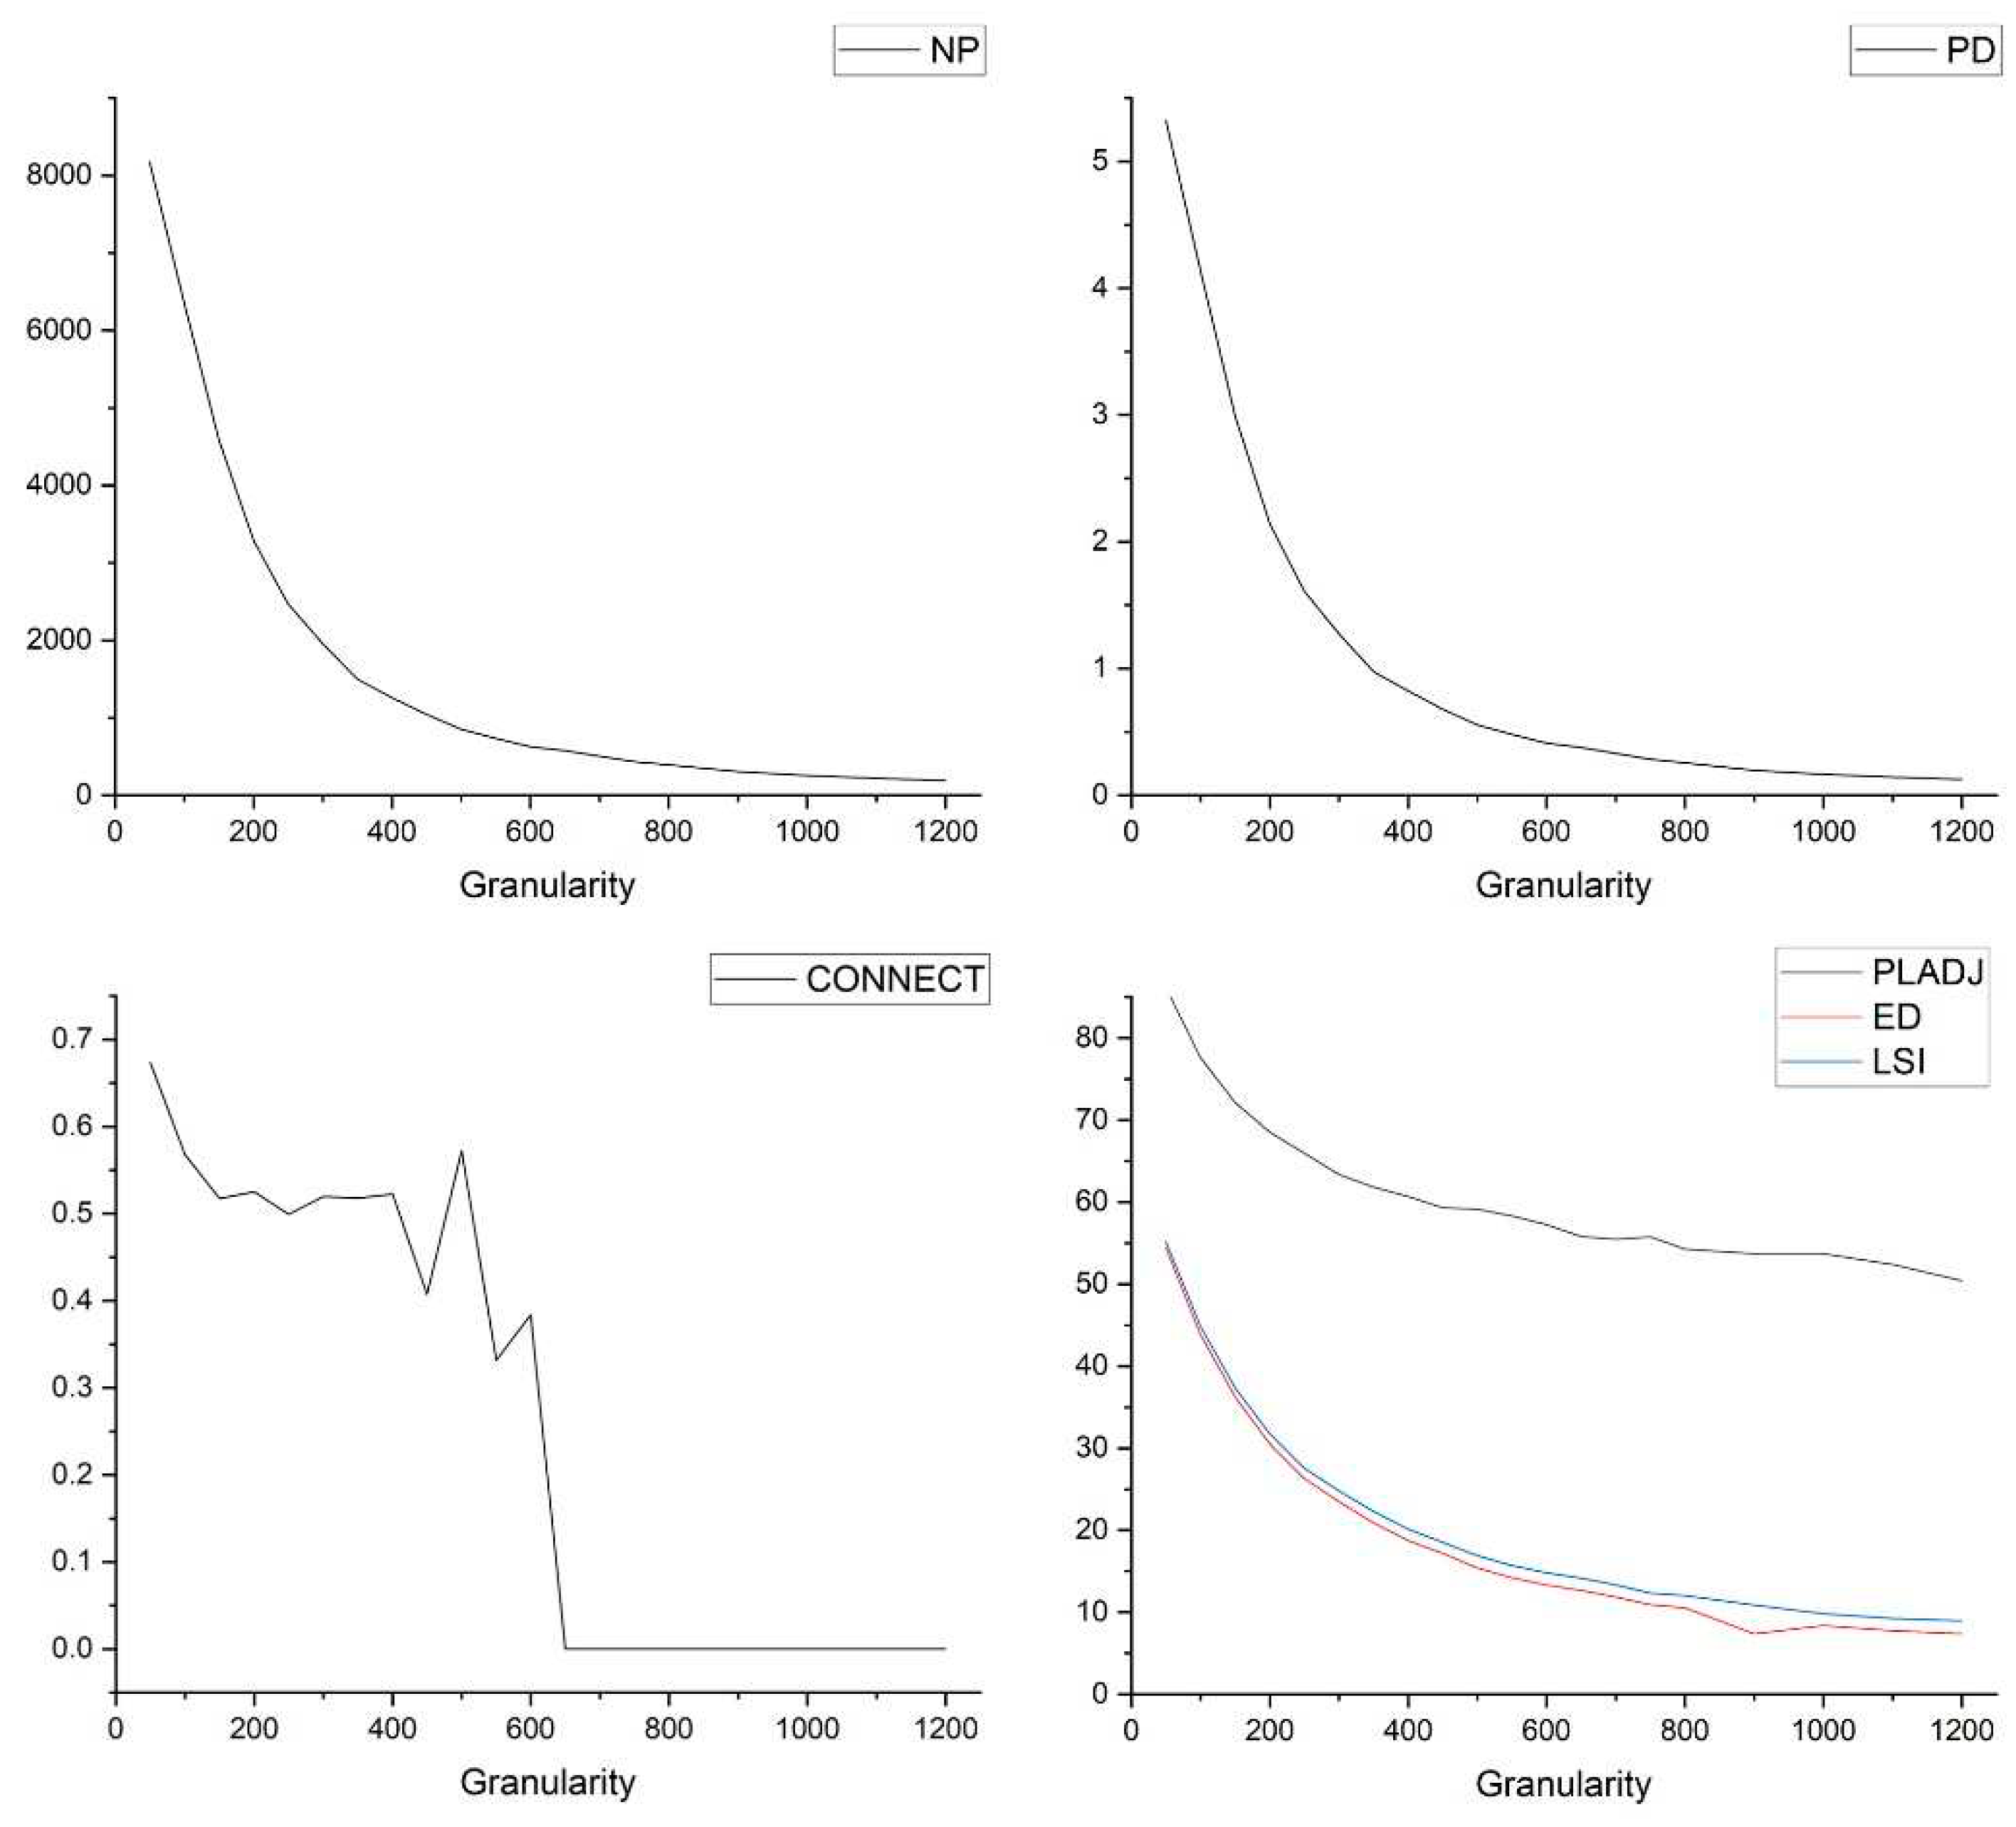
Figure 4.
Evaluation grid network.
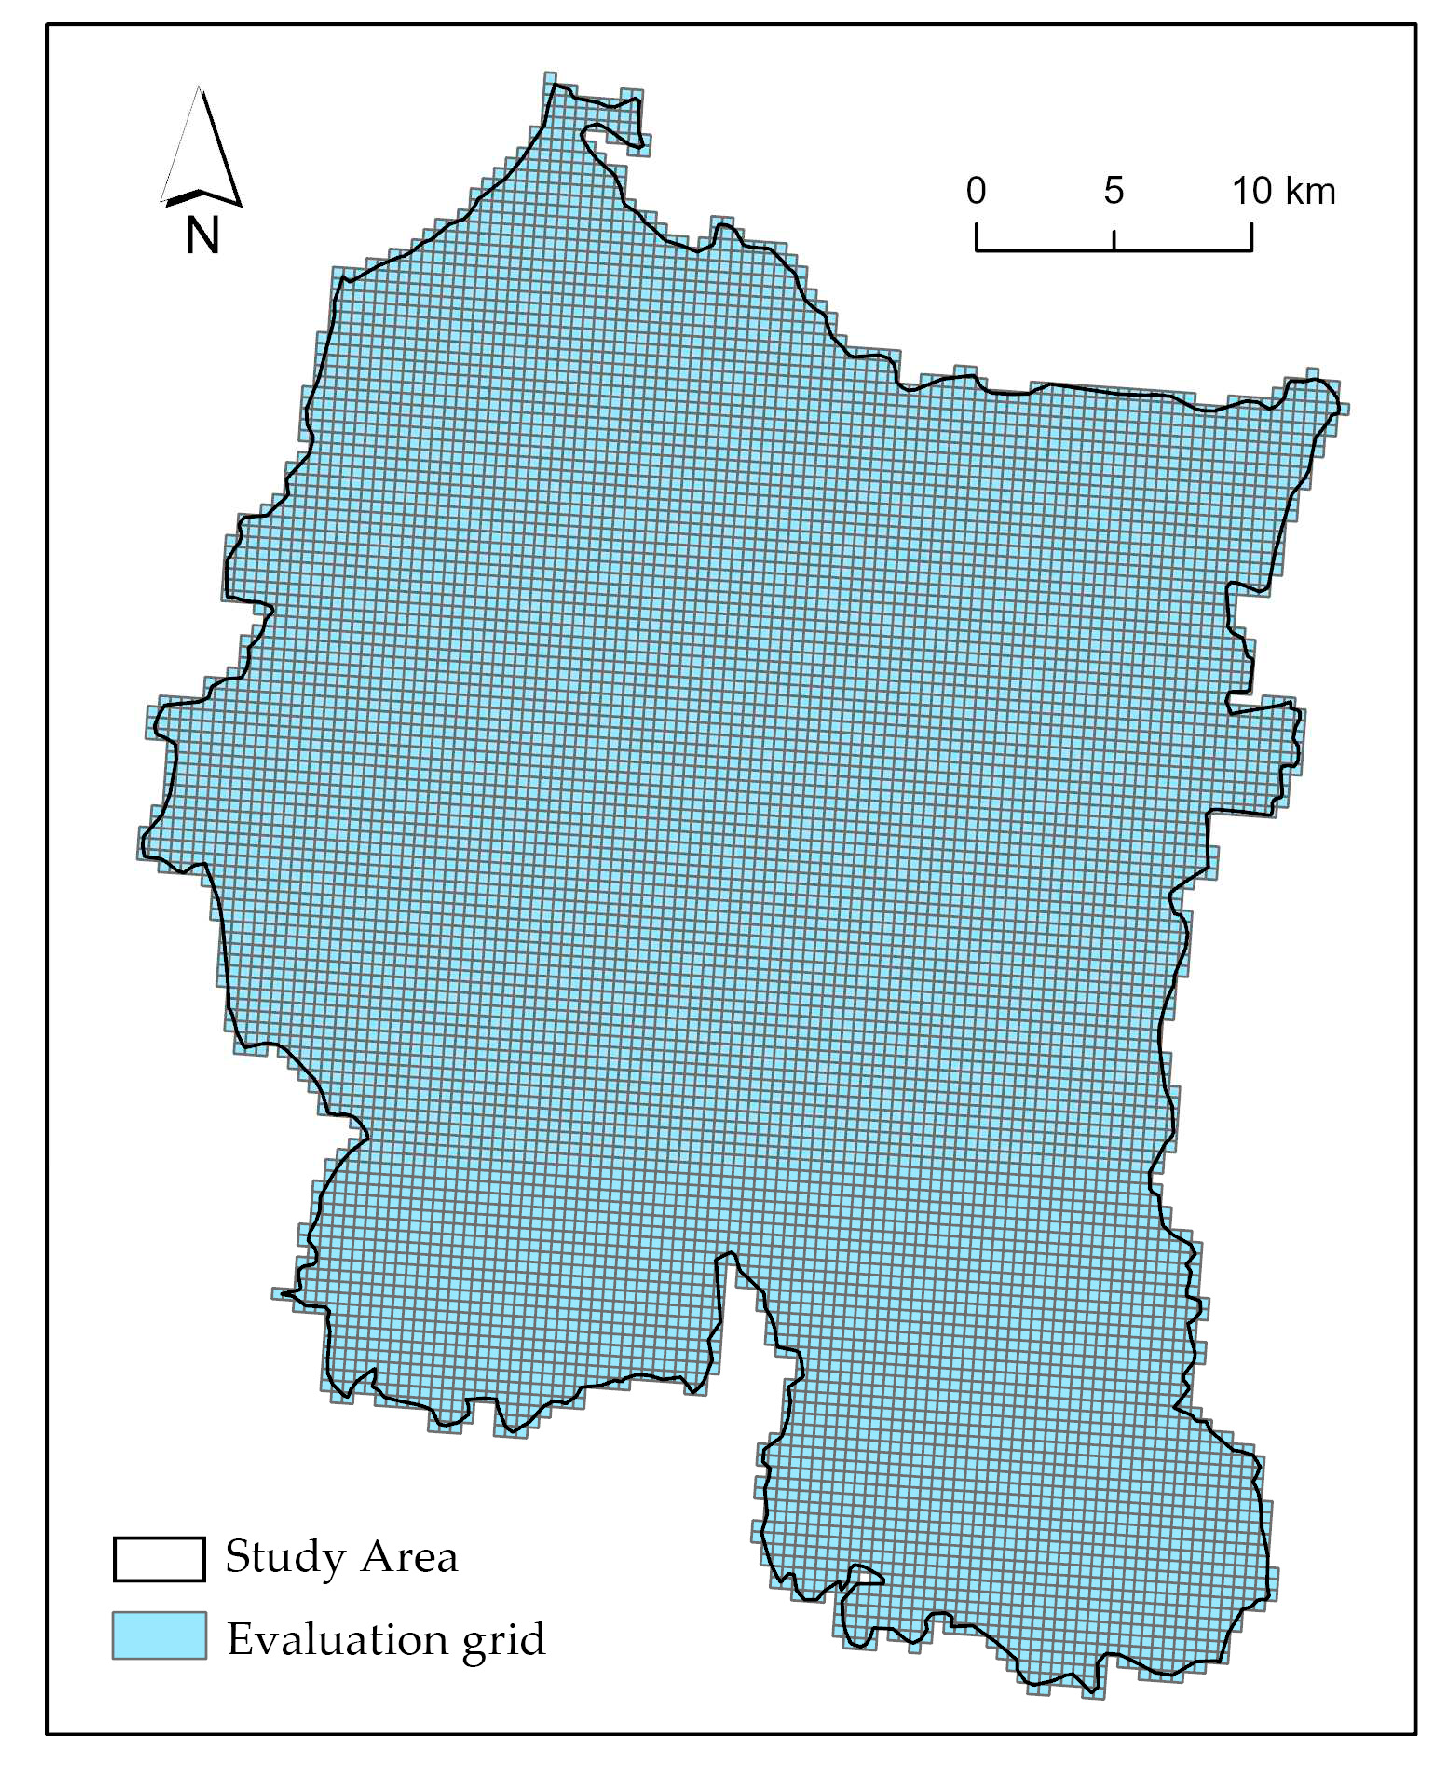
Figure 5.
Quality of Tourism Resource Evaluation. (a) Density; (b) Reputation; (c) Popularity.
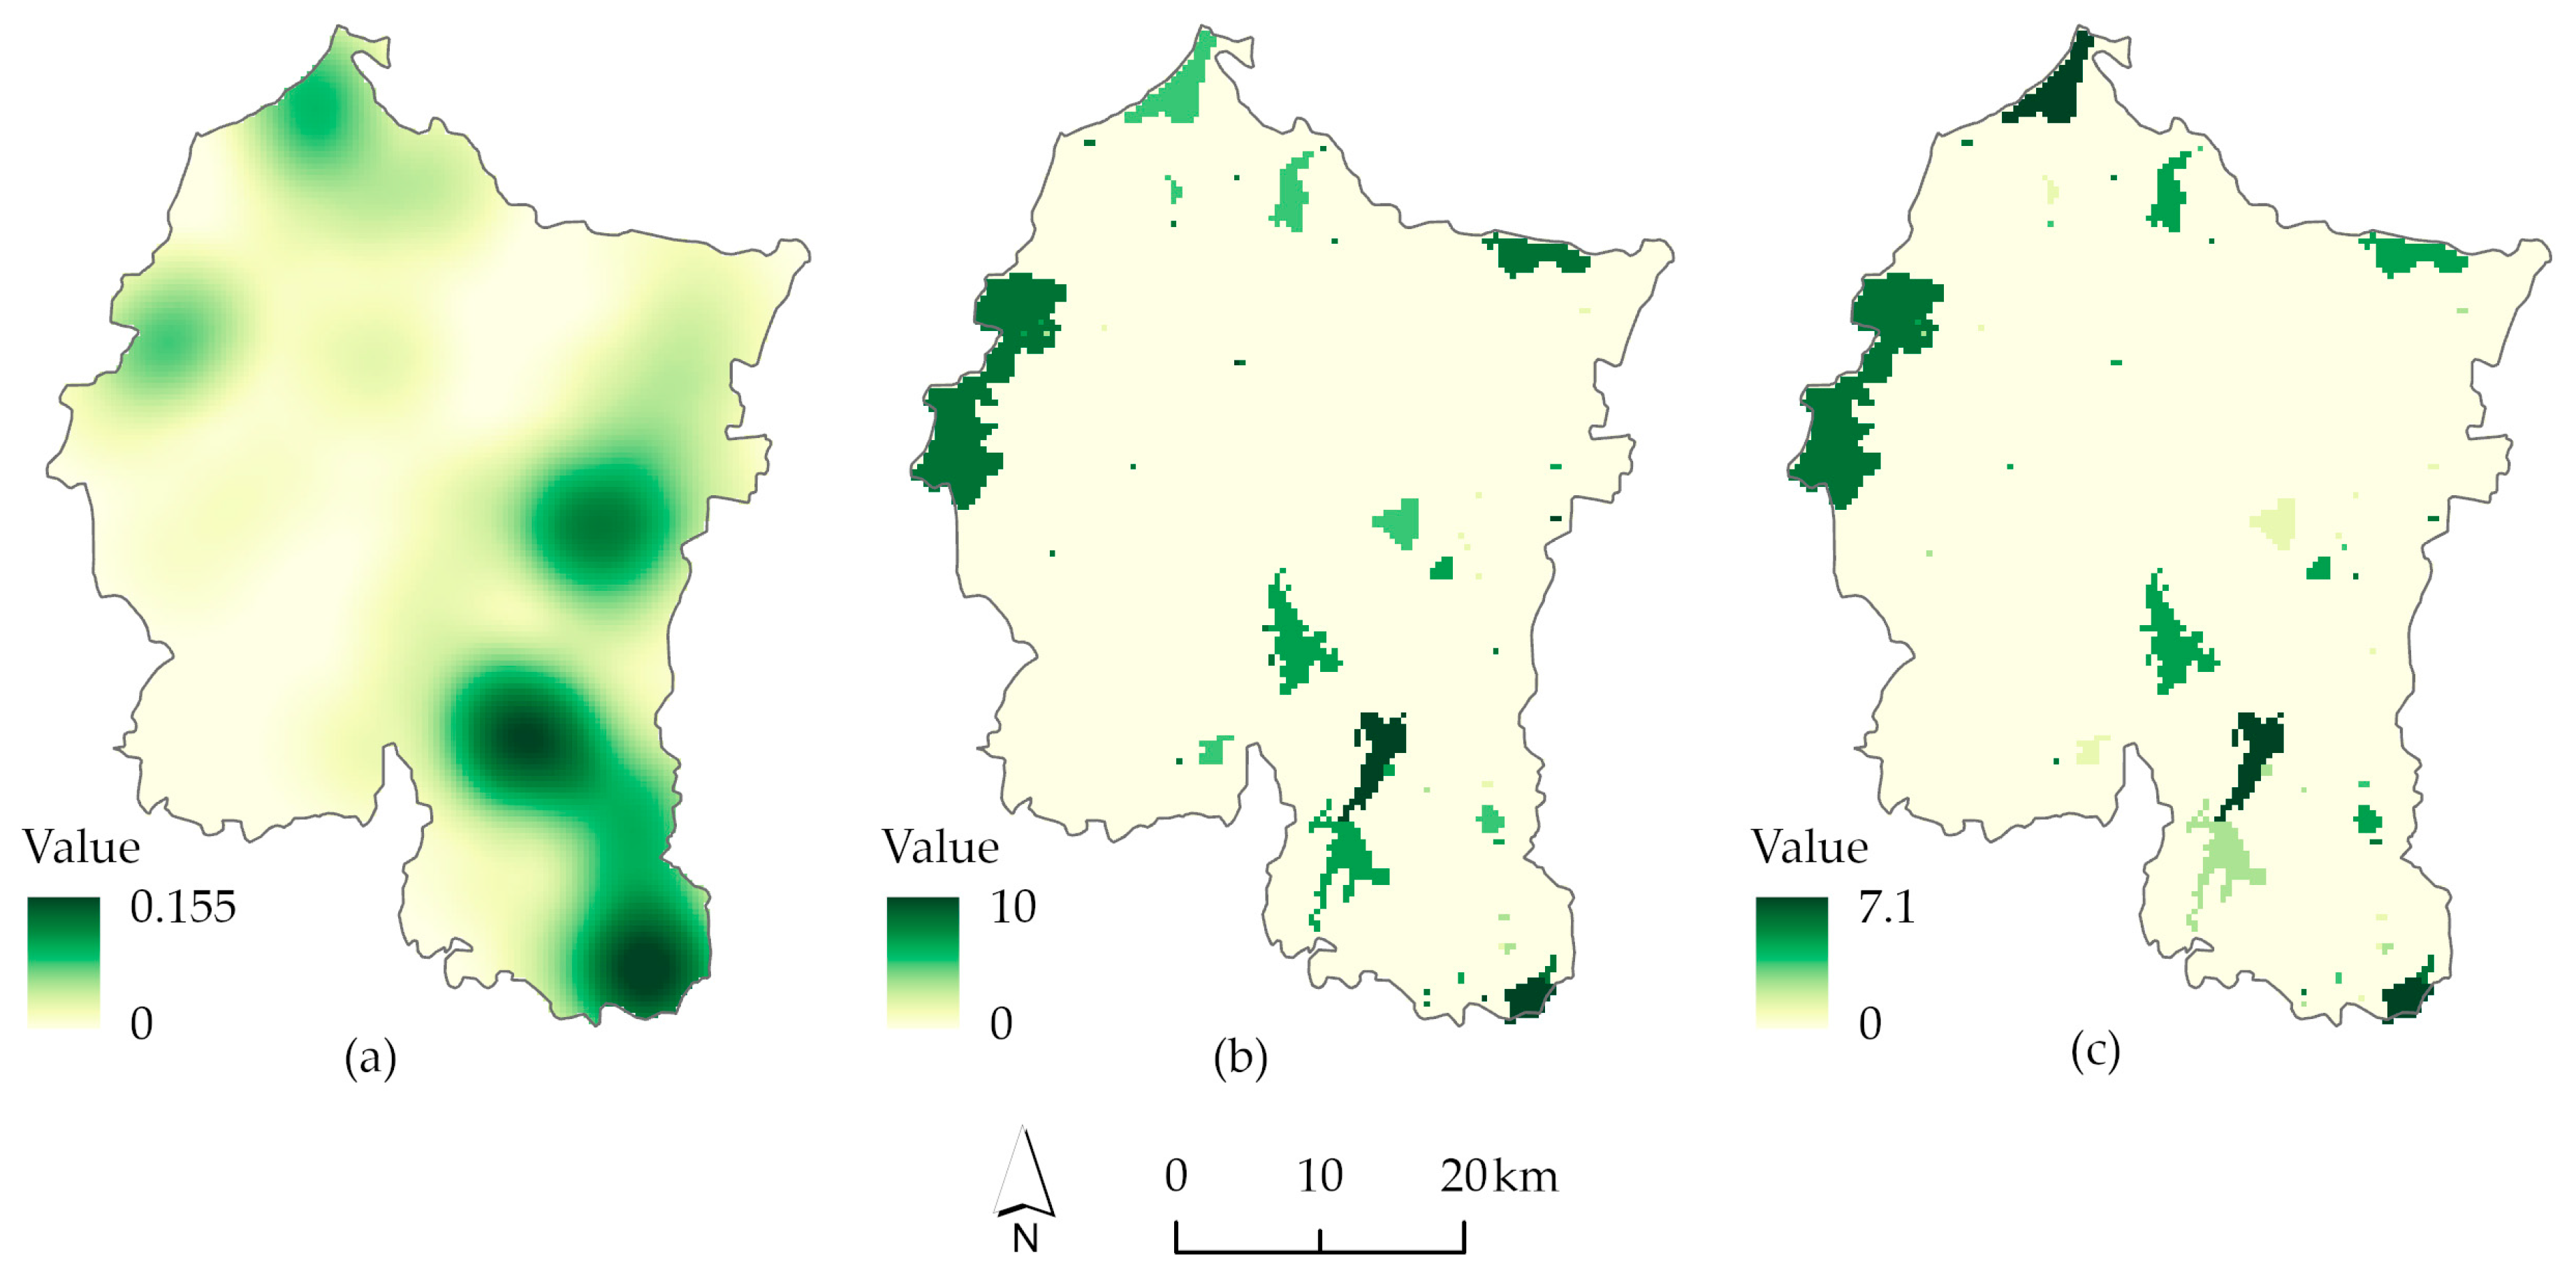
Figure 6.
Distribution of tourism service facilities. (a) Tourism service POI; (b) Road network.
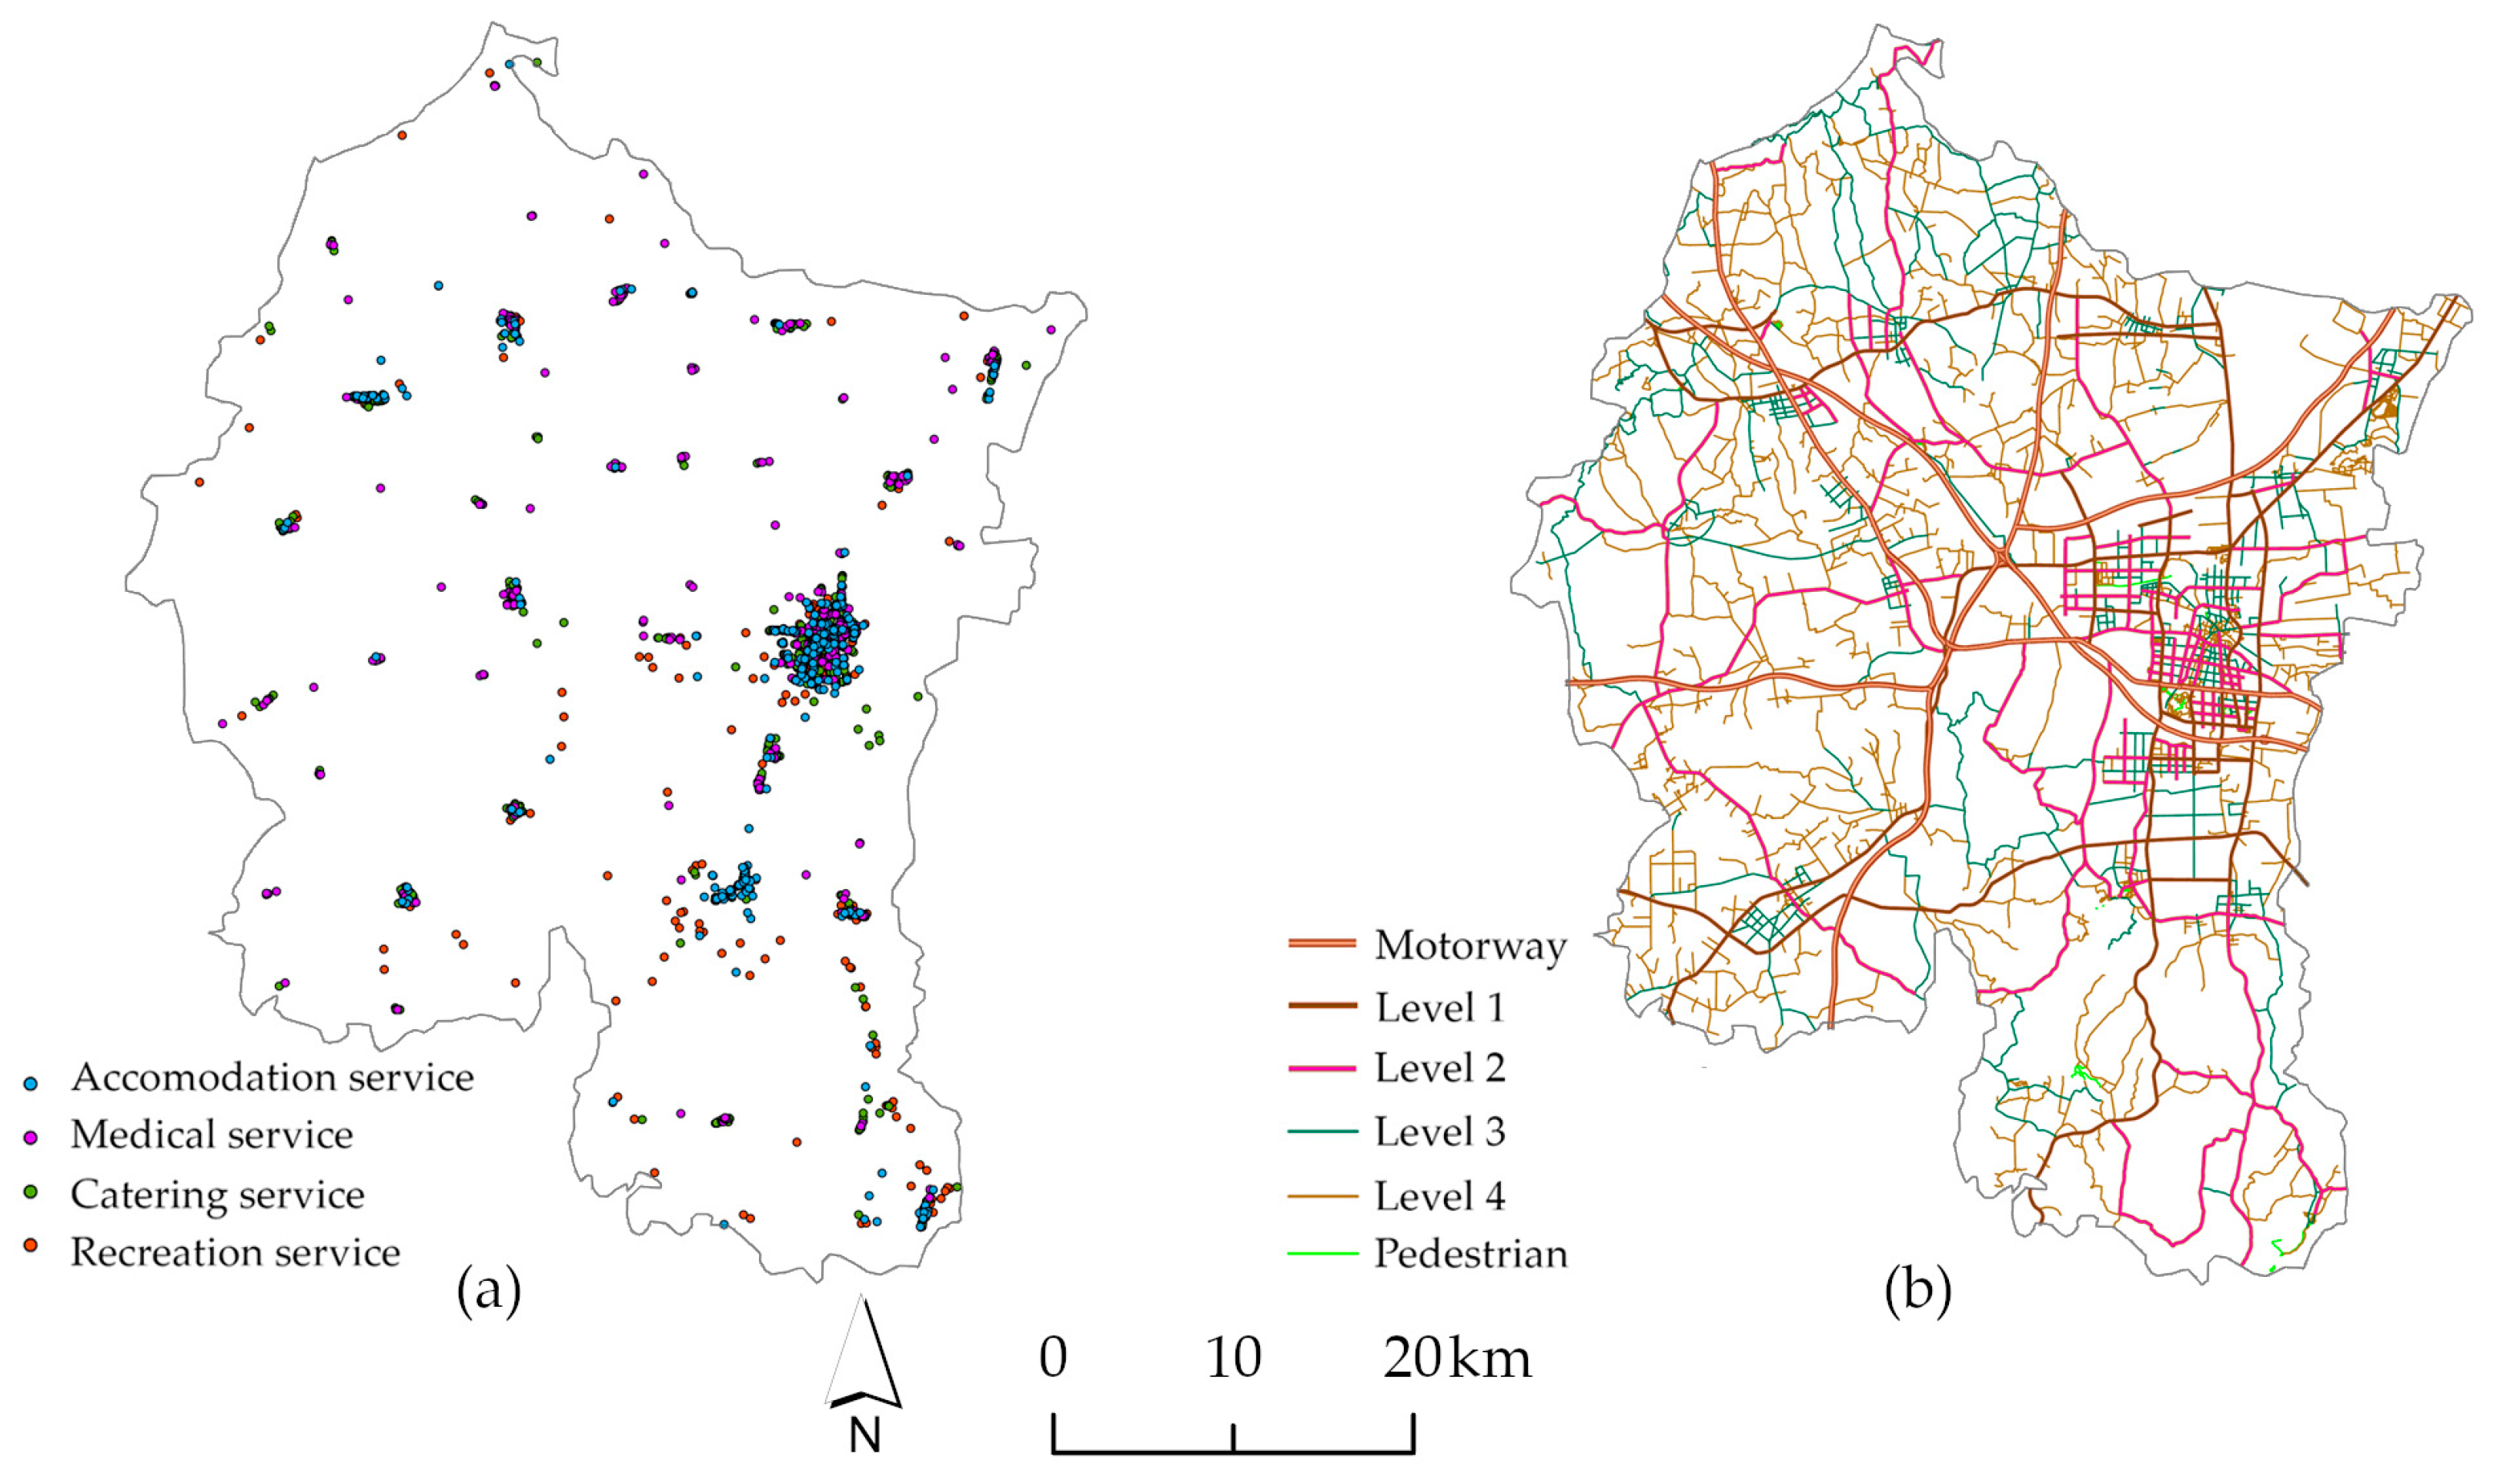
Figure 7.
Evaluation of the comprehensiveness of tourism service facilities. (a) Tourism service POI density; (b) Transport accessibility.
Figure 7.
Evaluation of the comprehensiveness of tourism service facilities. (a) Tourism service POI density; (b) Transport accessibility.
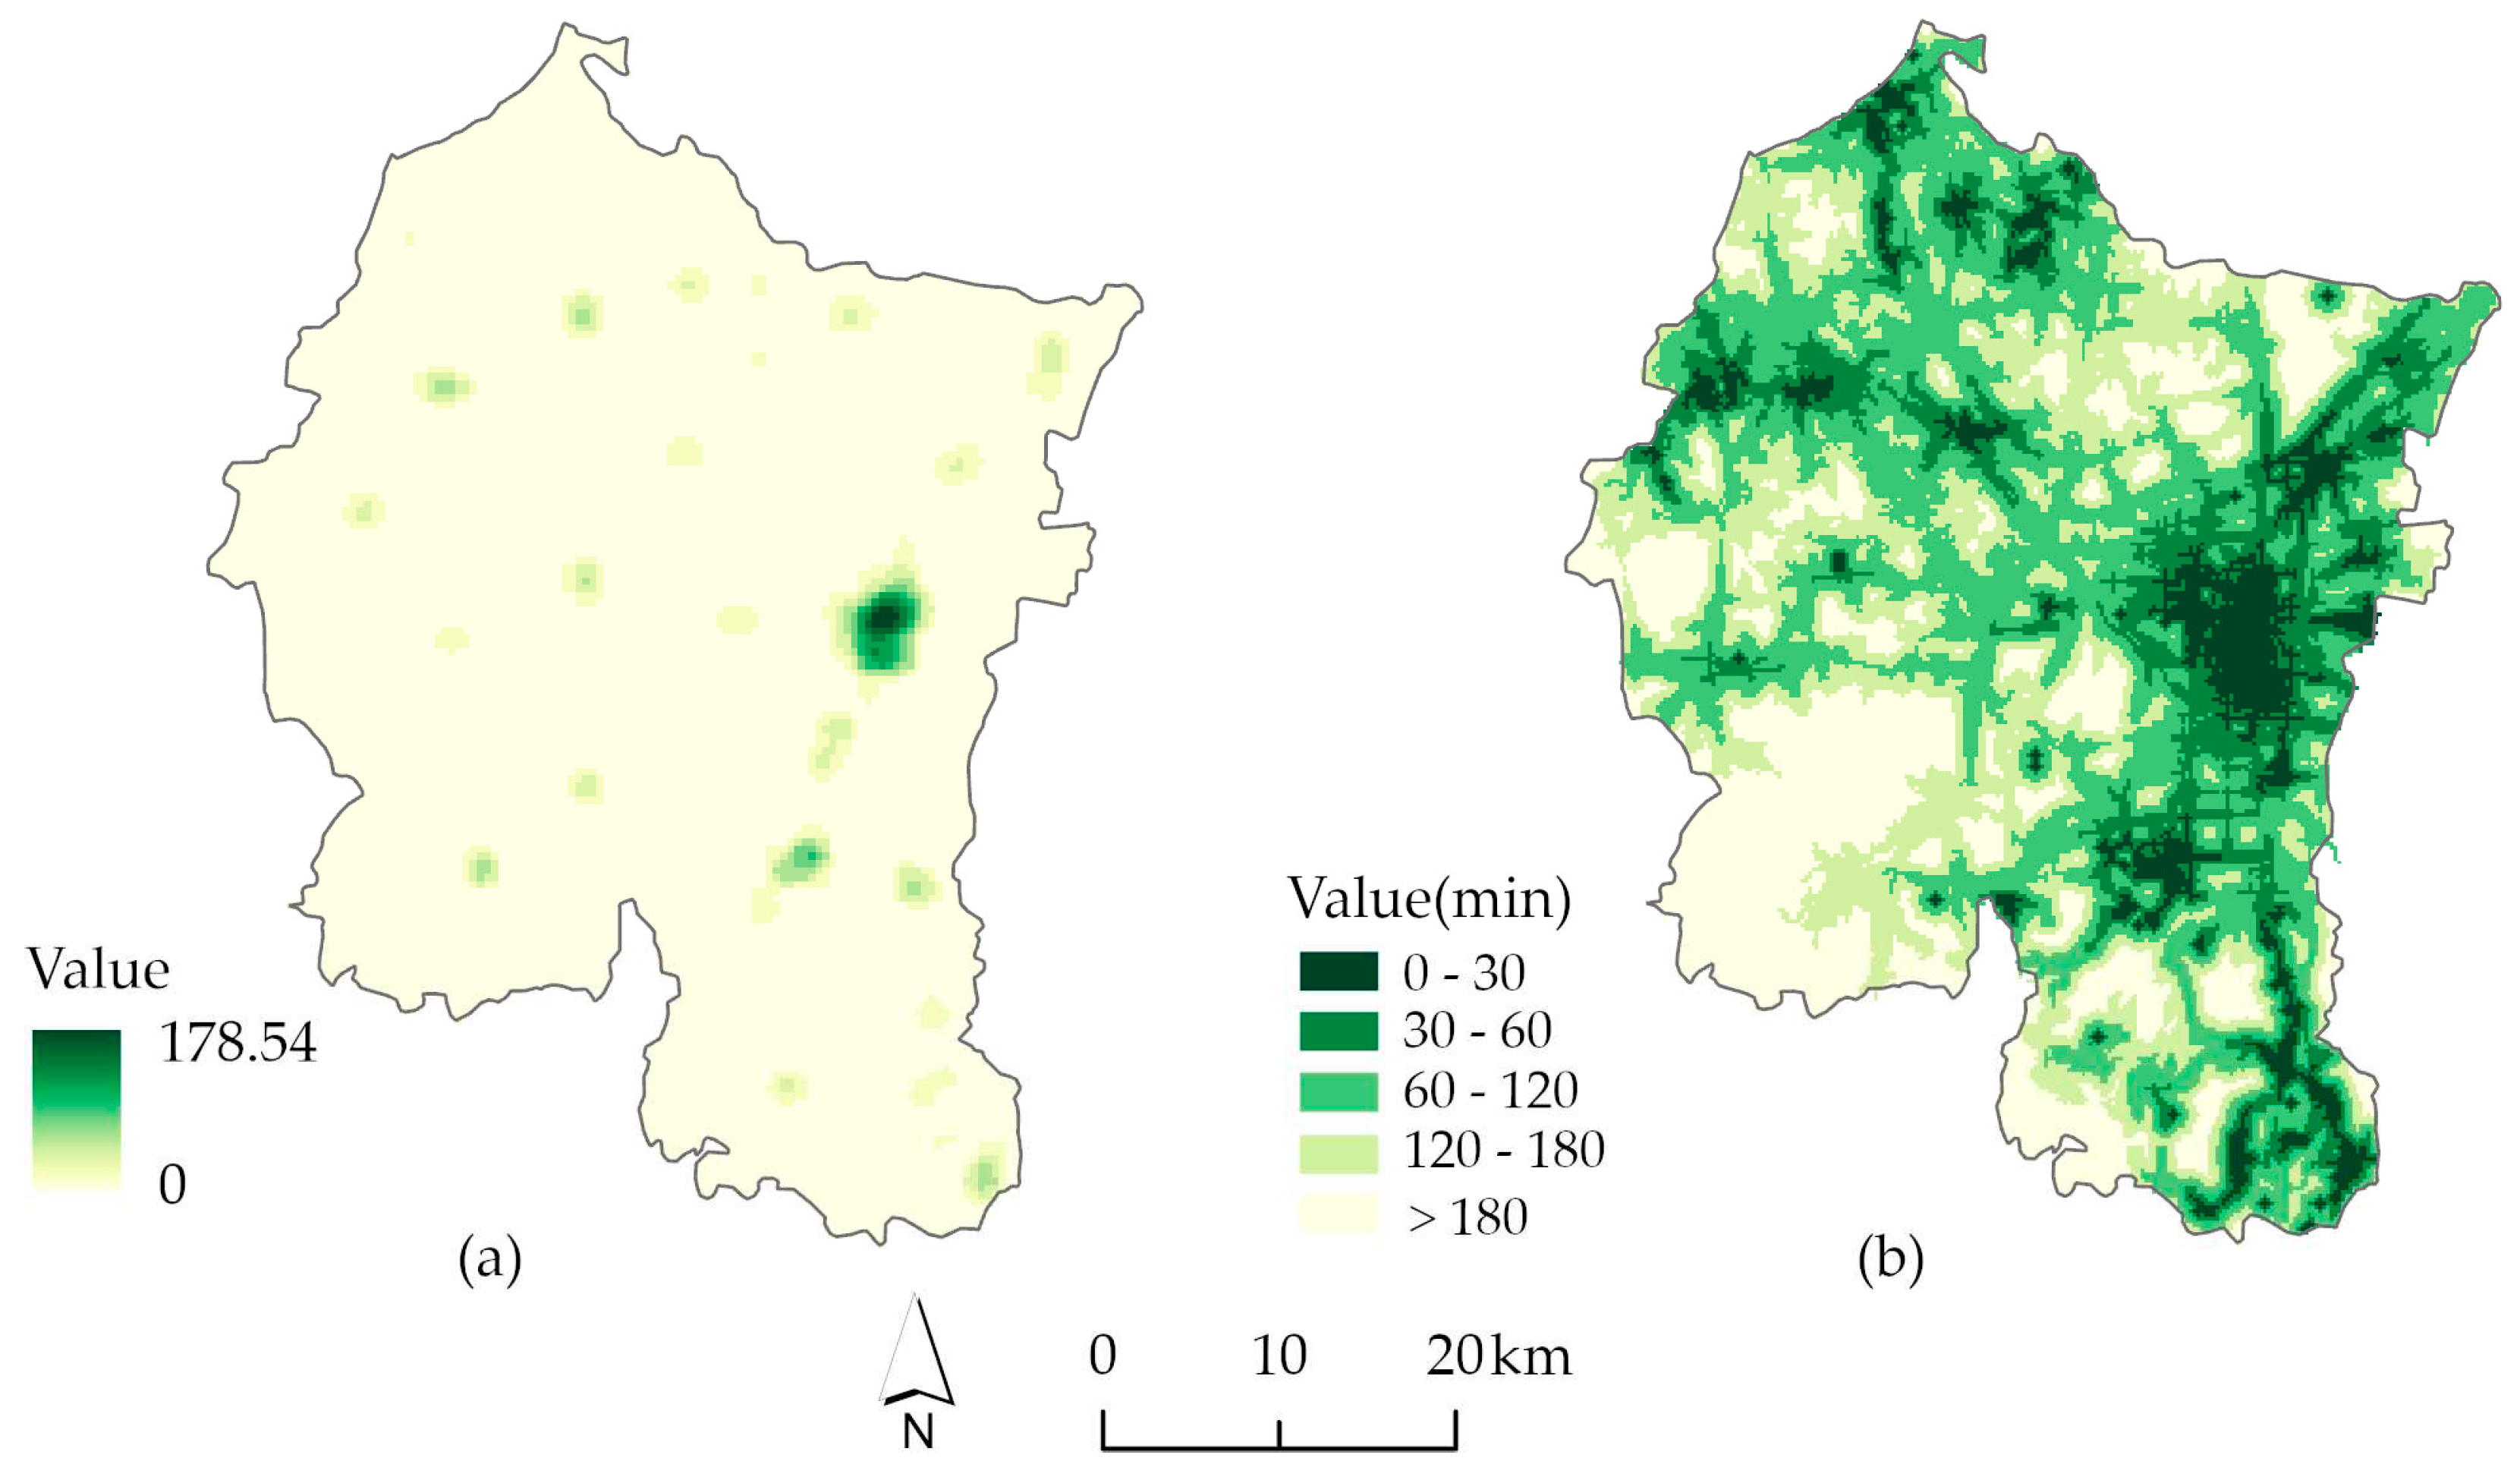
Figure 8.
Evaluation of tourist satisfaction. (a) Number of check-in photos at attractions; (b) Sentiment orientation of tourist reviews.
Figure 8.
Evaluation of tourist satisfaction. (a) Number of check-in photos at attractions; (b) Sentiment orientation of tourist reviews.
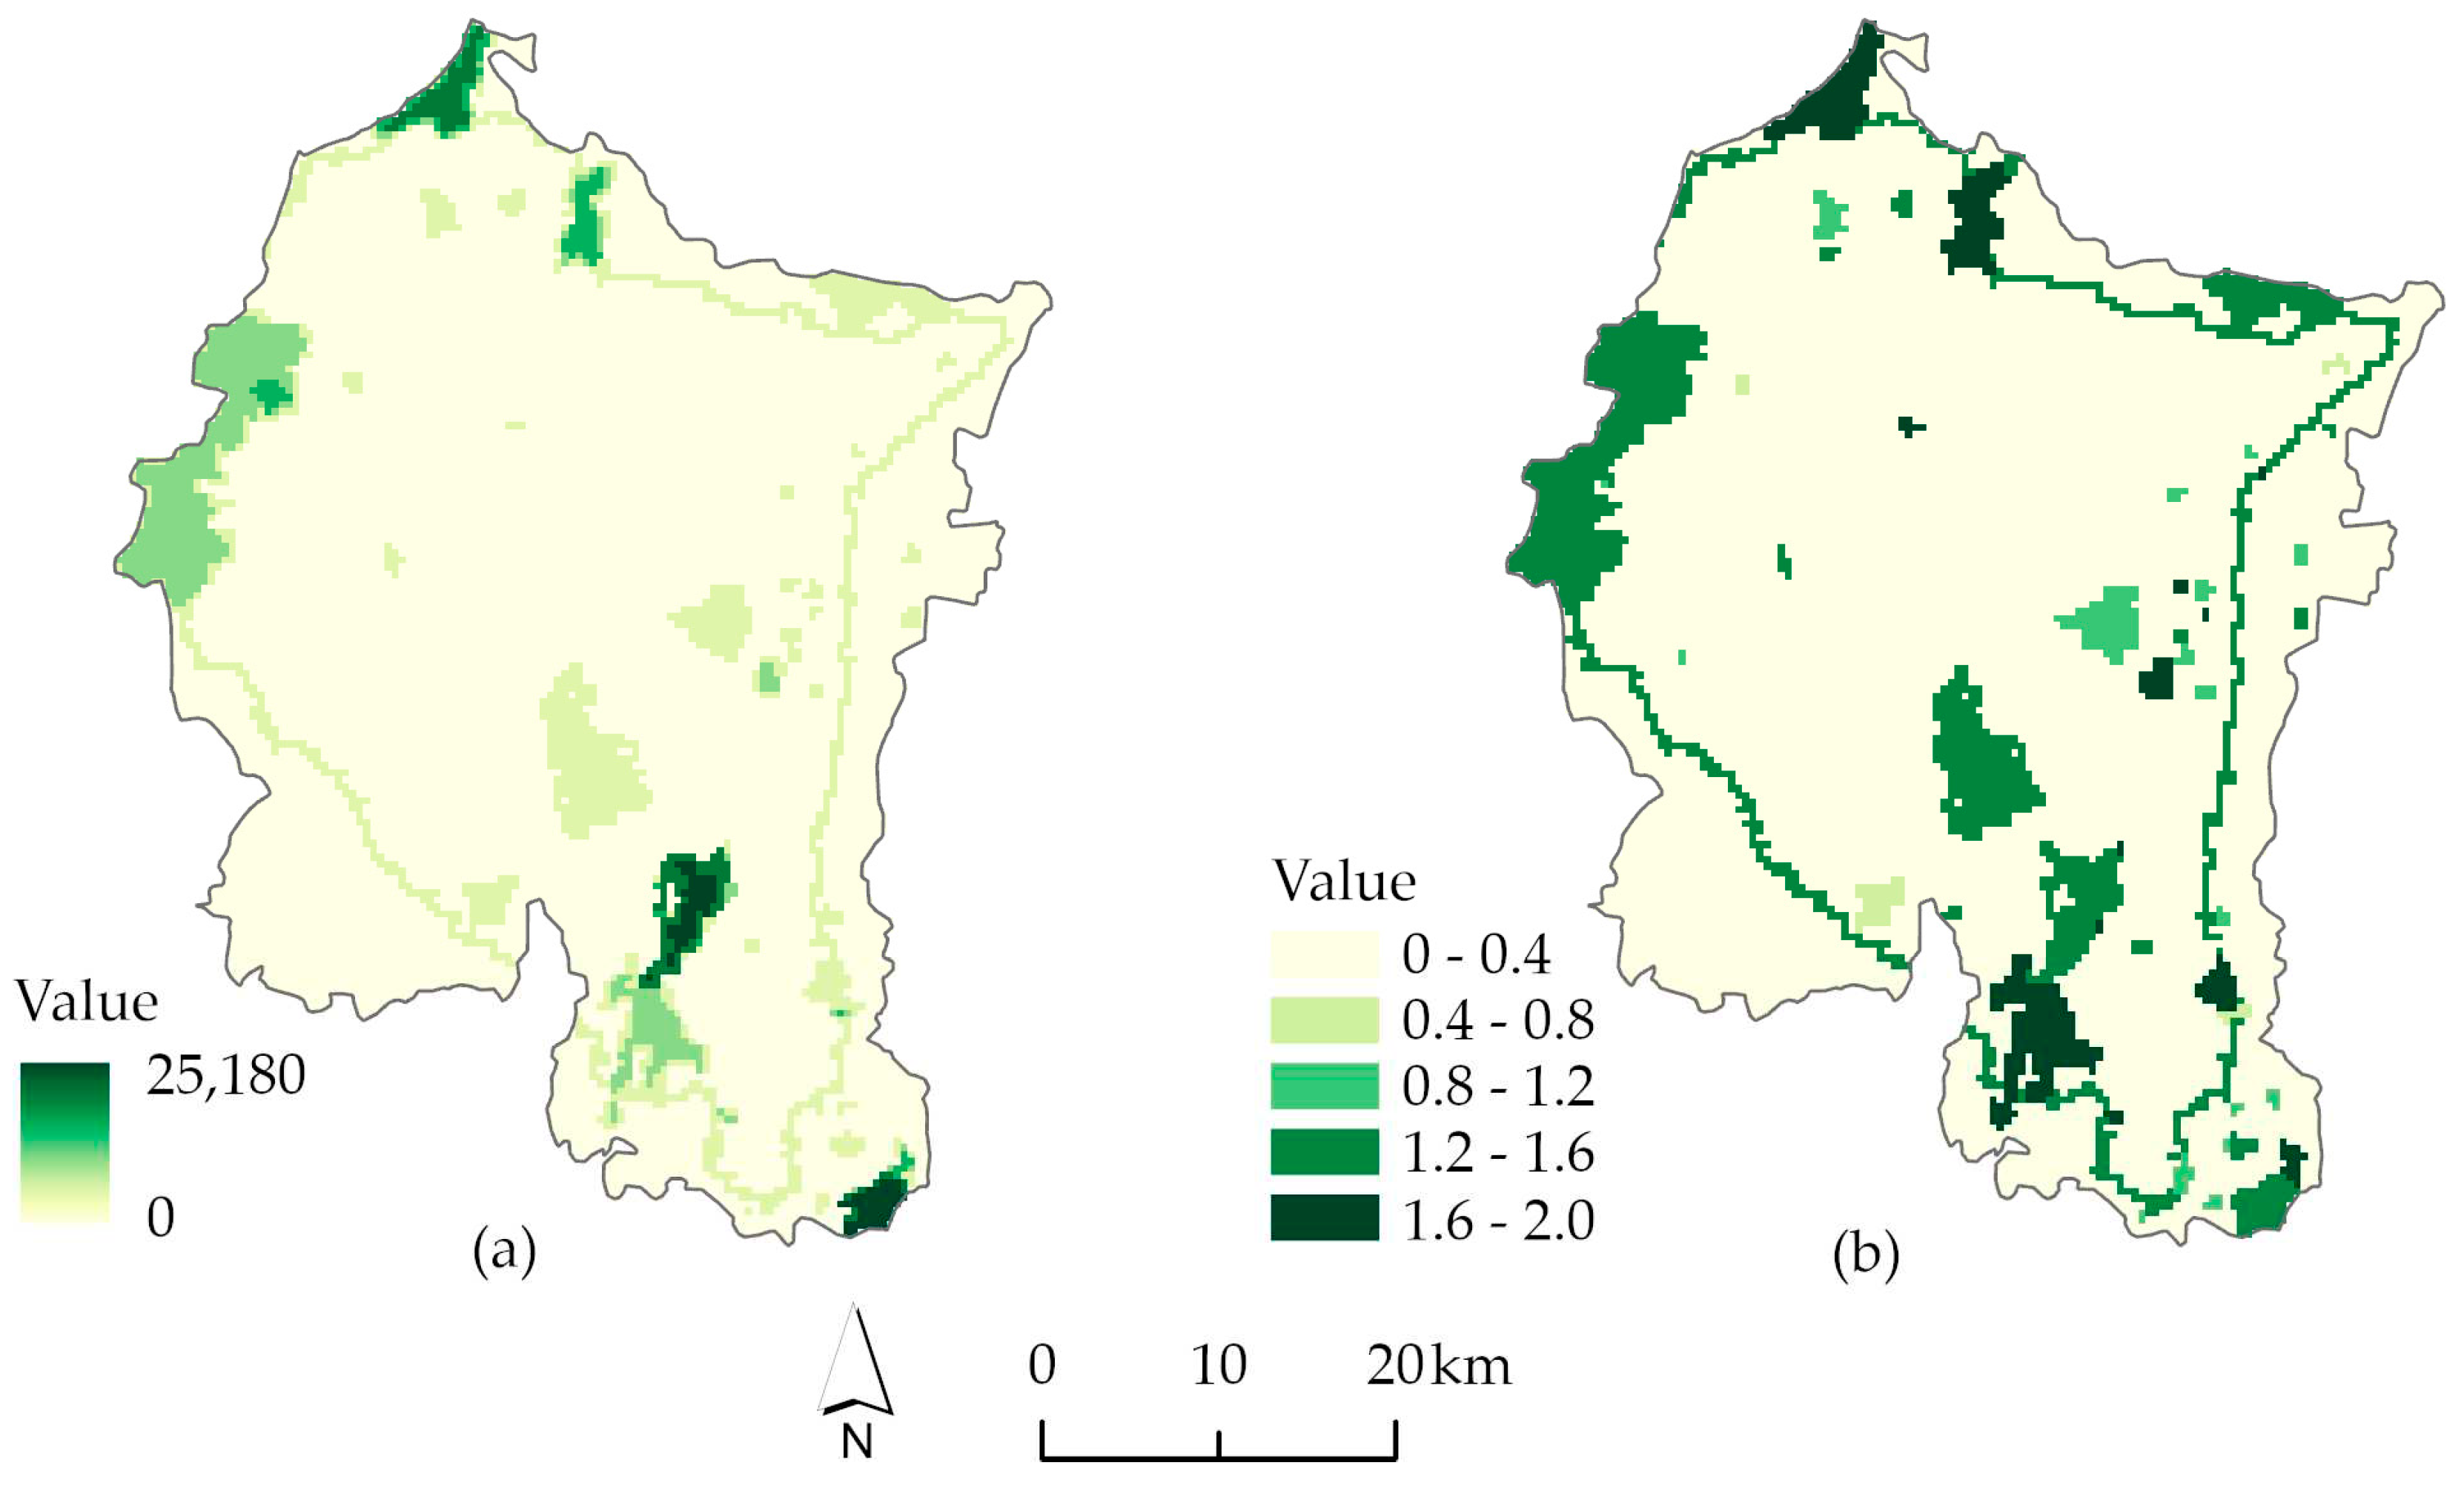
Figure 9.
Comprehensive evaluation of tourism service.
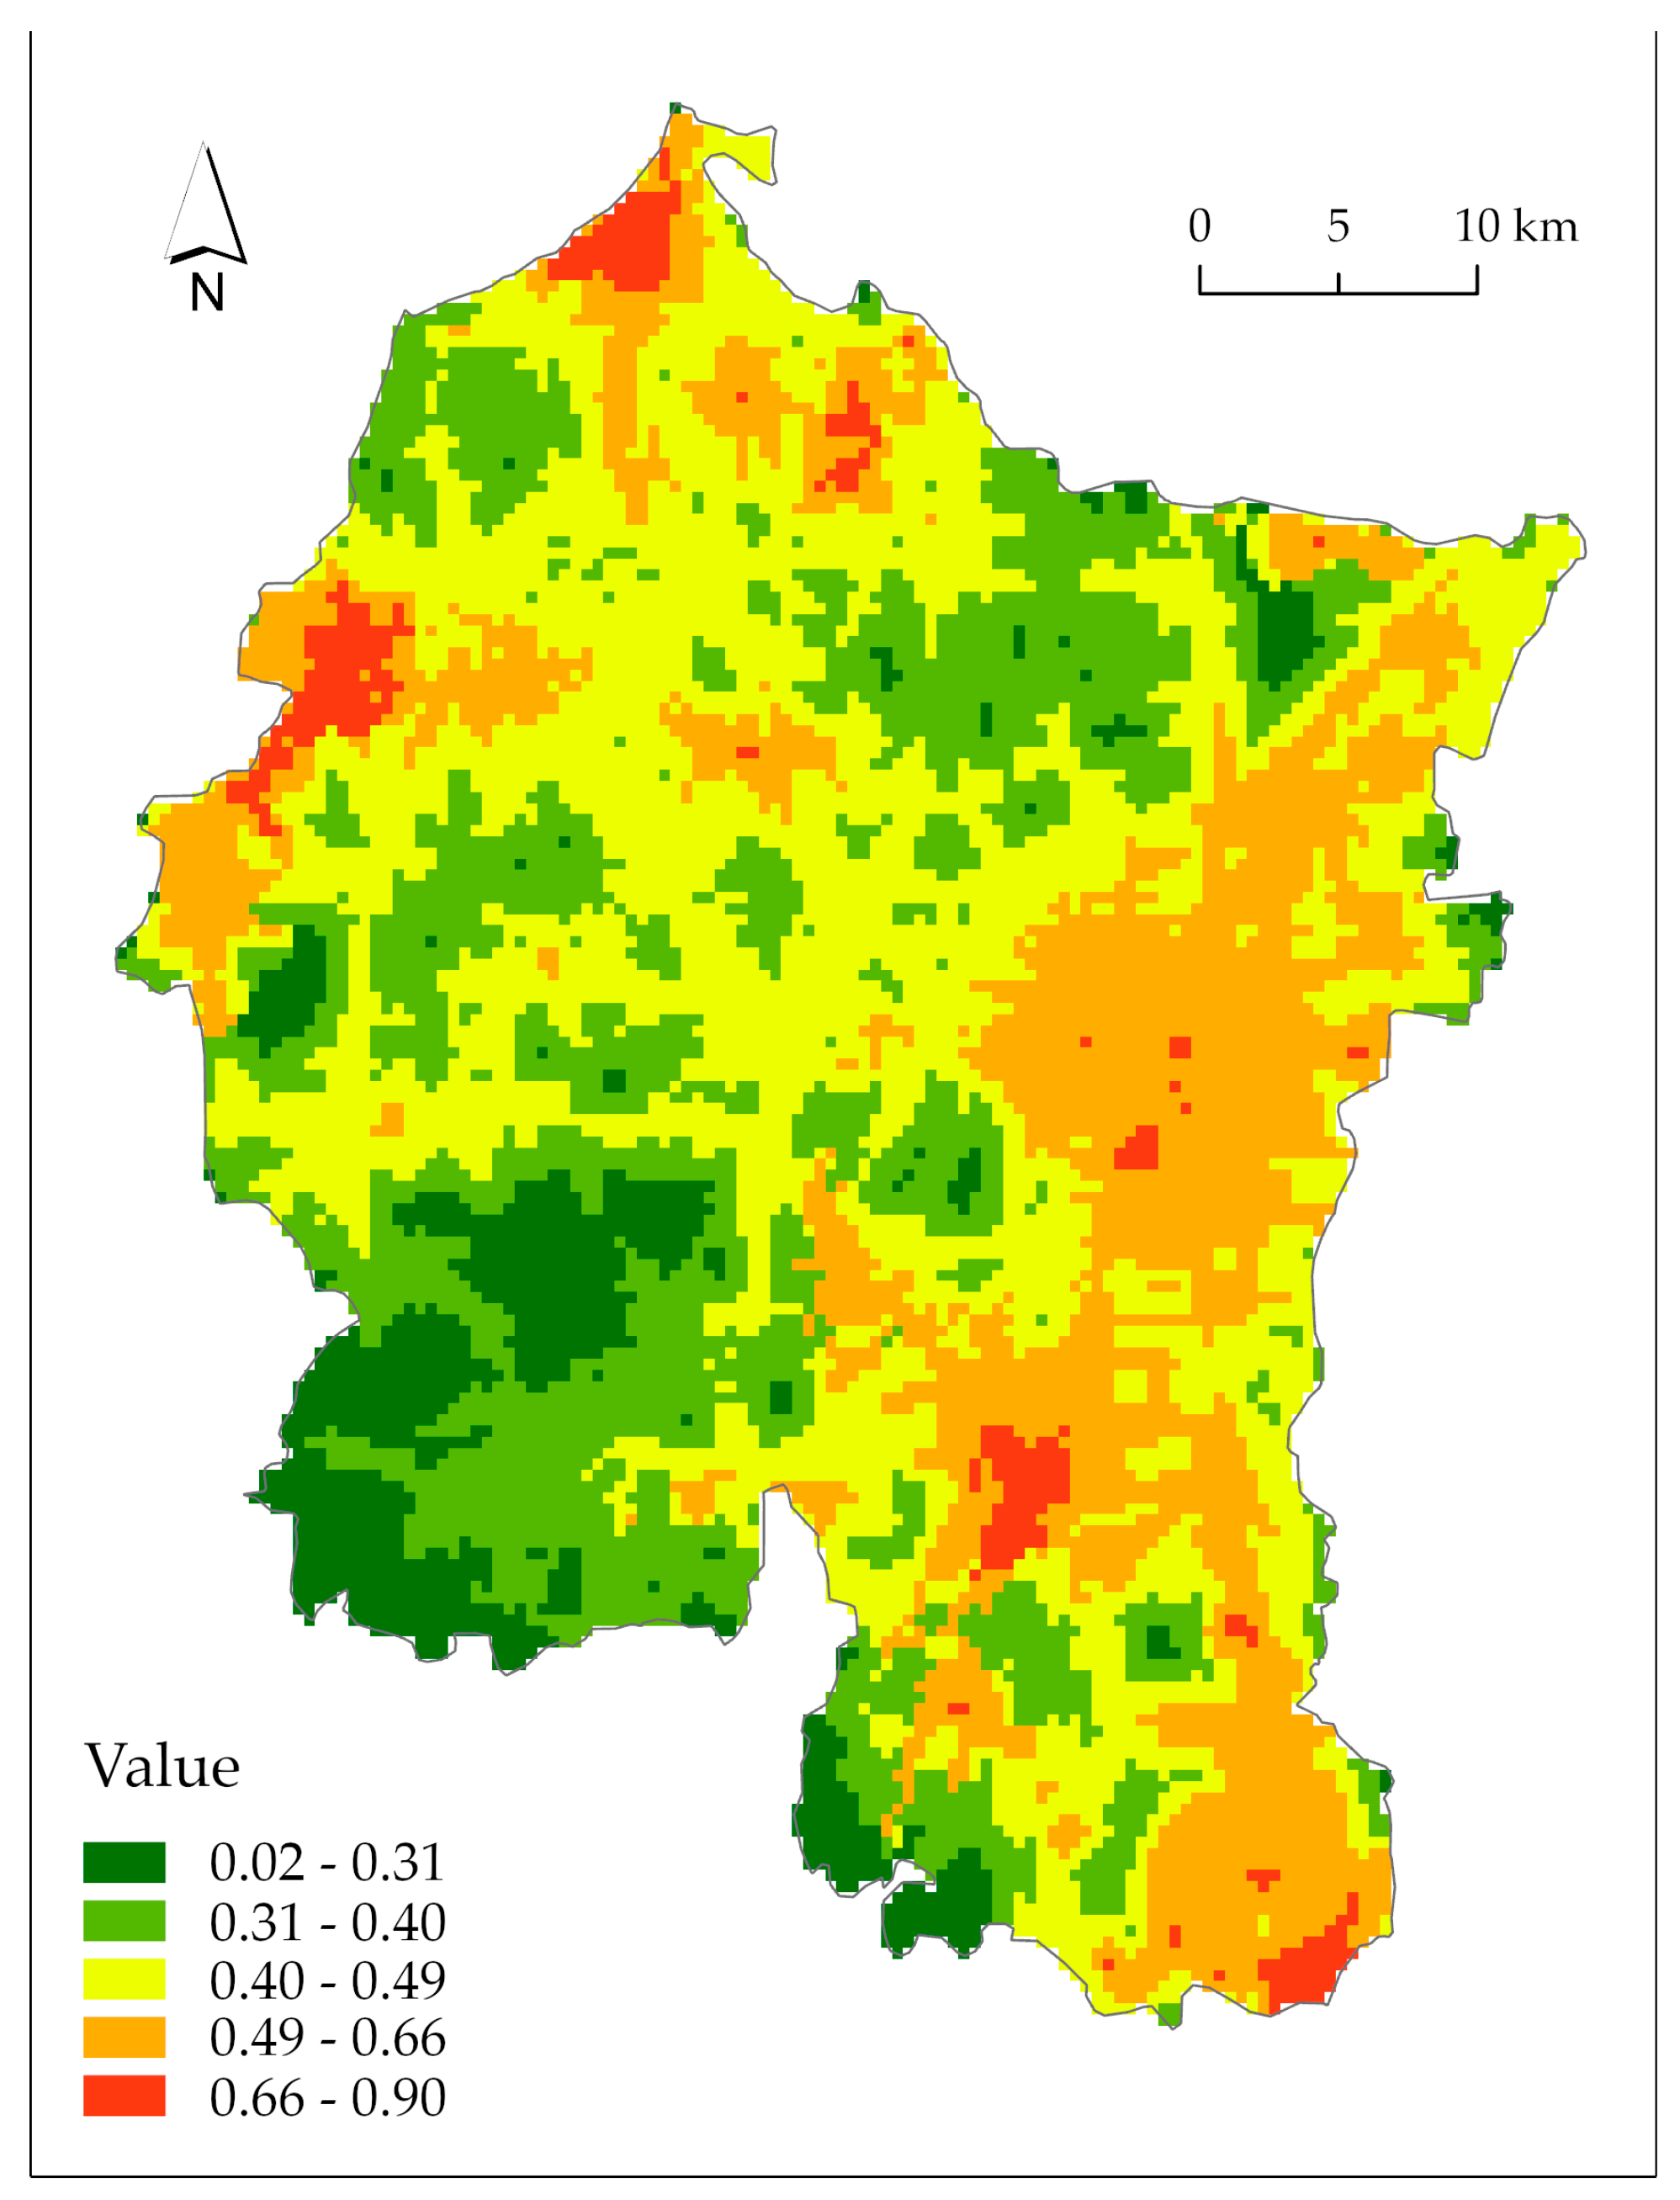
Figure 10.
Hot-cold spot analysis.
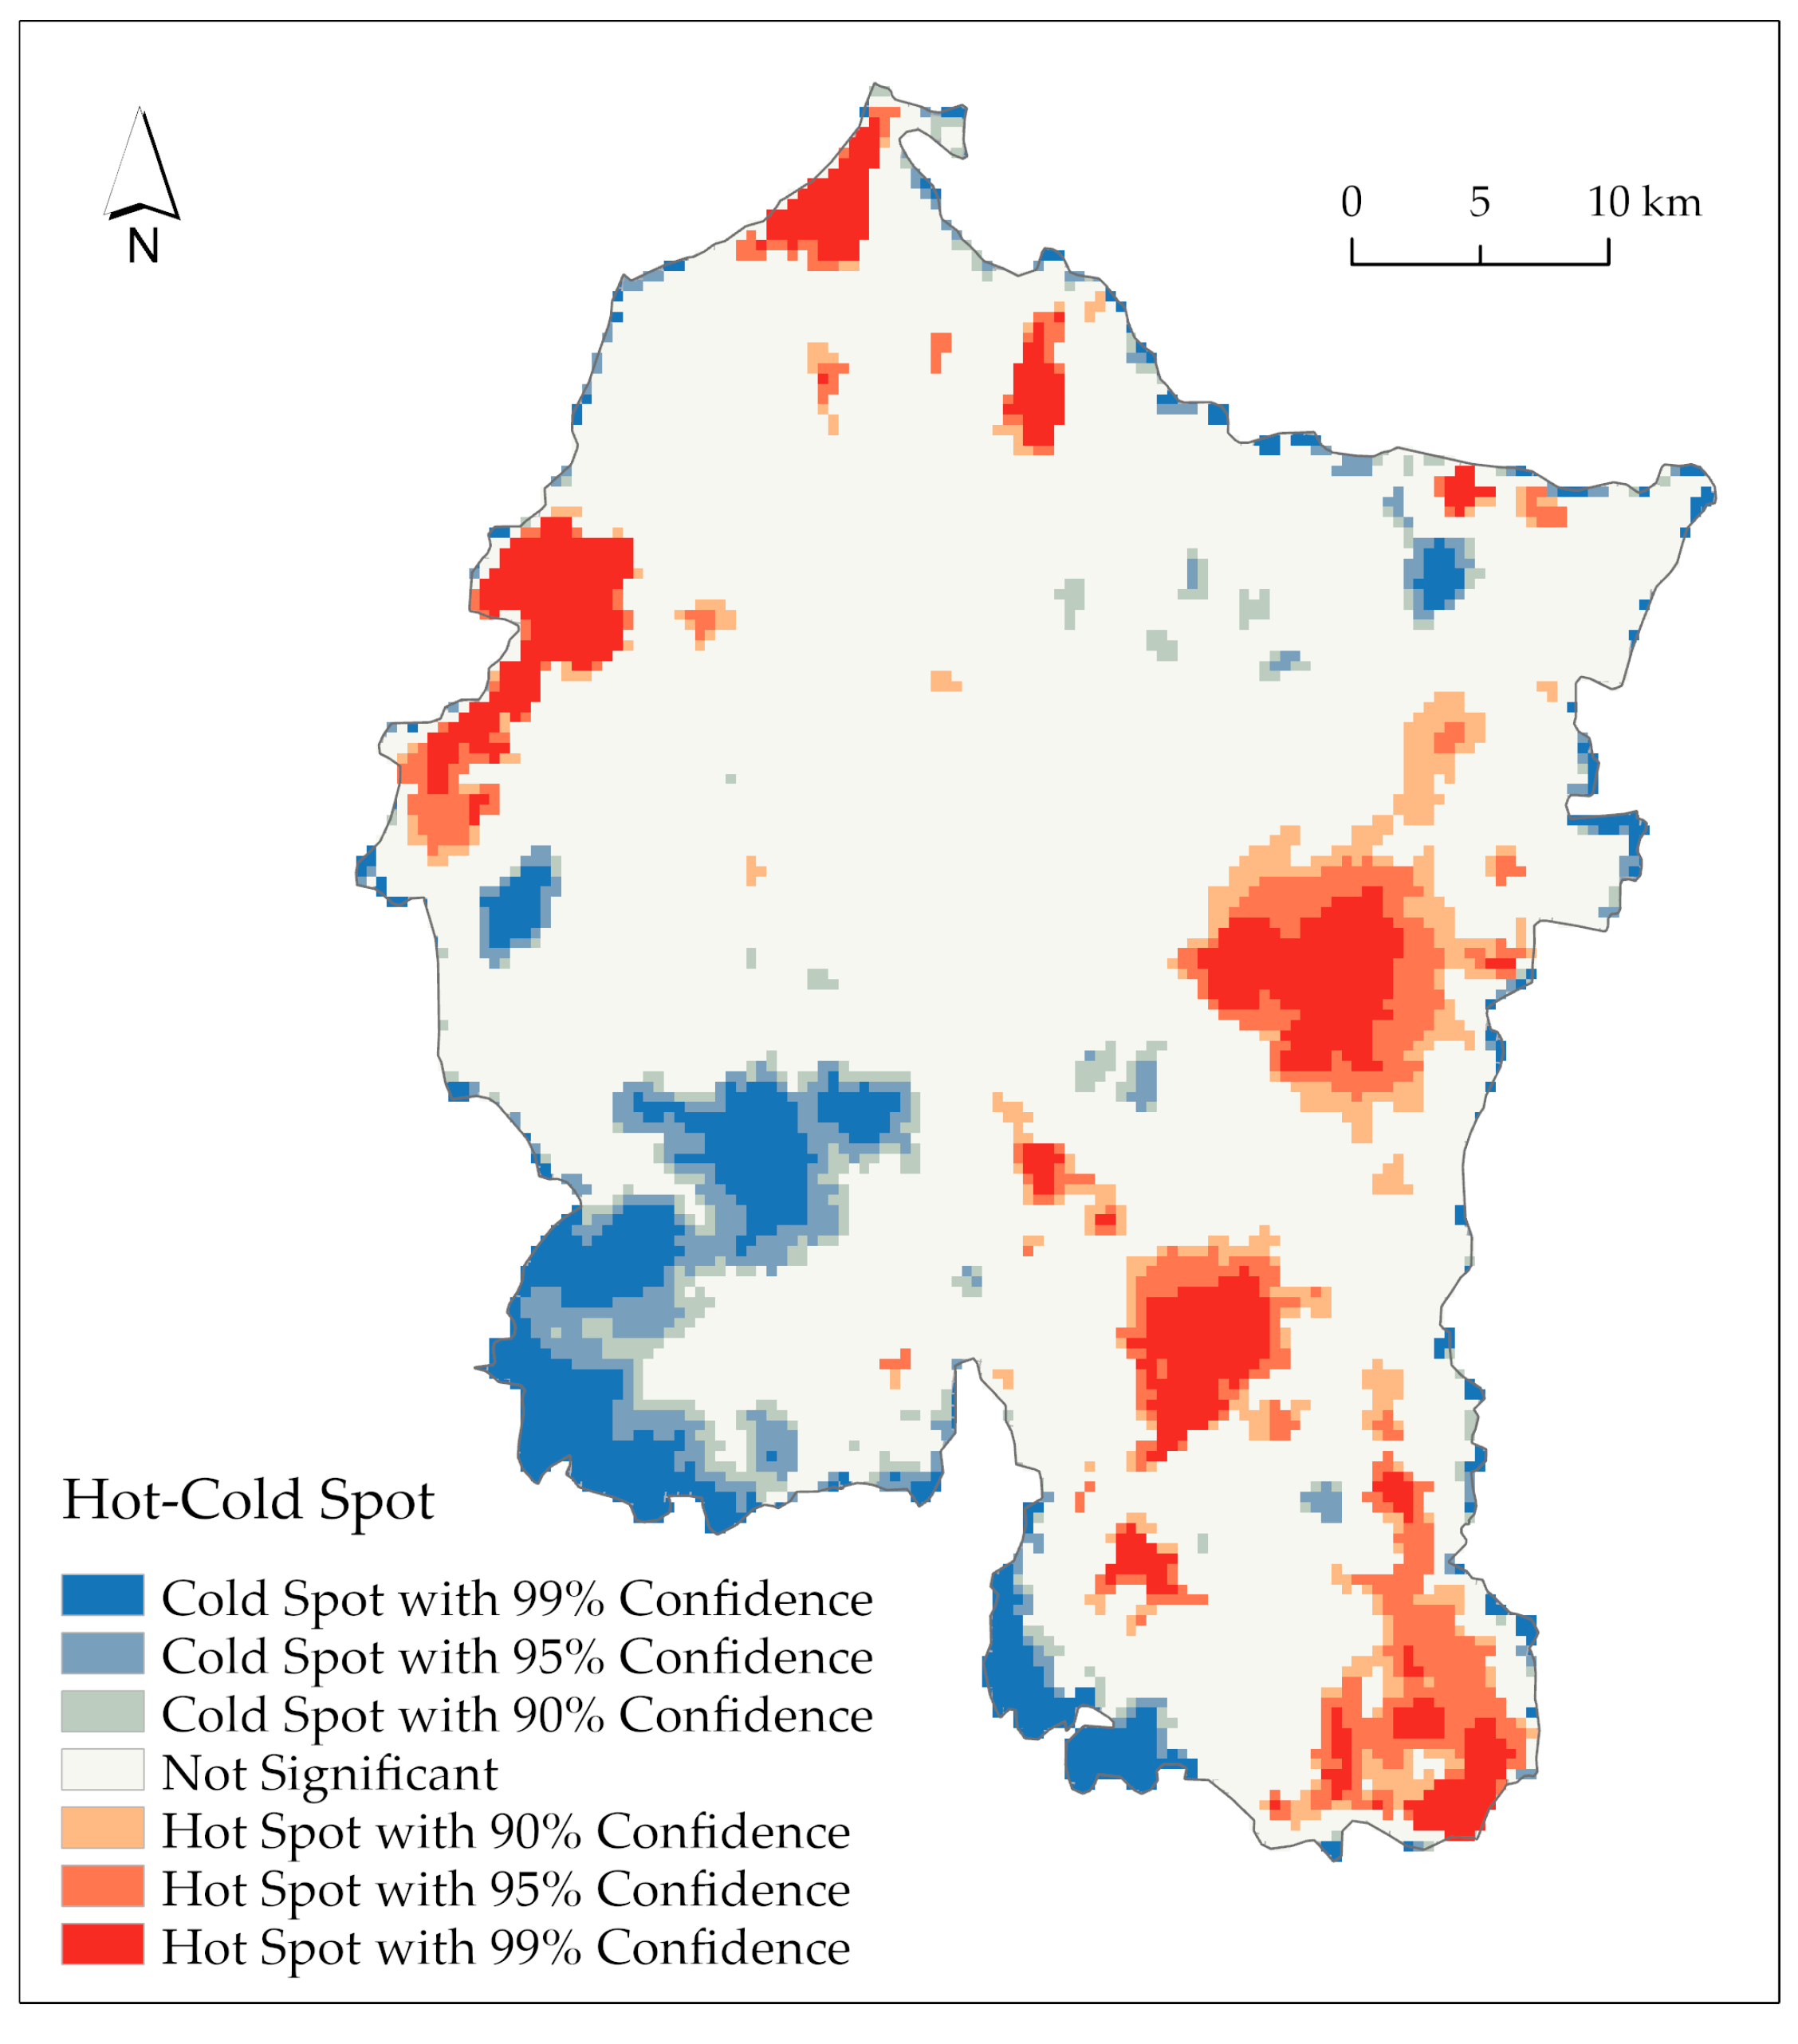
Figure 12.
Word clouds of hotpot areas. 1 indicates Wawushan Scenic Area, 2 indicates Caoshan Resort, 3 contains the attractions of the central city, 4 mainly covers Tianmu Lake, 5 mainly covers Nanshan Bamboo Sea Scenic Area, 6 indicates cold spot area in Tianmu Lake Town, 7 indicates the cold spot area in Shezhu Town.
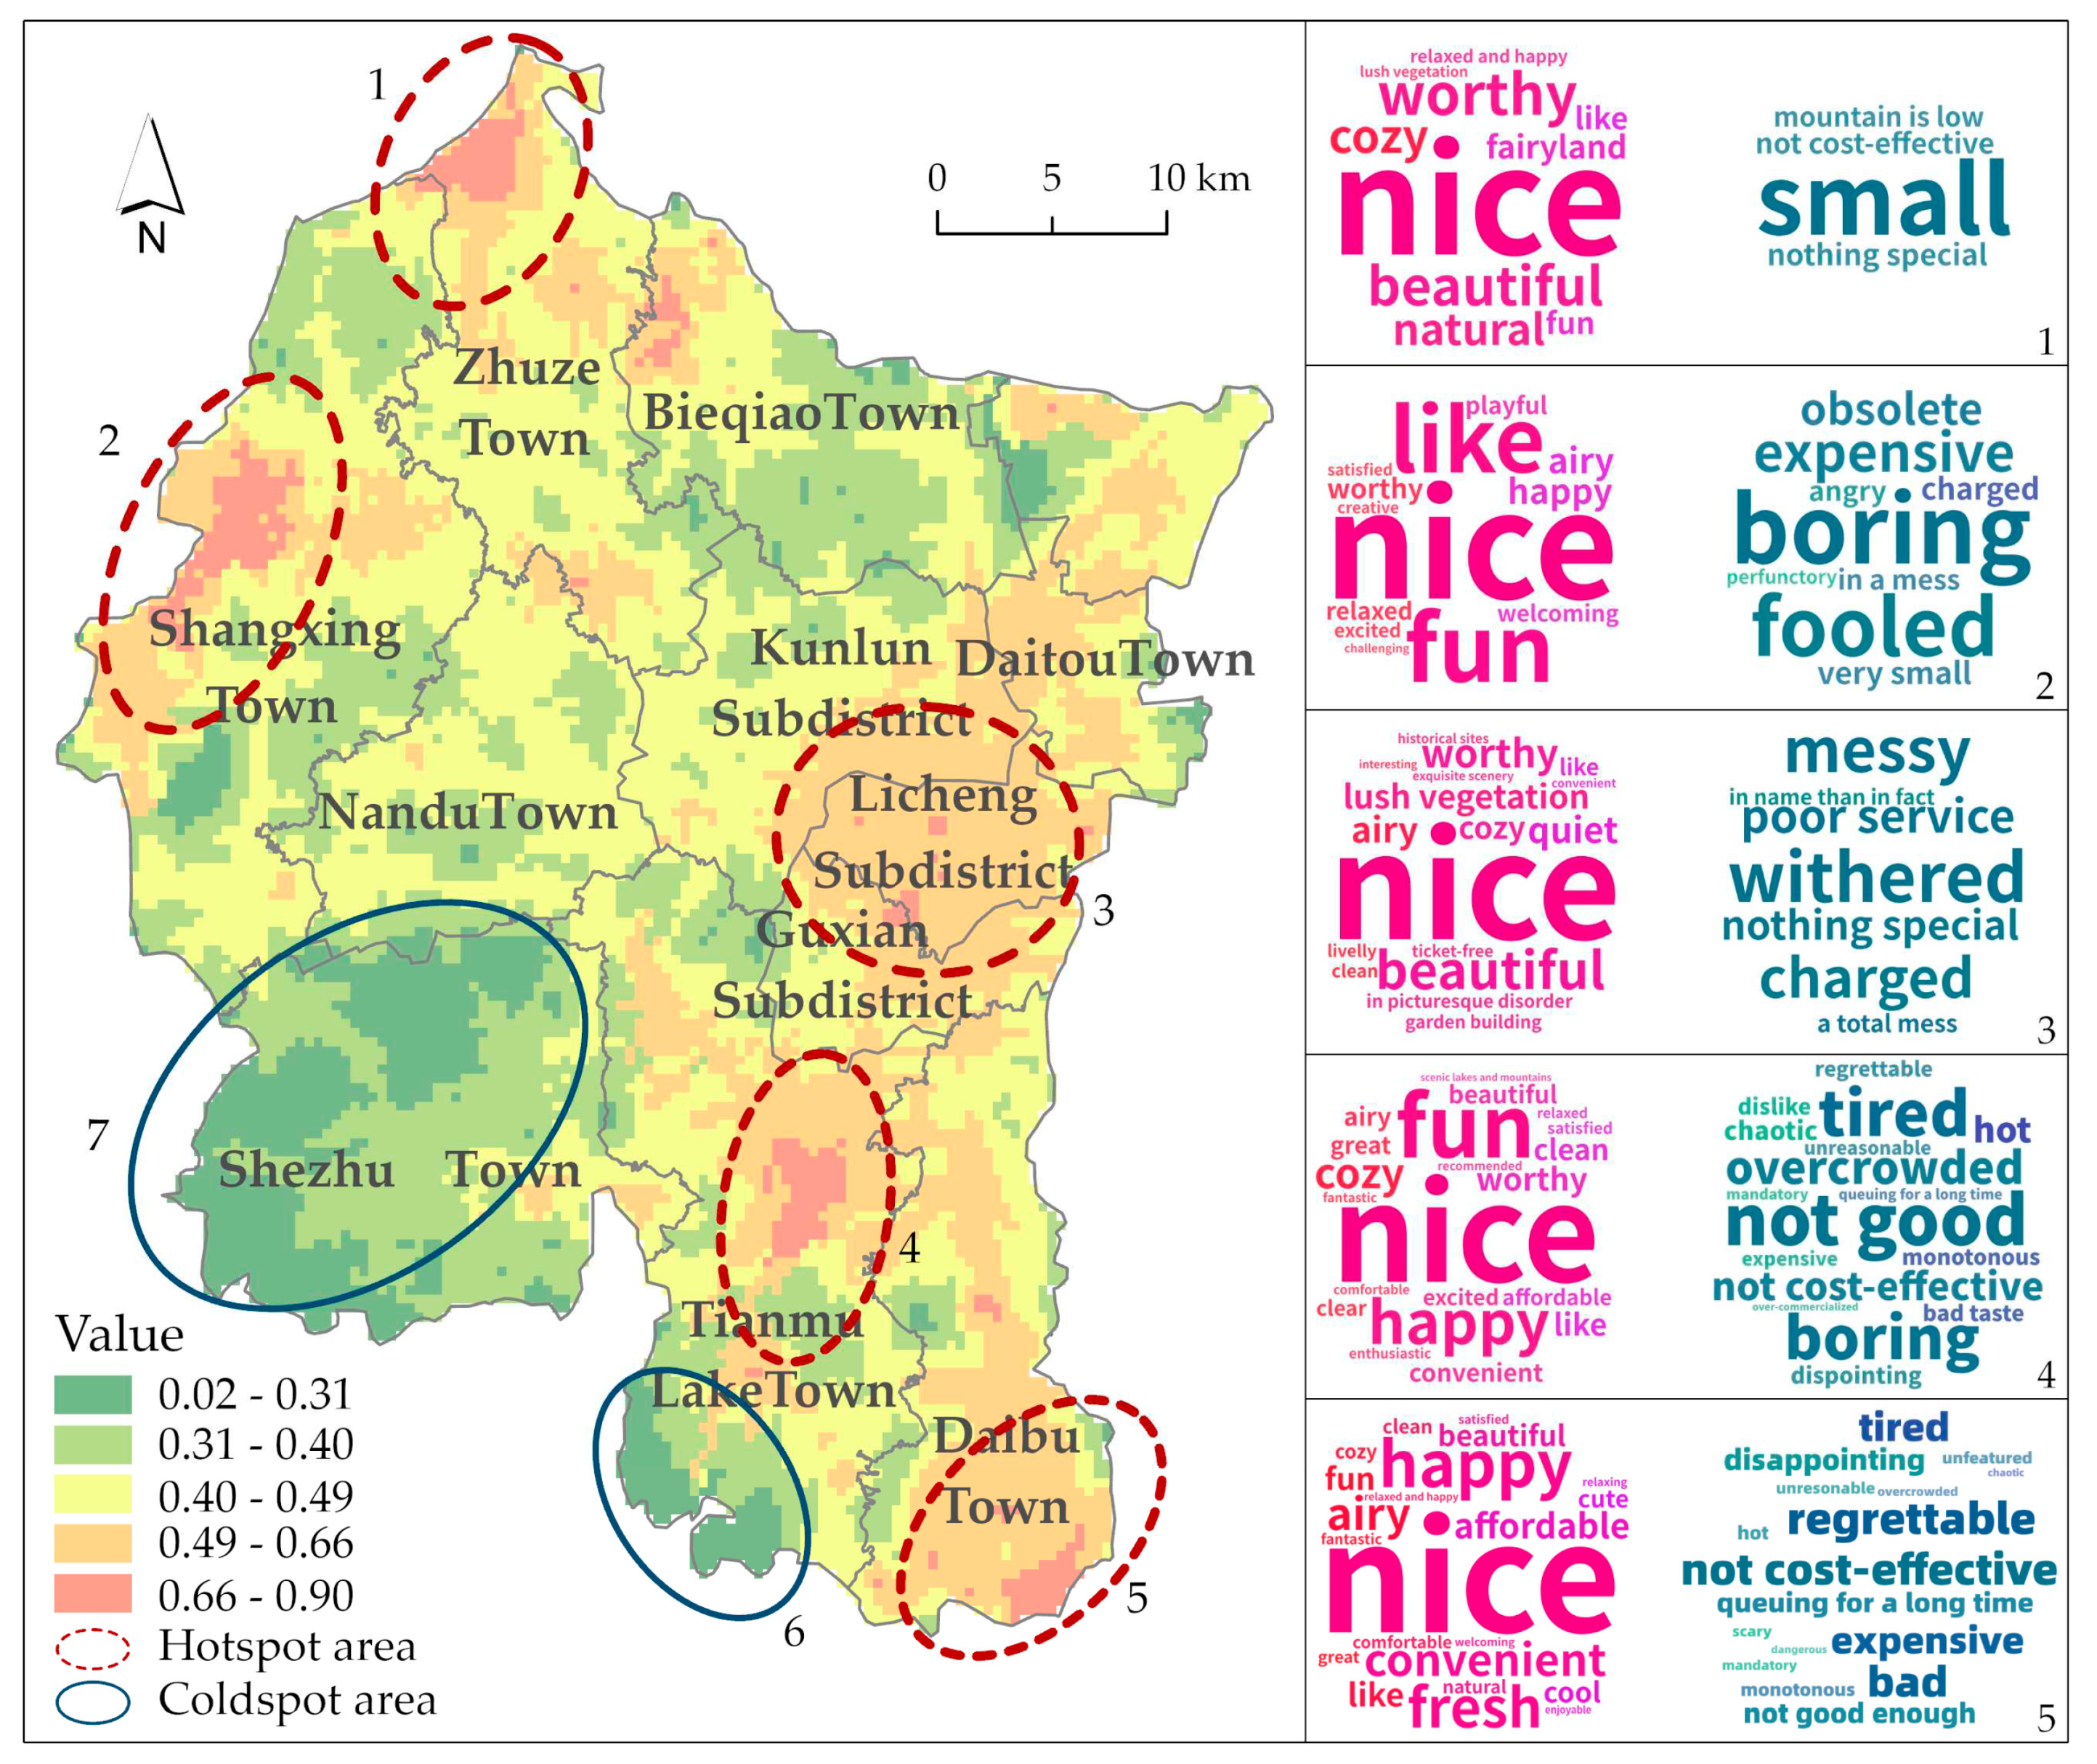
Figure 13.
Aerial photos and proposed programs of cold spot area in Tianmu Lake Town.
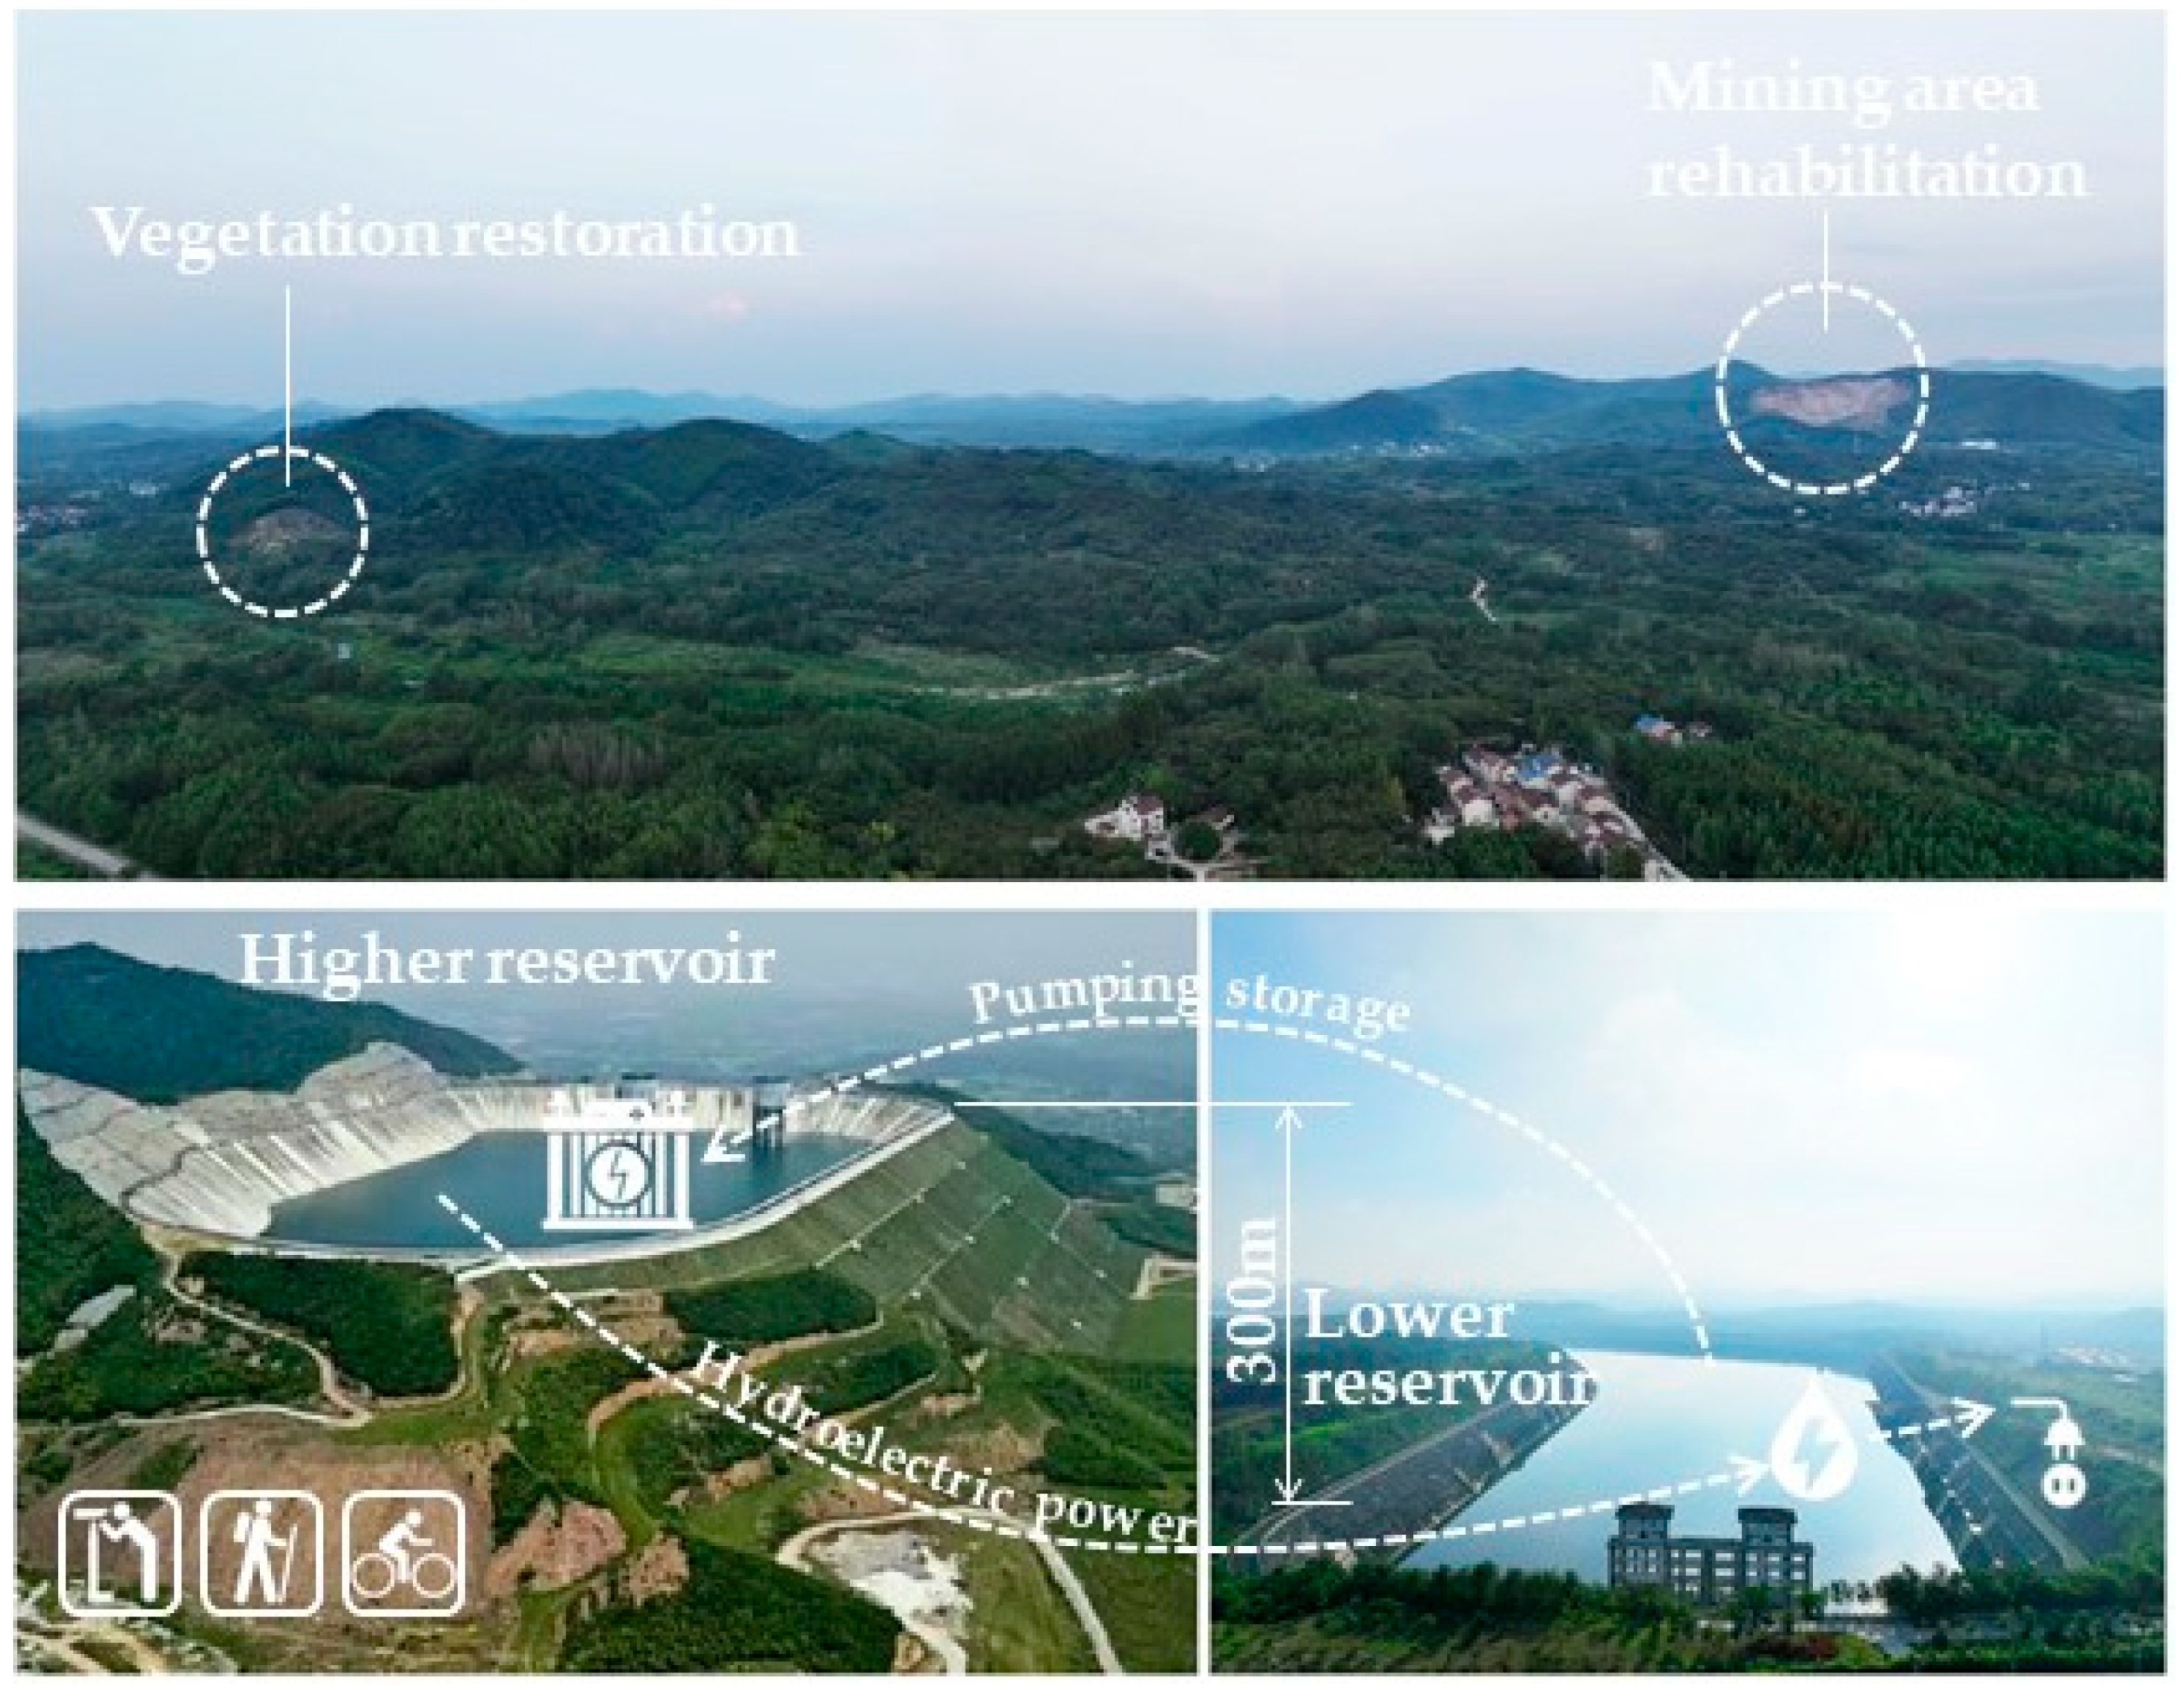
Figure 14.
Aerial photos and proposed programs of cold spot area in Shezhu Town.
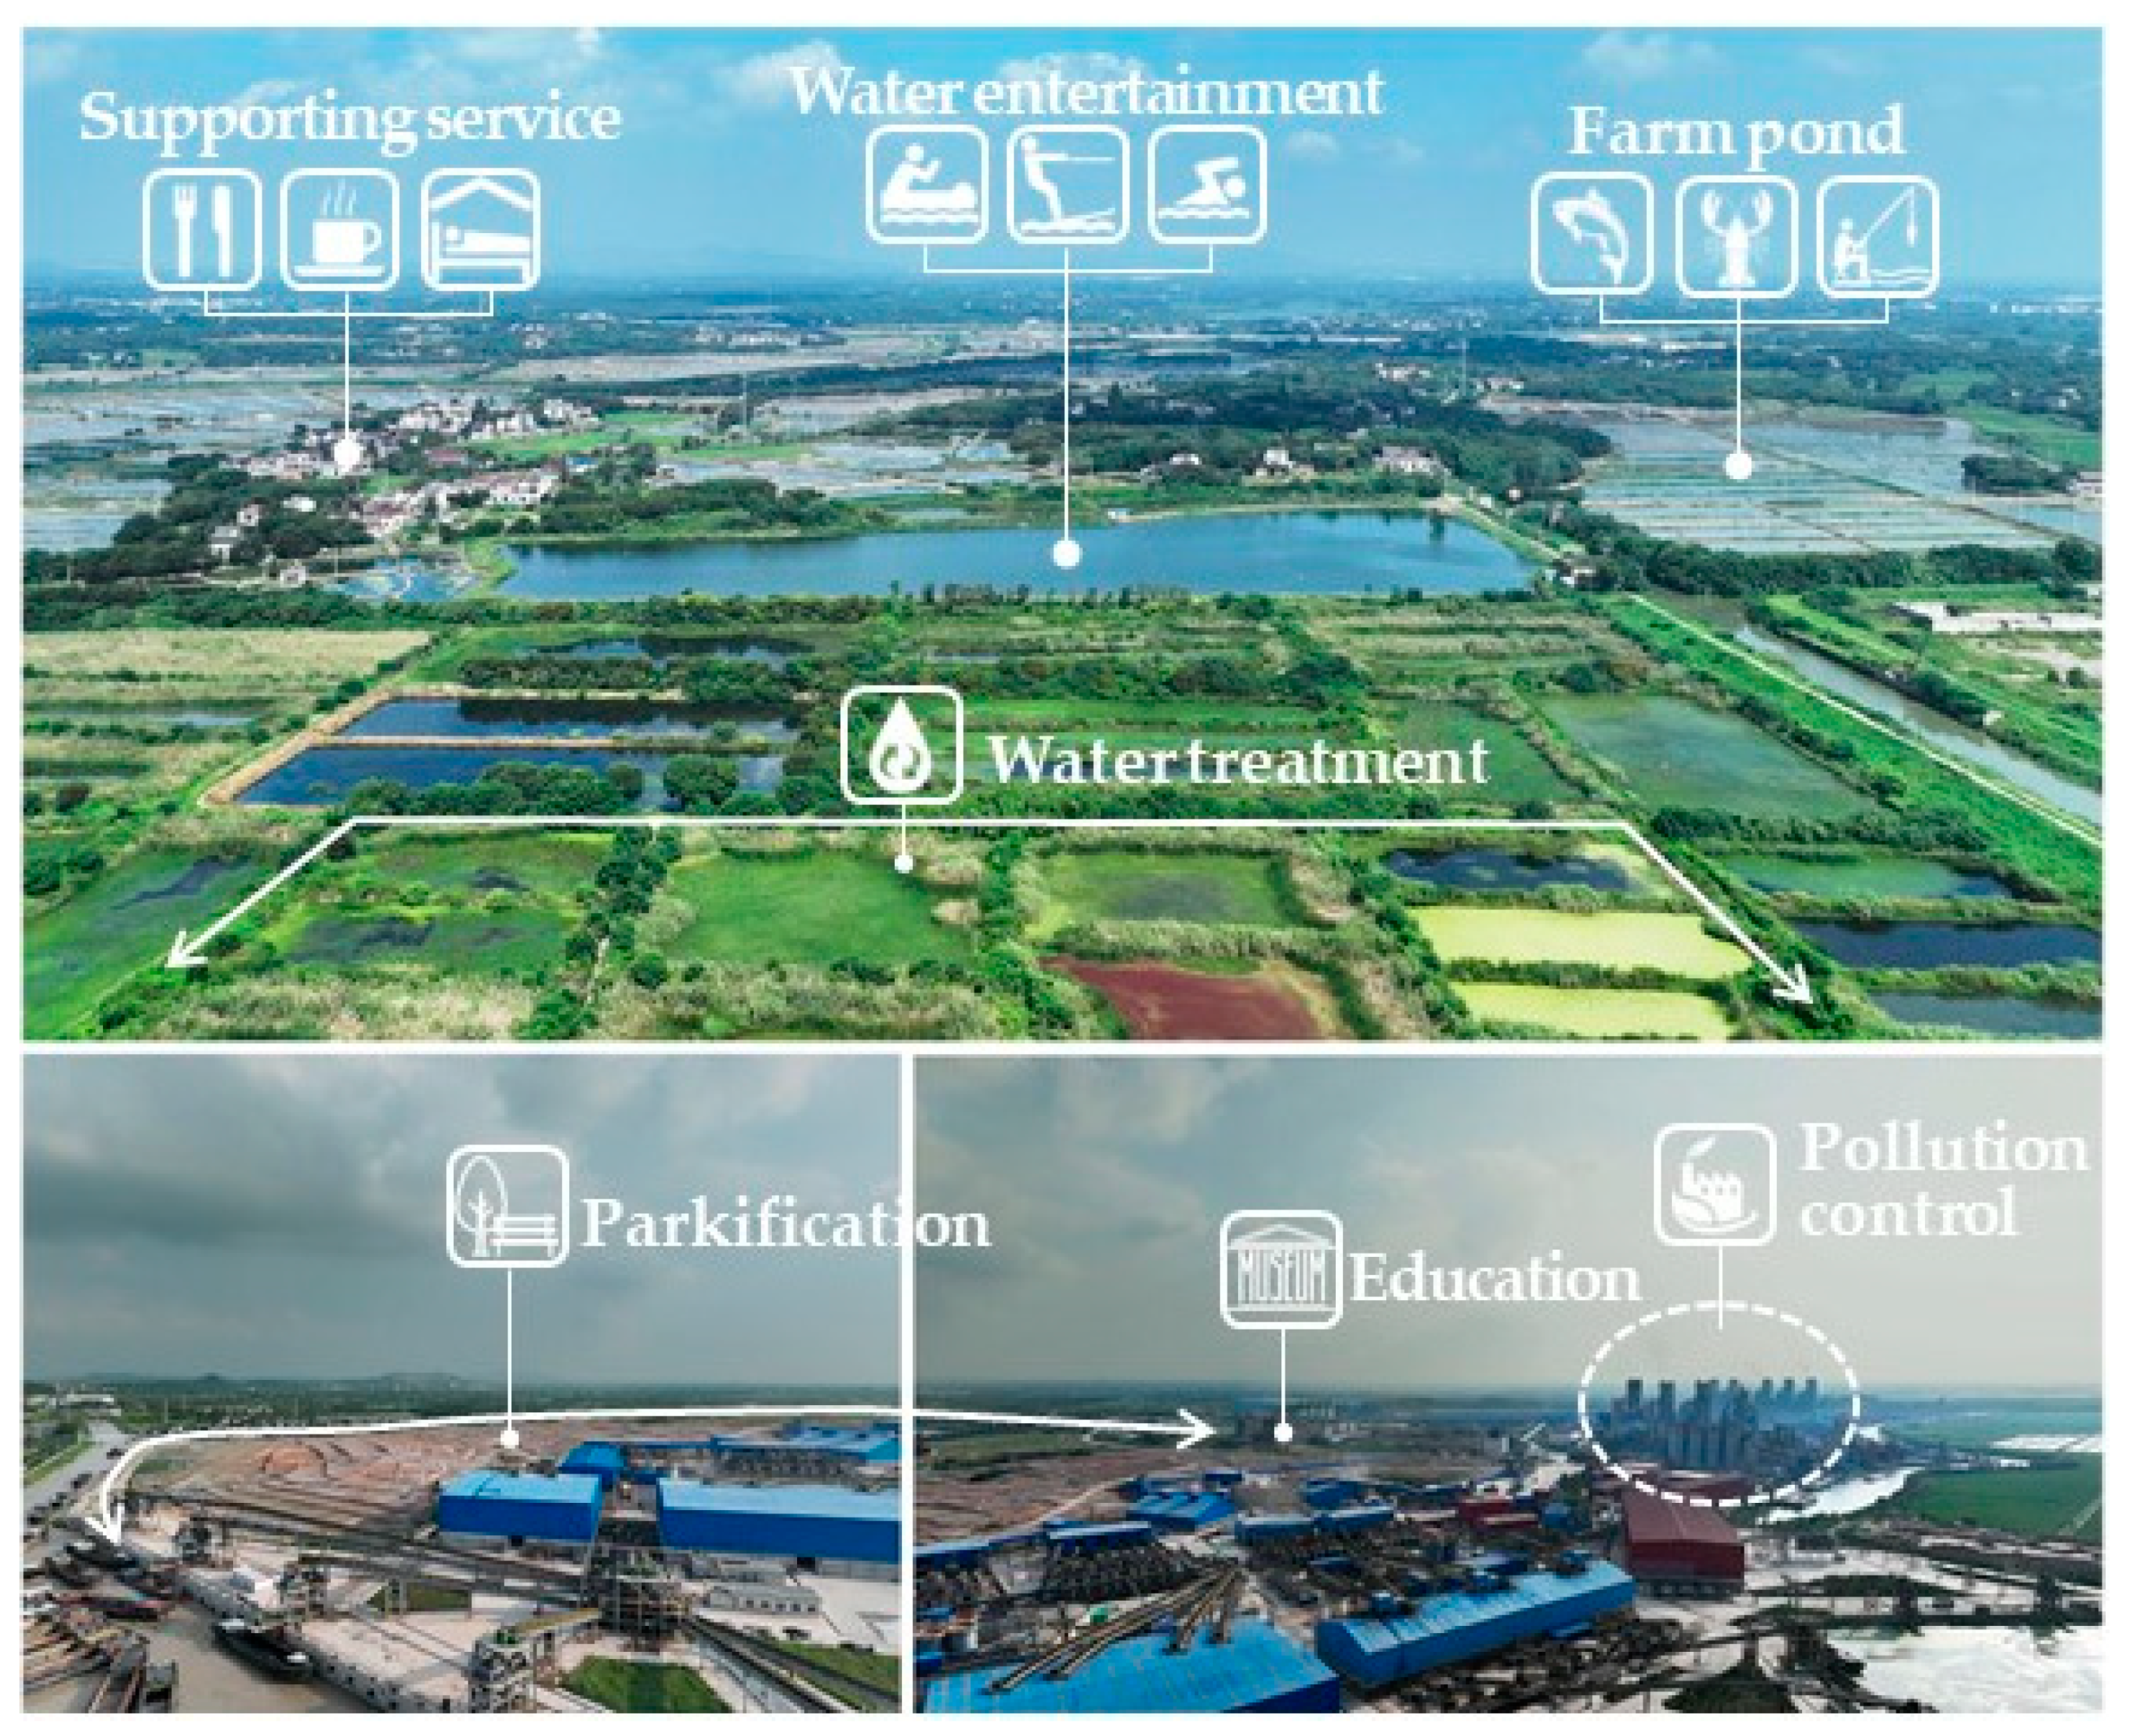

Table 1.
Basic data.
| Category | Data | Data Source |
|---|---|---|
| Location data | Tourism resources | Baidu Maps |
| POIs of tourism service facilities | ||
| Road network | OpenStreetMap | |
| Big data for tourism reviews | Number of check-in photos at attractions | Ctrip (www.ctrip.com), |
| Tourism review texts | Mafengwo (www.mafengwo.cn), | |
| Popularity ratings of attractions | Tongcheng Travel (www.ly.com) |
Table 2.
Evaluation indicator system for tourism service
| Target | Indexes | Weight | Factors | Weight |
|---|---|---|---|---|
| Tourism service | Quality of tourism resource | 0.2427 | Density | 0.0953 |
| Fame | 0.0749 | |||
| Popularity | 0.0725 | |||
| Comprehensiveness of tourism service facilities | 0.581 | Tourism service POI density | 0.063 | |
| Transport accessibility | 0.518 | |||
| Tourist satisfaction | 0.1763 | Number of check-in photos at attractions | 0.085 | |
| Sentiment orientation of tourist reviews | 0.0913 |
Table 3.
Speed and time cost values for different road levels.
| Road levels | Motorway | Level 1 | Level 2 | Level 3 | Level 4 | Pedestrian | Other |
|---|---|---|---|---|---|---|---|
| Speed () | 100 | 80 | 60 | 40 | 20 | 10 | 5 |
| Time cost value () | 0.6 | 0.75 | 1 | 1.5 | 3 | 6 | 12 |
Table 4.
Statistics of the area proportion of tourism service by different levels.
| Area Proportion (%) | Lower level | Low level | Medium level | High level | Higher level | |
|---|---|---|---|---|---|---|
| Whole city | 4.07 | 21.28 | 47.08 | 24.72 | 2.85 | |
| City divisions |
Zhuze Town | 0.00 | 4.59 | 67.34 | 22.39 | 5.68 |
| Shangxing Town | 1.80 | 21.69 | 53.05 | 17.70 | 5.76 | |
| Nandu Town | 0.65 | 19.46 | 77.20 | 2.68 | 0.00 | |
| Shezhu Town | 20.24 | 58.33 | 19.49 | 1.94 | 0.00 | |
| Bieqiao Town | 0.18 | 33.15 | 55.00 | 9.42 | 2.24 | |
| Shanghuang Town | 4.07 | 12.44 | 49.79 | 33.48 | 0.21 | |
| Daitou Town | 0.91 | 11.74 | 39.25 | 48.09 | 0.00 | |
| Kunlun Subdistrict | 0.00 | 11.64 | 58.98 | 29.38 | 0.00 | |
| Licheng Subdistrict | 0.00 | 0.10 | 8.15 | 88.18 | 3.57 | |
| Guxian Subdistrict | 0.00 | 2.84 | 43.69 | 52.06 | 1.42 | |
| Tianmu Lake Town | 5.37 | 20.85 | 42.56 | 27.13 | 4.10 | |
| Daibu Town | 0.07 | 6.61 | 36.24 | 52.42 | 4.66 | |
Disclaimer/Publisher’s Note: The statements, opinions and data contained in all publications are solely those of the individual author(s) and contributor(s) and not of MDPI and/or the editor(s). MDPI and/or the editor(s) disclaim responsibility for any injury to people or property resulting from any ideas, methods, instructions or products referred to in the content. |
© 2023 by the authors. Licensee MDPI, Basel, Switzerland. This article is an open access article distributed under the terms and conditions of the Creative Commons Attribution (CC BY) license (http://creativecommons.org/licenses/by/4.0/).
Copyright: This open access article is published under a Creative Commons CC BY 4.0 license, which permit the free download, distribution, and reuse, provided that the author and preprint are cited in any reuse.


