1. Introduction
Defects that occur during the design, development, or manufacturing phases due to process imperfections or those introduced during actual use can compromise a device's durability and functionality, because it will be unfit for its intended purpose and leads to the failure. Consequently, the existence of defects can result in severe consequences, such as product loss, a shorter lifespan for the component, environmental harm, repair expenses, and increased costs. Detecting these defects not only prevents failures in critical components during their use but also holds the potential to restore and repair these components by addressing the defects. The widely used Non-destructive Testing and Evaluation (NDT&E) techniques are Magnetic Particle Testing (MPT), Electromagnetic Testing (ET), Visual Inspection Testing (VT), Acoustic Emission Testing (AET), Thermal/InfraRed Imaging (IRI), Ultrasonic Testing (UT), Radiographic Testing (RT), Dye Penetrant Testing (PT) and. Depending on their complexity, these methods are often categorized and classified as either classical or innovative solutions. Non-Destructive Testing and Evaluation (NDT&E) typically serve as necessity for various purposes such as qualifying raw materials before processing, inspecting sub-components, finished products during and after manufacturing and maintenance phases.
In recent years, InfraRed Imaging (IRI) for Thermal NDT&E (TNDT&E) has gained immense popularity for its use for inspecting and characterizing a wide range of industrial and biomedical materials [
1,
2,
3,
4,
5,
6]. This approach revolves around mapping the temperature distribution across the test sample to identify hidden irregularities, assess their properties, and map stress patterns [
6,
7,
8,
9,
10]. Due to substantial capabilities of IRI, diverse applications found in various industries, including aeronautics, civil engineering, electrical engineering, mechanical engineering, automotive, and biomedical [
11,
12,
13,
14,
15].
Among the various Non-Destructive Testing and Evaluation (NDT&E) techniques, Infrared Imaging (IRI) has gained recognition as a dependable inspection method. This is because it offers, non-invasive, whole-region, rapid, safe, and non-contact inspection capabilities. IRI can be applied in either a passive or an active mode for NDT&E purposes [
14,
15,
16,
17,
18,
19,
20].
Passive infrared imaging involves capturing the inherent heat distribution of a test object without any external stimulation. This method is effective when the object naturally exhibits significant thermal variations. It finds applications in various scenarios such as detecting heat loss in structures, monitoring corrosion in pipe walls within thermal power plants, measuring power dissipation in electronic chips, identifying building seepage issues and many more. But the biggest disadvantage of this passive mode is its inability to provide clear thermal contrast for deeper subsurface anomalies and its limited capacity for quantitative analysis. These constraints restrict its applicability in certain situations.
Whereas Active thermal imaging [
20,
21,
22,
23,
24,
25,
26] employs a deliberate and controlled heat stimulus to introduce thermal energy applied to the test specimen which have predefined characteristics like amplitude, phase and bandwidth. To reveal subsurface deviations that are located deeper and have relatively smaller lateral dimensions, various signal, image, and video processing methods are applied to the temporal thermal response data recorded from the test object.
Compared to the Passive approach, Active thermography is preferred because it offers substantial enhancements in thermal contrast, particularly when it comes to subsurface anomalies. Additionally, it provides quantification capabilities and improved ability to analyze deeper layers within the test object, making it a valuable technique for inspections that require thorough depth analysis.
2. Active Thermal Infrared Imaging Techniques
In the realm of active infrared imaging methods for TNDT&E applications, three of the most employed techniques are Pulse Thermography (PT), Lock-in Thermography (LT), and Pulsed Phase Thermography (PPT) [
27,
28,
29,
30,
31,
32,
33].
PT finds out as the quickest and simplest method compared to other thermal non-destructive testing and evaluation (NDT&E) techniques [
1,
3,
5]. In PT, a brief and intense heat stimulus with high peak power is applied to the test specimen, and its temporal thermal distribution is typically observed during the cooling phase of the sample. The presence of defects leads to differences in thermal properties between the defective and non-defective areas, creating thermal contrast on the test object. However, there are limitations to the applicability of PT. It requires high peak power heat sources to generate the necessary high-frequency thermal waves for detecting subsurface defects with sufficient resolution. Additionally, challenges related to inconsistent emissivity and unequal heating on the object can significantly impact the temperature distribution over the test sample, further restricting its use.
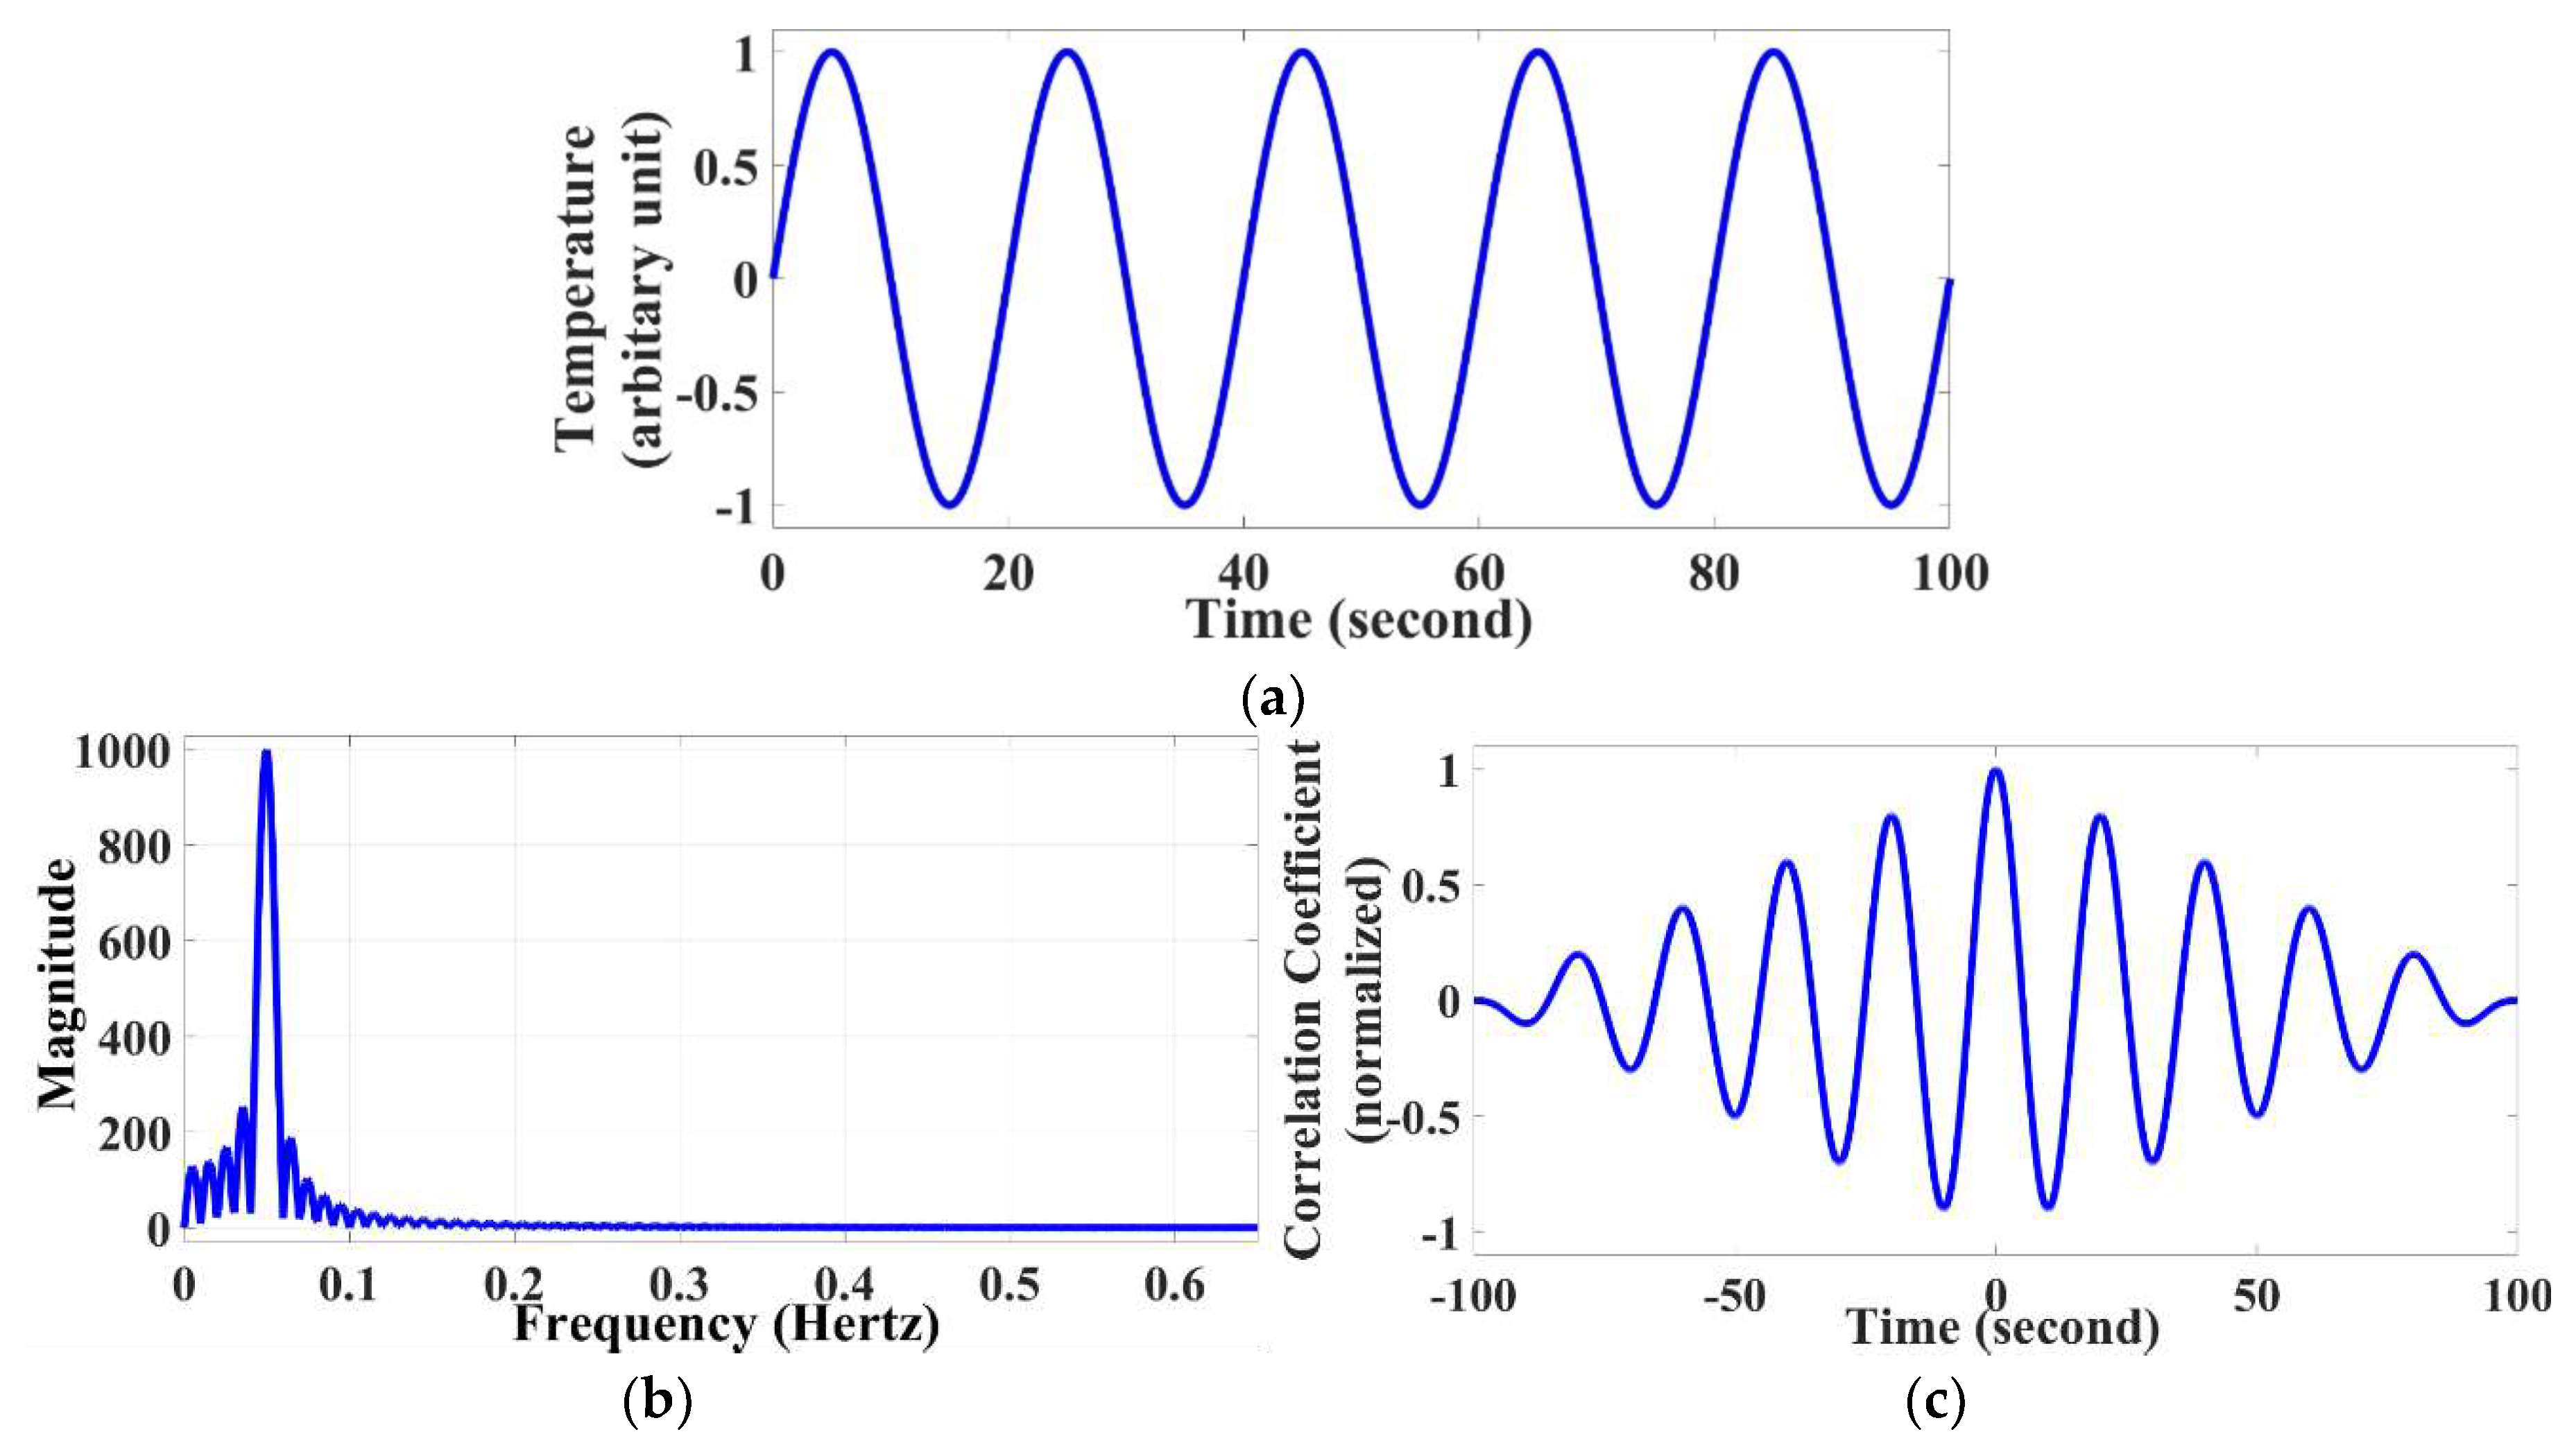
Lock-in Thermography (LT) takes a continuous, single-frequency heat source with relatively low to medium peak power when applied to the test object [
2]. This heat source generates and sends thermal waves into the test object. Subsequently, phase analysis is conducted on the thermal response data obtained (as illustrated in
Figure 1(a)) to uncover subsurface information about the test object. This phase analysis can be carried out using approaches such as Fourier transform or phase shifting. This makes LT a time-consuming approach to resolve the defects located at various depths of different lateral dimensions due to mono-frequency sinusoidal thermal distribution (
Figure 1(b)). The autocorrelation of the mean removed thermal distribution of the
Figure 1(a) is shown in
Figure 1(c).
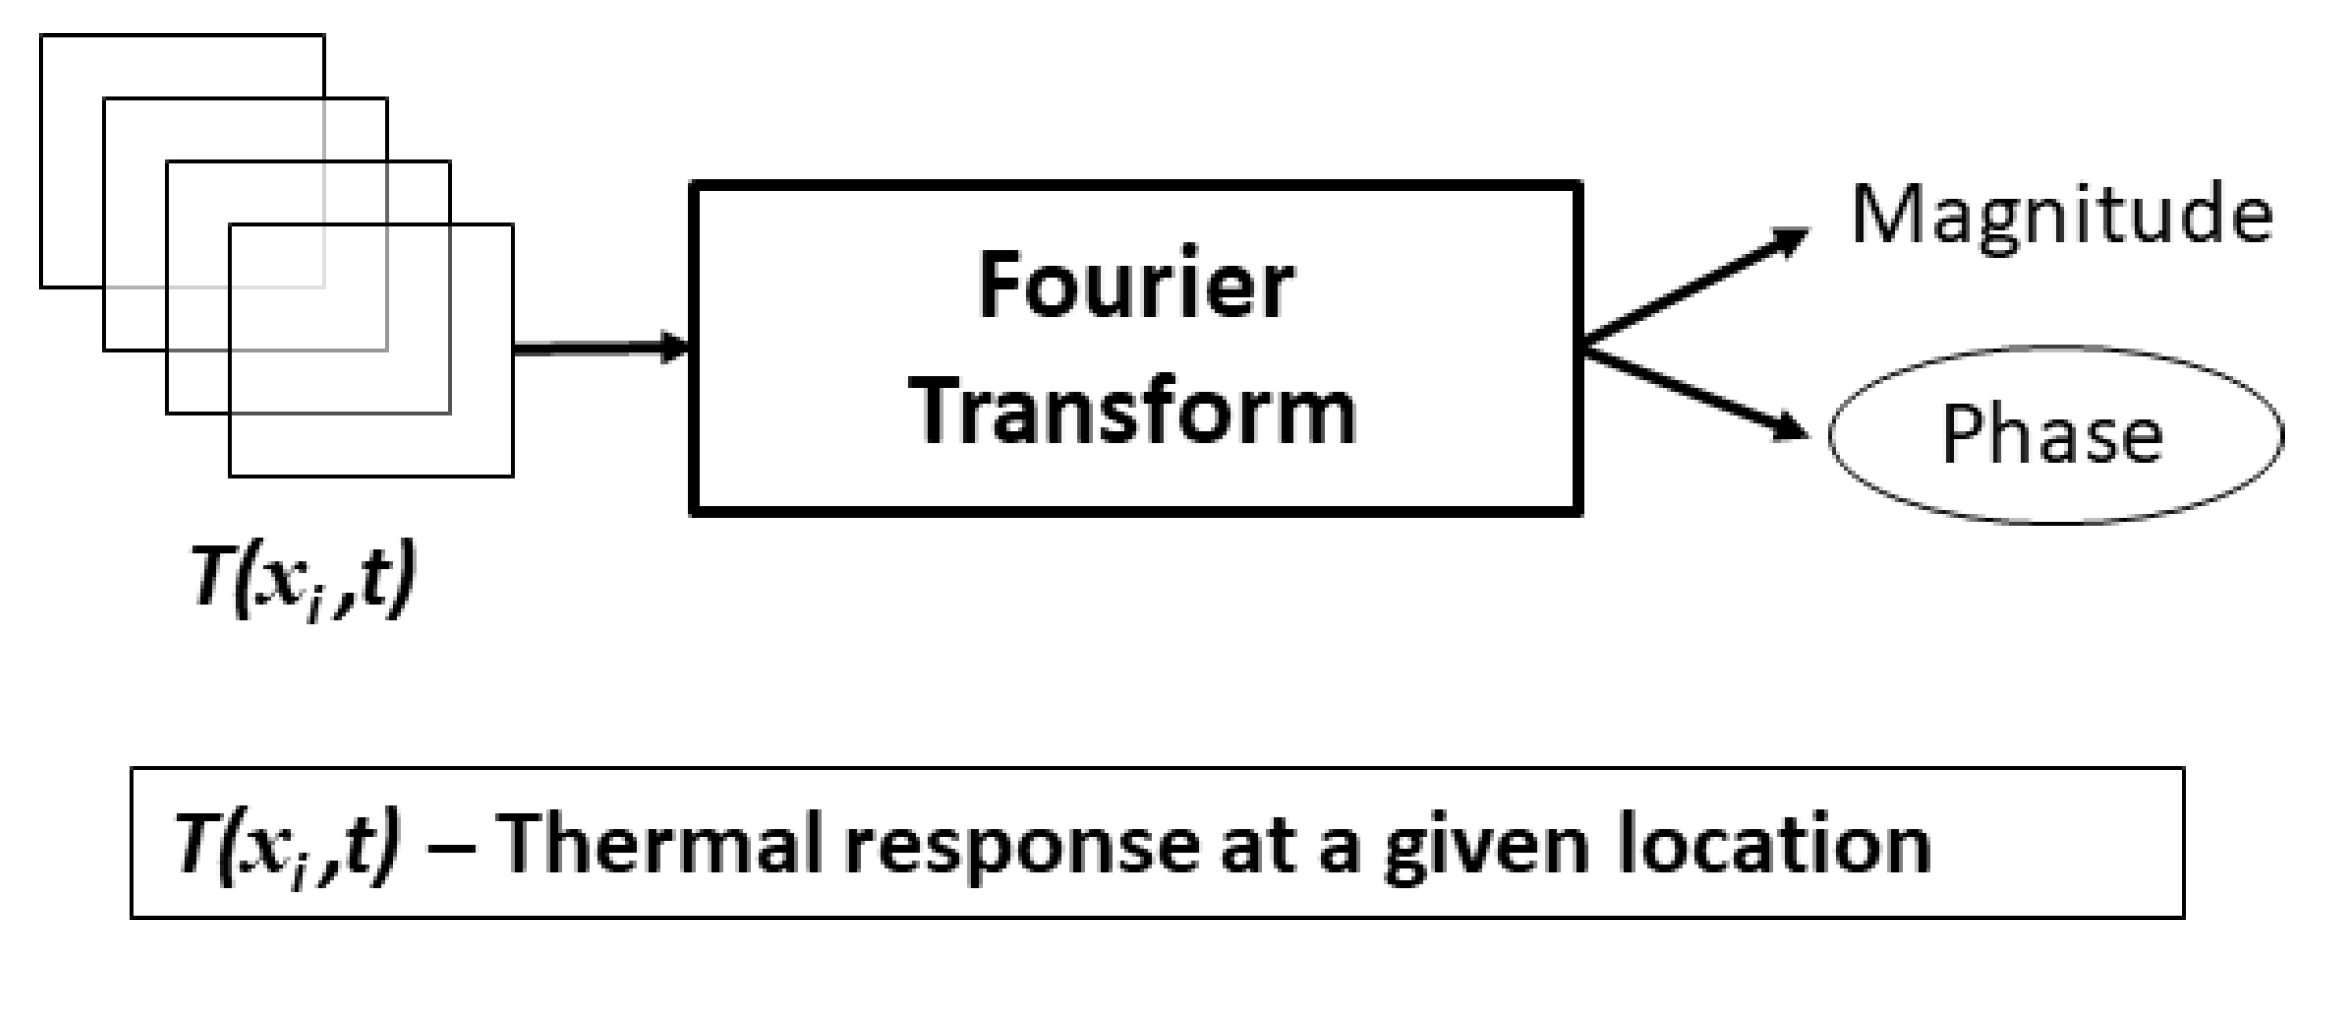
Pulsed Phase Thermography (PPT) shares similarities with Pulse Thermography (PT) in terms of the experimental setup. However, its analysis differs as it involves the application of Fourier Transform (FT) applied to the temporal thermal data recorded for each pixel during the cooling phase [
4,
5]. PPT combines the benefits of the wide bandwidth found in PT with the advantages of phase-based analysis seen in LT.
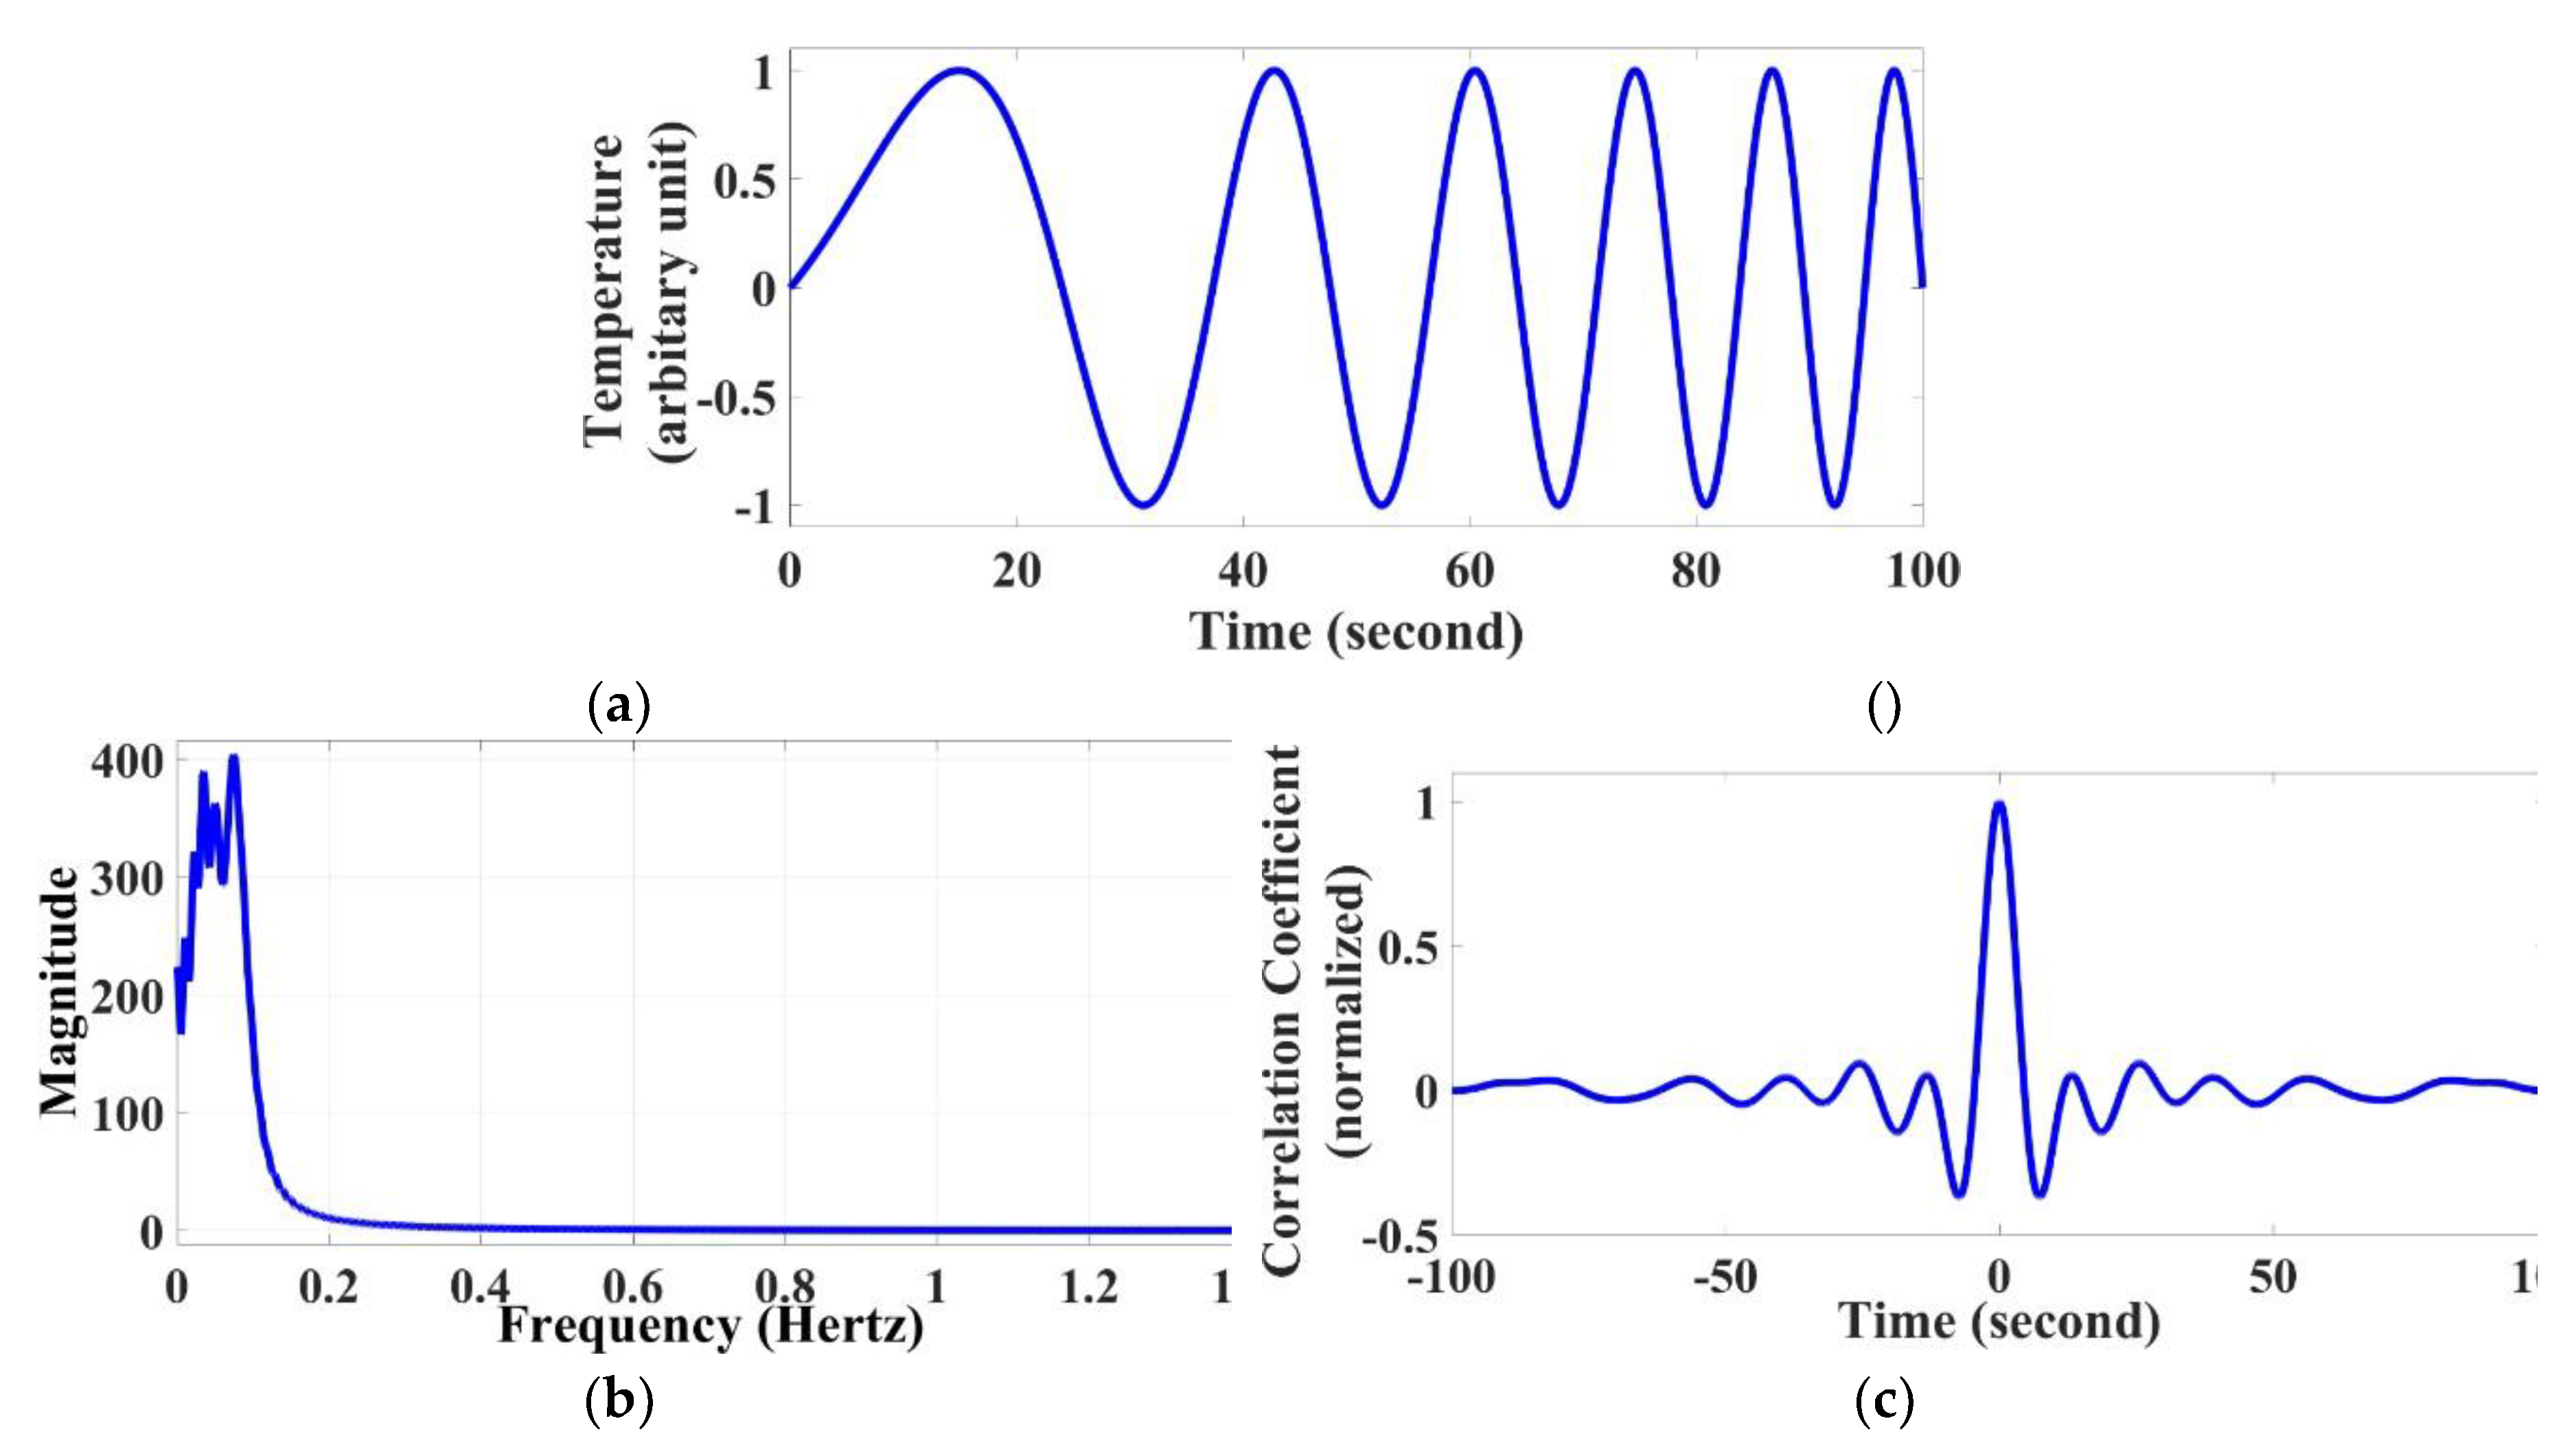
Frequency Modulated Thermal Wave Imaging (FMTWI) [
16,
18,
21], probes thermal waves into the test specimen within a desired band of frequencies in a limited time determined by thermo-physical properties of the sample and its dimensions, as depicted in
Figure 3(a). The frequency and its auto-correlation responses are illustrated in
Figure 3(b) and
Figure 3(c), respectively. FMTWI stands out as an economical and feasible experimental technique that addresses the restrictions related to the high peak power heat sources needed for the pulse-based approaches (PT and PPT), as well as the need for repetitive experimentation in LT to detect defects at various depths with sufficient resolution. The ability to sweep the desired band of thermal wave frequencies ensures the complete depth scanning of the specimen under examination in one run, even when using low peak power heat sources. This makes FMTWI a practical and efficient solution for inspecting objects with varying depths and spatial dimensions.
Figure 1.
Illustrates (a) mean zero temporal thermal distribution for an incident sinusoidal heat flux onto the test specimen (b) frequency response (of
Figure 1(a)) and (c) auto-correlation response of the
Figure 1(a).
Figure 1.
Illustrates (a) mean zero temporal thermal distribution for an incident sinusoidal heat flux onto the test specimen (b) frequency response (of
Figure 1(a)) and (c) auto-correlation response of the
Figure 1(a).
Figure 2.
Illustrates (a) thermal response over the object for an incident pulse shaped heat flux on to the test specimen (b) Frequency response (of
Figure 2(a)) and (c) the Auto-correlation response of the
Figure 2(a).
Figure 2.
Illustrates (a) thermal response over the object for an incident pulse shaped heat flux on to the test specimen (b) Frequency response (of
Figure 2(a)) and (c) the Auto-correlation response of the
Figure 2(a).
Figure 3.
Illustrates (a). an aperiodic linear frequency modulated thermal response for an incident frequency modulated heat flux with frequencies varying from 0.01 Hz-0.1 Hz for duration of 100 s (b) frequency response of
Figure 3(a) and (c) the auto-correlation response of the
Figure 3(a).
Figure 3.
Illustrates (a). an aperiodic linear frequency modulated thermal response for an incident frequency modulated heat flux with frequencies varying from 0.01 Hz-0.1 Hz for duration of 100 s (b) frequency response of
Figure 3(a) and (c) the auto-correlation response of the
Figure 3(a).
Regarding post-processing methods, the commonly employed traditional frequency domain phase-based analysis distributes the applied energy onto the examined sample into distinct frequency components [
23,
24]. However, this approach has limitations in terms of resolution and sensitivity for detecting subsurface defects using phase information from a specific frequency component, as depicted in
Figure 4. A more effective alternative is the matched-filter based time-domain analysis, which includes correlation coefficient and phase analysis [
24,
25] as illustrated in
Figure 5, outperforms the conventional method by providing improved results for detecting subsurface defects.
In matched filter-based time-domain data processing methods, the energy supplied within a specified frequency band during a predefined time is condensed into a narrow time duration, rather than being spread out among individual frequency components, as is the case with frequency domain analysis. These matched filter-based time-domain approaches, which include pulse-compression based correlation coefficient and time domain phase analysis, have shown promising results for defect detection when compared to the classical post processing approaches. The time domain phase and pulse compression based correlation co-efficient methods have been investigated to find their potential in detecting the defects.
The matched filter-based approach discussed in this context involves correlation-based post-processing data analysis. It offers several advantages, such as being resistant to multiplicative noises that can occur during experimentation from factors like inconsistent illumination and variations in emissivity over the sample surface. Also, it is robust against additive noise introduced during the detection process as well as thermal noise.
3. Results and Discussions
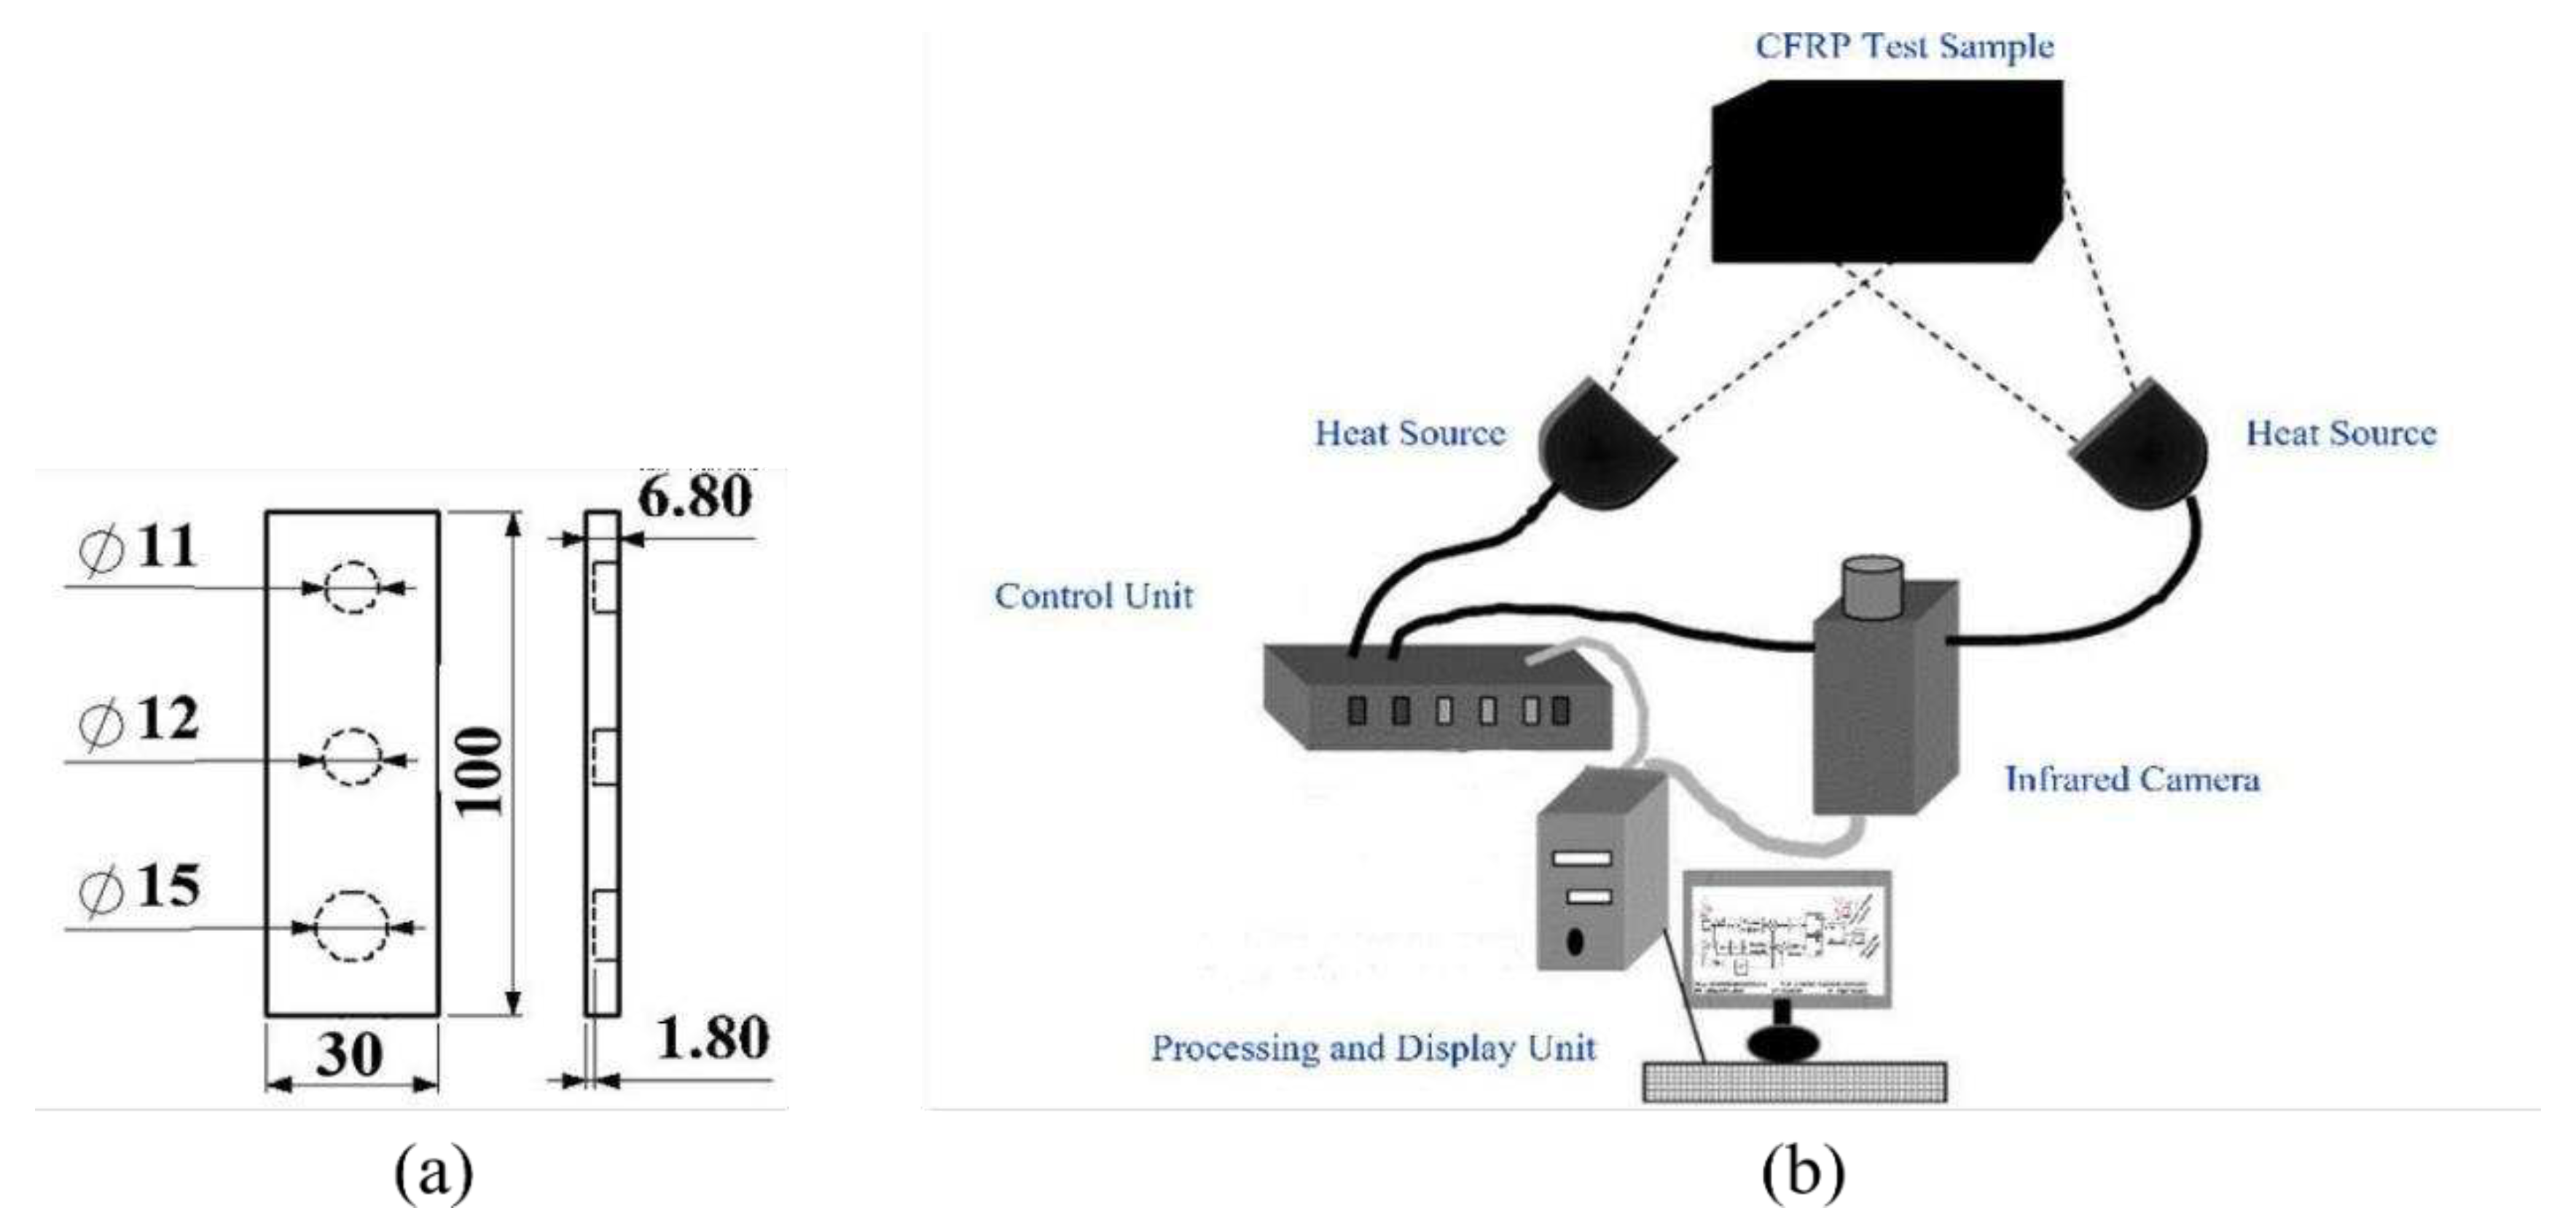
Experiments using LT, PPT, and FMTWI have been conducted on a Carbon Fibre Reinforced Polymer (CFRP) test specimen with blind holes as shown in
Figure 6(a), to investigate the defect detection capabilities of commonly used active infrared imaging techniques and their associated post-processing approaches. Further, the frequency (phase) and time domain (correlation coefficient and phase) based post-processing schemes have been adopted. PT has been performed by using two halogen lamps each 2 KW peak power with a duration of 12 s. Moreover, post-processing strategies based on the frequency and time domain (phase and correlation coefficient) have been implemented. PT has been performed by using two halogen lamps each 2 KW peak power with a duration of 12 s. The temporal temperature distribution is performed for 100 s using a capturing frequency of 20 Hz. In contrast, LT and FMTWI were performed for 100 s using a 0.05 Hz modulation frequency and a 0.01 Hz to 0.1 Hz sweep frequency, respectively, while maintaining the same capturing frequency (20 Hz) as PPT. Two 1 KW peak power halogen bulbs have been used to achieve this. The acquired zero mean experimental thermal responses have further been subjected to frequency domain (stack of phase image sequence) and time-domain based data processing (stack of correlation coefficient and phase image sequence). Reconstructed stacks of thermograms using the suggested frequency and time domain data processing techniques are displayed in
Figure 7,
Figure 8,
Figure 9,
Figure 10,
Figure 11,
Figure 12,
Figure 13,
Figure 14 and
Figure 15. Experiments for the LT (
Figure 7,
Figure 8 and
Figure 9), PPT (
Figure 10,
Figure 11 and
Figure 12), and FMTWI (
Figure 13,
Figure 14 and
Figure 15) were used to gather the results.
The analysis of thermal stacks reconstructed from the lock-in thermographic (LT) results reveals several noteworthy observations such as the time domain phase images (
Figure 8) show the better spatial thermal contrast than that of the widely used frequency domain phase approach
Figure 7). Further it is clear from the thermal images reconstructed from the correlation coefficient (
Figure 9) approach on LT data at different cross-sectional areas failed to provide enough contrast to visualize the blind holes. This is due to the sinusoidal thermal excitation of LT, as shown in
Figure 9(c). Furthermore, it can be shown from the thermal pictures of stacks that were reconstructed for various cross-sectional views from the obtained PPT thermographic data that the time domain phase images (
Figure 11) have better spatial thermal contrast than the frequency domain phase method (
Figure 10), which is often employed. Additionally, it is evident from the thermal stacks that were rebuilt using the correlation coefficient method (
Figure 12) and PPT data at various cross-sectional regions that insufficient contrast was provided to enable the visualization of the blind holes. This is due to the pulsed thermal excitation of PPT, which is not a pulse compression favourable excitation scheme. However, compared to the traditional frequency domain phase techniques (
Figure 13), the processed data of FMTWI with correlation-based data processing shows superior depth as well as spatial resolvability (
Figure 15). Nevertheless, the obtained stack from the time domain phase images still provides better spatial contrast to detect the hidden sub-surface defects as shown in
Figure 14.
4. Conclusions
This discussion has focused on the application of widely used thermal imaging modalities (LT, PPT, and FMTWI) and their associated post-processing methods for non-destructive testing and evaluation of Carbon Fiber Reinforced Polymer (CFRP) specimens containing blind holes as defects. Also, the superior sub-surface anomaly visualization capabilities offered by phase images retrieved from the time-domain analysis over conventional obtained phase images from the frequency-domain based analysis has been highlighted in the results. It also emphasizes that the best defect identification is achieved with a correlation coefficient-based post-processing approach, which is suitable for excitation schemes that benefit from pulse compression (such frequency-modulated incoming heat flux over the sample). This method provides improved depth resolvability together with enhanced spatial contrast, making it a useful tool for detecting flaws in CFRP specimens.
Consent for publication
All the authors of this manuscript provided their consent to the publisher to publish the work.
Availability of data and material
The results presented in this manuscript have no associated data.
Funding
No funding available for this work is presented in this manuscript.
Ethics approval and consent to participate statement
Not Applicable
Acknowledgements
Authors acknowledges for the support provided through his constructive suggestions and continuous encouragement by Mr. Mulaveesala Venkata Jagannadharao, Chukkavanipalem, Dharmavaram, Vizaianagaram, Andhra Pradesh, India.
Competing interests
The authors declare that they have no known competing financial interests or personal relationships that could have appeared to influence the work reported in this paper.
References
- Meola, C.; Carlomagno, G.M.; Giorleo, L. The use of infrared thermography for materials characterization. J. Mater. Process. Technol. 2004, 155-156, 1132–1137. [Google Scholar] [CrossRef]
- Gleiter, A.; Riegert, G.; Zweschper, T.; Busse, G. Ultrasound lock-in thermography for advanced depth resolved defect selective imaging. Insight - Non-Destructive Test. Cond. Monit. 2007, 49, 272–274. [Google Scholar] [CrossRef]
- Maierhofer, C.; Myrach, P.; Reischel, M.; Steinfurth, H.; Röllig, M.; Kunert, M. Characterizing damage in CFRP structures using flash thermography in reflection and transmission configurations. Compos. Part B: Eng. 2014, 57, 35–46. [Google Scholar] [CrossRef]
- Maldague, X.; Marinetti, S. Pulse phase infrared thermography. J. Appl. Phys. 1996, 79, 2694–2698. [Google Scholar] [CrossRef]
- Ibarra-Castanedo, C.; Sfarra, S.; Ambrosini, D.; Paoletti, D.; Bendada, A.; Maldague, X. Diagnostics of panel paintings using holographic interferometry and pulsed thermography. Quant. Infrared Thermogr. J. 2010, 7. [Google Scholar] [CrossRef]
- Mercuri, F.; Paoloni, S.; Orazi, N.; Cicero, C.; Zammit, U. Pulsed infrared thermography applied to quantitative characterization of the structure and the casting faults of the Capitoline She Wolf. Appl. Phys. A: Mater. Sci. Process. 2017, 123, 327. [Google Scholar] [CrossRef]
- Hedayatrasa, S.; Poelman, G.; Segers, J.; Van Paepegem, W.; Kersemans, M. Novel discrete frequency-phase modulated excitation waveform for enhanced depth resolvability of thermal wave radar. Mech. Syst. Signal Process. 2019, 132, 512–522. [Google Scholar] [CrossRef]
- Xu, D.; Chen, W.; Liu, P. Enhanced electromagnetic interference shielding and mechanical properties of segregated polymer/carbon nanotube composite via selective microwave sintering. Compos. Sci. Technol. 2020, 199, 108355. [Google Scholar] [CrossRef]
- Shi, Q.; Liu, J.; Liu, W.; Wang, F.; Wang, Y. Barker-coded modulation laser thermography for CFRP laminates delamination detection. Infrared Phys. Technol. 2019, 98, 55–61. [Google Scholar] [CrossRef]
- Dass, S.; Siddiqui, J.A.; Mulaveesala, R. Effectiveness of Biomaterial Coating on Bone Density Diagnosis Using Modulated Thermal Wave Imaging: A Numerical Study. Russ. J. Nondestruct. Test. 2022, 58, 510–520. [Google Scholar] [CrossRef]
- Murali, K.; Rama Koti Reddy, D.V. Segmentation of Thermographic Sequences in Frequency Modulated Thermal Wave Imaging for NDE of GFRP. Trans. Nanjing Univ. Aeronaut. Astronaut. 2018, 35, 226–235. [Google Scholar]
- Yang, R.; He, Y. Optically and non-optically excited thermography for composites: A review. Infrared Phys. Technol. Corrigendum: Infrared Phys. Technol. 2016, 76, 259–260. 2016, 75, 26–50. [Google Scholar] [CrossRef]
- Kher, V.; Mulaveesala, D.R. Statistical Analysis of Defect Dection in Glass Fiber Reinforced Polymers Using Frequency Modulated Thermal Wave Imaging. Russ. J. Nondestruct. Test. 2022, 58, 405–410. [Google Scholar] [CrossRef]
- Rani, A.; Mulaveesala, R. Novel pulse compression favorable excitation schemes for infrared non-destructive testing and evaluation of glass fibre reinforced polymer materials. Compos. Struct. 2022, 286, 115338. [Google Scholar] [CrossRef]
- Tabatabaei, N.; Mandelis, A. Thermal-wave radar: A novel subsurface imaging modality with extended depth-resolution dynamic range. Rev. Sci. Instrum. 2009, 80, 034902. [Google Scholar] [CrossRef]
- Luo, Z.; Luo, H.; Wang, S.; Mao, F.; Yin, G.; Zhang, H. The photothermal wave field and high-resolution photothermal pulse compression thermography for ceramic/metal composite solids. Compos. Struct. 2022, 282. [Google Scholar] [CrossRef]
- Rani, A.; Mulaveesala, R. Frequency Modulated Thermal Wave Imaging for Infrared Non-destructive Testing of Mild Steel. Mapan-J. Metrol. Soc. India 2021, 36, 389–393. [Google Scholar] [CrossRef]
- Ahmad, J.; Akula, A.; Mulaveesala, R.; Sardana, H.K. Probability of Detecting the Deep Defects in Steel Sample Using Frequency Modulated Independent Component Thermography. IEEE Sens. J. 2021, 21, 11244–11252. [Google Scholar] [CrossRef]
- Dua, G.; Arora, V.; Mulaveesala, R. Defect Detection Capabilities of Pulse Compression Based Infrared Non-Destructive Testing and Evaluation. IEEE Sens. J. 2021, 21, 7940–7947. [Google Scholar] [CrossRef]
- Rani, A.; Mulaveesala, R. Depth resolved pulse compression favourable frequency modulated thermal wave imaging for quantitative characterization of glass fibre reinforced polymer. Infrared Phys. Technol. 2020, 110, 103441. [Google Scholar] [CrossRef]
- Kher, V.; Mulaveesala, R. Probability of defect detection in pulse compression favourable thermal excitation schemes for infra-red non-destructive testing. Electron. Lett. 2020, 56, 998–1000. [Google Scholar] [CrossRef]
- Siddiqui, J.A.; Patil, S.S.; Chouhan, S.; Wuriti, S.; Arora, V.; Mulaveesala, R. Efficient pulse compression favourable thermal excitation scheme for non-destructive testing using infrared thermography: A numerical study. Electron. Lett. 2020, 56, 1003–1005. [Google Scholar] [CrossRef]
- Gong, J.; Liu, J.; Qin, L.; Wang, Y. Investigation of carbon fiber reinforced polymer (CFRP) sheet with subsurface defects inspection using thermal-wave radar imaging (TWRI) based on the multi-transform technique. NDT E Int. 2014, 62, 130–136. [Google Scholar] [CrossRef]
- Rani, A.; Mulaveesala, R. Investigations on pulse compression favourable thermal imaging approaches for characterisation of glass fibre-reinforce polymers. Electron. Lett. 2020, 56, 995–998. [Google Scholar] [CrossRef]
- Sharma, A.; Mulaveesala, R.; Arora, V. Novel Analytical Approach for Estimation of Thermal Diffusivity and Effusivity for Detection of Osteoporosis. IEEE Sens. J. 2020, 20, 6046–6054. [Google Scholar] [CrossRef]
- Ahmad, J.; Akula, A.; Mulaveesala, R.; Sardana, H.K. Defect detection capabilities of independent component analysis for Barker coded thermal wave imaging. Infrared Phys. Technol. 2020, 104, 103118. [Google Scholar] [CrossRef]
- Kaur, K.; Mulaveesala, R. An efficient data processing approach for frequency modulated thermal wave imaging for inspection of steel material. Infrared Phys. Technol. 2019, 103. [Google Scholar] [CrossRef]
- Kher, V.; Mulaveesala, R. Probability of defect detection in pulse compression favourable frequency modulated thermal wave imaging. Electron. Lett. 2019, 55, 789–791. [Google Scholar] [CrossRef]
- Mulaveesala, R.; Arora, V.; Rani, A. Coded thermal wave imaging technique for infrared non-destructive testing and evaluation. Nondestruct. Test. Eval. 2019, 34, 243–253. [Google Scholar] [CrossRef]
- Ghali, V.S.; Jonnalagadda, N.; Mulaveesala, R. Three-dimensional pulse compression for infrared nondestructive testing. IEEE Sens. J. 2009, 9, 832–833. [Google Scholar] [CrossRef]
- Ghali, V.S.; Mulaveesala, R. Frequency modulated thermal wave imaging techniques for non-destructive testing. Insight-Non-Destr. Test. Cond. Monit. 2010, 52, 475–480. [Google Scholar] [CrossRef]
- Ghali, V.S.; Jonnalagadda, N.; Mulaveesala, R. Three-dimensional pulse compression for infrared nondestructive testing. IEEE Sens. J. 2009, 9, 832–833. [Google Scholar] [CrossRef]
- Mulaveesala, R.; Tuli, S. Digitized frequency modulated thermal wave imaging for nondestructive testing. Mater. Eval. 2005, 63, 1046–1050. [Google Scholar]
|
Disclaimer/Publisher’s Note: The statements, opinions and data contained in all publications are solely those of the individual author(s) and contributor(s) and not of MDPI and/or the editor(s). MDPI and/or the editor(s) disclaim responsibility for any injury to people or property resulting from any ideas, methods, instructions or products referred to in the content. |
© 2023 by the authors. Licensee MDPI, Basel, Switzerland. This article is an open access article distributed under the terms and conditions of the Creative Commons Attribution (CC BY) license (http://creativecommons.org/licenses/by/4.0/).


