Submitted:
23 October 2023
Posted:
25 October 2023
Read the latest preprint version here
Abstract
Keywords:
1. Introduction
2. Material and Methods
2.1. Experimental Data
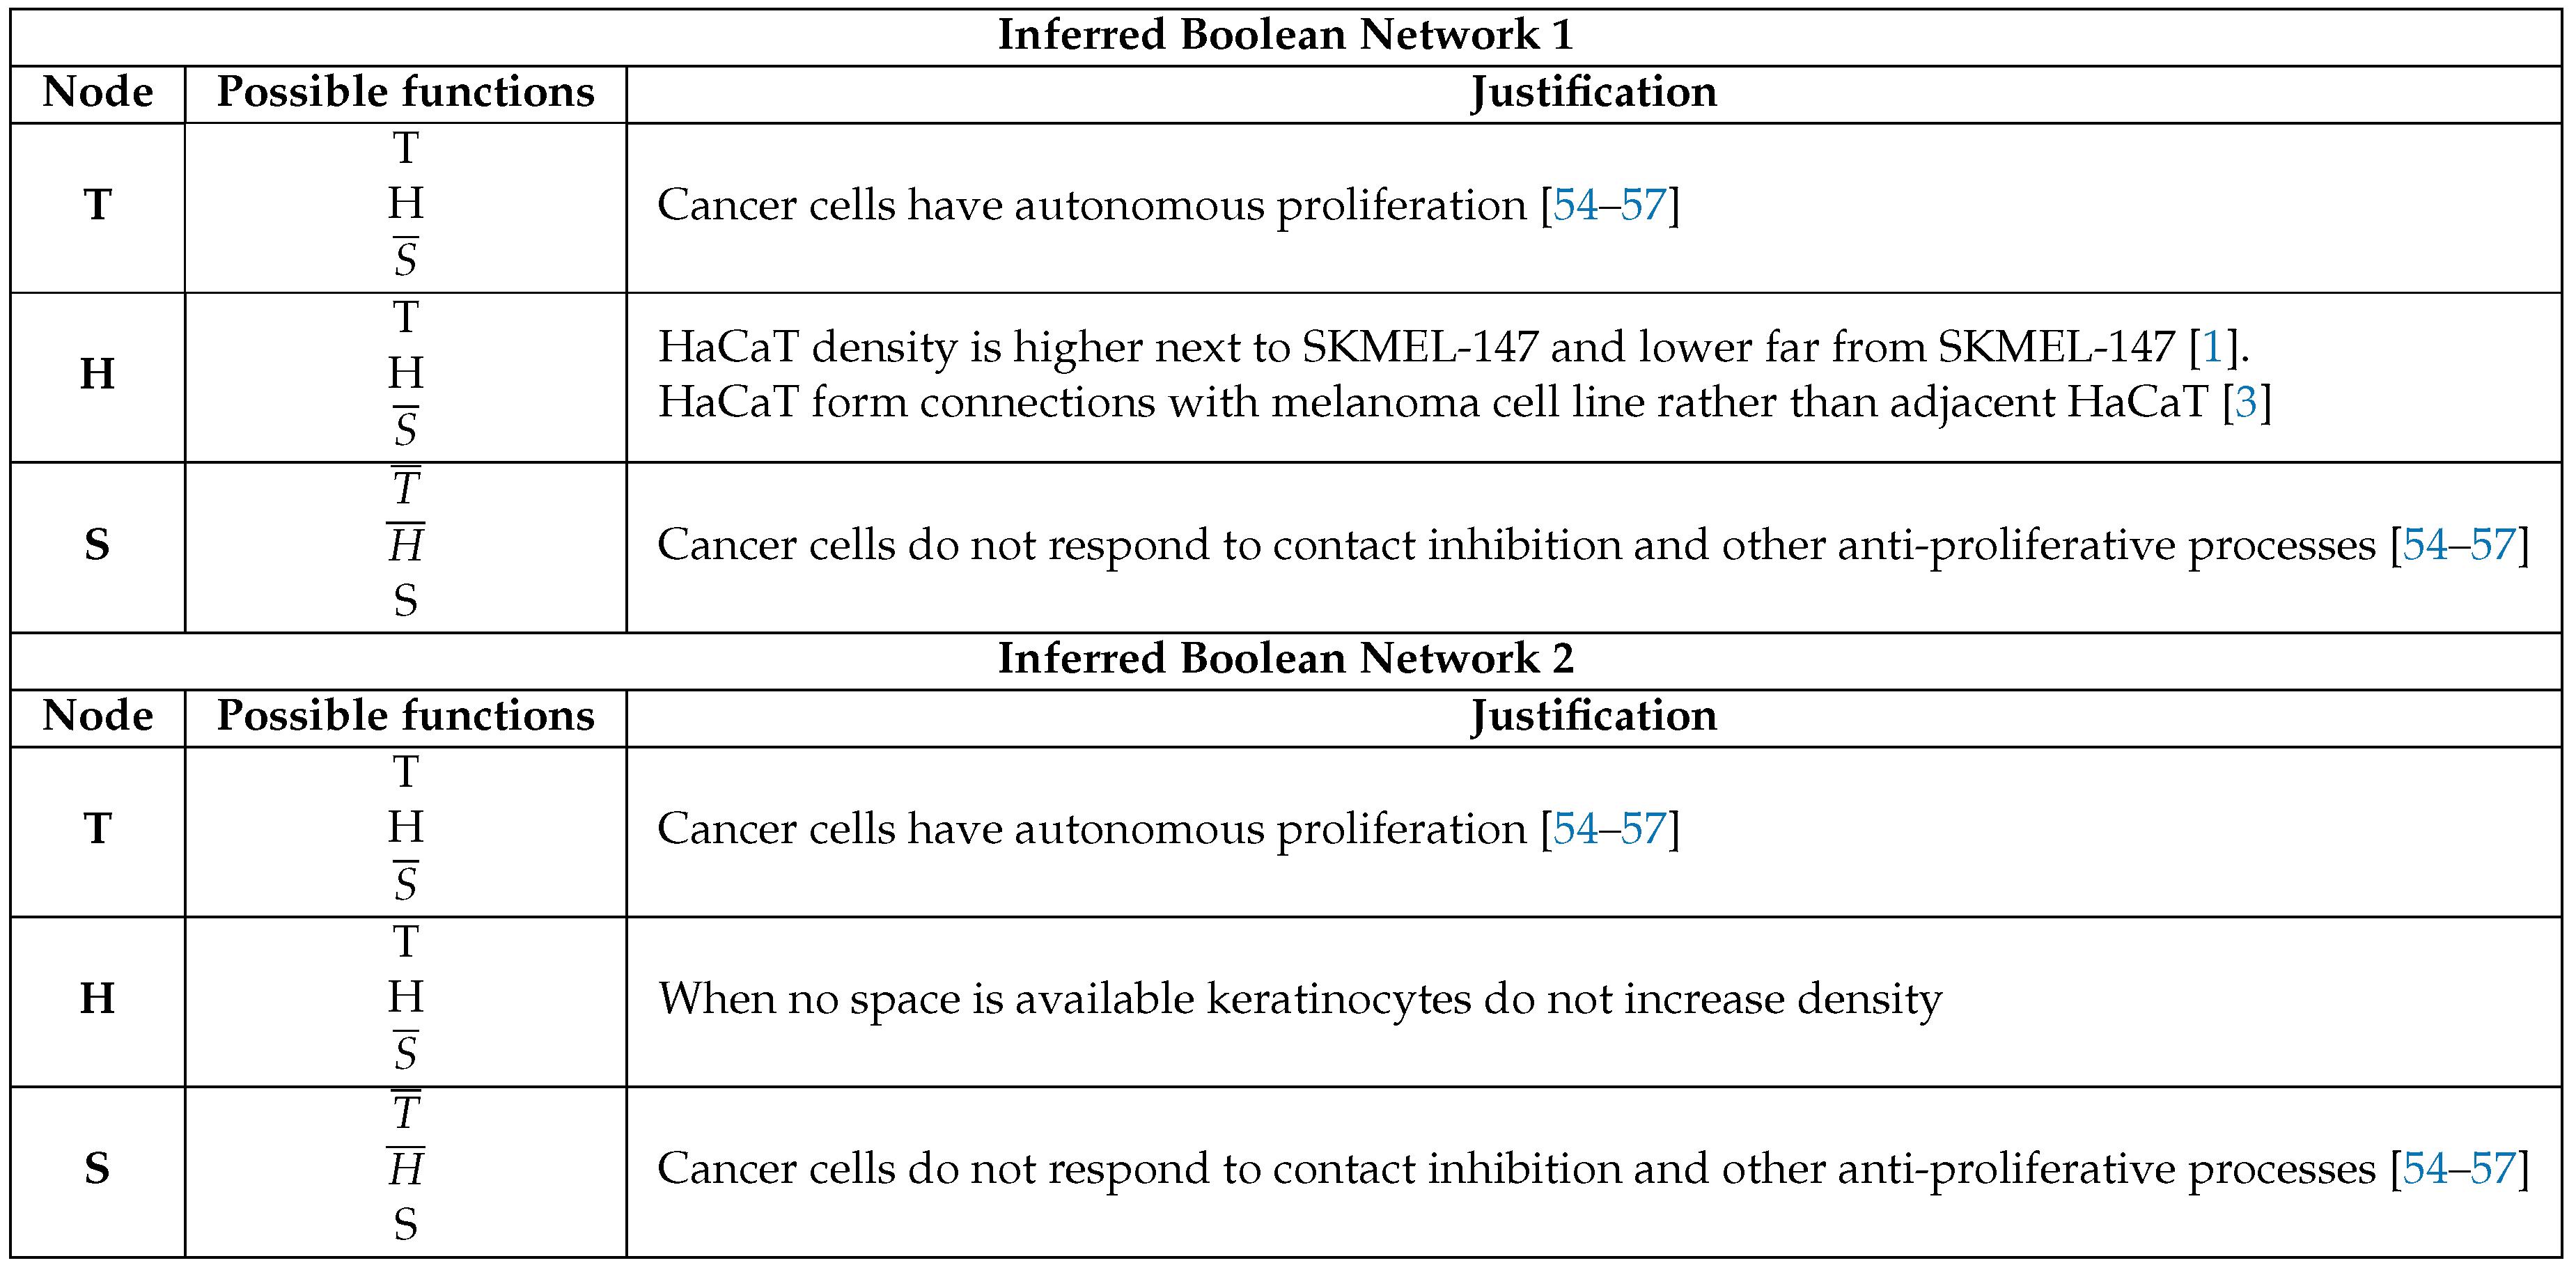
2.2. Boolean Network Inference
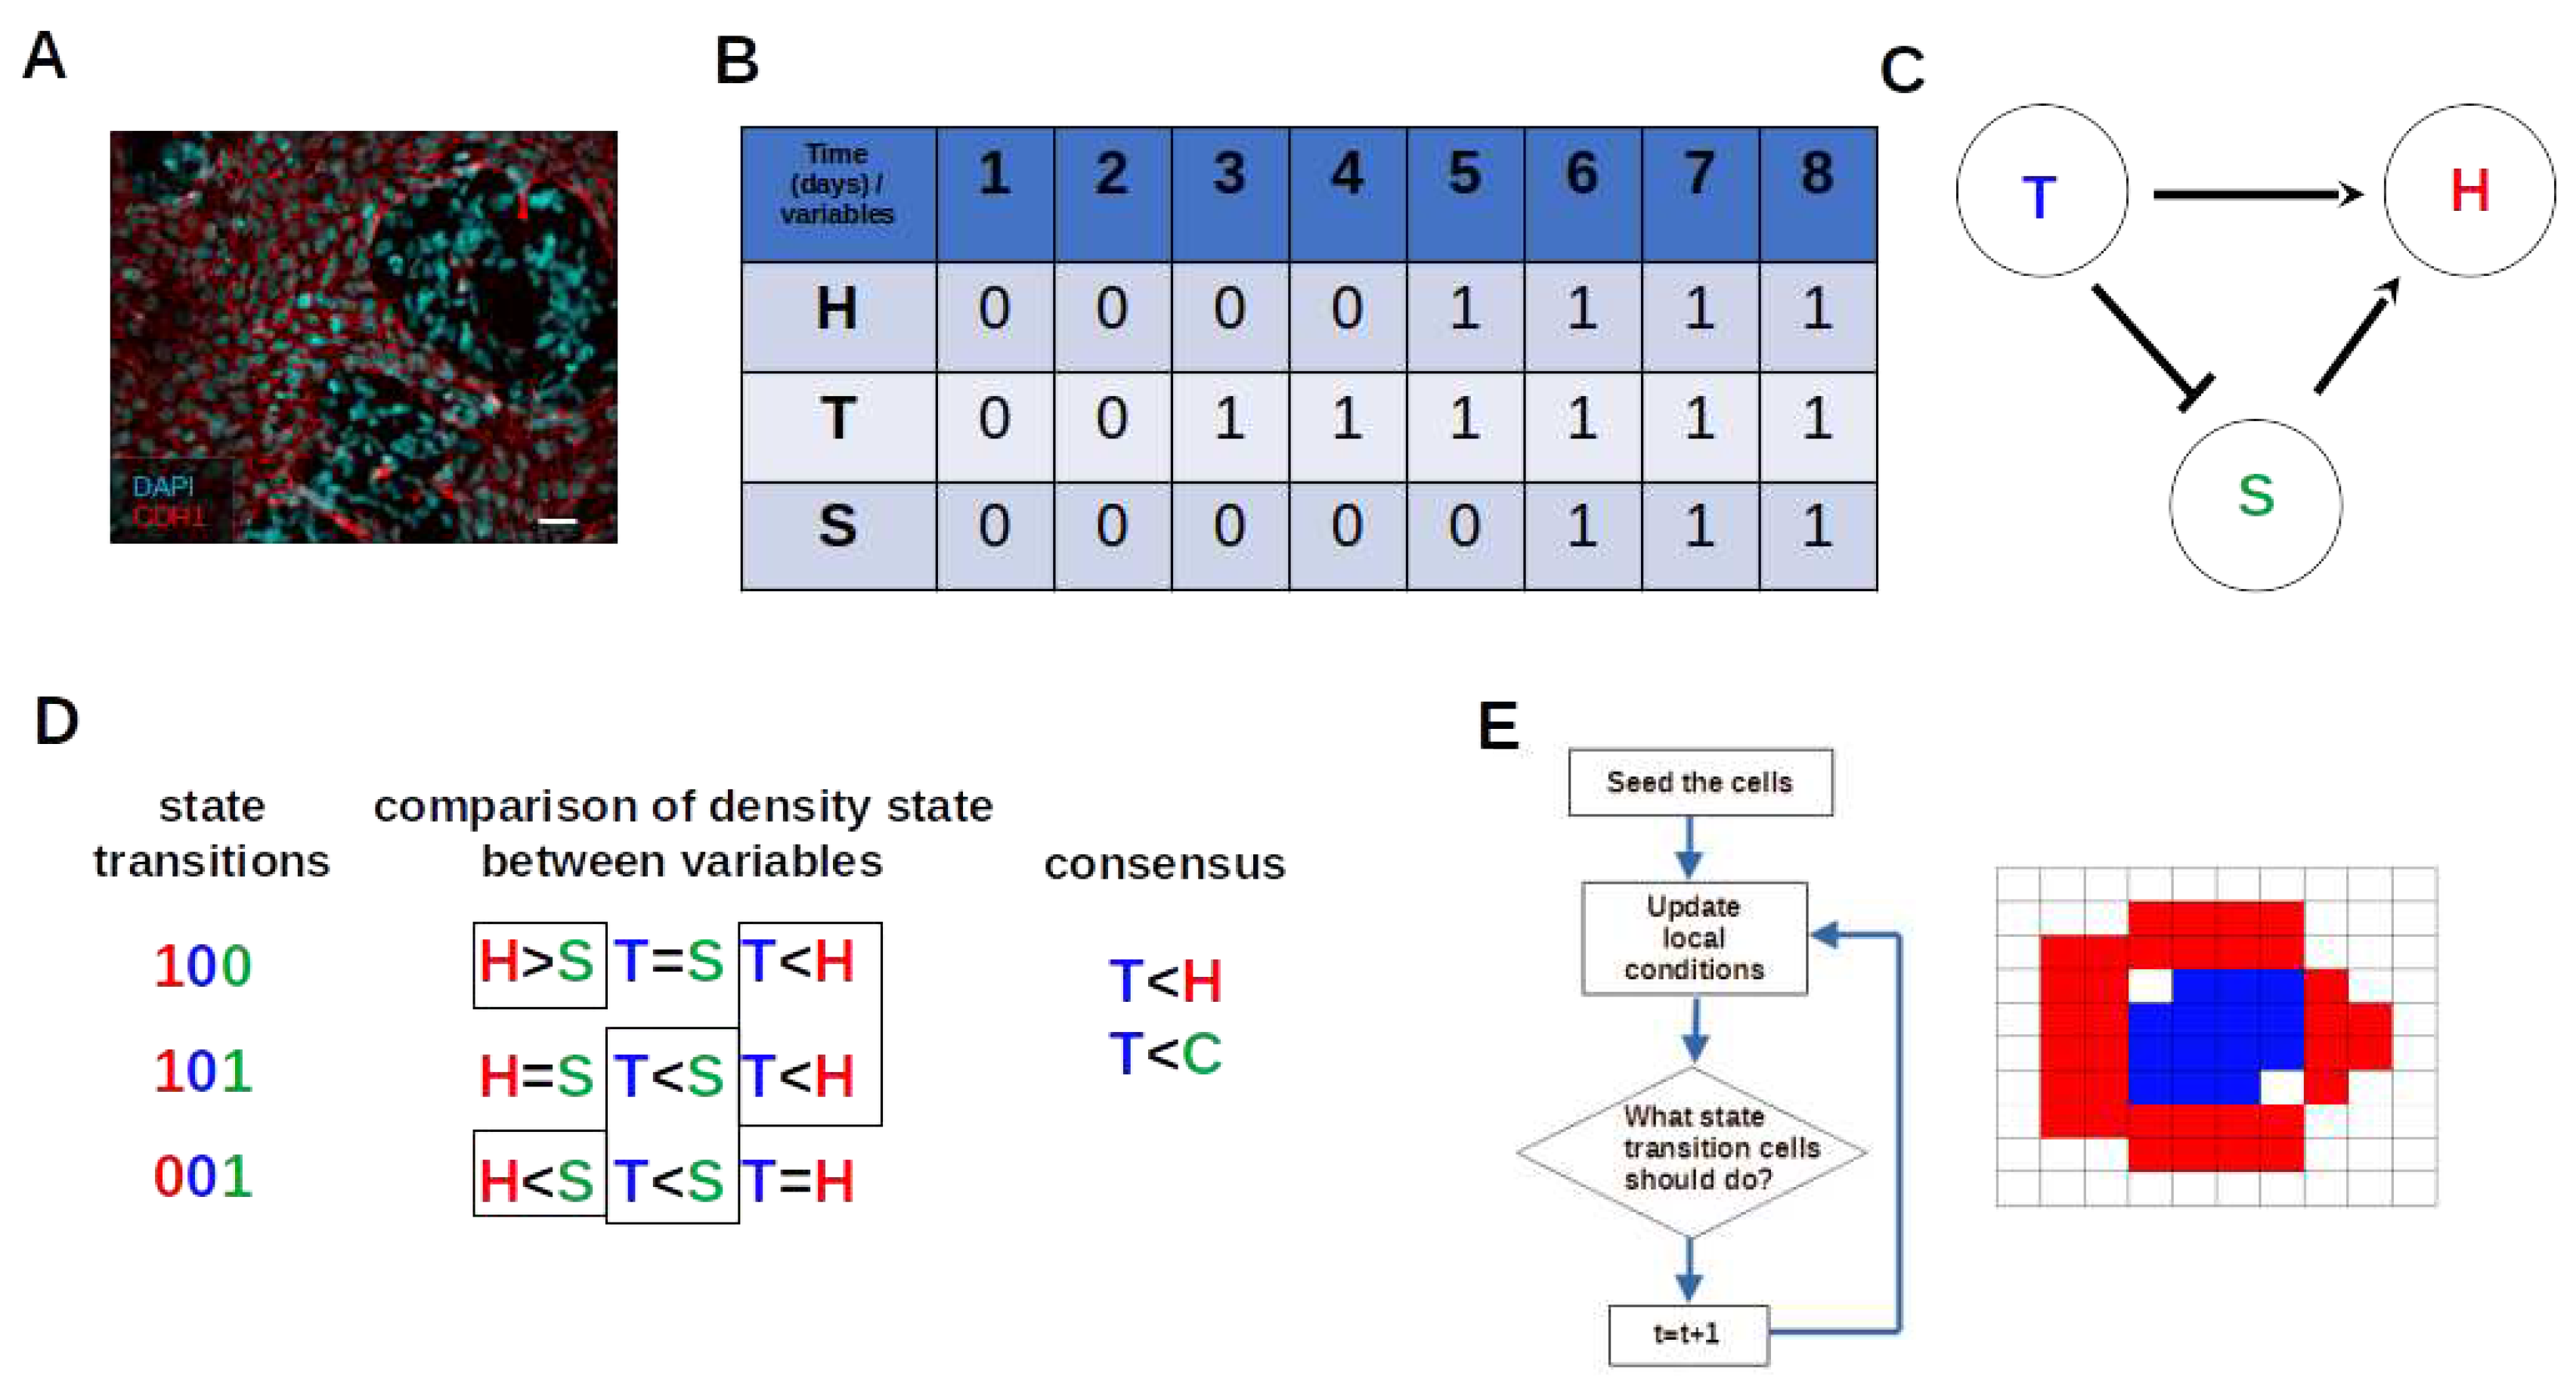
2.3. Estimating the Cellular Automata Dynamic Rules from BN Basins through Consensus of State Transition Comparison
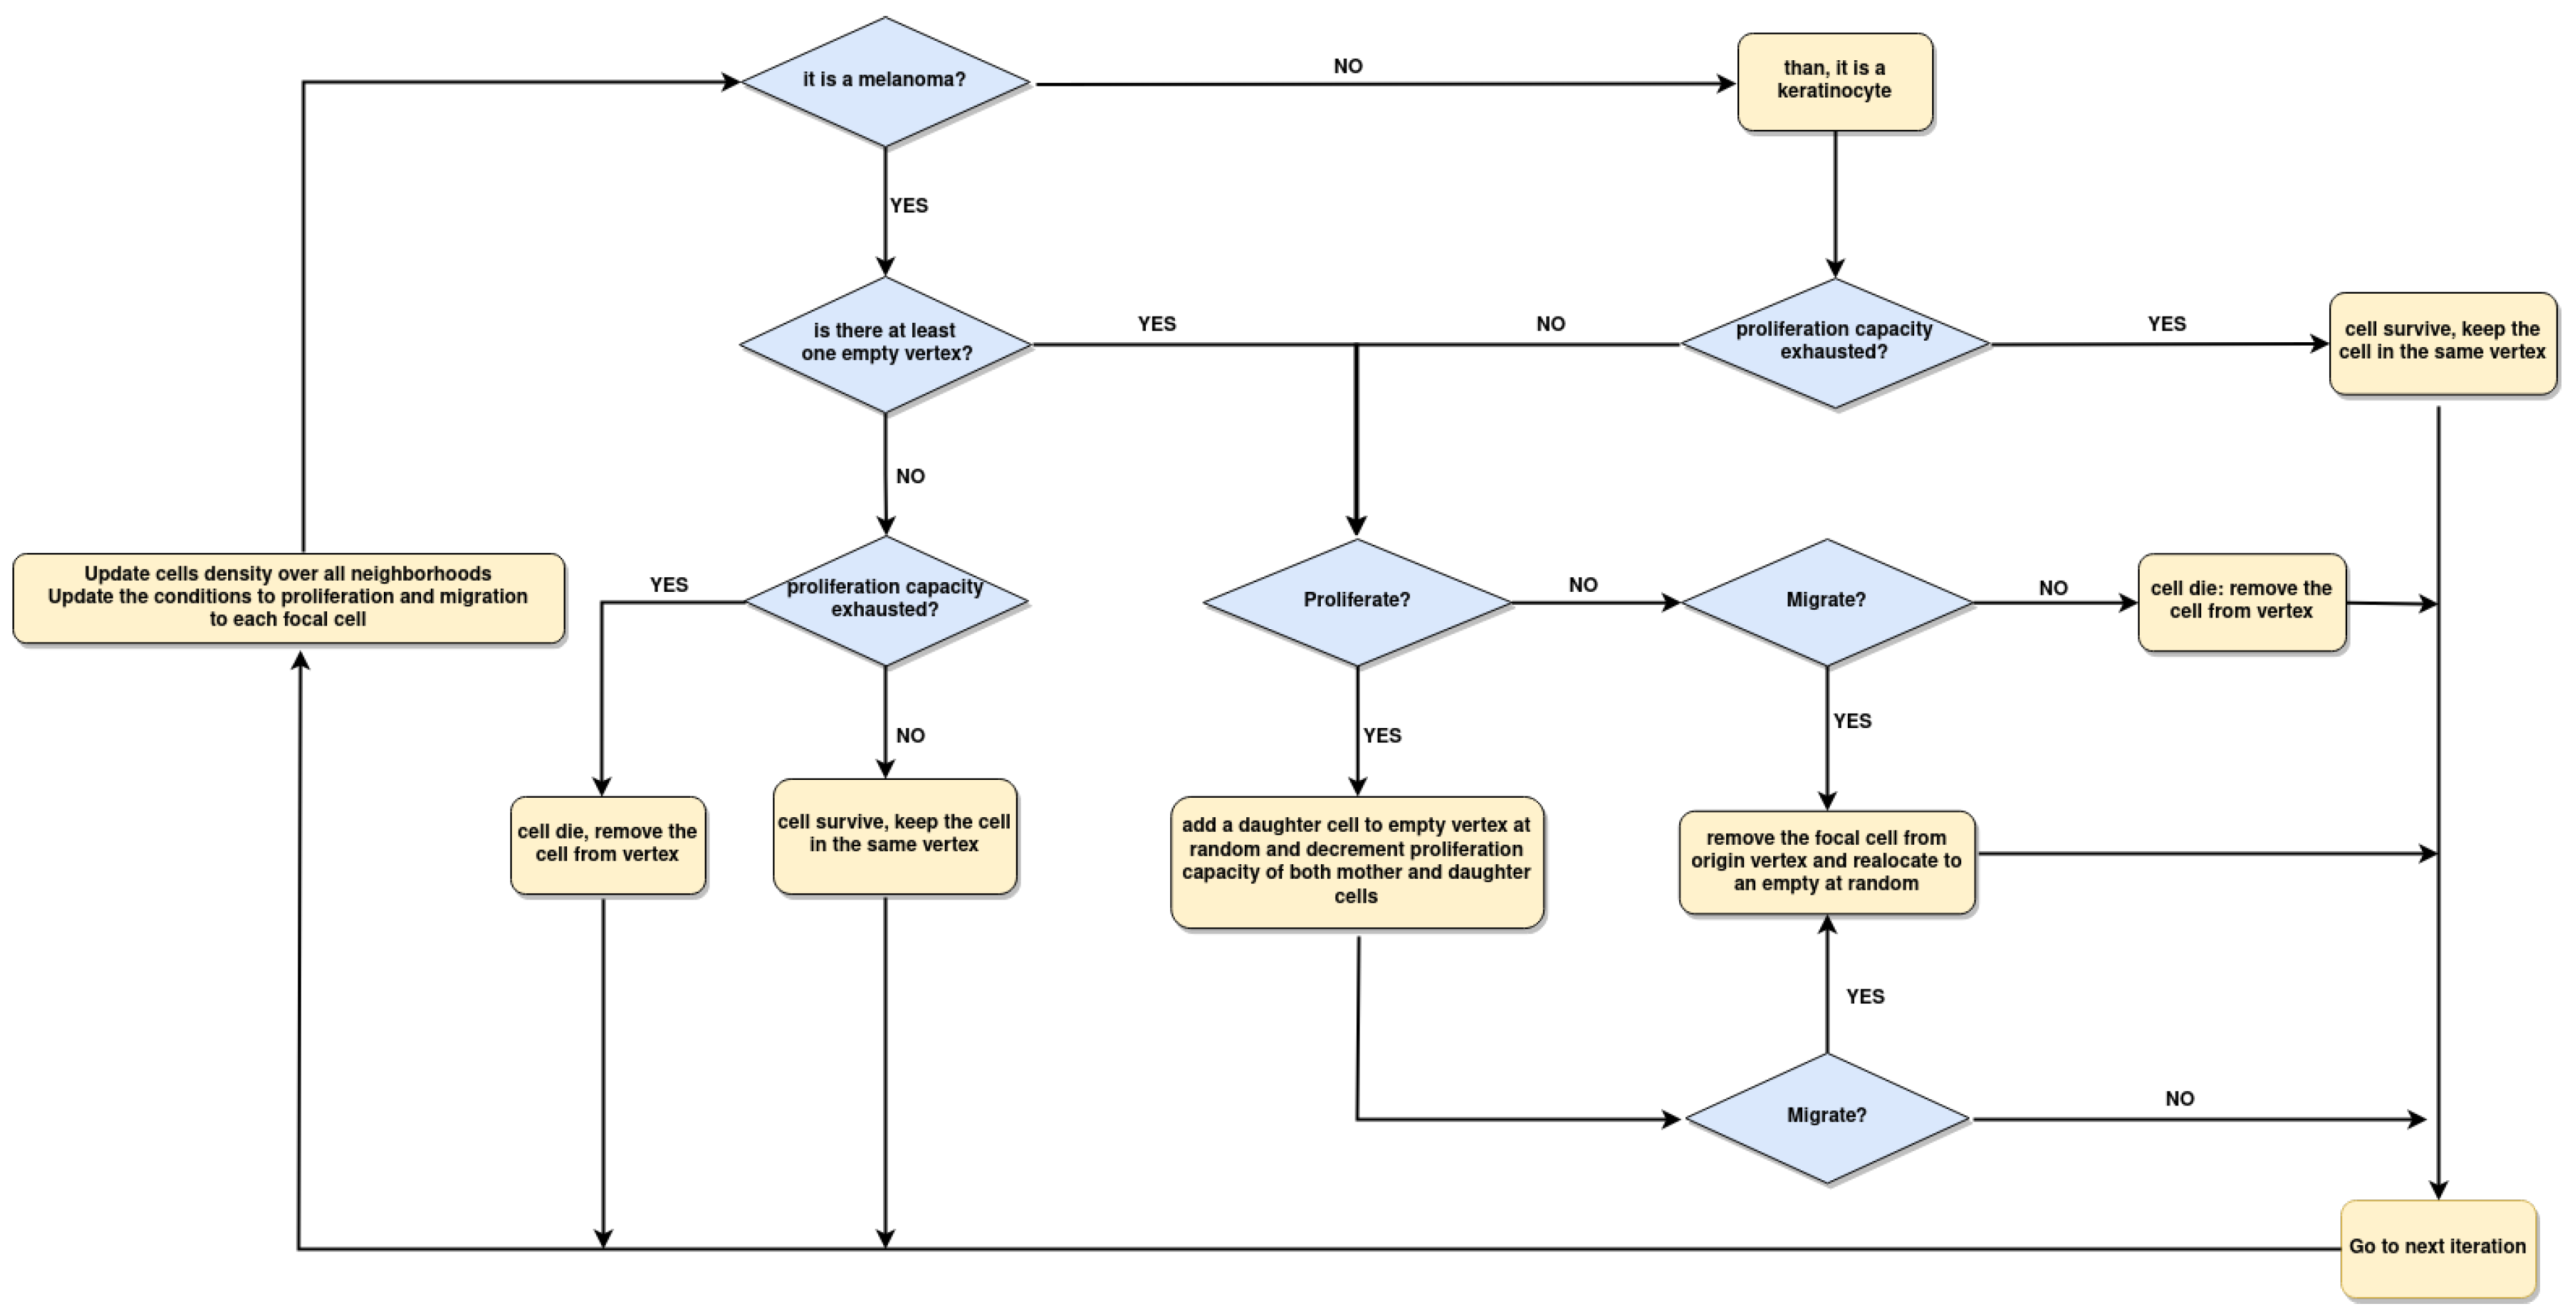
2.4. Implementation of Square-Lattice Cellular Automata
2.5. Spatial Configuration, Parameter Estimation, and Population Dynamics Process Probabilities
3. Results
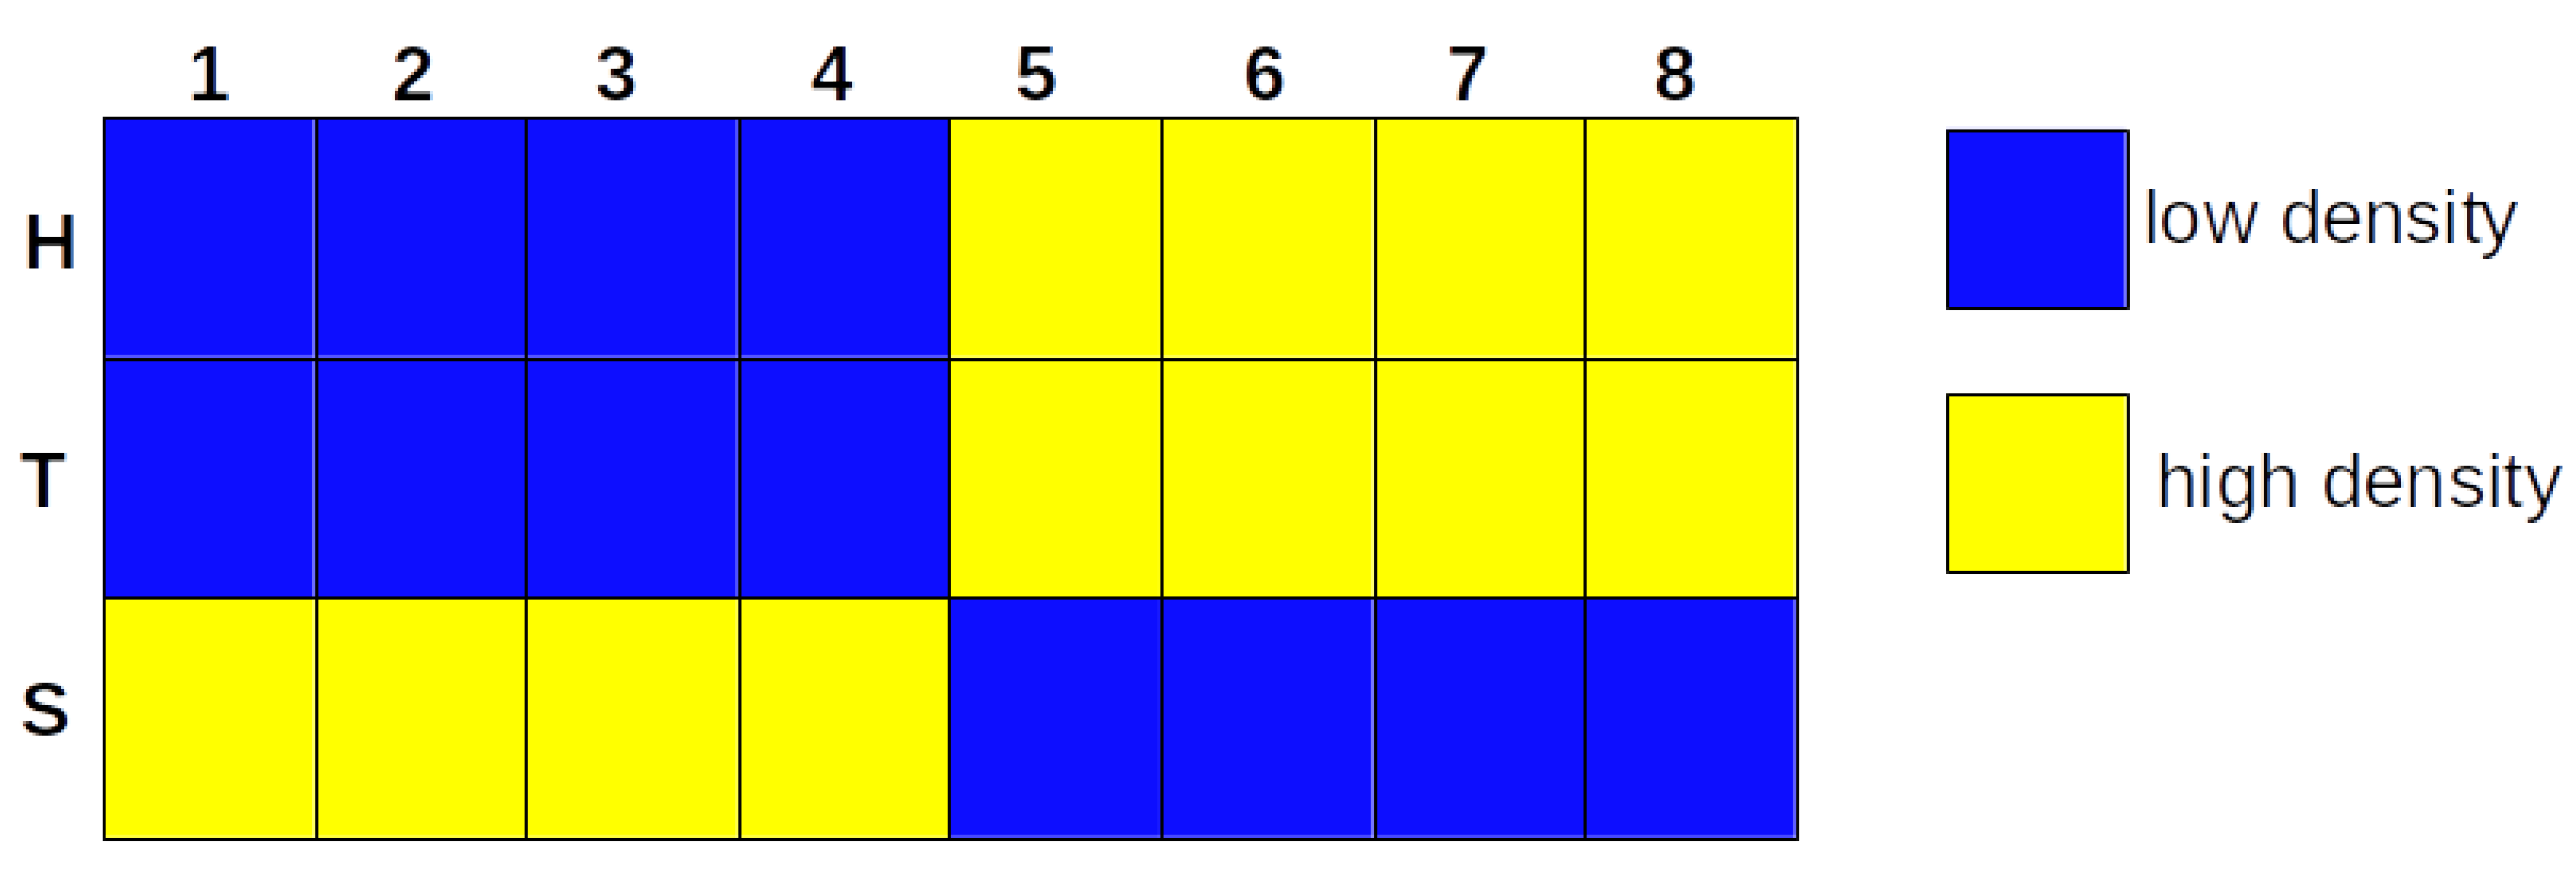
3.1. The Iterative k-Means Binarization Method Demonstrated That Both Populations Are in High Density after 4 Days
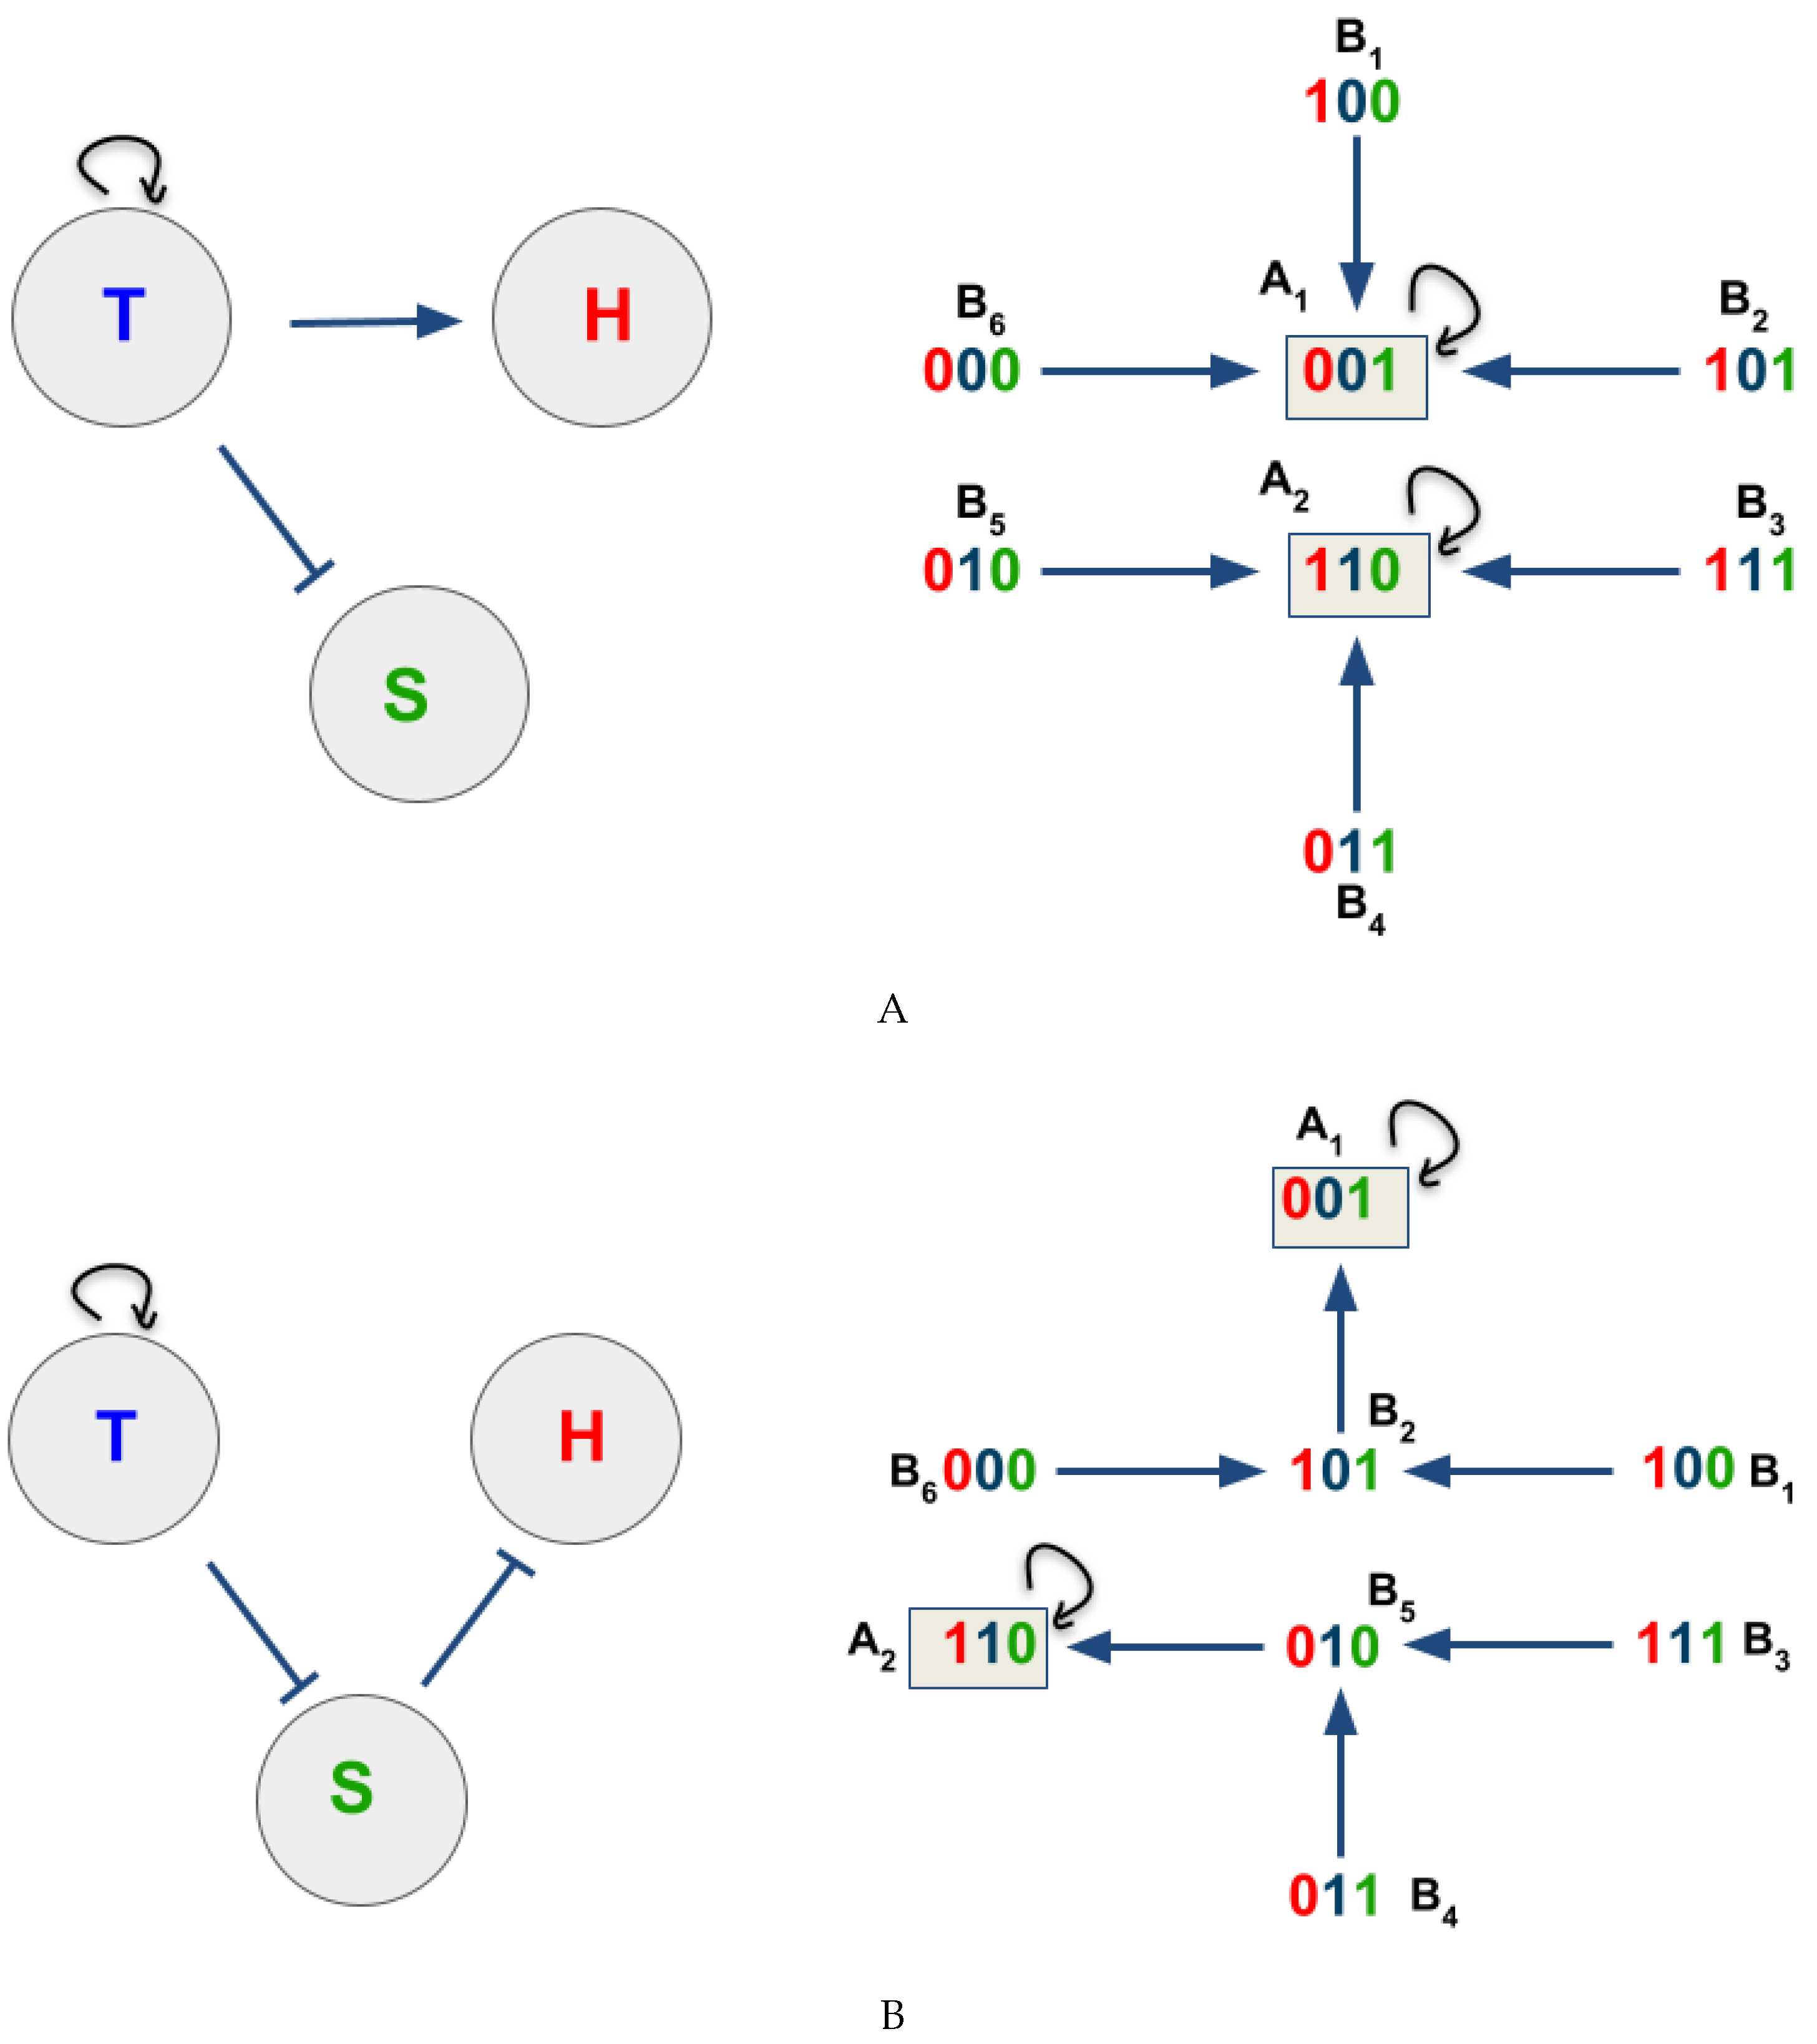
3.2. The Network Dynamics Exhibit Two Singleton Attractors
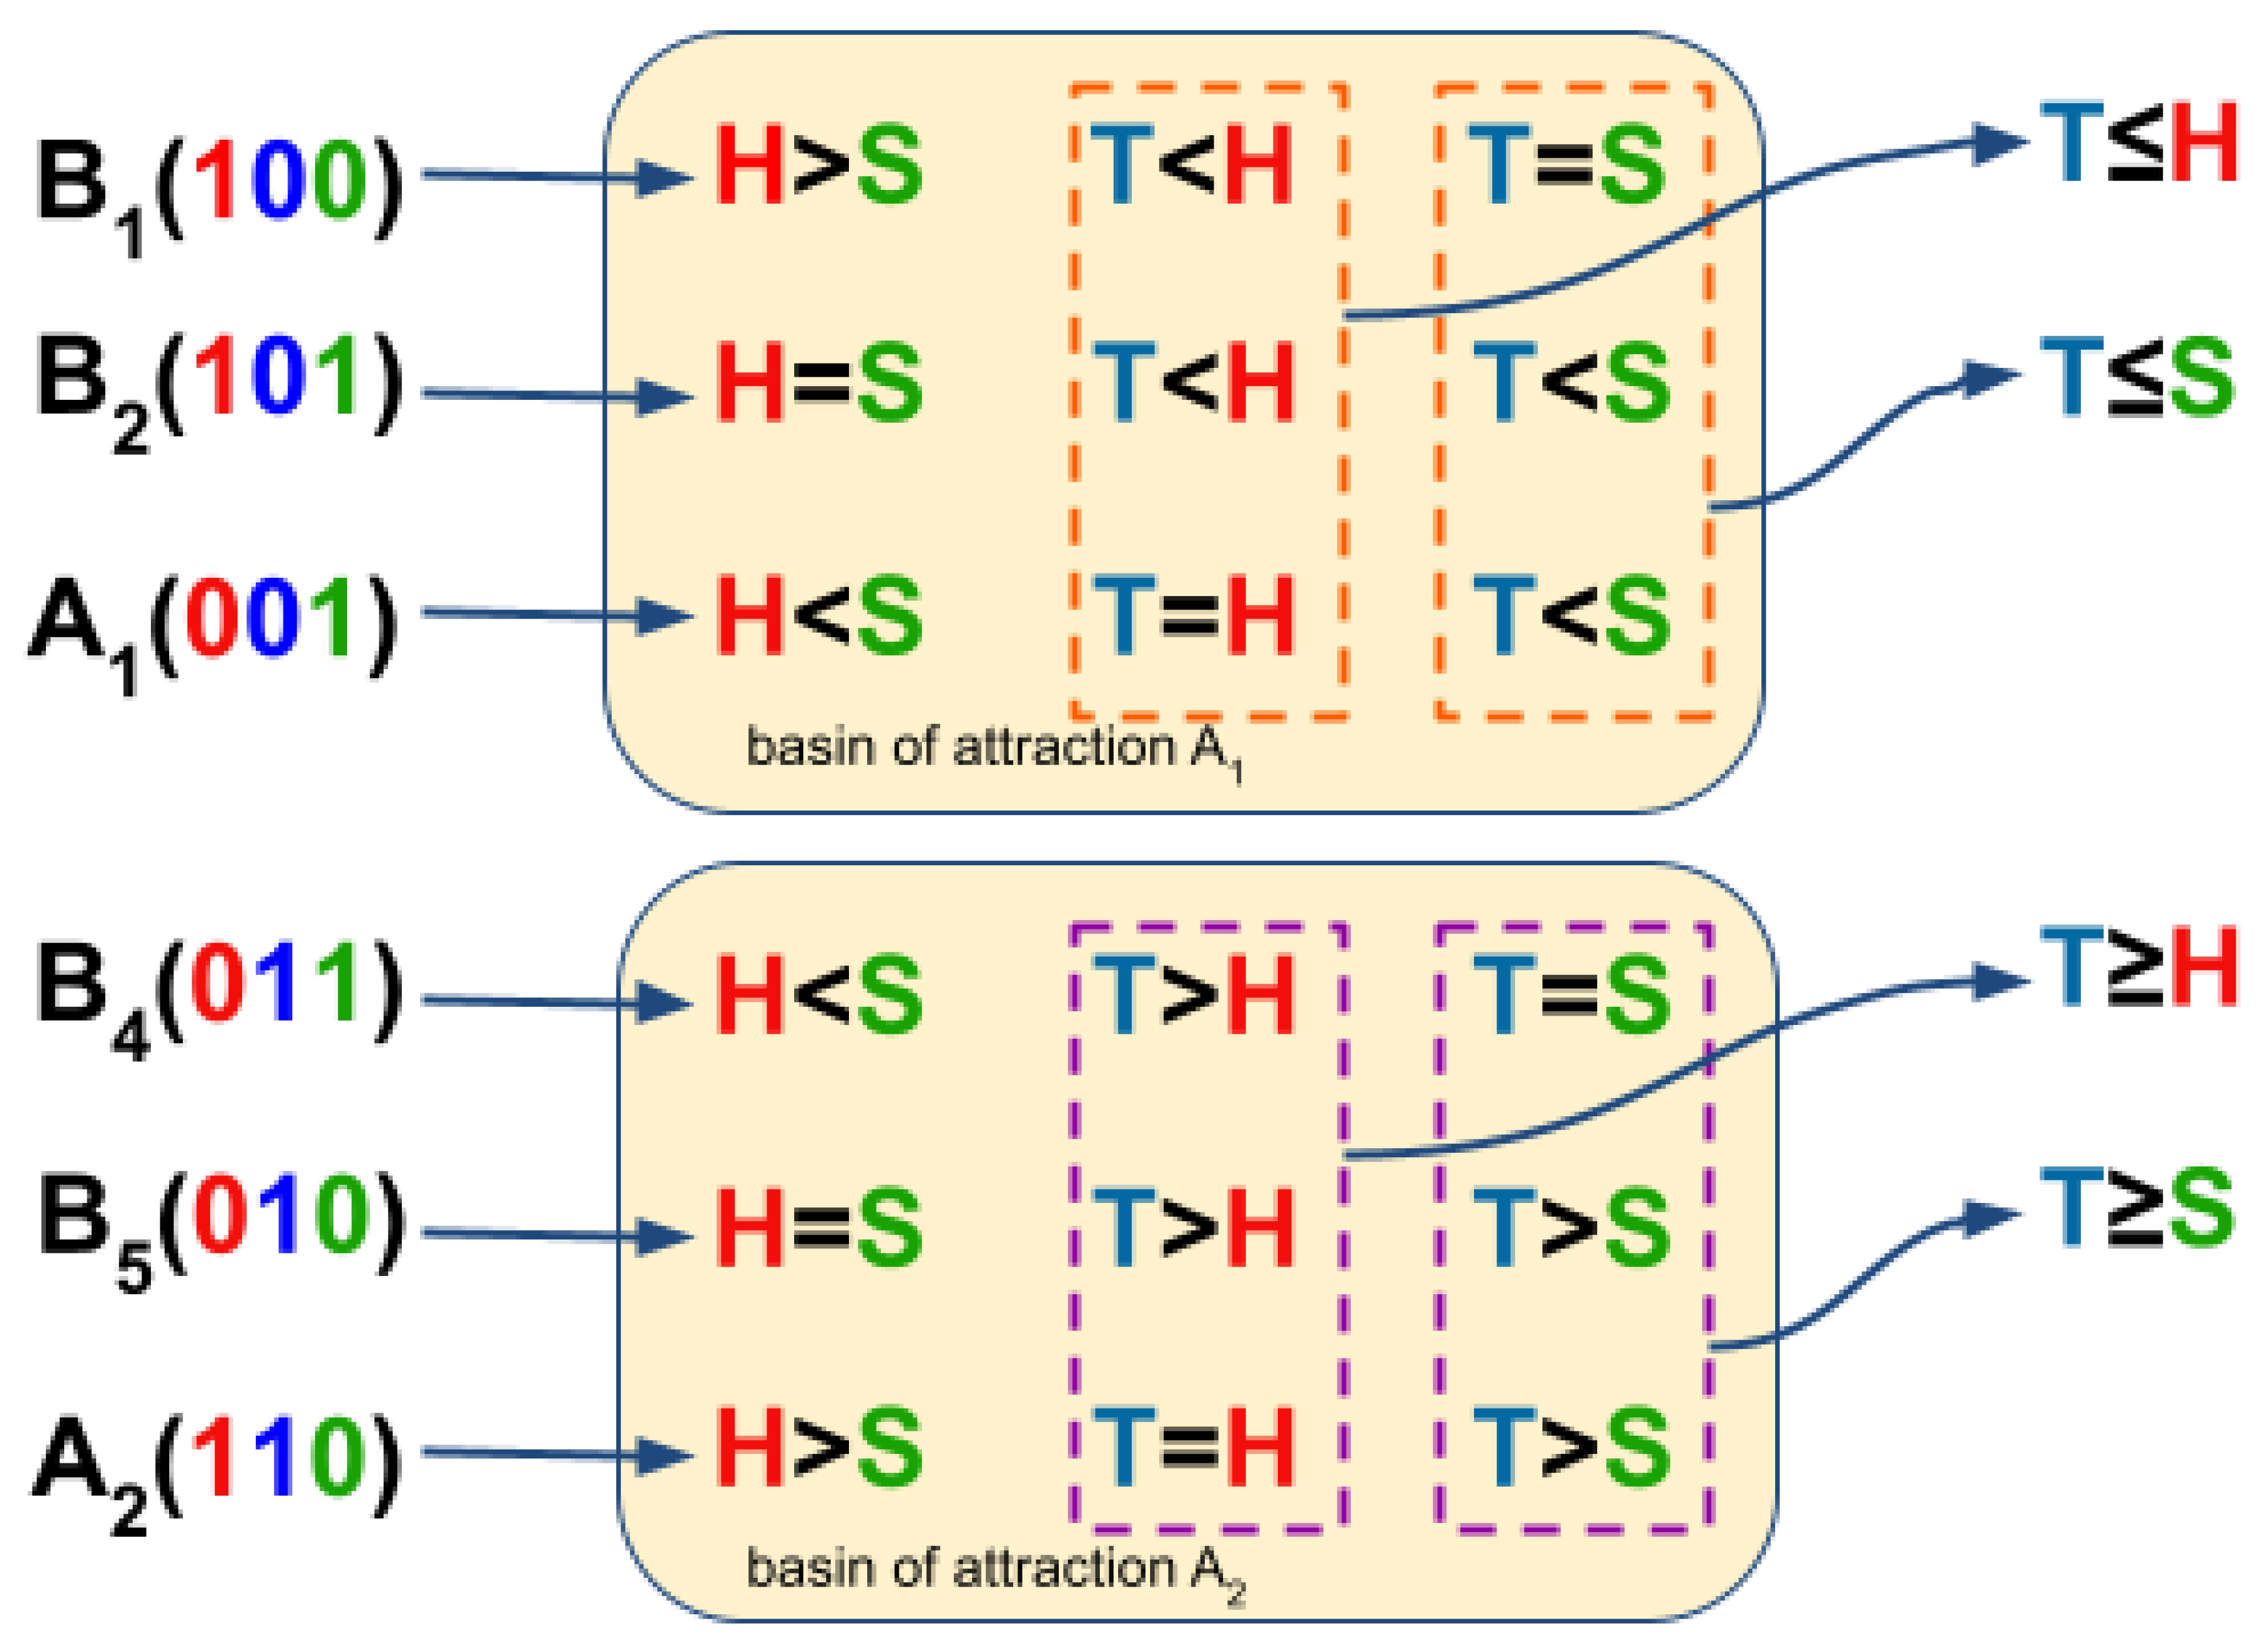
3.3. Boolean Network Basin Provide Cellular Automata Dynamic Rules for Proliferation and Migration
3.4. Data from Cell Lines and Growth Curves Allow us to Propose a Simple Rule to Describe Survival and Death Dynamics
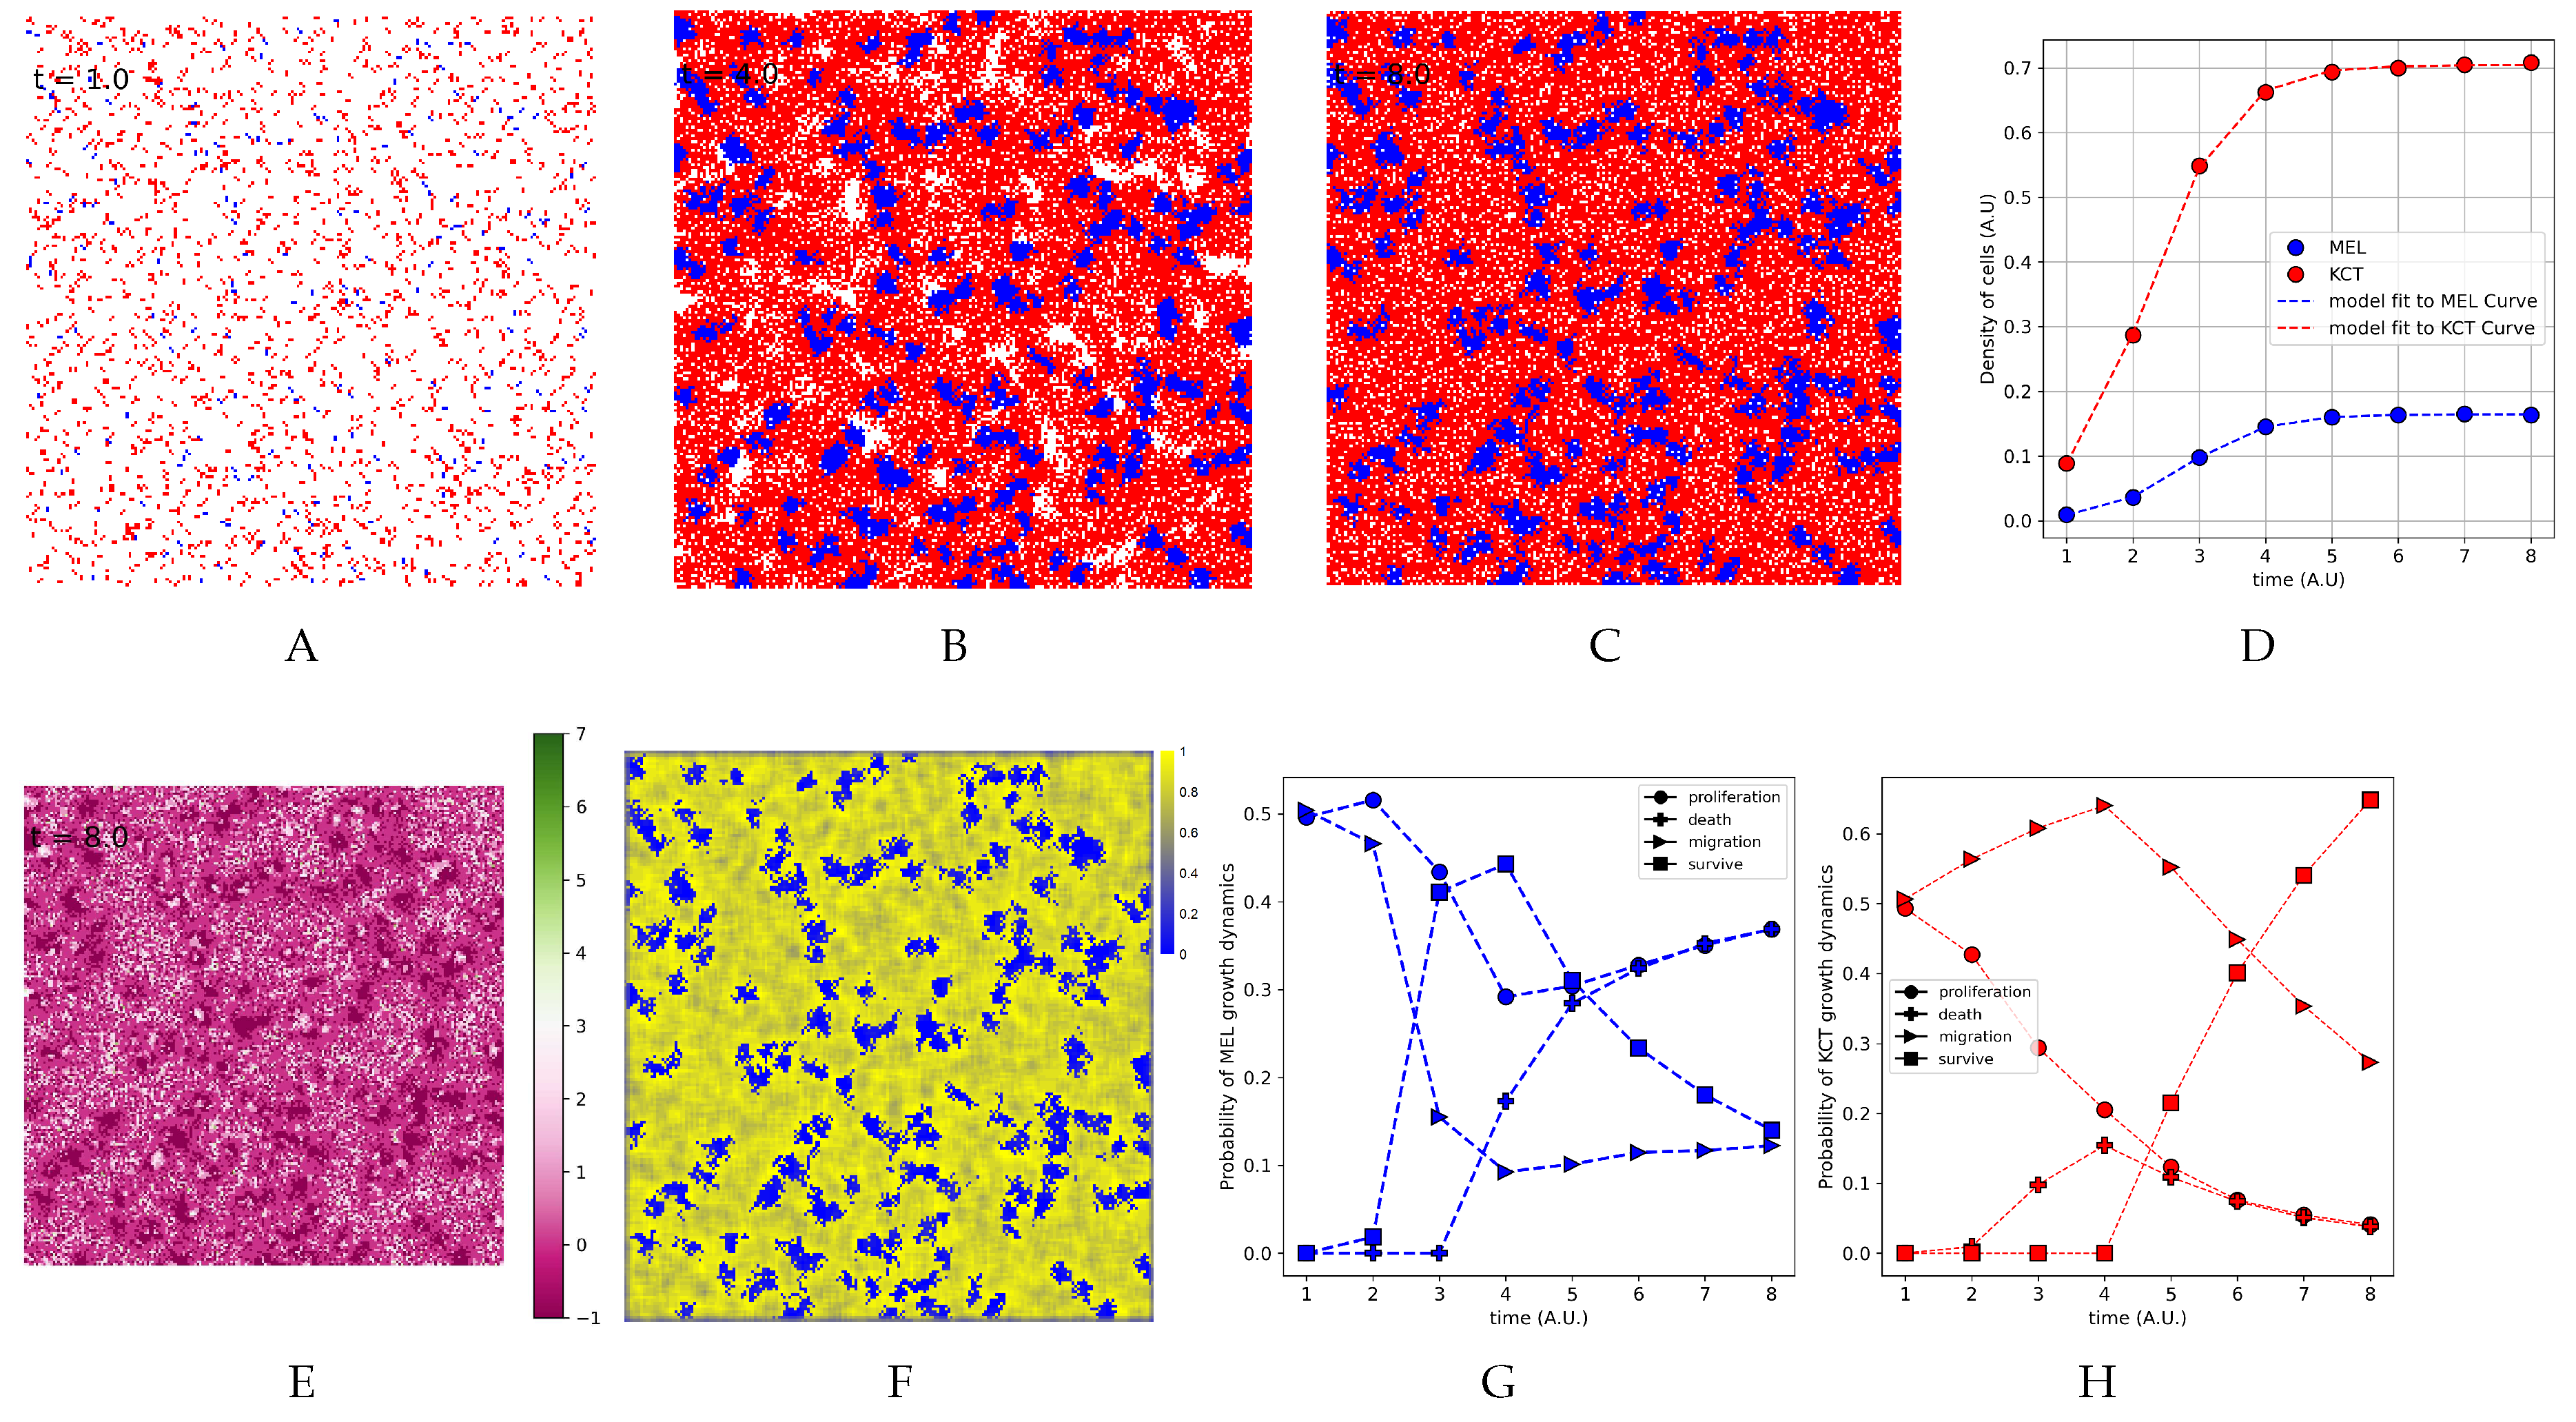
3.5. The Parameter Estimation Are in Agreement with Experimental Data
3.6. The Density of H Indeed is Higher Close to T Cluster
4. Discussion
5. Conclusion
Supplementary Materials
Acknowledgments
References
- Morais MCC, Stuhl I, Sabino AU, Lautenschlager WW, Queiroga AS, Tortelli Jr TC, et al. Stochastic model of contact inhibition and the proliferation of melanoma in situ. Sci. Rep. 2017, 7, 8026. [Google Scholar] [CrossRef]
- Kodet O, Lacina L, Krejčí E, Dvořánková B, Grim M, Štork J, et al. Melanoma cells influence the differentiation pattern of human epidermal keratinocytes. Mol. Cancer 2015, 14, 1–12. [Google Scholar] [CrossRef]
- Mazurkiewicz J, Simiczyjew A, Dratkiewicz E, Kot M, Pietraszek-Gremplewicz K, Wilk D, et al. Melanoma stimulates the proteolytic activity of HaCaT keratinocytes. Cell Commun. Signal. 2022, 20, 1–17. [Google Scholar]
- Neumann, JV. Theory of self-reproducing automata. Edited by Arthur W Burks. 1966.
- Wolfram, S. Statistical mechanics of cellular automata. Rev. Mod. Phys. 1983, 55, 601. [Google Scholar] [CrossRef]
- Wolfram, S. A new kind of science. vol. 5. Wolfram media Champaign, IL; 2002.
- Kauffman, S. Homeostasis and differentiation in random genetic control networks. Nature 1969, 224, 177–178. [Google Scholar] [CrossRef]
- Bornholdt, S. Boolean network models of cellular regulation: prospects and limitations. Journal of the royal society interface. 2008, 5 (Suppl. 1), S85–S94. [Google Scholar] [CrossRef] [PubMed]
- Wuensche A, Lesser M. Global dynamics of cellular automata: An atlas of basin of attraction fields of one-dimensional cellular automata. vol. 1. Colorado: Westview Press; 1992.
- Wuensche, A. Exploring discrete dynamics. Luniver Press; 2011.
- Wuensche, A. Attractor basins of discrete networks. Cognitive science research paper. 1997;461.
- Wuensche, A. The Ghost in the Machine: Basin of Attraction Fields of Disordered Cellular Automata Networks. In: Artificial Life III Conference; 1992.
- Wuensche, A. The ghost in the machine: Basins of attraction of random boolean networks. Artificial Life III: SFI Studies in the Sciences of Complexity, vol ëVII Addison-Wesley. 1994.
- Jeras I, Dobnikar A. Algorithms for computing preimages of cellular automata configurations. Phys. Nonlinear Phenom. 2007, 233, 95–111. [Google Scholar] [CrossRef]
- Soto JMG. Computation of explicit preimages in one-dimensional cellular automata applying the De Bruijn diagram. J. Cell. Autom. 2008, 3, 219–230. [Google Scholar]
- Dormann S, Deutsch A. Modeling of self-organized avascular tumor growth with a hybrid cellular automaton. Silico Biol. 2002, 2, 393–406. [Google Scholar]
- Spencer SL, Gerety RA, Pienta KJ, Forrest S. Modeling somatic evolution in tumorigenesis. Plos Comput. Biol. 2006, 2, e108. [Google Scholar]
- Enderling H, Hlatky L, Hahnfeldt P. Migration rules: tumours are conglomerates of self-metastases. Br. J. Cancer 2009, 100, 1917–1925. [Google Scholar] [CrossRef]
- Enderling H, Anderson AR, Chaplain MA, Beheshti A, Hlatky L, Hahnfeldt P. Paradoxical dependencies of tumor dormancy and progression on basic cell kinetics. Cancer Res. 2009, 69, 8814–8821. [Google Scholar] [CrossRef] [PubMed]
- Kansal A, Torquato S, Chiocca E, Deisboeck T. Emergence of a subpopulation in a computational model of tumor growth. J. Theor. Biol. 2000, 207, 431–441. [Google Scholar] [CrossRef]
- Zhang L, Strouthos CG, Wang Z, Deisboeck TS. Simulating brain tumor heterogeneity with a multiscale agent-based model: linking molecular signatures, phenotypes and expansion rate. Math. Comput. Model. 2009, 49, 307–319. [Google Scholar] [CrossRef] [PubMed]
- Wcisło R, Dzwinel W, Yuen DA, Dudek AZ. A 3-D model of tumor progression based on complex automata driven by particle dynamics. J. Mol. Model. 2009, 15, 1517–1539. [Google Scholar] [CrossRef] [PubMed]
- Wang Z, Deisboeck TS. Computational modeling of brain tumors: discrete, continuum or hybrid? Scientific modeling and simulations 2009; pp. 381–393.
- Anderson AR, Rejniak KA, Gerlee P, Quaranta V. Microenvironment driven invasion: a multiscale multimodel investigation. J. Math. Biol. 2009, 58, 579–624. [Google Scholar] [CrossRef] [PubMed]
- Zhang L, Wang Z, Sagotsky JA, Deisboeck TS. Multiscale agent-based cancer modeling. J. Math. Biol. 2009, 58, 545–559. [Google Scholar] [CrossRef] [PubMed]
- Anderson, AR. A hybrid mathematical model of solid tumour invasion: the importance of cell adhesion. Math. Med. Biol. J. IMA 2005, 22, 163–186. [Google Scholar] [CrossRef]
- Sottoriva A, Verhoeff JJ, Borovski T, McWeeney SK, Naumov L, Medema JP, et al. Cancer stem cell tumor model reveals invasive morphology and increased phenotypical heterogeneity. Cancer Res. 2010, 70, 46–56. [Google Scholar] [CrossRef]
- Gatenby RA, Smallbone K, Maini PK, Rose F, Averill J, Nagle RB, et al. Cellular adaptations to hypoxia and acidosis during somatic evolution of breast cancer. Br. J. Cancer 2007, 97, 646–653. [Google Scholar] [CrossRef]
- Gerlee P, Anderson A. Evolution of cell motility in an individual-based model of tumour growth. J. Theor. Biol. 2009, 259, 67–83. [Google Scholar] [CrossRef]
- Silva AS, Yunes JA, Gillies RJ, Gatenby RA. The potential role of systemic buffers in reducing intratumoral extracellular pH and acid-mediated invasion. Cancer Res. 2009, 69, 2677–2684. [Google Scholar] [CrossRef]
- Zhang L, Chen LL, Deisboeck TS. Multi-scale, multi-resolution brain cancer modeling. Math. Comput. Simul. 2009, 79, 2021–2035. [Google Scholar] [CrossRef] [PubMed]
- Gerlee P, Anderson AR. A hybrid cellular automaton model of clonal evolution in cancer: the emergence of the glycolytic phenotype. J. Theor. Biol. 2008, 250, 705–722. [Google Scholar] [CrossRef]
- Smallbone K, Gatenby RA, Gillies RJ, Maini PK, Gavaghan DJ. Metabolic changes during carcinogenesis: potential impact on invasiveness. J. Theor. Biol. 2007, 244, 703–713. [Google Scholar] [CrossRef] [PubMed]
- Anderson AR, Hassanein M, Branch KM, Lu J, Lobdell NA, Maier J, et al. Microenvironmental independence associated with tumor progression. Cancer Res. 2009, 69, 8797–8806. [Google Scholar] [CrossRef] [PubMed]
- Anderson AR, Weaver AM, Cummings PT, Quaranta V. Tumor morphology and phenotypic evolution driven by selective pressure from the microenvironment. Cell 2006, 127, 905–915. [Google Scholar] [CrossRef]
- Basanta D, Strand DW, Lukner RB, Franco OE, Cliffel DE, Ayala GE, et al. The role of transforming growth factor-β–mediated tumor-stroma interactions in prostate cancer progression: An integrative approach. Cancer Res. 2009, 69, 7111–7120. [Google Scholar] [CrossRef] [PubMed]
- de Pillis LG, Mallet DG, Radunskaya AE. Spatial tumor-immune modeling. Comput. Math. Methods Med. 2006, 7, 159–176. [Google Scholar] [CrossRef]
- Enderling H, Alexander NR, Clark ES, Branch KM, Estrada L, Crooke C, et al. Dependence of invadopodia function on collagen fiber spacing and cross-linking: computational modeling and experimental evidence. Biophys. J. 2008, 95, 2203–2218. [Google Scholar] [CrossRef]
- Bankhead A, Magnuson NS, Heckendorn RB. Cellular automaton simulation examining progenitor hierarchy structure effects on mammary ductal carcinoma in situ. J. Theor. Biol. 2007, 246, 491–498. [Google Scholar] [CrossRef]
- Gevertz J, Torquato S. Growing heterogeneous tumors in silico. Phys. Rev. 2009, 80, 51–91. [Google Scholar]
- Anderson AR, Basanta D, Gerlee P, Rejniak KA. Evolution, regulation, and disruption of homeostasis, and its role in carcinogenesis. Multiscale cancer modeling. 2011; p. 1–30.
- Silva AS, Gatenby RA, Gillies RJ, Yunes JA. A quantitative theoretical model for the development of malignancy in ductal carcinoma in situ. J. Theor. Biol. 2010, 262, 601–613. [Google Scholar] [CrossRef]
- Putnins M, Campagne O, Mager D, Androulakis I. From data to QSP models: a pipeline for using Boolean networks for hypothesis inference and dynamic model building. J. Pharmacokinet. Pharmacodyn. 2022, 49, 101–115. [Google Scholar] [CrossRef]
- Steinway SN, Biggs MB, Loughran Jr TP, Papin JA, Albert R. Inference of network dynamics and metabolic interactions in the gut microbiome. Plos Comput. Biol. 2015, 11, e1004338. [Google Scholar]
- Schlatter R, Schmich K, Avalos Vizcarra I, Scheurich P, Sauter T, Borner C, et al. ON/OFF and beyond-a Boolean model of apoptosis. Plos Comput. Biol. 2009, 5, e1000595. [Google Scholar]
- Mai Z, Liu H. Boolean network-based analysis of the apoptosis network: irreversible apoptosis and stable surviving. J. Theor. Biol. 2009, 259, 760–769. [Google Scholar] [CrossRef] [PubMed]
- Steinway SN, Zañudo JG, Ding W, Rountree CB, Feith DJ, Loughran Jr TP, et al. Network modeling of TGFβ signaling in hepatocellular carcinoma epithelial-to-mesenchymal transition reveals joint sonic hedgehog and Wnt pathway activation. Cancer Res. 2014, 74, 5963–5977. [Google Scholar] [CrossRef] [PubMed]
- Fumia HF, Martins ML. Boolean network model for cancer pathways: predicting carcinogenesis and targeted therapy outcomes. PLoS ONE 2013, 8, e69008. [Google Scholar]
- Cichorek M, Wachulska M, Stasiewicz A, Tymińska A. Skin melanocytes: biology and development. Adv. Dermatol. Allergol. 2013, 30, 30–41. [Google Scholar]
- Berestovsky N, Nakhleh L. An evaluation of methods for inferring boolean networks from time-series data. PLoS ONE 2013, 8, e66031. [Google Scholar]
- Hopfensitz M, Mussel C, Wawra C, Maucher M, Kuhl M, Neumann H, et al. Multiscale binarization of gene expression data for reconstructing Boolean networks. Ieee/Acm Trans. Comput. Biol. Bioinform. 2011, 9, 487–498. [Google Scholar]
- Müssel C, Hopfensitz M, Kestler HA. BoolNet—an R package for generation, reconstruction and analysis of Boolean networks. Bioinformatics 2010, 26, 1378–1380. [Google Scholar] [CrossRef]
- Lähdesmäki H, Shmulevich I, Yli-Harja O. On learning gene regulatory networks under the Boolean network model. Mach. Learn. 2003, 52, 147–167. [Google Scholar] [CrossRef]
- Hanahan D, Weinberg RA. The hallmarks of cancer. Cell 2000, 100, 57–70. [Google Scholar] [CrossRef]
- Hanahan D, Weinberg RA. Hallmarks of cancer: the next generation. Cell 2011, 144, 646–674.
- Weinberg, RA. The biology of cancer. 2013. [Google Scholar]
- Hanahan, D. Hallmarks of cancer: new dimensions. Cancer Discov. 2022, 12, 31–46. [Google Scholar] [CrossRef]
- Benzekry S, Lamont C, Beheshti A, Tracz A, Ebos JM, Hlatky L, et al. Classical mathematical models for description and prediction of experimental tumor growth. Plos Comput. Biol. 2014, 10, e1003800. [Google Scholar]
- Hayflick L, Moorhead PS. The serial cultivation of human diploid cell strains. Exp. Cell Res. 1961, 25, 585–621. [Google Scholar] [CrossRef]
- Hayflick, L. The limited in vitro lifetime of human diploid cell strains. Exp. Cell Res. 1965, 37, 614–636. [Google Scholar] [CrossRef] [PubMed]
- Blackburn EH, Gall JG. A tandemly repeated sequence at the termini of the extrachromosomal ribosomal RNA genes in Tetrahymena. J. Mol. Biol. 1978, 120, 33–53. [Google Scholar] [CrossRef] [PubMed]
- Poleszczuk J, Hahnfeldt P, Enderling H. Biphasic modulation of cancer stem cell-driven solid tumour dynamics in response to reactivated replicative senescence. Cell Prolif. 2014, 47, 267–276. [Google Scholar] [CrossRef]
- Poleszczuk J, Enderling H. A high-performance cellular automaton model of tumor growth with dynamically growing domains. Appl. Math. 2014, 5, 144. [Google Scholar] [CrossRef] [PubMed]
- Poleszczuk J, Hahnfeldt P, Enderling H. Evolution and phenotypic selection of cancer stem cells. Plos Comput. Biol. 2015, 11, e1004025. [Google Scholar]
- Poleszczuk J, Enderling H. Cancer stem cell plasticity as tumor growth promoter and catalyst of population collapse. Stem Cells Int. 2016, 2016, 3923527. [Google Scholar]
- Morton CI, Hlatky L, Hahnfeldt P, Enderling H. Non-stem cancer cell kinetics modulate solid tumor progression. Theor. Biol. Med. Model. 2011, 8, 1–13. [Google Scholar]
- Shyntar A, Patel A, Rhodes M, Enderling H, Hillen T. The Tumor Invasion Paradox in Cancer Stem Cell-Driven Solid Tumors. Bull. Math. Biol. 2022, 84, 139. [Google Scholar]
- Topman G, Sharabani-Yosef O, Gefen A. A method for quick, low-cost automated confluency measurements. Microsc. Microanal. 2011, 17, 915–922. [Google Scholar] [CrossRef]
- Martin S, Zhang Z, Martino A, Faulon JL. Boolean dynamics of genetic regulatory networks inferred from microarray time series data. Bioinformatics 2007, 23, 866–874. [Google Scholar] [CrossRef]
- Campbell NR, Rao A, Hunter MV, Sznurkowska MK, Briker L, Zhang M, et al. Cooperation between melanoma cell states promotes metastasis through heterotypic cluster formation. Dev. Cell 2021, 56, 2808–2825. [Google Scholar] [CrossRef] [PubMed]
- Hatzikirou H, Basanta D, Simon M, Schaller K, Deutsch A. ‘Go or grow’: the key to the emergence of invasion in tumour progression? Math. Med. Biol. J. Ima 2012, 29, 49–65. [Google Scholar] [CrossRef] [PubMed]
- Gallaher J, Anderson AR. Evolution of intratumoral phenotypic heterogeneity: the role of trait inheritance. Interface Focus 2013, 3, 20130016. [Google Scholar] [CrossRef] [PubMed]
- Kimmel GJ, Dane M, Heiser LM, Altrock PM, Andor N. Integrating mathematical modeling with high-throughput imaging explains how polyploid populations behave in nutrient-sparse environments. Cancer Res. 2020, 80, 5109–5120. [Google Scholar] [CrossRef] [PubMed]
- Garay T, Juhász É, Molnár E, Eisenbauer M, Czirók A, Dekan B, et al. Cell migration or cytokinesis and proliferation?–revisiting the “go or grow” hypothesis in cancer cells in vitro. Exp. Cell Res. 2013, 319, 3094–3103. [Google Scholar] [CrossRef] [PubMed]
- Vittadello ST, McCue SW, Gunasingh G, Haass NK, Simpson MJ. Examining go-or-grow using fluorescent cell-cycle indicators and cell-cycle-inhibiting drugs. Biophys. J. 2020, 118, 1243–1247. [Google Scholar] [CrossRef] [PubMed]
- Kon S, Ishibashi K, Katoh H, Kitamoto S, Shirai T, Tanaka S, et al. Cell competition with normal epithelial cells promotes apical extrusion of transformed cells through metabolic changes. Nat. Cell Biol. 2017, 19, 530–541. [Google Scholar] [CrossRef]
- Hill W, Zaragkoulias A, Salvador-Barbero B, Parfitt GJ, Alatsatianos M, Padilha A, et al. EPHA2-dependent outcompetition of KRASG12D mutant cells by wild-type neighbors in the adult pancreas. Curr. Biol. 2021, 31, 2550–2560. [Google Scholar] [CrossRef]
- Martins VC, Busch K, Juraeva D, Blum C, Ludwig C, Rasche V, et al. Cell competition is a tumour suppressor mechanism in the thymus. Nature 2014, 509, 465–470. [Google Scholar] [CrossRef]
- Wagstaff L, Goschorska M, Kozyrska K, Duclos G, Kucinski I, Chessel A, et al. Mechanical cell competition kills cells via induction of lethal p53 levels. Nat. Commun. 2016, 7, 11373. [Google Scholar] [CrossRef]
- Alowaidi F, Hashimi SM, Alqurashi N, Alhulais R, Ivanovski S, Bellette B, et al. Assessing stemness and proliferation properties of the newly established colon cancer ‘stem’cell line, CSC480 and novel approaches to identify dormant cancer cells. Oncol. Rep. 2018, 39, 2881–2891. [Google Scholar]
- Gao X, McDonald JT, Hlatky L, Enderling H. Acute and fractionated irradiation differentially modulate glioma stem cell division kinetics. Cancer Res. 2013, 73, 1481–1490. [Google Scholar] [CrossRef]
- Tang J, Fernandez-Garcia I, Vijayakumar S, Martinez-Ruis H, Illa-Bochaca I, Nguyen DH, et al. Irradiation of juvenile, but not adult, mammary gland increases stem cell self-renewal and estrogen receptor negative tumors. Stem Cells 2014, 32, 649–661. [Google Scholar] [CrossRef]
- Grimes DR, Fletcher AG. Close encounters of the cell kind: The impact of contact inhibition on tumour growth and cancer models. Bull. Math. Biol. 2020, 82, 1–13. [Google Scholar]
- Pavel M, Renna M, Park SJ, Menzies FM, Ricketts T, Füllgrabe J, et al. Contact inhibition controls cell survival and proliferation via YAP/TAZ-autophagy axis. Nat. Commun. 2018, 9, 2961. [Google Scholar] [CrossRef] [PubMed]
- West J, Newton PK. Cellular interactions constrain tumor growth. Proc. Natl. Acad. Sci. USA 2019, 116, 1918–1923. [Google Scholar] [CrossRef] [PubMed]
- Hanahan D, Coussens LM. Accessories to the crime: functions of cells recruited to the tumor microenvironment. Cancer Cell 2012, 21, 309–322. [Google Scholar] [CrossRef] [PubMed]
- Quail DF, Joyce JA. Microenvironmental regulation of tumor progression and metastasis. Nat. Med. 2013, 19, 1423–1437. [Google Scholar] [CrossRef]
- Maley CC, Aktipis A, Graham TA, Sottoriva A, Boddy AM, Janiszewska M, et al. Classifying the evolutionary and ecological features of neoplasms. Nat. Rev. Cancer 2017, 17, 605–619. [Google Scholar] [CrossRef] [PubMed]
- Wittmann DM, Krumsiek J, Saez-Rodriguez J, Lauffenburger DA, Klamt S, Theis FJ. Transforming Boolean models to continuous models: methodology and application to T-cell receptor signaling. Bmc Syst. Biol. 2009, 3, 1–21. [Google Scholar]
- Krumsiek J, Pölsterl S, Wittmann DM, Theis FJ. Odefy-from discrete to continuous models. Bmc Bioinform. 2010, 11, 1–10. [Google Scholar]
| Parameters | Melanoma | Keratinocytes |
|---|---|---|
| K | 0.16 | 0.7 |
| rho | 1.63 | 1.20 |
| tau | 2.7 | 2.2 |
Disclaimer/Publisher’s Note: The statements, opinions and data contained in all publications are solely those of the individual author(s) and contributor(s) and not of MDPI and/or the editor(s). MDPI and/or the editor(s) disclaim responsibility for any injury to people or property resulting from any ideas, methods, instructions or products referred to in the content. |
© 2023 by the authors. Licensee MDPI, Basel, Switzerland. This article is an open access article distributed under the terms and conditions of the Creative Commons Attribution (CC BY) license (http://creativecommons.org/licenses/by/4.0/).


