Preprint
Article

Labor Force Participation Rate and Expected Length of Retirement 1989-2066: Comparison of Several OECD Countries

Altmetrics

Downloads

159

Views

59

Comments

0

Submitted:

19 October 2023

Posted:

24 October 2023

You are already at the latest version

Alerts
Abstract
The world population is aging, which along with recent shifts in the labor force participation (LFP), is having a significant longevity influence on state pension programs across the board, including Canada, Finland, Japan, and Germany. Except Japan, these countries have set their statutory re-tirement age at 65, but the impact of aging workforce and declined fertility rates create wonders on the estimate future trends in the LFP, as well as the length of retirement. In this study, we fit the LFP rates of these countries, representing continents from Asia, Europe and North America among the OECD countries, using the Lee-Carter and Cairns-Blake-Dowd (CBD) stochastic models. The es-timates are then used for the projection of future LFP rates (1989-2066), and by combining the mortality forecasts from the United Nations, we project the expected length of retirement (1989-2066). This study provided a novel comparison between the Lee-Carter and the CBD LFP models by fitting and forecasting the LFP rates of senior employees between 50- to 74-year-olds. The results revealed disparities between models that provided proof of the presence of model risk for longer retirement durations. The study findings emphasized the importance for decision-makers in pension industry to have awareness of potential risks and limits associated with the LFP models. The Lee-Carter model outperformed the CBD model even though the CBD model is known for its ac-curate prediction in higher ages. Population aging should be considered in any analysis of the long-term viability of pensions, together with the participation rate trends for a sustainable labor market future.
Keywords: 
Subject: Social Sciences  -   Demography

1. Introduction

Aging workforce is a circumstance whereby the labor force structure is affected by the aging population [1,2,3]. Due to the longevity risk of older people and low fertility rate, the composition of workers’ age groups has skewed. Shifting in age structure causes older people to work longer to sustain their remaining life without relying solely on pension income, as the pension fund is insufficient for most pension bodies. As a result, the statutory pension retirement age has risen to ensure that the economic growth and pension fund are sufficient once the older adults retire.
This study focuses on the projection of labor force participation rate (LFP) and expected length of retirement (ELR). Aging workforce is one of the main components that affect this projection rate. Aging workforce is a circumstance whereby the labor force structure is affected by the aging population ([2,3,4]). Due to the longevity risk of older people and low fertility rate, the composition of different workers’ age groups has skewed. Shifting in age structure causes older people to work longer to sustain their remaining life, without relying solely on pension income, as the pension fund is insufficient for most pension bodies. As a result, the statutory pension retirement age has risen to ensure that the economic growth and pension fund are sufficient once the older adults retire.
According to the International Federation of Pension Fund Administrators (FIAP), the statutory retirement age should be increased once again due to insufficient fund by allowing more elderly people to contribute to the pension contributions and becoming less of a liability. Therefore, it raises several questions whether these older adults are willing to work in their golden ages regardless of their health status, productivity, [5,6,7] and social responsibilities ([8]). Several studies showed that the improvement in education level ([9]), and low wages workers were willing to stay in the workforce longer, while retirement preferences of others might vary.
Despite demographic shifts and increases in life expectancy, pension reforms have been enacted in developed nations, including Canada, Finland, Japan, and Germany in recent years to keep their pension systems viable. The Canadian pension system has undergone multiple reforms, including the recent implementation of the Canada Pension Plan (CPP) Enhancement in 2019 that offers inducements for laborers to accumulate funds for their post-retirement period by means of private pension schemes and other savings mechanisms. In Germany, a defined benefit pension system was replaced by a defined contribution, as part of a pension reform that took effect in 2000 ([10,11]). The pension reforms in Finland have increased the average age, whereby employees leave their employment by 3.9 months ([12]). This is due to a large decline in disability pension enrollment beginning at the age of 58, and a reduction in the incidence of unemployment among young people. Japan managed to attain a fiscal stability with further pension reforms, a rise in the consumption tax, and an increase in the number of women in the labor market. Both the Canada Pension Plan and the Old Age Security program have undergone revisions to raise the minimum retirement age and benefit levels ([13].
Gender roles have historically played a significant role in determining LFP rates. In recent decades, however, there has been a shift toward greater gender equality in the labor force, with more women entering the paid workforce and challenging traditional gender roles. Despite these changes, there are still significant gender differences in LFP. In the majority of nations, male LFP remains higher than female participation. This is the result of a variety of factors, including discrimination, unequal access to education and training, and societal expectations regarding gender roles and responsibilities. In fact, informal care is unpaid care provided by family members, typically women, to ill or disabled children, elderly parents, or other family members. Informal caregiving has a strong correlation with female LFP [14,15,16,17]
The dependency ratio is an age-population ratio of those typically not in the labor force (ages 0 to 14, and 65+) and those typically in the labor force (ages 15 to 64) and is likely influenced by the number of people actively looking for work. A high dependency ratio indicates a large number of dependents per person of working age, which can burden the economy. A high labour force participation rate indicates that many people are employed or actively seeking employment, which can stimulate economic growth. In general, a low dependency ratio and a high LFP rate are regarded as indicators of an economy's health. The dependency ratio is likely influenced by the number of people actively looking for work. Employment participation rates in ASEAN countries are found to be favorably affected by the Old-Age Dependency Ratio [18] The likelihood of being employed in Bangladesh is lower in households with an older person or a large dependency ratio [19] If disparities in education and LFP among demographic groups in the European Union (EU) were eliminated, the expected size of the labor force and labor force dependency ratio would change dramatically. The rise in the economic reliance ratio may be slowed by future increases in LFP ([20]). Without considering variations in the labor market participation, traditional reliance ratios for the elderly can be deceptive. However, a higher dependency ratio can strain pension systems, as fewer workers contribute to support a larger number of retirees.
Predicting the size of the working population is important. One of the methods is a stochastic forecasting model, whereby it incorporates population forecasting with LFP forecasting, while also considering the epidemiological factors. For example, the prevalence and economic implications of absenteeism in an aging population in Germany were projected using a unique stochastic forecasting approach [21]. In another study, [22] projected the Brazilian LFP rates using a stochastic model. Comparative analyses of labor force forecasting methods were also conducted [23] using the naïve prediction, balancing model, and forecasting based on the number of employed people in the economic sectors. Germany’s population and labor supply were also predicted until 2060, using a stochastic model [24] To illustrate the difficulties in anticipating LFP rates, [25] showed that a random walk model could predict the short-term aggregate LFP rates, as well as complex econometric models.
In this study we fit the LFP rates using the stochastic models of Lee-Carter and Cairns-Blake-Dowd (CBD). We then forecast the ELR using the better model. Thus, using and comparing stochastic models for the projection of LFP rates is an important contribution of this paper. To the best of our knowledge, there is no study that compares the Lee-Carter and the CBD models for the LFP rates since the CBD can be adapted to the higher ages of workers.
Several research suggested tweaks to the Lee-Carter model that would make it more effective at modeling and forecasting rates. Some examples of these adjustments are using a Bayesian method [26] incorporating randomness or an error term into the model [26,27], or employing a state-space model to get around the biodemographic constraint. Moreover, Lee-Carter model has been contrasted with other models, including the neural networks ([28]), autoregressive integrated moving average (ARIMA) model ([29]), and modified Lee-Carter model with bias-corrected estimators ([30]). Although several improvements have been made, the Lee-Carter model is still commonly used for predictions.
The CBD model and the Lee-Carter model were employed in various research to identify which best fits the data. CBD model with a cohort effect was found to provide the greatest fit for males in England and Wales ([31]), whereas the quadratic CBD model showed the best fit to mortality data in other studies ([32]). However, other research indicated that variants of Lee-Carter model better suit their data ([27,33]). Generally, selecting a model requires looking at multiple options, and deciding which one works best with the facts at hand. For simplicity of this research, the standard Lee-Carter model and CBD model were utilized to compare the LFP forecast for higher ages.
The phenomenon of older people engaging in the labour market at higher rates may indicate a propensity for extended employment. However, it is essential to distinguish between the factors of financial obligation and individual will. The presence of economic uncertainty, inadequate savings, and the escalating expenses associated with healthcare often serve as motivating factors for older people to prolong their participation in the workforce. Hence, the rise in labour market participation may not always signify a deliberate choice for delayed retirement, but rather a compulsion driven by economic circumstances. The implementation of policies that include older employees in the labour market, so extending the statutory retirement age, serves as a barrier to early retirement. [8,9,34,35] Research indicates that individuals belonging to low-income groups often engage in longer working hours in order to meet the demands of their living standards. [35] The policy of raising the statutory retirement age was not well viewed by older employees due to its failure to examine factors such as income level and employment preferences among this demographic [36]. In the event of a substantial labour force participation rate, especially among the elderly population, governmental entities may exhibit a greater propensity to provide incentives for individuals to postpone their retirement. Potential strategies to promote extended working lives may include modifications to pension schemes, tax incentives, or other retirement perks.
Elderly employees often possess a substantial reservoir of knowledge and specialised skills, making them very advantageous resources for businesses. If organisations acknowledge and incentivize this behaviour, it is possible that older employees may be more motivated to postpone their retirement, so indicating a sincere inclination towards prolonging their careers. There exists no discernible correlation between an augmentation in labour market engagement and a preference for delayed retirement among elderly individuals [37,38] Indeed, there exists a correlation between an augmentation in labour market engagement and the occurrence of early retirement among individuals in the older demographic. The early retirement of elderly employees has been prompted by the influx of new participants into the labour market. The adverse view of older employees, coupled with the belief that they exhibit lower levels of performance in comparison to their younger counterparts, may also serve as a contributing factor to the decision of early retirement [39] which may lead to age discrimination. Furthermore, it is worth noting that several circumstances, including both physical and mental health issues, have the potential to contribute to the occurrence of early retirement. [39,40,41].
The retirement choices made by elderly individuals may also be impacted by social interactions and the retirement patterns shown within their social circle. There is a higher probability that individuals will choose to retire if their family, friends, colleagues, or acquaintances choose for retirement at a younger age [42] The retirement choices of individuals may also be influenced by the retirement age of their spouse. For instance, individuals of the male gender who are approaching retirement age may exhibit a preference for retiring just if their significant other likewise chooses to retire. The influence of marital status and spousal work on retirement behaviour has been shown to be substantial. The presence of spouses in the labour market has the potential to impact the process of transitioning out of work, especially in cases when retirement is not a deliberate decision [43].
Retirement choices might be influenced by changes in pension schemes and retirement incentives as well. The transition from defined benefit (DB) to defined contribution (DC) retirement plans has had a role in the increase of labour market participation among older individuals [37,38]. The correlation between the time of retirement and wealth accumulation differs between defined benefit (DB) plans and defined contribution (DC) plans. In DB plans, retirement timing is often influenced by the accumulation of wealth, but in DC plans, wealth accumulation does not exert comparable incentives for retirement timing [37]. Retirement patterns may be influenced by several factors, including changes in Social Security regulations, modifications in pension schemes, and fluctuations in wages. For instance, research has shown that changes in the Social Security system have had an impact on the patterns of retirement seen in recent times.
This research aims to fit the stochastic models of Lee-Carter and CBD to LFP rates for individuals aged 50 and above using the data (1989-2021) from four OECD countries. These countries are considered because they have/will set their statutory retirement age at 65 in the pay-as-you-go (PAYG) system and represent the continents of Asia, North America and Europe. The goodness-of-fit of the two models and the forecasted LFP rates for these four countries were then compared. The attained value was then combined with mortality estimates from the United Nations to forecast the ELR for each gender, respectively. This study contributes in terms of providing a novel comparison between the Lee-Carter and Cairns-Blake Dowd (CBD) models, using the data from four OECD countries.

2. Materials and Methods

We used the OECD data [44]for years 1989 until 2021, provided in 5-year age groups. We divided the data into training set (1989-2016) and test set (2017-2021). The training and test sets were used respectively to estimate the parameters and to obtain the prediction errors (RMSE and MAPE). The labor force age groups considered in this study were 50-54, 55-59, 60-64, 65-69 and 70-74 years. To obtain single age data, the age group data was transformed into cubic spline data. Interpolation and forecasting with a cubic spline can be accurate and may assist in forecasting and interpolation for a wide range of disciplines [45,46,47,48,49] The LFP were fitted and forecasted using StMoMo R package by [50]
The Lee Carter model formula is as follows:
log m x , t = A x + B x k t + ε x , t
Where m x , t is the LFP rate at age x and year t; A x is the age pattern; B x is the sensitiveness in the movement of parameter k t ; k t measures the general level of LFP rates at year t; and ε x , t is the error term with mean 0 and variance σ 2 .
The parameters were estimated using Ordinary Least Square (OLS) and Single Value Decomposition method. Time series index k t was modeled with ARIMA technique, which was predicted via a random walk with drift.
Cairns-Blake-Dowd Model
The Lee-Carter model estimates the parameters using the central rate〖 m x , t while the CBD model estimates the parameters using the probability rate q x , t . In this study, adjustments were made to allow for a valid comparison between these models. Two assumptions were proposed; firstly, the central rate remained the same from age x to age x + 1 as well as from one year to the next, and secondly, the population remained stationary [51] The CBD formula is
log q x , t 1 q x , t = k t 1 + x x ¯ k t 2
where q x , t is the proportion of the population at age x and year t that is actively engaged in the labor market; k t 1 )is the intercept of the model (it affects every age in the same way, and it represents the level of remaining in labor force at time t); and k t 2 ) is the slope of the model (every age is differently affected by this parameter).
The best fit model was then utilized to estimate the duration of retirement [52]. Assuming for simplicity that the starting age of retirement is 50, to calculate the expected length of retirement (ELR) [53], the simplified version [52]is as follows:
E L R = ρ 20 50 x = 50 89 S x T x γ x 1 0.5 × 1 q x e x + e x + 1 2
where ρ 20 50 is the probability of surviving from age 20 until age 50; S x is the probability of surviving until age x; T x is the probability of remaining in the labor force until age x, assuming the worker survived to that age; γ x is the likelihood of retiring at age x if the worker is still employed at that age, 1 q x is the proportion of deceased people that is determined by the mortality rate within the age range; e x is the expectancy of life at age x; and e x + 1 is the expectancy of life at age x+1. We used the LFP rates to calculate γ x , whereas the survivorship and mortality estimates are calculated from the mortality forecasts of the United Nations.

3. Results

3.1. Results for Lee Carter Model

3.1.1. Time index k t

and Period effect, B x ,
The parameter estimates under the Lee Carter estimation for LFP male and female are shown in Figure A1 and Figure A2 shows the parameter estimates under the Lee Carter estimation for LFP male and female respectively. The B x values indicate the sensitivity of the rate to changes in the underlying factors captured by parameter k t . The higher the B x value, the more responsive the rate is to the changes in k t .
The B x values peaked at 0.08 (age 67), 0.06 (age 63), 0.06 (age 63) and 0.10 (age 67), respectively for Canada, Finland, Germany and Japan, indicating that Canada and Japan had higher sensitivities to the changes in k t at age 67. All four countries reached the minimum at around 0.00 (age 74). These differences suggested that country-specific factors may influenced the rate, and the underlying factors were captured by the k t parameter of Lee-Carter model.
We also estimated the parameters of Lee Carter model for female LFP rate (age 50-74) and the parameters are shown in Figure A2. The B x values peaked at 0.06 (age 67), 0.06 (age 63), 0.07 (age 63) and 0.10 (age 67), respectively for Canada, Finland, Germany and Japan, showing almost similar trend with the male LFP rate. However, all four countries reached the minimum value at different ages. Canada reached its minimum at 0.03 (age 73), Finland at 0.00 (age 74), Germany at 0.02 (age 66) and Japan at 0.02 (age 74).
The difference in the sensitiveness of B x values between male and female LFP rates implied that there might be gender-specific factors influencing the rates. It also suggested that changes in economic, social, or demographic conditions captured by the k t   parameter had a stronger influence on female LFP rates compared to male. Therefore, the findings indicated that there were gender disparities in the LFP rates, with females being more responsive to the changes captured by the k t   parameter. These disparities could be influenced by several factors, including societal norms.

3.1.2. Forecasted k t

Both male and female LFP rates in Canada, Finland, Germany and Japan demonstrated improvements. The k t values for both genders generally increased, indicating an upward trend in the LFP rates. This suggested that more individuals, irrespective of gender, have been actively participating in the labor market in these countries.
For female, all four countries reached the minimum value at different ages in Figure A4. Canada reached its minimum at 0.03 (age 73), Finland at 0.00 (age 74), Germany at 0.02 (age 66) and Japan at 0.02 (age 74). Both male and female LFP rates in Canada, Finland, Germany and Japan demonstrated improvements. The k t values for both genders generally increased, indicating an upward trend in the LFP rates. This suggested that more individuals, irrespective of gender, have been actively participating in the labor market in these four countries.

3.2. Results for Cairns-Blake-Dowd Model

3.2.1. Time index k t ( 1 )

and k t ( 2 ) Figure 1 shows the time-varying parameter of CBD model for male LFP rates (1989-2016) in four countries; Canada, Finland, Germany and Japan. The time index k t ( 1 ) is the model intercept, therefore it affects all ages equally. Specifically, if k t ( 1 ) decreases over time, it indicates that people of all ages are entering the labor force at an increasing rate. The slope of the model is represented by the time index k t ( 2 ) , which affects each age in a unique way. For male laborforce, The k t ( 1 ) and k t ( 2 )   values for Canada, Finland and Germany showed declining trends in 1989-2000 and increasing trends in 2000 onwards. In Japan, the k t ( 1 ) and k t ( 2 )   values showed declining trends in 1989-2005 and increasing trends in 2005 onwards.
For female workers in Figure 2, the k t ( 1 ) and k t ( 2 )   values showed increasing trends. The increasing trend of k t ( 1 ) values indicate that workers at all ages entered the labor force at a decreasing rate. The increasing trend of k t ( 2 ) values indicate that the rate of labor force entrance is higher at higher ages (older workers) which are shown in Figure 2.

3.2.2. Forecasted k t ( 1 )

and k t ( 2 ) The forecasted k t ( 1 ) and k t ( 2 ) are shown in Figure A5 and Figure A6 for male and female LFP rates (ages 50-74) respectively for years 2017-2066 in four countries (Canada, Finland, Germany and Japan). The k t ( 1 ) values for all countries and both gender (except for male workers in Finland) showed a general pattern of increasing rates over time. On the contrary, the male LFP in Finland showed a decreasing rate. As for the k t ( 2 ) values, all countries and both genders showed a general pattern of increasing rates over time. The relatively stable values of k t ( 2 ) for all countries, which were close to zero, suggested consistent improvements in the LFP rates across different age groups. The improvements were not skewed toward specific age cohorts but were spread evenly across different age groups.

3.3. Labor Force Participation (LFP) rate

The training and test sets were used respectively to estimate the parameters and to obtain the prediction errors (RMSE and MAPE). We select the better model between Lee-Carter and CBD by comparing the AIC, BIC, RMSE and MAPE using the test data (2017-2021). Table 1 shows the out-of-sample results for male and female LFP rates for all four OECD countries.
The AIC and BIC of CBD model were higher than Lee-Carter model, indicating a poorer fit to the data. The RMSE and MAPE for CBD model were also higher than Lee-Carter model, indicating a lower accuracy in forecasting the LFP rates. Based on these measures, the Lee-Carter model outperformed the CBD model.
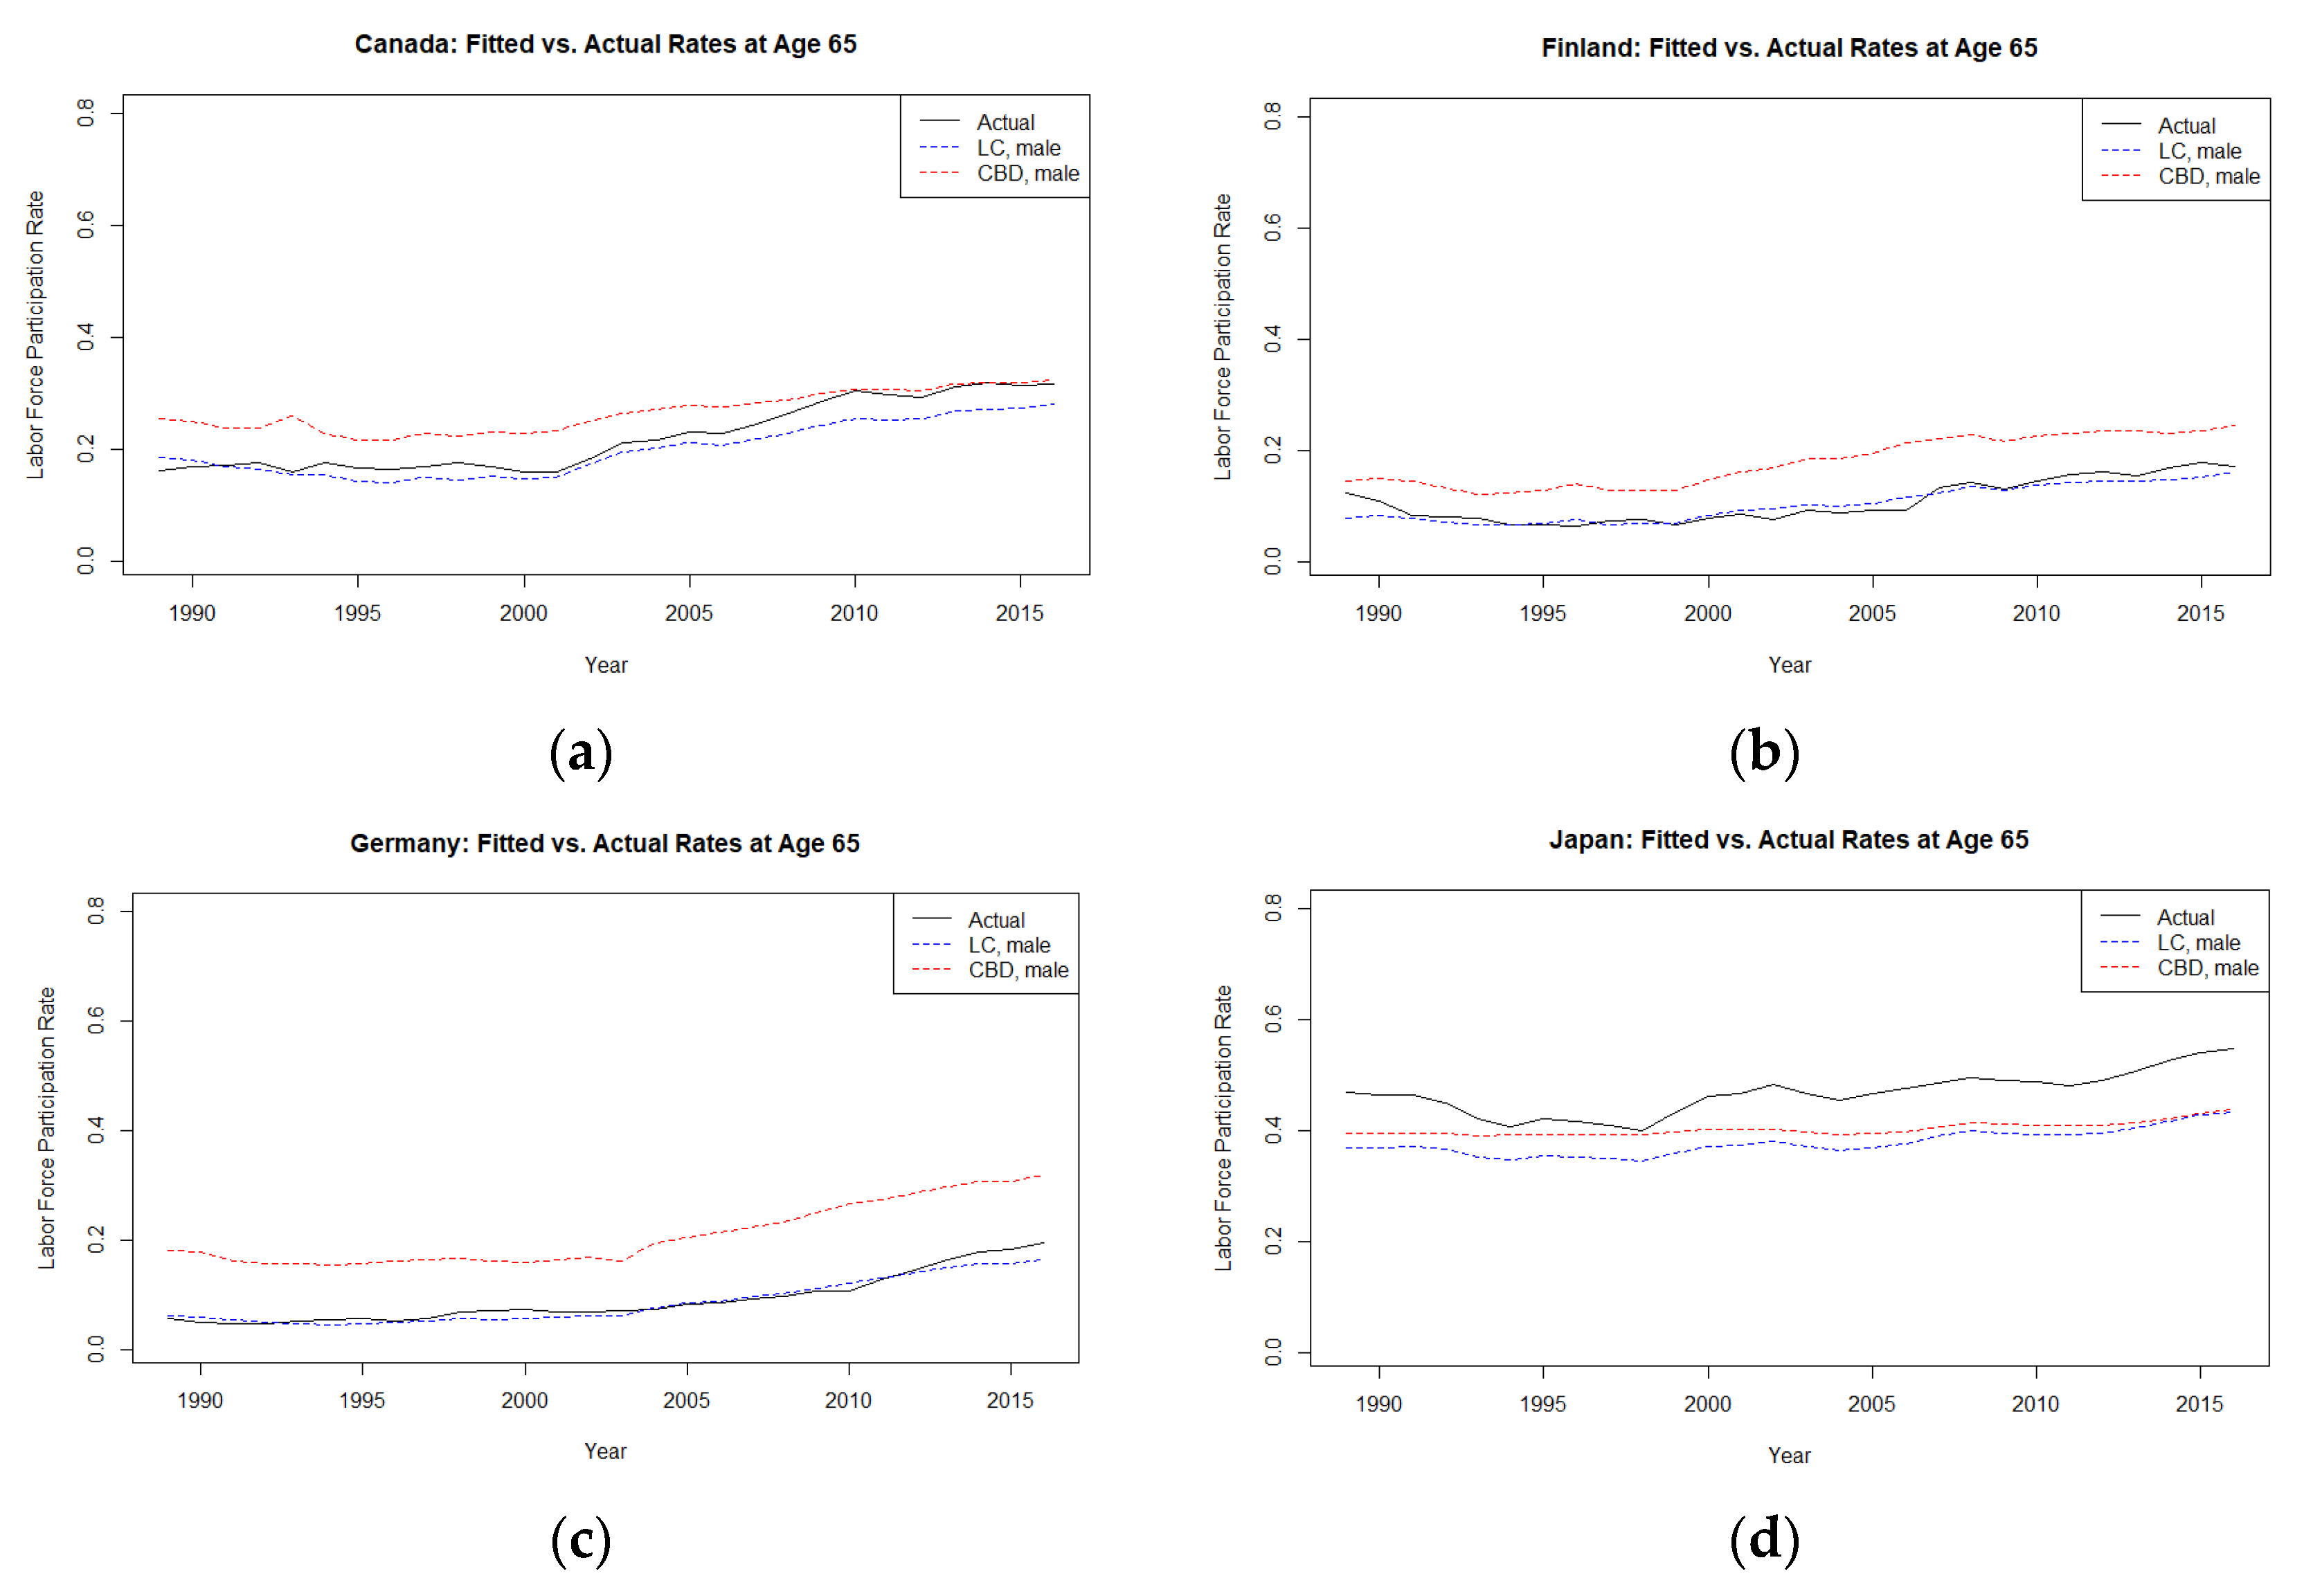
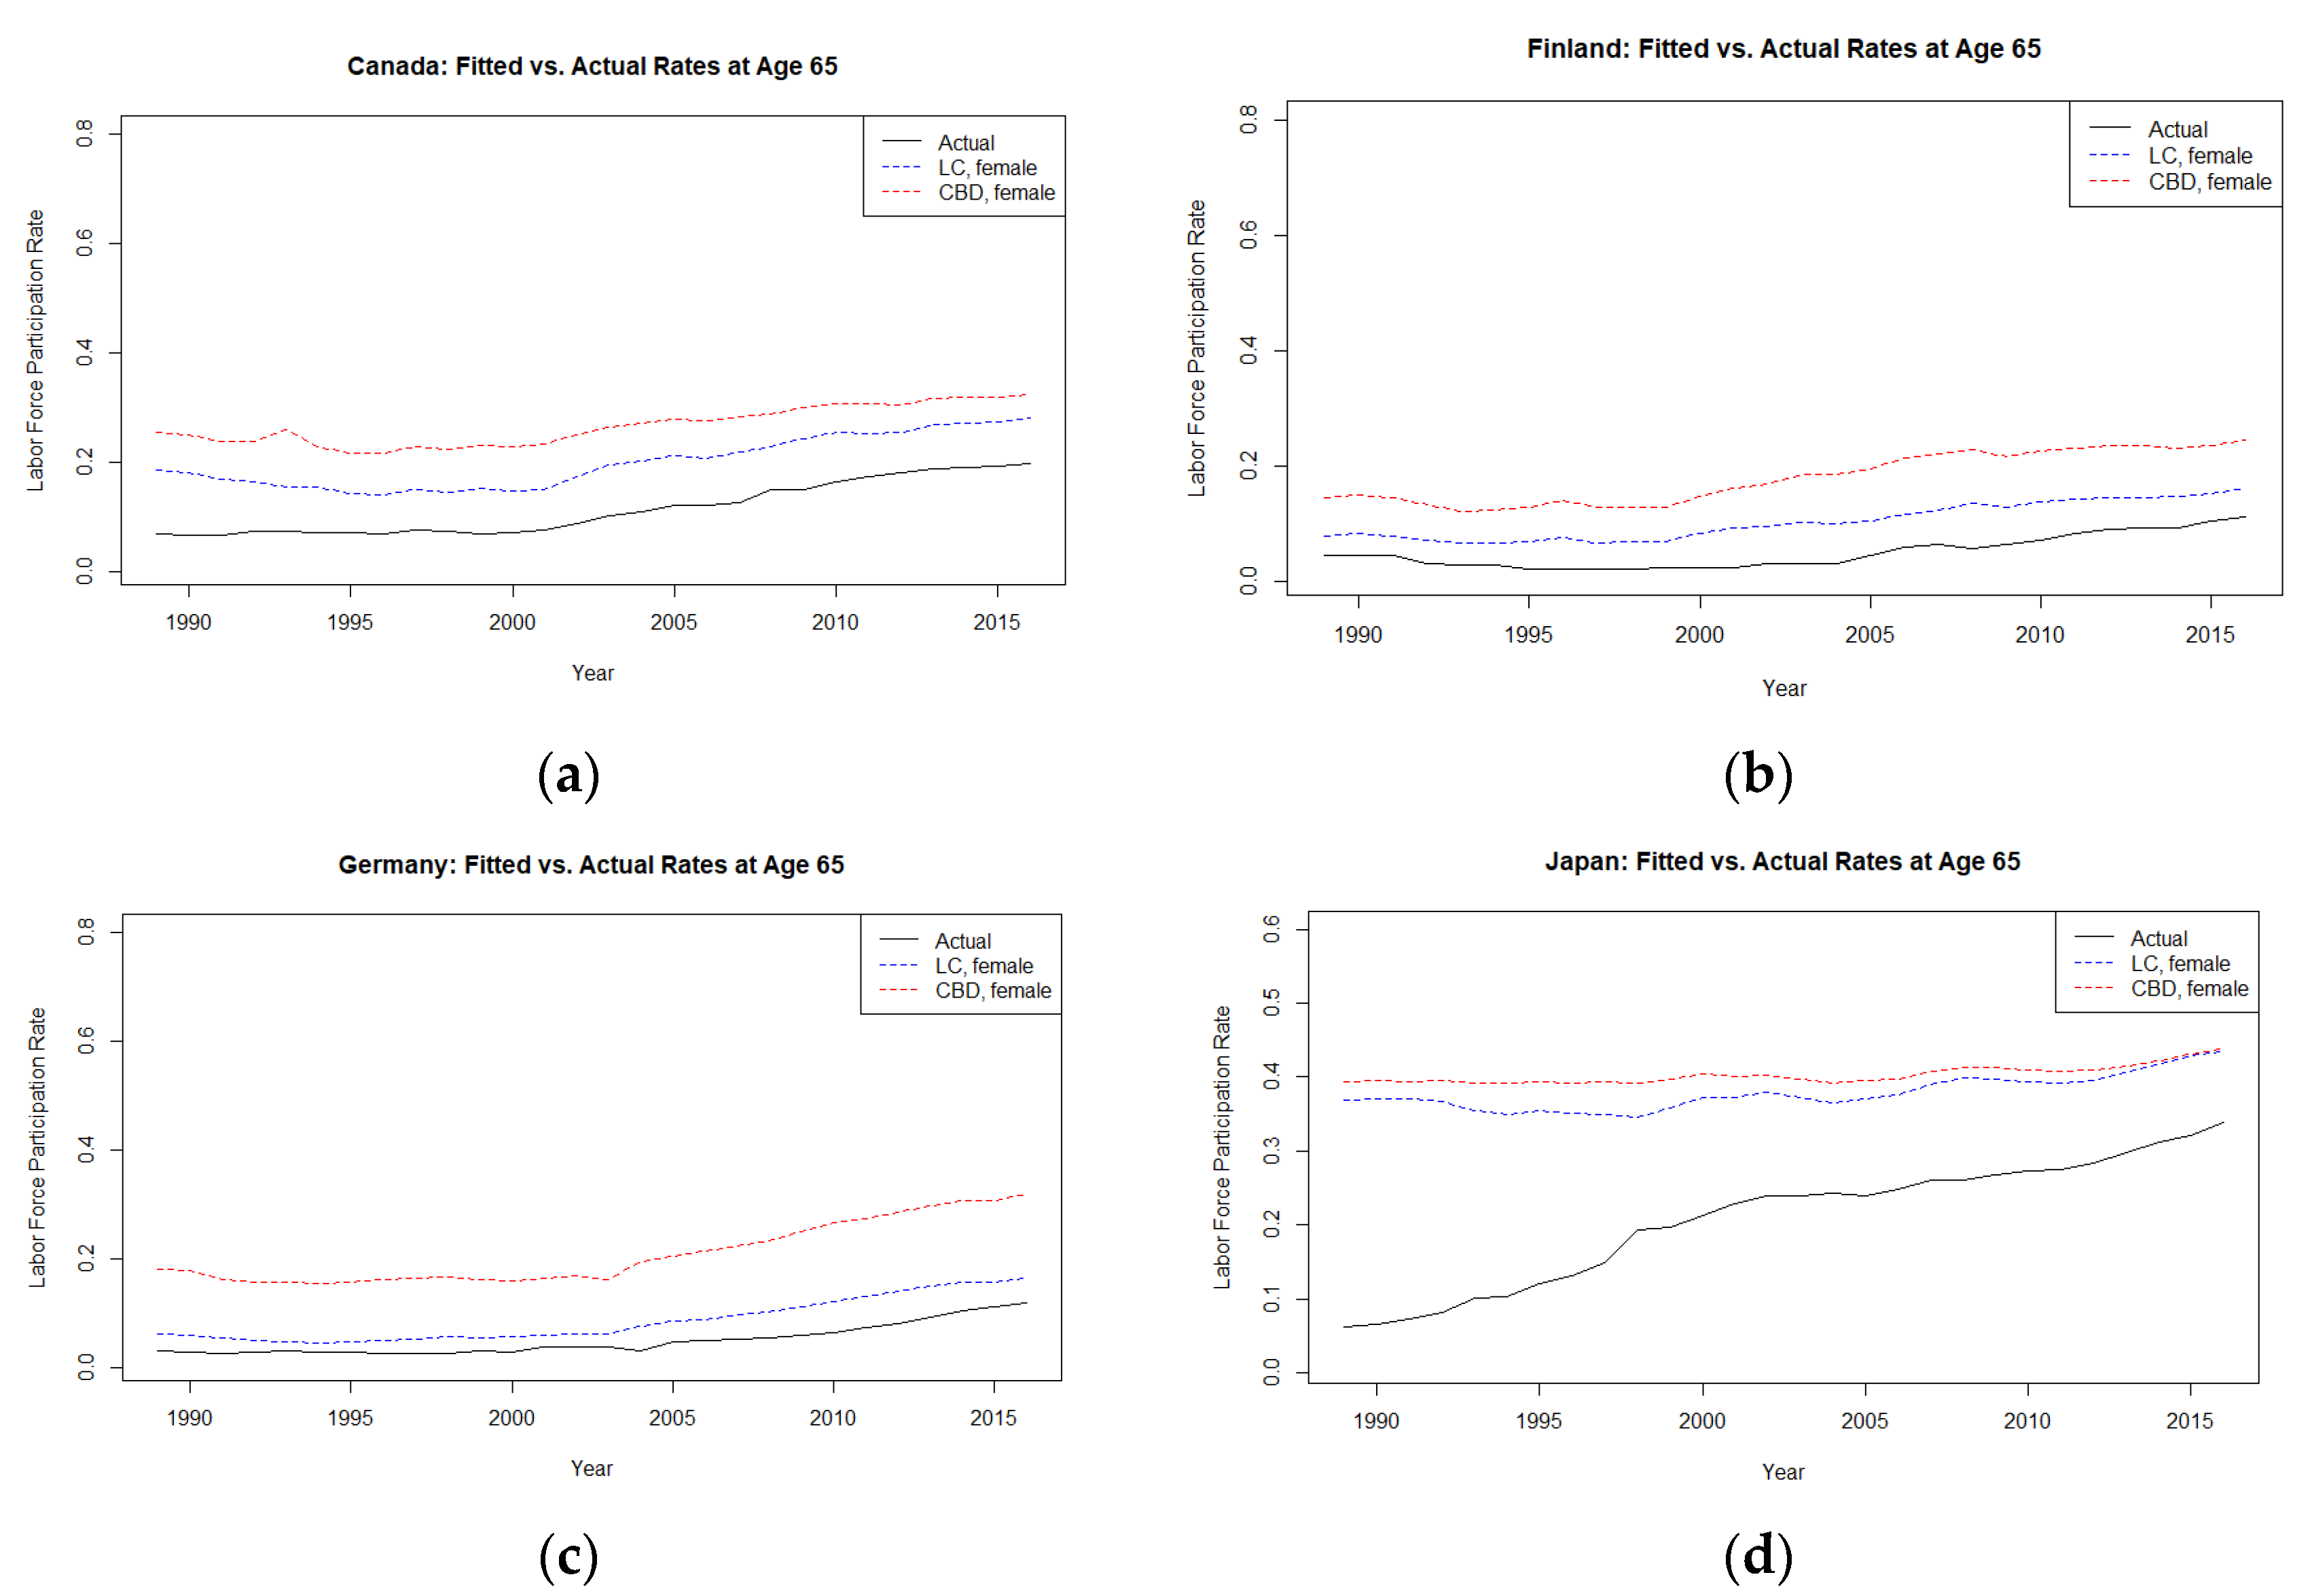
Figure 2 and Figure 3 illustrated the observed vs. fitted LFP rates (in logarithmic scale) for years 1986-2016 based on Lee-Carter and CBD models respectively for male and female workers at age 65. Both Lee-Carter and CBD curves demonstrated increases in LFP rates for male and female workers at age 65 in all four countries and both genders. Overall, the Lee-Carter curves are closer to the actual LFP rates, making it more reliable for forecasting. Although the figures are not shown here, the Lee-Carter curves for ages 55 and 75 demonstrated an acceptable degree of convexity, making them preferable compared to CBD curves.

3.4. Duration of retirement

Working life expectancy and expected length of retirement (ELR) are two related concepts that are important when considering employment and retirement planning. Working life expectancy is the projected number of years an individual is expected to be actively participating in the labor force, while the ELR is the projected number of years an individual is likely to spend in retirement after he (or she) exit the labor force. The percentage of working life spent by men and women in Canada and Finland is quite similar, but different in Germany and Japan. Women in Japan have lower working life expectancy than men. [54].
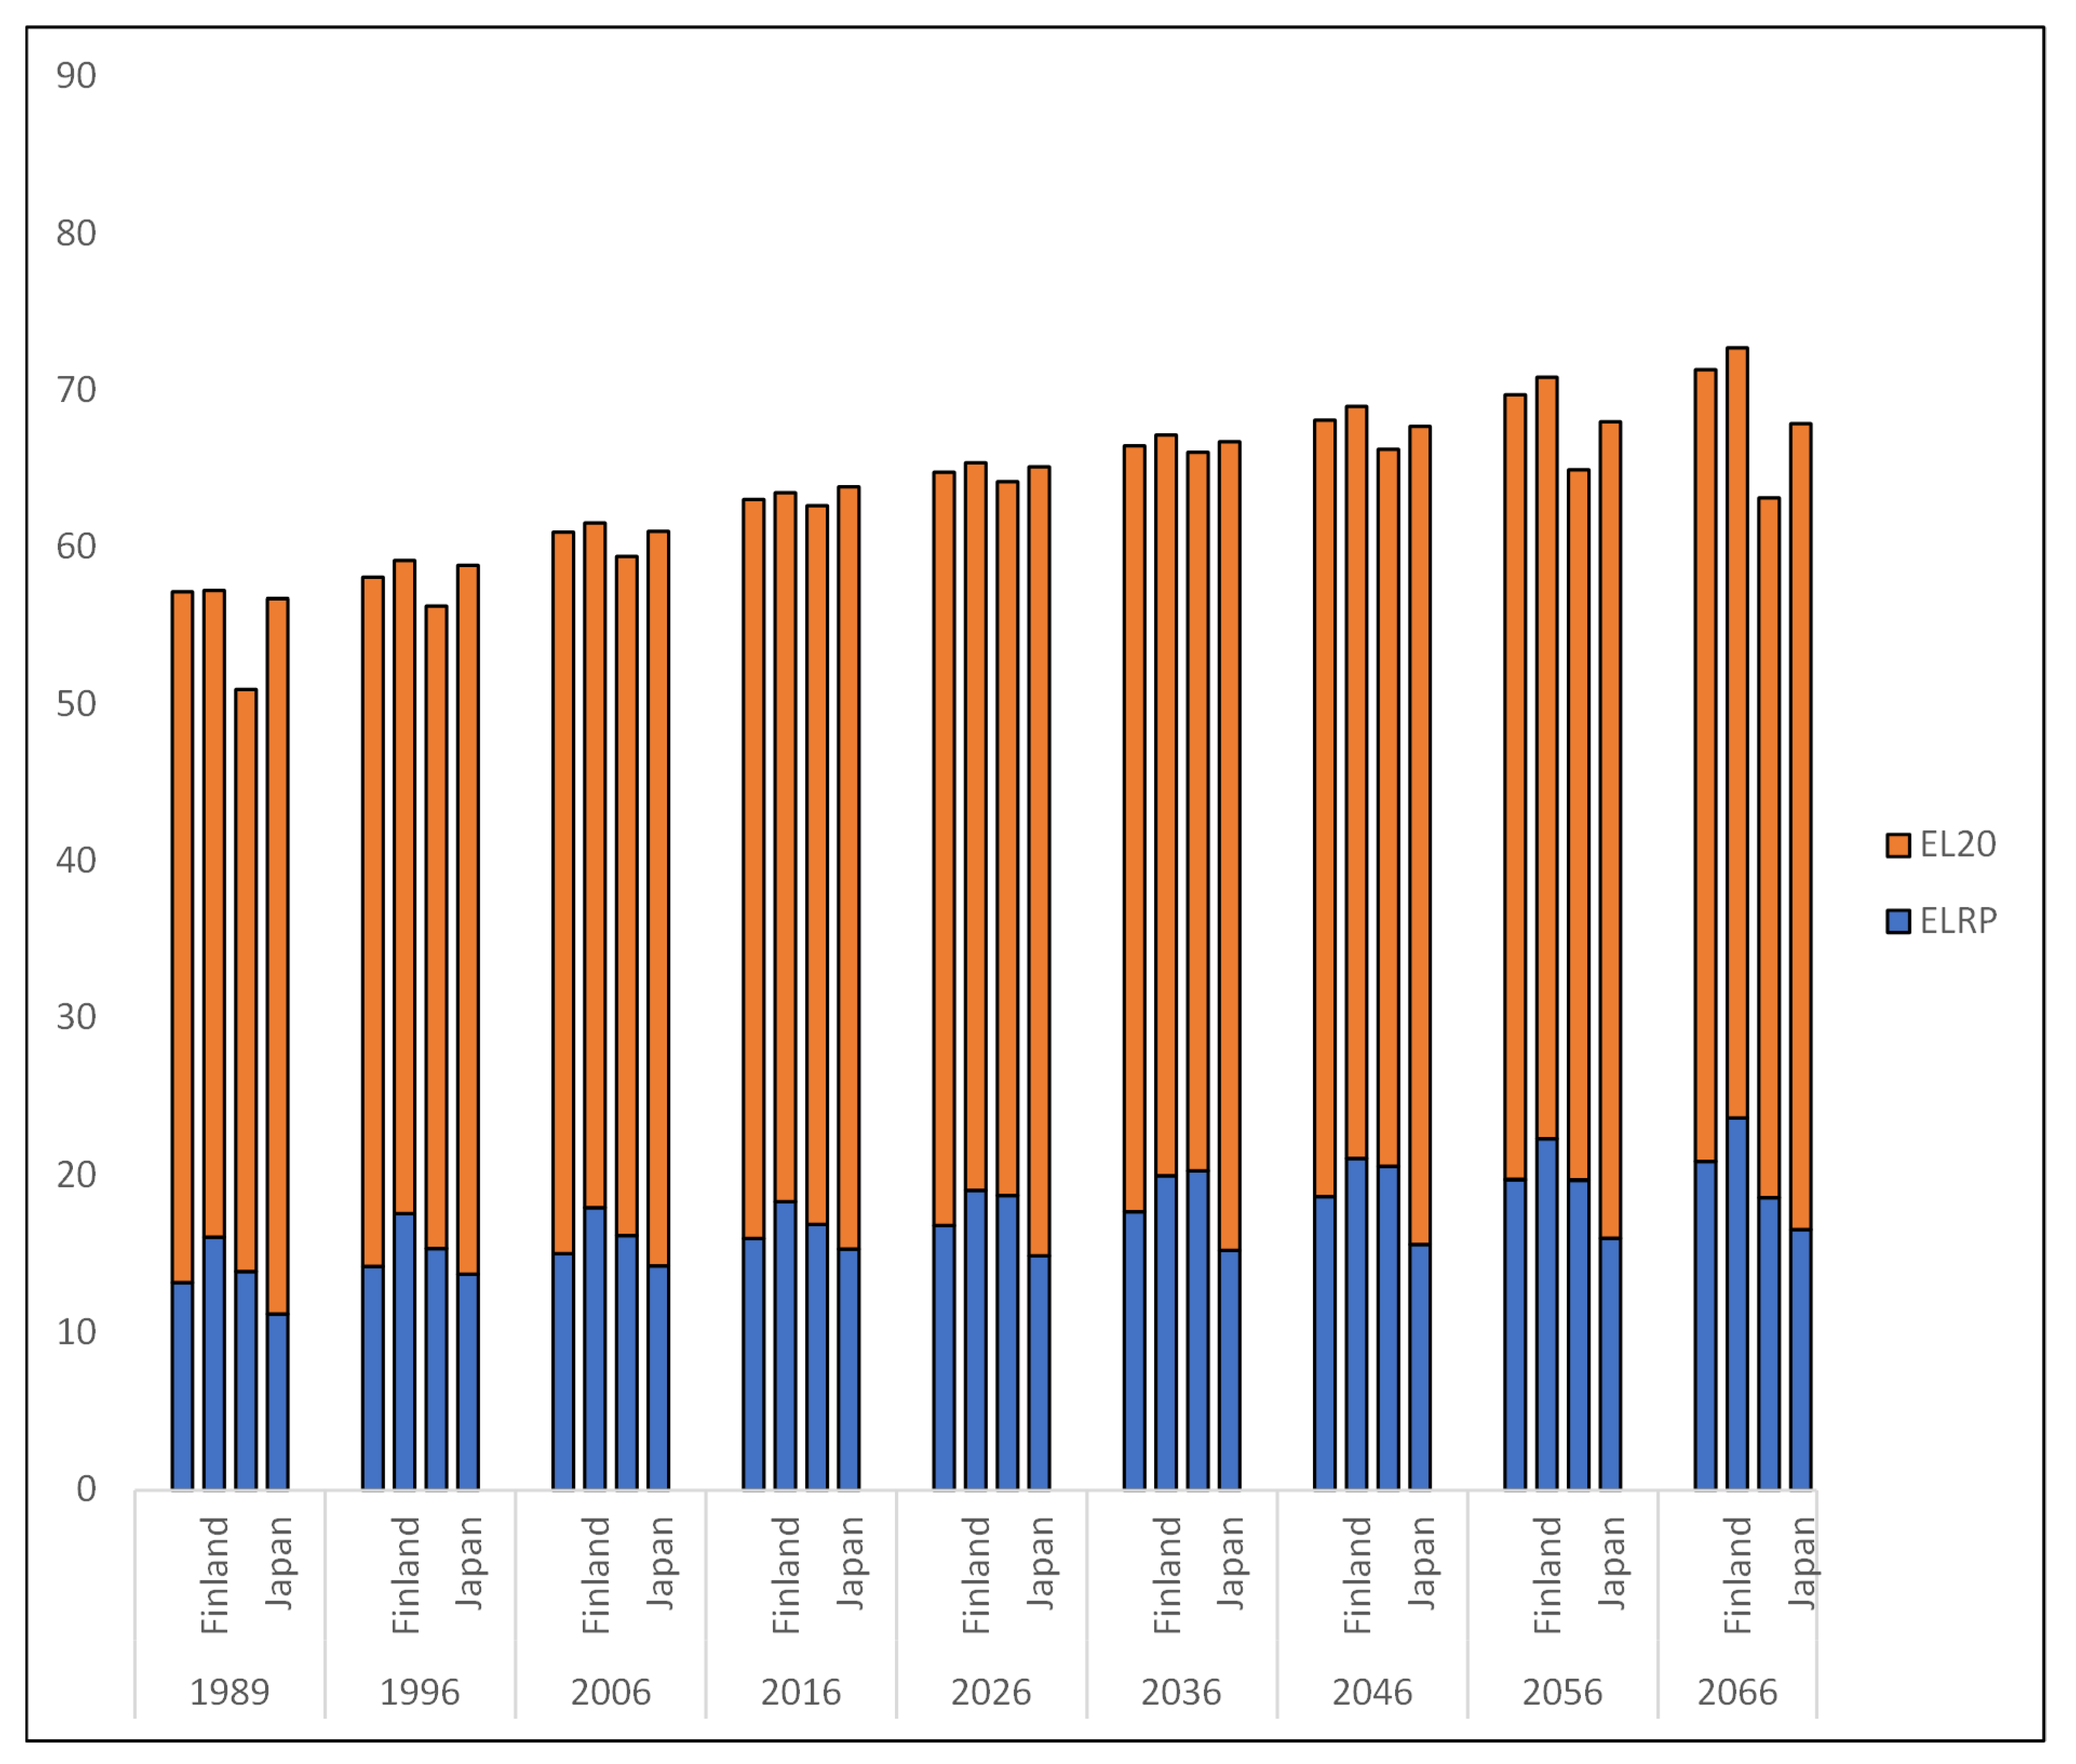
The life expectancy at age of 20 can be used as an indicator for the working life of a worker. In this study, age 20 is chosen as the mean age of entry into the job market [55]. Figure A5 shows the life expectancy at age 20 for female populations in Canada, Finland, Germany and Japan ([56]
The significance of demographic transitions and prospective shifts in retirement habits is shown by the projections from 2026 until 2066 in Table 2 and Table 3, which shows a continuous increase in the ELR. There has been a steady growth in the retirement age in Canada throughout the years. People in Canada are living in retirement for longer periods of time, and this trend is anticipated to continue. Retirement age has been rising steadily in Finland during the past several decades. According to the projections for the future, this pattern of longer retirement age seems likely to continue. In Germany, the average retirement age is rising rapidly.
The ELR from 2026 until 2066 show that all countries were forecasted to have higher ELR, where the increments were higher for female workers. These results show that even though the LFP rate increased over the years, the decline in mortality rates and the increase in life expectancy were larger. The decrease in LFP rate for old ages may also contribute to the rise in the ELR. The results demonstrated that across all four countries, female retirees were expected to spend more time in retirement than in the past. Among the countries examined, Finland regularly displayed the longest ELR for female retirees, while Japan consistently showed the lowest.
This demonstrated a lengthening of retirement ages. There has been a little change in the typical age of retirement in Japan during the past few decades. In the years ahead, retirement age is predicted to rise. In light of the sustainability issues of pension scheme, several studies recommended the transition to define contribution plan for public servants, rather than revising on changes in retirement age, coverage, pension benefits, and contributions, especially in OECD countries [57].

4. Discussion

The projections of LFP trends showed an overall upward trend over time. The stochastic mortality models provided a more complete picture of the future LFP patterns by using a probabilistic framework that accounts for inherent uncertainties. Both Lee Carter and CBD models use random fluctuations to provide a variety of potential outcomes, in contrast to deterministic models that generate a single set of outcomes based on fixed assumptions.
In mortality forecasting and analysis, the Lee-Carter and Cairns-Blake-Dowd (CBD) models were both widely utilized. While both models have advantages and disadvantages, the Lee-Carter model is superior to the CBD model for several reasons. The Lee-Carter model has been extensively researched and applied in a variety of contexts, demonstrating its robustness and adaptability. It has been used to forecast mortality rates for various populations and has demonstrated its ability to capture mortality trends [58,59,60,61]. The model permits the estimation of age-specific mortality levels and rates of change, thereby shedding light on mortality patterns.
In addition to being a favored choice for mortality modelling, the CBD model has some limitations. The CBD model posits a two-factor structure for mortality rates, with one factor affecting all ages and another factor predominantly influencing older ages. This assumption may not hold true for all populations, limiting the model's ability to capture more complex mortality patterns [33,62]
The retirement outlooks in the selected OECD countries differ for each country. As for Canada, the retirement age was raised from 65 to 67-year-old, but the government also took steps to lessen the impact. on weaker groups like women. To assist women who need to take time off from work to care for family members, or who may not have accrued enough pension contributions, the government provided an optional option to defer collecting the benefits from the Canada Pension Plan until the age of 70. This option may provide larger total pension income in comparison to those who begin collecting benefits at an earlier age [63]. Significant progress in Finland has been made in promoting gender equality and work-life balance, which has contributed to the high levels of female LFP in the country. Regarding familial outcomes, majority of research were focused on the connection between child-care availability and mothers’ labor supply [64]. The emphasis on work-life balance is one of the main factors that contribute to Finland's high LFP. The nation has made work-life balance a policy priority, which has had a positive effect on the society ([65]. This has enabled women to partake in labor force while also fulfilling their responsibilities as carers. The availability of institutional childcare has also been a significant factor in Finland's high LFP. [66] ranked the nation highly in terms of excellence of its formal childcare provision.
In terms of gender gap role, women in the workforce in Germany might be impacted by the country’s pension reform, which made people work longer to qualify for retirement benefits. One of the key problems was that As a result of caring obligations and gender pay inequalities, women might frequently have shorter careers and lower salaries than men. Women might find it more challenging to accrue the required pension contributions and be eligible for a respectable pension when they retire. Therefore, raising the retirement age may disproportionately impact women, particularly those who hold part-time or low-paying occupations regardless of education attainment [67,68]
Countries with ageing populations, particularly Japan and Germany, may exhibit varying LFP rates among older individuals compared to countries with younger populations, as shown from the forecasted results in this study. This can be attributed to the need to sustain pension systems and the demand for experienced labour, as elucidated by the variability observed in the forecast results. After the implementation of pension system reforms, the projected retirement age in Germany has increased. Consequently, many older workers have expressed their willingness to extend their retirement [69,70]. However, evidence suggests a growing disparity in social inequality during the transition from work to retirement. High-skilled workers tend to retire at a later age, while low-skilled workers who typically prefer early retirement may be expected to work longer to secure adequate pension [69].
It is important to note that the rise in the statutory retirement age in Japan could potentially impact the LFP and retirement decisions [71] .In addition to gradually raising the retirement age, Japanese government has also taken steps to encourage women to stay in the workforce, including encouraging equal pay, expanding access to childcare, and offering tax breaks to firms who recruit women. The decline in fertility rates and the ageing of Japan's population may have implications for the trend of LFP [24,72].
The consequences for the Pay-As-You-Go (PAYGO) system and the financial viability of social security systems may be influenced by the old-age dependence ratio. Elevated levels of old-age dependence ratio may impose burdens on the working-age demographic and require modifications to the PAYGO system. When a nation experiences a high old-age dependence ratio, the working population is confronted with an increased responsibility to financially support the living costs of the older populace [73]. This scenario may have ramifications for the PAYGO mechanism. The alterations in the old-age dependence ratio may have significant repercussions for fiscal sustainability and economic development because the financial support for present retirees' benefits is reliant on the contributions made by the existing workforce [74,75].
The challenge of balancing work and family obligations has long been a persistent struggle, primarily by women workers. Despite the global labor market experiencing an increase in women's participation, they continue to bear a disproportionate burden of caregiving duties. This phenomenon is of utmost importance in influencing women's decisions regarding employment, career paths, and retirement possibilities. There is a positive and significant relationship between women's age and their LFP especially among older women (Majumder and Dey, 2021). However, it is worth noting that it is common for women to decrease their working hours and subsequently experience a decline in their incomes due to caregiving responsibilities (Alcover et al., 2022). Among other factors are the intensity of caregiving responsibilities, the compatibility between individuals and their job, and the level of conflict between work and personal life (Noone et al., 2018; boer Vuuren 2021). The caring responsibilities of women have a substantial impact on their ability to participate in the labor market and on their eligibility for early retirement.
The significant increase in life expectancy has a profound impact on the LFP and fundamentally alters the dynamics surrounding late retirement options. The perception of "old age" has led people to consider planning for longer careers. The LFP’s age is projected to increase in the future for both genders. Therefore, individuals need to consider not only their financial needs but also their intellectual and emotional engagement with work. The pension reform to implement retirement age around 65-67 may be achievable. This is in line with the changes in Social Security regulations between 1992 and 2004 which resulted in a two-percentage-point increase in the proportion of 65- to 67-year-olds working full-time [25,76]. The availability of health facilities and improved access to health services can also have an impact on women's life expectancy and their participation in the labor force [77]
Social Security and pension benefits provide individuals with a financial safety net, and thus, allowing them to extend their working years beyond the traditional retirement age. Increasing statutory retirement age may be achievable as the LFP forecast until 2066 is expected to rise for higher age. Thus, the presence of social security programmes can significantly influence retirement decisions as individuals tend to delay their retirement when they have access to these benefits [78,79]
In OECD countries, there is a significant relationship between socioecological measures of wealth such as salary and pension, income inequality, education, and employment, and health outcomes such as life expectancy, healthy life expectancy, and adolescent health [80] especially since the life expectancy of male is lower than female [81]. The improvement in life expectancy does not necessarily indicate an overall enhancement in health conditions for older workers. Factors contributing to early retirement include illness and hazardous behaviour. The presence of chronic diseases and psychological disorders was associated with a higher probability of early retirement [82] and poor adult health has been shown to negatively impact wages, LFP, and ultimately earnings [83,84,85]). The effects of health such as the onset of chronic conditions like cardiovascular disease [86,87]in later life may disrupt the LFP, earned income, and wealth.
Predicting LFP rates can be difficult due to behavioral changes over time [25]. Without more specific data and analysis, it is difficult to provide an accurate forecast for LFP. The variations in retirement prospects and rates of engagement in the workforce among elderly adults, including the OECD nations, have noteworthy consequences for economic development, social fairness, and the long-term viability of public pension schemes.

5. Conclusions

The objective of this study was to fit the LFP rates for several OECD countries using the Lee-Carter and Cairns-Blake-Dowd (CBD) stochastic models. The results showed that the Lee-Carter model performed better than the CBD model in terms of forecasting the LFP rates. Generally, both men and women were projected to have higher LFP rates in the later years (2066) compared to the earlier years (2016), and therefore were more likely to be actively seeking employment in the later years.
The estimates of the LFP rates from the Lee-Carter model were then used for the projection of the future LFP rates and the expected length of retirement (ELR) for the years 2026 until 2066. The results showed that Germany is anticipated to experience the highest increase in the ELR for male workers (15 to 22 years), followed by Japan (12 to 16 years), Canada (14 to 17 years), and Finland (15 to 17 years). As for female workers, Finland is expected to have the highest increase (19 to 24 years), followed by Canada (17 to 21 years), Japan (15 to 17 years) and Germany (19 to 20 years in 2056).
The trends and changes in retirement age, the life expectancy at the age of 20, and the percentage of life spent working differ between nations. The life expectancy at the age of 20 was rising, the fraction of people who were expected to actively work fluctuated slightly, and the number of years expected to spend in retirement period increased or remained the same. For male workers, Germany was expected to have the highest working life expectancy. The average age for starting retirement is increasing or remaining the same in most countries, indicating that people are living longer in their retirement years.
Female workers tend to be varied when it comes to retirement preference depending on their social responsibilities, family responsibilities and financial outcomes. Predictions show that the female participation rate will increase in the future especially when the life expectancy has improved over time. As mentioned by [22] mortality improvement will influence retirement outcome. The elderly would rather work than retire and relax during their golden ages and offer their invaluable skills and wisdom.
The results showed that even though the LFP rate is expected to increase, the ELR is projected to increase as well. The LFP after the age of 64 will still be a real concern, and raised the question of whether the old age workers should work or retire at such golden ages. Other factors such as demography, social and economic should also be considered in the LFP model to better forecast the future needs for the PAYGO system. To cater for the improved fertility and life expectancy, there are certainly other options to consider in pension reform other than increasing the retirement age. institutional heterogeneity and highlighted policy changes, education levels, and personal wealth as the factors that drive the increase in retirement age; therefore, it is crucial to predict whether the OECD countries' LFP will follow the same pattern as in more developed economies [88], [89]. For future research, cohort effect and wider age span would really help in forecasting the LFP rate. In fact, by looking into other factors such as educational level, performance of labor demand, and level of informality within the labour market in the pension program will help to better understand the trends of LFP rate in the sustainable future.

Author Contributions

Conceptualization, S.F.R. and N.I..; methodology, S.F.R.; software, N.H.A.J.; validation, S.F.R., N.I. and Z.I.; formal analysis, Z.I..; investigation, R.A.R..; resources, N.I.; data curation, Z.I and N.I.; writing—original draft preparation, S.F.R.; writing—review and editing, N.H.A.J..; visualization, R.A.R.; supervision, N.I..; project administration, Z.I.; funding acquisition, N.I. All authors have read and agreed to the published version of the manuscript.

Funding

This research received no external funding.

Data Availability Statement

We encourage all authors of articles published in MDPI journals to share their research data. In this section, please provide details regarding where data supporting reported results can be found, including links to publicly archived datasets analyzed or generated during the study. Where no new data were created, or where data is unavailable due to privacy or ethical restrictions, a statement is still required. Suggested Data Availability Statements are available in section “MDPI Research Data Policies” at https://www.mdpi.com/ethics.

Acknowledgments

The authors express appreciation to Ministry of Higher Education (MOHE) of Malaysia and Universiti Teknologi MARA (UiTM) for the schol-arship (SLAB).

Conflicts of Interest

The authors declare no conflict of interest. The funders had no role in the design of the study; in the collection, analyses, or interpretation of data; in the writing of the manuscript; or in the decision to publish the results.

References

  1. Felstead, A. Closing the age gap? Age, skills and the experience of work in Great Britain. Ageing Soc. 2010, 30, 1293–1314. [Google Scholar] [CrossRef]
  2. Chomik, R.; McDonald, P.; Piggott, J. Population ageing in Asia and the Pacific: Dependency metrics for policy. J. Econ. Ageing 2016, 8, 5–18. [Google Scholar] [CrossRef]
  3. Louria, D.B. Extraordinary Longevity: Individual and Societal Issues. J. Am. Geriatr. Soc. 2005, 53, S317–S319. [Google Scholar] [CrossRef]
  4. Felstead, A. Closing the age gap? Age, skills and the experience of work in Great Britain. Ageing Soc. 2010, 30, 1293–1314. [Google Scholar] [CrossRef]
  5. Cloostermans, L.; Bekkers, M.B.; Uiters, E.; Proper, K.I. The effectiveness of interventions for ageing workers on (early) retirement, work ability and productivity: a systematic review. Int. Arch. Occup. Environ. Heal. 2015, 88, 521–532. [Google Scholar] [CrossRef] [PubMed]
  6. Thang, L.L. Population aging, older workers and productivity issues: the case of Singapore. J. Comp. Soc. Welf. 2011, 27, 17–33. [Google Scholar] [CrossRef]
  7. Van Dalen, H.P.; Henkens, K.; Schippers, J. Productivity of Older Workers: Perceptions of Employers and Employees. Popul. Dev. Rev. 2010, 36, 309–330. [Google Scholar] [CrossRef] [PubMed]
  8. Szinovacz, M.E. Introduction: The Aging Workforce: Challenges for Societies, Employers, and Older Workers. J. Aging Soc. Policy 2011, 23, 95–100. [Google Scholar] [CrossRef] [PubMed]
  9. Bjursell, C.; Nystedt, P.; Björklund, A.; Sternäng, O. Education level explains participation in work and education later in life. Educ. Gerontol. 2017, 43, 511–521. [Google Scholar] [CrossRef]
  10. Bonin, H. 15 Years of Pension Reform in Germany: Old Successes and New Threats. Geneva Pap. Risk Insur. - Issues Pr. 2009, 34, 548–560. [Google Scholar] [CrossRef]
  11. Fukawa, T. Japanese Welfare State Reforms in the 1990s and Beyond: How Japan is Similar to and Different from Germany. Vierteljahr. zur Wirtsch. 2001, 70, 571–585. [Google Scholar] [CrossRef]
  12. Kyyrä, T. Early Retirement Policy in the Presence of Competing Exit Pathways: Evidence from Pension Reforms in Finland. Economica 2015, 82, 46–78. [Google Scholar] [CrossRef]
  13. G. A. Spedicato and G. P. Clemente, “Mortality projection with demography and lifecontingencies packages,” no. 2013, 2013, [Online]. Available: https://cran.r–project.org/web/packages/lifecontingencies/vignettes/mortality_projection.pdf.
  14. Dey, I. Wearing Out the Work Ethic: Population Ageing, Fertility and Work–Life Balance. J. Soc. Policy 2006, 35, 671–688. [Google Scholar] [CrossRef]
  15. Kelle, N. Combining employment and care-giving: how differing care intensities influence employment patterns among middle-aged women in Germany. Ageing Soc. 2020, 40, 925–943. [Google Scholar] [CrossRef]
  16. Lyberaki, A. Migrant Women, Care Work, and Women's Employment in Greece. Fem. Econ. 2011, 17, 103–131. [Google Scholar] [CrossRef]
  17. Yamamoto, H.; Arimura, S.; Nakanishi, A.; Shimo, Y.; Motoi, Y.; Ishiguro, K.; Murakami, K.; Hattori, N.; Aoki, S. Age-related effects and gender differences in Japanese healthy controls for [123I] FP-CIT SPECT. Ann. Nucl. Med. 2017, 31, 407–412. [Google Scholar] [CrossRef]
  18. G. M. Manansala, D. G. M. Manansala, D. V Jan Marquez, and M. L. Antoinette Rosete, “Journal of Economics, Finance and Accounting Studies Social Security On Labor Markets to Address the Aging Population in Selected ASEAN Countries,” 2022. [CrossRef]
  19. W. S. Khan, “Journal of Humanities and Social Sciences Studies Factors Affecting Labor Force Participation Decision in Bangladesh: An Empirical Study Using Microdata,” 2022. [CrossRef]
  20. N. Maestas and J. Zissimopoulos, “W O R K I N G P A P E R How Longer Work Lives Ease the Crunch of Population Aging,” 2009. [Online]. Available: http://ssrn.com/abstract=1526761Electroniccopyavailableat:https://ssrn. 1526.
  21. Vanella, P.; Wilke, C.B.; Söhnlein, D. Prevalence and Economic Costs of Absenteeism in an Aging Population—A Quasi-Stochastic Projection for Germany. Forecasting 2022, 4, 371–393. [Google Scholar] [CrossRef]
  22. Queiroz, B.L.; Ferreira, M.L.A. The evolution of labor force participation and the expected length of retirement in Brazil. J. Econ. Ageing 2021, 18, 100304. [Google Scholar] [CrossRef]
  23. Drobotenko, M.I.; Nevecherya, A.P. Forecasting the labor force dynamics in a multisectoral labor market. Comput. Res. Model. 2021, 13, 235–250. [Google Scholar] [CrossRef]
  24. Fuchs, J.; Söhnlein, D.; Weber, B.; Weber, E. Stochastic Forecasting of Labor Supply and Population: An Integrated Model. Popul. Res. Policy Rev. 2018, 37, 33–58. [Google Scholar] [CrossRef]
  25. Higgins, P.; Hotchkiss, J.L.; Terry, E. Evolution of Behavior, Uncertainty, and the Difficulty of Predicting Labor Force Participation. Bus. Econ. Res. 2019, 9, 157–178. [Google Scholar] [CrossRef]
  26. Fajar, M.; Fajariyanto, E. LEE-CARTER MODELING FOR MORTALITY IN INDONESIA WITH A BAYESIAN APPROACH. BAREKENG: J. Ilmu Mat. dan Ter. 2022, 16, 1241–1248. [Google Scholar] [CrossRef]
  27. Odhiambo, J.O. Deep Learning Incorporated Bühlmann Credibility in the Modified Lee–Carter Mortality Model. Math. Probl. Eng. 2023, 2023, 1–8. [Google Scholar] [CrossRef]
  28. Schnürch, S.; Korn, R. POINT AND INTERVAL FORECASTS OF DEATH RATES USING NEURAL NETWORKS. ASTIN Bull. 2022, 52, 333–360. [Google Scholar] [CrossRef]
  29. Shelleng, A.U.; Sule, Y.J.; Kajuru, J.Y.; Kabiru, A. Comparative Study of Lee Carter and Arch Model in Modelling Female Mortality in Nigeria. UMYU Sci. 2022, 1, 96–100. [Google Scholar] [CrossRef]
  30. Liu, Q.; Ling, C.; Li, D.; Peng, L. BIAS-CORRECTED INFERENCE FOR A MODIFIED LEE–CARTER MORTALITY MODEL. ASTIN Bull. 2019, 49, 433–455. [Google Scholar] [CrossRef]
  31. Cairns, A.J.G.; Blake, D.; Dowd, K.; Coughlan, G.D.; Epstein, D.; Ong, A.; Balevich, I. A Quantitative Comparison of Stochastic Mortality Models Using Data From England and Wales and the United States. North Am. Actuar. J. 2012, 13, 1–35. [Google Scholar] [CrossRef]
  32. Gyamerah, S.A.; Arthur, J.; Akuamoah, S.W.; Sithole, Y. Measurement and Impact of Longevity Risk in Portfolios of Pension Annuity: The Case in Sub Saharan Africa. FinTech 2023, 2, 48–67. [Google Scholar] [CrossRef]
  33. Maccheroni, C.; Nocito, S. Backtesting the Lee–Carter and the Cairns–Blake–Dowd Stochastic Mortality Models on Italian Death Rates. Risks 2017, 5, 34. [Google Scholar] [CrossRef]
  34. Frimmel, W.; Pruckner, G.J. Retirement and healthcare utilization. J. Public Econ. 2020, 184, 104146. [Google Scholar] [CrossRef]
  35. Elmeskov, J. Aging, Public Budgets, and the Need for Policy Reform. Rev. Int. Econ. 2004, 12, 233–242. [Google Scholar] [CrossRef]
  36. Carr, E.; Hagger-Johnson, G.; Head, J.; Shelton, N.; Stafford, M.; Stansfeld, S.; Zaninotto, P. Working conditions as predictors of retirement intentions and exit from paid employment: a 10-year follow-up of the English Longitudinal Study of Ageing. Eur. J. Ageing 2016, 13, 39–48. [Google Scholar] [CrossRef] [PubMed]
  37. F. W. Heiland and Z. Li, “CHANGES IN LABOR FORCE PARTICIPATION OF OLDER AMERICANS AND THEIR PENSION STRUCTURES: A POLICY PERSPECTIVE,” 2012. [Online]. Available: http://ssrn.com/abstract=2127718Electroniccopyavailableat:https://ssrn.com/abstract=2127718Electroniccopyavailableat:https://ssrn.com/abstract=2127718.
  38. T. Bridges and F. P. Stafford, “At the Corner of Main and Wall Street: Family Pension Responses to Liquidity Change and Perceived Returns,” Michigan Retirement Research Center Research Paper,, no. 282, 2012, [Online]. Available: http://ssrn.com/abstract=2208568Electroniccopyavailableat:https://ssrn.com/abstract=2208568Electroniccopyavailableat:https://ssrn.com/abstract=2208568. 2208.
  39. Alcover, C.-M.; Topa, G. Work characteristics, motivational orientations, psychological work ability and job mobility intentions of older workers. PLOS ONE 2018, 13, e0195973. [Google Scholar] [CrossRef] [PubMed]
  40. Buyens, D.; Van Dijk, H.; Dewilde, T.; De Vos, A. The aging workforce: perceptions of career ending. J. Manag. Psychol. 2009, 24, 102–117. [Google Scholar] [CrossRef]
  41. Stynen, D.; Jansen, N.W.H.; Kant, I. The impact of work-related and personal resources on older workers’ fatigue, work enjoyment and retirement intentions over time. Ergonomics 2017, 60, 1692–1707. [Google Scholar] [CrossRef] [PubMed]
  42. Vermeer, N.; van Rooij, M.; van Vuuren, D. Retirement Age Preferences: The Role of Social Interactions and Anchoring at the Statutory Retirement Age. De Econ. 2019, 167, 307–345. [Google Scholar] [CrossRef]
  43. Radl, J.; Himmelreicher, R.K. The Influence of Marital Status and Spousal Employment on Retirement Behavior in Germany and Spain. Res. Aging 2015, 37, 361–387. [Google Scholar] [CrossRef]
  44. Organisation for Economic and, C. and Development, “OECD Labour Force Statistics,” 2020.
  45. Adejumo, W.A.; Tijani, A.R.; Adesanyaonatola, S. What Are the Socio-Economic Predictors of Mortality in a Society? J. Financial Risk Manag. 2019, 08, 248–259. [Google Scholar] [CrossRef]
  46. Kim, J.-H.; Aum, J.; Han, J.-H.; Jeong, J. Optimization of compute unified device architecture for real-time ultrahigh-resolution optical coherence tomography. Opt. Commun. 2015, 334, 308–313. [Google Scholar] [CrossRef]
  47. Kim, W.; Jang, D.; Kim, T. Improved Web Content Adaptation for Visual Aspect of Mobile Services. 2007 Third International IEEE Conference on Signal-Image Technologies and Internet-Based System SITIS. pp. 402–408.
  48. J. A. Liggett and J. R. Salmon, “CUBIC SPLINE BOUNDARY ELEMENTS,” 1981.
  49. Hou, X.H.; Liu, H.H. Research on Improved Spline Interpolation Algorithm in Super-Resolution Reconstruction of Video Image. Appl. Mech. Mater. 2013, 380-384, 3722–3725. [Google Scholar] [CrossRef]
  50. Villegas, A.M.; Kaishev, V.K.; Millossovich, P. StMoMo: An R Package for Stochastic Mortality Modeling. SSRN Electronic Journal, no. 1992, 2015. [CrossRef]
  51. Cairns, A.J.G.; Blake, D.; Dowd, K. A Two-Factor Model for Stochastic Mortality with Parameter Uncertainty: Theory and Calibration. J. Risk Insur. 2006, 73, 687–718. [Google Scholar] [CrossRef]
  52. Lee, C. The expected length of male retirement in the United States, 1850-1990. J. Popul. Econ. 2001, 14, 641–650. [Google Scholar] [CrossRef]
  53. Crafts, N. The 15-Hour Week: Keynes's Prediction Revisited. Economica 2022, 89, 815–829. [Google Scholar] [CrossRef]
  54. Annear, M.; Shimizu, Y.; Kidokoro, T. Health-Related Expectations Regarding Aging among Middle-Aged and Older Japanese: Psychometric Performance and Novel Findings from the ERA-12-J. Int. J. Environ. Res. Public Heal. 2022, 19, 13509. [Google Scholar] [CrossRef] [PubMed]
  55. Lee, R. The Lee-Carter Method for Forecasting Mortality, with Various Extensions and Applications. North Am. Actuar. J. 2000, 4, 80–91. [Google Scholar] [CrossRef]
  56. United Nations, “United Nations World Population Prospects 2022,” 2022.
  57. Lin, H.-C.; Tanaka, A.; Wu, P.-S. Shifting from pay-as-you-go to individual retirement accounts: A path to a sustainable pension system. J. Macroecon. 2021, 69. [Google Scholar] [CrossRef]
  58. Li, N.; Lee, R. Coherent mortality forecasts for a group of populations: An extension of the lee-carter method. Demography 2005, 42, 575–594. [Google Scholar] [CrossRef]
  59. Mahmoudvand, R.; Alehosseini, F.; Zokaei, M. Feasibility of Singular Spectrum Analysis in the Field of Forecasting Mortality Rate. J. Data Sci. 2013, 11, 851–866. [Google Scholar] [CrossRef]
  60. H. Zulkifle, S. H. Zulkifle, S. Rohani, M. Nor, F. Yusof, & Nurul, and S. Samsudin, “Modelling Period Effect of Lee-Carter Mortality Model with SETAR Model,” 2022.
  61. Antonio, K.; Bardoutsos, A.; Ouburg, W. Bayesian Poisson log-bilinear models for mortality projections with multiple populations. Eur. Actuar. J. 2015, 5, 245–281. [Google Scholar] [CrossRef]
  62. S. Nocito, “Stochastic Mortality Projections: A Comparison of the Lee-Carter and the Cairns-Blake-Dowd models Using Italian Data.,” University of Studies of Turin, no. 1, pp. 1–15, 2015.
  63. Andersen, A.G.; Markussen, S.; Røed, K. Pension reform and the efficiency-equity trade-off: Impacts of removing an early retirement subsidy. Labour Econ. 2021, 72. [Google Scholar] [CrossRef]
  64. Ryser, V.-A.; Heers, M. Early Child-care Arrangements and Both Parents’ Subjective Well-being. J. Child Fam. Stud. 2023, 32, 1002–1017. [Google Scholar] [CrossRef]
  65. Leppäkumpu, J.; Sivunen, A. Communicating across the borders: managing work-life boundaries through communication in various domains. Community, Work. Fam. 2023, 26, 222–241. [Google Scholar] [CrossRef]
  66. Verhoef, M.; Plagnol, A.C.; May, V. Linking Formal Child Care Characteristics to Children’s Socioemotional Well-Being: A Comparative Perspective. J. Child Fam. Stud. 2018, 27, 3482–3496. [Google Scholar] [CrossRef]
  67. Dandan, M.M.; Marques, A.P. Education, Employment and Gender Gap in Mena Region. Asian Econ. Financial Rev. 2017, 7, 573–588. [Google Scholar] [CrossRef]
  68. A. Terada-Hagiwara, S. F. A. Terada-Hagiwara, S. F. Camingue-Romance, and J. E. Zveglich, “Gender Pay Gap: A Macro Perspective,” 2018. [CrossRef]
  69. Hess, M. Retirement Expectations in Germany—Towards Rising Social Inequality? Societies 2018, 8, 50. [Google Scholar] [CrossRef]
  70. Nivorozhkin, A.; Nivorozhkin, E. Job search, transition to employment and discouragement among older unemployed welfare recipients in Germany. Soc. Policy Adm. 2021, 55, 747–765. [Google Scholar] [CrossRef]
  71. Fehr, H.; Kallweit, M.; Kindermann, F. Pension reform with variable retirement age: a simulation analysis for Germany. J. Pension- Econ. Finance 2012, 11, 389–417. [Google Scholar] [CrossRef]
  72. Nazah, N.; Duasa, J.; Arifin, M.I. Fertility and Female Labor Force Participation in Asian Countries; Panel ARDL Approach. 2021, 22, 272–288. [CrossRef]
  73. Bai, Z.; Wallbaum, K. Optimizing Pension Outcomes Using Target-Driven Investment Strategies: Evidence from Three Asian Countries with the Highest Old-Age Dependency Ratio*. Asia-Pacific J. Financial Stud. 2020, 49, 652–682. [Google Scholar] [CrossRef]
  74. Miyazaki, K. OPTIMAL PAY-AS-YOU-GO SOCIAL SECURITY WITH ENDOGENOUS RETIREMENT. Macroecon. Dyn. 2017, 23, 870–887. [Google Scholar] [CrossRef]
  75. Lau, S.-H.P.; Tsui, A.K. ECONOMIC-DEMOGRAPHIC DEPENDENCY RATIO IN A LIFE-CYCLE MODEL. Macroecon. Dyn. 2019, 24, 1635–1673. [Google Scholar] [CrossRef]
  76. Gustman, A.L.; Steinmeier, T. How Changes in Social Security Affect Recent Retirement Trends. Res. Aging 2008, 31, 261–290. [Google Scholar] [CrossRef]
  77. Muryani; Watik, A. ; Wibowo, W.; Herianingrum, S.; Widiastuti, T. Study of the Socio-Economic Analysis of Females Role in Eastern part of Indonesia. Int. J. Adv. Sci. Res. Eng. 2023, 09, 53–61. [Google Scholar] [CrossRef]
  78. Blau, D.M.; Goodstein, R.M. Can Social Security Explain Trends in Labor Force Participation of Older Men in the United States? J. Hum. Resour. 2010, 45, 328–363. [Google Scholar] [CrossRef]
  79. Larsen, M.; Pedersen, P.J. Labour force activity after 65: what explain recent trends in Denmark, Germany and Sweden? J. Labour Mark. Res. 2017, 50, 15–27. [Google Scholar] [CrossRef]
  80. Barbalat, G.; Franck, N. Ecological study of the association between mental illness with human development, income inequalities and unemployment across OECD countries. BMJ Open 2020, 10, e035055. [Google Scholar] [CrossRef] [PubMed]
  81. Ivankova, V.; Gavurova, B.; Khouri, S. Understanding the relationships between health spending, treatable mortality and economic productivity in OECD countries. Front. Public Heal. 2022, 10, 1036058. [Google Scholar] [CrossRef] [PubMed]
  82. Kang, M.; Yoon, C.; Yoon, J. Influence of illness and unhealthy behavior on health-related early retirement in Korea: Results from a longitudinal study in Korea. J. Occup. Heal. 2015, 57, 28–38. [Google Scholar] [CrossRef] [PubMed]
  83. Haas, S.A.; Glymour, M.M.; Berkman, L.F. Childhood Health and Labor Market Inequality over the Life Course. J. Heal. Soc. Behav. 2011, 52, 298–313. [Google Scholar] [CrossRef]
  84. Clark, C.; Smuk, M.; Lain, D.; Stansfeld, S.A.; Carr, E.; Head, J.; Vickerstaff, S. Impact of childhood and adulthood psychological health on labour force participation and exit in later life. Psychol. Med. 2017, 47, 1597–1608. [Google Scholar] [CrossRef]
  85. A. Lorenti, C. A. Lorenti, C. Dudel, J. M. Hale, and M. Myrskylä, “Working and disability expectancies at old ages: the role of childhood circumstances and education,” Feb. 2020. [CrossRef]
  86. Schofield, D.J.; Callander, E.J.; Shrestha, R.N.; Passey, M.E.; Percival, R.; Kelly, S.J. Indirect Economic Impacts of Comorbidities on People With Heart Disease. Circ. J. 2014, 78, 644–648. [Google Scholar] [CrossRef]
  87. Tomoike, H.; Yokoyama, H.; Sumita, Y.; Hanai, S.; Kada, A.; Okamura, T.; Yoshikawa, J.; Doi, Y.; Hori, M.; Tei, C.; et al. Nationwide Distribution of Cardiovascular Practice in Japan – Results of Japanese Circulation Society 2010 Annual Survey –. Circ. J. 2015, 79, 1058–1067. [Google Scholar] [CrossRef] [PubMed]
  88. Boissonneault, M.; Rios, P. Changes in healthy and unhealthy working-life expectancy over the period 2002–17: a population-based study in people aged 51–65 years in 14 OECD countries. Lancet Heal. Longev. 2021, 2, e629–e638. [Google Scholar] [CrossRef] [PubMed]
  89. Matsukura, R.; Shimizutani, S.; Mitsuyama, N.; Lee, S.-H.; Ogawa, N. Untapped work capacity among old persons and their potential contributions to the “silver dividend” in Japan. J. Econ. Ageing 2018, 12, 236–249. [Google Scholar] [CrossRef]
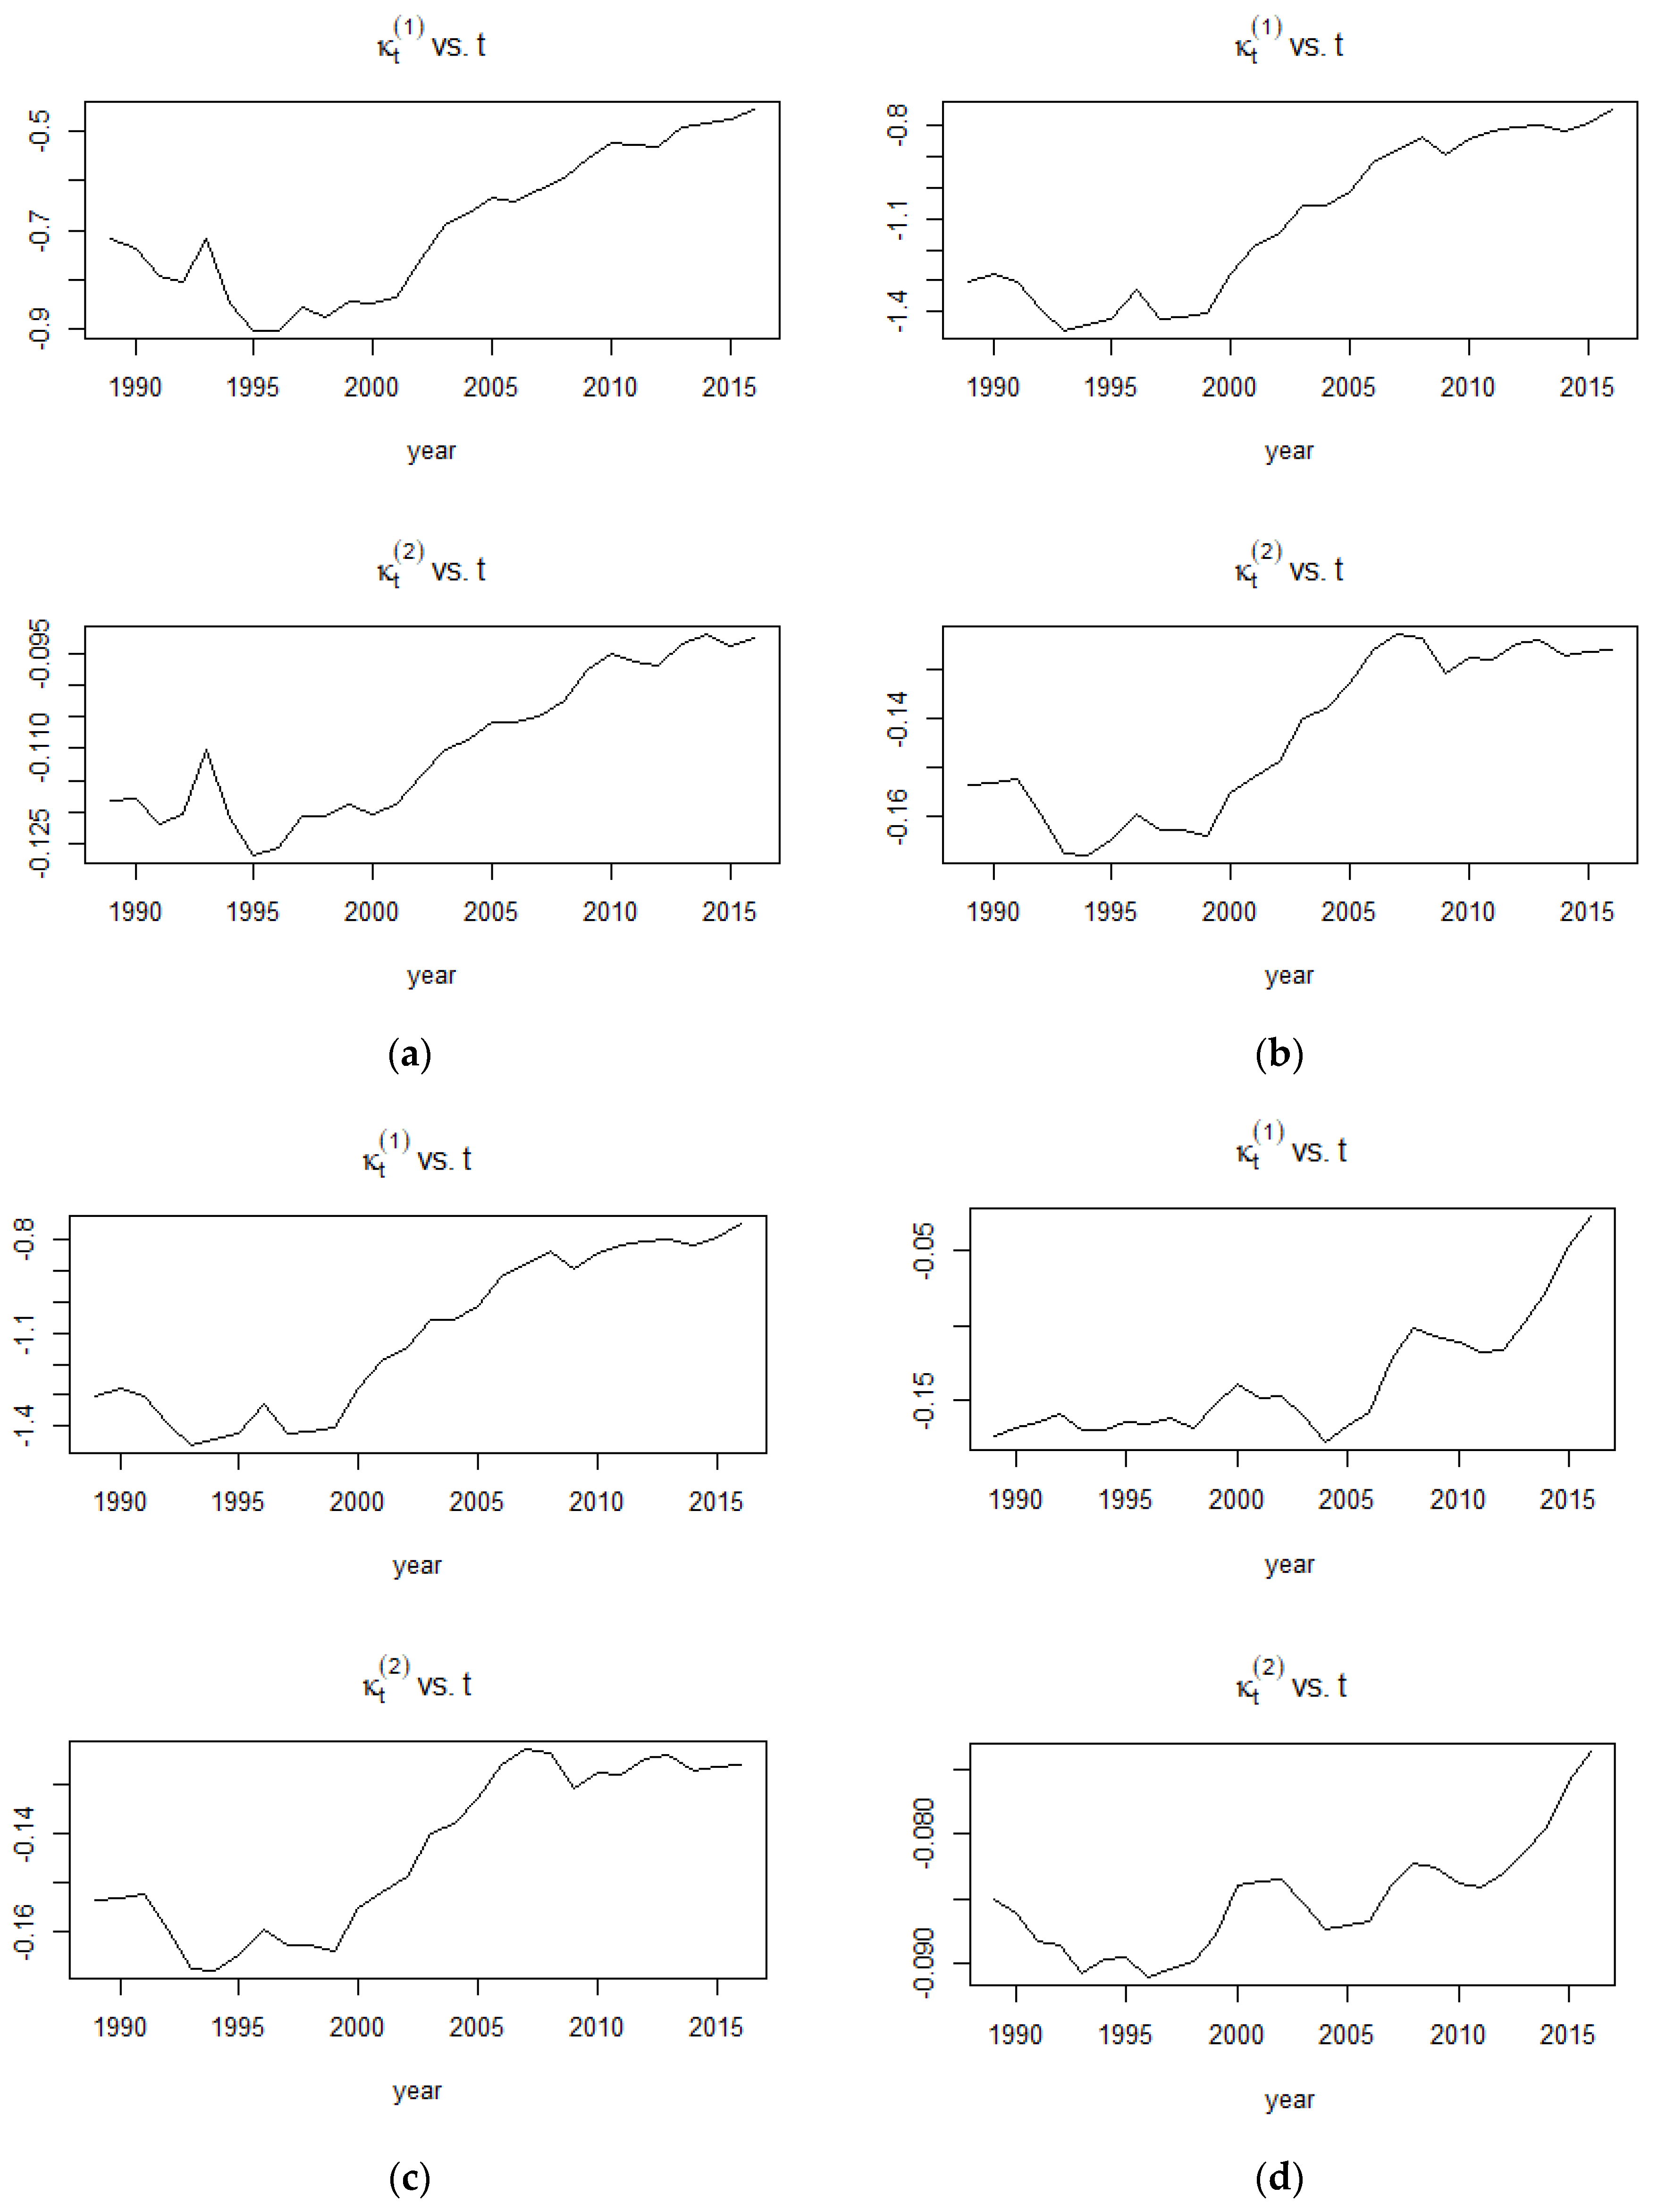
Figure 1. Parameter estimates of male LFP rate for CBD model in four countries; (a) Canada (b) Finland (c) Germany (d) Japan.
Preprints 88186 g001
Figure 2. Observed versus Fitted Rates (Male) of Lee Carter and CBD at Age 65.
Preprints 88186 g002
Figure 3. Observed versus Fitted Rates (Female) of Lee Carter and CBD at Age 65.
Preprints 88186 g003
Figure 4. Life expectancy at age 20 (EL20) and expected length of retirement at age 50 (ELRP) for female populations in Canada, Finland, Germany and Japan (1989-2066).
Preprints 88186 g004
Table 1. The in-sample and out-of-sample results (male and female) for all four OECD countries.
Male Female
Canada Finland Japan Germany Canada Finland Japan Germany
Lee Carter AIC 4004 2628 5790 4449 3485 2271 5954 4005
BIC 4350 2974 6136 4795 4350 2974 6136 4669
RMSE 0.16 0.17 0.24 0.17 0.12 0.16 0.16 0.13
MAPE 0.22 0.26 0.31 0.24 0.54 0.24 0.24 0.21
Cairns Blake Dowd AIC 5691 2918 27531 14993 4501 2758 10562 10365
BIC 5946 3173 27786 15248 4756 3012 10817 10620
RMSE 0.17 0.18 0.34 0.22 0.13 0.20 0.24 0.19
MAPE 0.35 0.36 0.38 0.70 3.59 1.52 0.51 1.20
Table 2. Forecasted ELR (Male at age 50).
Year Canada Finland Germany Japan
1989 11.05 10.70 16.10 11.26
1996 12.36 12.11 13.32 12.60
2006 12.97 12.81 14.07 12.63
2016 13.54 13.63 13.10 12.76
2026 14.19 14.53 15.36 12.36
2036 14.84 15.18 16.64 12.35
2046 15.44 15.76 18.07 12.96
2056 16.07 16.35 19.73 14.22
2066 16.77 17.00 21.60 16.06
Table 3. Forecasted ELR (Female at age 50).
Year Canada Finland Germany Japan
1989 13.20 16.10 13.91 11.56
1996 14.23 17.59 15.44 13.74
2006 15.04 17.97 16.19 14.27
2016 16.01 18.34 18.90 15.34
2026 16.84 19.06 18.75 14.91
2036 17.71 19.96 22.27 15.26
2046 18.67 21.07 20.56 15.63
2056 19.73 22.31 19.70 16.02
2066 20.87 23.64 18.61 16.57
Disclaimer/Publisher’s Note: The statements, opinions and data contained in all publications are solely those of the individual author(s) and contributor(s) and not of MDPI and/or the editor(s). MDPI and/or the editor(s) disclaim responsibility for any injury to people or property resulting from any ideas, methods, instructions or products referred to in the content.
Copyright: This open access article is published under a Creative Commons CC BY 4.0 license, which permit the free download, distribution, and reuse, provided that the author and preprint are cited in any reuse.
Prerpints.org logo

Preprints.org is a free preprint server supported by MDPI in Basel, Switzerland.

Subscribe

© 2024 MDPI (Basel, Switzerland) unless otherwise stated