Preprint
Article

Integrated Genomic Analysis of Primary Prostate Tumor Foci and Corresponding Lymph Node Metastases Identifies Mutations and Pathways Associated with Metastasis

Altmetrics

Downloads

123

Views

113

Comments

0

A peer-reviewed article of this preprint also exists.

Submitted:

24 October 2023

Posted:

25 October 2023

You are already at the latest version

Alerts
Abstract
Prostate cancer is a highly heterogeneous disease, and mortality is mainly due to metastases, but the initial steps of metastasis have not been well characterized. We have performed integrative whole exome sequencing and transcriptome analysis of primary prostate tumor foci and corresponding lymph node metastases (LNM) from 43 patients enrolled in clinical trial. We present evidence that while there are some cases of clonally independent primary tumor foci, 87% of primary tumor foci and metastases are descended from a common ancestor. We demonstrate that genes related to oxidative phosphorylation are upregulated in LNM and in African-American patients relative to White patients. We further show that mutations in TP53, FLT4, EYA1, NCOR2, CSMD3, and PCDH15 are enriched in prostate cancer metastases. These findings were validated in a meta-analysis of 3,929 primary tumors and 2,721 metastases and reveal a pattern of molecular alterations underlying the pathology of metastatic prostate cancer. We show that LNM contain multiple subclones that are already present in primary tumor foci. We observed enrichment of mutations in several genes including understudied genes such as EYA1, CSMD3, FLT4, NCOR2, and PCDH15 and find that mutations in EYA1 and CSMD3 are associated with poor outcome in prostate cancer.
Keywords: 
Subject: Biology and Life Sciences  -   Biochemistry and Molecular Biology

1. Introduction

Although there have been genomic profiling analyses of primary prostate cancers by The Cancer Genome Atlas [1] and other genomic studies of metastatic castration-resistant prostate cancers (mCRPC) [2,3,4,5,6], analyses of primary tumors and metastases from the same patients are relatively understudied. Most studies have used only primary tumors [1], only metastatic tumors [4,6], or metastases and primary tumors from different patients [3], but only a very few have analyzed metastases and primary tumors from the same patients [7]. However, this study used targeted DNA sequencing and low-pass Whole Genome Sequencing for copy number alterations, but did not perform whole exome sequencing (WES) or RNAseq analyses [7]. No studies have performed integrative WES and RNAseq using multiple sites from the same patients. Additionally, few studies have analyzed lymph node metastases (LNM) [8], since most studies have focused on bone or visceral metastases [9]. Analysis and understanding of LNM is critical because LNM represents one of the first steps in the systemwide metastatic process, and patients with positive lymph nodes at radical prostatectomy experience poor cancer specific survival rates [10]. Furthermore, analyses of multiple independent tumor foci from the same patients together with corresponding LNM are lacking. Moreover, while studies have examined African-American (AA) men at the RNA [11] or DNA levels [12,13], integrative genomic profiling of RNA and DNA has not been performed in highly diverse cohorts with high proportions of AA men. In this study, we address this gap in our knowledge of prostate cancer biology through integrative RNAseq and WES approaches to identify potential key driver mutations and important genomic expression changes involved in prostate cancer metastasis.
Prostate cancer is characterized by intratumoral heterogeneity on multiple levels [14]. Primary prostate cancer is known to be multifocal, which underlies the rationale for the Gleason scoring system [15,16,17,18]. Previous studies have found that over 70% of patients have multifocal disease representing multiple tumor grades [16]. Furthermore, different primary tumor foci can be composed of genetically distinct clones, suggesting independent carcinogenesis events within the prostate gland [19,20,21,22,23]. Intratumoral heterogeneity has been identified even within single primary tumor foci in the prostate [24], suggesting parallel evolution of independent clones with branching and divergent paths.
Intratumoral heterogeneity is a poorly understood phenomenon that is critically important for understanding tumor progression and the development of drug resistance, as different sub-clones can respond differently to microenvironmental changes and selection pressure from therapies. Recent studies have indicated that independent foci and biopsies can have markedly different performance in commercially available biomarker panels [25]. Thus, understanding intratumoral heterogeneity is essential for biomarker development and validation, prognosis, and therapeutic decision-making for precision medicine.
Here we have performed WES of 137 samples and RNAseq analysis of 165 samples from 43 patients enrolled in a clinical trial [26] that included both radical prostatectomy and extensive dissection of all pelvic lymph nodes (LNs). We present evidence that while there are some cases of clonally independent primary tumor foci, 87% of primary tumor foci are descended from a common ancestor, and that while metastases are heterogeneous and contain multiple subclones, they are genetically related to 87% of primary tumor foci within the same patients. We demonstrate that genes related to oxidative phosphorylation are transcriptionally upregulated in LNM, and that these genes are also upregulated in African-American patients relative to White patients. We further show that mutations in TP53, FLT4, EYA1, CSMD3, and PCDH15 are enriched in prostate cancer metastases. Moreover, we validate our findings in a meta-analysis of publicly available datasets from twelve different studies representing 3929 primary tumors and 2721 metastases. These findings have implications for our understanding of the molecular events required for prostate metastasis.

2. Materials and Methods

Patient Samples

All patient samples were derived from a clinical trial (NCT01808222) conducted at our institution to determine the sensitivity and specificity of [18F]-fluciclovine PET imaging for the detection of significant occult metastatic disease in patients with unfavorable intermediate-risk or high-risk prostate cancer [26]. These patients had no definitive findings of systemic metastases on conventional imaging such as CT, MR, and bone scan. Patients underwent radical prostatectomies and extended pelvic lymph node dissections. In this trial, 56 prostate cancer patients were enrolled based on criteria that correspond to a 50-80% PSA failure rate within high or very high-risk groups (T3a, Gleason score 8-10, or PSA greater than 20 ng/ml) and underwent radical prostatectomy and extended pelvic lymph node dissection. Of these, 30/56 (54%) of patients had metastases. Of those, 7 had only one positive lymph node, and 23 had two or more positive lymph nodes. A total of 92 positive LNs were identified out of a total of 2480 excised LNs of which 58 positive LNs were > 4mm in diameter.
Formalin-Fixed Paraffin-Embedded (FFPE) tissue samples were identified from this clinical trial, consisting of prostate and lymph node dissections from 56 cases. Of these 56 cases, 7 did not give consent for genomic analyses (4 metastatic and 3 non-metastatic) and were excluded from the study, leaving a potential of 49 available for genomic studies. For the patients in which the cancer did not metastasize (n=23), we identified at least 3 FFPE prostate tissue samples and 1 LN (benign) for examination. For the cases in which the cancer did metastasize (n=26), we identified at least 4 primary prostate samples, 1 benign LN and 1 metastatic LN. All available FFPE blocks were collected from Emory University Hospital (EUH) pathology services and coded to remove any personal health information (PHI). For three of the cases, the metastatic LN blocks were not available and were excluded from the study and for three other cases, no LN metastases exceeded the minimum size of 4mm and were also excluded, leaving a total of 43 cases available for RNA and DNA extraction. Clinical metadata is provided in Supplementary Table S1. Race was determined by self-identification.

RNA and DNA Extraction and Sequencing

Seven 5 µm sections were prepared at the Winship Cancer Tissue and Pathology Shared Resource Core (CTPSR) for sectioning. One section from each block was stained with Hematoxylin and Eosin (H&E) for histological analysis by a GU pathologist to identify and annotate prostate cancer regions of interest (ROI) within the tissue samples for macrodissection. Annotated H&E slides were aligned to unstained sections and tissue was collected only from the ROI, which was typically >90% tumor. Entire LNM foci were annotated for macrodissection, excluding any benign regions of the lymph nodes. For separate primary tumor foci, independent foci were identified from contralateral aspects of the prostate or separate locations (e.g. apex vs base or anterior vs posterior). The identified regions from all six sections were macrodissected, and the tissue was collected directly into a shearing microtube. Once tissue was obtained, RNA and DNA isolation was performed at the Emory Integrated Genomics Core (EIGC) using the Covaris truXTRAC FFPE total NA kit.
Quality control (QC) analysis was also performed by the EIGC on all RNA and DNA extractions, and RNAseq and WES were performed by HudsonAlpha (subunit of Discovery Life Sciences). For RNAseq, we performed 100 bp paired-end sequencing using the SMART-Seq Stranded library prep kit (Takara, 634444). For WES analysis, libraries were prepared using the KAPA HyperPrep / Covaris Shearing Library Construction, IDT v2 Capture kit and 100 bp PE sequencing was performed on a NovaSeq 6000. Of the samples prepared, 43 patients had RNA of sufficient quality for sequencing, and 35 patients had DNA of sufficient quality for WES. For non-metastatic patients two primary tumor foci (primary tumor foci) and one benign LN were sequenced. For metastatic patients three primary tumor foci, one benign LN, and all metastatic LNs were sequenced. RNA was extracted from 10 adjacent normal prostate samples from both metastatic and non-metastatic patients. A total of 165 tissue samples (51 primary tumor foci from metastatic patients, 46 primary tumor foci from non-metastatic patients, 19 LN metastases, 39 benign LNs, and 10 Normal Adjacent Prostate samples) were sequenced via RNA-seq and 137 tissue samples were sequenced via WES (Table 1).

RNA-seq Analysis Pipeline

Raw FASTQ files were analyzed by FastQC for quality control analysis and TrimGalore [27] was used to remove adapter sequences and poor-quality reads (Phred < 24) (31). Next, trimmed reads were mapped with STAR aligner [28] based on the GRCh38 reference and GENCODE.v.24 annotations. DESeq2 [29] was used to determine differences in RNA expression between sample groups. WebGestalt (WEB-based Gene SeT AnaLysis Toolkit) [30] was used to conduct several gene set enrichment analyses (GSEA) [31] for each comparison. Ecotyper analysis was performed using the Ecotyper website (https://ecotyper.stanford.edu/).

WES Analysis Pipeline

Similar to the RNA-seq pipeline, FastQC was used for quality control checks of the high throughput data and TrimGalore was used to remove adapter sequences and eliminate poor quality reads. Genome mapping was conducted with the Burrows-Wheeler Alignment (BWA) algorithm from the Genome Analysis Toolkit (GATK) [32] against the GRCh38 human genome to generate BAM files. GATK and Picard Toolkit were used to calibrate read group qualities and mark duplicates (39). The GATK Mutect2 algorithm was used to call somatic mutations using a panel of normals (PON) as previously described[1] to detect SNVs and indels. VCF files were analyzed in R to identify significant mutations based on a minimum read depth of 40 reads per base, an allele frequency (AF) difference > 0.05, and false discovery rate (FDR) < 0.1 based on F-tests. GATK funcotator was used to annotate mutations and generate mutation annotation format (MAF) files. These MAF files were analyzed using the R package maftools [33] to identify recurrent mutations and patterns to build mutational profiles. BAM files were also analyzed using HATCHet [34], an algorithm to compute tumor heterogeneity, copy number aberrations (CNAs), and whole-genome duplications (WGDs) used to investigate tumor evolution and metastatic seeding patterns.

3. Results

To investigate the molecular changes, mutations, and signaling pathways that characterize the initial steps of prostate cancer metastasis to the lymph nodes, we analyzed 19 discrete LNM, 97 primary tumor foci, 39 benign lymph nodes, and 10 normal adjacent prostate tissue samples from 43 patients enrolled in a clinical trial (NCT01808222) of extended lymphadenectomy and metastasis excision guided by [18F]-fluciclovine PET imaging for high risk, newly diagnosed prostate cancer conducted at our institution [26] (Supplementary Table S1). These patients fell within high or very high-risk groups (T3a, Gleason score 8-10, or PSA greater than 20 ng/ml). Of these patients, 16 had LN metastases at least 4 mm in diameter, and 20 patients had no metastases. For metastatic patients, we performed RNA and Whole Exome Sequencing (WES) on three primary tumor foci, one benign LN, and all LN metastases greater than 4mm in diameter (see Methods). For non-metastatic patients, we sequenced two primary tumor foci and one benign LN. In total, RNAseq was performed on 165 tissue samples from 43 patients (Supplementary Tables S2 & S3), and WES was performed on 137 samples from 35 patients (Supplementary Table S4). A summary of all sequenced samples is provided in Table 1.

3.1. RNA-seq Analysis Identifies Oxidative Phosphorylation Is Associated with LNM

To understand the signaling pathways essential for the first steps of metastasis, we performed RNAseq analysis. A median of 56 million paired-end reads were obtained per sample, and 44,289 transcripts were detected in at least 5% of samples. Samples were classified by several criteria including tissue site of origin (prostate vs lymph node), malignant vs. benign, primary tumor vs. metastasis, and deriving from a patient with metastases vs. a patient without metastases (met vs. non-met).
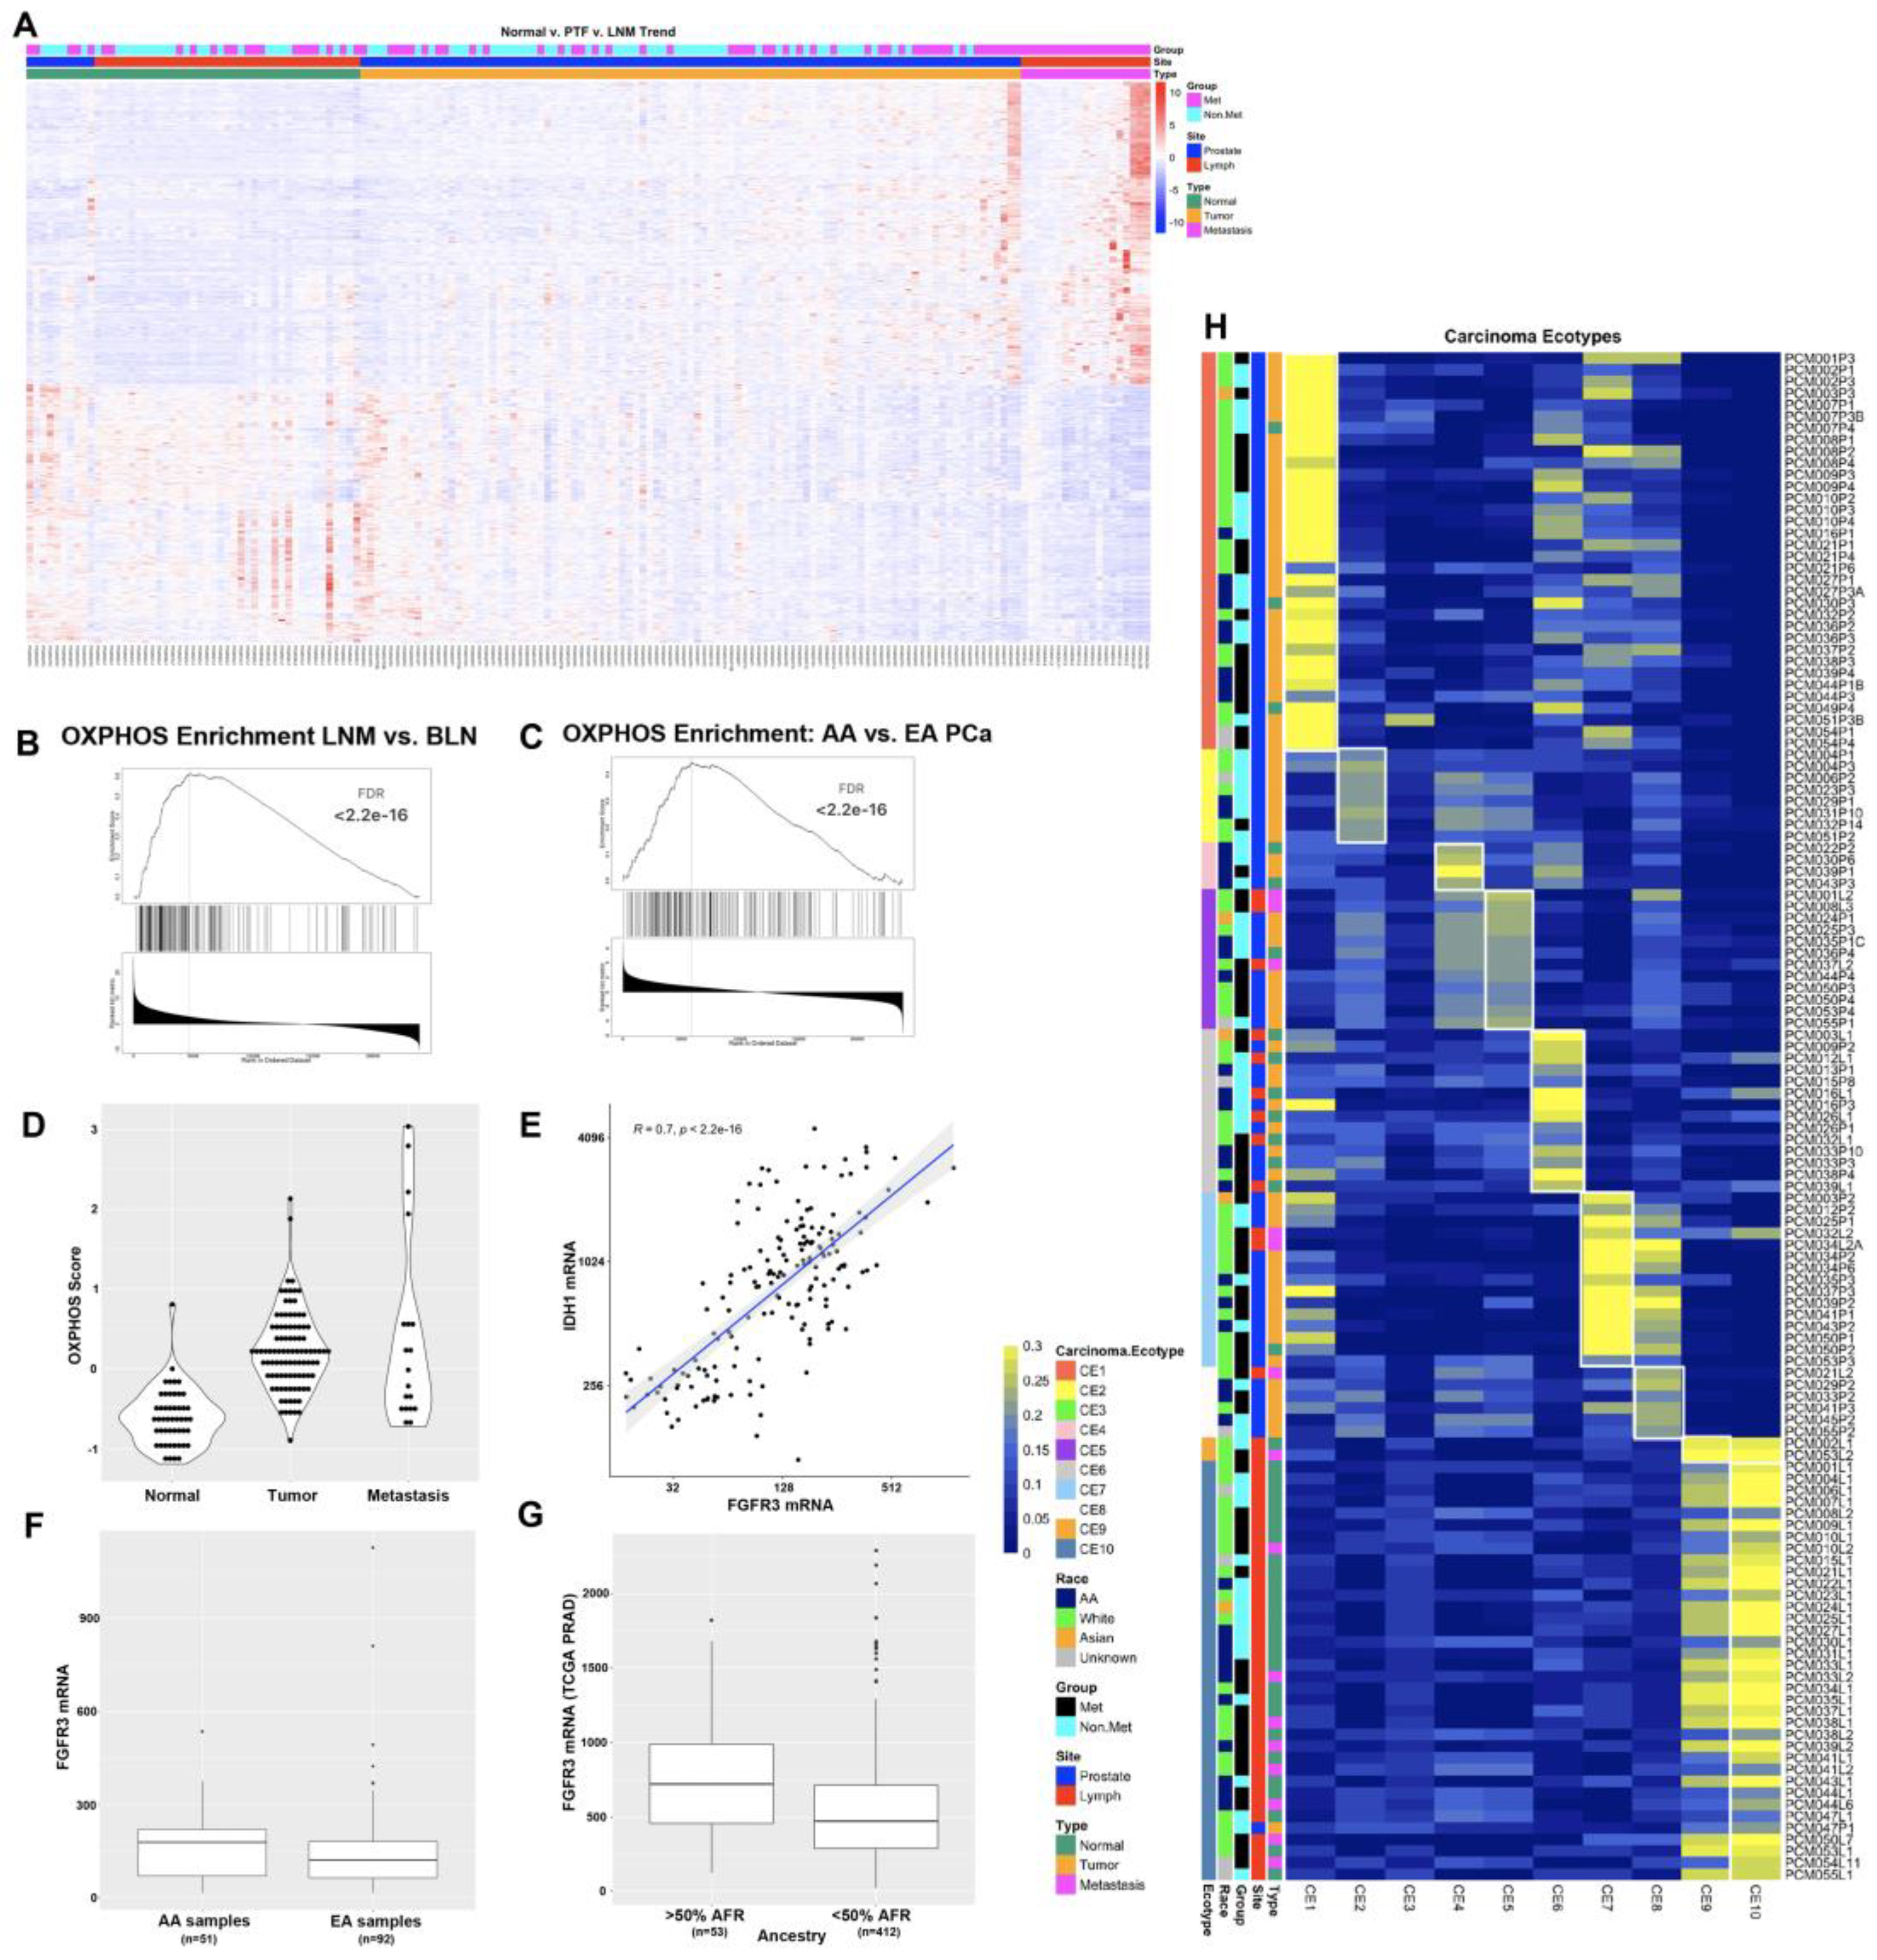
In the first analysis, we identified a set of 381 genes whose expression that trended consistently upward, significantly increasing from normal prostate tissue to primary tumor foci and from primary tumor foci to LNM, as well as a set of 323 genes that trended consistently downward from normal tissue to primary tumor foci to LNM (Figure 1A and Supplementary Table S7). The upregulated gene set included oncogenes such as PIK3CB, FGFRL1, and NCOA2; prostate cancer related genes such as SPON2, PCAT4, and SCHLAP1; and cell cycle genes such as MKI67, MCM4, KIF4A, CENPF, and FLNB. Downregulated genes included tumor suppressors such as PTEN and TGFBR3; adhesion and junction proteins such as SDC3, ITGA9, ITGA7, RSU1, and TGFBI; and apoptotic genes such as TNFRSF10B (DR5/TRAILR2) and RAPGEF3 (EPAC1). These consistent changes in gene expression across sample types suggests that they play key roles in metastasis to the lymph nodes.
Next, we compared 39 benign lymph nodes (BLN) to 19 LNM and identified 9396 transcripts differentially expressed (p-adj < 0.01) between these two sets of samples (Supplementary Table S5). As expected, the most differentially expressed genes included NKX3-1, KLK3 (PSA), KLK2, KLK4, TMPRSS2, AR, AMACR, FOLH1 (PSMA) and PCA3. Also of interest were several genes associated with prostate cancer metastases including FOXA1, EZH2, SCHLAP1, CDH1, SOX4, SOX9, HOXB13, and TGFBR3. Gene set enrichment analysis (GSEA) identified several pathways significantly associated with LNM including the Hallmark 50 pathways ANDROGEN_RESPONSE, MYC_TARGETS_V1, OXIDATIVE_PHOSPHORYLATION, MTORC1_SIGNALING, and MYC_TARGETS_V2 which all had an FDR < 2.2E-16 (Table 2 and Figure 1B). Altered expression of the oxidative phosphorylation pathway was also observed to be differentially expressed in AA men and in metastatic clones (see below).
Comparing primary tumor foci to LNM, 6203 transcripts were differentially expressed (p-adj < 0.01) (Supplementary Table S6). Primary tumor foci were enriched relative to LNM in gene sets associated with Epithelial to Mesenchymal Transition (EMT), estrogen signaling, TGF beta signaling, Notch signaling, and the response to hypoxia. LNM were enriched in cell cycle progression pathways and immune function pathways such as interferon (IFN) gamma and IFN alpha responses (Supplementary Figure S1).
Table 2. GSEA Analysis of BLN vs. LNM.
Gene Set Size Leading Edge Number NES FDR
HALLMARK_ANDROGEN_RESPONSE 101 47 -2.3952 <2.2e-16
HALLMARK_MYC_TARGETS_V1 200 132 -2.2692 <2.2e-16
HALLMARK_OXIDATIVE_PHOSPHORYLATION 199 117 -2.1852 <2.2e-16
HALLMARK_MTORC1_SIGNALING 200 120 -2.0443 <2.2e-16
HALLMARK_MYC_TARGETS_V2 58 35 -1.9282 <2.2e-16
HALLMARK_FATTY_ACID_METABOLISM 157 70 -1.8465 0.000112
HALLMARK_GLYCOLYSIS 199 93 -1.8362 0.000096004
HALLMARK_UNFOLDED_PROTEIN_RESPONSE 113 55 -1.8126 0.00033601
HALLMARK_PEROXISOME 104 54 -1.806 0.00037335
HALLMARK_E2F_TARGETS 200 103 -1.7584 0.00039202
HALLMARK_EPITHELIAL_MESENCHYMAL_TRANSITION 200 73 1.6463 0.0029856
HALLMARK_MYOGENESIS 197 69 1.7325 0.002488
HALLMARK_KRAS_SIGNALING_UP 198 79 1.7459 0.0023325
HALLMARK_TNFA_SIGNALING_VIA_NFKB 200 88 1.8804 0.00053315
HALLMARK_INFLAMMATORY_RESPONSE 199 86 1.9837 <2.2e-16
HALLMARK_INTERFERON_ALPHA_RESPONSE 97 56 2.0873 <2.2e-16
HALLMARK_COMPLEMENT 200 101 2.269 <2.2e-16
HALLMARK_IL6_JAK_STAT3_SIGNALING 83 52 2.3259 <2.2e-16
HALLMARK_ALLOGRAFT_REJECTION 199 116 2.4589 <2.2e-16
HALLMARK_INTERFERON_GAMMA_RESPONSE 200 123 2.608 <2.2e-16
Figure 1. RNAseq analysis of 165 prostate cancer patient samples identifies oxidative phosphorylation as differentially expressed between AA and White patients. A) Heat map of 704 genes that trend consistently upward or downward from normal to primary tumor foci to LNM. B) GSEA plot of the oxidative phosphorylation gene set from comparison of LNM to benign lymph nodes. C) GSEA plot of the oxidative phosphorylation gene set from analysis of African-American vs. White patients with Gleason score of 7. D) OXPHOS score increases in from normal prostate to primary tumor to LNM. E) FGFR3 is highly correlated with OXPHOS gene IDH1 F) FGFR3 is expressed at higher levels in AA PCa than EA PCa in our cohort. G) FGFR3 mRNA is significantly higher in patients with >50% African ancestry in the TCGA PRAD dataset. H) Ecotyper analysis of 131 samples assigned to one of ten unique carcinoma ecotypes (CE).
Preprints 88654 g001

3.2. Oxidative Phosphorylation, Immune Signaling, and Hedgehog Pathways Are Differentially Expressed in AA Patients

The racial diversity of our cohort enabled us to identify differences in gene expression between (self-identified) African-American and White patients. Of the 165 samples analyzed by RNAseq, 30 primary tumor foci samples came from 14 African-American patients and 53 primary tumor foci samples came from 23 White patients. There were only three LNM from three African-American patients and 14 LNM from 12 White patients. To optimize sample power, we chose to focus on primary tumor foci to examine differences in gene expression based on race. We determined that the average Gleason score from the radical prostatectomies was higher in the White patients than in the African-American patients (8.61 vs 7.93, p=0.03), and therefore, when computing differences in gene expression between primary tumor foci from African-American and White patients, we performed subset analyses on patients with Gleason score 7 (16 samples from 7 African-American patients, 7 samples from 4 White patients) and Gleason score 9 (12 samples from 6 African-American patients, 43 samples from 18 White patients). We performed GSEA analysis on these differences and determined that for Gleason score 7 patients, primary tumor foci from African-Americans were enriched in gene sets relating to IFN alpha response, oxidative phosphorylation, and adipocyte development, among others (Figure 1C). For Gleason score 9 patients, primary tumor foci from African-Americans were enriched in gene sets relating to Hedgehog signaling, muscle differentiation, and EMT. For both sets of analyses, primary tumor foci from African-Americans were enriched in gene sets associated with UV response, early estrogen response, adherens and tight junctions, and mitotic spindle assembly (Supplementary Tables S8-9). Differential expression of DNA damage response, hormonal response, adhesion, and proliferation pathways in AA men are consistent with the typically worse outcomes observed in these patients [35].
Three of the most significantly upregulated OXPHOS genes included IDH1, IDH2, and FGFR3. These data are intriguing in light of a recent study on the role of the FGFR3-TACC3 gene fusion driver mutation that has been observed in 3% of human glioblastoma cases [36]. This study found that the FGFR3-TACC3 fusion protein drove increased mitochondria, ATP production, and oxidative phosphorylation [36]. To better quantify the OXPHOS pathway activation in our RNAseq datasets, we constructed an OXPHOS score based on the z-score normalized gene expression values of the 105 genes in the leading edge of the OXPHOS gene set analyses. We computed the OXPHOS score for all samples and compared the expression in normal, primary tumor, and LNM samples and found increased OXPHOS scores as tumors progressed (Figure 1D). Interestingly, FGFR3 was highly correlated with OXPHOS gene expression, including expression of IDH1 (Figure 1E, p < 2.2e-16) and IDH2 (p = 3.7e-14), which is critical for and modulates the assembly of the entire OXPHOS system [37]. We noted that FGFR3 was expressed at higher levels in AA samples than in EA samples in our cohort (Figure 1F). To investigate whether this observation was confirmed in an independent cohort, we also analyzed the association of FGFR3 mRNA expression with %African Ancestry data from The Cancer Genome Atlas (TCGA) Prostate Adenocarcinoma (PRAD) dataset [1] using data available on cBioPortal [38,39] and determined that FGFR3 was one of the genes most strongly associated with %African (%AFR) ancestry (Spearman rho = 0.2, p = 1.479e-5). We also determined that FGFR3 expression was higher in patients with >50% AFR ancestry compared to patients with < 50% AFR ancestry (Figure 1G, adj.p = 0.027).

3.3. Ecotyper Analysis Identifies Ecotypes with Activated Oxidative Phosphorylation and Androgen Signaling Are Associated with LNM

The Ecotyper tool [40] is a machine learning framework for analysis of gene expression patterns from bulk tumor RNA to identify cellular subtypes and the state of the tumor microenvironment. We applied Ecotyper analysis to our RNAseq expression data using the ten carcinoma ecotypes (CE) that were generated using 5,946 tumors from 16 TCGA studies [40]. The Ecotyper tool was able to assign a dominant carcinoma ecotype to 131 of the 165 RNAseq samples (Figure 1H and Table S2). In general, the CE’s that were assigned to each sample were consistent with the tissues from which they were derived. For example, samples from the lymph node were primarily assigned to CE10, which is associated with IL-2, IL-6, and allograft rejection, and sometimes CE9, which is associated with IFN-alpha and IFN-gamma signaling. Additionally, normal prostate tissue samples were most often assigned to CE6, which is associated with normal tissues. LNM were also assigned to CE5, CE7, and CE8. CE5 is associated with spermatogenesis, MYC signaling, and DNA repair pathways, while CE7 is associated with Androgen, PI3K, MTORC, and OXPHOS pathways, and CE8 is associated with spermatogenesis and CCL16. Many of the primary tumor foci were associated with CE1 and CE2, which are associated with EMT, TGFB, Notch, and Hedgehog signaling in CE1 and hypoxia and proliferation in CE2. CE7 and CE8 were enriched in patients who had metastases. For CE7 samples, 73% of samples were from patients with metastases, while for CE8, 67% of samples were from patients with metastases. Association of CE7 with metastatic samples is consistent with previous studies demonstrating activation of androgen and PI3K/MTOR pathways in mCRPC [3,9], and our identification here of the oxidative phosphorylation pathway association with LNM.

3.4. WES Analysis Determines SPOP, FLT4, and PCDH15 Mutations Are Enriched in LNM
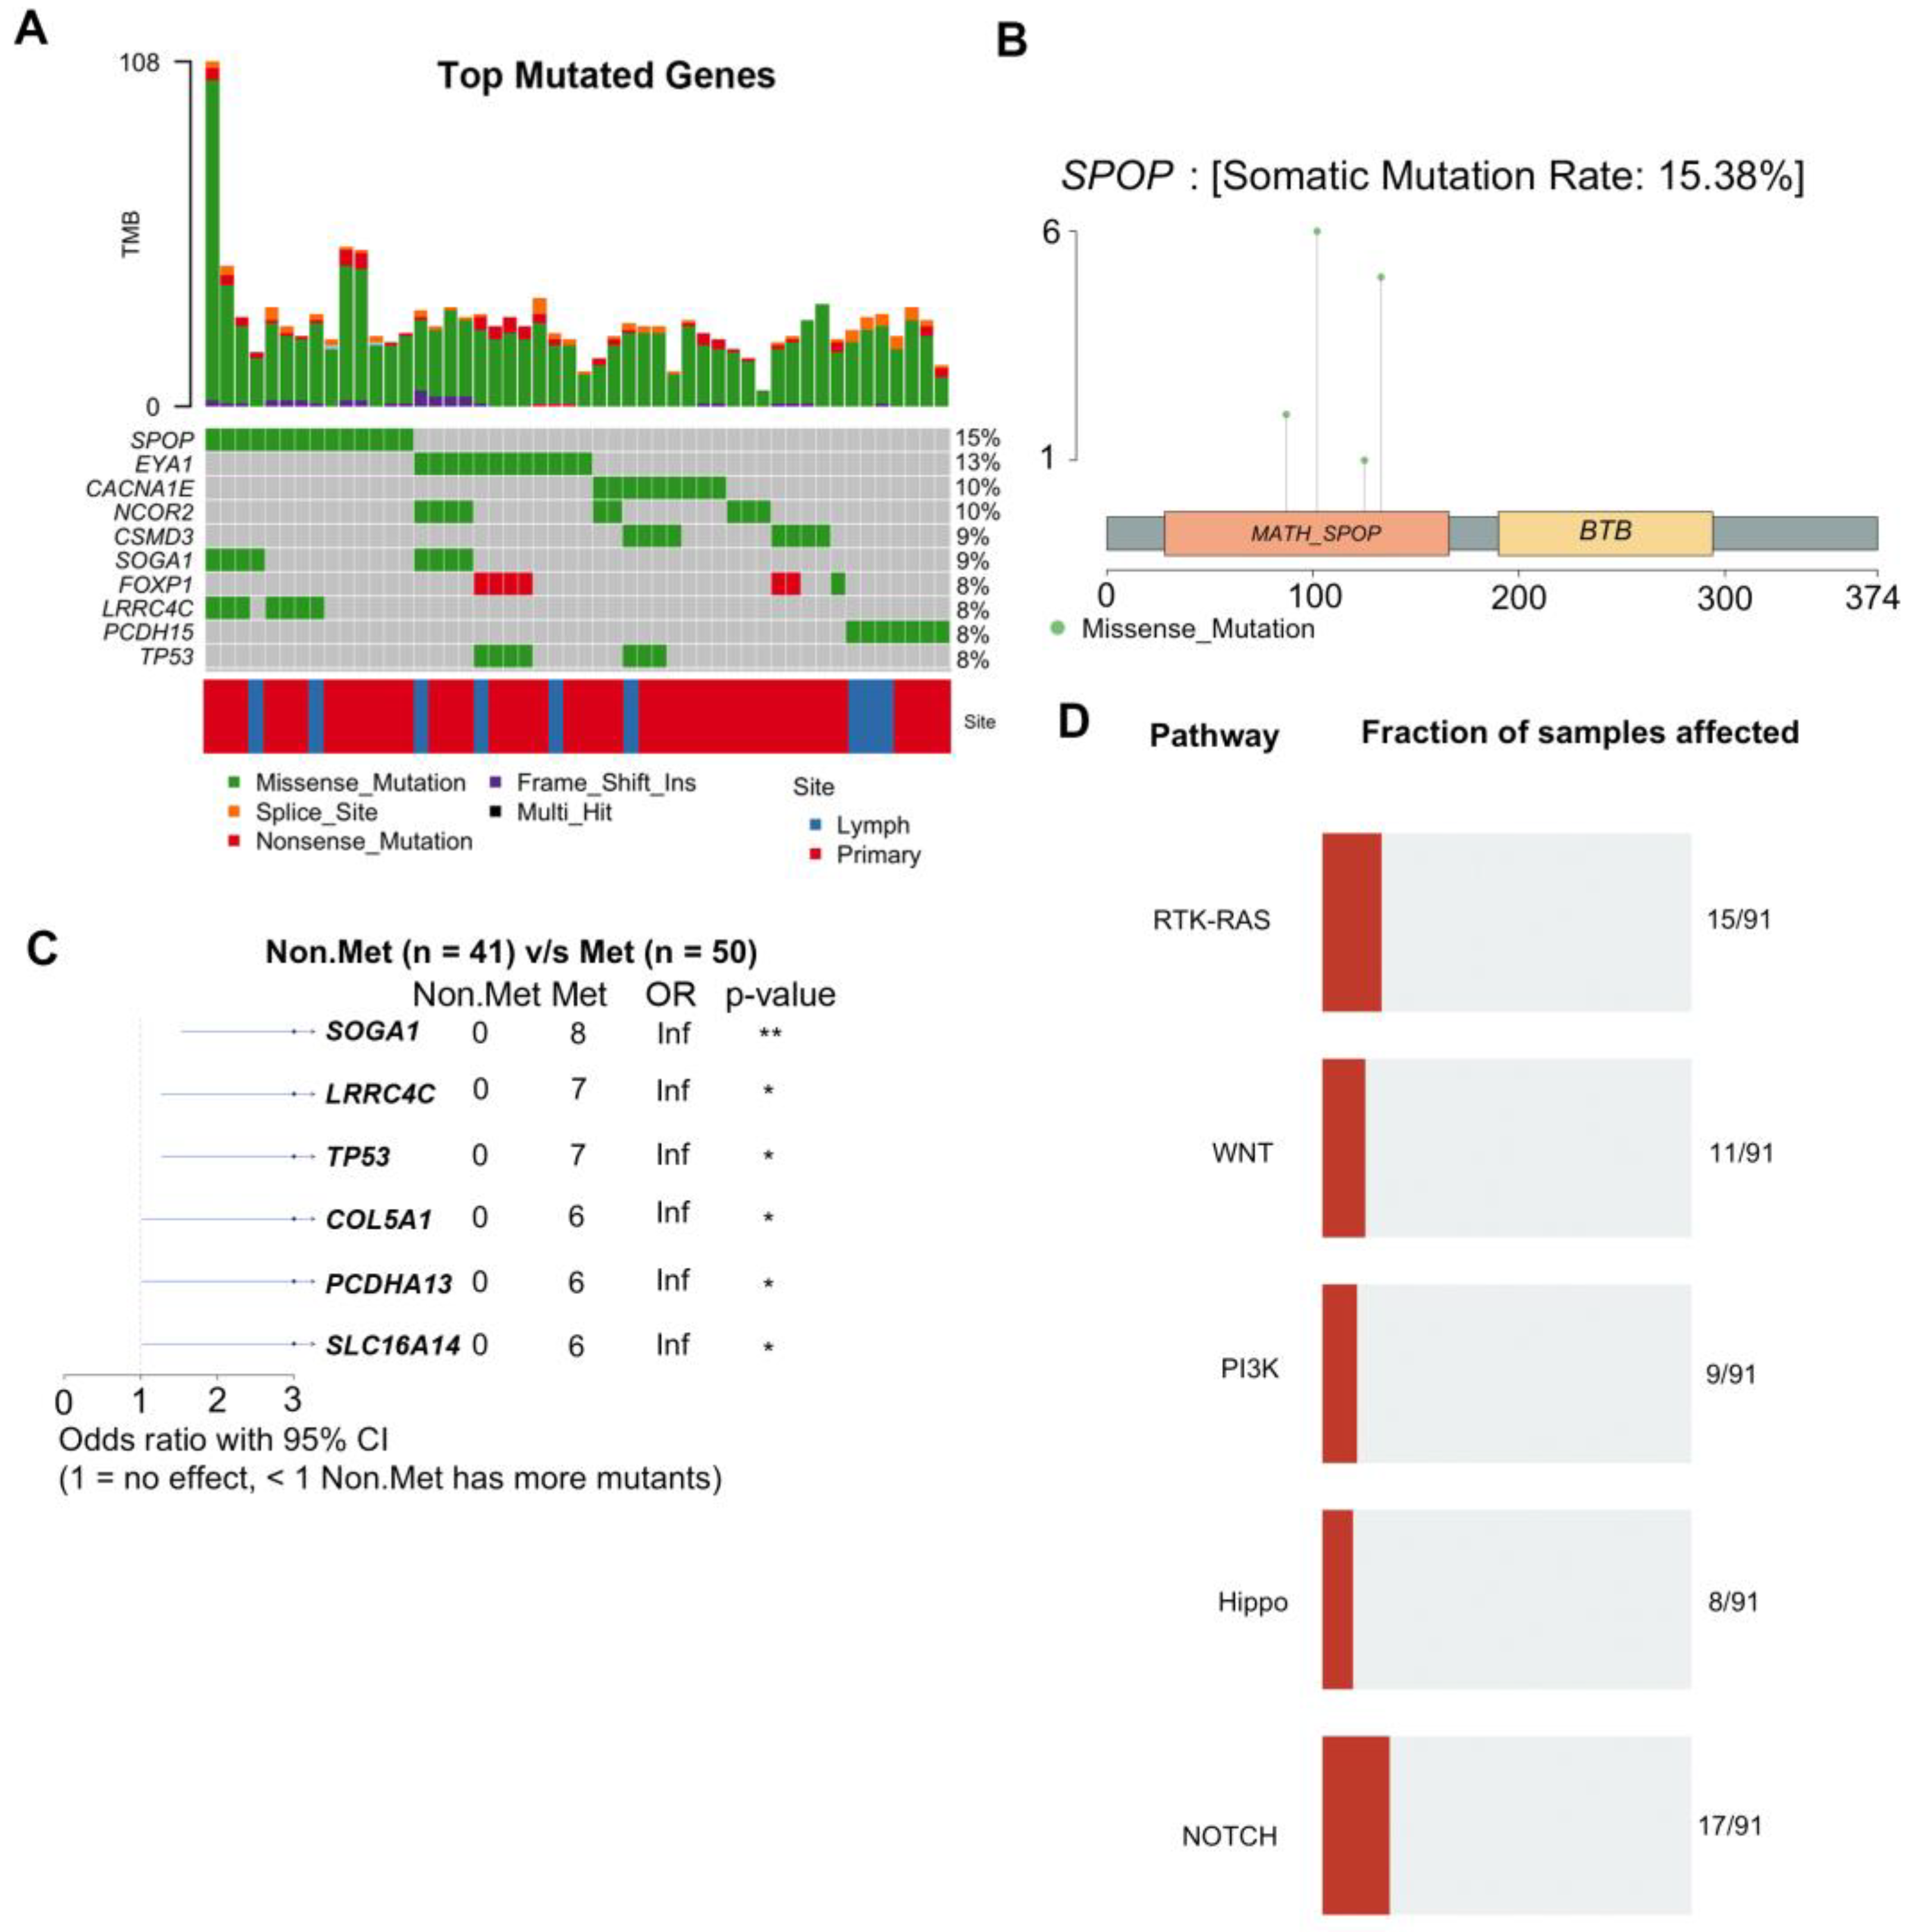
To identify mutations associated with LNM, we performed WES analysis. A total of 137 tissue samples from 35 patients were subjected to WES analysis at a median exome depth of 149 reads. GATK analysis pipelines including BWA alignment and Mutect2 variant calling using a panel of 34 normal samples were used to generate variant calls as previously described[1] (see Methods). We identified 1927 significant somatic mutations in 91 patient samples (Supplementary Table S10). The top mutated genes based on the number of samples across each site are shown (Figure 2A). The top ten mutated genes included SPOP, EYA1, NCOR2, CACNA1E, SOGA1, CSMD3, TP53, PCDH15, LRRC4C, and FOXP1 (Figure 2B). We observed four different missense mutations in SPOP from five patients, all of which were located in the MATH domain, which is involved in receptor binding and oligomerization (Figure 2C). Two patients (PCM021 and PCM033) had the same SPOP-F133V mutation. Furthermore, we identified specific mutations that were enriched in metastatic samples using maftools and determined that genes preferentially mutated in metastases included SOGA1, LRRC4C, TP53, COL5A1, PCDHA13, and SLC16A14 (Figure 2D). Mutations were most frequent in RTK/RAS, Wnt, PI3K, Hippo, and Notch pathways (Figure 2E).
Figure 2. WES analysis of 137 prostate cancer patient samples identifies recurrent mutations associated with metastasis. A) Graphical depiction of the top ten most frequently mutated genes in this study. Each column represents an individual tissue sample. Percentages on the right indicate the percentage of samples with mutations in that gene. Tumor mutational burden (TMB) for each sample is plotted along the top. B) Lollipop plot of mutations detected in the SPOP gene. C) Forest plot of mutations preferentially detected in patients with metastases. D) Signaling pathways most highly impacted by the detected mutations.
Preprints 88654 g002
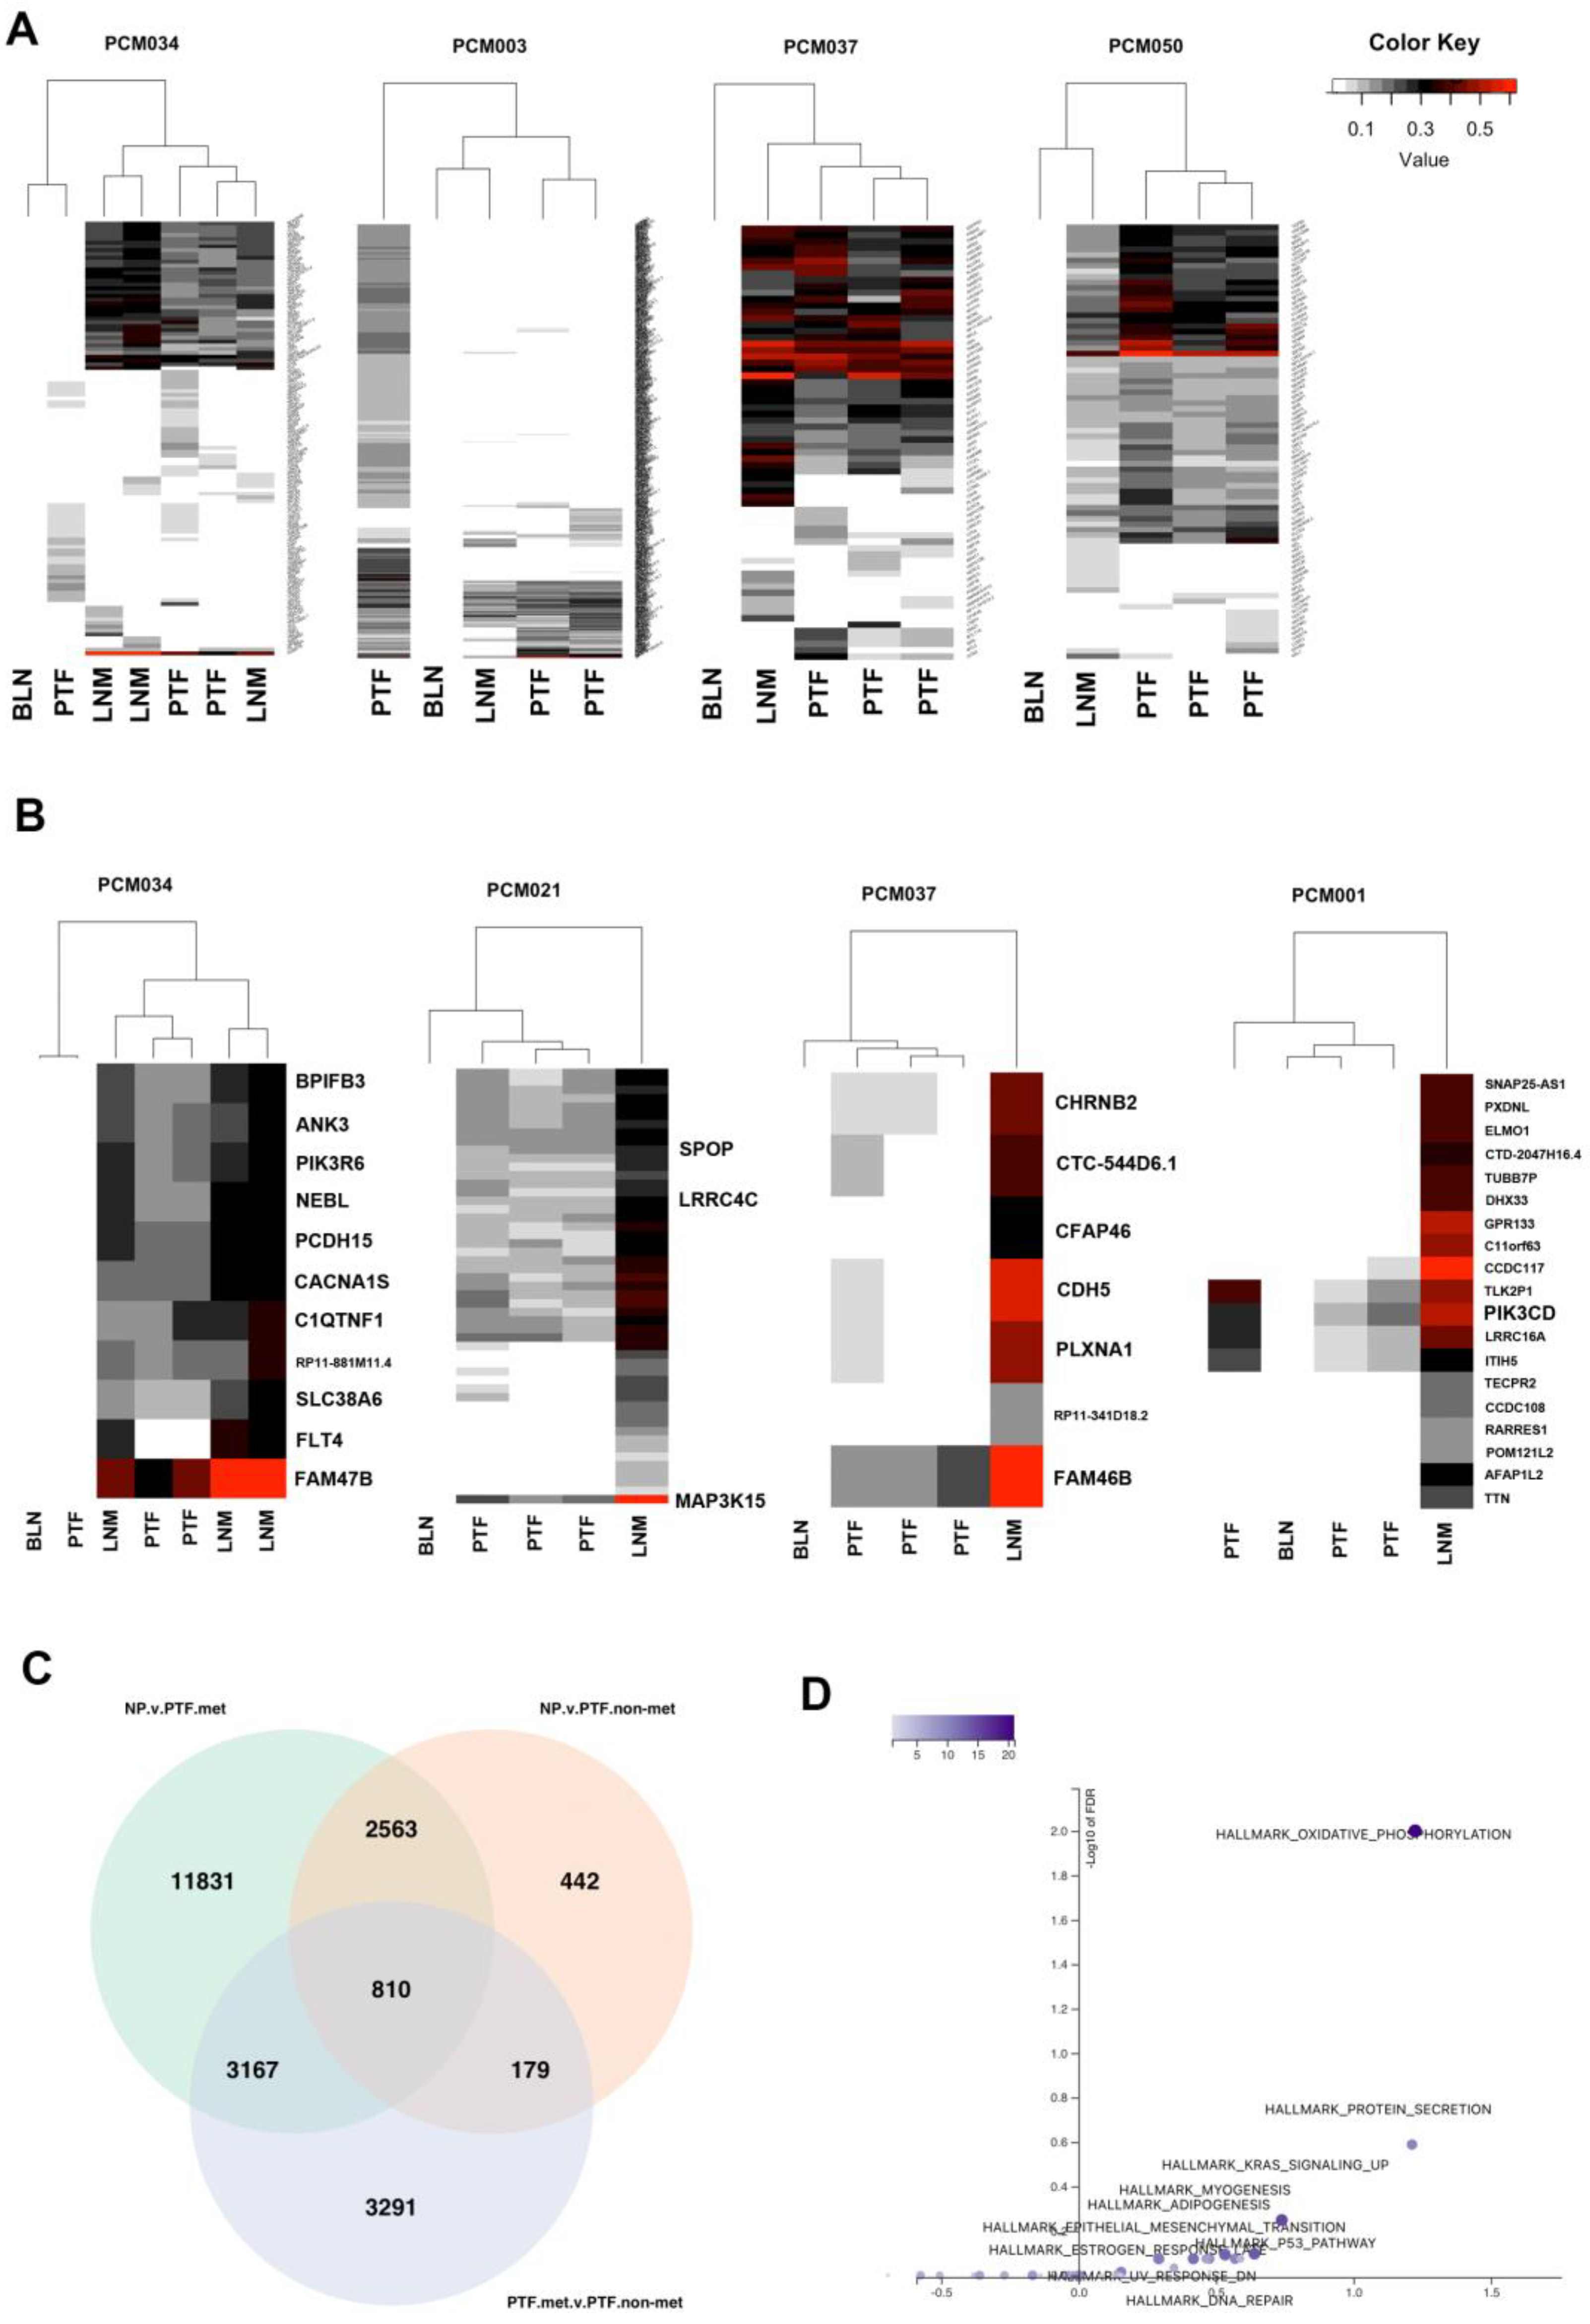
To examine tumor heterogeneity, we performed clustering based on mutation allele frequencies. Mutational allele frequency clustering identified some cases of clonally independent primary tumor foci. While some patients (e.g. PCM034 and PCM003) had primary tumor foci that appear to be clonally independent from the metastases and other primary tumor foci (Figure 3A), most primary tumor foci (e.g. PCM037 and PCM050) were clonally related to the metastases and derived from a common ancestral clone (Figure 3A). We also identified mutations that were significantly different in allele frequency between LNM and all primary tumor foci from the same patients. We found that mutations in FLT4, LRRC4C, PCDH15, FAM47B, PIK3CD, MAP3K15, PIK3R6, and SPOP, among others, were significantly enriched in LNM relative to primary tumor foci, suggesting natural selection for these somatic mutations in metastatic clones (Figure 3B). Of those genes, FLT4, SPOP, and PCDH15 were mutated in multiple patients. Association of FLT4 and PCDH15 with prostate cancer metastases has not been previously reported.
Figure 3. Analysis of metastatic and non-metastatic clones identifies oxidative phosphorylation as associated with metastasis. A) Heatmaps of all identified mutations clustered based on allele frequencies. LNM are clonally related to most primary tumor foci. Some patients (PCM034 and PCM003) contained primary tumor foci that were not clonally related to others, although most patients did not. B) Heatmaps of genes with significantly increased allele frequencies in LNM relative to primary tumor foci within the same patients indicating potential clonal selection. C) Venn diagram of sets of significantly differentially expressed genes comparing normal prostate to metastatic primary tumor foci, normal prostate to non-metastatic primary tumor foci, and metastatic primary tumor foci to non-metastatic primary tumor foci. D) Volcano plot of over-representation analysis of the 810 genes in the center of the Venn Diagram in panel C. Oxidative phosphorylation was significantly overrepresented in these genes.
Preprints 88654 g003

3.5. Integrative DNA/RNA Analysis Determines the Oxidative Phosphorylation Pathway, FLT4 Mutations, and PCDH15 Mutations Are Associated with Metastasis

To better understand molecular changes associated with metastasis, we performed integrated WES and RNAseq analyses. Based on shared genetic alterations of primary tumor foci to LNM, we categorized samples as either metastatic clones or non-metastatic clones (Supplementary Table S2) by examining the number of shared mutations and estimating if they were genetically related as being descended from a common ancestor containing the same somatic mutations. We performed DESeq2 analysis comparing these two groups to control for the fact that primary tumor foci and LNM are derived from different tissue microenvironments and different organ sites. We compared primary tumor foci from metastatic clones (primary tumor foci.met) to primary tumor foci from non-metastatic clones (primary tumor foci.nonmet) and both sets of primary tumor foci to normal prostate tissue (NP). Primary tumor foci.met samples were categorized based on mutation allele frequency as compared to LNM to determine if they were clonally related. Primary tumor foci.nonmet samples were either derived from patients without metastases or from patients with metastases that were not clonally related to corresponding LNM. The number of differentially expressed genes in each comparison are shown in the Venn Diagram in Figure 3C. Over-representation analysis of the 810 genes at the intersection of the three comparisons (i.e. genes different between all three groups of normal prostate and non-metastatic primary tumor and metastatic primary tumor samples, Supplementary Table S11) determined that they are enriched in genes involved in oxidative phosphorylation (Figure 3D). These genes included multiple ATP synthase genes (ATP5MF, ATP6V0B, ATP6V1G1), multiple cytochrome C oxidase and reductase genes (COX17, COX6A1, COX6B1, UQCRH, UQCRQ), and multiple NADH:ubiquinone oxidoreductase subunits (NDUFA3, NDUFB7, NDUFS6, and NDUFS8).
To further uncover gene expression differences associated with metastatic clones, we compared the metastatic primary tumor clones to the set of normal prostate and non-metastatic primary tumor clones. This analysis identified 1962 significantly different genes (p.adj < 0.05). GSEA analysis of these genes identified six gene sets associated with metabolism, including oxidative phosphorylation (hsa00190, FDR < 2.2e-16), seven gene sets associated DNA repair, twelve gene sets associated with cell cycle, seven gene sets associated with immune responses, and three gene sets associated with protein trafficking (Supplementary Table S12).
In addition, we analyzed associations of mutant alleles to Ecotyper carcinoma ecotypes. We restricted our analysis to mutations that were observed in at least two different patients and computed adjusted p-values using Bonferroni correction. Mutations in FLT4 were significantly associated with assignment of samples to CE7 (adj-p = 1.1E-4) and CE8 (adj-p = 1.5E-3), while mutations in PCDH15 were also significantly associated with the CE7 (adj-p = 7.8E-7) and CE8 (adj-p = 1.7E-3) ecotypes that included many LNM samples.

3.6. Tumor Heterogeneity Analysis Identifies Subclones Suggesting Gain of chr8 Prior to chr8p Loss
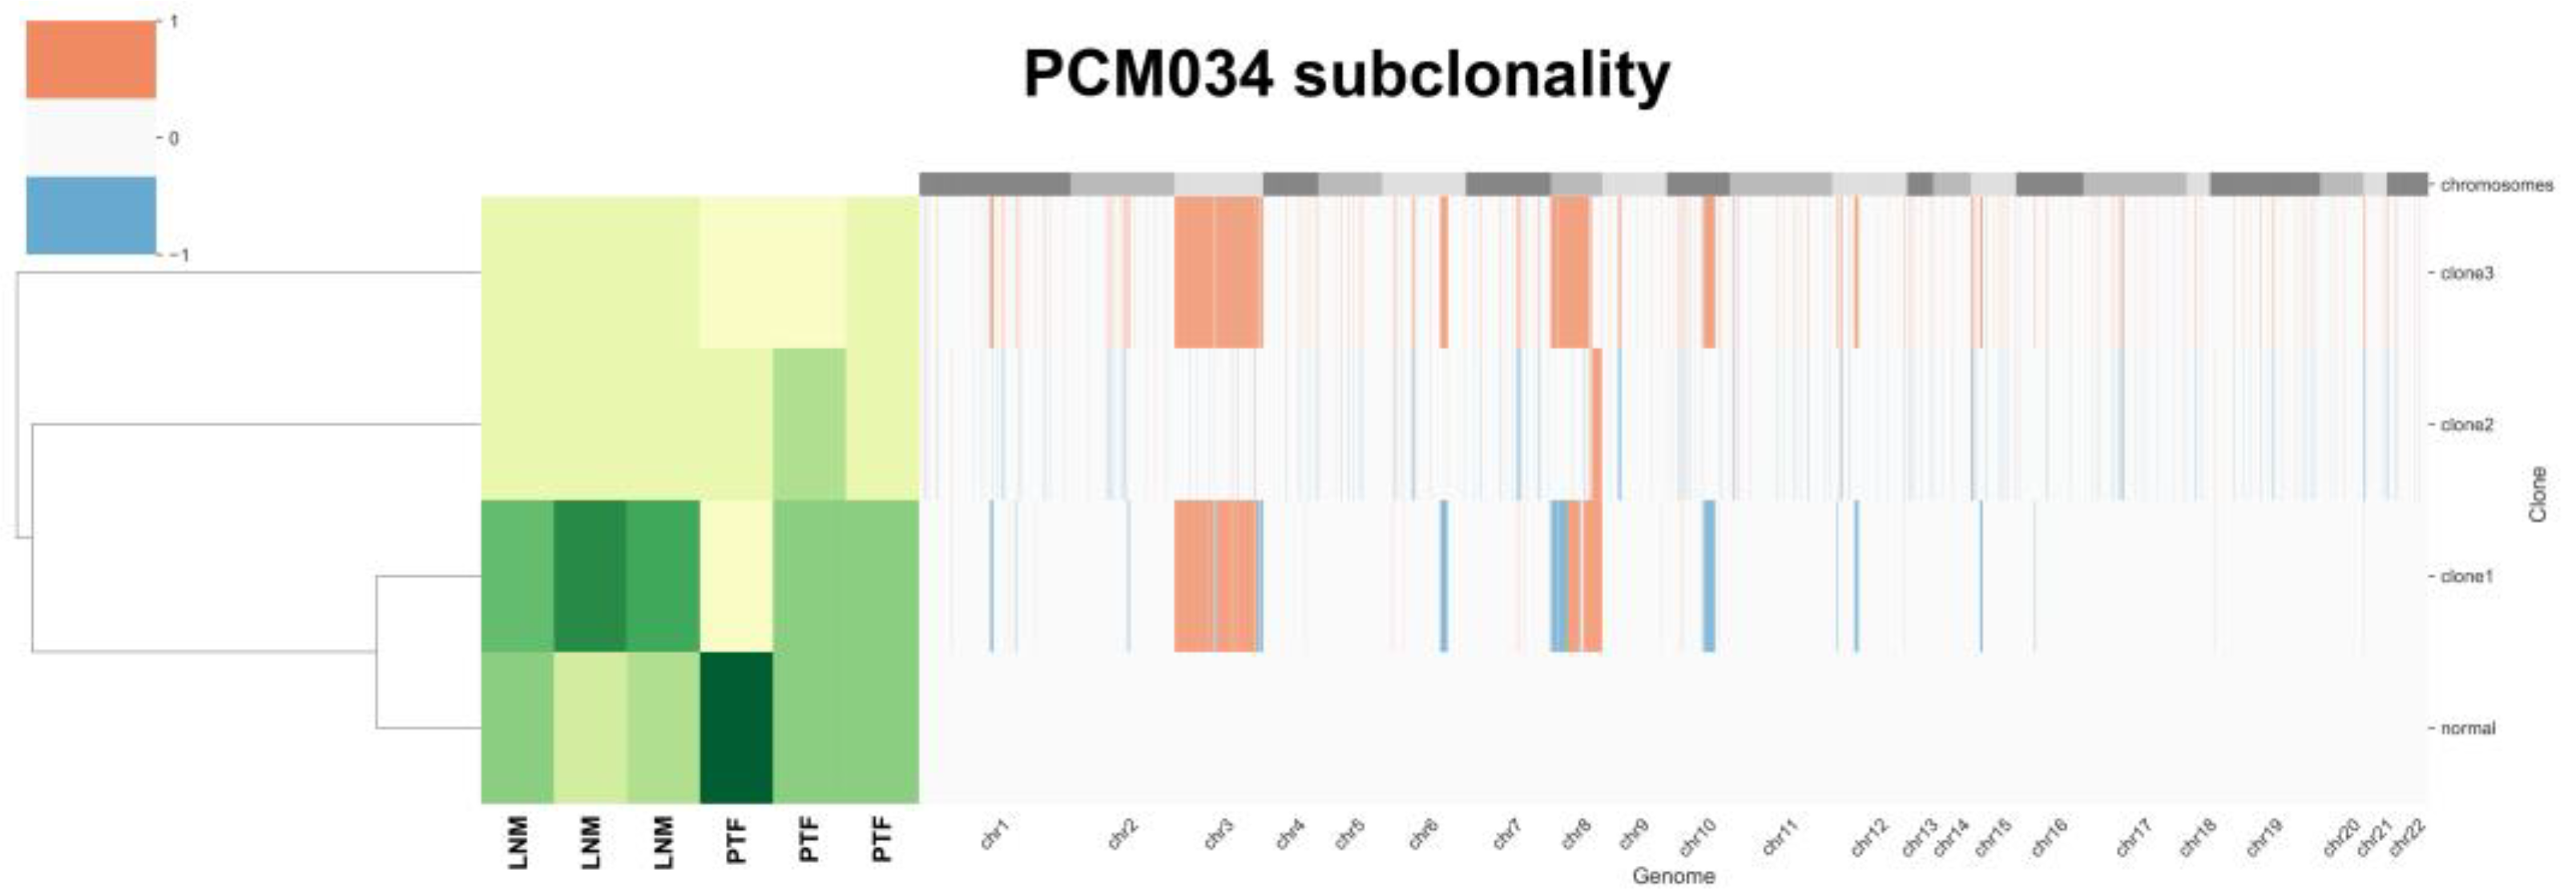
To examine subclones within each sample, we performed HATCHet analysis. The HATCHet software tool can compute tumor heterogeneity [34], copy number aberrations (CNAs), and whole-genome duplications (WGDs) to investigate tumor evolution and metastatic seeding patterns. We applied HATCHet analysis to our WES dataset and observed that most samples had subclonal populations (Figure 4). Patient PCM034 which had three LNM was of particular interest and had three subclones. Clone 1 was enriched in all three LNM and was characterized by gain of chromosomal arm 8q (containing c-MYC) and loss of chromosomal arm 8p (containing NKX3.1). The other subclones exhibited gain of chr8 but no loss of 8p, suggesting that gain of chr8 may have preceded loss of 8p during tumor evolution in this patient.
Figure 4. HATCHet analysis of tumor heterogeneity for patient PCM034 identifies subclones with differential gains in chr8. Gains and losses for each chromosome are indicated as red or blue. Abundance of subclones is indicated with lighter colors showing less abundance and darker colors showing greater abundance. Four subclones were identified, with clone 1 containing loss of chr8p and gain of chr8q most prevalent in the LNM samples. Primary tumor foci were enriched in the normal subclone.
Preprints 88654 g004

3.7. Validation in External Datasets Demonstrates EYA1 and CSMD3 Mutations Are Associated with Poor Survival
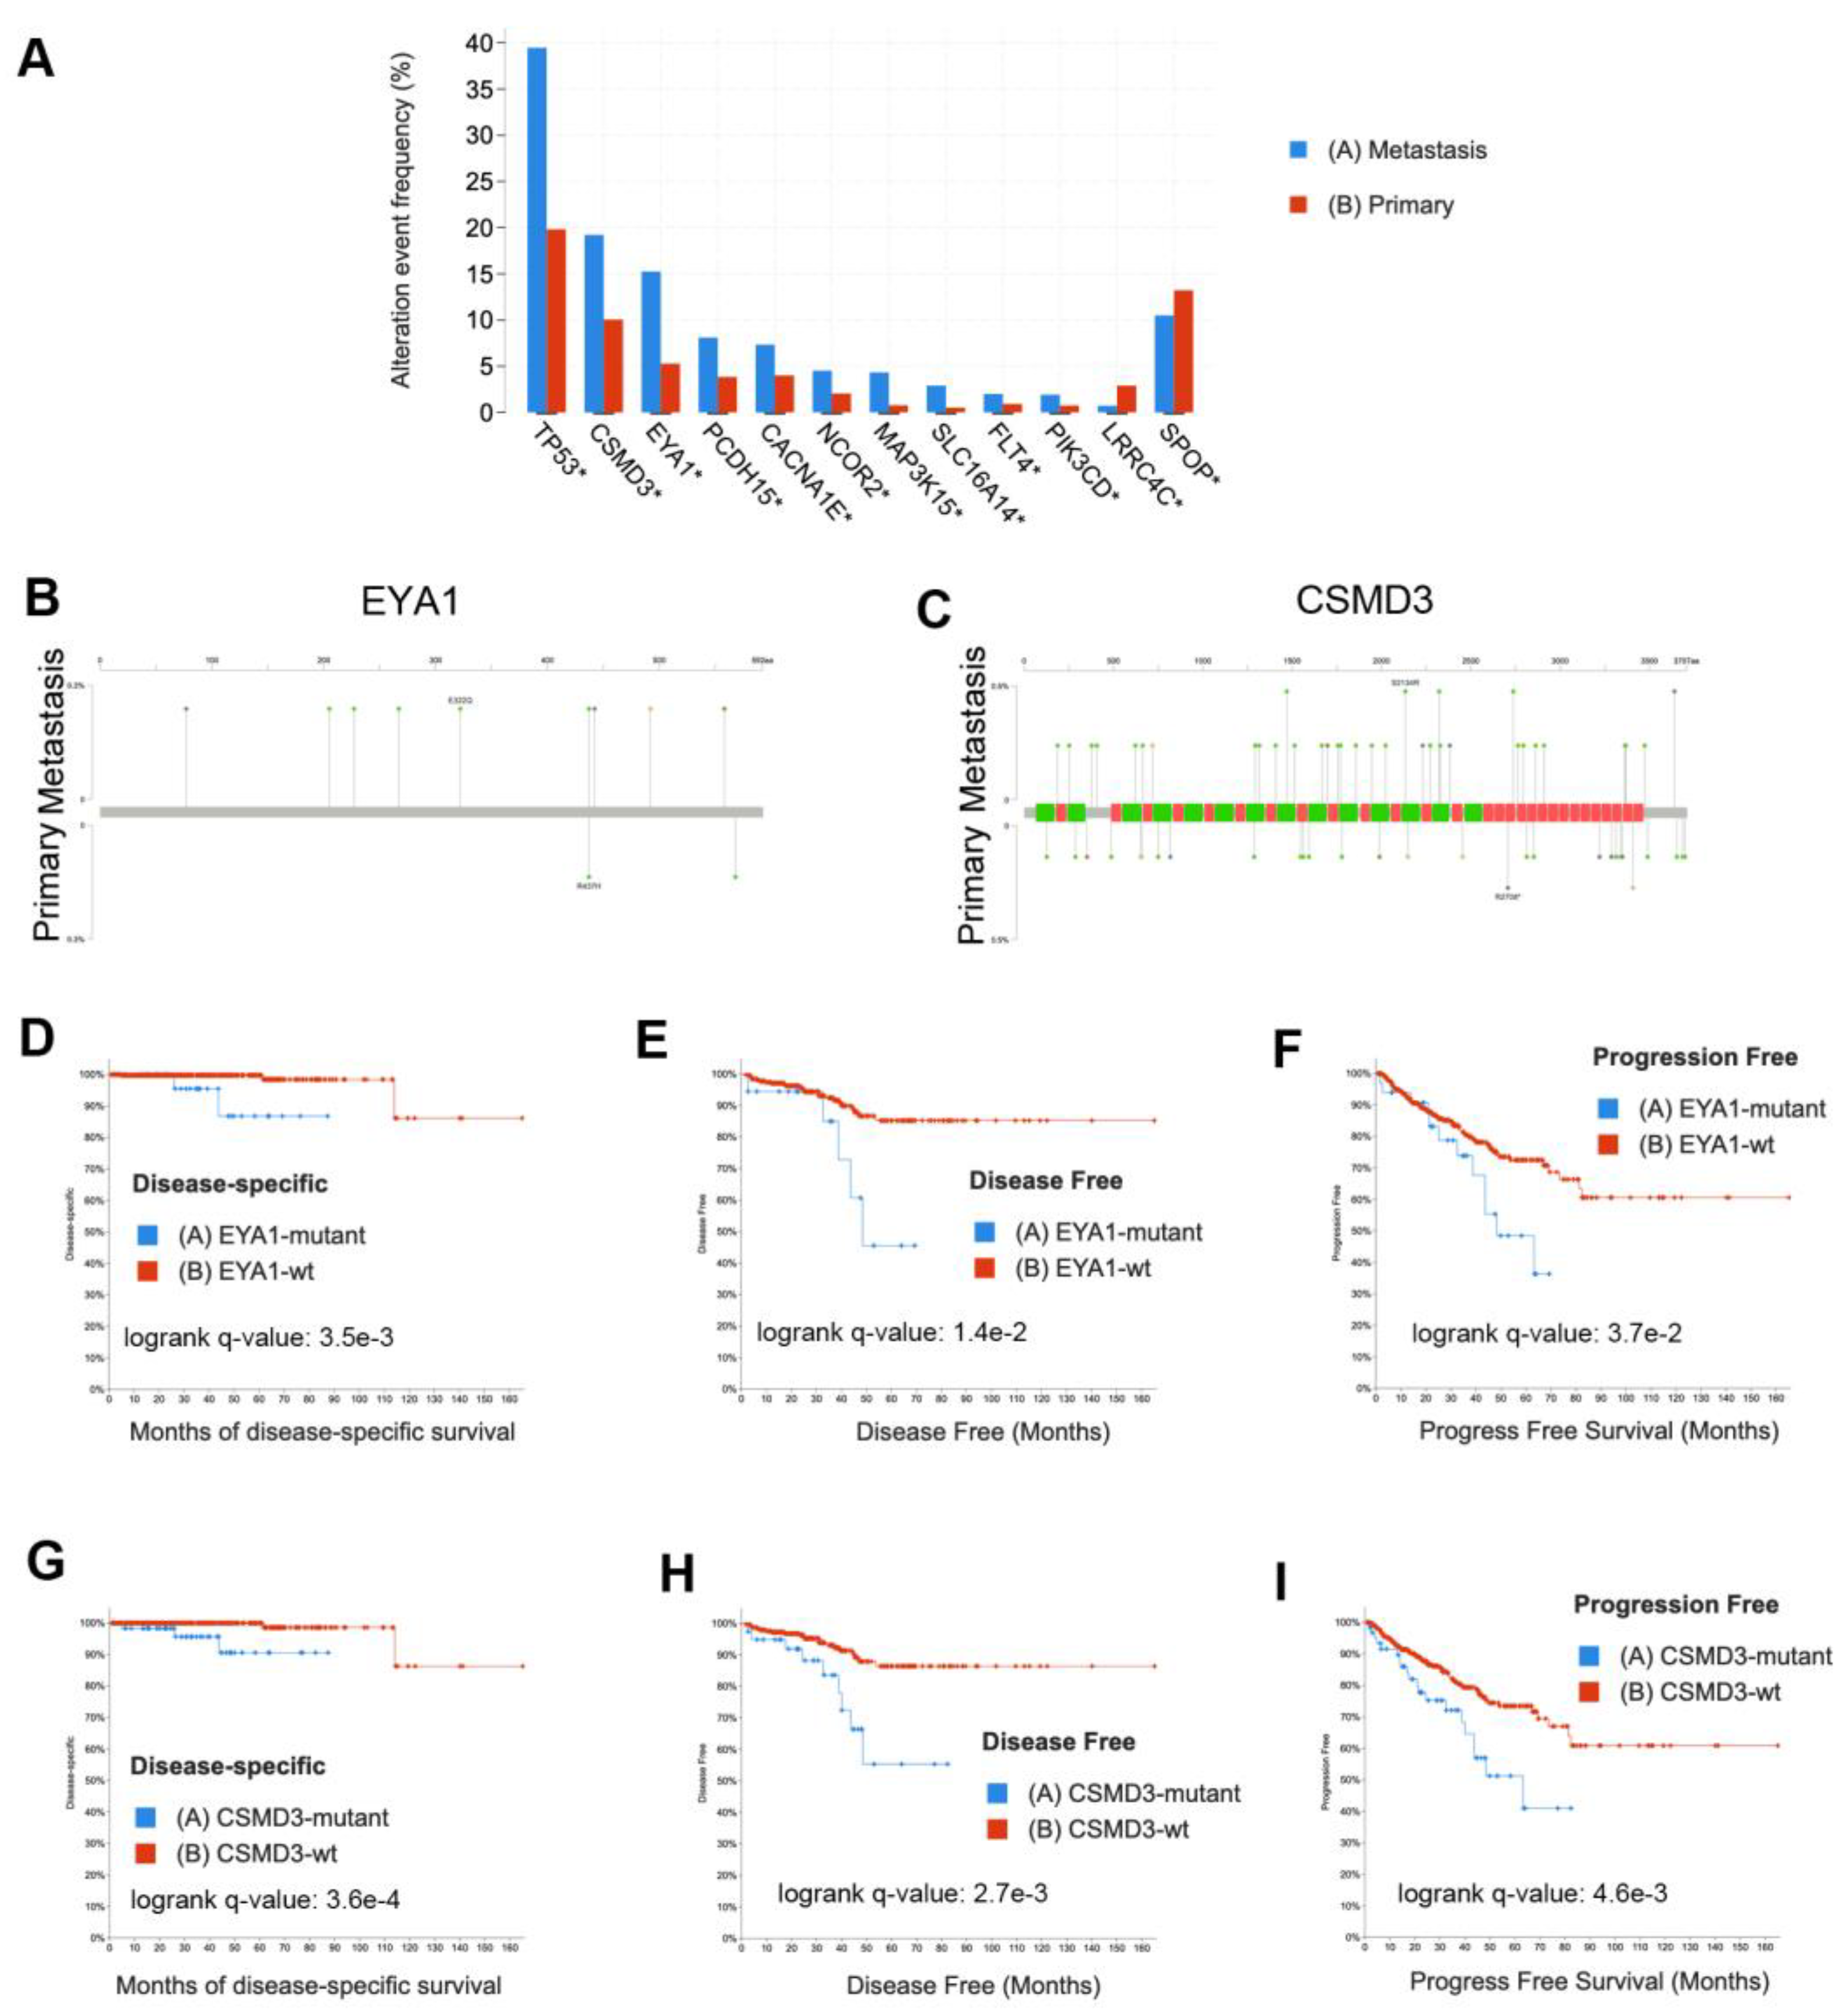
To evaluate the generalizability of our findings, we analyzed the mutations that we identified that appeared to be more frequent in LNM than in primary tumor foci or were frequently mutated in our cohort. We examined data from twelve published studies [2,3,6,41,42,43,44,45,46,47,48,49] that are publicly available in cBioPortal [38,39] comprising 8902 samples. Of those 8902 samples, 6650 samples (Supplementary Table S13) were definitively annotated as either primary tumors (n = 3929) or metastases (n =2721). We found that mutations were enriched in metastases over primary tumors for TP53 (q = 2E-64), EYA1 (q = 2E-9), CSMD3 (q = 6.1E-6), MAP3K15 (q = 3.3-5), PIK3CD (q = 2.2E-4), SLC16A14 (q = 1.4E-3), FLT4 (q = 1.6E-3), PCDH15 (q = 2.1E-3), CACNA1E (q = 1.5E-2), and NCOR2 (q = 1.9E-2) by Fisher exact test adjusted for false discovery (Figure 5A). We found SPOP mutations were enriched in primary tumors (q = 3.1E-3), and surprisingly, LRRC4C were also enriched in primary tumors (q = 3.1E-5). The complete list of mutations from this meta-analysis enriched in metastases or primary tumors includes well established oncogenes and tumor suppressors such as AR, TP53, PTEN, RB1, APC, MYC, and CTNNB1 and is provided in Supplementary Table S14. Mutational comparisons for EYA1 and CSMD3 are shown in Figure 5B,C. To examine the clinical significance of these mutations, we compared the disease-specific survival (492 patients) in the TCGA PanCancer dataset [46], disease-free survival (334 patients), and progression-free survival (494 patients) for samples with and without EYA1 (Figure 5D-F) or CSMD3 (Figure 5G-I) mutations (including SNV, CNV, and structural variations) and found that mutations in both these genes were significantly associated with poor outcome.
Figure 5. Validation of mutations using external datasets analyzed in cBioPortal demonstrates EYA1 and CSMD3 mutations are associated with patient outcome. A) Enrichment of mutations in metastases (n = 2721) or primary tumors (n = 3929). Asterisk indicates significant q-value based on Fisher exact tests. B) Lollipop plot of EYA1 mutations in metastases (top) compared to primary tumors (bottom). C) Lollipop plot of CSMD3 mutations in metastases (top) compared to primary tumors (bottom). D) Kaplan-Meier plot of disease-specific survival comparing EYA1-mutant cases (n = 34) to EYA1 wild-type cases (n = 458). E) Kaplan-Meier plot of disease-free survival comparing EYA1-mutant TCGA cases (n = 18) to EYA1 wild-type TCGA cases (n = 316). F) Kaplan-Meier plot of progression-free survival comparing EYA1-mutant TCGA cases (n = 34) to EYA1 wild-type TCGA cases (n = 460). G) Kaplan-Meier plot of disease-specific survival comparing CSMD3-mutant TCGA cases (n = 63) to CSMD3 wild-type TCGA cases (n = 429). H) Kaplan-Meier plot of disease-free survival comparing CSMD3-mutant TCGA cases (n = 39) to CSMD3 wild-type TCGA cases (n = 295). I) Kaplan-Meier plot of progression-free survival comparing CSMD3-mutant TCGA cases (n = 63) to CSMD3 wild-type TCGA cases (n = 431).
Preprints 88654 g005

4. Discussion

Mortality from prostate cancer is due to metastases, and thus, understanding the mechanisms of metastasis is essential for improving patient outcomes. The heterogeneity of metastases is poorly understood, and there are multiple opposing models of prostate cancer metastasis. Some data using copy number analyses support a monoclonal model of metastasis, in which most metastatic lesions derive from a single clone despite the multiclonal nature of the primary tumor [50]. Additional studies have shown limited genomic diversity in multiple metastases from the same men [51]. However, conflicting studies support polyclonal seeding of metastases based on whole genome sequencing of 51 tumors from 10 patients [52]. Some of the differences between these studies may be due to varying degrees of detail and granularity in the methods employed to molecularly characterize prostate cancer metastases. In addition, it is not clear if the genomic variability observed in metastases in some studies are due to mutations that occur at the metastatic site or if polyclonal populations from different primary foci seeded those metastases. Most studies that have analyzed intratumoral heterogeneity have examined a limited number of patients and used only the index lesion of the primary tumor.
Here, we aimed to address this gap in our understanding of heterogeneity in prostate cancer metastasis and to leverage unique resources of many patients from a clinical trial that includes both radical prostatectomy and extensive dissection of all pelvic LNs. Since metastasis to surrounding LNs is one of the first steps in metastatic spread, understanding intratumoral heterogeneity in pelvic LNs provides unique insights into the initial mechanisms and heterogeneity of prostate cancer metastasis. Additionally, analysis of multiple primary foci greatly increases the richness of our dataset and enables an integrated functional and clinical genomics approach to reveal genes driving aggressive metastatic prostate cancer.
Our data suggest that LNM contain multiple subclones that are already present in multiple related primary tumor foci. However, some subclones are more abundant in the LNM than in primary tumor foci, suggesting natural selection for these subclones and enrichment for specific mutations. We also show here that in addition to well-established oncogenes such as AR and TP53, mutations in lesser studied genes such as EYA1, CSMD3, FLT4, NCOR2, and PCDH15 are enriched in prostate cancer metastases relative to primary tumors. Additionally, mutations in FLT4 and PCDH15 are associated with the CE7 and CE8 gene expression ecotypes associated with Androgen, PI3K, MTORC, and OXPHOS pathways. Finally, using publicly available datasets, we have shown that mutations in EYA1 and CSMD3 are not only more frequent in metastases, but also are associated with worse disease-specific survival, progression-free survival, and disease-free survival.
The most frequent somatic mutation that we observed occurred in the Speckle-type POZ Protein (SPOP) gene, which is essential for ubiquitination and subsequent proteasomal degradation [53,54]. Functional SPOP is necessary for the degradation of AR, and mutated SPOP fails to ubiquitinate AR, allowing for an increase of AR protein [53,54]. Consistent with previous findings, we observed recurrent mutations in the MATH binding domain of SPOP, which mediates protein-protein interactions with AR. Recent studies have also identified important interactions between SPOP and c-JUN [55], in which mutated SPOP can bind to and stabilize c-JUN, potentially leading to accelerated cell proliferation. Nevertheless, SPOP mutations are more frequent in primary tumors than metastases, and patients with SPOP mutations have improved outcomes [2].
Our findings are consistent with previous studies, and expand upon them further. While we did not observe driver mutations in KIF4A and WDR62 that have been observed in metastatic prostate cancer [56], we did observe mutations in KIF5C, KIF7, KIF14, KIF18A, KIF20B, and KIF22, as well as in WDR17, WDR78, and WDR87, suggesting that other members of these families may also serve as cancer drivers. Consistent with earlier studies, we also observed mutations in FOXA1 [2,3,5], NCOR2 [9], and APC [9].
The nuclear receptor corepressor 2 (NCOR2) gene encodes a nuclear co-repressor (NCOR2) that mediates gene silencing. NCOR2 interacts with nuclear receptors, such as AR, to promote gene repression. Recently, it has been shown that reduced NCOR2 expression accelerates failure of androgen deprivation therapy in prostate cancer patients [57]. Mutations in NCOR2 could interfere with the ability of NCOR2 to regulate and maintain the epigenome and result in worse patient outcomes.
EYA transcriptional coactivator and phosphatase 1 (EYA1) encodes a transcription factor on chr8 that interacts with the SIX1 transcription factor and has intrinsic phosphatase activity important for SIX1 activity during development [58]. Mutations in EYA1 may cause dysregulation and act as a tumor promoter with SIX1 via activation of STAT3 signaling in thyroid carcinomas [59].
CUB and Sushi multiple domains 3 (CSDM3) has been shown to be one of the ten most recurrently mutated genes in prostate cancer [60] and SNPs in CSMD3 are associated with risk of prostate cancer in Hispanic men [61]. CSMD3 is also located on chr8 and CSMD3 was identified as the second most frequently somatically mutated gene (next to TP53) in non-small cell lung cancer [62]. CSMD3 mutation is highly correlated with increased tumor mutational burden and poor clinical prognosis in ovarian cancer [63].
FMS-related receptor tyrosine kinase 4 (FLT4, also known as VEGFR-3) is a receptor tyrosine kinase that binds to VEGF-C and VEGF-D. Mutations in FLT4 have been associated with sentinel lymph node metastases in prostate cancer [64], and FLT4 plays a critical role in prostate lymphangiogenesis [65]. Our observation that FLT4 mutations are associated with carcinoma ecotypes is intriguing and future studies will examine a potential causative role for these mutations.
Protocadherin-related 15 (PCDH15) is a member of the cadherin superfamily that mediates cell-cell adhesion. Somatic mutation of PCDH15 has been associated with metastasis in ocular adnexal sebaceous carcinoma [66]. PCDH15 knockdown significantly increases ERK phosphorylation and activation, increasing proliferation of oligodendrocyte progenitor cells [67]. Our observation that PCDH15 mutations are associated with specific carcinoma ecotypes is an avenue of future investigation.
Through our RNAseq analyses, we determined that genes that were differentially expressed between normal prostate, metastatic clones in the prostate, and non-metastatic clones in the prostate were enriched for oxidative phosphorylation. Interestingly, lower grade African-American samples with Gleason score 7 were also enriched for this gene set. Both low and high-grade African-American samples had increased expression of genes associated with adherens and tight junctions and mitotic spindle assembly, which could be related to the generally more aggressive phenotypes and worse outcomes associated with African-American patients [68,69].
There are a number of limitations to this study. First, while this study includes tissues from only 43 patients, of which only 16 had metastases, it does provide RNAseq analysis of 165 samples and WES analysis of 137 samples, with at least three and up to seven samples for each patient. Second, the samples used were macrodissected from FFPE blocks and thus were analyzed by bulk sequencing. Finally, while many of our observations were either consistent with previous literature or validated in large external datasets, functional validation of the observed mutations and gene expression changes are needed to better understand the mechanisms of metastasis and poor outcome for prostate cancer patients.

5. Conclusions

The data provided in this study can serve as a resource for future studies of prostate cancer metastasis and tumor heterogeneity. We show that LNM contain multiple subclones that are already present in multiple related primary tumor foci and suggest natural selection for some metastatic subclones and enrichment for specific mutations. We further show that oxidative phosphorylation is strongly associated with both metastasis and racial disparities. Integrative genomic analysis of primary prostate tumors and associated LNM demonstrated enrichment of mutations in several genes including both well-established oncogenes and tumor suppressors and understudied genes such as EYA1, CSMD3, FLT4, NCOR2, and PCDH15. Future studies of these genes could provide novel avenues for detection of patients at high risk for metastasis as well as new therapeutic approaches specifically targeting the metastatic process.

Supplementary Materials

The following supporting information can be downloaded at the website of this paper posted on Preprints.org. Supplementary Figure S1. GSEA analysis comparing primary tumor foci to LNM with the Hallmark 50 gene sets. Gene sets enriched in primary tumor foci are shown in blue and gene sets enriched in LNM are shown in orange. Supplementary Table S1. Clinical metadata for patients included in this study. Supplementary Table S2. Metadata of 165 RNAseq samples including carcinoma ecotype assignment data. Supplementary Table S3. RNAseq Readcount data of 165 samples. Supplementary Table S4. Metadata of 137 WES samples including 102 tumor samples and 35 matched normal samples. Supplementary Table S5. DESeq2 results of comparison of benign lymph nodes to metastatic lymph nodes. Supplementary Table S6. DESeq2 results of comparison of primary tumor foci to lymph node metastases. Supplementary Table S7. Table of 704 genes consistently trending up or down from normal to primary tumor to metastases. Supplementary Table S8. GSEA results from comparison of primary tumor foci from African-Americans with Gleason score 7 to White primary tumor foci with Gleason score 7. Supplementary Table S9. GSEA results from comparison of primary tumor foci from African-Americans with Gleason score 9 to White primary tumor foci with Gleason score 9. Supplementary Table S10. Table of 1927 significant somatic mutations identified in 91 tumor samples. Supplementary Table S11. Set of 810 genes significantly different in three comparisons: normal prostate vs. primary tumor metastatic clones, normal prostate vs. primary tumor non-metastatic clones, and primary tumor metastatic clones vs. primary tumor non-metastatic clones. Supplementary Table S12. GSEA analysis results for comparison of metastatic primary tumors to non-metastatic primary tumors and normal prostate. Supplementary Table S13. Clinical data for 6650 samples used from 12 published studies as downloaded from cBioPortal. Supplementary Table S14. Enriched mutations in primary and metastatic samples based on the analysis of the 6650 samples downloaded from cBioPortal.

Author Contributions

Concept and Design: CSM, DMS, MGS, and AOO. Data Acquisition: CSM, MA, CLW, IOL, and OAAO. Data Analysis: CSM, ERK, DP, and BGB. Statistical Analysis: CSM, ERK, BGB, DP, and YH. Drafting of manuscript: CSM, CLW, and ERK. Critical revision of the manuscript: CSM, ERK, MA, IOL, BGB, DP, YH, DMS, MGS, and AOO. Obtained funding: CSM and MGS.

Funding

This work was supported by NIH grants and U01-CA113913. Research reported in this publication was supported in part by the Emory University Integrated Genomics Core (EIGC) of the Winship Cancer Institute of Emory University and NIH/NCI under award number, 2P30CA138292-04. The content is solely the responsibility of the authors and does not necessarily reflect the official views of the National Institute of Health.

Institutional Review Board Statement

The study was conducted in accordance with the Declaration of Helsinki, and approved by the Institutional Review Board of Emory University (protocol STUDY00003774.

Data Availability Statement

Complete fastq, bam, vcf, and maf file datasets are available under controlled access in the public data repository dbGaP Study Accession: phs003404.v1.p1 “Genomic Analysis Of Prostate Tumor Heterogeneity In Metastasis”. Processed read counts from RNAseq and mutational data from WES are available in the Supplementary Material.

Acknowledgments

The authors would like to thank Cole Smith for technical assistance and Dr. Jindan Yu for critical comments on the manuscript.

Conflicts of Interest

The authors declare no conflict of interest.

References

  1. Cancer Genome Atlas Research, N. The Molecular Taxonomy of Primary Prostate Cancer. Cell 2015, 163, 1011–1025. [Google Scholar] [CrossRef]
  2. Abida, W.; Cyrta, J.; Heller, G.; Prandi, D.; Armenia, J.; Coleman, I.; Cieslik, M.; Benelli, M.; Robinson, D.; Van Allen, E.M.; et al. Genomic correlates of clinical outcome in advanced prostate cancer. Proc Natl Acad Sci U S A 2019, 116, 11428–11436. [Google Scholar] [CrossRef] [PubMed]
  3. Grasso, C.S.; Wu, Y.M.; Robinson, D.R.; Cao, X.; Dhanasekaran, S.M.; Khan, A.P.; Quist, M.J.; Jing, X.; Lonigro, R.J.; Brenner, J.C.; et al. The mutational landscape of lethal castration-resistant prostate cancer. Nature 2012, 487, 239–243. [Google Scholar] [CrossRef]
  4. He, M.X.; Cuoco, M.S.; Crowdis, J.; Bosma-Moody, A.; Zhang, Z.; Bi, K.; Kanodia, A.; Su, M.J.; Ku, S.Y.; Garcia, M.M.; et al. Transcriptional mediators of treatment resistance in lethal prostate cancer. Nat Med 2021, 27, 426–433. [Google Scholar] [CrossRef]
  5. Quigley, D.A.; Dang, H.X.; Zhao, S.G.; Lloyd, P.; Aggarwal, R.; Alumkal, J.J.; Foye, A.; Kothari, V.; Perry, M.D.; Bailey, A.M.; et al. Genomic Hallmarks and Structural Variation in Metastatic Prostate Cancer. Cell 2018, 174, 758–769. [Google Scholar] [CrossRef] [PubMed]
  6. Robinson, D.; Van Allen, E.M.; Wu, Y.M.; Schultz, N.; Lonigro, R.J.; Mosquera, J.M.; Montgomery, B.; Taplin, M.E.; Pritchard, C.C.; Attard, G.; et al. Integrative clinical genomics of advanced prostate cancer. Cell 2015, 161, 1215–1228. [Google Scholar] [CrossRef] [PubMed]
  7. Mateo, J.; Seed, G.; Bertan, C.; Rescigno, P.; Dolling, D.; Figueiredo, I.; Miranda, S.; Nava Rodrigues, D.; Gurel, B.; Clarke, M.; et al. Genomics of lethal prostate cancer at diagnosis and castration resistance. J Clin Invest 2020, 130, 1743–1751. [Google Scholar] [CrossRef]
  8. Russo, G.I.; Bonacci, P.; Bivona, D.; Privitera, G.F.; Broggi, G.; Caltabiano, R.; Vella, J.; Lo Giudice, A.; Asmundo, M.G.; Cimino, S.; et al. Genomic Landscape Alterations in Primary Tumor and Matched Lymph Node Metastasis in Hormone-Naive Prostate Cancer Patients. Cancers (Basel) 2022, 14. [Google Scholar] [CrossRef]
  9. Robinson, D.; Van Allen, E.M.; Wu, Y.M.; Schultz, N.; Lonigro, R.J.; Mosquera, J.M.; Montgomery, B.; Taplin, M.E.; Pritchard, C.C.; Attard, G.; et al. Integrative clinical genomics of advanced prostate cancer. Cell 2015, 161, 1215–1228. [Google Scholar] [CrossRef]
  10. Cheng, L.; Zincke, H.; Blute, M.L.; Bergstralh, E.J.; Scherer, B.; Bostwick, D.G. Risk of prostate carcinoma death in patients with lymph node metastasis. Cancer 2001, 91, 66–73. [Google Scholar] [CrossRef]
  11. Powell, I.J.; Dyson, G.; Land, S.; Ruterbusch, J.; Bock, C.H.; Lenk, S.; Herawi, M.; Everson, R.; Giroux, C.N.; Schwartz, A.G.; et al. Genes associated with prostate cancer are differentially expressed in African American and European American men. Cancer Epidemiol Biomarkers Prev 2013, 22, 891–897. [Google Scholar] [CrossRef] [PubMed]
  12. Huang, F.W.; Mosquera, J.M.; Garofalo, A.; Oh, C.; Baco, M.; Amin-Mansour, A.; Rabasha, B.; Bahl, S.; Mullane, S.A.; Robinson, B.D.; et al. Exome Sequencing of African-American Prostate Cancer Reveals Loss-of-Function ERF Mutations. Cancer discovery 2017, 7, 973–983. [Google Scholar] [CrossRef] [PubMed]
  13. Jaratlerdsiri, W.; Chan, E.K.F.; Gong, T.; Petersen, D.C.; Kalsbeek, A.M.F.; Venter, P.A.; Stricker, P.D.; Bornman, M.R.; Hayes, V.M. Whole Genome Sequencing Reveals Elevated Tumor Mutational Burden and Initiating Driver Mutations in African Men with Treatment-Naive, High-Risk Prostate Cancer. Cancer Res 2018. [Google Scholar] [CrossRef] [PubMed]
  14. Yadav, S.S.; Stockert, J.A.; Hackert, V.; Yadav, K.K.; Tewari, A.K. Intratumor heterogeneity in prostate cancer. Urol Oncol 2018, 36, 349–360. [Google Scholar] [CrossRef] [PubMed]
  15. Gleason, D.F. Classification of prostatic carcinomas. Cancer Chemother Rep 1966, 50, 125–128. [Google Scholar] [PubMed]
  16. Gleason, D.F. Histologic grading of prostate cancer: a perspective. Hum Pathol 1992, 23, 273–279. [Google Scholar] [CrossRef] [PubMed]
  17. Gleason, D.F.; Mellinger, G.T. Prediction of prognosis for prostatic adenocarcinoma by combined histological grading and clinical staging. J Urol 1974, 111, 58–64. [Google Scholar] [CrossRef]
  18. Aihara, M.; Wheeler, T.M.; Ohori, M.; Scardino, P.T. Heterogeneity of prostate cancer in radical prostatectomy specimens. Urology 1994, 43, 60–66. [Google Scholar] [CrossRef]
  19. Cheng, L.; Song, S.Y.; Pretlow, T.G.; Abdul-Karim, F.W.; Kung, H.J.; Dawson, D.V.; Park, W.S.; Moon, Y.W.; Tsai, M.L.; Linehan, W.M.; et al. Evidence of independent origin of multiple tumors from patients with prostate cancer. J Natl Cancer Inst 1998, 90, 233–237. [Google Scholar] [CrossRef]
  20. Mehra, R.; Han, B.; Tomlins, S.A.; Wang, L.; Menon, A.; Wasco, M.J.; Shen, R.; Montie, J.E.; Chinnaiyan, A.M.; Shah, R.B. Heterogeneity of TMPRSS2 gene rearrangements in multifocal prostate adenocarcinoma: molecular evidence for an independent group of diseases. Cancer Res 2007, 67, 7991–7995. [Google Scholar] [CrossRef]
  21. Boutros, P.C.; Fraser, M.; Harding, N.J.; de Borja, R.; Trudel, D.; Lalonde, E.; Meng, A.; Hennings-Yeomans, P.H.; McPherson, A.; Sabelnykova, V.Y.; et al. Spatial genomic heterogeneity within localized, multifocal prostate cancer. Nat Genet 2015, 47, 736–745. [Google Scholar] [CrossRef]
  22. Lovf, M.; Zhao, S.; Axcrona, U.; Johannessen, B.; Bakken, A.C.; Carm, K.T.; Hoff, A.M.; Myklebost, O.; Meza-Zepeda, L.A.; Lie, A.K.; et al. Multifocal Primary Prostate Cancer Exhibits High Degree of Genomic Heterogeneity. Eur Urol 2019, 75, 498–505. [Google Scholar] [CrossRef]
  23. Lindberg, J.; Klevebring, D.; Liu, W.; Neiman, M.; Xu, J.; Wiklund, P.; Wiklund, F.; Mills, I.G.; Egevad, L.; Grönberg, H. Exome Sequencing of Prostate Cancer Supports the Hypothesis of Independent Tumour Origins. European Urology 2013, 63, 347–353. [Google Scholar] [CrossRef]
  24. Cooper, C.S.; Eeles, R.; Wedge, D.C.; Van Loo, P.; Gundem, G.; Alexandrov, L.B.; Kremeyer, B.; Butler, A.; Lynch, A.G.; Camacho, N.; et al. Analysis of the genetic phylogeny of multifocal prostate cancer identifies multiple independent clonal expansions in neoplastic and morphologically normal prostate tissue. Nature Genetics 2015, 47, 367–372. [Google Scholar] [CrossRef]
  25. Wei, L.; Wang, J.; Lampert, E.; Schlanger, S.; DePriest, A.D.; Hu, Q.; Gomez, E.C.; Murakam, M.; Glenn, S.T.; Conroy, J.; et al. Intratumoral and Intertumoral Genomic Heterogeneity of Multifocal Localized Prostate Cancer Impacts Molecular Classifications and Genomic Prognosticators. Eur Urol 2017, 71, 183–192. [Google Scholar] [CrossRef]
  26. Alemozaffar, M.; Akintayo, A.A.; Abiodun-Ojo, O.A.; Patil, D.; Saeed, F.; Huang, Y.; Osunkoya, A.O.; Goodman, M.M.; Sanda, M.; Schuster, D.M. [(18)F]Fluciclovine Positron Emission Tomography/Computerized Tomography for Preoperative Staging in Patients with Intermediate to High Risk Primary Prostate Cancer. J Urol 2020, 204, 734–740. [Google Scholar] [CrossRef] [PubMed]
  27. Kreuger, F. TrimGalore, https://github.com, 2020.
  28. Dobin, A.; Davis, C.A.; Schlesinger, F.; Drenkow, J.; Zaleski, C.; Jha, S.; Batut, P.; Chaisson, M.; Gingeras, T.R. STAR: ultrafast universal RNA-seq aligner. Bioinformatics 2013, 29, 15–21. [Google Scholar] [CrossRef] [PubMed]
  29. Love, M.I.; Huber, W.; Anders, S. Moderated estimation of fold change and dispersion for RNA-seq data with DESeq2. Genome Biol 2014, 15, 550. [Google Scholar] [CrossRef]
  30. Wang, J.; Vasaikar, S.; Shi, Z.; Greer, M.; Zhang, B. WebGestalt 2017: a more comprehensive, powerful, flexible and interactive gene set enrichment analysis toolkit. Nucleic Acids Res 2017, 45, W130–W137. [Google Scholar] [CrossRef] [PubMed]
  31. Subramanian, A.; Kuehn, H.; Gould, J.; Tamayo, P.; Mesirov, J.P. GSEA-P: a desktop application for Gene Set Enrichment Analysis. Bioinformatics 2007, 23, 3251–3253. [Google Scholar] [CrossRef] [PubMed]
  32. Van der Auwera, G.A.; O'Connor, B.D. Genomics in the Cloud: Using Docker, GATK, and WDL in Terra; O'Reilly Media: 2020.
  33. Mayakonda, A.; Lin, D.C.; Assenov, Y.; Plass, C.; Koeffler, H.P. Maftools: efficient and comprehensive analysis of somatic variants in cancer. Genome Res 2018, 28, 1747–1756. [Google Scholar] [CrossRef]
  34. Zaccaria, S.; Raphael, B.J. Accurate quantification of copy-number aberrations and whole-genome duplications in multi-sample tumor sequencing data. Nat Commun 2020, 11, 4301. [Google Scholar] [CrossRef]
  35. Powell, I.J. Epidemiology and pathophysiology of prostate cancer in African-American men. J Urol 2007, 177, 444–449. [Google Scholar] [CrossRef]
  36. Frattini, V.; Pagnotta, S.M.; Tala; Fan, J. J.; Russo, M.V.; Lee, S.B.; Garofano, L.; Zhang, J.; Shi, P.; Lewis, G.; et al. A metabolic function of FGFR3-TACC3 gene fusions in cancer. Nature 2018, 553, 222–227. [Google Scholar] [CrossRef]
  37. Murari, A.; Goparaju, N.S.V.; Rhooms, S.K.; Hossain, K.F.B.; Liang, F.G.; Garcia, C.J.; Osei, C.; Liu, T.; Li, H.; Kitsis, R.N.; et al. IDH2-mediated regulation of the biogenesis of the oxidative phosphorylation system. Sci Adv 2022, 8, eabl8716. [Google Scholar] [CrossRef]
  38. Cerami, E.; Gao, J.; Dogrusoz, U.; Gross, B.E.; Sumer, S.O.; Aksoy, B.A.; Jacobsen, A.; Byrne, C.J.; Heuer, M.L.; Larsson, E.; et al. The cBio cancer genomics portal: an open platform for exploring multidimensional cancer genomics data. Cancer discovery 2012, 2, 401–404. [Google Scholar] [CrossRef]
  39. Gao, J.; Aksoy, B.A.; Dogrusoz, U.; Dresdner, G.; Gross, B.; Sumer, S.O.; Sun, Y.; Jacobsen, A.; Sinha, R.; Larsson, E.; et al. Integrative analysis of complex cancer genomics and clinical profiles using the cBioPortal. Science signaling 2013, 6, pl1. [Google Scholar] [CrossRef] [PubMed]
  40. Luca, B.A.; Steen, C.B.; Matusiak, M.; Azizi, A.; Varma, S.; Zhu, C.; Przybyl, J.; Espin-Perez, A.; Diehn, M.; Alizadeh, A.A.; et al. Atlas of clinically distinct cell states and ecosystems across human solid tumors. Cell 2021, 184, 5482–5496. [Google Scholar] [CrossRef] [PubMed]
  41. Abida, W.; Armenia, J.; Gopalan, A.; Brennan, R.; Walsh, M.; Barron, D.; Danila, D.; Rathkopf, D.; Morris, M.; Slovin, S.; et al. Prospective Genomic Profiling of Prostate Cancer Across Disease States Reveals Germline and Somatic Alterations That May Affect Clinical Decision Making. JCO Precis Oncol 2017, 2017. [Google Scholar] [CrossRef] [PubMed]
  42. Armenia, J.; Wankowicz, S.A.M.; Liu, D.; Gao, J.; Kundra, R.; Reznik, E.; Chatila, W.K.; Chakravarty, D.; Han, G.C.; Coleman, I.; et al. The long tail of oncogenic drivers in prostate cancer. Nat Genet 2018, 50, 645–651. [Google Scholar] [CrossRef] [PubMed]
  43. Chakraborty, G.; Nandakumar, S.; Hirani, R.; Nguyen, B.; Stopsack, K.H.; Kreitzer, C.; Rajanala, S.H.; Ghale, R.; Mazzu, Y.Z.; Pillarsetty, N.V.K.; et al. The Impact of PIK3R1 Mutations and Insulin-PI3K-Glycolytic Pathway Regulation in Prostate Cancer. Clin Cancer Res 2022, 28, 3603–3617. [Google Scholar] [CrossRef] [PubMed]
  44. Fraser, M.; Sabelnykova, V.Y.; Yamaguchi, T.N.; Heisler, L.E.; Livingstone, J.; Huang, V.; Shiah, Y.J.; Yousif, F.; Lin, X.; Masella, A.P.; et al. Genomic hallmarks of localized, non-indolent prostate cancer. Nature 2017, 541, 359–364. [Google Scholar] [CrossRef] [PubMed]
  45. Gerhauser, C.; Favero, F.; Risch, T.; Simon, R.; Feuerbach, L.; Assenov, Y.; Heckmann, D.; Sidiropoulos, N.; Waszak, S.M.; Hubschmann, D.; et al. Molecular Evolution of Early-Onset Prostate Cancer Identifies Molecular Risk Markers and Clinical Trajectories. Cancer Cell 2018, 34, 996–1011. [Google Scholar] [CrossRef] [PubMed]
  46. Hoadley, K.A.; Yau, C.; Hinoue, T.; Wolf, D.M.; Lazar, A.J.; Drill, E.; Shen, R.; Taylor, A.M.; Cherniack, A.D.; Thorsson, V.; et al. Cell-of-Origin Patterns Dominate the Molecular Classification of 10,000 Tumors from 33 Types of Cancer. Cell 2018, 173, 291–304. [Google Scholar] [CrossRef] [PubMed]
  47. Nguyen, B.; Mota, J.M.; Nandakumar, S.; Stopsack, K.H.; Weg, E.; Rathkopf, D.; Morris, M.J.; Scher, H.I.; Kantoff, P.W.; Gopalan, A.; et al. Pan-cancer Analysis of CDK12 Alterations Identifies a Subset of Prostate Cancers with Distinct Genomic and Clinical Characteristics. Eur Urol 2020, 78, 671–679. [Google Scholar] [CrossRef] [PubMed]
  48. Stopsack, K.H.; Nandakumar, S.; Arora, K.; Nguyen, B.; Vasselman, S.E.; Nweji, B.; McBride, S.M.; Morris, M.J.; Rathkopf, D.E.; Slovin, S.F.; et al. Differences in Prostate Cancer Genomes by Self-reported Race: Contributions of Genetic Ancestry, Modifiable Cancer Risk Factors, and Clinical Factors. Clin Cancer Res 2022, 28, 318–326. [Google Scholar] [CrossRef]
  49. Stopsack, K.H.; Nandakumar, S.; Wibmer, A.G.; Haywood, S.; Weg, E.S.; Barnett, E.S.; Kim, C.J.; Carbone, E.A.; Vasselman, S.E.; Nguyen, B.; et al. Oncogenic Genomic Alterations, Clinical Phenotypes, and Outcomes in Metastatic Castration-Sensitive Prostate Cancer. Clin Cancer Res 2020, 26, 3230–3238. [Google Scholar] [CrossRef]
  50. Liu, W.; Laitinen, S.; Khan, S.; Vihinen, M.; Kowalski, J.; Yu, G.; Chen, L.; Ewing, C.M.; Eisenberger, M.A.; Carducci, M.A.; et al. Copy number analysis indicates monoclonal origin of lethal metastatic prostate cancer. Nature Medicine 2009, 15, 559–565. [Google Scholar] [CrossRef]
  51. Kumar, A.; Coleman, I.; Morrissey, C.; Zhang, X.; True, L.D.; Gulati, R.; Etzioni, R.; Bolouri, H.; Montgomery, B.; White, T.; et al. Substantial interindividual and limited intraindividual genomic diversity among tumors from men with metastatic prostate cancer. Nat Med 2016, 22, 369–378. [Google Scholar] [CrossRef]
  52. Gundem, G.; Van Loo, P.; Kremeyer, B.; Alexandrov, L.B.; Tubio, J.M.C.; Papaemmanuil, E.; Brewer, D.S.; Kallio, H.M.L.; Högnäs, G.; Annala, M.; et al. The evolutionary history of lethal metastatic prostate cancer. Nature 2015, 520, 353–357. [Google Scholar] [CrossRef]
  53. An, J.; Wang, C.; Deng, Y.; Yu, L.; Huang, H. Destruction of full-length androgen receptor by wild-type SPOP, but not prostate-cancer-associated mutants. Cell Rep 2014, 6, 657–669. [Google Scholar] [CrossRef] [PubMed]
  54. Barbieri, C.E.; Baca, S.C.; Lawrence, M.S.; Demichelis, F.; Blattner, M.; Theurillat, J.P.; White, T.A.; Stojanov, P.; Van Allen, E.; Stransky, N.; et al. Exome sequencing identifies recurrent SPOP, FOXA1 and MED12 mutations in prostate cancer. Nat Genet 2012, 44, 685–689. [Google Scholar] [CrossRef] [PubMed]
  55. Mo, X.; Niu, Q.; Ivanov, A.A.; Tsang, Y.H.; Tang, C.; Shu, C.; Li, Q.; Qian, K.; Wahafu, A.; Doyle, S.P.; et al. Systematic discovery of mutation-directed neo-protein-protein interactions in cancer. Cell 2022, 185, 1974–1985. [Google Scholar] [CrossRef]
  56. Das, R.; Sjostrom, M.; Shrestha, R.; Yogodzinski, C.; Egusa, E.A.; Chesner, L.N.; Chen, W.S.; Chou, J.; Dang, D.K.; Swinderman, J.T.; et al. An integrated functional and clinical genomics approach reveals genes driving aggressive metastatic prostate cancer. Nat Commun 2021, 12, 4601. [Google Scholar] [CrossRef] [PubMed]
  57. Long, M.D.; Jacobi, J.J.; Singh, P.K.; Llimos, G.; Wani, S.A.; Rowsam, A.M.; Rosario, S.R.; Hoogstraat, M.; Linder, S.; Kirk, J.; et al. Reduced NCOR2 expression accelerates androgen deprivation therapy failure in prostate cancer. Cell Rep 2021, 37, 110109. [Google Scholar] [CrossRef]
  58. Li, X.; Oghi, K.A.; Zhang, J.; Krones, A.; Bush, K.T.; Glass, C.K.; Nigam, S.K.; Aggarwal, A.K.; Maas, R.; Rose, D.W.; et al. Eya protein phosphatase activity regulates Six1-Dach-Eya transcriptional effects in mammalian organogenesis. Nature 2003, 426, 247–254. [Google Scholar] [CrossRef]
  59. Kong, D.; Li, A.; Liu, Y.; Cui, Q.; Wang, K.; Zhang, D.; Tang, J.; Du, Y.; Liu, Z.; Wu, G.; et al. SIX1 Activates STAT3 Signaling to Promote the Proliferation of Thyroid Carcinoma via EYA1. Front Oncol 2019, 9, 1450. [Google Scholar] [CrossRef]
  60. Zhao, X.; Lei, Y.; Li, G.; Cheng, Y.; Yang, H.; Xie, L.; Long, H.; Jiang, R. Integrative analysis of cancer driver genes in prostate adenocarcinoma. Mol Med Rep 2019, 19, 2707–2715. [Google Scholar] [CrossRef]
  61. Beuten, J.; Gelfond, J.A.; Martinez-Fierro, M.L.; Weldon, K.S.; Crandall, A.C.; Rojas-Martinez, A.; Thompson, I.M.; Leach, R.J. Association of chromosome 8q variants with prostate cancer risk in Caucasian and Hispanic men. Carcinogenesis 2009, 30, 1372–1379. [Google Scholar] [CrossRef]
  62. Liu, P.; Morrison, C.; Wang, L.; Xiong, D.; Vedell, P.; Cui, P.; Hua, X.; Ding, F.; Lu, Y.; James, M.; et al. Identification of somatic mutations in non-small cell lung carcinomas using whole-exome sequencing. Carcinogenesis 2012, 33, 1270–1276. [Google Scholar] [CrossRef]
  63. Lu, N.; Liu, J.; Xu, M.; Liang, J.; Wang, Y.; Wu, Z.; Xing, Y.; Diao, F. CSMD3 is Associated with Tumor Mutation Burden and Immune Infiltration in Ovarian Cancer Patients. Int J Gen Med 2021, 14, 7647–7657. [Google Scholar] [CrossRef] [PubMed]
  64. Stearns, M.E.; Wang, M.; Hu, Y.; Kim, G.; Garcia, F.U. Expression of a flt-4 (VEGFR3) splicing variant in primary human prostate tumors. VEGF D and flt-4t(Delta773-1081) overexpression is diagnostic for sentinel lymph node metastasis. Lab Invest 2004, 84, 785–795. [Google Scholar] [CrossRef] [PubMed]
  65. Wong, S.Y.; Haack, H.; Crowley, D.; Barry, M.; Bronson, R.T.; Hynes, R.O. Tumor-secreted vascular endothelial growth factor-C is necessary for prostate cancer lymphangiogenesis, but lymphangiogenesis is unnecessary for lymph node metastasis. Cancer Res 2005, 65, 9789–9798. [Google Scholar] [CrossRef] [PubMed]
  66. Xu, S.; Moss, T.J.; Laura Rubin, M.; Ning, J.; Eterovic, K.; Yu, H.; Jia, R.; Fan, X.; Tetzlaff, M.T.; Esmaeli, B. Whole-exome sequencing for ocular adnexal sebaceous carcinoma suggests PCDH15 as a novel mutation associated with metastasis. Mod Pathol 2020, 33, 1256–1263. [Google Scholar] [CrossRef] [PubMed]
  67. Zhen, Y.; Cullen, C.L.; Ricci, R.; Summers, B.S.; Rehman, S.; Ahmed, Z.M.; Foster, A.Y.; Emery, B.; Gasperini, R.; Young, K.M. Protocadherin 15 suppresses oligodendrocyte progenitor cell proliferation and promotes motility through distinct signalling pathways. Commun Biol 2022, 5, 511. [Google Scholar] [CrossRef]
  68. Taksler, G.B.; Keating, N.L.; Cutler, D.M. Explaining racial differences in prostate cancer mortality. Cancer 2012, 118, 4280–4289. [Google Scholar] [CrossRef]
  69. Mahal, B.A.; Aizer, A.A.; Ziehr, D.R.; Hyatt, A.S.; Choueiri, T.K.; Hu, J.C.; Hoffman, K.E.; Sweeney, C.J.; Beard, C.J.; D'Amico, A.V.; et al. Racial Disparities in Prostate Cancer-Specific Mortality in Men With Low-Risk Prostate Cancer. Clin Genitourin Cancer 2014. [Google Scholar] [CrossRef]
Table 1. Sample distribution across 40 prostate cancer patients.
Samples / Patients RNAseq WES Both
Primary Tumor Foci 97 88 80
Metastatic Lymph Nodes (LNM) 19 19 19
Normal Prostate tissue (NP) 10 0 0
Normal Lymph Nodes (LN) 39 37 33
Total Samples 165 137 132
Metastatic Patients 18 15 15
Non-Metastatic Patients 25 20 20
White Patients 23 20 20
African-American Patients 14 13 13
Total Patients 43 35 35
Disclaimer/Publisher’s Note: The statements, opinions and data contained in all publications are solely those of the individual author(s) and contributor(s) and not of MDPI and/or the editor(s). MDPI and/or the editor(s) disclaim responsibility for any injury to people or property resulting from any ideas, methods, instructions or products referred to in the content.
Copyright: This open access article is published under a Creative Commons CC BY 4.0 license, which permit the free download, distribution, and reuse, provided that the author and preprint are cited in any reuse.
Prerpints.org logo

Preprints.org is a free preprint server supported by MDPI in Basel, Switzerland.

Subscribe

© 2024 MDPI (Basel, Switzerland) unless otherwise stated