Preprint
Article

Energy Storage in Power to Heat or Cold Applications – an Analysis of Electrical versus Thermal Energy Storage

Altmetrics

Downloads

204

Views

269

Comments

0

This version is not peer-reviewed

Submitted:

24 October 2023

Posted:

25 October 2023

You are already at the latest version

Alerts
Abstract
The transition of the energy system to renewable sources means the cheap energy storage in fossil fuels must be replaced by other options. A large part of the demand for useful energy is heat and cold, often produced from electric energy by a resistance heater, compression heat pump or cooler. The question is then to store the initial electric energy by electric energy storage (EES) or the useful energy by thermal energy storage (TES). In a desktop study both options were compared, by the choice made in existing applications, and also generally analyzing current technology data. For the latter, cost, round-trip efficiencies, life cycles and life time of EES, specifically for batteries, and of TES, specifically for hot and cold water, ice and other PCM were collected. Applications studied are heating and cooling in buildings and in industry. Application-typical conversion efficiencies were also collected and taken into account. The results show that in many existing installations TES, incl. by PCM, is already preferred, and that TES is advantageous in most investigated applications economically, in addition to technical advantages. Thus, TES has a large potential in the transition of the energy system to stabilize the electricity grid by demand side management.
Keywords: 
Subject: Engineering  -   Energy and Fuel Technology

1. Introduction

1.1. Background – The transition of the energy system, incl. challenges and options

Because of climate change, a reduction of CO2 emissions to zero is needed globally. In the energy system, the use of the fossil fuels coal, oil, and natural gas must be stopped, while at the same time their place must be taken by other options. For example, the IEA [1] sets “Key milestones in the pathway to net zero”: for 2025 “No new sales of fossil fuel boilers”, for 2030 “1020 GW annual solar and wind additions” and “Phase-out of unabated coal in advanced economies”, and for 2035 “Overall net-zero emissions electricity in advanced economies”.
The energy system can be looked at and discussed in different ways: the flow of different types and amounts of energy, or as network of technologies for conversion, storage, and transport of energy that enable the use of energy as desired (Figure 1). Energy input as found in nature, called primary energy, is from nuclear and fossil fuels, as well as renewables like biomass, wind, water, and solar energy. It is used as what is called useful energy, largely for heat and cold, work, and for light etc.
In the energy system today the fossil fuels still play a dominant role as energy source. Options to replace them are an increased use of nuclear energy and of the renewables sun, wind, water, and biomass. Renewable energy from sun and wind is available worldwide, the technologies can be installed fast, at various scale, and do not require safety measures comparable to those required for nuclear energy. There is thus wide agreement [1] that the largest part to replace fossil fuels as energy source must be covered by sun and wind.
Besides having sufficient energy sources, storage and transport of energy is crucial. Energy from sun and wind is variable on a daily, even seasonal scale, and not even in a reliable way if the weather changes. That demand for useful energy does not fit in time to availability is common. In the electricity grid power plants using fossil fuels fill the gap. And fossil fuels are also a way of energy storage [2], even to cover seasonal variations. The phase out of fossil fuels thus does not only mean a loss of cheap energy sources, but also of cheap energy storage and also transport. For the transition, new sources of energy, and also options for storage and transport must be therefore considered.
Chemical energy storage, as in the fossil fuels, allows simple energy storage as well as transport due to high storage density and low energy losses on storage and transport. Storage of electric energy from the renewables as chemical energy requires conversion, e.g. by electrolysis of water to hydrogen H2. Critical are conversion losses, thus it is seen as option where better options are missing, mainly for long distance transport (together with electricity) and long time storage. For short distances and times better options exist. Electrical energy storage (EES) can be done by a variety of storage types. Most relevant today is by conversion to gravitational energy in pumped hydro EES. Large-scale increase of storage capacity however is not possible due to the required geographical conditions. Common, and increasing fast, is the storage of electric energy in batteries. Cost, life time and number of cycles are crucial, and availability of materials is discussed controversially. Due to the cost, economics is only achieved if used for many cycles, so for storage for only few hours to days. Another option for energy storage, suitable for few hours to days, is thermal energy storage. Thermal energy storage (TES), depending on the application called heat or cold storage, is possible by 3 effects: change of the temperature of a material, change of its phase, or change of its composition. Just raising the temperature of a material is the effect most frequently used, even in everyday life. The associated heat is called sensible heat because the temperature change can be sensed easily. If using a phase change, commonly phase change between solid and liquid is used. Materials that are able to store a significant amount of heat by changing phase are called Phase Change Material (PCM). It is common to call them also latent heat storage material, meaning that heat is stored at constant temperature, but the term is also used if some temperature change is involved. TES by hot water, cold water, or including phase change by ice, is successfully used for decades for domestic hot water, space heating and cooling in buildings, or industrial heating and cooling. And commercial use of other PCM has increased in recent years too.
The future energy system will have a large share of electric energy from solar PV and wind power plants, thus the share of electric energy in energy transport will also increase. Due to the central role of electricity this is called “electrification” of the energy system. Matching electricity produced and useful energy demand in time and power gets complicated as in addition to the variation in demand of useful energy by consumers the variation in electricity production grows. How to deal with the demand for electric energy storage and transport is thus a central question in the transition of the energy system.
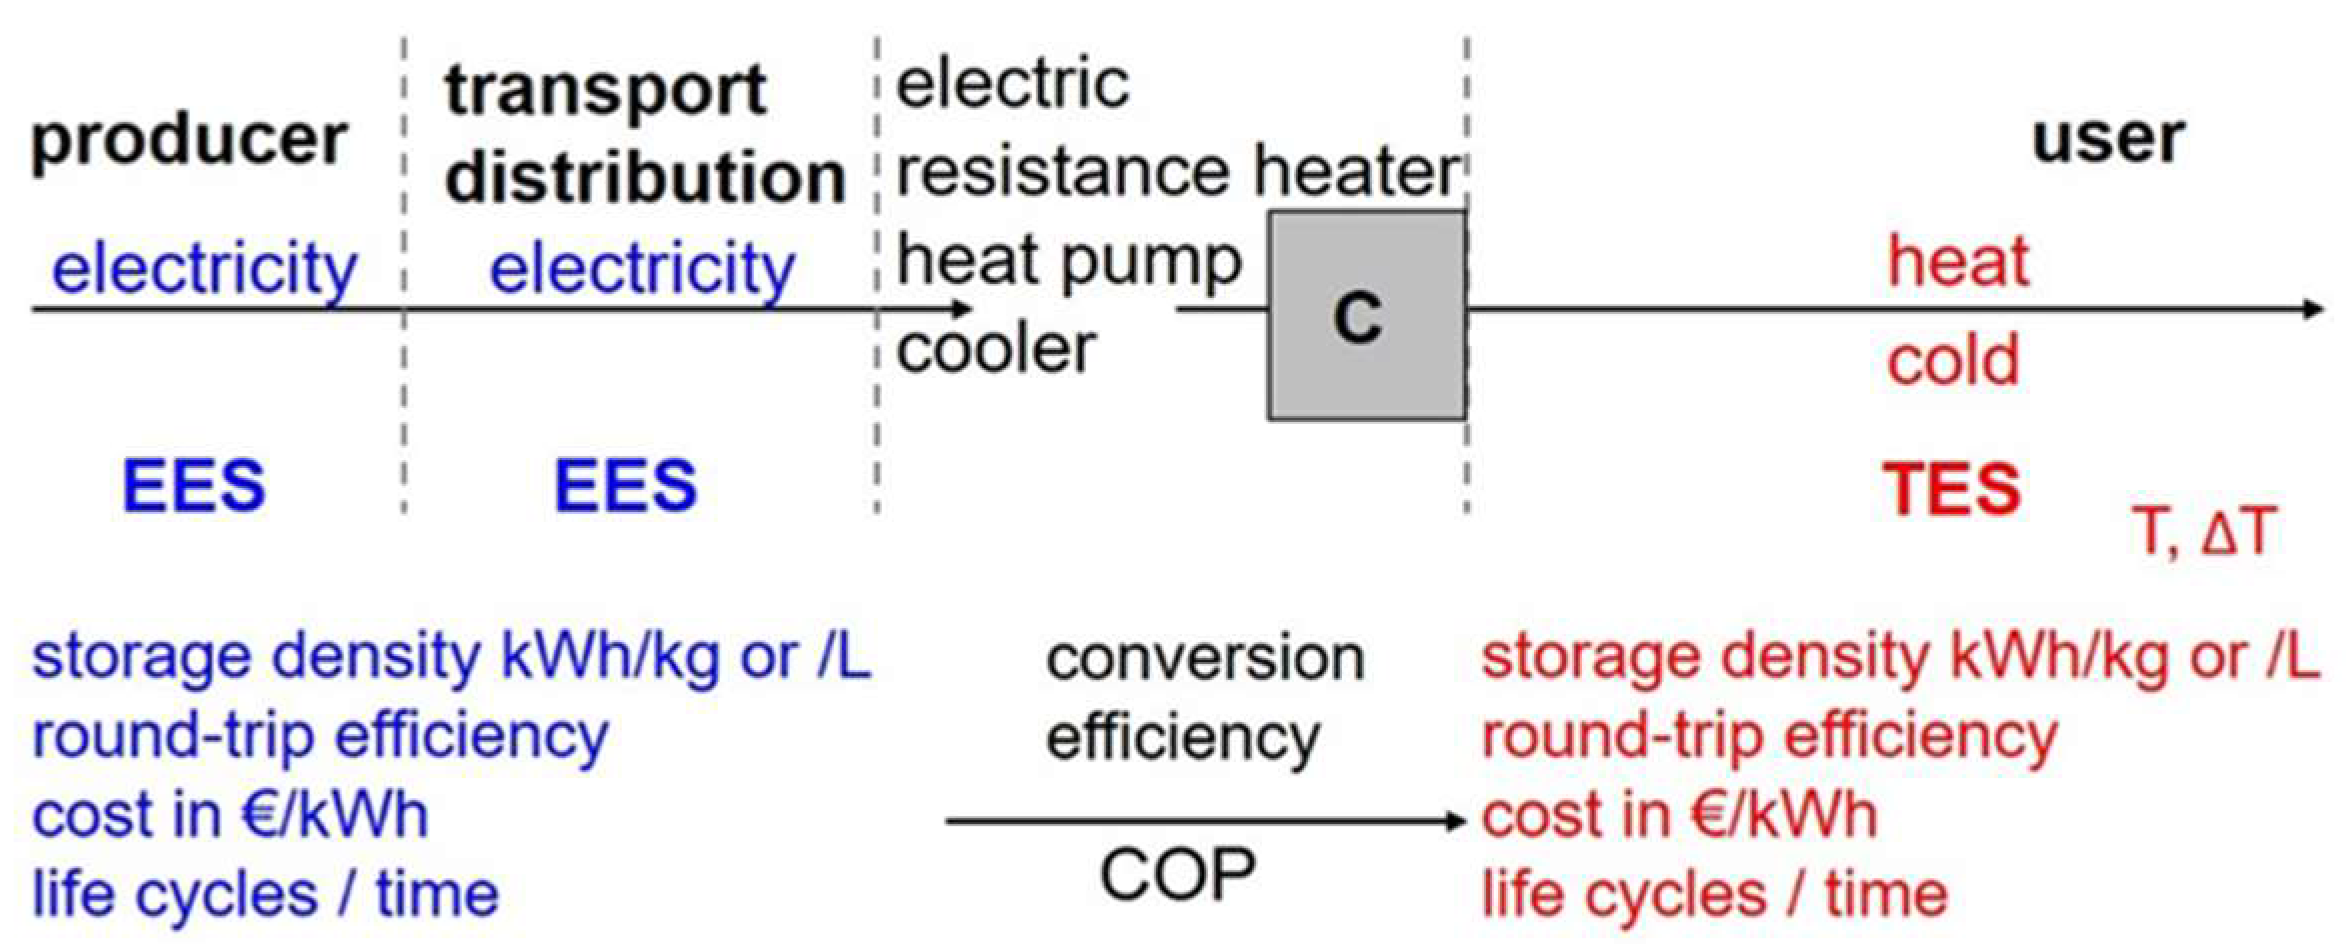
Heat and cold have the biggest share of useful energy (Figure 1). And heat and cold is often produced from electric energy, using an electric resistance heater, an electric driven heat pump or cooler (Figure 2). Therefore, TES offers storage capacity for heat and cold produced, and so a second, promising option compared to storing the electric energy produced using EES. Specifically with regard to fast adaptions of the energy system in the next years, interesting is that TES to store useful heat or cold for consumption is already widely used today. Moreover, heat and cold storages are commercially available for many applications with a wide range of sizes and temperatures, already used for many decades and thus a proven technology, and economic where they are established on the market.
The crucial question is then whether to store the driving electric energy by EES or the useful thermal energy (heat or cold) by TES (Figure 2). Because the transition of the energy system must be done in two to three decades, it is important to study the choice based on already available commercial solutions. Both options are here in a direct competition. However, evaluating the options is more complex as can be observed, and lessons learned, on examples from the past and present where the choice was using TES instead of EES. The large-scale use of cold-water and ice TES with compression coolers in Japan and the US for cooling in industry, in buildings, and even in whole districts, is an example. Often forgotten, because being so common, is domestic hot-water storage heated electrically. Energy cost, including their variations, but also efficiency gains, having a backup, available heating and cooling power, as well as overall grid stability which is important for the grid operators are all crucial considerations and show the complexity of the comparison.

1.2. Previous investigations of the potential of TES

An economic evaluation based on market conditions was done by Rathgeber et al. [3] using the assumption that the maximum acceptable costs of thermal energy supplied by a TES should not exceed the cost of thermal energy otherwise available from the market. Assuming that the TES can be charged with heat free of cost only its own cost are relevant. The maximum acceptable storage capacity costs were then calculated considering the interest rate for the capital cost of a storage, the intended payback period of the user class (industry or building), the cost of energy at the market, and the number of storage cycles. In a further publication [4] the calculations were continued and compared with real cost. For 100 cycles a year the cost of TES should be below 150€/kWh in the building sector, respectively 20€/kWh in industry, for 300 cycles a year 400€/kWh respectively 50€/kWh. For real cost they found that hot-water TES is available (Vaillant) at 17.6€/kWh for 2000 L. For a size of only 500 l at same conditions cost are 84.4€/kWh. For ice TES they found cost of (Cristopia) 20 to 25€/kWh. Hot-water as well as ice TES is according the calculation thus economic in buildings and in industry if the number of cycles per year exceeds 100 cycles.
Regarding the transition of the energy system this analysis has several weaknesses. First is the simple approach that makes idealized assumptions, neglecting the cost for charging the TES, resulting thus only in “maximum acceptable storage capacity costs”. Looking to the future, comparison was at market cost years ago, typically from fossil fuels. However, in the future fossil fuels are phased-out thus their availability decreases and then ceases, and prices rise due to CO2 taxes during the life time of a newly installed TES. And with regard to the change of the energy system, in a holistic view the potential of TES must be evaluated by comparison with other options for energy storage. Last, but not least, the simple economic evaluation misses crucial issues that cause a decision.
Investigations regarding the use of TES or EES, up to now, have focused mostly on specific applications. The use of cold-water TES and ice TES is standard for industrial cooling as well as space cooling in large buildings and even districts. They allow to produce cold at times of low electricity cost, and additionally shifting load in the electricity grid away from peak-load times. It is interesting that in this application EES, despite being an option on the user side, is nowhere considered. This is however done if the electricity grid is small, especially if it only consists of the application, and if electricity is generated from renewables, specifically sun and wind. For example, to store food small solar-driven cold rooms are commercially available. According [5], the standard is to use batteries to store the electricity to run the system at night, but batteries are a major expense and last only 6 to 7 years. PCM entered the market in recent years, system cost are lower, thus PCM is the best option. Besides stationary island systems, mobile applications have also been investigated. For example [6] investigated the problem of air-conditioning of the driver space on trucks during nondriving times, thus when the main engine is off. Different options were compared: an extra engine (auxiliary power unit), a small electric engine with a separate battery for EES, or storing cold in an ice TES charged during driving times. They found that ice TES showed a high-efficiency and was economic, so it became a commercial product. Cooling the space which is used to transport goods in vans and on trucks is nowadays also often done using a PCM TES instead of the common cooling system [7]. Generally, these previous investigations however focused just on specific applications, and the reasons for choosing TES and not EES are often not communicated completely.
Investigations on the choice of TES or EES, not specific to an application, and not only focused on cost, are missing. Such a holistic view is however needed to see the whole potential of TES in the energy system.

1.3. Aims and purposes of the research

Due to the phase-out of the fossil fuels and the increasing production of renewable electricity the demand for energy storage in general, as well as to take load from the electricity grid on peak supply or demand, is increasing and will continue to do in the future. A large share of the used energy is heat and cold, and the cooling demand will increase. Heat is often and with the phase-out of fossil fuels will even be more often produced by electric resistance heating and by electrically driven heat pumps, and cold by electrically driven coolers. The crucial question is then to store the driving electric energy by EES or the useful energy by TES. They are in direct competition. Keeping in mind that significant parts of the transition of the energy system must be done fast, and that heat and cold storage is already today economic, technically proven, and available, the question arises what TES can contribute in this situation. Can TES contribute more than it already does? And if yes, what helps to unfold its potential? The purpose is to answer these questions.
The aim of this research is a holistic study of the choice to store the driving electric energy by EES or to store the useful energy by TES in power to heat or cold applications, based on already available commercial solutions under technical and economic aspects. The integration of the storages in both options is in different locations of the energy grid, and thus cost and benefits are not always at the same stakeholder. Therefore, the situation is more complex than just cost, such that further favorable and unfavorable conditions must be investigated.

2. Materials and Methods

2.1. Methodology

The methodology chosen is a desktop study, which is based on data and other information from open available sources. The comparison of the options of EES versus TES is done in two ways:
  • Analysis of existing application examples (general and individual)
This way of analysis is based on available information of already installed and used applications where the choice to install EES or TES was already made, reasons are known, but often incomplete. It starts with an overview on past experience and the current situation of commercial use, followed by an analysis, including suitable conditions for choosing TES or EES, and also the problem that cost and benefit of TES and EES show up at different points in the energy system. Key results are advantages and disadvantages of TES and EES, reasons why one is used or not used, and also further lessons learnt from specific application examples.
2.
Analysis of applications by current technology data and comparison
This way of analysis is independent of existing applications, just looking at which option should be the best based on technical, cost, and other data. Needed to decide which option should be best are data for EES, TES, as well as the converters. Specifically, for EES and TES needed are values of the storage density and the round-trip efficiency, up-to-date cost (here only investment cost as main part), and life cycles and life time. The conversion efficiency, COP, is needed for comparison of EES and TES because e.g. for a COP = 3 the storage capacity of TES has to be 3 times that of EES. The life cycles and time give information for how long an investment in storage capacity will last. The round-trip efficiency describes economic losses by the value of the energy lost.
Despite that it is possible to learn a lot from existing application examples, for them the choice of EES or TES was already done, at economic and other conditions of the past. They already changed, and will change even more during the phase out of fossil fuels. The second way, to analyze EES and TES by direct comparison, is at the same time and thus same conditions, such that the individual development of conditions is not relevant as long as both are affected equally (e.g. inflation rate or energy prices). For both ways of analysis, section “3. Results” covers the data and other information collected, while section “4. Discussion" covers their discussion.

2.2. Scope

2.2.1. Applications considered

The selection of applications to be considered follows two criteria. First, applications must have a demand for heat or cold large enough for an impact, and supplied by electrical energy using for conversion a resistance heater, or a compression heat pump or cooler. For a direct comparison of EES versus TES other possible options should not be relevant. Thus, to avoid competition with chemical energy storage (renewable H2 etc.) the focus is on short term storage, thus applications with 100, better 200 or 300 storage cycles per year.
According these criteria, the applications considered here are space heating and cooling in buildings, heating and cooling in industrial processes (can require higher discharge power), and domestic hot water (requiring very large discharge power)

2.2.2. Energy storage technologies considered

For a technology to have significant impact on the energy system in the next decade requires a significant share of installations in that time. ES technologies considered thus must already be commercially available, and should also already be a proven technology. Better is if they are already a proven technology in the considered field of application. Upscaling should also not be limited by other issues, for example availability of materials. As discussed above, to analyze EES and TES by direct comparison, excluding chemical energy storage, ES technologies considered must be able to perform a storage cycle in a few hours to days to be useful for 100, better 200 or 300 storage cycles per year.
For EES, considered are therefore batteries, specifically Li-ion and lead-acid batteries. Not considered is pumped hydro due to limits in upscaling, and power to gas because of conversion losses etc.
For TES, considered is hot- and cold-water TES, ice TES, and TES using other PCM. TES using other PCM than water became commercial in recent years [7] for space heating or domestic hot water. Not considered is sorption heat storage as it is not commercially available, and the same holds for other technologies of thermochemical ES.
For both ways of analysis described in 2.1 Methodology, covering the considered applications and ES technologies described in 2.2 Scope, section 3. Results collects data and other information. These are then discussed afterwards in section 4. Discussion.

3. Results

3.1. Analysis of existing application examples (general and individual)

This first analysis of EES versus TES is by available information on already installed and used commercial applications. The choice to install EES or TES was already made, reasons are often known, but rarely in detail. Data and information to be collected within the scope of applications and technologies considered are the application, the technology chosen, suitable conditions (economic, technical, and also legal), reasons for the choice, past experience, and lessons learned. The following examples were collected.
The most common example, often not even noticed anymore and therefore forgotten, is domestic hot water storage. Already tapping hot water (cp = 4 kJ/(l∙°C)) at 1 l/min with a temperature lift of 30 K, e.g. by heating water at 15°C to be used at 45°C, corresponds to a heating power of 2 kW (1 l/min ∙ 4 kJ/(l∙K) ∙ 30K = 120 kJ/min = 120/60 kJ/s = 2kW). Heated electrically by an electric resistance heater the required 2 kW of electric power is already in the range of the maximum possible in common household electrical installations. Therefore, with few exceptions, if domestic hot water is heated electrically it is done well before it is required, the hot water is then stored, and upon demand it is simply taken from the storage. Storages for domestic hot water with electric resistance heating range in size from small ones with few liters to large ones beyond hundred liters. The advantage of using TES, here hot-water TES, is to match the heating power need, which is without hot-water TES technically not practicable. Often domestic hot water and space heating are done together, and even if heat is supplied by a solar thermal collector or a heat pump an electric resistance heater as backup is often installed.
Another example from space heating is heating stones for heat storage. Nuclear power plants produce electricity at a more or less constant rate and are thus used for base load. In the past, in Germany more electricity was produced from nuclear power plants than needed at low load at night. Thus, to sell the excess electricity at night the price of electricity at night was reduced significantly. This made use of electricity for space heating economically interesting. Electricity at night, at low price, can be converted by a resistance heater to heat and then stored as sensible heat, for example by heating stones. In Germany this has been used for many decades. While in the previous case the investment cost of the hot water storage and the benefit of having hot water even at many liters per minute is on the same side, the user, here it is initially different. Here the producer has a problem: production of excess electricity with no corresponding demand. By reducing the cost of excess electricity at night it gets interesting for the user who needs heat, at any time. If the electricity cost is low enough the savings here can convince the user to spend the investment cost for installing a TES. Then, both sides have cost and benefit: the user benefits from low electricity prices but has investment cost, while the producer has “cost” of selling at low price and benefits of selling at all.
Nuclear power plants are used in many countries, including some with a large cooling demand. In Japan, producers also decided to reduce the cost of electricity at night significantly. At the same time, besides cooling of industrial processes also space cooling including dehumidification is needed. As cold is often produced from electricity by electric compression coolers it became widespread to add some kind of cold storage to be able to produce cold at night using electricity at low cost, to use the cold then in daytime. For this, cold-water TES as well as ice TES is used. According the Heat Pump & Thermal Storage Technology center of Japan (HPTCJ) [8], in 2020 more than 30,000 thermal storages shifted more than 2 GW. This is equivalent to the output of two average nuclear power plants.
The use of a cold-water TES or an ice TES connected to an electric compression cooler for space cooling, air-conditioning, and industrial cooling, is also widespread in the USA. However, the initial problem is quite different. The problem is not to have excess electricity from nuclear power plants at night. Like in Japan, the daily demand variation is large, specifically for cooling, but in addition the electricity grid is often not able to transport enough electricity for peak demand. Blackouts can be the result. Blackouts are a significant problem for the user, thus having a cold storage as backup for cooling is an advantage. Also, problems with the electricity grid bring, besides users and producers, those who run and are responsible for the electricity grid into play. They need to be considered separately as they are not always identical to producers (e.g. in Germany). And in recent years, with the increasing share of renewable solar and wind electricity, their variability forces producers of electricity to think even more about energy storge. It is thus not surprising that the variety of approaches has increased. BAC [9] mentions attractive load shift incentives and rebates offered by utilities, which can reduce the initial investment cost of an ice TES significantly. According the article, amounts can range from $500/ton shifted in Florida to $2600/kW shifted in New York City (1 ton of refrigeration is the cooling power from melting of 1 short ton, meaning 2,000 lb = 907 kg, of ice at 0 °C in 24 hours; 1 ton = 3.51 kW). According an article [10], the company Ice Energy just completed (at the time of writing in 2019) the first phase of a project to deploy over 1200 ice-making and cooling machines at businesses and industrial facilities across the territory of the utility Southern California Edison (SCE). In this case the underlying business model is a partnership with the utility. According the article, Ice Energy supplies and installs its units at businesses and industrial facilities free of charge to their owners. To pay for the units, Ice Energy has a contract with SCE to manage peak demand and load shifting, allowing SCE to operate the units as is best suited for the overall system. According Ice Energy, when complete this will be the largest distributed TES system in the nation. The article further on includes three more crucial issues. First, there seems to be a legal requirement to utilities to create market structures which allow energy storage to participate. Second, Ice Energy estimates that its units come at half the life-cycle cost of lithium-ion batteries, significantly caused by the expected 20-year life for its products, which is longer than most lithium-ion batteries. And third, important for the long-term business, there are no barriers to upscaling from rare materials (like rare earth materials) or other hard-to-find components. Another PCM-TES technology specifically for cold storage facilities, for example for food storage, was developed by Viking Cold Solutions. According an article [11], the technology was evaluated in a study by the environmental consulting firm D+R international on behalf of the utility Southern California Edison, and was recommended to improve energy efficiency and demand response in cold storage facilities.
Besides these rather general application examples there are also many individual application examples where TES is used instead of EES. For example, [12] lists a 1270 m³ hot water storage used for a local heating grid in Germany, and with electricity from wind turbines as heat source. [13] describes a 33,000 m³ hot-water storage with a capacity of about 1500 MWh installed at a cogeneration power plant in Nürnberg, Germany. While its main use is decoupling the produced electricity and heat, which is used in the district heating network, it also has two resistance heaters of 20 MW each to use excess electricity from sun and wind. Two more interesting examples can be found in [14]. The first is from Canada and deals with the use of electricity from wind to be used by installing TES for domestic space heating. Summerside is a town on Prince Edward Island. Its utility, municipally owned, operates 21 MW of local wind capacity that supplies roughly half of the town’s electricity demand. In the past, at times of low demand excess electricity had to be sold to the grid at low price, while at the same time almost 80% of the town’s heat demand was met by expensive oil space heating. In 2013 the town implemented a municipal program to encourage residents to replace oil-based heating with electric TES using ceramic bricks or time-of-use electric water heaters at discounted rates. Customers could buy the TES, rent it, or engage in a 5, 7, or 10 year lease-to-own scheme. As a result of the program, 24% of the excess wind electricity that was previously sold to the grid at low price was then used in the community, increasing the municipality owned utility income, and at the same time saving consumers on average CAD 1300 per year per household in the case of the ceramic brick TES and CAD 200 for the time-of-use electric water heaters. In addition, also 400 t of CO2 were avoided. The provincial government stated 2017 that it wants to follow the example for the whole province. While the first example from [14] used “old” technology, the second uses a “new” one, “new” with regard to market penetration, however with already about a decade of real experience. The TES technology uses PCM other than ice for heating purposes. According the article, the PCM used changes phase at 58°C, has four times the energy density of a hot water TES, and can undergo 41,000 storage cycles without degradation. It is claimed to be 60 to 90% cheaper than the cheapest Li-ion alternative per unit of energy stored. The technology can be used together with rooftop PV, grid electricity, or a heat pump. It has been tested in several trials. The first, in 2013, showed household heating running costs 50% lower compared to a gas-powered boiler. To decarbonize domestic heating the UK government announced 2019 a USD 2 million award to fund a trial for the developer of the technology, Sunamp, to work with an energy supplier to allow customers to heat their homes with low-cost renewable electricity during off-peak times, enabled through the use of the supplier’s energy management platform. The trial aims to demonstrate the feasibility on the mass market, crucial with regard to the announcement of the UK government that it would ban gas heating in new houses by 2025.
In the previous general and individual application examples information collected was mainly with focus on the overall energy system. However, advantages or disadvantages in the individual installation are also common. BAC [15] and [9] list some benefits of ice TES, among them are savings of energy (operating a chiller at lower ambient temperatures at night increases the efficiency, and the same holds for operating a chiller at optimum load), lower first cost (operating a chiller continuously at optimum load can allow reduction of the chiller size), lower electricity cost (use of off-peak electricity prices as well as rebates and incentives for load shifting), and reduced environmental impact (by general energy savings or lower refrigerant charge). While some of them were already discussed before, there are additional ones with regard to the chiller, improving its efficiency, lower first cost, and besides reduced environmental impact. These are on the user side, affect the user’s decision to install ice TES or not, and are not related to the overall energy system. Most of these benefits of ice TES also apply to the use of cold-water TES, and actually could also apply to TES connected to heat pumps, except the increase of efficiency by operating at night. Operation of a heat pump at night at lower ambient temperatures would decrease its efficiency, thus for heat pumps increase of efficiency is by operation in daytime, e.g. with solar electricity. For electric resistance heating the efficiency is 100%, so efficiency related advantages do not exist. Besides that, reduction of the size of the converter, therefore reduction of investment cost, shifting of the operating hours of the converter to times of off-peak electricity cost, all are the same.
Finally, the question to choose EES or TES also shows up in applications without a connection to the greater electricity grid. Among these is the use of cold TES in small solar cold rooms or fast milk cooling using solar PV, the use of cold TES for cooling of the cold storage compartment on trucks, vans, even containers, and also for truck cabin cooling (see discussion in section 1.2, [7,16]). If TES is integrated into a product, the specific advantages of TES versus EES are often not published. Nevertheless, those applications still show that TES was the preferred choice compared to the option of using EES.

3.2. Analysis of current technology data and comparison

3.2.1. Background

This second analysis of EES versus TES is by comparing available information on current technology data. An overview on the type of data to be collected gives Figure 3.
Regarding energy storage technologies, for EES considered are batteries, specifically Li-ion and lead-acid batteries, and for TES considered is hot- and cold-water TES, ice TES, and TES using other PCM (section 2.2). For EES and TES needed are data of the storage density and the round-trip efficiency, up-to-date cost (investment cost as main part), and the life cycles and life time. For TES also the temperature T and its swing ∆T are required; they are affected by the considered application, determine the options of TES to choose, and ∆T affects also the storage density. Besides the technologies for EES and TES also the technologies for conversion, C, between electricity and heat or cold (Figure 3) have to be considered, being electric resistance heater, and electrically driven heat pump and cooler, because the conversion efficiency, COP, determines the corresponding storage capacity of EES and TES to be compared (section 2.1). The COP is for electrically driven heat pump and cooler again affected by the application temperatures.
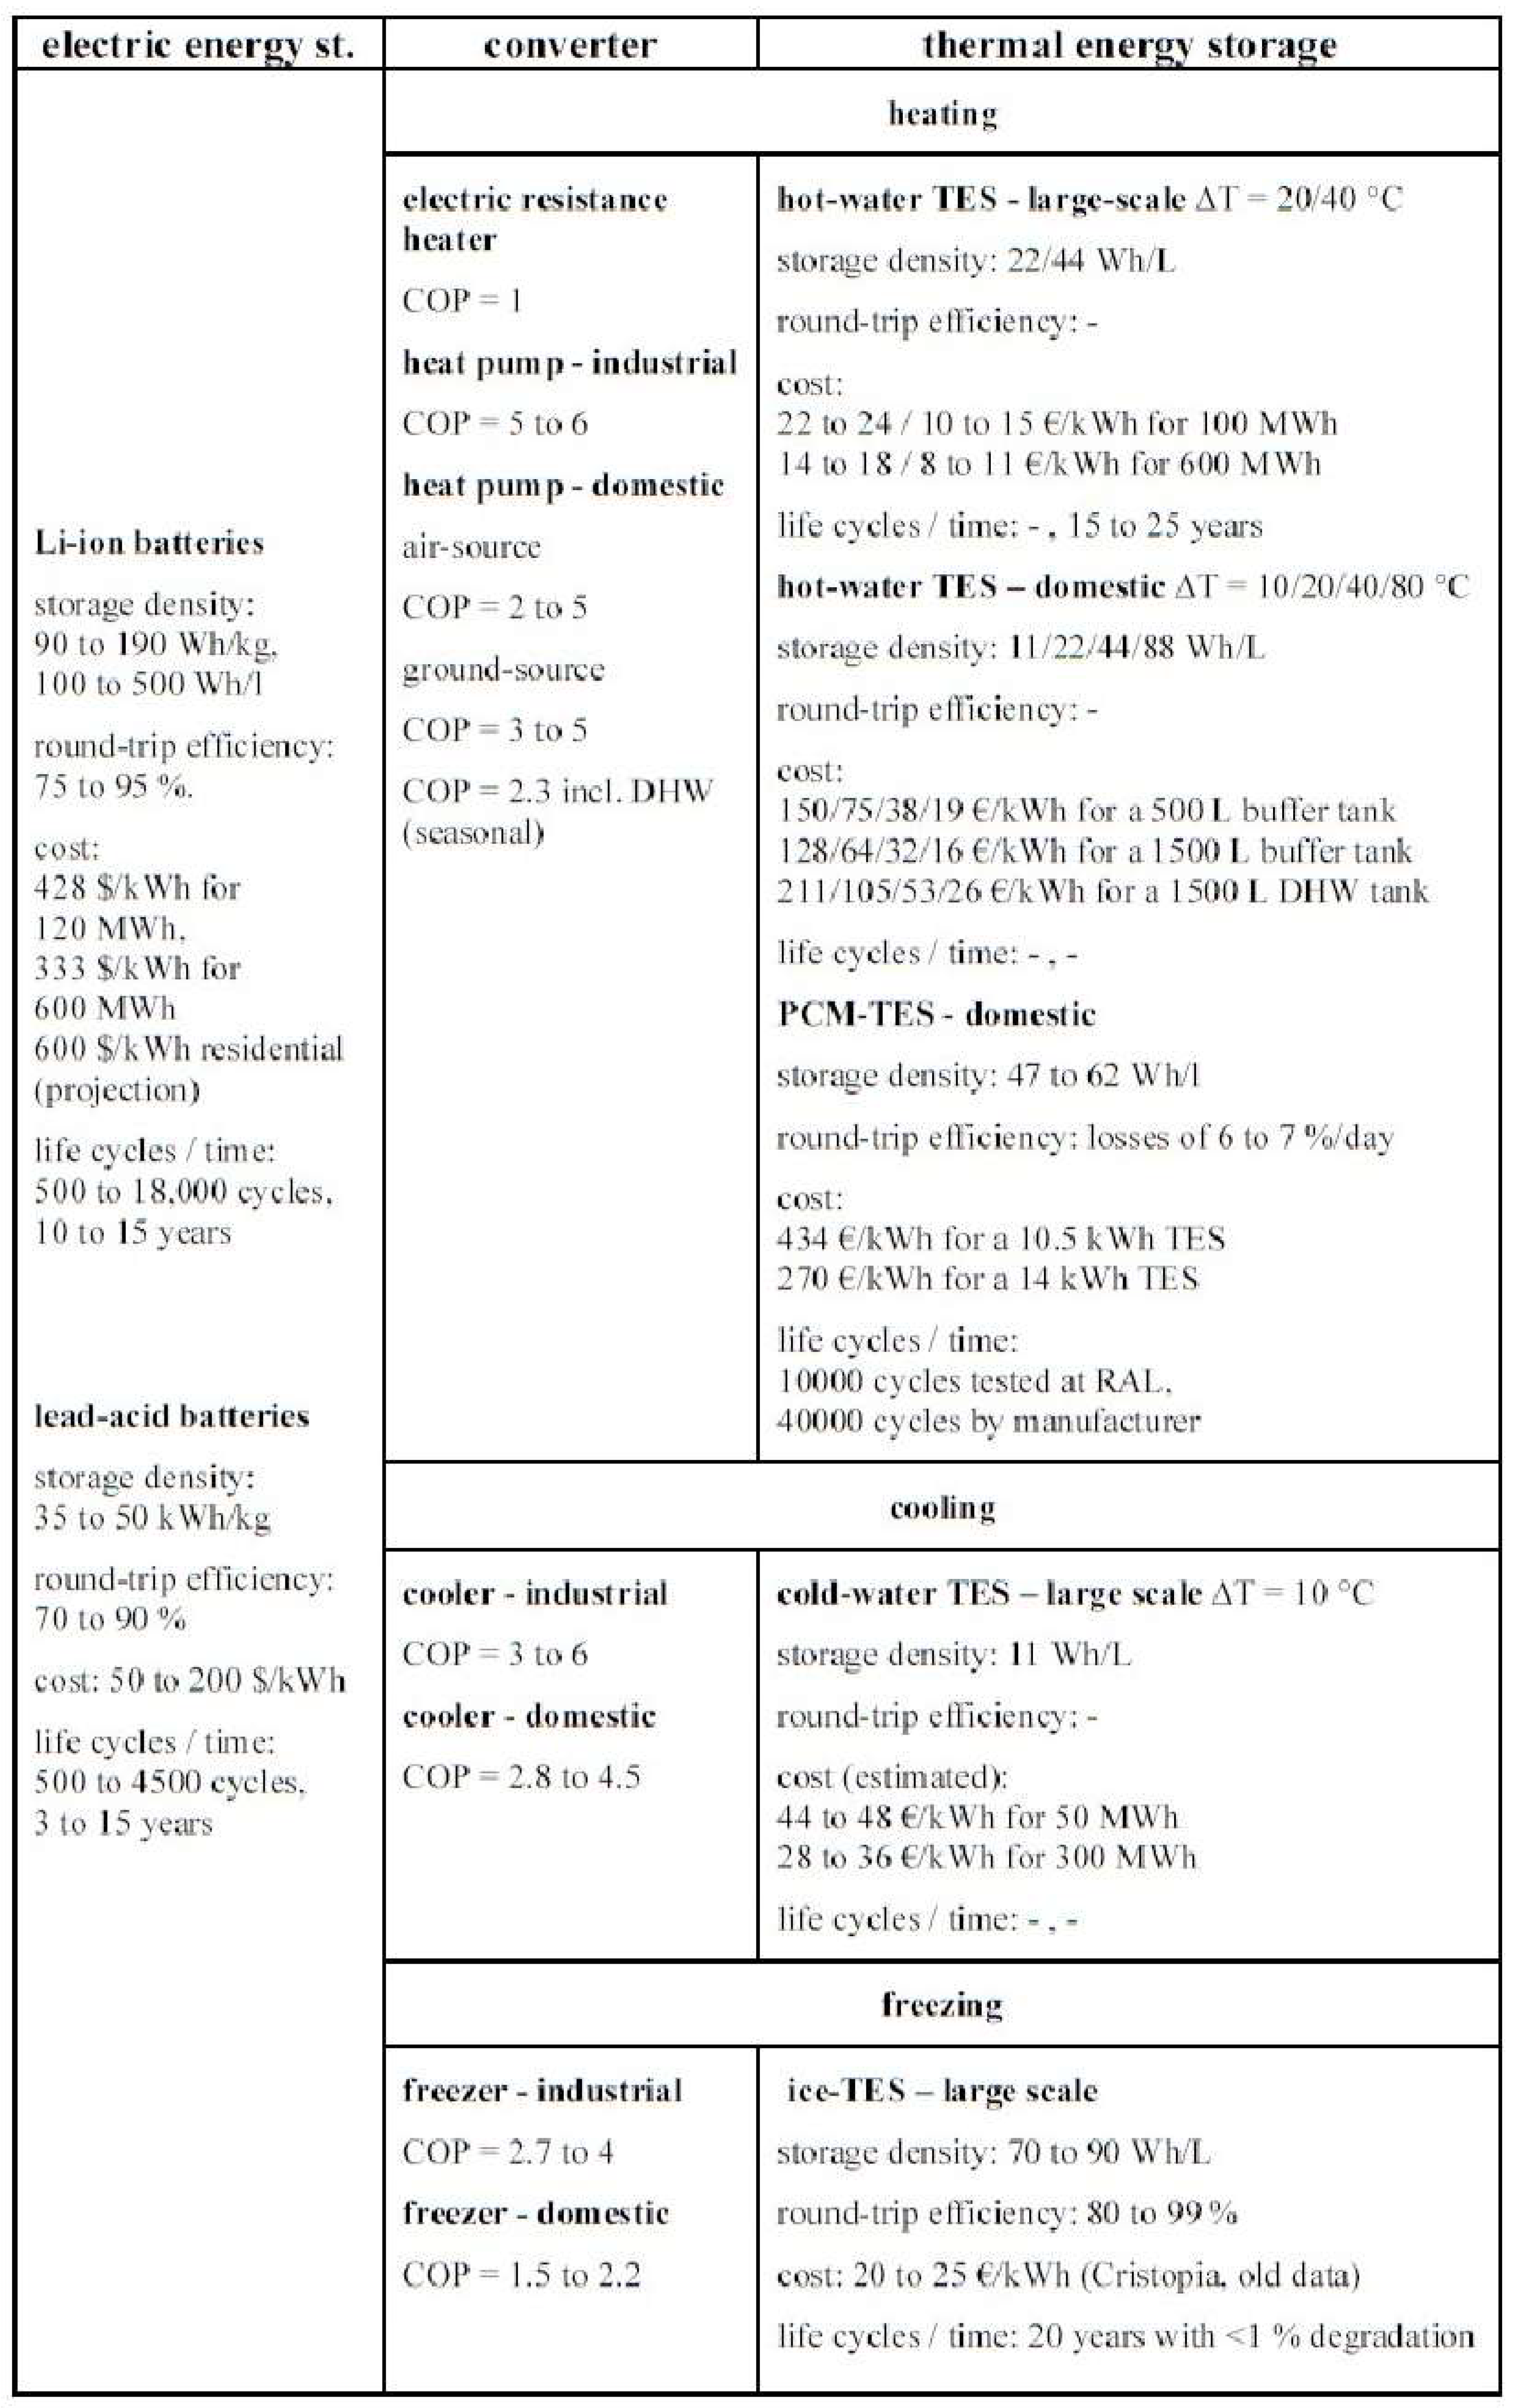
An overview of the value ranges for the technology data collected gives Figure 4, while the collected data in detail are described in the following sections. In Figure 4, values for TES and corresponding converters are grouped with respect to application for heating, cooling, and freezing as the application conditions affect the technology choice and data. The values from the overview in Figure 4 are then used for the discussion in section 4.2. The collection of the technology data in detail in the following sections starts with those for EES (Li-ion and lead-acid batteries), then TES (hot water and PCM, cold water, ice), and at the end for converters (electric resistance heater and heat pump, cooler, and freezer for below 0°C). Each includes a justification of the value range given then in Figure 4.

3.2.2. EES data

For Li-ion batteries the following data were collected. Values found for the storage density are 150 to 180 Wh/kg and 300 to 350 Wh/l [17], 151 Wh/kg (average, [18]), 100 to 500kWh/m3 [19], and 90 to 190Wh/kg [20]. Values found for the round-trip efficiency are 90% [17], 87% (average) [18], 75 to 95% [19], 80 to 95% [20], and 83 to 87% [21]. Values found for the cost are 1150€/kWh for homes and 800€/kWh for large systems [22], a projection for 2020 to be 600$/kWh residential and 300$/kWh utility [19], a projection to 137$/kWh in 2020 [23], a prediction to fall below 100$/kWh within 3 years (then 2023) [24], and for large systems (60MWDC) system cost of 428$/kWh for a 120MWh system, 349$/kWh for a 360MWh system, and 333$/kWh for a 600MWh system with cost expected to drop to about 150$/kWh by 2030 [21]. Finally, values found for life cycles and time are 2500 and 1000 to 5000 cycles and 15 and 10 to 15 years [17], 1000 to 6000 cycles [19], and 500 to 18000 cycles and 15 years [20]. Summarizing, shown in the overview in Figure 4, literature values of the storage density are in a range of 90 to 190 Wh/kg and 100 to 500 Wh/l, and the values of the round-trip efficiency are in the range of 75 to 95%. The cost has dropped in recent years. The most up-to-date and reliable cost seem to be those of [21], ranging from 428$/kWh for a 120MWh system to 333$/kWh for a 600MWh system. For smaller, residential systems the projection of 600$/kWh by [19] is chosen here. Values for life cycles range from 500 to 18,000 cycles, and those for life time from 10 to 15 years.
For lead acid batteries the following data were collected. Values found for the storage density are 35 to 40 Wh/kg and 80 to 90 Wh/l [17], 30.58 Wh/kg (average) [18], and 30 to 50Wh/kg [20]. Values found for the round-trip efficiency are 85% [17], 76% (average) [18], and 70 to 90% [20]. The values for cost are 400 to 600 $/kWh [17] and 50 to 200$/kWh [20]. Values found for life cycles and time are 2000 cycles as well as 1500 to 5000 cycles and 15 years [17], and 500 to 4500 cycles and 3 to 15 years [20]. Summarizing (Figure 4), literature values of the storage density are in the range of 35 to 50 kWh/kg, the round-trip efficiency in the range from 70 to 90%, and cost are in the range from 50 to 200 $/kWh. Values for life cycles range from 500 to 4500 cycles and for life time from 3 to 15 years.

3.2.3. TES data

Data for hot-water TES at large-scale were found in [25], who collected data for pressureless tanks (maximum temperature 95°C) for sizes of up to several 10,000m3, based on project experience, and said that the largest part of the cost are the capital cost. They plotted the specific cost for 3 different constructions and two temperature swings ΔT=20/40°C for a minimum temperature of 50°C (“/”signifies different temperature swings and is used in the following accordingly for the corresponding data of the storage density and cost). Since all use water (cp = 4kJ/(l∙°C) = 1.1Wh/(l∙°C)) the storage density is the same for all: 22/44 Wh/l. From the 3-D plots in [25] values of the specific cost can then be estimated. The following pairs give the specific cost for ΔT=20/40°C for three different constructions and two TES sizes. For a storage capacity of 100 MWh the three constructions have for the temperature swings ΔT=20/40°C cost of about 22/15 €/kWh, 15/10 €/kWh, and 24/...€/kWh. For a 600 MWh TES size the cost are about 18/10 €/kWh, 14/8 €/kWh, and 16/11 €/kWh. The cost pairs for the different temperature swings ΔT in this case do not directly scale by a factor of 2 because in each pair the storage capacity is fixed thus the tank size varies. Overall, the cost show a clear effect of the construction type at a given storage capacity, and naturally of the storage capacity at given temperature swing and construction type. For the round-trip efficiency no value was found, but losses can be considered small because the considered tanks have a large volume to surface ratio and because the cycle times here are considered to be no more than a few days. Regarding life cycles and time, for industrial hot water tanks made of fiberglass and polyethylene 20 to 25 years and for glass-lined steel tanks 15 to 20 years were found in the available literature [26]. Summarizing (Figure 4), the values of the storage density are 22/44 Wh/l for ΔT=20/40°C, and corresponding cost are in the range of 22 to 24 / 10 to 15 €/kWh for 100 MWh capacity, respectively in the range of 14 to 18 / 8 to11 €/kWh for 600 MWh capacity. Regarding the round-trip efficiency no value was found, and for the life time 15 to 25 years.
Hot-water storage is also used in small-scale applications, like heating in domestic buildings, and the same is also done using PCM. Heating in buildings can comprise space heating as well as domestic hot water (DHW). While DHW generally requires storage temperatures above 60°C due to drinking water safety requirements, space heating can also be done at lower temperatures with low temperature heating installations. Therefore, a larger variety of temperature swings ΔT=10/20/40/80°C is considered. ΔT=80°C should be about the limit if water at 15°C enters for domestic hot water and the maximum tank temperature is 95°C.
Data for hot-water TES for domestic use must be split up into those for heating only, called simple buffer tanks, and those also for domestic hot water which have extra equipment raising the cost. The following values for 500 l and 1500 l tanks for heating, and in addition 1500 l also for DHW, are based on data taken from a commercial distributor [27]. The storage density is for temperature swings of ΔT=10/20/40/80°C for all the same 11/22/44/88 Wh/l, because as all use water (cp = 4kJ/(l∙°C) = 1.1Wh/(l∙°C)). The respective specific costs for the 4 temperature swings are for the 500 l buffer tank 150/75/38/19 €/kWh, and for the 1500 l buffer tank 128/64/32/16 €/kWh. For the 1500 l which is also for domestic hot water the values are 211/105/53/26 €/kWh. The values show the expected decrease with size, decrease with increasing temperature swing, and of course that more complex tanks like for DHW cost more. No values were found for the round-trip efficiency, and also no values for the life cycles and life time. Summarizing (Figure 4), the values of the storage density are 11/22/44/88 Wh/l for ΔT=10/20/40/80°C, the corresponding cost are for the 500 l buffer tank 150/75/38/19 €/kWh and for the 1500 l buffer tank 128/64/32/16 €/kWh, being for heating applications only. For the 1500 l tank which is also for domestic hot water the values are 211/105/53/26 €/kWh.
For PCM-TES for domestic heating applications the following data were collected for Sunamp models. For the UniQ HW 9 (10.5 kWh) a storage density of 56Wh/l, losses of 7%/day, cost of 313€/kWh, and 10,000 cycles tested by RAL and 40,000 tested by Sunamp. For the somewhat larger UniQ HW 12 (14 kWh) a storage density of 62Wh/l, losses of 6%/day, cost of 270€/kWh, and again 10,000 cycles tested by RAL and 40,000 by Sunamp. Technical data were taken from [28] and [29], unit cost from [30], storage density, losses, and specific cost then calculated. For the Thermio 150HP (10.5 kWh) a storage density of 47Wh/l, losses of 7%/day, cost of 434€/kWh, and again 10,000 cycles tested by RAL and 40,000 by Sunamp were found. For the Thermio 300HP (14 kWh) a storage density of 62Wh/l, losses of 6%/day, cost of 270€/kWh, and again 10,000 cycles tested by RAL and 40,000 tested by Sunamp. For the last two models the technical data were taken from [29]. Summarizing (Figure 4), the storage density is 47 to 62 Wh/l, losses are 6 to 7%/day, the costs range from 434€/kWh for a 10.5kWh TES to 270€/kWh for the larger 14kWh TES. Values for life cycles are 10,000 tested at RAL and 40,000 by the manufacturer.
Data for cold-water TES for cooling in large scale applications, like large buildings, even districts, or industrial processes, are hard to get. The reason is probably the same as for other large TES, that installations are designed for each case and cost and other data are then not made public. This was the experience already with hot-water TES, and holds also for ice-TES discussed next. Nevertheless, based on the values for hot-water TES for heating in large scale applications it is possible to make estimates. The operation of cold-water TES, to use for cooling but without freezing the water, is between some 5°C and 15°C, thus with a temperature swing of ΔT=10°C. As already calculated above, for hot-water TES the corresponding storage density is 11 Wh/l. Hot-water TES are operated at higher temperatures, so there can be a difference in the insulation, thus different tank cost. However, it is still possible to use their cost to estimate cost values here, just assuming a hot-water TES is used as cold-water TES. Then, using values of hot-water TES at ΔT=20°C, for the cold-water TES at ΔT=10°C the total storage capacity is only half, e.g. 100 MWh capacity becomes 50 MWh capacity, while the specific cost double as the tank cost remain the same. The costs are then estimated to be in the range of 44 to 48 €/kWh for 50 MWh, respectively 28 to 36 €/kWh for 300 MWh capacity.
For ice-TES for cooling applications, the following data were collected. While the theoretical storage density is 90Wh/l, a lower value of 70Wh/l was found in literature [31], probably taking into account heat exchangers etc. For the round-trip efficiency, values of >85% [31] and 80 to 99% [32] were found. For the specific cost no recent value was found. Therefore, the only available value is (Cristopia) 20 to 25€/kWh from a publication several years old [4]. It is therefore necessary to take into account some increase of this value due to inflation in about a decade. For the lifetime, 20 years with <1% degradation was found [31], as well as 20 years again [10]. Regarding ice-TES sizes, [9] states "Thousands of Installations Worldwide Ranging from 90 – 125,000 Ton-Hours", which are by conversion (1 ton hour = 3.5 kWh) have a size of some 300kWh and 400MWh, thus ranging from about 3m3 to 4000m3 if simply using 100kWh/m3. Examples are installations in the Taipei 101 building [9] with 128MWh capacity, and the district cooling plant in Chicago, with the 125,000 Ton-Hours capacity [33].

3.2.4. Converter data

The conversion efficiency from electrical to thermal energy, meaning heat and cold, is the COP. It determines the storage capacity of EES and TES that have to be compared. Similar as for TES, the COP values depend on the conditions in the applications for heating and cooling and are thus grouped together with them in the overview in Figure 4.
For an electric resistance heater, conversion of electric to thermal energy for heating is by 100%, thus the ratio, called COP, is 1.
For an electrically driven compression heat pump or cooler the ratio is often > 100%, by taking heat from the ambient in a heat pump, or discarding to the ambient in a cooler. Their performance is characterized by the ratio of the heat/cold supplied to the work required, Q/W, or the heating/cooling power and mechanical power. The maximum value, which can be calculated by the Carnot efficiency, depends strongly on the temperature of the ambient as well as the temperature of the space which has to be heated or cooled. The value in a real application is thus strongly dependent on the operating conditions, especially absolute temperature and relative temperatures given by the application, like space heating or cooling, domestic hot water, heating or cooling in industrial processes, and further on the ambient, being air, ground, water reservoirs (a lake or a river), which are affected by the climate and season. Besides these two application typical conditions, the value also depends on several other things. One is what it refers to: only the mechanical heating/cooling machine, or including the electric motor to drive it, or also including pipes and heat exchangers with extra temperature difference. For electrically driven heating/cooling machines the value possibly also includes electricity used for any controls etc. Further on, the value also depends on the technology, the size, and the design of the heating/cooling machine, being the least, average, or the most efficient one. Therefore, values found in literature differ greatly even for the same application. Different names are also used for the ratio. In some scientific/technical areas the ratio is generally called Coefficient Of Performance, COP, while others use separate terms for heating and cooling: COP for heating applications and Energy Efficiency Ratio, EER, for cooling applications. Also, as conditions change with season, seasonal values are marked as SCOP and SEER. The references found usually do not give details on the conditions and what a value refers to. Only some give temperatures, some if a value is for good equipment or best etc., such that a comparison and direct discussion is not possible. Therefore, here only ranges of the values found are given. The crucial ranges are then included in the overview in Figure 4.
For domestic heat pumps for space heating without preparation of domestic hot water values ranging for air source heat pumps from about 2 (low temperature space heating at cold ambient conditions or mild ambient conditions but high temperature space heating) to about 5 (low temperature space heating at mild ambient conditions) were found, and for ground source heat pumps between 3 and 5 [34, 35]. If also for domestic hot water, requiring higher temperatures for hot water storge, COP values are lower. An investigation of large air-to-water heat pumps for fuel-boiler substitution in multi-family buildings [36] resulted in COP's for space heating and domestic hot water being seasonally only 2.3. For industrial process heating COP values found range from about 5 to 6 for temperature lifts of 30 to 40 K [37].
For domestic space cooling with or without dehumidification best values up to 5 [38] were found (conversion to SI units was needed). For small coolers, values of 2.8 to 4.5 for cooling (ambient temperatures 20°C and 35°C) and 1.5 to 2.2 for freezing (at same ambient temperatures) were found [39]. For industrial process cooling values found range between 3 to 6 if just cooling at around +5°C, and 2.7 to 4 when freezing at around -5°C [37, 40].

4. Discussion

The information and data that were just collected in section 3. are now discussed. Because the aim of this research is a holistic study of the choice to store the driving electric energy by EES or to store the useful energy by TES in power to heat or cold applications, the discussion includes different perspectives. According 2.1 Methodology, the discussion is first with regard to information of more general nature, based on collected information from existing application examples (results from section 3.1). Because advantages and disadvantages of choosing EES or TES are with different stakeholders, the discussion is subdivided here by different perspectives. The second part of the discussion is then regarding pure technical and economic data of the technologies (results from section 3.2).

4.1. Discussion of existing application examples (general and individual)

4.1.1. General features from basic principles

General features of using EES or TES (Figure 2) that are independent of the type of EES, TES, and converter, are obvious from Figure 2. First of all, using EES allows the free choice of what the electricity is used for after storage, while using TES the conversion to heat or cold is done when stored. Using EES requires to transport the electricity through the electricity grid at the time of heat or cold demand and full sizing of the converter to that demand, unless EES is installed directly at the user just in front of the converter such that the transport in the electricity grid can be shifted. TES instead allows to shift electricity transport as well as to size the converter to the average heat or cold demand. TES also serves as backup in case of failure of the electricity grid or the converter. If these features are relevant, and if they are an advantage or disadvantage depends on the perspective.

4.1.2. Perspective of the user side only

Regarding the perspective of the user, section 3.1 showed specific advantages of using TES compared to EES. Depending on the individual case (installation and heat/cold demand profile), TES allows to decouple heat/cold supplied to the use from that produced by the converter to some degree. This can allow using the converter for longer times and thus allow using a converter of smaller capacity, consequently reduce its investment cost. If the converter is operated such that its efficiency is optimized, energy savings and related energy cost savings are possible. This is specifically the case for heat pumps and coolers, for the latter for example by operation at night. Besides energetic optimization, a TES also allows optimization of energy cost not by amount of energy but by off-peak energy prices. These are common advantages of TES compared to EES to be considered by a user in a cost versus benefit analysis, and they all support the decision to use TES.

4.1.3. Perspective of the energy system as a whole

Regarding the perspective of the energy system as a whole, thus the perspective of electricity producers, grid operators, and politicians who are planning the transformation of the whole energy system and deciding on many boundary conditions, section 3.1 also showed specific advantages of using TES compared to EES, and past experience and lessons learnt on how to get installations and the transformation of the energy system done. Looking at the energy system as a whole, energy production and transport must be considered. With regard to electric energy and final conversion to thermal energy, meaning to heat or cold, the analysis of existing examples identified the production of excess electricity at times without a corresponding electricity demand as a crucial issue to consider, for example from nuclear power plants at night, and increasing in future also from wind and solar power plants. With regard to the transport of electricity in the electricity grid, the electric power to be transported is also an issue, not only from the variation of the electric power demanded by the users but also the one produced. The analyzed existing application examples show that higher peak and lower off-peak electricity rates by the producers are a common approach to adjust the demand from the users with regard to time and power to electricity production as well as to what the transport grid is able to transport. Peak- and off-peak electricity rates can apply to the electricity amount (per kWh) or the power (per kW). Besides electricity rates, load shift incentives and rebates are also offered by producers. Benefits and costs are with the producer, being able to sell electricity at times with no corresponding demand or with no problem during transport, but at lower price thus at lower income from sales, and also at the user side lowering the cost of electricity if shifting some demand to off-peak times. A shift of demand by the user can be by a change of behavior, when requiring heating or cooling, or optionally also by installing EES at the user side or a corresponding TES after the converter. If the electricity grid is not dimensioned for the maximum electric power ES is always needed, which has to be installed at the user side as just discussed, or as EES in the grid closer to the user. Examples of EES in the grid, including close to the user, exist, but were not investigated here. Examples with direct comparison between EES in the electricity grid and TES at the user side are missing, such that the direct comparison is then discussed based on technology data in the following section. Installations of EES at the user, before conversion to heat or cold, were not found in a single case; all existing application examples found are examples where TES was installed at the user side. ES installations cost time, as well as money for the investment etc. With regard to money, again electricity rates, incentives, and rebates by the producers are a common and successful approach to convince users to install TES while keeping their demand for heat or cold at unchanged times. Existing application examples show however also approaches going far beyond this common one. The example of Ice Energy [10], which has installed a large distributed TES system, free of charge to users, paid by revenue from a contract with the utility Southern California Edison to manage peak demand and load shifting, shows that utilities can go very different ways. Also, quite different from the very common variation of electricity prices, incentives, and rebates, is the way the municipality owned utility of Summerside has chosen [14]. To be able to sell its wind generated electricity within town, instead selling it at low price to the wider grid, a program was started to replace oil-based heating by electric TES heating or time-of-use electric water heaters at discounted rates, for the customer to choose between purchasing the TES, rent it, or engage in a several year lease-to-own scheme. In local heating grids it is also possible to install a large TES in a district heating grid and to heat it by electricity from sun or wind, e.g. by an electric resistance heater, alone or more typical connected to a cogeneration power plant (e.g. [13]).

4.2. Discussion of applications by current technology data

4.2.1. Perspective of the energy system as a whole

The second part of the discussion compares the choice of EES versus TES solely based on current technology data of EES and TES, specifically by technical and economic data. In section 3.2 such data were collected and summarized, and an overview of typical values was given Figure 4 which is now the basis for the discussion.
To start with, it is necessary to stress that the data collected can only give a rough overview. EES and TES values of storage densities depend on the product and what exactly they refer to. The same holds for cost, actually even more; cost also depend on the system size and if costs of system integration are taken into account or not. Round-trip efficiencies and life cycles and time can strongly vary with usage profile, specifically charging and discharging power and standstill times. And for converters, except electrical resistance heaters, the conversion efficiency (COP) is generally different for heat pumps and coolers, depends on the heat in- and output temperature, maybe varying in time (for example seasonal COP), and also depends on how much of a heating or cooling system they refer to (energy consumption of pumps, temperature gradients on heat exchangers). Nevertheless, the data collected allow discussing the choice between EES and TES. For the discussion only rough values are used and all cost are converted to € assuming 1€ = 1$.
For heating in large applications the comparison with EES must be made for hot-water TES. The discussion starts with using an electric resistance heater for conversion. An electric resistance heater has a COP = 1, thus the amount of electric energy which is stored in an EES corresponds to the same amount of thermal energy to be stored in a TES. For large EES, Figure 4 lists cost of roughly 400 €/kWh for a Li-ion battery system of 120 MWh, and roughly 300 €/kWh for a system of 600 MWh. For large hot-water TES, for 100MWh they are in the range of 22 to 24€/kWh for a temperature lift of only 20°C and 10 to 15€/kWh for 40°C. For a 600MWh hot-water TES the cost are in the range of 14 to 18€/kWh for 20°C and 8 to 11€/kWh for 40°C. The cost of hot-water TES is thus lower, lower by more than a factor of 10. In addition, the estimated life time for the battery is 10 to 15 years, for the TES it is 15 to 25 years. That the costs of TES were read from a 3-D graph, thus not very accurate, is therefore not crucial. For lead-acid batteries, even the lowest cost value is 2 to 6 times that of a large hot-water TES, and the lifetime is much shorter in comparison. Thus, again hot-water TES is clearly the better option. For heating in large systems with a heat pump, industrial heat pumps should generally be considered. They have a COP = 5 to 6. Consequently, the amount of electrical energy to be stored in an EES before the conversion corresponds to a 5 to 6 times larger amount that would have to be stored in a TES after conversion. Nevertheless, the cost advantage of the large scale hot-water TES of more than a factor of 10 still more than compensates that.
For heating in small, domestic applications, the comparison with EES must be made for two TES technologies: hot-water TES and PCM TES. They are discussed separately. For hot-water TES the specific cost are (Figure 4) for a temperature lift of only 20°C 75€/kWh for a 500 l buffer tank and 64€/kWh for a 1500 l buffer tank, and 105€/kWh for a 1500 l DHW tank, and for a larger lift of 40°C they are 38€/kWh, 32€/kWh, and 53€/kWh. For the life time of small hot-water TES no values were found, but they should be at least equal to that of EES. The easiest comparison with EES is again assuming conversion by an electric resistance heater with COP = 1. Compared to cost of a Li-ion battery EES, the costs of TES are much lower than those for EES being roughly 600 €/kWh for a residential and about 300€/kWh for a large in-grid EES system. Even if a domestic heat pump is used for conversion, only for the best COP = 5 the large EES can be more economic than the costly domestic hot-water TES. However, the power requirement to supply domestic hot water actually makes EES prohibitive. The comparison with lead-acid batteries is less straightforward as their costs are in a similar range. For comparison it is necessary to stress that the COP = 5 is for heating at lower temperature, while for preparation of domestic hot water far lower COP values result. Comparing for example the cost of 53€/kWh for a DHW tank at a temperature lift of 40°C with the lowest cost of 50€/kWh for the lead-acid batteries, lower values of the COP could easily be set off by the different lifetime. However, for low temperature heating a high COP = 5 could apply, and the fact that the specific cost of TES must then be multiplied by 5 might make the EES the better choice. For heating in small, domestic applications using a PCM-TES, its cost around 300 to 400€/kWh are similar to the values of EES in a large Li-ion battery system, and in the best case half of the cost of 600€/kWh for a residential one. Taking additionally into account the very large number of life cycles of the residential PCM-TES, the residential PCM-TES is for conversion by an electric resistance heater again the better option. The number of 40,000 life cycles tested by the manufacturer is more than twice the highest value of life cycles of Li-ion batteries, thus that the cost advantage is more than a factor of 2 compared to a large-scale Li-ion battery system and more than a factor of 4 for a residential Li-ion battery. Taking into account other values for the life cycles of a Li-ion battery, not the highest value found, and that the values for the life cycles of the residential PCM-TES are only those successfully tested and not cycles until failure, the factors will be higher. For the case that conversion is by an electrically driven heat pump, the high storage temperature of the PCM-TES of about 60°C leads to values of the COP lower than 5. Thus, the previously found advantage of the PCM-TES to Li-ion battery EES is not reversed. For the comparison with lead-acid batteries the uncertainty in the number of life cycles makes a real comparison impossible, but that the ratio is higher than 10 is a clear message against using lead-acid battery EES; the additional cost for maintenance and frequent replacement will add up significantly. Also not included in the discussion here is the power requirement to prepare domestic hot water, which in the case of a heat pump and EES would require significant oversizing of the heat pump, with prohibitive cost.
For cooling in large applications, e.g. district cooling or cooling of industrial processes, cold-water TES as well as ice TES is available. They are again discussed separately. For large scale cold-water TES, due to the lack of original data, the costs were estimated based on the cost of large scale hot-water TES just assuming a temperature lift of 10°C, as is typical. For a 50MWh TES they are then in the range of 44 to 48 €/kWh, while for a 300MWh system they are about 28 to 36 €/kWh, to be compared to the cost of roughly 400€/kWh for a Li-ion battery system for a 100MWh system, and for a 600MWh system roughly 300€/kWh, thus for somewhat different system size. The cost of EES are roughly 10 times as high, which is by far not offset by the efficiency of large industrial coolers with maximum of COP = 6. In addition comes the longer life time of TES. For lead-acid batteries, the cheapest batteries have about 2 times the cost of the cheapest TES. The effect of a COP = 6 could thus give the batteries an advantage by a factor of 3, but this can be set off by the advantage of the TES with regard to life cycles and time; the range of values for the batteries does not allow a conclusion. Also, there is the advantage of cold-water TES to supply high cooling power, out of the scope here as being dependent on the application.
For cooling in small applications it is also interesting to look at the option of small-scale cold-water TES, maybe some time in future needed for space cooling. For that, the cost of domestic hot-water TES for a temperature swing of 10°C can be used, which are (Figure 4) for a 1500 l buffer tank 128€/kWh. This is about 2.5 to 3.5 times lower than the cost of even large Li-ion battery systems, thus could offset the COP of small domestic coolers in the range of 2.8 to 4.5.
If an application needs not only cooling but instead freezing, large-scale ice TES is a widely used option. The cost of 20 to 25€/kWh (Figure 4) are however data several years old, thus only a hint. Nevertheless, even if up-to-date cost would be in the range of 30 to 40€/kWh they would be a factor of 10 lower than those of even large Li-ion battery systems, thus not be set off by the efficiency of industrial freezers with COP = 2.7 to 4. Also, there is the advantage of ice TES to supply high cooling power, again not discussed here. It would be interesting to get an idea also for small systems, for example for building air-conditioning including also dehumidification or for small food storage rooms. Large systems often use ice TES, however in contrast to cold-water TES it is not possible to adapt cost data from hot-water TES as they are not constructed to allow freezing of the water.

4.2.2. Sensitivity analysis

Finally, at the end of the discussion of applications by current technology data, it is necessary to make a sensitivity analysis of the technology data since they have a range, some uncertainty, and also might change with time, all affecting the results.
The cycle frequency played no role in the comparison of EES and TES here as both were compared for the same application. But it played a crucial role in the initial selection of applications and technologies for EES and TES to be investigated: a cycle in a fraction of an hour to several days, so at least 100 storage cycles per year, better 200 or even 300. The discussion focused on technology data of storage density and round-trip efficiency, up-to-date (investment) cost per storage capacity, life cycles and time, and conversion efficiency COP. The COP depends on the type of application, converter used (electric resistance heater, heat pump, or cooler), boundary conditions like temperatures and required power, and specific equipment. Overall, the COP varies in a range of 1 to 6, so by a factor of 6, and even for heat pumps and coolers within the same application by a factor of about 1.25 to 2.5. The storage capacity of EES and TES to be compared, and their corresponding cost, can thus vary in a wide range even within the same application. The specific investment cost per kWh stored also vary strongly with technology and system size, e.g. by a factor of about 2 for Li-ion batteries and by a factor of 4 for lead-acid batteries. Similar variations exist also for hot and cold water TES where sufficient data are available. To avoid a more complex discussion the round-trip efficiency was not taken into account. It could be taken into account by the cost per kWh lost in a storage cycle, and is relevant. For example, if energy cost are 0.1€/kWh stored, then a round-trip efficiency of 90% means 10% loss per cycle, thus 0.01€/kWh stored. For 100 cycles per year this amounts in 10 years life time to a loss of 10€/kWh stored. The values of the life cycles varied by a factor of 9 for lead-acid batteries, and by a factor of 36 for Li-ion batteries, thus that a more detailed calculation of the economics of losses is not possible.
The analysis in section 4.2.1. indicates that in most cases TES is the better choice, possible as the advantage is in most cases beyond the range of different data values. The sensitivity analysis now showed that telling more detailed, quantitatively, how much using EES or TES is better, is not possible with the current data basis, specifically not in general.

5. Conclusions

The aim of this research was a holistic study of the choice to store the driving electric energy by EES or to store the useful energy by TES in power to heat or cold applications. In contrast to previous investigations the analysis here was thus in direct comparison to the main remaining option, EES, under the assumption that in the future energy system use of cheap fossil fuels is stopped, and storage cycles in the considered applications are short thus that chemical storage of renewable electricity, e.g. in hydrogen, is not economic. To give a holistic picture, the analysis was done in two ways: analysis of existing application examples, and analysis of applications by current technology data and comparison. The analysis of existing application examples (general and individual) gave an overview on already successful applications, reasons why e.g. TES was chosen, past experience and suitable conditions for choosing TES. It covered the perspective of users, producers, grid operators, and politicians. The analysis of applications by current technology data and comparison gave a data-based view on the economics, and showed that in many cases TES seems to be the better option compared to EES. It is thus clear from the analysis that TES could contribute much more than it does already, and that awareness of this option for the transition of the energy system among stakeholders is needed. Options how to unfold the potential were identified in the analysis of the existing application examples.
Future R&D should therefore not only focus on basics and the technological realization of TES as well as the technical integration of TES in the energy system. Even for already commercial TES solutions often data like investment cost, life time and cycles, which have been shown to play a crucial role in the economics of TES, are missing. Making the relevant data available for decisions to install TES must not be forgotten. The problems in finding data for this investigation show a big gap here. Also crucial are business models that support integration of TES, and not to forget standards and legal boundary conditions that can prohibit, allow, or promote use of a technology; all are crucial to use the large potential of TES to a full extent, and should be studied much more. Last, but not least, many issues are country specific and therefore must be studied also as that. These are of course the legal conditions, but also the specific energy grid and its future development, and the demand for energy storage and specifically heat and cold in the future. Related to that is to study deeper the crucial assumption made here: the same number of cycles for EES and TES to be able to compare both directly. It is justified e.g. for a fixed, daily cold demand in industrial processes or in countries with year around space cooling, however, if e.g. space cooling is only seasonal then for the rest of the year EES could still be used while TES not. This again is a matter of study for country specific situations and the individual applications.

Funding

This research received no external funding.

Data Availability Statement

No new data were created or analyzed in this study. Data sharing is not applicable to this article.

Conflicts of Interest

The author declares no conflict of interest.

References

  1. IEA. Net Zero by 2050 - A Roadmap for the Global EnergySector. IEA Report. IEA 2021. Available online: https://iea.blob.core.windows.net/assets/0716bb9a-6138-4918-8023-cb24caa47794/NetZeroby2050-ARoadmapfortheGlobalEnergySector.pdf (downloaded 2.6.2021).
  2. Mehling, H.; Technologies of energy conversion, storage, and transport in the energy system - A brief introduction. Tredition, 2016, ISBN: 978-3-7345-4049-3.
  3. Rathgeber, C.; Lävemann, E.; Hauer, A.; Economic top–down evaluation of the costs of energy storages — A simple economic truth in two equations. Journal of Energy Storage, 2015, volume 2, pages 43-46. [CrossRef]
  4. Rathgeber, C.; Hiebler, S.; Lävemann, E.; Dolado, P.; Lazaro, A.; Gasia, J.; de Gracia, A.; Miró, L.; Cabeza, L. F.; König-Haagen, A.; Brüggemann, D.; Campos-Celador, Á.; Franquet, E.; Fumey, B.; Dannemand, M.; Badenhop, T.; Diriken, J.; Nielsen, J. E.; Hauer, A.; IEA SHC Task 42 / ECES Annex 29 – A simple tool for the economic evaluation of thermal energy storages. SHC 2015, International Conference on Solar Heating and Cooling for Buildings and Industry, Energy Procedia 2016, 91, 197 – 206. [CrossRef]
  5. Flammini, A.; Bracco, S.; Sims, R.; Cooke, J.; Elia, A.; Costs and Benefits of Clean Energy Technologies in the Milk, Vegetable and Rice Value Chains. Published by the Food and Agriculture Organization of the United Nations (FAO) and the Deutsche Gesellschaft für Internationale Zusammenarbeit (GIZ) GmbH. 2018. Available online: https://www.fao.org/documents/card/en/c/I8017EN (accessed on 29 June 2022).
  6. Khelifa, N.; Krämer, W.; Standklimatisierung von Nutzfahrzeugkabinen über Kältespeicherung. 6. Karlsruher Fahrzeugklima-Symposium, 17. Sept. 2004. Available online: http://www.twk-karlsruhe.de/download/symposium_06/manwebasto.pdf (downloaded 14th May 2020).
  7. Mehling, H.; Brütting, M.; Haussmann, T.; PCM products and their fields of application - An overview of the state in 2020/2021. Journal of Energy Storage, 2022, 51. [CrossRef]
  8. HPTCJ. About Thermal Storage Air Conditioning. published 2104, updated later Available online: https://www.hptcj.or.jp/e/learning/tabid/367/Default.aspx (accessed 25 Feb. 2023).
  9. BAC. Ice Thermal Storage. Brochure. Available online: https://baltimoreaircoil.com/download_api_endpoint/1088/g1_ice_20150914.pdf (downloaded 15 Nov. 2022).
  10. Roselund, C.; Ice Energy brings the deep freeze to U.S. energy storage. pv magazine USA, 2019, available at https://pv-magazine-usa.com/2019/02/13/ice-energy-brings-the-deep-freeze-to-u-s-energy-storage/, accessed 24 Feb. 2023.
  11. Cameron Murray. Edison validates Viking Cold Solution’s cooling thermal energy storage tech. March 25, 2022, Available online: https://www.energy-storage.news/thermal-energy-storage-comes-of-age-with-edison-validation-100-round-trip-efficiency-pilot-and-ip-acquisition/ (accessed 18th Oct. 2022).
  12. Lipp. Tanks and system solutions. Available online: https://www.lipp-system.de/tanks/thermal-storage-tanks/?lang=en, (accessed 8th Nov. 2022).
  13. N-ERGIE Aktiengesellschaft. Wahrzeichen der Energiewende - Der Wärmespeicher der N-ERGIE. Stand: Juni 2015; Available online: https://www.n-ergie.de/n-ergie/unternehmen/unsere-energie/kraftwerksstandort (downloaded 6 Dec. 2022).
  14. IRENA. INNOVATION OUTLOOK THERMAL ENERGY STORAGE. 2020, Available online: https://www.irena.org/publications/2020/Nov/Innovation-outlook-Thermal-energy-storage (downloaded 17 Feb. 2023).
  15. Baltimore Aircoil Company. Ice Thermal Storage. Brochure, 2012. Available online: https://baltimoreaircoil.com/products/ice-thermal-storage (downloaded 15th Nov. 2022).
  16. Mehling, H.; Use of Phase Change Materials for Food Applications - State of the Art in 2022. Appl. Sci., 2023, 13. [CrossRef]
  17. May, G. J.; Davidson, A.; Monahov, B.; Lead batteries for utility energy storage: A review. Journal of Energy Storage, 2018, 15, 145–157. [CrossRef]
  18. Kebede, A. A.; Coosemans, T.; Messagie, M.; Jemal, T.; Behabtu, H. A.; Van Mierlo, J.; Berecibar, M.; Techno-economic analysis of lithium-ion and lead-acid batteries in stationary energy storage application. Journal of Energy Storage, 2021, 40. [CrossRef]
  19. He, W.; King, M.; Luo, X.; Dooner, M.; Li, D.; Wang, J.; Technologies and economics of electric energy storages in power systems: Review and perspective. Advances in Applied Energy, 2021, 4. [CrossRef]
  20. Lemian D.; Bode, F.; Battery-Supercapacitor Energy Storage Systems for Electrical Vehicles: A Review. Energies, 2022, 15. [CrossRef]
  21. NREL. 2022 Annual technology baseline: Utilityscale battery storage. Available online: https://atb.nrel.gov/electricity/2022/utility-scale_battery_storage, data updated 07/21/2022 (accessed 17 Feb. 2023).
  22. Figgener, J.; Stenzel, P.; Kairies, K.-P.; Linßen, J.; Haberschusz, D.; Wessels, O.; Angenendt, G.; Robinius, M.; Stolten, D.; Sauer, D. U.; The development of stationary battery storage systems in Germany – A market review. Journal of Energy Storage, 2020, 29. [CrossRef]
  23. Martin Placek. Electric vehicles - global lithium-ion battery pack costs 2011-2030. Published by Martin Placek, Feb 15, 2021. Available online: https://www.statista.com/statistics/883118/global-lithium-ion-battery-pack-costs/ (accessed 15.12.2021).
  24. pv Europe. Average cost of lithium-ion battery cell below $100 kWh in 2023. published 09/24/2020, Available online: https://www.pveurope.eu/solar-storage/average-cost-lithium-ion-battery-cell-below-100-kwh-2023 (accessed 15.12.2021).
  25. Urbaneck, T.; Oppelt, T.; Sehwöster, I.; Banck, E. F.; Große Druckbehälter als thermische Energiespeicher - Teil 1: Vor- und Nachteile sowie Einsatzgrenzen. EuroHeat&Power, 2018, 47. Jg, Heft 11-12.
  26. GSC Tanks. An introduction to industrial hot water storage tanks. Available online: https://www.gsctanks.com/industrial-hot-water-storage-tanks/ (accessed 8th Nov. 2022).
  27. ofen.de. Pufferspeicher. Available online: https://www.ofen.de/pufferspeicher?p=1&o=2&n=16&f=326 (accessed 16 Dec. 2022).
  28. Sunamp, website. Available online: https://www.thermalearth.co.uk/sunamp-heat-batteries-and-thermal-en (accessed 10th Dec. 2021).
  29. Sunamp: Thermino. Product brochure, September 2022 - Version 2.3. Available online: https://sunamp.com/en-gb/wp-content/uploads/sites/2/2022/10/Sunamp-Thermino-Brochure-September-2022-English-V2.3.pdf (downloaded 7 Nov. 2022).
  30. Midsummer Wholesale. Sunamp heat batteries. Available online: https://midsummerwholesale.co.uk/buy/sunamp-heat-batteries (accessed 7th Nov. 2022).
  31. NOSTROMO. Technology. Available online: https://www.nostromo.energy/technology/ (accessed 17 Feb. 2023).
  32. UTILITY DIVE. Ice, ice energy: The hot market for cooled liquid energy storage. Contributing editor: Herman K. Trabish; available online: https://www.utilitydive.com/news/ice-ice-energy-the-hot-market-for-cooled-liquid-energy-storage/408356/ (accessed 17 Feb. 2023).
  33. BAC. District cooling with ice thermal storage. Movie. Available online: https://baltimoreaircoil.com/products/ice-thermal-storage/tsu-m-ice-chiller-thermal-storage-unit (accessed 11 March 2023).
  34. airconditionerlab. Coefficient of Performance Explained. Available online: https://airconditionerlab.com/coefficient-of-performance, published 2021 (accessed 15 Nov. 2022).
  35. Yu Chang Zhen. What is the COP of Heat Pumps? Available online: https://aircondlounge.com/what-is-the-cop-of-heat-pumps/ (accessed 15 Nov 2022).
  36. Montero, O.; Brischoux, P.; Callegari, S.; Fraga, C.; Rüetschi, M.; Vionnet, E.; Calame, N.; Rognon, F.; Patel, M.; Hollmuller, P.; Large Air-to-Water Heat Pumps for Fuel-Boiler Substitution in Non-Retrofitted Multi-Family Buildings—Energy Performance, CO2 Savings, and Lessons Learned in Actual Conditions of Use. Energies, 2022, 15. [CrossRef]
  37. Ahrens, M. U.; Braekken, A.; Foslie, S. S.; Moen, O. M.; Lovas, K. A.; Bantle, M.; Hafner, A.; Eikevik, T. M.; Performance analysis of high temperature heat pumps and thermal energy storages for a dairy. Proceedings of 15th IIR-Gustav Lorentzen Conference on Natural Refrigerants (GL2022), Trondheim, Norway, June 13-15th 2022. [CrossRef]
  38. ENERGY STAR. Most Efficient 2022 — Central Air Conditioners and Air Source Heat Pumps. Available online: https://www.energystar.gov/products/most_efficient (accessed 15 Nov. 2022).
  39. Ure, Z.; Thermal Energy Storage for Cold Chain Applications. 7th IIR conference on Sustainability and the Cold Chain, April 11-13 2022. [CrossRef]
  40. BAC. TSU Thermal Storage Products. Available online: https://www.baltimoreaircoil.eu/system/files/TSU.pdf (downloaded 15 March 2021).
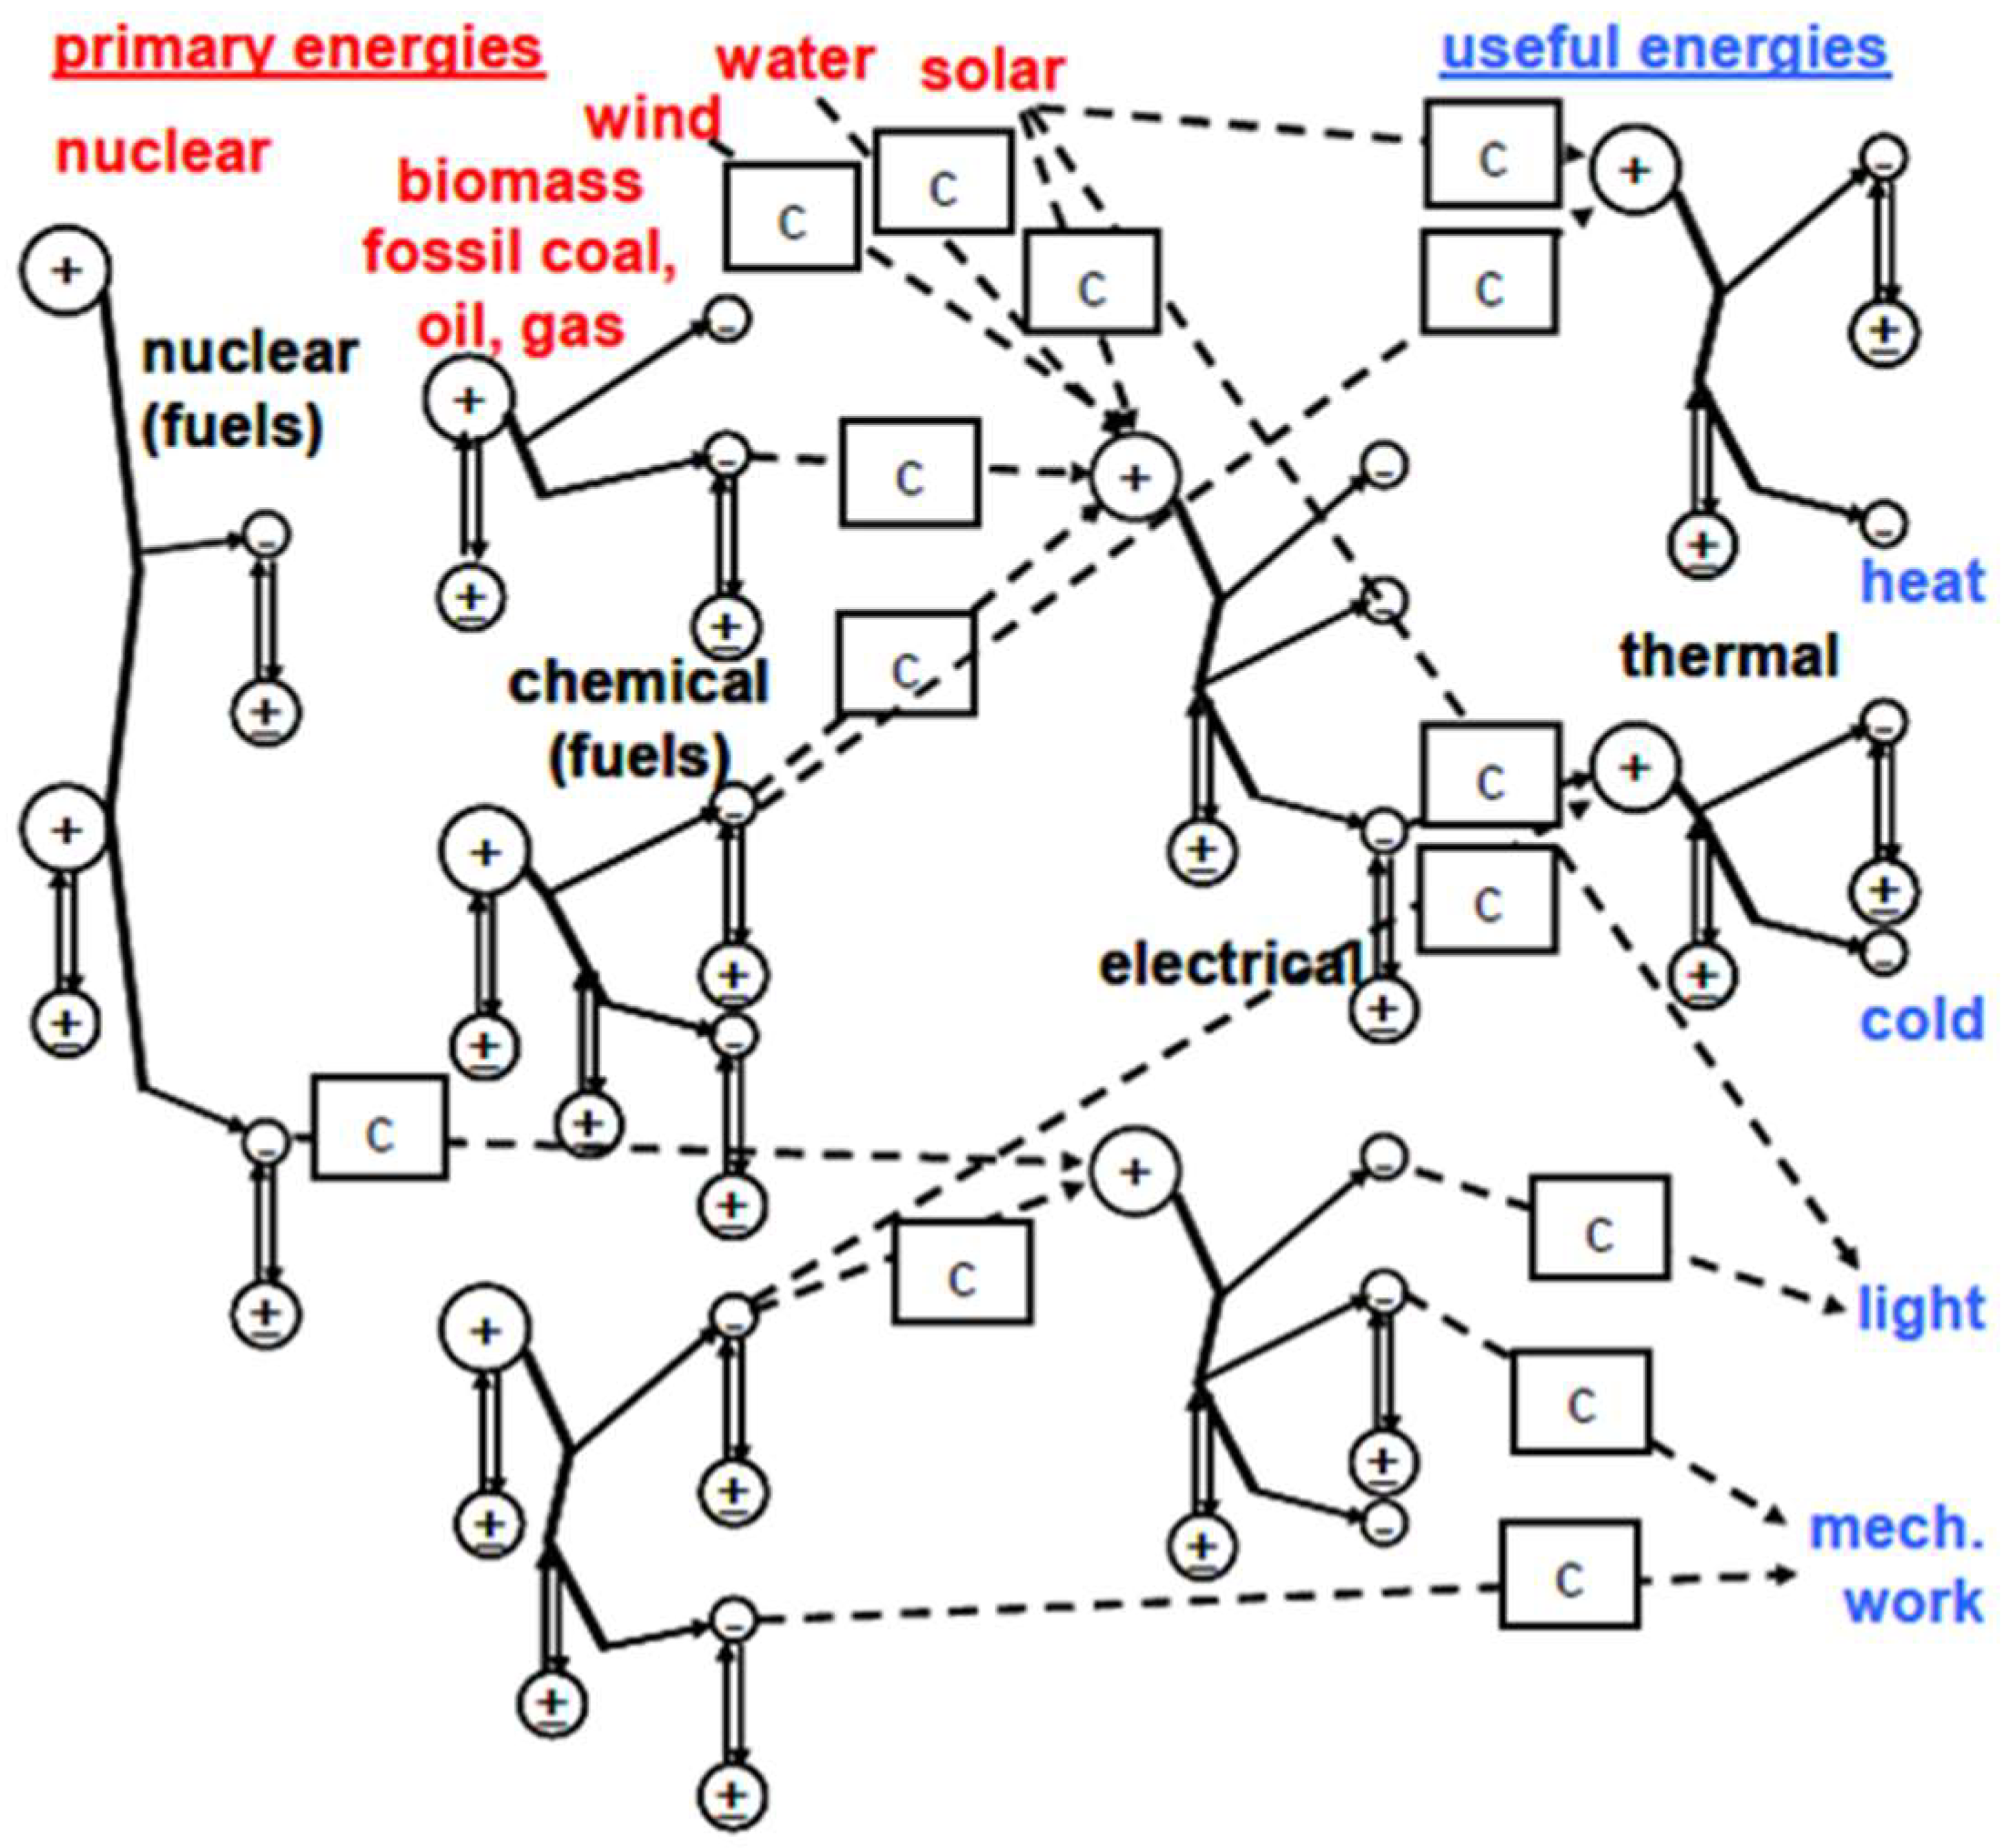
Figure 1. Sketch of the energy system; c = converter, + = source, − = sink, ± = storage [2].
Preprints 88638 g001
Figure 2. Schematic sketch of (electric) power to heat or cold conversion and options for energy storage by EES or by TES.
Preprints 88638 g002
Figure 3. Overview of current technology data to be collected for the later discussion.
Preprints 88638 g003
Figure 4. Overview of the value ranges for crucial properties: for EES in general, and for TES and converters grouped with respect to heating, cooling, and freezing.
Preprints 88638 g004
Disclaimer/Publisher’s Note: The statements, opinions and data contained in all publications are solely those of the individual author(s) and contributor(s) and not of MDPI and/or the editor(s). MDPI and/or the editor(s) disclaim responsibility for any injury to people or property resulting from any ideas, methods, instructions or products referred to in the content.
Copyright: This open access article is published under a Creative Commons CC BY 4.0 license, which permit the free download, distribution, and reuse, provided that the author and preprint are cited in any reuse.
Prerpints.org logo

Preprints.org is a free preprint server supported by MDPI in Basel, Switzerland.

Subscribe

© 2024 MDPI (Basel, Switzerland) unless otherwise stated