Preprint
Article

Biologicalization of Smart Manufacturing using DNA-Based Computing

This version is not peer-reviewed.

Submitted:

24 October 2023

Posted:

25 October 2023

You are already at the latest version

A peer-reviewed article of this preprint also exists.

Abstract
This article provides a general overview of the bio-inspired computing method called DNA-Based Computing (DBC), including its theory and applications. The main theme of DBC is the central dogma of molecular biology (once information of DNA/RNA has got into a protein, it can’t get out again), i.e., DNA to RNA (sequences of four types of nucleotides) and DNA/RNA to protein (sequence of twenty types of amino acids) are allowed, not the reverse ones. Thus, DBC transfers few-element information (DNA/RAN-like) to many-element information (protein-like), solving a given cognitive problem. DBC can take many forms; this article elucidates two main forms, denoted as DBC-1 and DBC-2. Using arbitrary numerical examples, it is shown that DBC-1 can solve the following cognitive problems: “similarity indexing between seemingly different but inherently identical objects” and “recognizing regions of an image separated by a complex boundary.” DBC-2 can solve the following cognitive problem: “pattern recognition when the relevant information is insufficient.” Smart manufacturing-based systems (digital twins and big data analytics) must solve the abovementioned problems to make the manufacturing enablers (machine tools and monitoring systems) more self-reliant and autonomous. Consequently, DBC can improve the cognitive problem-solving ability of smart manufacturing-relevant systems and, thereby, can enhance its biologicalization.
Keywords: 
Subject: 
Engineering  -   Industrial and Manufacturing Engineering

1. Introduction

Manufacturing adds value to an economy. One of the acclaimed manufacturing concepts is smart manufacturing [1,2] or Industry 4.0 [3,4]. Smart manufacturing employs information and communication technology-based systems to solve manufacturing problems. Among others, cyber-physical systems, Industrial Internet of Things, big data, big data analytics, artificial intelligence, machine learning, digital models, digital shadows, digital twins, sensor signaling, virtual reality, and digital manufacturing commons are the main constituents of smart manufacturing [1,2,3,4,5]. These constituents are embedded into manufacturing enablers (machine tools, human resources, peripherical equipment, computer-aided design, manufacturing and process planning systems, enterprise resources planning systems, and supply chain systems) [1,2,3,4,5]. The goal is to make the manufacturing enablers more self-reliant or autonomous [2,4,5]. Consequently, the above-mentioned constitutes and enablers need to do some cognitive tasks (pattern recognition, knowledge elicitation, adaptation to emerging environments, and dealing with uncertainty) [2,4,5]. In this case, different aspects of biological systems can be used as a source of motivation, as suggested by the “biologicalization” movement of manufacturing [6,7]. (This article uses the term “biologicalization” instead of “biologicalization” to keep spelling consistency.) In biologicalization, three stages are considered: 1) bio-inspiration, 2) bio-integration, and 3) bio-intelligence [6,7]. Bio-inspiration refers to a method that relates to a biological phenomenon. Among others, genetic algorithms/programming and artificial neural networks/deep learning are the prominent bio-inspired computing methods. Genetic algorithm is based on the biological phenomenon called evolution, whereas artificial neural networks/deep learning is based on neuron signal processing that takes place in the brain of a biological organism. Bio-integration integrates biotechnological solutions to manufacturing, e.g., cleaning waste water and other chemical wastes using microorganisms (bacteria). Lastly, bio-intelligence injects human-like intelligence into smart manufacturing systems, making them even smarter. For example, a bio-intelligence-based design system can design a product, translating customer needs into product specifications. It is worth mentioning that among the three stages, bio-intelligence is the most challenging because it needs knowledge creation as well as simultaneous management of all four types of knowledge [8] rather than mere use of existing knowledge.
Nevertheless, biologicalization in manufacturing can be traced back to the initiative of Ueda called Biological Manufacturing Systems (BMS) [9,10,11]. The BMS acknowledges the ever-changing external-internal environments of the life cycle of a product and lets the enabling systems self-grow, self-organize, adapt, and evolve [9,10,11]. Like other systems, the BMS needs information to run. Two types of information are recommended: 1) “DNA-type information” and “BN (Brain and Neurons)-type information” [9,10,11]. As we know, as far as biological systems are concerned, DNA-type information means inherited information (i.e., genetic information (DNA) that is passed from one cell to another and one generation to another). And, BN-type information means learned-type information (i.e., the information that the brain learns using the neural network). For the BMS, on the other hand, DNA-type information is a metaphor. It refers to information the BMS must inherit while solving product life cycle-relevant problems. Similarly, BN-type information is also a metaphor for the BMS. It means the information that the BMS must learn while solving product life cycle-relevant problems. However, one of the main concerns of the BMS is what kind of information out of DNA-type information and BN-type information should be prioritized. The answer is DNA-type information is more important than BN-type information because superior biological functions, such as flexibility, autonomy, self-formation, and self-recovery, are expressed by DNA-type information rather than BN-type information. See [9,10,11] for more details. The remarkable thing is that an integrated approach called “gentelligent” manufacturing systems has been developed to get benefited from DNA-type information and BN-type information [12,13].
However, some authors addressed the biologicalization movement of manufacturing [14,15,16,17,18,19,20,21] based on the central dogma of molecular biology [22,23] introduced by Crick (one of the Nobel laureates who discovered the double helix structure of DNA). Crick stated, “Once information has got into a protein, it can’t get out again. Information here means the sequence of the amino acid residues, or other sequences related to it” [23,24]. It means genetic information can be passed to protein (sequence of amino acids) from DNA or RNA (sequence of nucleic acids), but the reverse is not possible. Therefore, biological systems only allow “DAN to DNA,” “DNA to RNA,” and “DNA to protein” information flow. Since a DNA molecule is a sequence of four elements (A, C, G, and T) and protein is a sequence of twenty types of amino acids, central dogma of molecular biology implies that biological systems promote a jump in information content [25] while synthesizing protein using genetic information written in DNA (the maximum possible information content of DNA is log2(4) = 2 Bits and the maximum possible information of protein is log2(20) = 4.322 Bits). Authors consider that the information processing underlying DNA-RNA-Protein and subsequently the jump of information content can be of great use while solving smart manufacturing-relevant problems (pattern recognition and similarity identification). In this article, the authors use some arbitrary examples and presents the operations to be used in DNA-RNA-Protein-like information processing for solving the abovementioned cognitive problems.
The rest of this article is organized as follows. Section 2 uses a schematic diagram to describe the central dogma of molecular biology and the main processes involved. Section 3 presents algorithms underlying DNA-Based Computing (DBC) inspired by the central dogma of molecular biology. Section 4 presents three arbitrary examples showing the cognitive computing ability of DBC. In particular, the following three types of problems are considered: 1) similarity indexing between seemingly different but inherently identical objects; 2) recognizing regions of an image separated by a complex boundary; and 3) recognizing patterns using insufficient information (e.g., a very short-windowed sensor signal). Section 5 concludes this article.

2. Central Dogma of Molecular Biology

As mentioned before, the central dogma of molecular biology establishes the logical and physical relationships among such macro molecules as DNA, RNA, and proteins. In particular, biological systems only allow “DAN to DNA,” “DNA to RNA,” and “DNA to protein” information flow [22,23]. A comprehensive description of DNA-RNA-Protein-centric processes can be found in [24]. In this article, the objective is to gain inspiration from the core processes of central dogma and build models (algorithms) to solve cognitive problems. Therefore, a customized and brief description of the core processes underlying the central dogma of molecular biology is presented in this section.
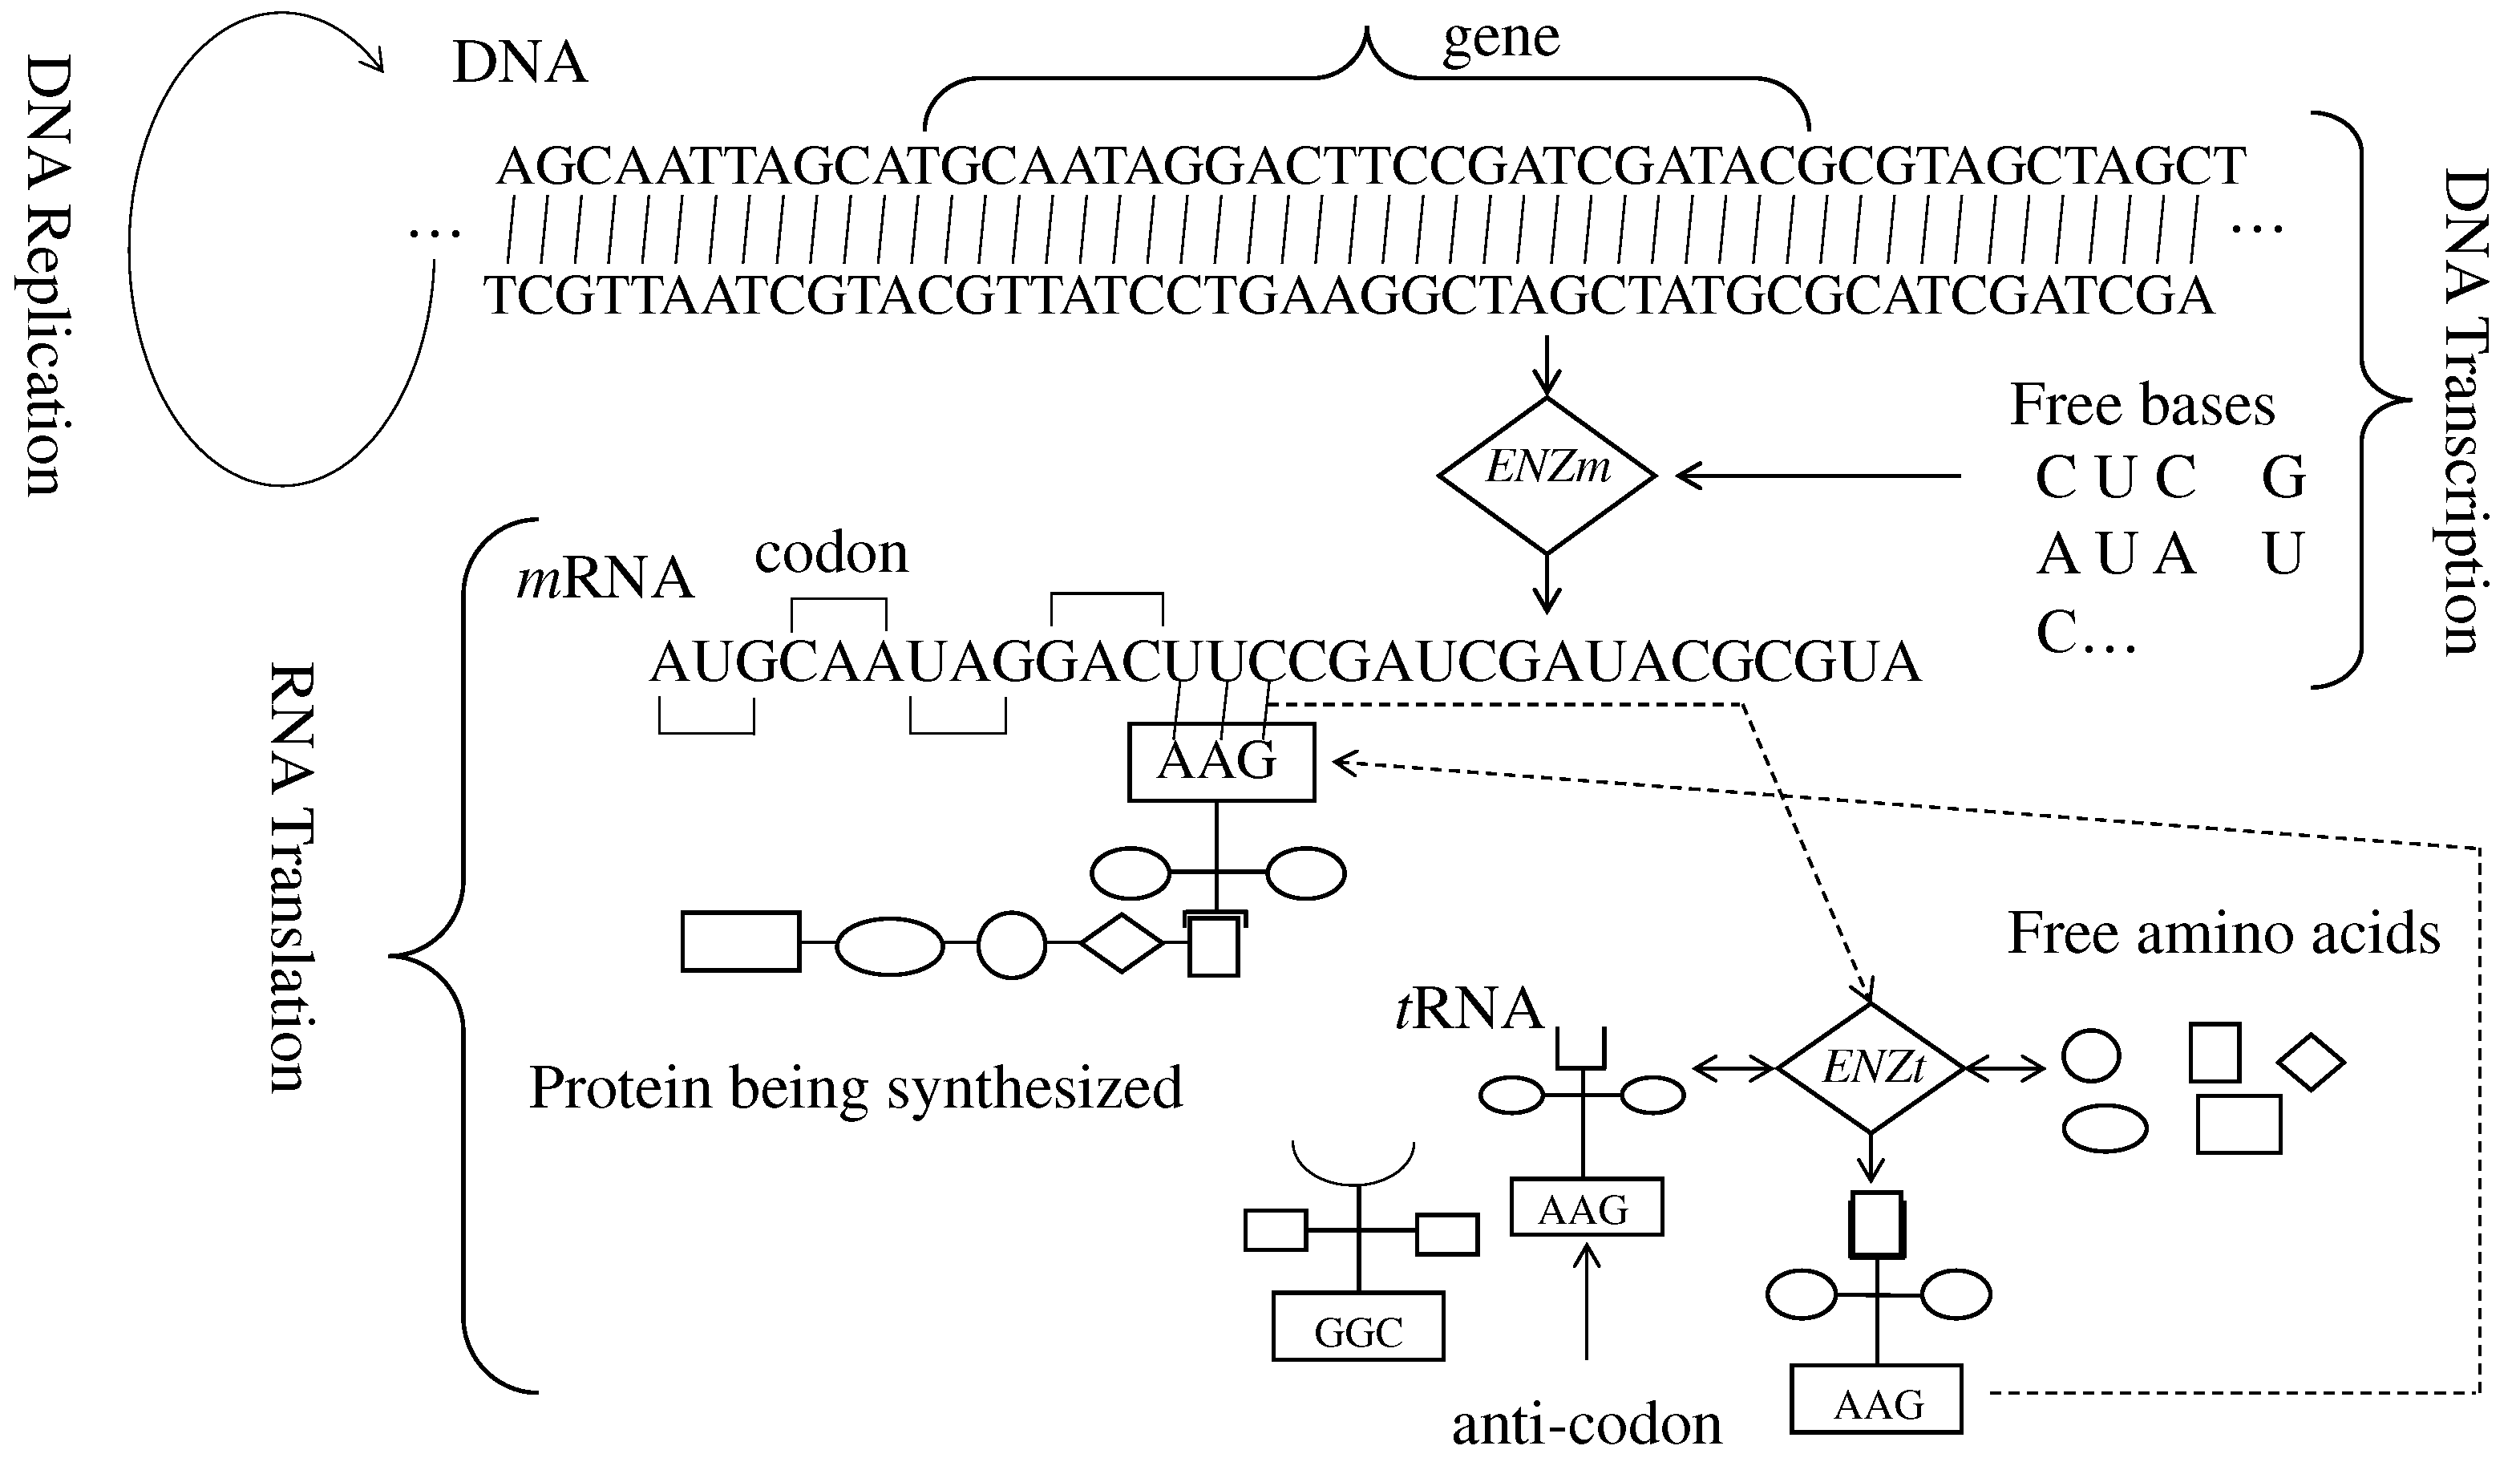
Figure 1 schematically illustrates the core processes of the central dogma of molecular biology [16,17]. As seen in Figure 1, the three core processes are 1) DNA replication, 2) DNA Transcription, and 3) RNA Translation. The first one produces a copy of DNA when cell division occurs [24]. The other two are involved in protein synthesis [24]. The enzymatic activities of the latter two processes are denoted as ENZm and ENZt. The molecules involved are DNA (double strands of nucleic acids (A, C, G, and T), mRNA (single strand of nucleic acids (A, C, G, and U)), tRNA (a relatively short stand of nucleic acids), codon (three consecutive nucleic acids of mRNA), anti-codon (counterpart of codon in tRNA), free bases (free nucleic acids), tRNA charged with amino acid, and protein (sequence of amino acids). Thus, the main objective of these molecules and enzymatic activities is to synthesize a protein based on the genetic information stored in DNA. Consequently, central dogma’s main purpose is to maintain a unidirectional information flow (DNA to a protein via RNA but not protein to the other way).
DNA transcription’s enzymatic activities (ENZm) first recognize a DNA segment as a gene and make a copy of it (gene), synthesizing free bases. The copied segment is used to form a messenger RNA (mRNA). While doing so, A is copied as U, C is copied as G, G is copied as C, and T is copied as A. On the other hand, the enzymatic activities of RNA Translation (ENZt) operate on mRNA, tRNA, and free amino acids and produce a protein (sequence of amino acids). In doing so, ENZt first bonds an appropriate amino acid to a tRNA. The selection of amino acid depends on the anti-codon (a three-base sequence of nucleic acids at a certain location of tRNA). In the next step, ENZt helps make a bond between a codon of mRNA and an anti-codon of tRNA-amino-acid compound. Finally, ENZt helps the tRNA-amino-acid compound release the amino acid to the growing chain of the protein. This way, genetic instruction stored in DNA is passed to proteins. It is worth mentioning that the sequence of amino acids of a protein is its primary structure. It makes a three-dimensional structure due to folding (tertiary structure). The tertiary structures of proteins perform functional activities and serve as structural units in biological systems. Therefore, biological systems keep producing proteins. Other than DNA Transcription and RNA Translation, there is an important process that is called DNA replication by which the DNA is replicated for storage and cell division. Some microorganisms rely on mRNA directly for protein synthesis.
However, there are some universal rules that biological systems use during the DNA Transcription and RNA Translation. These are called genetic rules. The genetic rules establish relationships among amino acids, codon of mRNA, and anti-codon of tRNA. Table 1 shows the nucleic acid relations of DNA, mRNA, and tRNA.

3. DNA-Based Computing (DBC)

Computing methods can be developed inspired by the core processes involved in the central dogma of molecular biology. The authors denote these computing methods as DNA-Based Computing (DBC) [16,17,18,19,20,21]. DBC can take many forms, but the basic principle remains the same: generate many-element-based piece of information (similar to protein) from a few-element-based piece of information (similar to DNA and RNA). Consequently, a rise in the information content [25] may take place (see Section 1). The two most promising forms (algorithms) of DBC are presented below. The first is denoted as DBC-1 and the other as DBC-2. These algorithms are described as follows.
First, consider DBC-1. It is schematically illustrated in Figure 2. This algorithm consists of four steps and seven processes. Referring to Figure 2, the steps and processes are described as follows.
Step 1: This step consists of Process 1. Process 1 extracts problem-relevant information from a given problem.
Step 2: This step consists of Processes 2 and 3 and generates DNA-like information (DNA array) from the problem-relevant information. In doing so, the user sets the DNA forming rules. For example, consider that a binary string <0000111001110000011111111> is the problem-relevant information. If the user defines that 00 → A, 01 → C, 10 → G, and 11 → T, which are denoted as DNA translation rules, then the resulting DNA array is <AATGCTAACTTT>. Note that the last digit (“1”) is truncated. Instead of truncating a digit, one more digit can be added (i.e., in this case “1” or “0” depending on a user-defined process). In that case, the resulting DNA array becomes one letter longer, i.e., <AATGCTAACTTTT>. Reading frame is also a constituent of DNA forming rules. For example, the above case refers to the pair-wise reading frame, i.e., two consecutive letters in the binary string are replaced by a letter of DNA. There are other possibilities. Each digit in the binary string can be replaced by a letter of DNA, considering it (the digit) and the next one. This reading frame is denoted as the continuous reading frame. Thus, the continuous reading frame converts <0000111001110000011111111> to <AAACTTGACTTGAAAACTTTTTTTT>. Therefore, the constituents of DNA forming rules are DNA translation rules, truncation/adding schemes, and reading frames.
Step 3: This step consists of Processes 4 and 5 and produces a protein array that consists of single-letter symbols of amino acids. In doing so, protein-forming rules use protein translation rules as shown in Table 2 (i.e., three consecutive letters of DNA array are considered a codon and translated into the corresponding single-letter symbol of protein). It also employs a truncation/addition scheme and a reading frame similar to the ones described in the previous process. For example, if the DNA array <AATGCTAACTTTT> undergoes the protein-forming rules, the following protein array can be produced: <NMCALXNTLF>. In this case, the protein-forming rule is DNA(i)DNA(i+1)DNA(i+2) = codon(i) → AA(k) where DNA(i) is the i-th letter in DNA array, codon(i) is the i-th codon (one of the three-letter DNA bases shown in Table 2), and AA(i) the corresponding single letter symbol of amino acid (according to Table 2). Thus, ∀codon(i) ∈ {AAA, AAC, AAG, AAT, ACA, ACC, ACG, ACT, AGA, AGC, AGG, AGT, ATA, ATC, ATG, ATT, CAA, CAC, CAG, CAT, CCA, CCC, CCG, CCT, CGA, CGC, CGG, CGT, CTA, CTC, CTG, CTT, GAA, GAC, GAG, GAT, GCA, GCC, GCG, GCT, GGA, GGC, GGG, GGT, GTA, GTC, GTG, GTT, TAA, TAC, TAG, TAT, TCA, TCC, TCG, TCT, TGA, TGC, TGG, TGT, TTA, TTC, TTG, TTT}. Moreover, following protein-forming rules hold:
  • IF codon(i) ∈ {ATT, ATC, ATA} THEN protein(i) = I
  • IF codon(i) ∈ {CTT, CTC, CTA, CTG, TTA, TTG} THEN protein(i) = L
  • IF codon(i) ∈ {GTT, GTC, GTA, GTG} THEN protein(i) = V
  • IF codon(i) ∈ {TTT, TTC} THEN protein(i) = F
  • IF codon(i) ∈ {ATG} THEN protein(i) = M
  • IF codon(i) ∈ {TGT, TGC} THEN protein(i) = C
  • IF codon(i) ∈ {GCT, GCC, GCA, GCG} THEN protein(i) = A
  • IF codon(i) ∈ {GGT, GGC, GGA, GGG} THEN protein(i) = G
  • IF codon(i) ∈ {CCT, CCC, CCA, CCG} THEN protein(i) = P
  • IF codon(i) ∈ {ACT, ACC, ACA, ACG} THEN protein(i) = T
  • IF codon(i) ∈ {TCT, TCC, TCA, TCG, AGT, AGC} THEN protein(i) = S
  • IF codon(i) ∈ {TAT, TAC} THEN protein(i) = Y
  • IF codon(i) ∈ {TGG} THEN protein(i) = W
  • IF codon(i) ∈ {CAA, CAG} THEN protein(i) = Q
  • IF codon(i) ∈ {AAT, AAC} THEN protein(i) = N
  • IF codon(i) ∈ {CAT, CAC} THEN protein(i) = H
  • IF codon(i) ∈ {GAA, GAG} THEN protein(i) = E
  • IF codon(i) ∈ {GAT, GAC} THEN protein(i) = D
  • IF codon(i) ∈ {AAA, AAG} THEN protein(i) = K
  • IF codon(i) ∈ {CGT, CGC, CGA, CGG, AGA, AGG} THEN protein(i) = R
  • IF codon(i) ∈ {TAA, TAG, TGA} THEN protein(i) = X
Step 4: This is the last step. It consists of Processes 6 and 7 and generates a solution to solve the problem. In this case, the information of the protein array (both sequential information and frequency-driven information) is used to extract problem-solving rules. Here, sequential information means whether a particular amino acid sequence occurs. Frequency-driven information means which amino acids are predominant, which are not, and which are absent in the protein array. See Section 4 for examples of problem-solving rules.
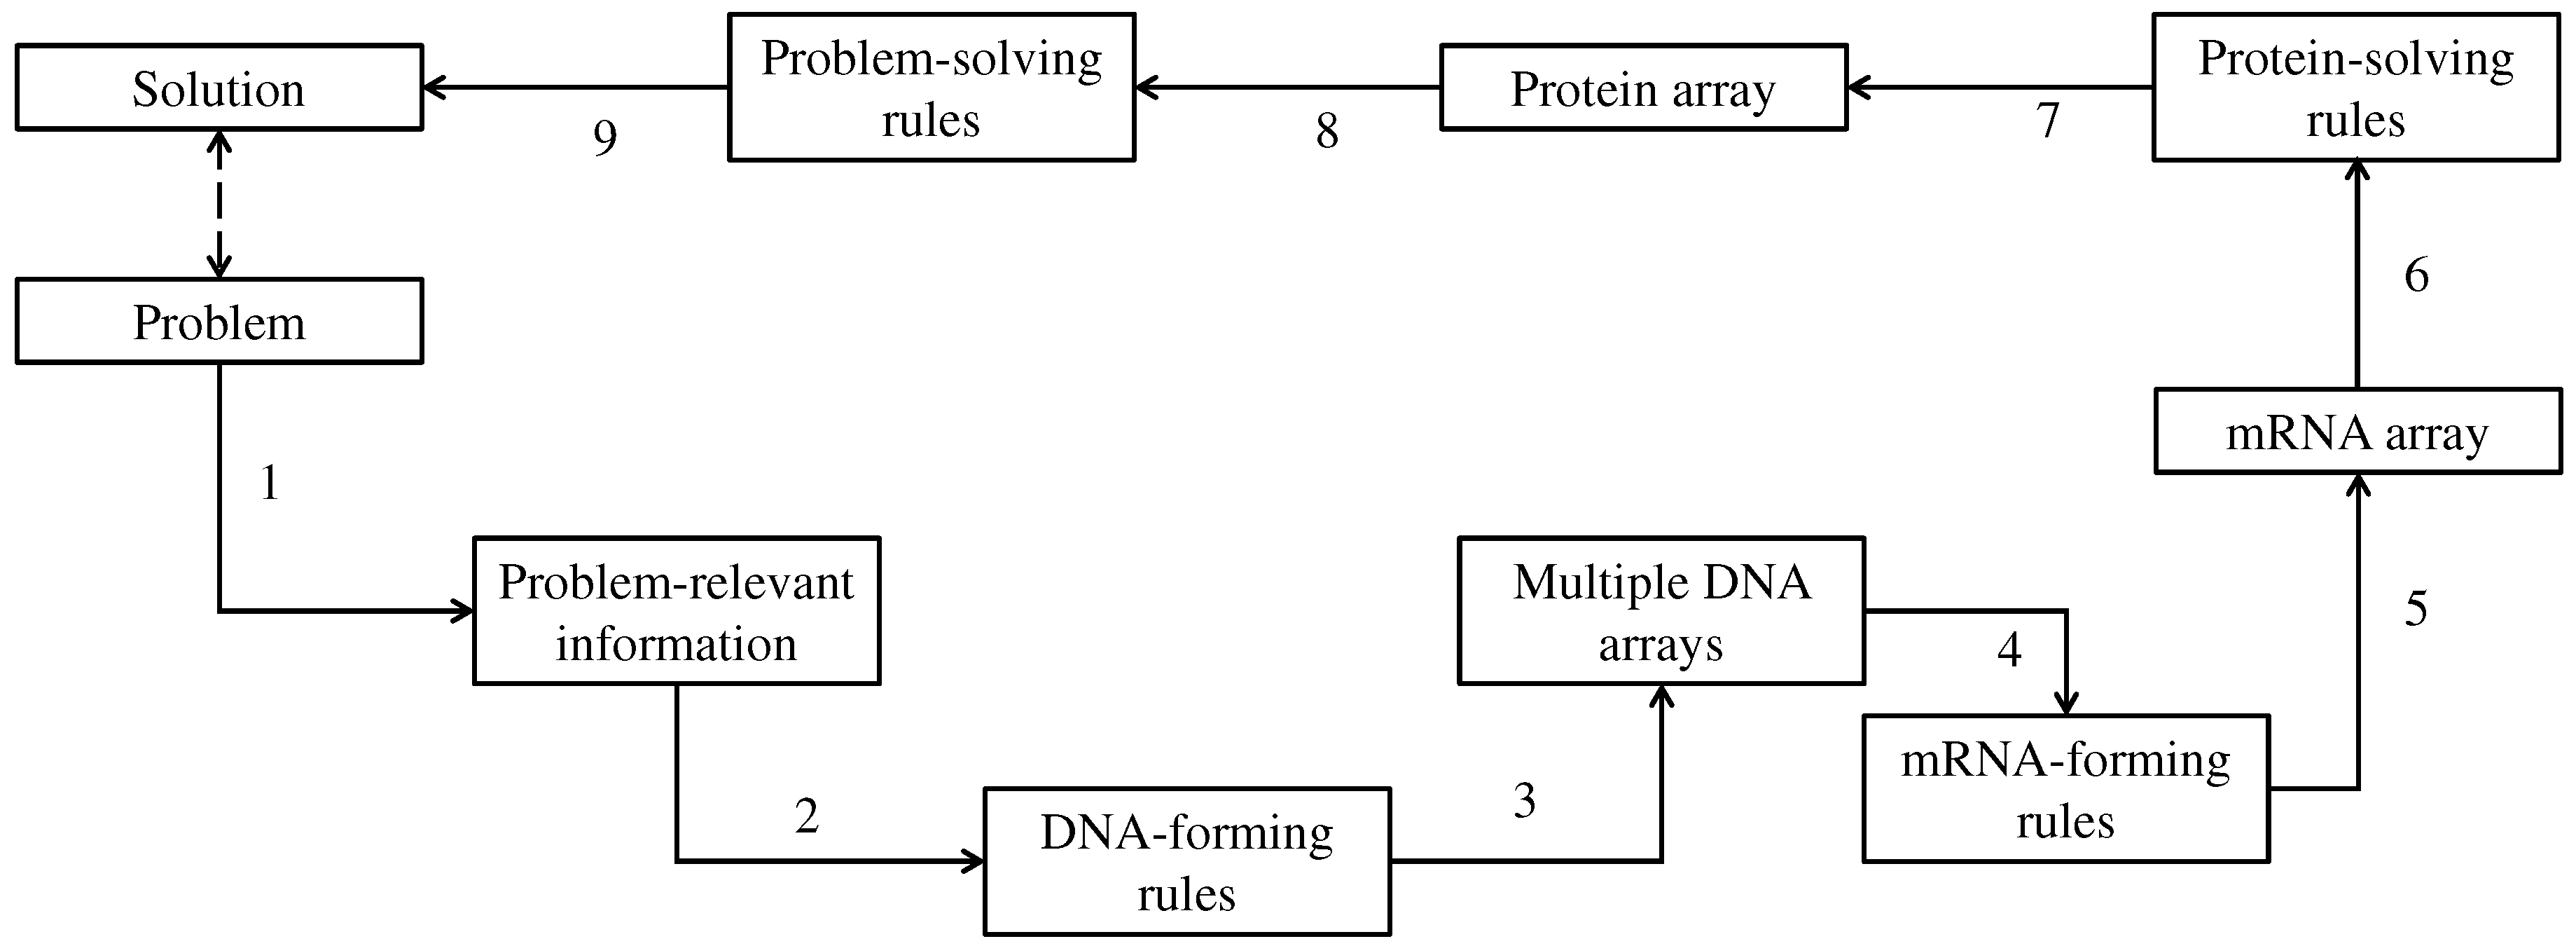
The other form of DBC, DBC-2, is schematically illustrated in Figure 3.
Compared to DBC-1, DBC-2 has an additional functionality to deal with mRNA-forming rules and mRNA array. In addition, it produces multiple DNA array unlike DBC-2. Consequently, DBC-2 consists of five steps and nine processes. The description is as follows.
Step 1: This step consists of Process 1 and produces problem-relevant information from a given problem. Thus, this step is similar to that of Step 1 of DBC-1.
Step 2: This step consists of Processes 2 and 3 and generates multiple DNA arrays using different DNA-forming rules. Recall the arbitrary example of the DNA array of DBC-1 where <0000111001110000011111111> is converted to <AATGCTAACTTT> using the following DNA-forming rules: DNA translation rules: 00 → A, 01 → C, 10 → G, and 11 → T; truncation/addition scheme: truncation; and pair-wise reading frame. If a different DNA translation is used, i.e., 11 → A, 01 → C, 10 → G, and 00 → T, keeping truncation/addition and reading frame the same, then the following DNA array results <TTAGCATTCAAA>. Similarly, if another different DNA translation is used, i.e., 11 → A, 10 → C, 01 → G, and 00 → T, keeping truncation/addition and reading frame the same, then the following DNA array results <TTACGATTGAAA>. This way, multiple DNA arrays can be produced from a single piece of problem-relevant information.
Step 3: This step consists of Processes 4 and 5 and generates an mRNA array using mRNA-forming rules. The mRNA-forming rules determine how to integrate the DNA arrays produced in the previous step while generating an mRNA array. For example, consider the following formulation. Let the DNA arrays be DNA1 = <AATGCTAACTTT>, DNA2 = <TTAGCATTCAAA>, and DNA3 = <TTACGATTGAAA>. An mRNA-forming rule is: mRNA = <DNA1DNA2DNA3>, i.e., mRNA = < AATGCTAACTTTTTAGCATTCAAATTACGATTGAAA>. This type of mRNA-forming rule is denoted as the direct addition rule, and the resulting mRNA is denoted as directly added mRNA. There are other alternatives, too. For example, consider the case of mRNA array denoted as a cascaded mRNA, where a cascading rule is applied to integrate the elements of DNA arrays, as follows: mRNA = <…mRNA(j)mRNA(j+1)mRNA(j+2)…> = <…DNA1(i)DNA2(i)DNA3(i)…> = <ATTATTTAAGGCCCGTAAATTATTCCGTAATAATAA>.
Step 4: This step consists of Processes 6 and 7 and produces a protein array that consists of single-letter symbols of amino acids. This step is similar to Step 3 of DBC-1. The only difference is it operates on mRNA array not on the DNA array(s). Thus, this step is similar to that of Step 1 of DBC-1.
Step 5: This is the last step. It consists of Processes 8 and 9 and generates a solution to solve the problem. It is similar to Step 4 of DBC-1.
Other than DBC-1 and DBC-2, other forms of DBC can be developed based on the basic principle: get a many-element piece of information (similar to protein) from a few-element piece of information (similar to DNA). One of the remarkable things is that a user has much freedom to customize DBC for a given problem. This freedom is exercised by fixing the DAN-forming, mRNA-forming, protein-forming, and problem-solving rules. Protein-forming rules are fixed unless the user wants to replace the genetic rules (Table 2) with other rules that obey the abovementioned basic principle. Regarding problem-solving rules, DBC must not act like a black-box type machine learning algorithm (e.g., artificial neural network). The focus is on engaging human users with the problems they want to solve. The case studies presented in the next section shed light on the performance and characteristics of DBC described above.

4. Results

This section presents three arbitrary illustrative examples showing the cognitive computing ability of DBC-1 and DBC-2. The first example deals with similarity indexing between seemingly different but inherently the same objects. The second example deals with recognizing two regions of an image separated by a complex boundary. The last example deals with pattern recognition when the relevant information is insufficient.

4.1. Similarity Indexing

In many smart manufacturing applications, it is necessary to exchange decision-relevant information among independent workspaces. In this case, similarity indexing between seemingly different but inherently the same objects can help build trust in the information exchanged [17]. Ullah et al. [17] and D’Addona et al. [18] used DBC to index seemingly different but inherently identical images. This subsection presents the key aspects of the DBC-based indexing procedure. For the sake of better understudying a well-knowledge shape (tree) modeled by fractal geometry [26] is considered.
Figure 4 shows four samples of the tree. A set of 1000 points is used to represent each tree. The mathematical settings for generating the points can be found in [27]. Since a stochastic process is involved, the positions of the points are not the same for the trees, but they collectively represent the same object (a tree). This similarity of these trees can be verified using DBC-1. The description is as follows.
Figure 3. Four trees each represented by 1000 points. (a)-(d) Four trees wherein each tree is modeled by 1000 points generated stochastically using fractal geometry.
Preprints 88590 g003a
The problem here is to find out the similarity of the trees (Figure 3) in a quantitative manner using DBC-1. Table 3 summarizes the settings of DBC-1 used in this case.
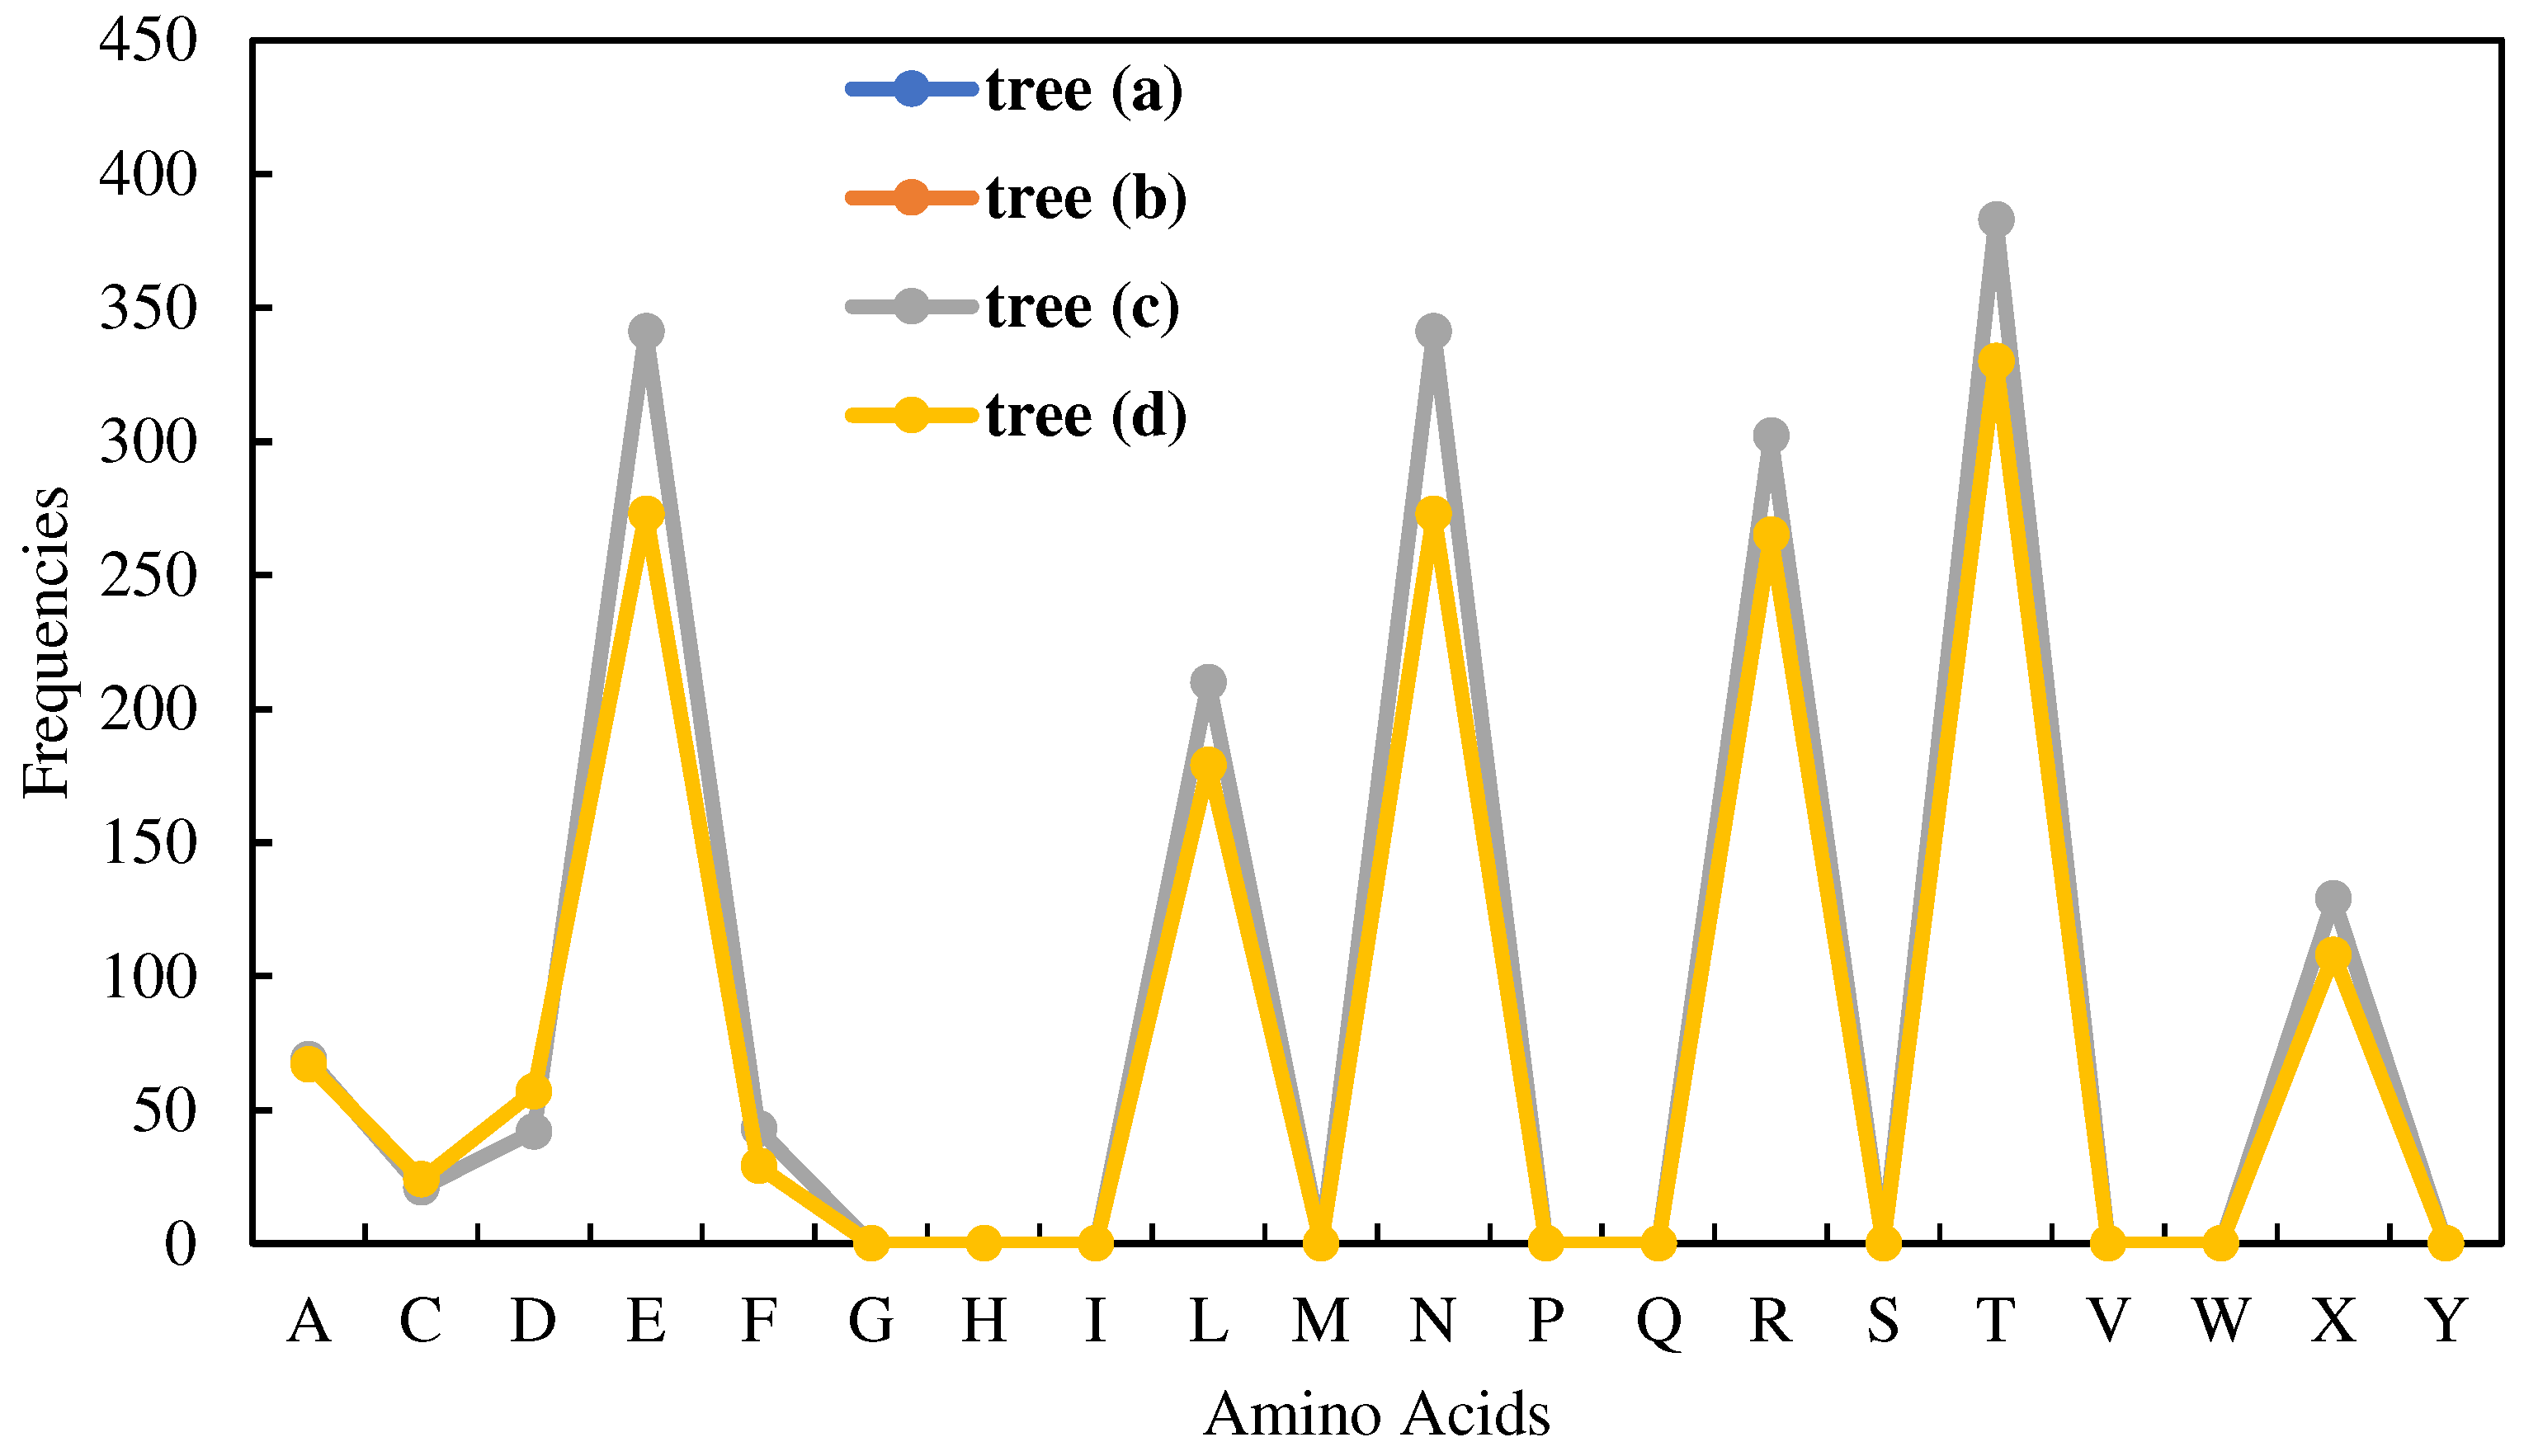
The frequencies (fr(.)) of amino acids (except K) are plots as shown in Figure 4. It is found that the frequencies of K are the same (8016) for trees (a),…,(c), whereas it is 8293 for tree (d). Since the frequency of K is very large compared to those of others for each tree, the frequencies of other amino acids (except K) are plotted as shown in Figure 4 to understand the variability in the frequencies for different trees. These plots also help extract rules for solving the problem (similarity indexing). In synopsis, the following rules are extracted from the proteins of the trees. This way a set of transparent and human-comprehensible rules can be extracted from the sequential and frequential states of the amino acids in the proteins. These rules can be used to decide whether or not the objects are similar or not. The rules extracted are summarized in Table 4 and described as follows. The zero-frequency amino acids are G, H, I, M, P, Q, S, V, W, and Y. Equal frequency amino acids are E and N. In particular, fr(E) = fr(N) = 341 for the trees in Figures 4(a)-(c) and fr(E) = fr(N) = 273 for Figure (d). In addition, the summation of frequencies of D and N is equal to the frequency of T, i.e., (fr(D) + fr(N) = fr(T) = 383 for trees Figures 4(a)-(c) and 330 for the tree in Figure 4(d)). The least frequent amino acid other than the zero-frequency ones is C. Finally, the list of amino acids in the ascending order of frequencies is as follows: fr(A) < fr(X) < fr(L) < fr(R) < fr(E) < fr(N) < fr(T). Therefore, observing whether or not the rules shown in Table 4, it can be confirmed the shapes (this time the four trees in Figure 3) are the same.

4.2. Image Processing

In some applications of smart manufacturing, image processing is needed. For example, Kubo et al. [21] performed a topographical analysis of an image of a grinding wheel using DBC to see the effectiveness of dressing operations that sharpen the wheel. Iwadate and Ullah [19] determined the outer boundary of a complex shape given by a point cloud using DBC. In such applications, stochastically distributed segments of an image must be recognized and processed to get the desired result. This can be done easily if different amino acids could have assigned the stochastically distributed segments. In doing so, some specific setting of DBC is needed. This subsection describes the specific setting using an arbitrary example as follows.
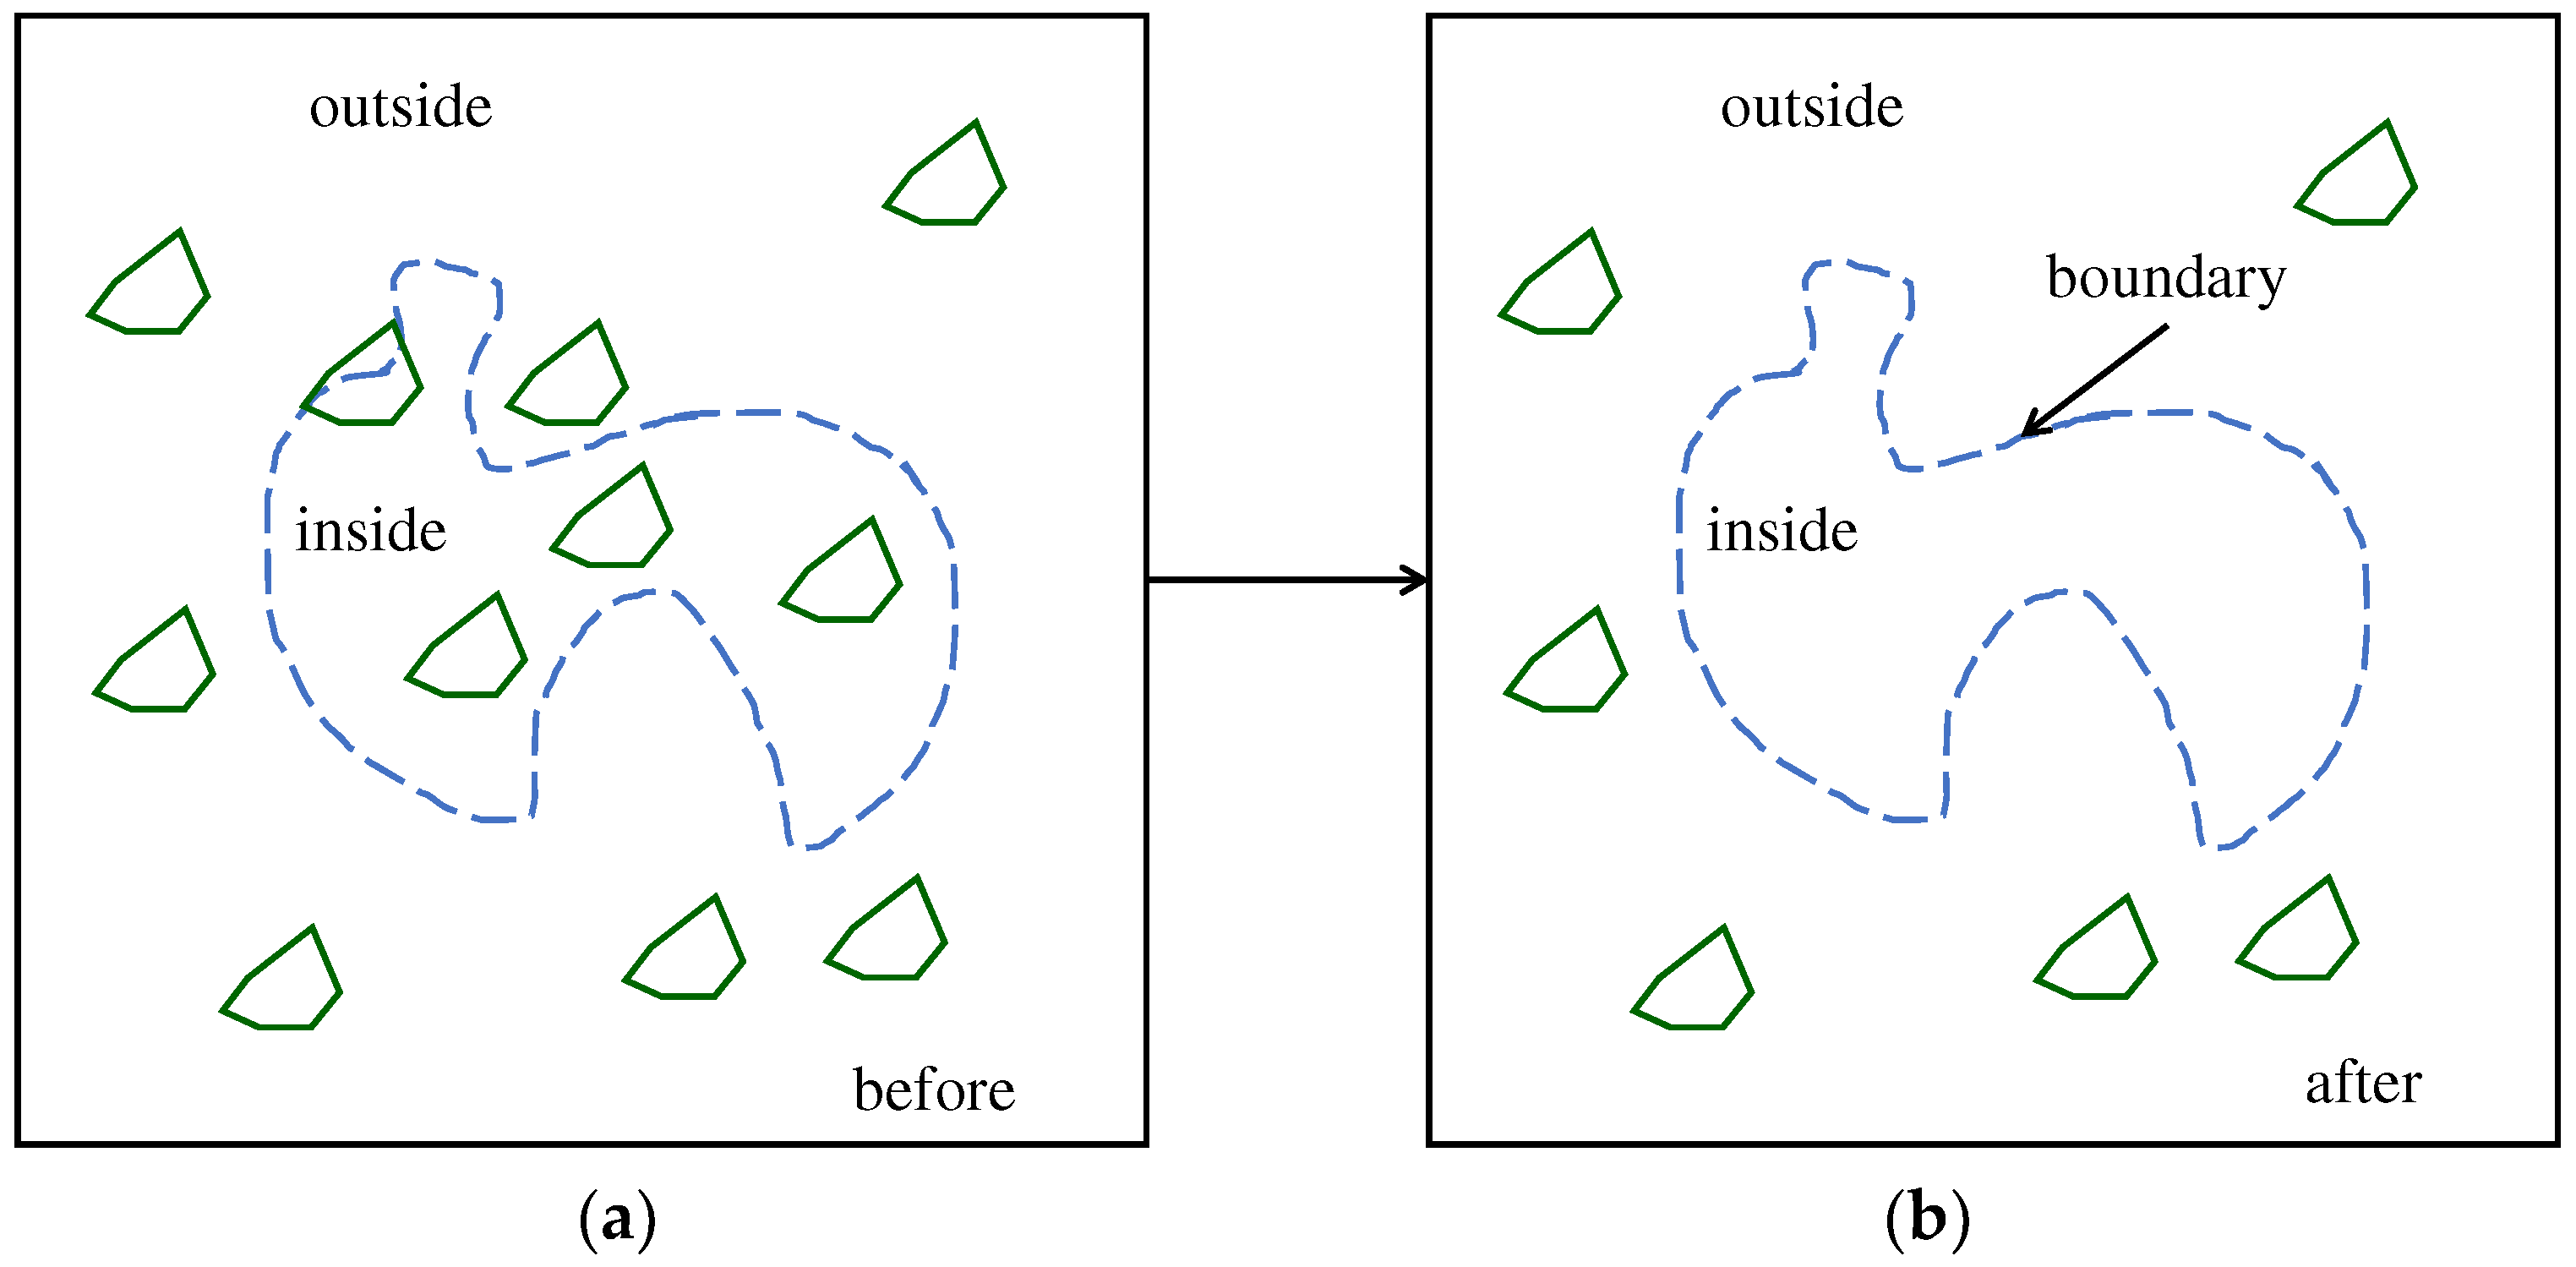
Consider an arbitrary image, as shown in Figure 5, where similar objects are inside and outside a complex boundary. How to eliminate the objects within the boundary while keeping those outside is the problem here. In other words, the problem is determining a convex or concave hull representing the boundary and doing the rest, i.e., eliminating similar objects inside the hull while keeping those outside.
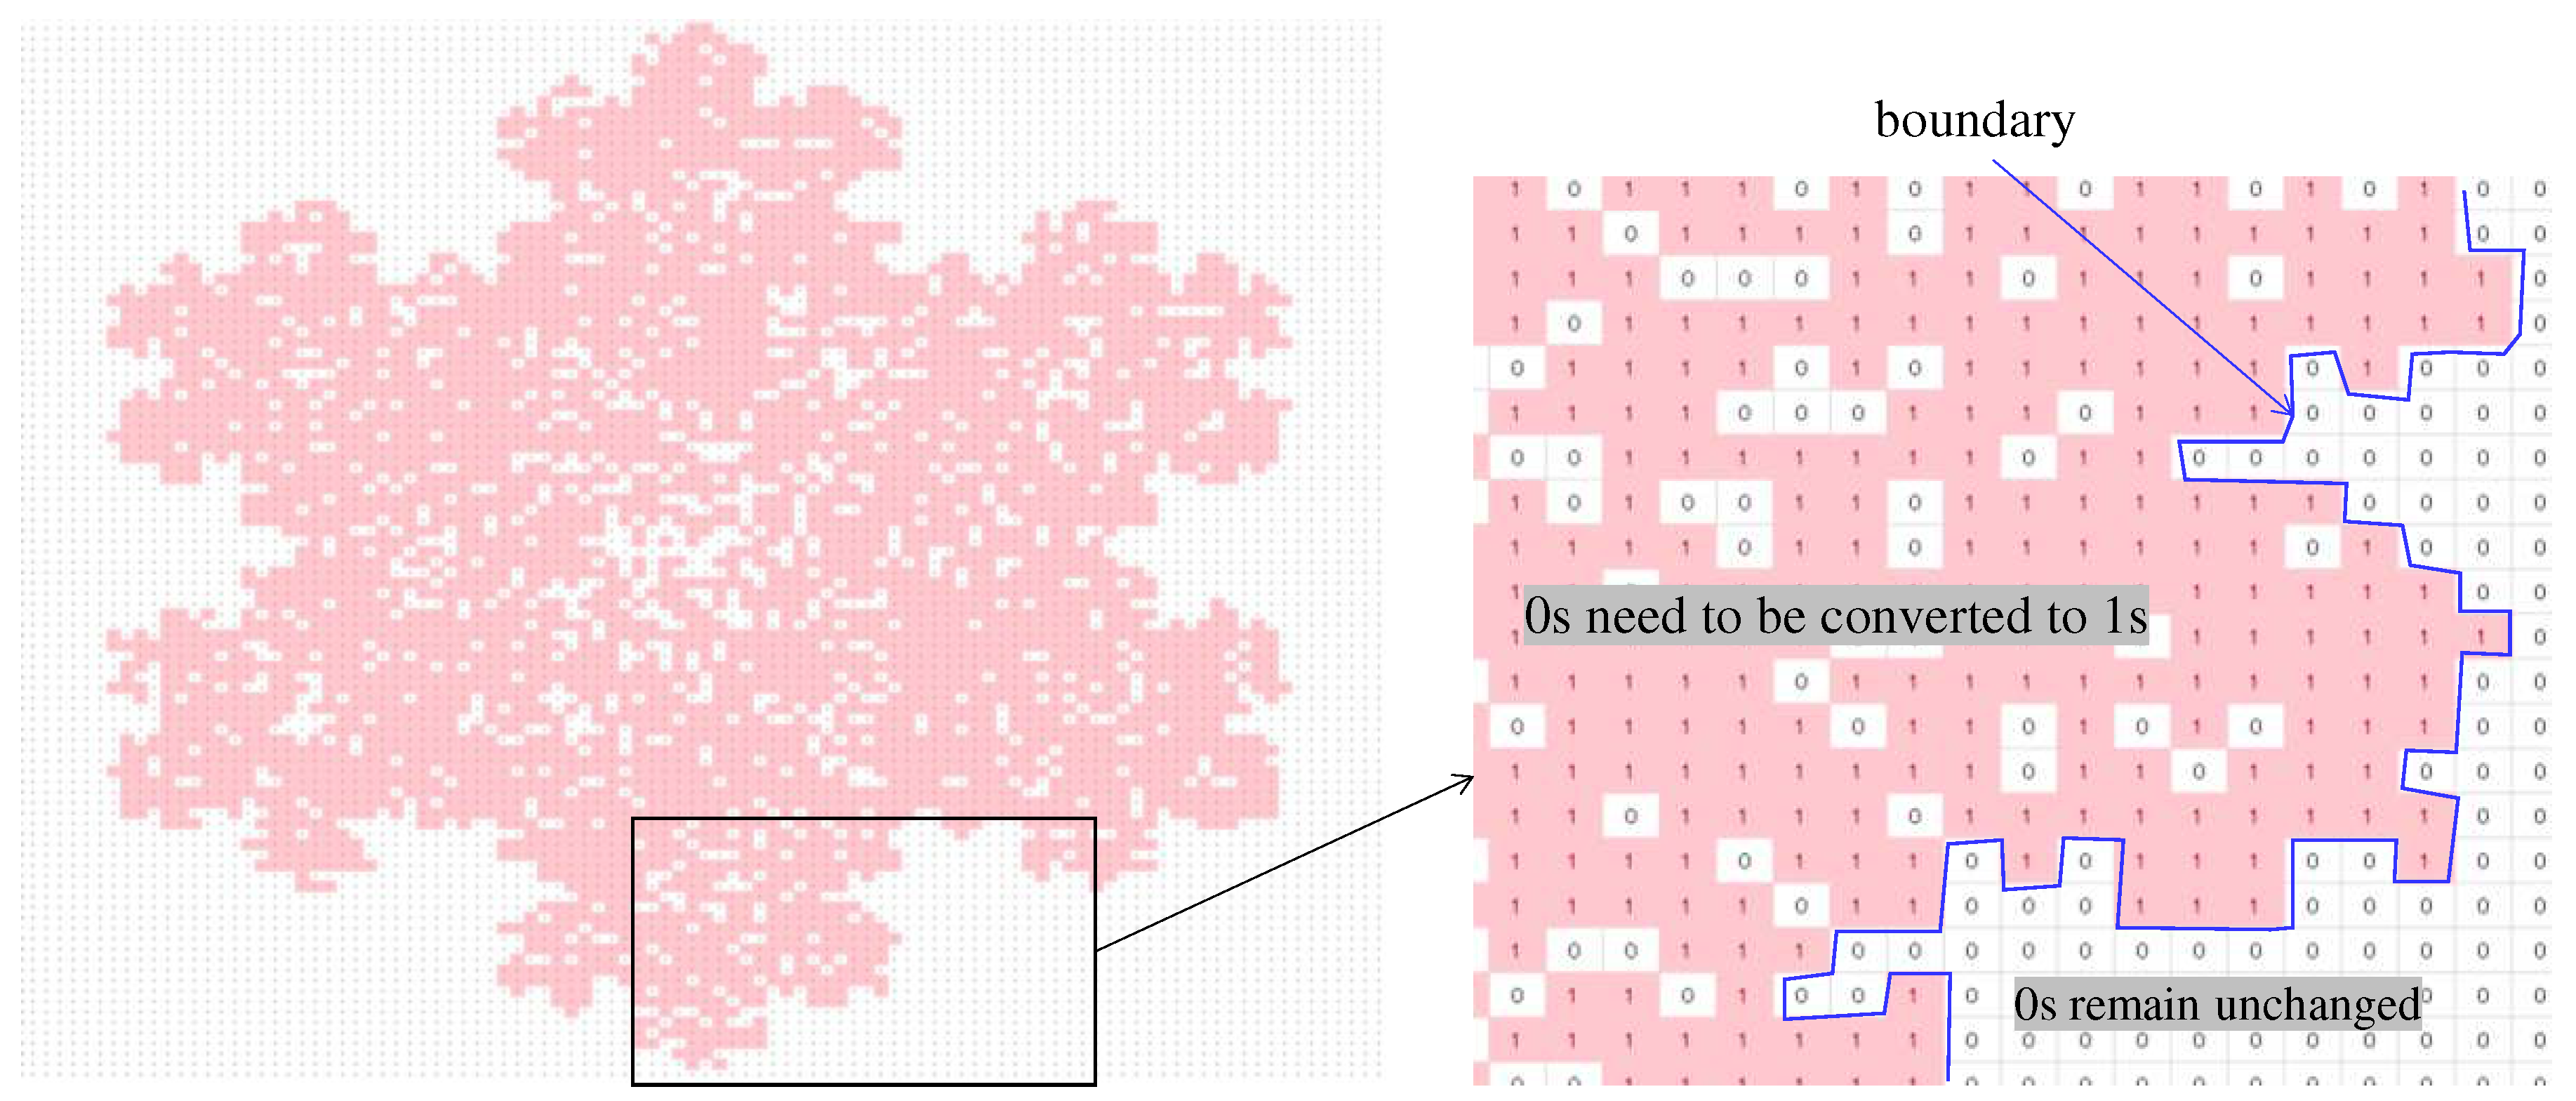
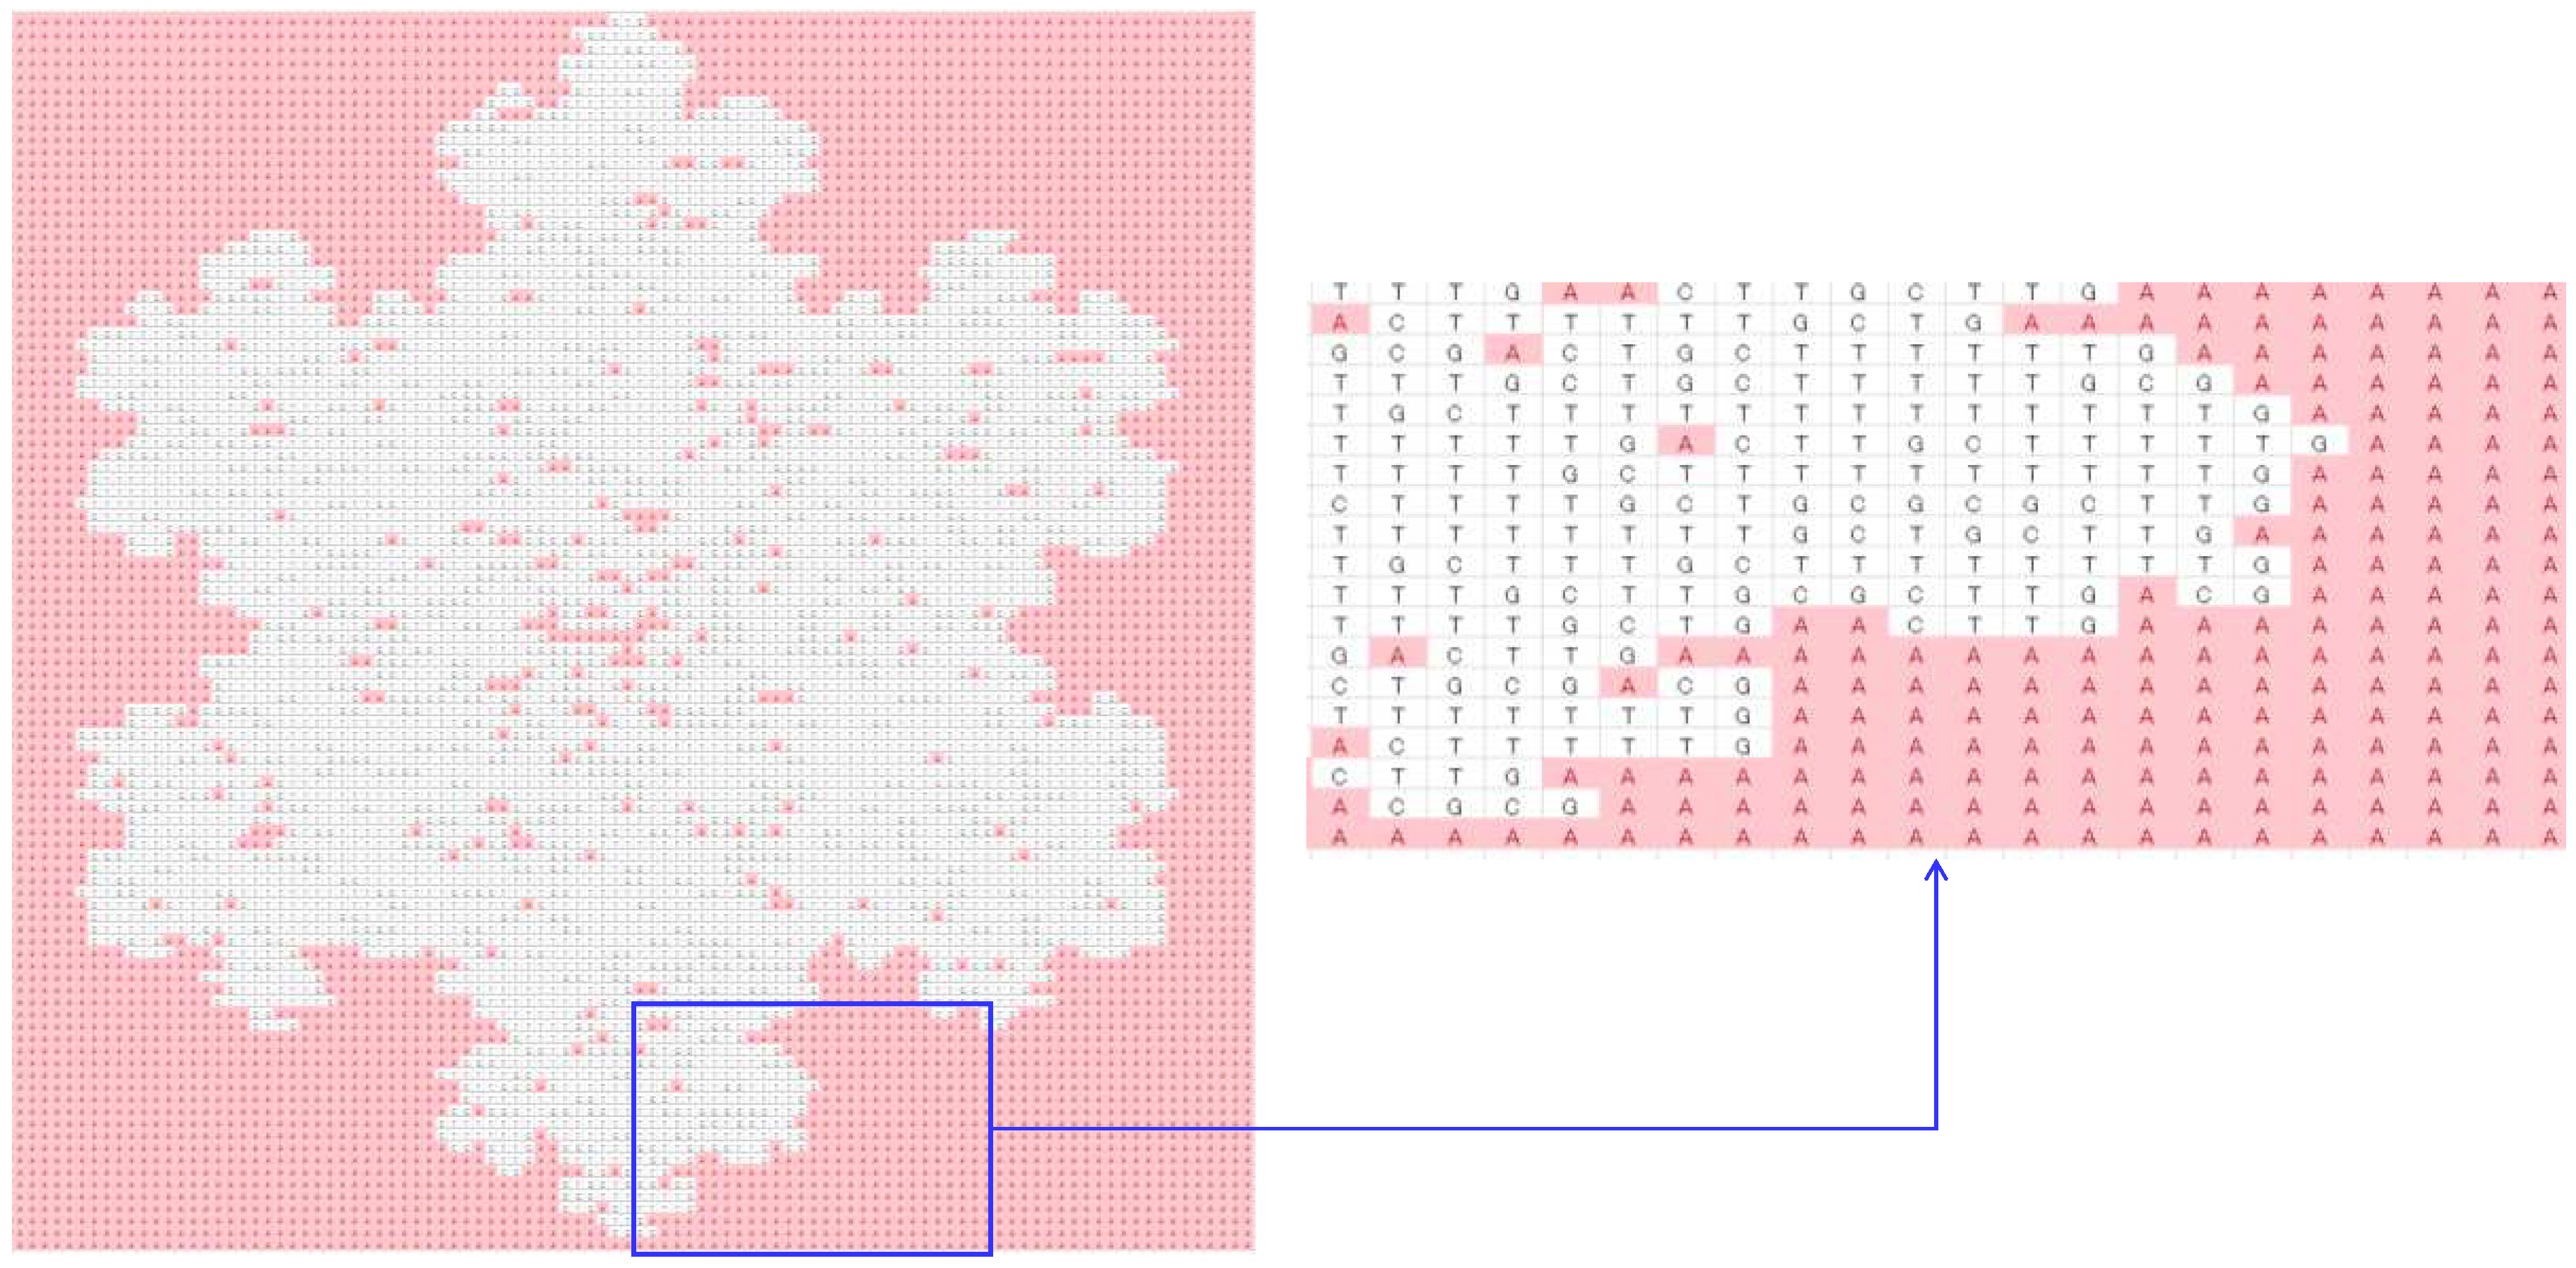
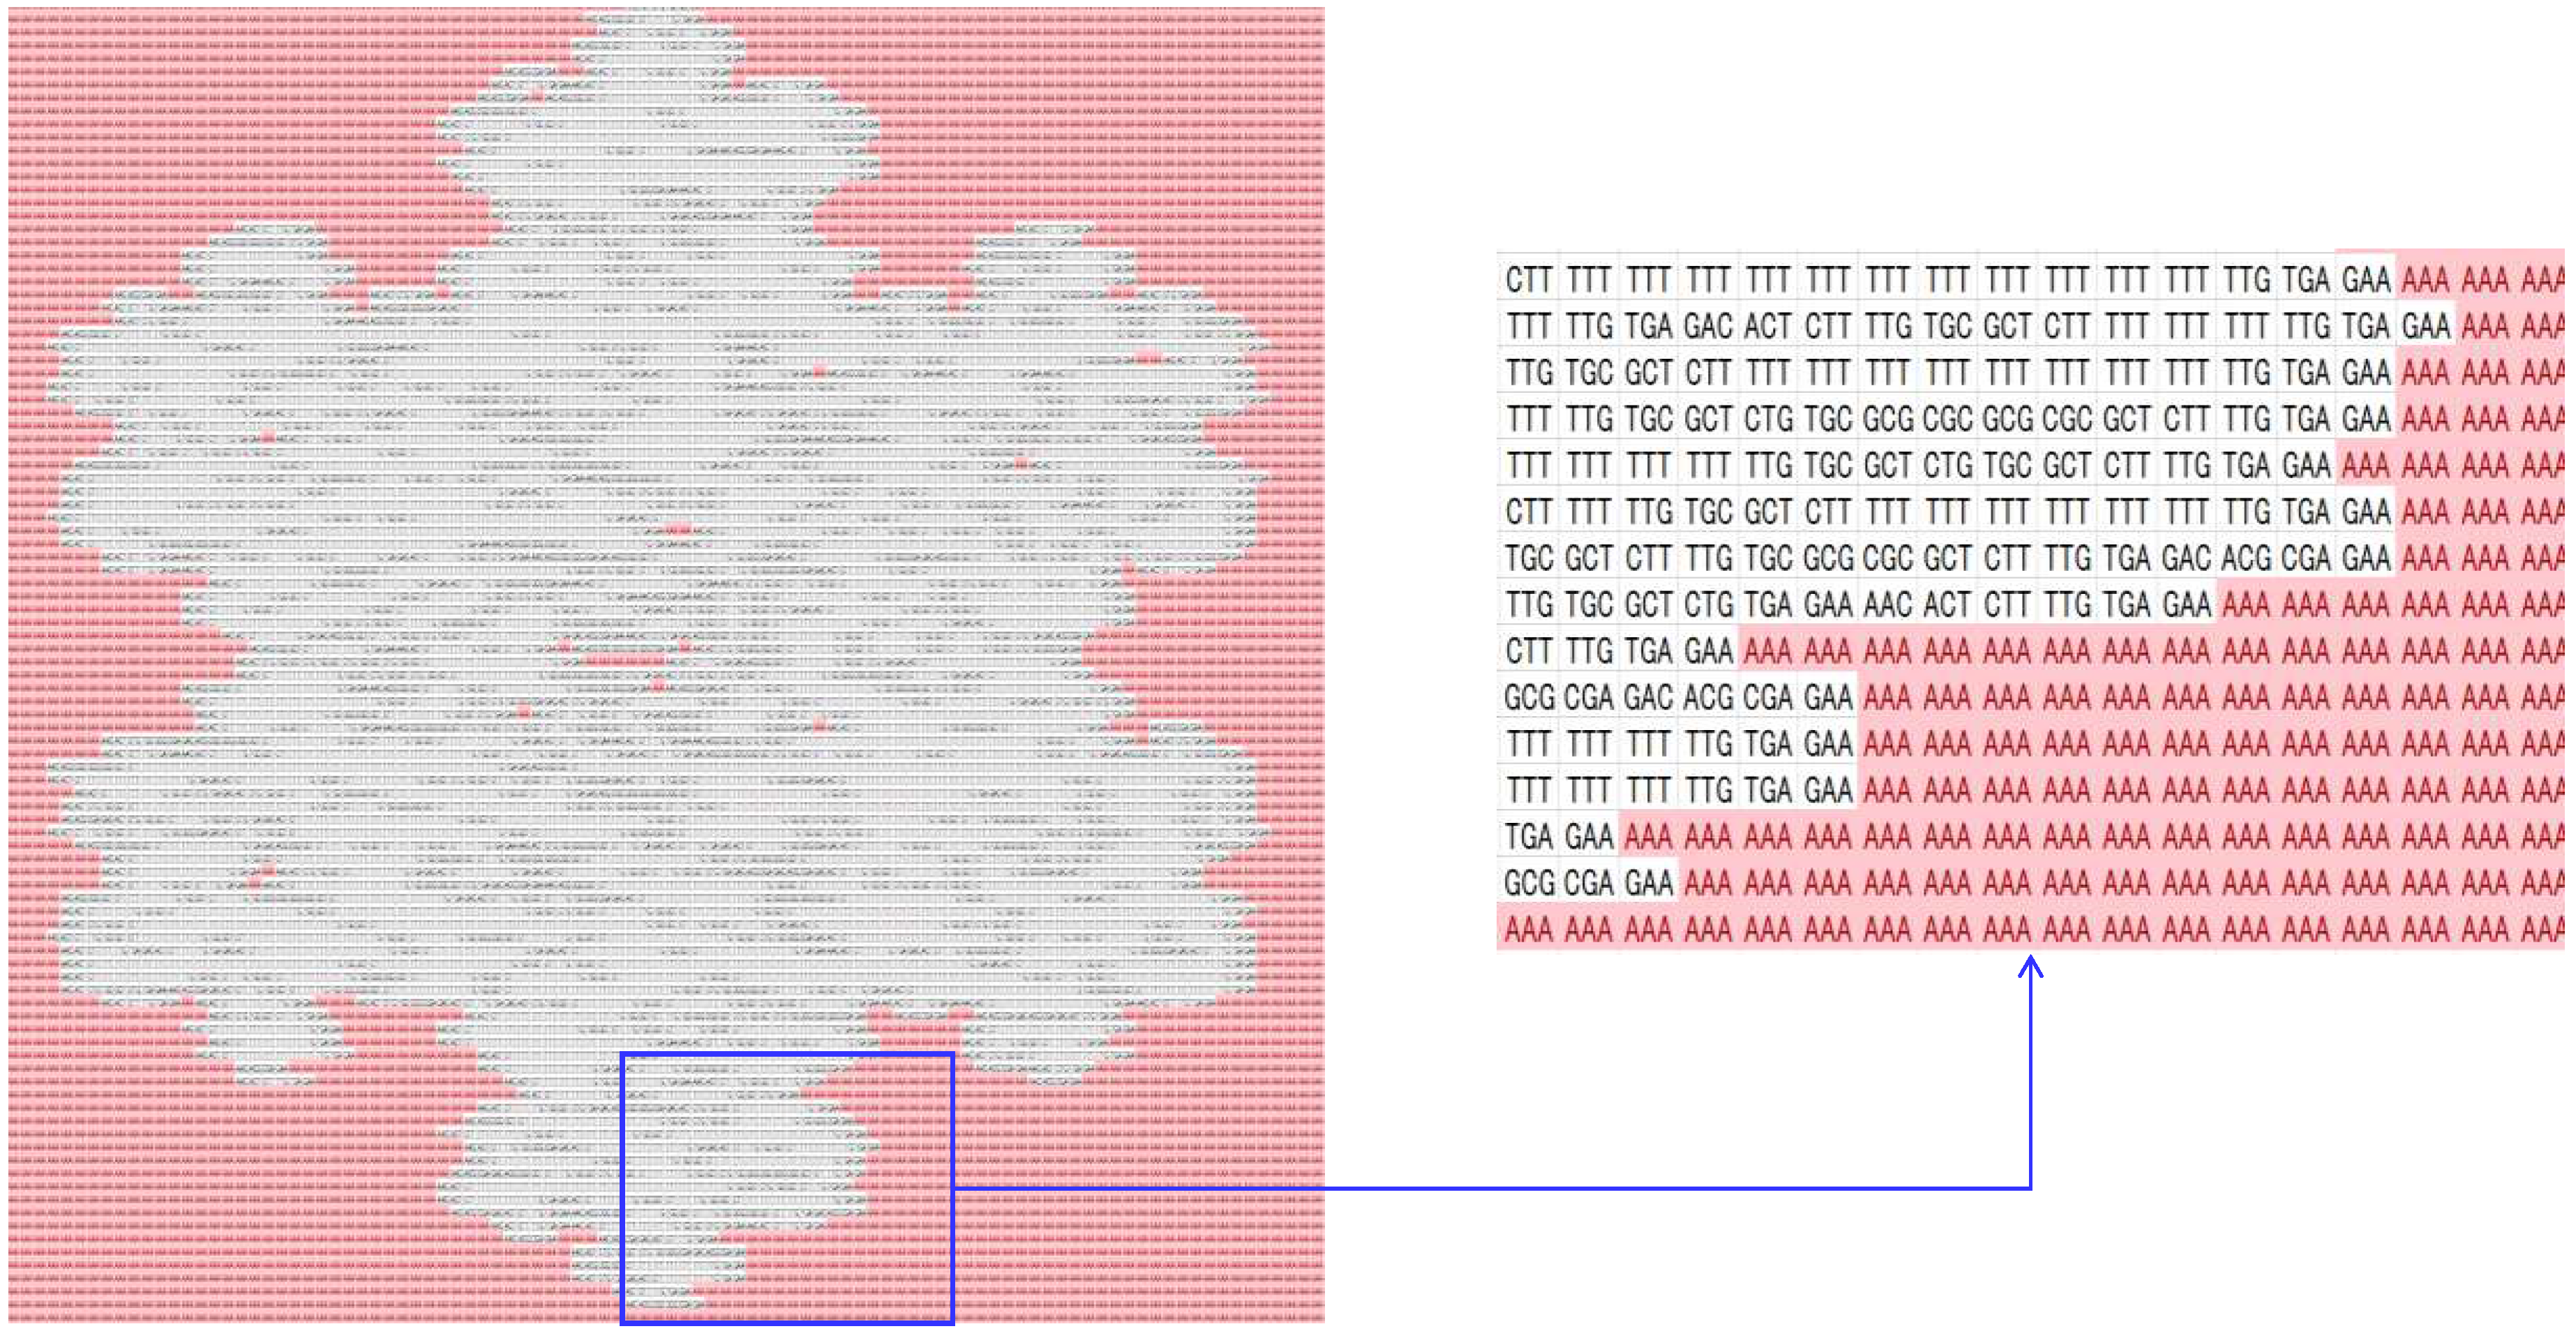
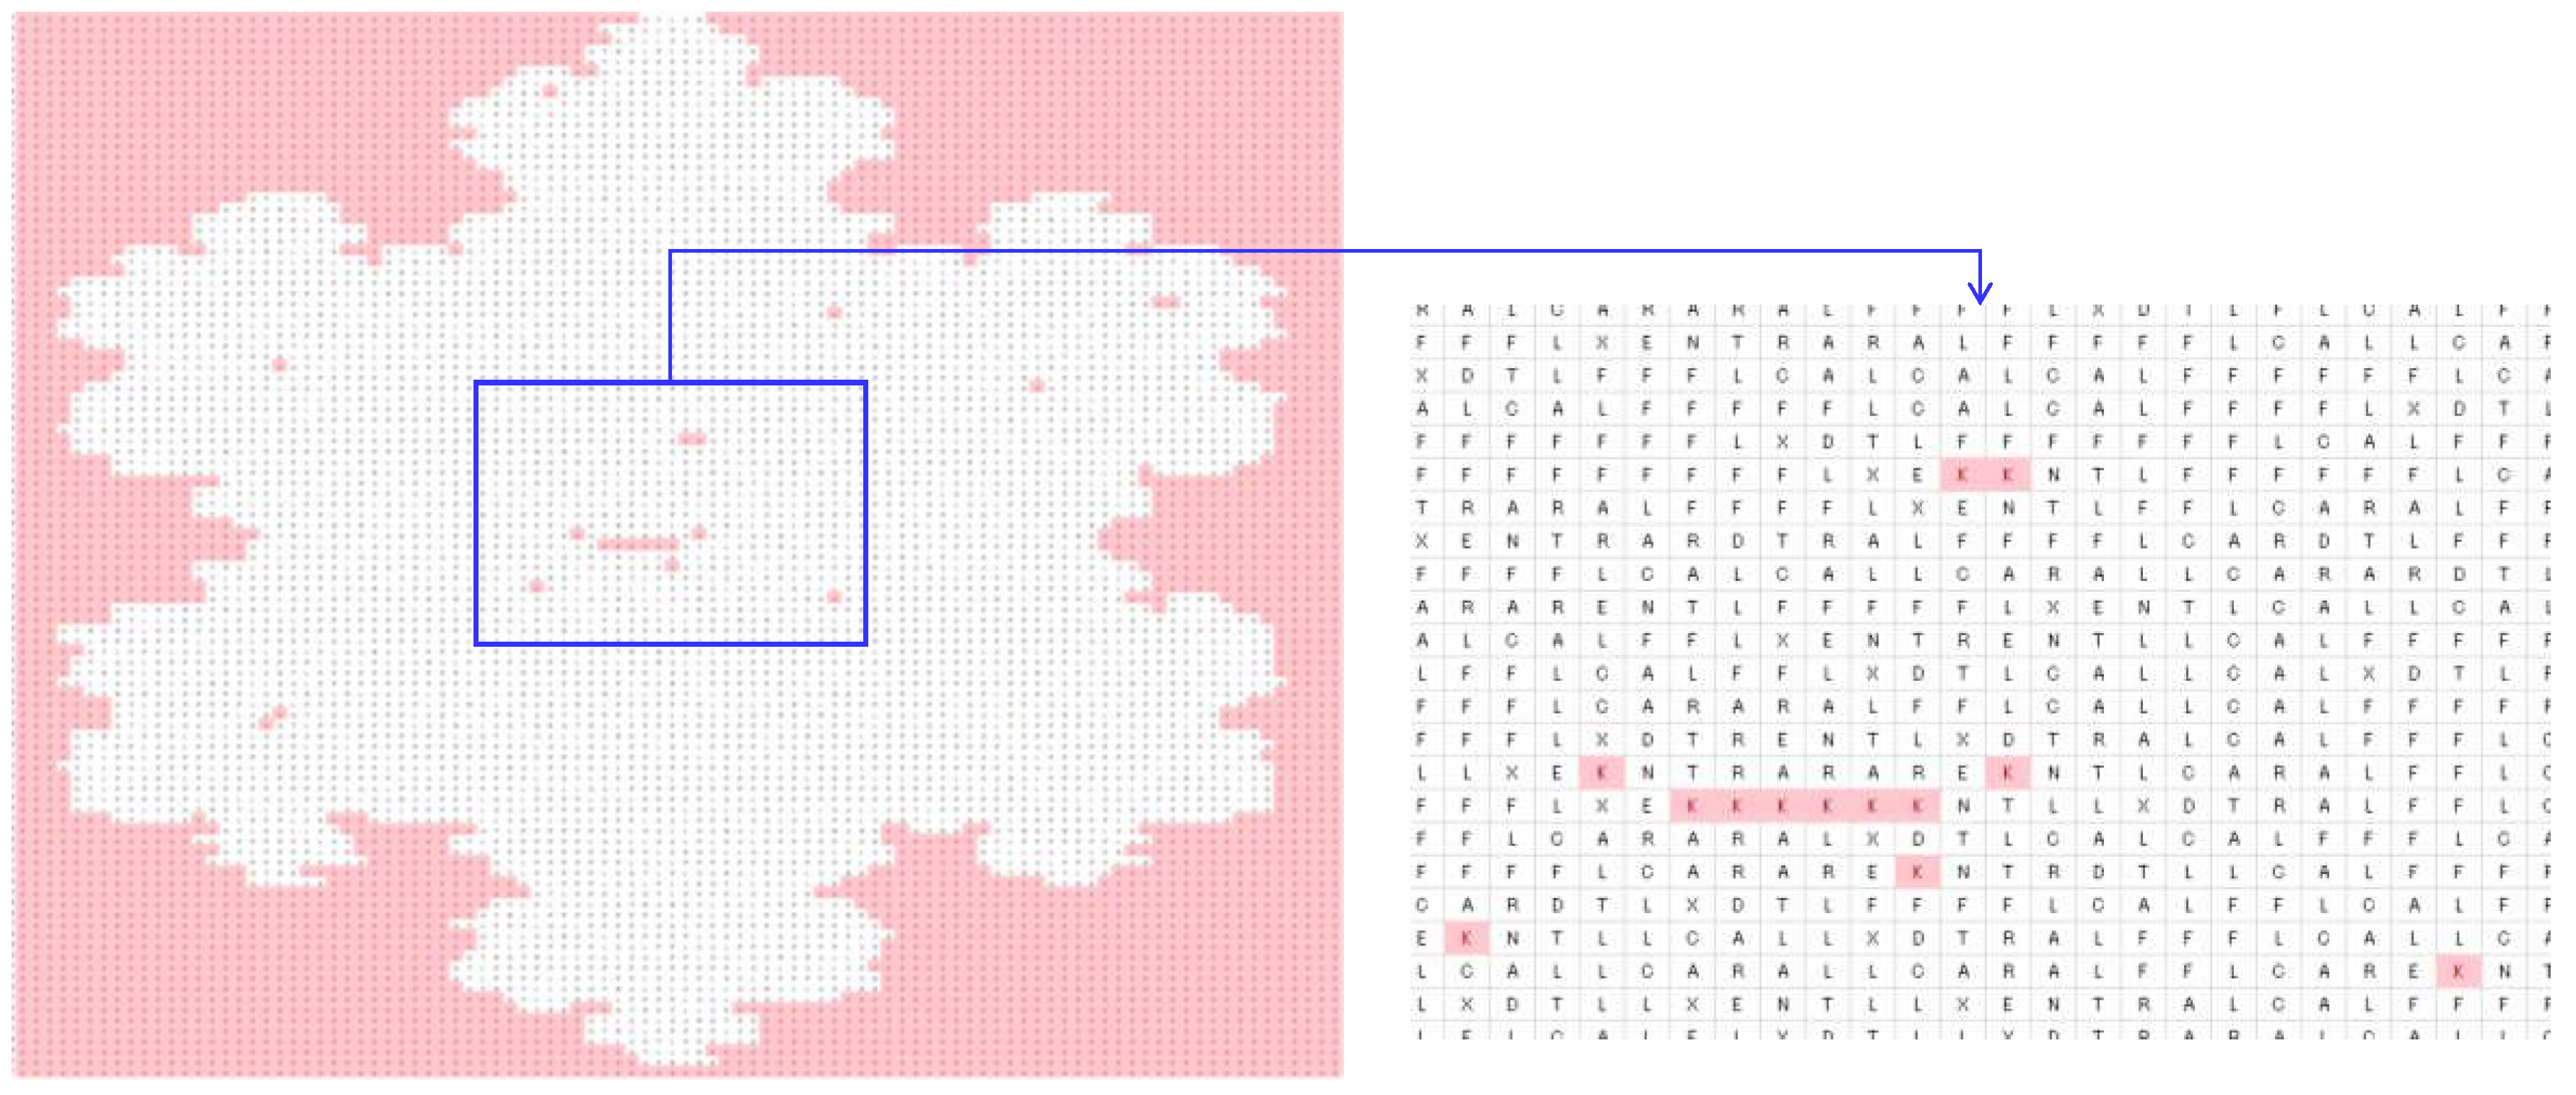
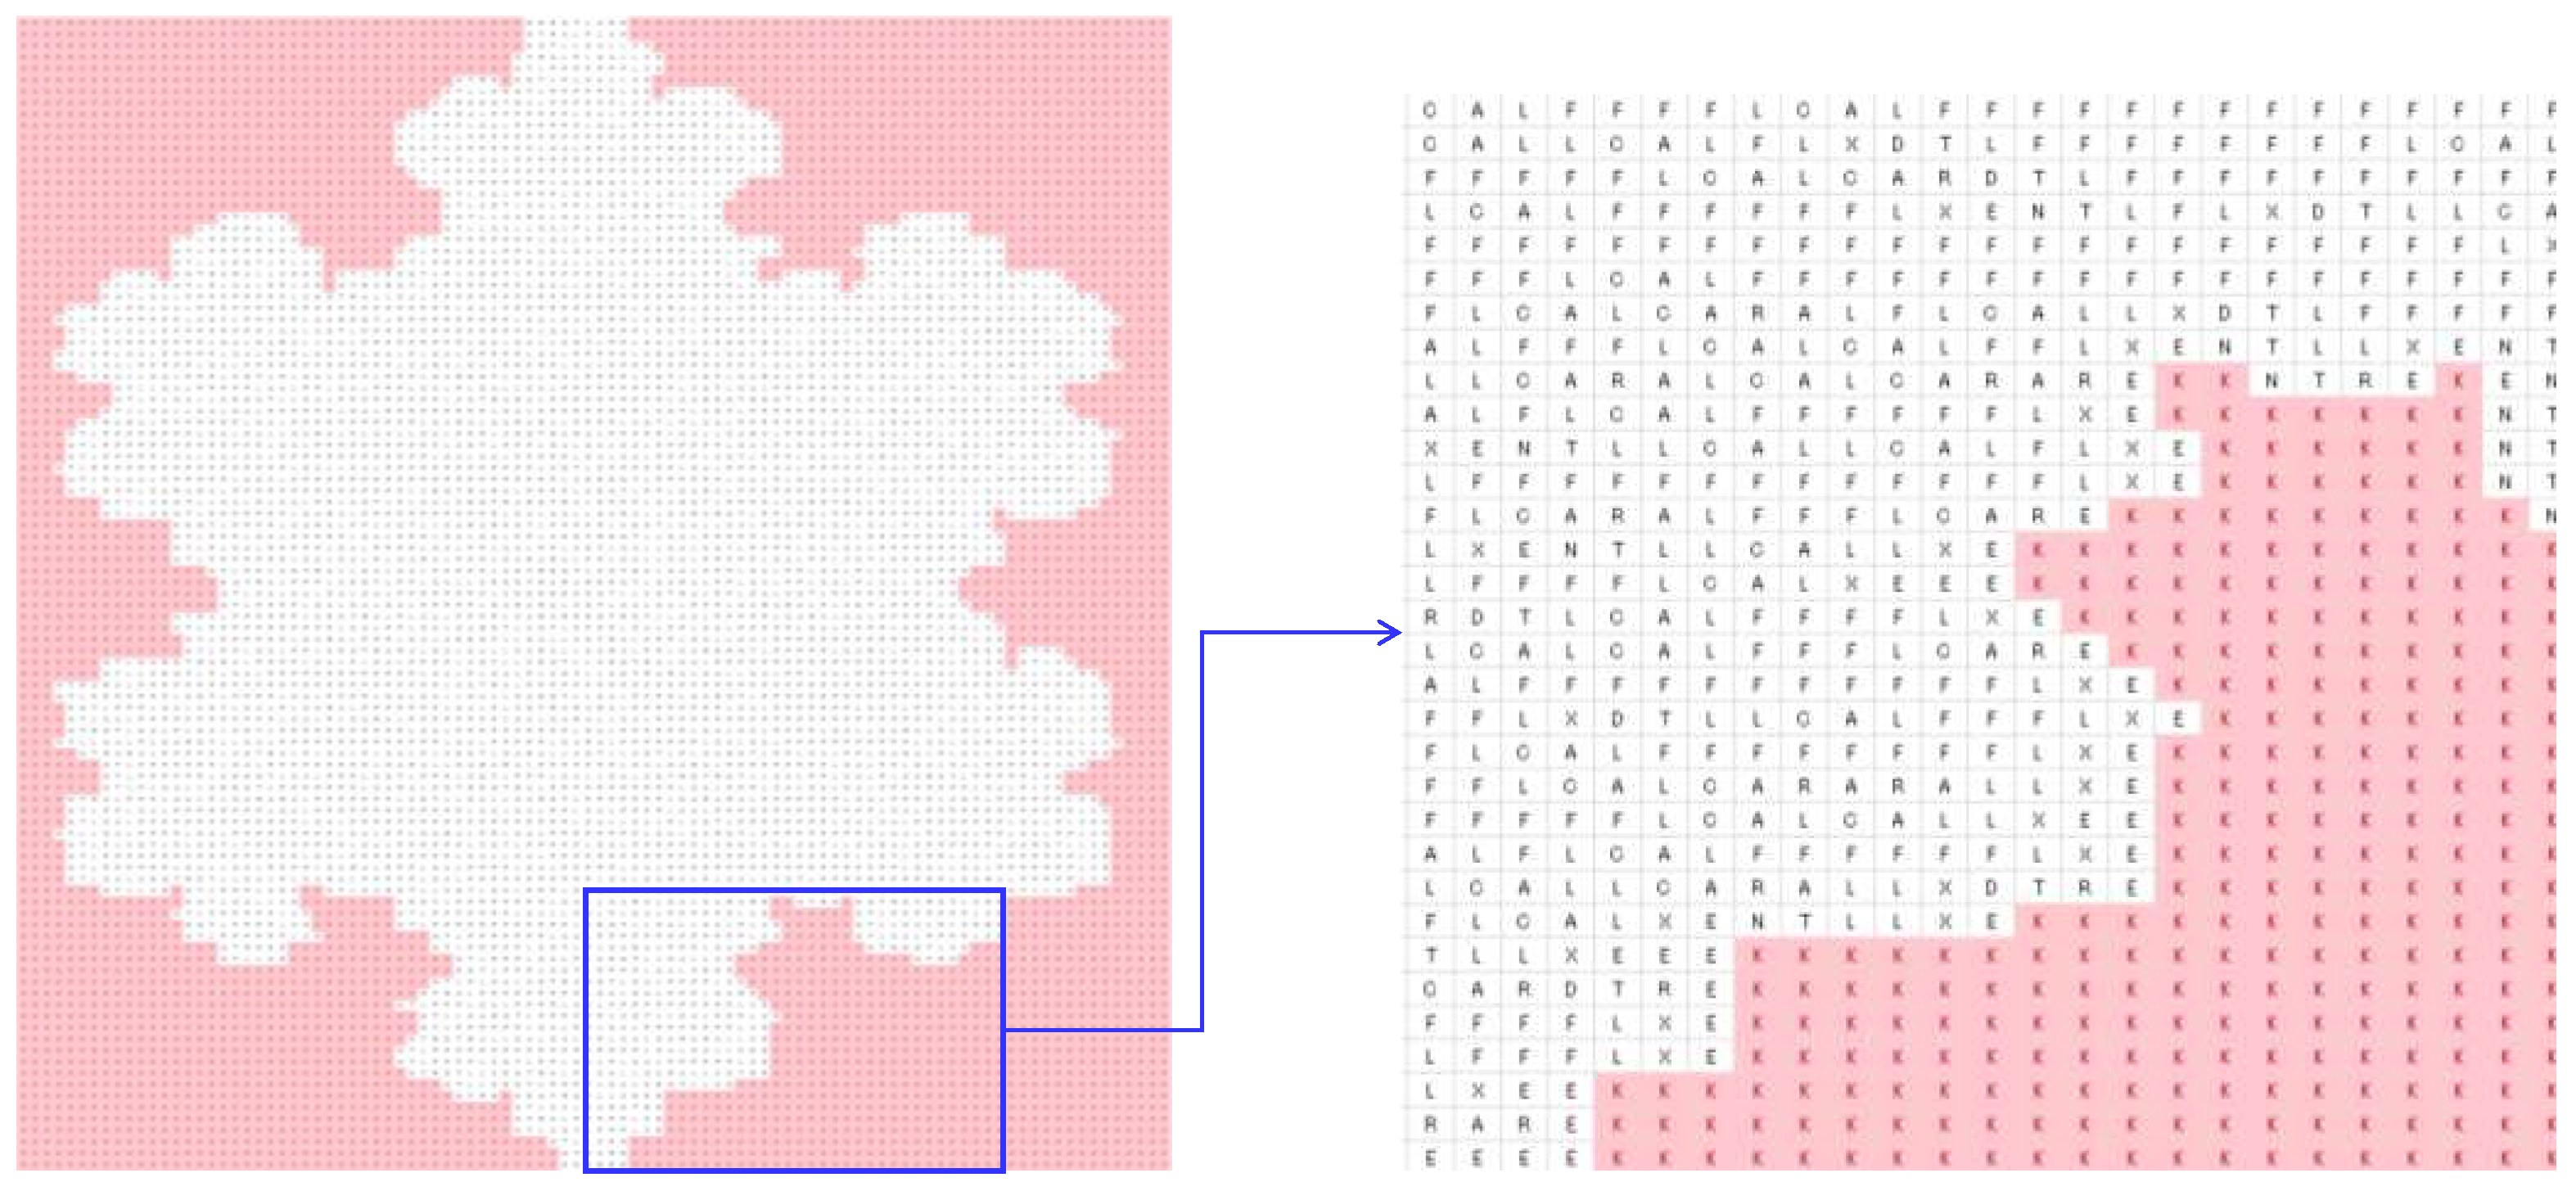
To be more specific, consider a particular case (the shape of a snowflake), as shown in Figure 6. As seen in Figure 6, the snowflake is represented by a (100 × 100) two-dimensional binary array. There are 0s inside and outside of the boundary of the snowflake, whereas 1s reside inside the snowflake only. If 0s inside the snowflake convert to 1s and 0s outside of the snowflake remain unchanged, then 1s represent the snowflake itself, and 0s represent the outside of the snowflake. Thus, the above operation results in a concave hull (boundary) that defines the geometric shape of the snowflake. In order to perform the above-mentioned concave hulling, the settings of DBC-1 shown in Table 3 can be used. This is what is done, and the results are shown in Figure 6, Figure 7, Figure 8, Figure 9 and Figure 10. Figure 7 shows the two-dimensional DNA array of the snowflake and its surroundings. Figure 8 shows the codons generated from the two-dimensional DNA array (Figure 7). Figure 9 shows the two-dimensional protein array generated from the codon array (Figure 8). As seen in Figure 9, the outside of the snowflake is occupied by the amino acid denoted as K. The inside of the snowflake is occupied by amino acids other than K, but still, there are exceptions. These few Ks inside snowflake’s boundary can be converted to an amino acid other than K using a simple rule, as follows:
( p r o t e i n i , j 1 = ¬ K p r o t e i n i , j = K p r o t e i n i , j + 1 = ¬ K c _ p r o t e i n i , j = ¬ K )
The above rule considers three consecutive amino acids from a row of the protein array, protein(i,j-1)protein(i,j)protein(i,j+1), and checks whether the middle amino acid is K and the other two are not K. If this condition is true, the middle amino acid is replaced by K. Otherwise, the rule does not make any change in the protein array. This way, a corrected protein array (c_protein) is created. Thus, the above rule is the problem-solving rule for this particular case. The corrected protein array is shown in Figure 10. As seen in Figure 10, Ks (pink color) occupy the outside area of the snowflake and amino acids other than K occupy the inside area of the snowflake. The corrected protein can be converted into a binary array making all non-Ks 1s and all Ks 0s. Consequently, this new binary array becomes the geometric model of the snowflake.

4.3. Pattern Recognition in Time Series Datasets

In smart manufacturing, manufacturing enablers come equipped with sensors that collect signals in the form of time series datasets. Machine learning methods like artificial neural networks are often employed to learn from time series datasets. The knowledge learned is then used to make informed decisions, ensuring the sustainable operations of the manufacturing enablers. The remarkable thing is that a large number of datasets are required to learn and use the knowledge due to the inherent characteristics of the abovementioned machine learning methods. Consequently, when the abovementioned machine learning-based methods are involved in a decision cycle, it slows it. This is a bottleneck because the decision cycle (learning and using required knowledge) must be very fast in smart manufacturing; otherwise, sustainable operation cannot be guaranteed. Thus, a new breed of machine learning methods is needed to support the decision cycles of smart manufacturing adequately. DBC can contribute in this regard. Ullah [16] made a study on this. Based on that study, this subsection presents the salient points of DBC when it acts as a less-data-dependent and quick machine learning method.
From the perspective of DBC, learning the underlying patterns possessed by a given time series dataset is based on one-to-one mapping. Here, one-to-one mapping means mapping a point x(t) of a time series dataset, TS = <x(t) | 0,1,…>, to an amino acid. For this reason, at least three DNA arrays are needed, and these DNA arrays must produce an mRNA based on the cascading rule (see Section 3). The DNA arrays can be the same or different ones. As a result, a codon (three consecutive letters of mRNA) represents a point (x(t)). In other words, an amino acid in the protein array (protein(t)) corresponds to a point, x(t), of a time series TS = <x(t) | 0,1,…>. Therefore, the authors recommend DBC-2 (not DBC-1) to solve the pattern recognition problems associated with time series datasets.
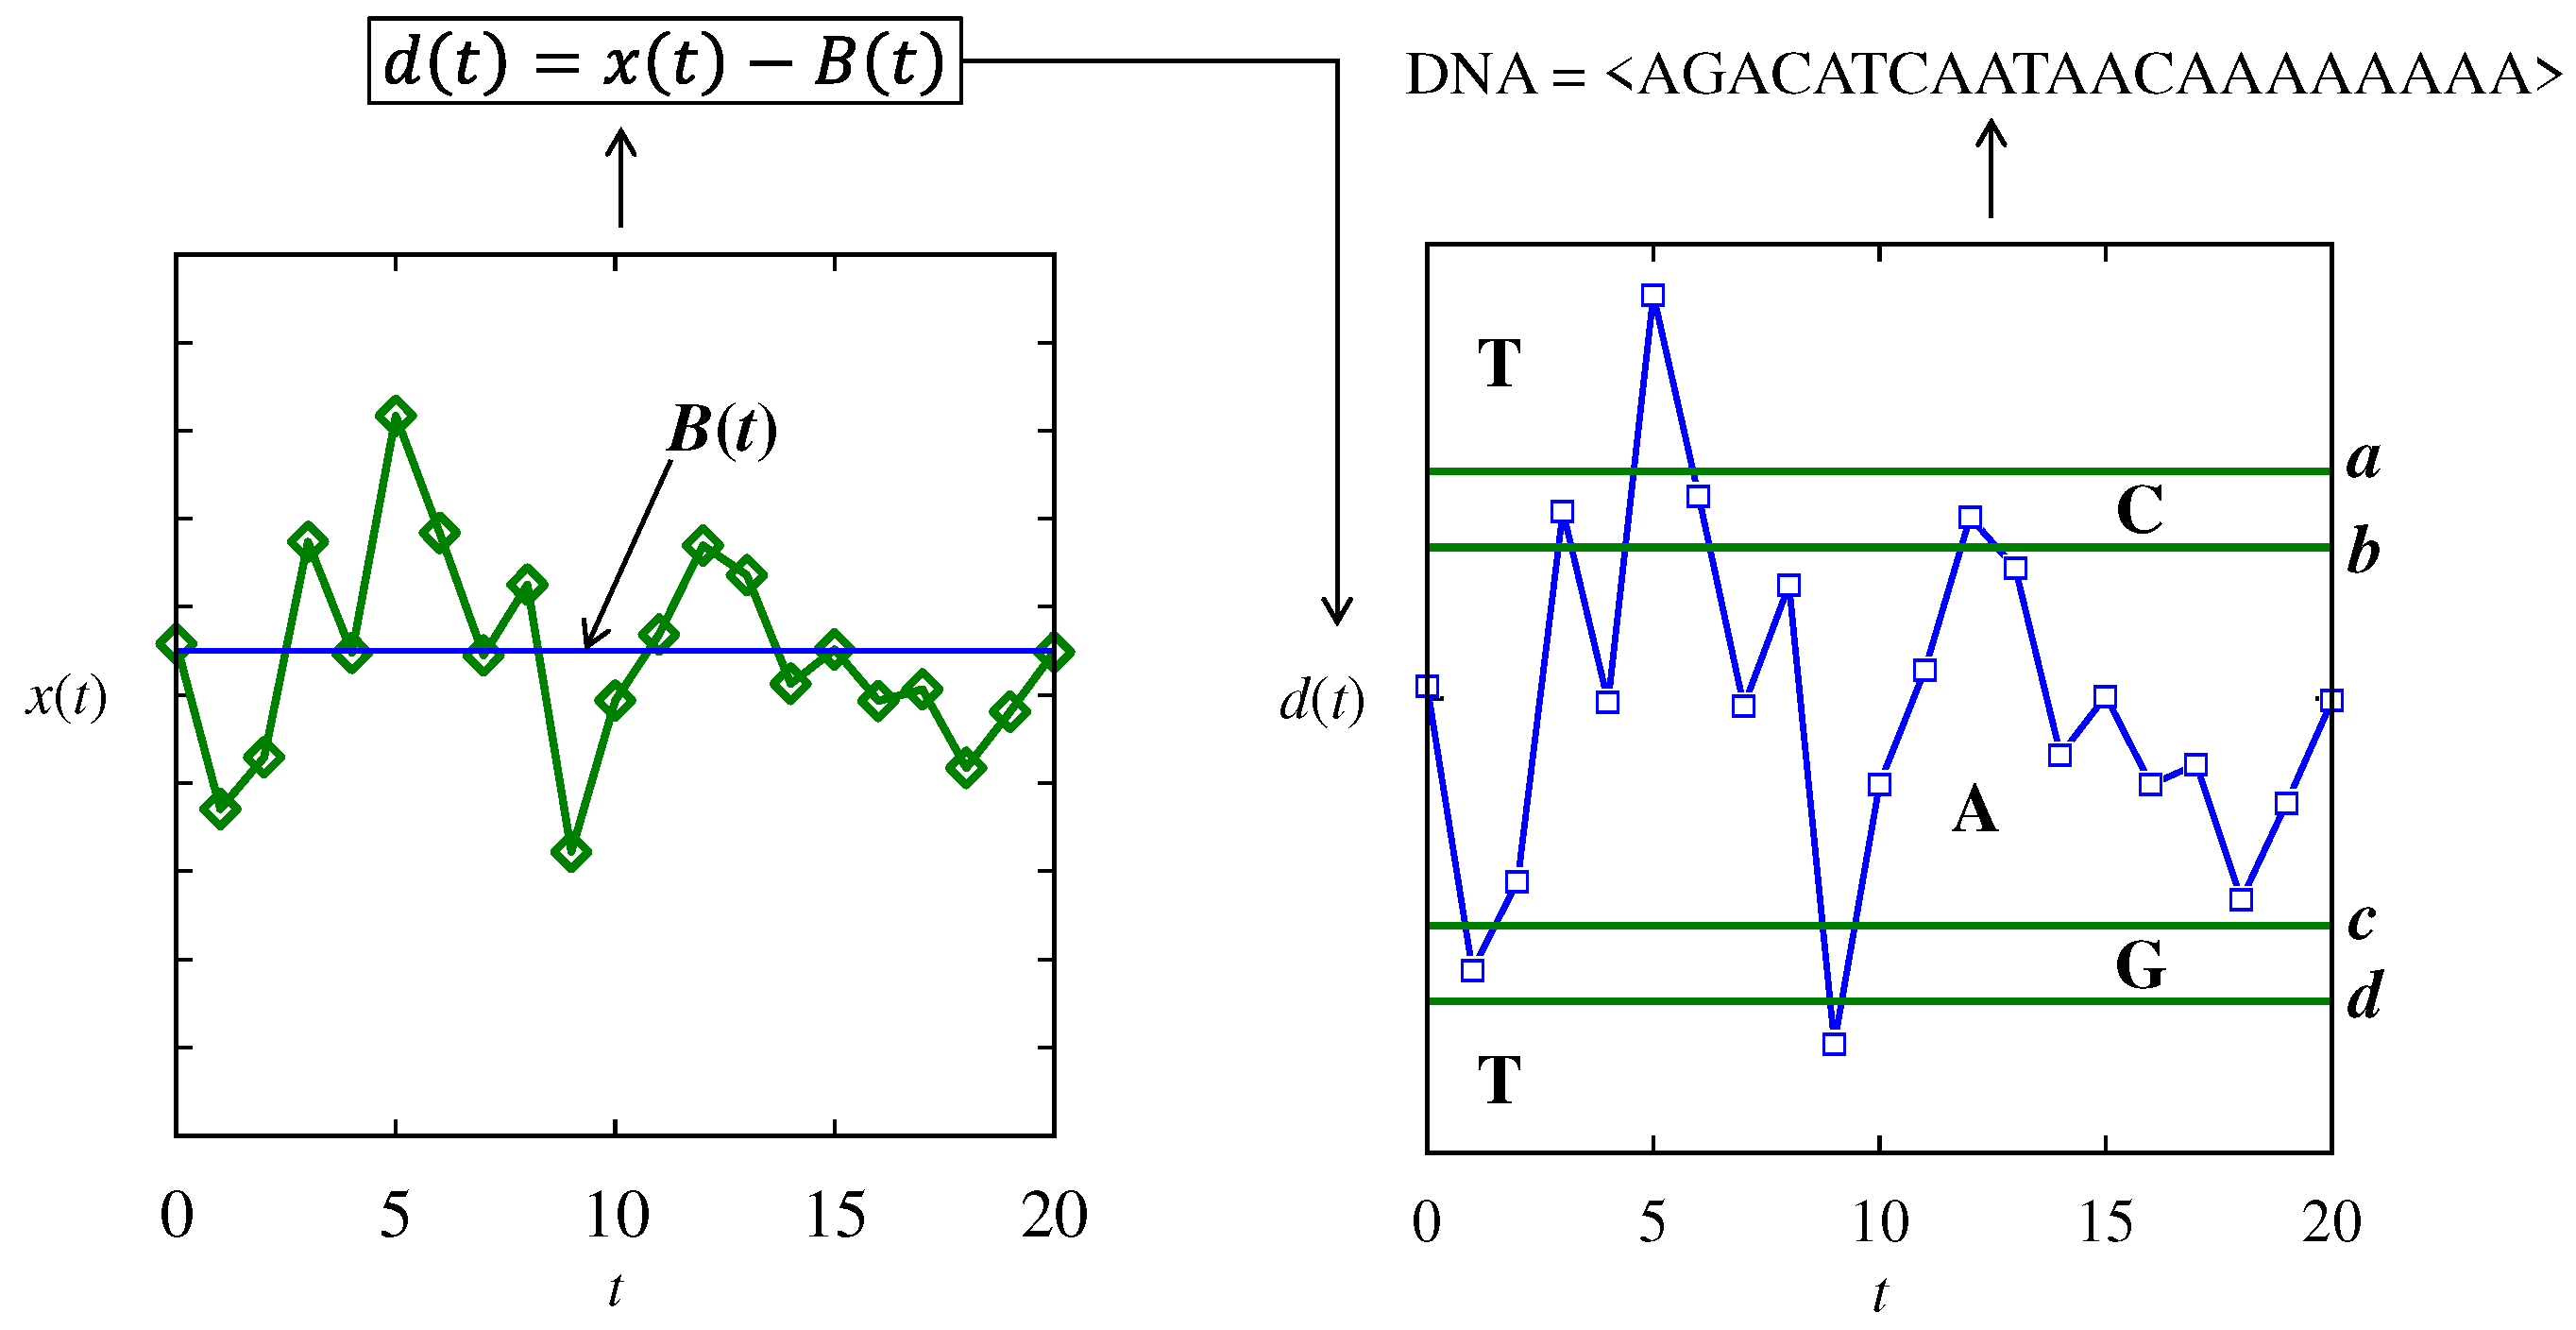
Unlike the DNA-forming rules described above, new DNA-forming rules are used to recognize patterns from a given time series. The new rules are schematically illustrated in Figure 11. As seen in Figure 11, first, a signal is subtracted from a user-defined baseline denoted as B = <…B(t)…>. This results in a difference time series dataset, denoted as diff = <…d(t)…>. Thus, the following relationship holds: d(t) = x(t) – B(t), ∀t = {0,1,…}. The difference time series dataset is processed using four thresholds, a > b > c > d, to create a DNA array. For this, the following rules are used: d(t) ∈ [c, b] → A, d(t) ∈ (b, a) → C, d(t) ∈ (d, c) → G, (d(t) ≥ a or d(t) ≤ d) or, a) → T. The arbitrary case shown in Figure 11 results in a DNA array DNA = <AGACATCAATAACAAAAAAAA>. This way, several DNA arrays can be produced. Each time, baseline and thresholds can be set as preferred by the use.
Consider two time series datasets. One follows a normal distribution with a mean of 100 and a standard deviation of 5. It is denoted as a normal signal. The other follows a random distribution in the interval [85, 115]. It is denoted as not a normal signal. The time series datasets are shown in Figure 12 using a plot. From the visual inspection (Figure 12), it is clear that these two datasets are hardly distinguishable. DBC-2 must make them distinguishable. The formulations shown in Table 5 are used, and protein arrays (this time one-dimensional) are generated to determine whether DBC-2 can distinguish these two signals. The time series datasets are created many times using Monte Carlo simulation, and the corresponding protein arrays are recorded. The first 25 samples of the protein arrays and their analysis results are shown in Table 6. As seen in Table 6, in both cases, the protein arrays consist of the following four amino acids: F, G, K, and P. The amino acid “K” dominates the normal time series datasets, whereas the amino acid “F” dominates the non-normal ones. The Shannon’s entropy function [25] is used to calculate the entropy or average information content of each protein, as follows:
E n p r o t e i n . = i = 1 a a i P r a a i log 4 1 a a i
In Equation (2), En(protein(.)) ∈ [0,1] denotes the entropy of a give protein where the unit is “dna,” indicating the logarithm function has a base equal to 4, aa1 = F, aa2 = G, aa3 = K, and aa4 = P, Pr(aai) is the probability of the aai in the given protein array. The probability is calculated by dividing the frequency of aai (fr(aai)) by the number of amino acids in the given protein array. Since each time series dataset consists of 21 amino acids (Table 6), the total number of amino acids is 21. Thus, the following relation holds here: Pr(aai) = fr(aai)/21.
It is observed that the entropy of a normal signal is less than that of a non-normal one. In rare cases, the entropy of a normal signal becomes greater than or equal to that of a non-normal one. For example, consider the number 3 protein arrays in Table 6. In this case, both protein arrays have the same entropy, but the frequency of F is high for the non-normal protein array, and the frequency of K is high for the normal protein array. Thus, a logical test regarding the values of entropy of the respective proteins and frequencies of F and K can be used as a problem-solving rule to detect whether or not a signal is a normal signal, though it may look different. Regarding Table 6, the following rule is applied: En(protein(normal) > En(protein(no-normal), otherwise fr(K) > fr(F). When this rule holds, “yes” is returned, as shown in Table 6. Not that only two of a hundred repetitions produce a false position or true negative results. It means that DBC-2 is an effective machine learning algorithm that recognizes patterns in time series datasets even though the time series window is very short.

5. Conclusions

Employing bio-inspired computing has been proven to be one of the effective ways to develop intelligent systems for smart manufacturing. DBC, based on the central dogma of molecular biology, is a valuable constituent of bio-inspired computing. However, it is less popular than other bio-inspired computing methods, such as artificial neural networks and genetic algorithms/programming. Especially when the transparency of a machine learning algorithm is an issue, DBC is a better choice. Using simple mapping from few-element to many-element, DBC provides a simple solution to complex cognitive problems. The human intervention can also be captured very easily because DNA- and mRNA-forming rules are user-defined, and these rules explicitly capture the human intervention in the whole computing process. Having said that, the authors do not mean that DBC is a competitor of other bio-inspired computing methods found in the literature. Rather, the authors mean that it is a synergetic method that deserves further exploration.
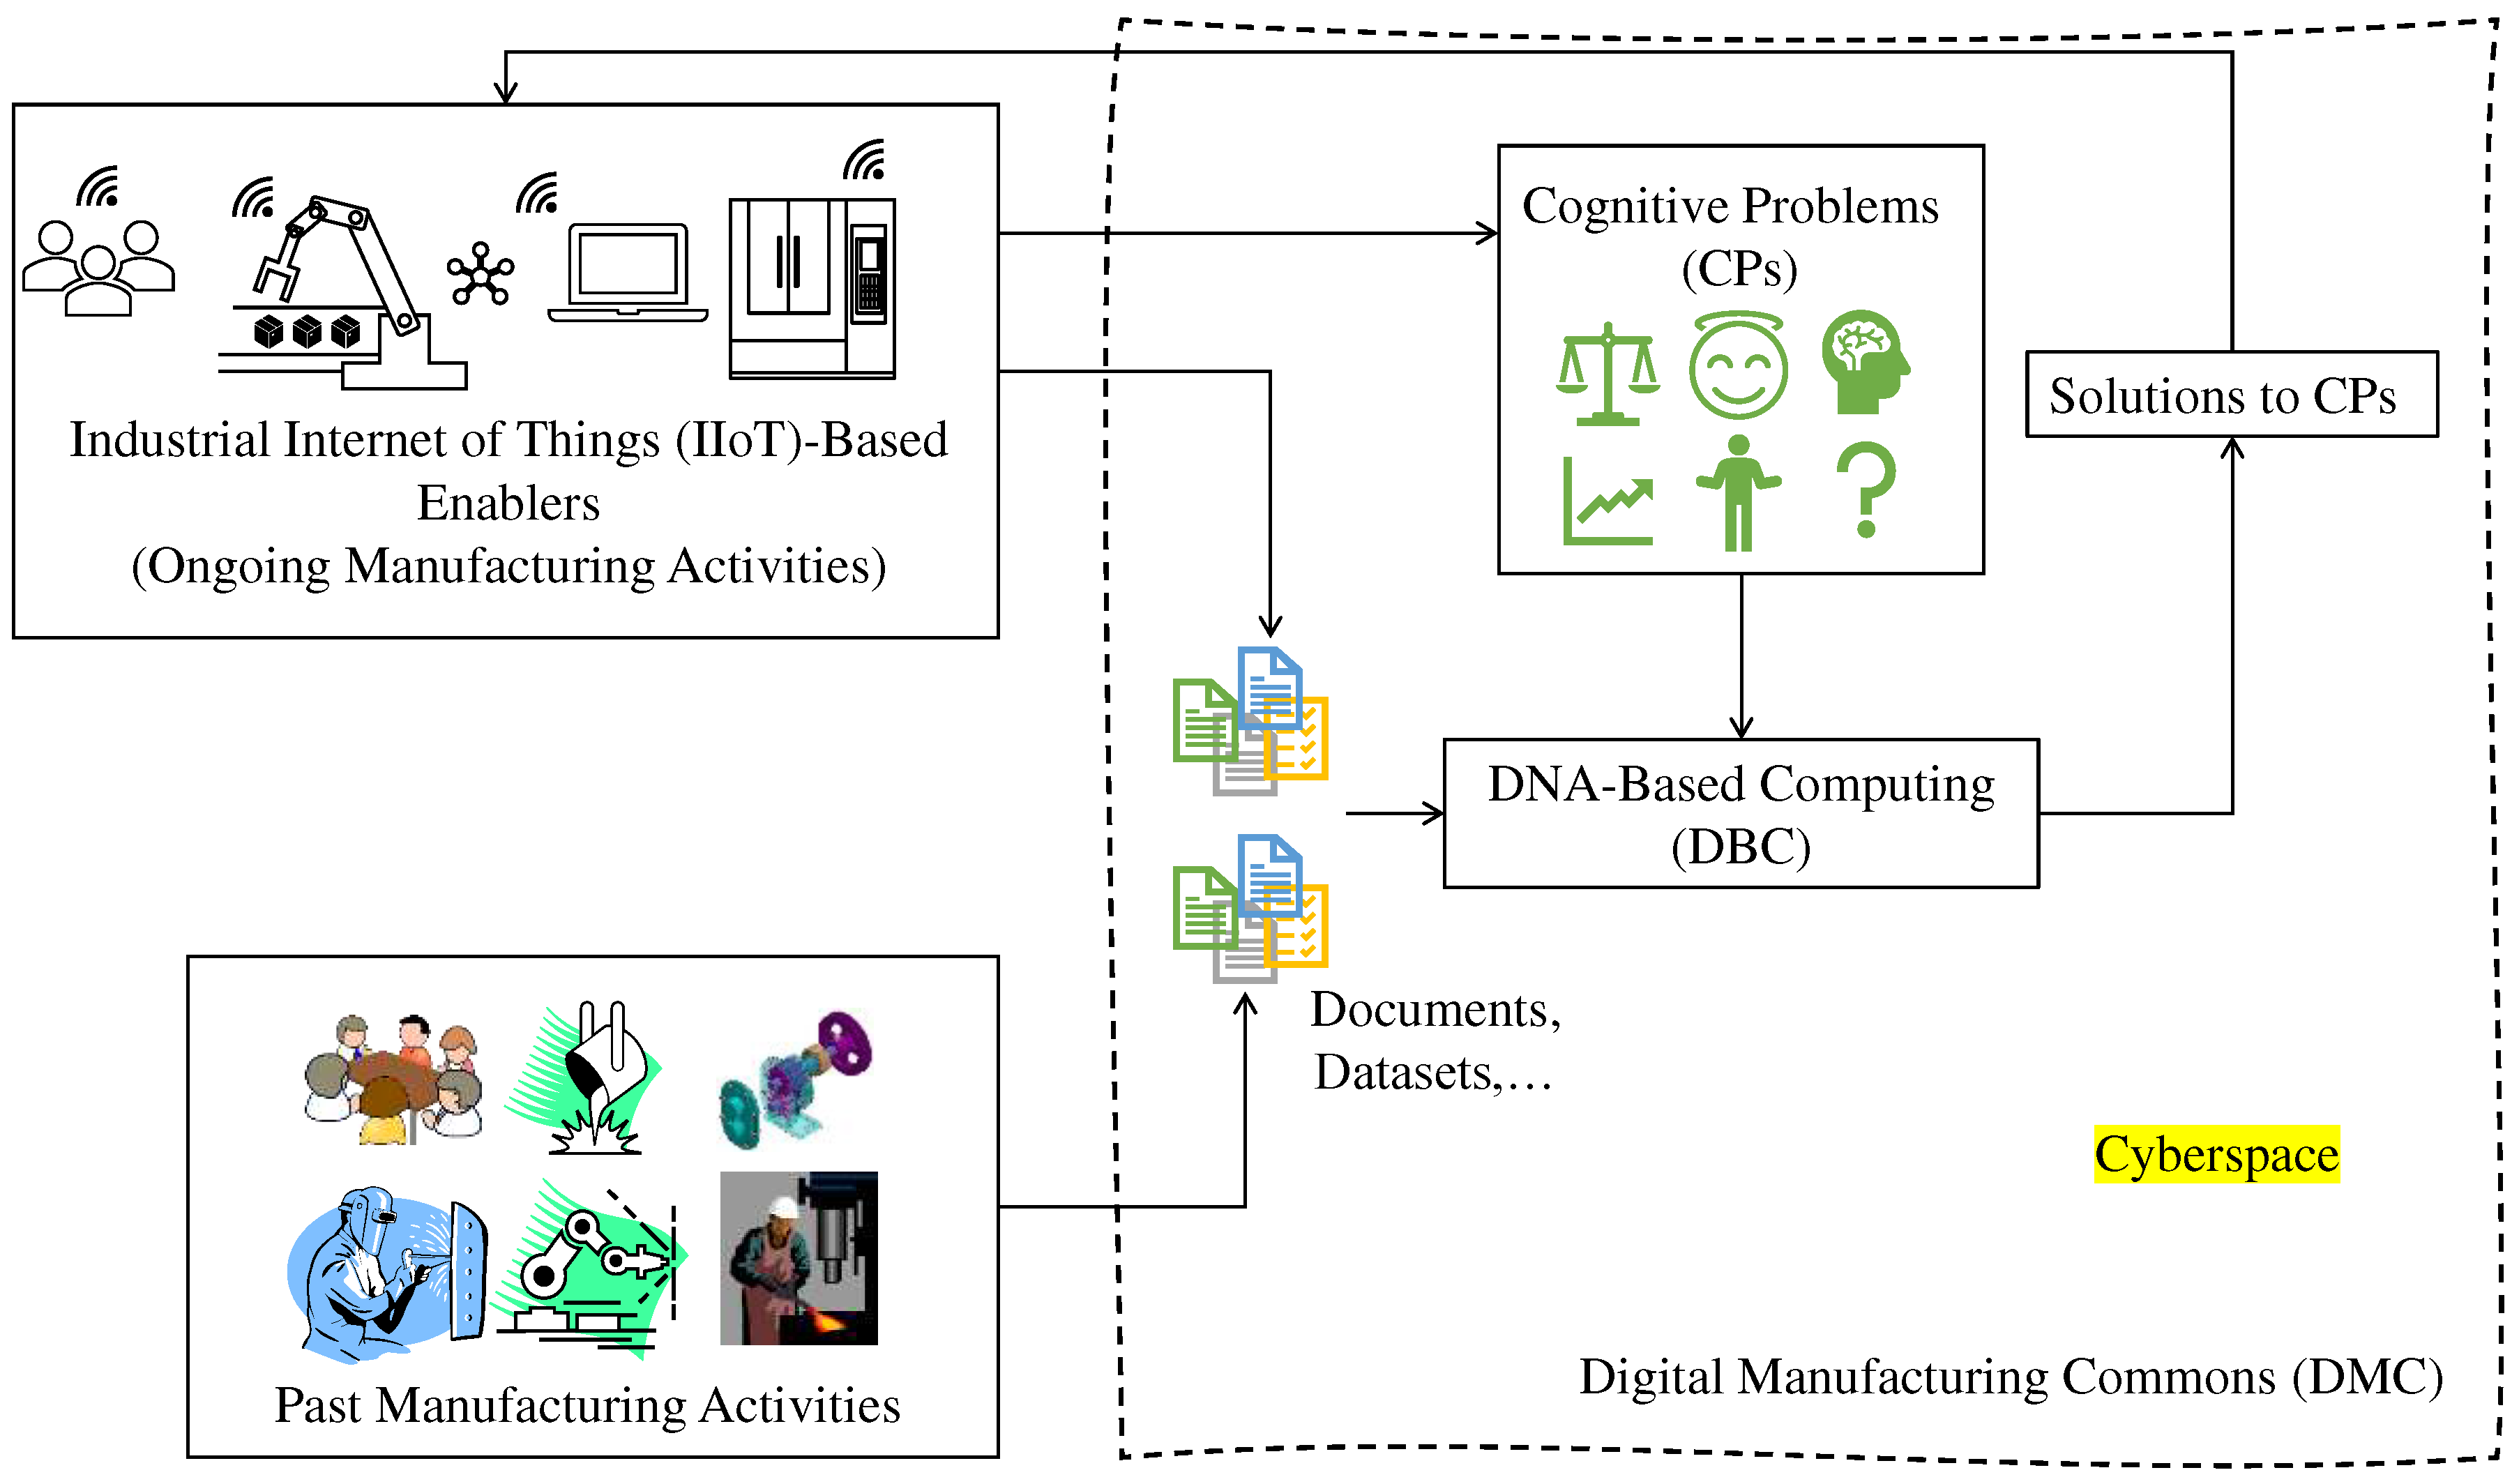
The problems addressed in this article—1) similarity indexing between seemingly different but inherently the same objects, 2) recognizing two regions of an image separated by a complex boundary, 3) pattern recognition when the relevant information is insufficient—common cognitive problems in smart manufacturing. Thus, DBC can be positioned in a smart manufacturing framework, as schematically illustrated in Figure 13. As seen in Figure 13, DBC occupies cyberspace of smart manufacturing. The cognitive problems (CPs) associated with the ongoing manufacturing activities of the Industrial Internet of Things-based enablers can be integrated with DBC. DBC acknowledges the cognitive problems and consults documents and datasets collected from ongoing and past manufacturing activities. Finally, the solutions to CPs generated by DBC are fed into the manufacturing enablers.

Authors Contributions

“Conceptualization, S.U.; methodology, X.X. and L.Z.; software, S.U.; validation, S.U. and L.Z.; formal analysis, S.U.; investigation, S.U. and L.Z.; resources, S.U.; data curation, S.U.; writing—original draft preparation, S.U. and L.Z.; writing—review and editing, S.U. and L.Z.; visualization, S.U. and L.Z.; supervision, S.U.; project administration, S.U.; funding acquisition, S.U. All authors have read and agreed to the published version of the manuscript.”

Funding

This research received no external funding.

Data Availability Statement

The data are available upon request to the corresponding authors.

Conflicts of Interest

The authors declare no conflict of interest.

References

  1. Kusiak, A. Smart manufacturing, International Journal of Production Research, 2018, 56 (1-2), 508-517. [CrossRef]
  2. Beckmann, B.; Giani, A.; Carbone, J.; Koudal, P.; Salvo, J.; Barkley, J. Developing the Digital Manufacturing Commons: A National Initiative for US Manufacturing Innovation. Procedia Manufacturing 2016, 5, 182–194. [Google Scholar] [CrossRef]
  3. Dumitrescu, R.; Riemensperger, F.; Schuh, G. (Eds.). acatech Maturity Index Smart Services: Shaping the Transformation of Businesses to Smart Service Providers (acatech STUDY), Munich 2023. Available Online: https://en.acatech.de/publication/acatech-maturity-index-smart-services/. [CrossRef]
  4. Sharif Ullah, A. M. M. Modeling and simulation of complex manufacturing phenomena using sensor signals from the perspective of Industry 4.0. Advanced Engineering Informatics 2019, 39, 1–13. [Google Scholar] [CrossRef]
  5. Ghosh, A. K.; Ullah, A. M. M. S.; Teti, R.; Kubo, A. Developing sensor signal-based digital twins for intelligent machine tools. Journal of Industrial Information Integration 2021, 24, 100242. [Google Scholar] [CrossRef]
  6. Byrne, G.; Dimitrov, D.; Monostori, L.; Teti, R.; van Houten, F.; Wertheim, R. Biologicalisation: Biological transformation in manufacturing. CIRP Journal of Manufacturing Science and Technology 2018, 21, 1–32. [Google Scholar] [CrossRef]
  7. Wegener, K.; Damm, O.; Harst, S.; Ihlenfeldt, S.; Monostori, L.; Teti, R.; Wertheim, R.; Byrne, G. Biologicalisation in manufacturing – Current state and future trends. CIRP Annals 2023, 72(2), 781–807. [Google Scholar] [CrossRef]
  8. Ullah, A.S. What is knowledge in Industry 4.0?. Engineering Reports. 2020; 2, e12217. [CrossRef]
  9. Ueda, K.; Vaario, J.; Ohkura, K. Modelling of Biological Manufacturing Systems for Dynamic Reconfiguration. CIRP Annals 1997, 46(1), 343–346. [Google Scholar] [CrossRef]
  10. Ueda, K. A concept for bionic manufacturing systems based on DNA-type information. In Human Aspects in Computer Integrated Manufacturing, Olling, G. J., Kimura, F. Eds.; Elsevier, 1992; pp 853-863. [CrossRef]
  11. Ueda, K. Intelligent Manufacturing Systems: From Knowledge-base to Emergence-type. Journal of the Japan Society for Precision Engineering 1993, 59(11), 1755–1760, [In Japanese]. [Google Scholar] [CrossRef]
  12. Denkena, B.; Morke, T. Cyber-Physical and Gentelligent Systems in Manufacturing and Life Cycle: Genetics and Intelligence–Keys to Industry 4.0; Academic Press, 2017.
  13. Denkena, B.; Dittrich, M.-A.; Stamm, S.; Wichmann, M.; Wilmsmeier, S. Gentelligent processes in biologically inspired manufacturing. CIRP Journal of Manufacturing Science and Technology 2021, 32, 1–15. [Google Scholar] [CrossRef]
  14. Ullah, A. M. M. S.; Yano, A. Higuchi, M. Protein Synthesis Algorithm and a New Metaphor for Selecting Optimum Tools. JSME International Journal Series C 1997, 40 (3), 540-546. [CrossRef]
  15. Shuta, Y.; Ullah, A.M.M.S.; Yano, A.; Higuchi, M.; Yamaguchi, T. Grinding Wheel Design Based on the Model of Protein Synthesis. Journal of the Japan Society of Grinding Engineers, 1998, 42 (10) 418-423. [In Japanese].
  16. Ullah, A. M. M. S. A DNA-based computing method for solving control chart pattern recognition problems. CIRP Journal of Manufacturing Science and Technology 2010, 3(4), 293–303. [Google Scholar] [CrossRef]
  17. Ullah, A. M. M. S.; D’Addona, D.; Arai, N. DNA based computing for understanding complex shapes. Biosystems 2014, 117, 40–53. [Google Scholar] [CrossRef] [PubMed]
  18. D’Addona, D. M.; Ullah, A. M. M. S.; Matarazzo, D. Tool-wear prediction and pattern-recognition using artificial neural network and DNA-based computing. Journal of Intelligent Manufacturing 2017, 28(6), 1285–1301. [Google Scholar] [CrossRef]
  19. Iwadate, K.; Ullah, S. Determining Outer Boundary of a Complex Point-Cloud using DNA Based Computing. Transaction of the Japanese Society for Evolutionary Computation 2020, 11(1), 1–8, [In Japanese]. [Google Scholar] [CrossRef]
  20. Ghosh, A. K.; Ullah, A. S.; Kubo, A.; Akamatsu, T.; D’Addona, D. M. Machining Phenomenon Twin Construction for Industry 4.0: A Case of Surface Roughness. Journal of Manufacturing and Materials Processing 2020, 4 (1), 11. [CrossRef]
  21. Kubo, A.; Teti, R.; Ullah, A.S.; Iwadate, K.; Segreto, T. Determining Surface Topography of a Dressed Grinding Wheel Using Bio-Inspired DNA-Based Computing. Materials 2021, 14, 1899. [Google Scholar] [CrossRef] [PubMed]
  22. Crick F. Central dogma of molecular biology. Nature. 1970 Aug 8;227(5258):561-3. [CrossRef]
  23. Cobb, M. 60 years ago, Francis Crick changed the logic of biology. PLoS Biol. 2017 Sep 18;15(9):e2003243. [CrossRef]
  24. Alberts, B., Johnson, A., Lewis, J., Raff, M., Roberts, K., Walter, P., 2002, Molecular Biology of the Cell, Fourth Edition. Garland Science, New York.
  25. Shannon, C. E. A mathematical theory of communication. The Bell System Technical Journal 1948, 27(3), 379–423. [Google Scholar] [CrossRef]
  26. Barnsley, M. F.; Demko, S. Iterated Function Systems and the Global Construction of Fractals. Proceedings of the Royal Society of London. Series A, Mathematical and Physical Sciences 1985, 399(1817), 243–275. [Google Scholar] [CrossRef]
  27. Sharif Ullah, A. M. M.; Sato, Y.; Kubo, A.; Tamaki, J. Design for Manufacturing of IFS Fractals from the Perspective of Barnsley’s Fern-leaf. Computer-Aided Design and Applications 2015, 12(3), 241–255. [Google Scholar] [CrossRef]
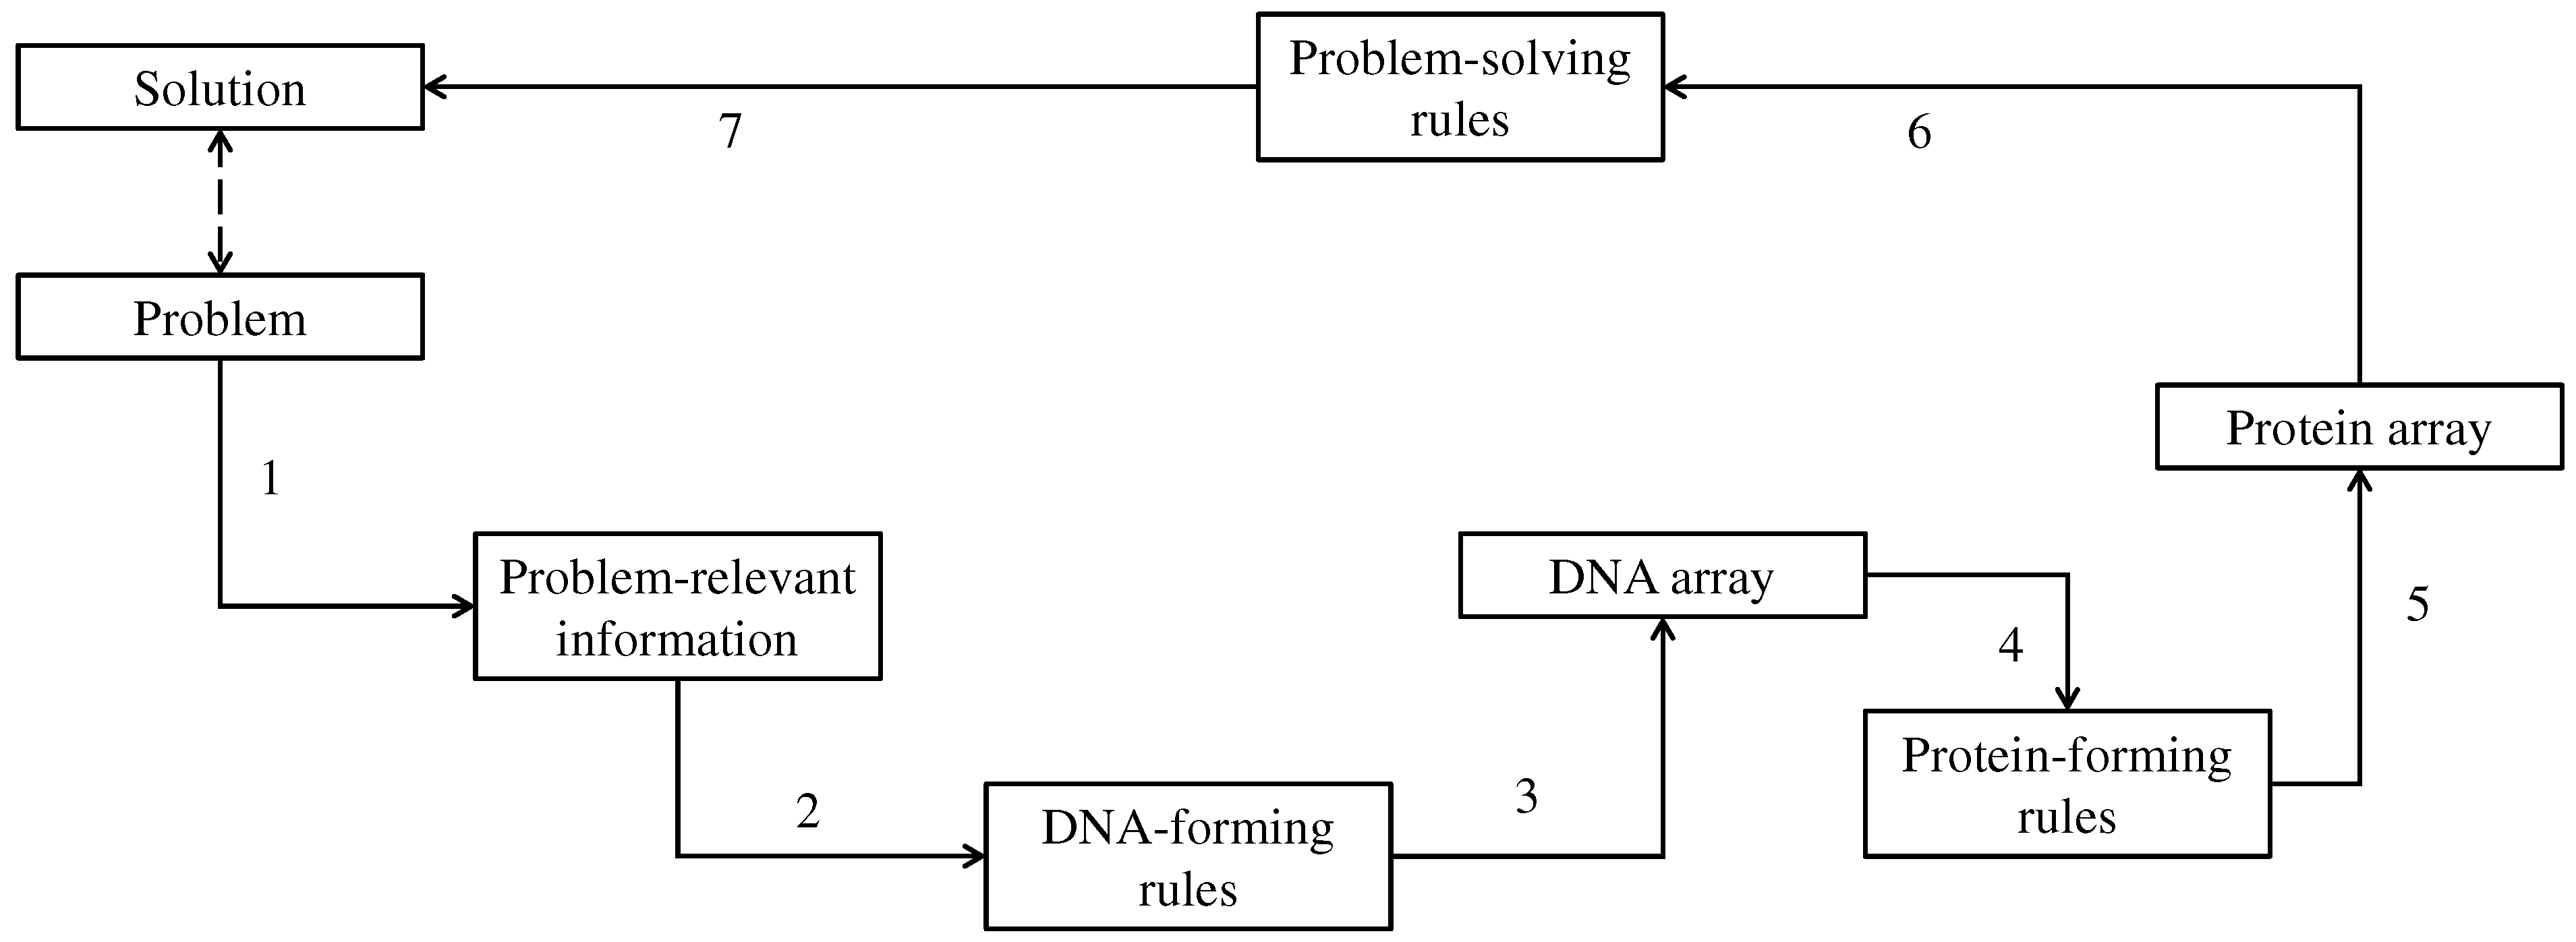
Figure 1. Core processes underlying the central dogma of molecular biology [16,17].
Preprints 88590 g001
Figure 2. DBC-1.
Figure 2. DBC-1.
Preprints 88590 g002
Figure 3. DBC-2.
Figure 3. DBC-2.
Preprints 88590 g003
Figure 4. Frequencies of amino acids (except K) in the protein arrays of the four trees.
Preprints 88590 g004
Figure 5. A geometric modeling problem. (a) before geometric modeling; (b) after geometric modeling.
Preprints 88590 g005
Figure 6. A snowflake in the form of a two-dimensional binary array.
Preprints 88590 g006
Figure 7. Two-dimensional DNA array of the snowflake.
Preprints 88590 g007
Figure 8. Codons generated from the two-dimensional DNA array (Figure 7).
Preprints 88590 g008
Figure 9. Two-dimensional protein array generated from the codon array (Figure 8).
Preprints 88590 g009
Figure 10. Two-dimensional corrected protein array generated from the protein array in Figure 9.
Preprints 88590 g010
Figure 11. DNA-forming rules for time series datasets.
Preprints 88590 g011
Figure 12. Two stochastic time series datasets.
Preprints 88590 g012
Figure 13. Perceived role of DBC in smart manufacturing.
Preprints 88590 g013
Table 1. Nucleic acids relationships.
DNA mRNA (codon) tRNA (anti-codon)
A U A
C G C
G C G
T A U
Nucleic acid symbols
Table 2. Amino acids and nucleic acids relationships [16,17,23].
No Three-letter DNA bases (codons$) Amino acids (single-letter symbols)
1 ATT, ATC, ATA Isoleucine (I)
2 CTT, CTC, CTA, CTG, TTA, TTG Leucine (L)
3 GTT, GTC, GTA, GTG Valine (V)
4 TTT, TTC Phenylalanine (F)
5 ATG Methionine (M)
6 TGT, TGC Cysteine (C)
7 GCT, GCC, GCA, GCG Alanine (A)
8 GGT, GGC, GGA, GGG Glycine (G)
9 CCT, CCC, CCA, CCG Proline (P)
10 ACT, ACC, ACA, ACG Threonine (T)
11 TCT, TCC, TCA, TCG, AGT, AGC Serine (S)
12 TAT, TAC Tyrosine (Y)
13 TGG Tryptophan (W)
14 CAA, CAG Glutamine (Q)
15 AAT, AAC Asparagine (N)
16 CAT, CAC Histidine (H)
17 GAA, GAG Glutamic acid (E)
18 GAT, GAC Aspartic acid (D)
19 AAA, AAG Lysine (K)
20 CGT, CGC, CGA, CGG, AGA, AGG Arginine (R)
21 TAA, TAG, TGA None (X%)
$ For computational purposes, the three-letter DNA bases are considered codons. % The amino acid denoted as X does not exist, i.e., TAA, TAG, and TGA do not code any amino acids. For computational purposes, X is used to replace TAA, TAG, and TGA.
Table 3. Settings of DBC-1 for analyzing the trees in Figure 3.
Items Settings
Problem relevant information A (100 × 100) binary array of the tree
DNA-forming rules 00 = A, 01 = C, 10 = G, 11 = T, continuous reading frame, truncation/addition: truncation
Protein-forming rules As described in Section 3
Table 4. Rules for similarity index of the trees.
Rules
Zero-frequency amino acids G, H, I, M, P, Q, S, V, W, and Y
Equal-frequency amino acids E and N (341 for trees Figure 4(a)-(c) and 273 for Figure (d))
Special frequencies Summation of frequencies of D and N is equal to the frequency of T, i.e., (fr(D) + fr(N) = fr(T) = 383 for trees Figures 4(a)-(c) and 330 for the tree in Figure 4(d)).
The least frequent amino acid other than the zero-frequency ones C
List of amino acids in the ascending order of frequencies fr(A) < fr(X) < fr(L) < fr(R) < fr(E) < fr(N) < fr(T)
Table 5. Settings of DBC-2 for pattern recognition of time series datasets.
Items Settings
Baseline and thresholds B(t) = 100, a = 10, b = 5, c = -5, and d = 10 for all three DNA arrays
mRNA-forming rules Cascading rule among three DNA, DNA1,…,DNA3
mRNA = <…codon = DNA1(i)DNA2(i)DNA3(i)…>
Protein-forming rules As described in Section 3
Table 6. Samples of proteins and their analysis.
No Protein arrays (normal) Proteins arrays (not normal) Entropy (normal) [dna] Entropy (not normal) [dna] Problem-solving rule holds
1 KKKPFKKKKKPKKGKKPKFKK KFKGPFKFKKGFKKGPFGFKK 0.640 0.910 yes
2 KGKKKKKKKKKKKKKPKKKGP FKKGFPGGGKKPKFKFPKGKK 0.446 0.937 yes
3 PKGKKGKPPPPGKFKKKKKKK PGKKKFPFFFFFKFKFFFFFP 0.782 0.782 yes
4 PKKPGKPKFFFKKKKPPKKKP FFGKFKGKKKGFKFGPFKGPK 0.808 0.931 yes
5 KGKPKPKPKKKKKGKPKKKGK KPFGKPKFFPFFKGFGGPPKF 0.623 0.985 yes
6 PKGGKFGKKKKKKKKGKKKKK PPFKKGKGFFFKFFFGGGKKF 0.610 0.931 yes
7 KKKGKKKKKKKPKGKKKKKKP FKKGKFKKPFKGFKFKGFKFF 0.446 0.832 yes
8 KKKKPKFPKFKKKKKKKKKKK GPKFFKKFFPKGPFGKFGPKP 0.446 0.991 yes
9 GKKKKFPPKKKPFKPKGPPPK FPKGKKFFFKKFPGGKGPGKF 0.842 0.969 yes
10 PFKKGKKPKKKFKKPKKKKKK GKFGFKKFKFPFFPFGGFKKK 0.640 0.919 yes
11 KKFKKKKPKKKKKPKKGKKKK FPFFKGFGKFGGFFGKGKPGK 0.494 0.936 yes
12 KKKFKKPKKKFFKPKKKKKKK KFGKFGPKFFGKKPGFKGGGK 0.512 0.936 yes
13 KGKKKKKPKKKKKKKKKKKKK FFKPGFGPGKGKGPKFPPFFF 0.274 0.985 yes
14 KKKKKPPKKKKKKGGKGGKPP GGKFKPFKKFGKKKFKFFFKK 0.670 0.824 yes
15 KKKKKPGKKKKKKKKKPKKPK FKKFGFFKFFFGGGGFGGGPF 0.428 0.832 yes
16 PGPKPKKPPKPKKKKKKKKKK PKGGPPPFFFKFFPFFGPKPK 0.558 0.957 yes
17 KGKGKPGKKFKKKKPKKKKKP FFFFKKPKGKKFKKKPPFFKK 0.701 0.824 yes
18 KGKGKKGKKKKFGKPKPKGKK PKPPFKKKPKFKKFKKFFFPF 0.727 0.773 yes
19 GKPKKKKKPFKPPKPKKKKKG FGPFFKFGFFKKKGKGKGFGP 0.727 0.942 yes
20 KPKGKGKKKGKKGKGKPKKGK GPFGKGKGGFFFFGPGPPGKP 0.634 0.959 yes
Disclaimer/Publisher’s Note: The statements, opinions and data contained in all publications are solely those of the individual author(s) and contributor(s) and not of MDPI and/or the editor(s). MDPI and/or the editor(s) disclaim responsibility for any injury to people or property resulting from any ideas, methods, instructions or products referred to in the content.
Copyright: This open access article is published under a Creative Commons CC BY 4.0 license, which permit the free download, distribution, and reuse, provided that the author and preprint are cited in any reuse.
Alerts
Prerpints.org logo

Preprints.org is a free preprint server supported by MDPI in Basel, Switzerland.

Subscribe

© 2025 MDPI (Basel, Switzerland) unless otherwise stated