
You are currently viewing a beta version of our website. If you spot anything unusual, kindly let us know.
Preprint
Article
Physicochemical and Oscillatory Properties, Microstructure, and Survival of Bifidobacterum longum subsp. longum TISTR 2195 of Yogurt Ice Cream with different Fat Contents and Prebiotics
Altmetrics
Downloads
67
Views
29
Comments
0


This version is not peer-reviewed
Abstract
Yogurt ice cream (YIC) containing Bifidobacterum longum subsp. longum TISTR 2195 (B. longum) with different fat contents (2 and 10% fat) and prebiotics (galacto-oligosaccharide, GOS and fructo-oligosaccharide, FOS) was investigated for its physicochemical properties, microstructure, and survival of B. longum during storage time and in a simulated gastrointestinal tract. Fat contents affected pH, fat particle size, hardness, melting rate, and solid-like characteristic of ice cream while FOS seemed to enhance the hardness and elasticity of YIC better than GOS due to less solubility and denser microstructure which exhibited more solid-like properties than YIC containing GOS. The interaction effect of fat content at 10% fat and FOS in YIC seemed to promote more sensorial acceptance than the ice cream containing 2% fat and GOS. The fat content, concentration of prebiotics, and type of prebiotics were attributed to the survival of B. longum in YIC. Moreover, the survival number of B. longum in YIC during storage for 180 days and in the simulated gastrointestinal tract was still in 106 CFU g-1, which is considered to benefit human health. Finally, probiotic YIC in this study could be used as a guide for functional ice cream manufacture future.
Keywords:
Subject: Biology and Life Sciences - Food Science and Technology
1. Introduction
The International Food Information Council Foundation (IFIC) defines functional food as food containing substances that are beneficial to health. In addition to having nutritious nutrients which help to prevent or cure diseases [1], alternative foods are becoming more popular nowadays as consumers pay more attention to their health. Ice cream is one of the most popular desserts in the world which is sold in many eateries, and it is recognized as the perfect dessert [2]. Developing ice cream products with higher nutritional value by reducing fat content but increasing microorganisms called (probiotics) that benefit the human gastrointestinal tract (GI tract), and nutrients (prebiotics) that also benefit human microflora could be one solution that gives consumers more choice in their ice cream consumption. Such ice cream is recognized as a synbiotic food product.
Probiotics refer to microorganisms, especially bacteria that can survive in the human GI tract, resulting in a balanced human GI tract as well as allowing beneficial microflora to grow and work more efficiently. These probiotics can resist extreme conditions in the human GI tract. The amount of probiotics that can survive in the GI tract which is considered effective in promoting human health is equal to a reference value of 106 CFU g-1 or milliliter of the finished product before consumption. Consuming 106 to 109 live probiotic cells brings the maximum benefit to the human body [3]. Probiotics which are generally used in food products include Lactobacilli microorganisms such as Lactobacillus acidophilus, Lactobacillus agilis, Lactobacillus rhamnosus, and Bifidobacteria such as Bifidobacterum longum and Bifidobacterum bufidum. Lactobacillus is a bacterium that lives in the small intestine and Bifidobacterium lives in the colon [4].
Prebiotics refer to food components that cannot be digested but are beneficial for the growth of intestinal microorganisms. These microorganisms are capable of performing the activity of the microorganisms themselves, which has a positive effect on the bodies of those who consume prebiotics. Fructo-oligosaccharides (FOS), inulin, galacto-oligosaccharides (GOS), lactulose, and lactosucrose are popular prebiotics used in food products [5].
Yogurt ice cream (YIC) or frozen yogurt is milk ice cream which contains yogurt of at least 10-20% of the weight of the ice cream and it is becoming more popular nowadays because it has a sweet and sour taste and it also has the same health benefits as yogurt, as well as providing a refreshing coolness, which is a distinctive feature of ice cream. YIC meets the needs of consumers who do not like the sharp sour taste and texture of yogurt [6] but still value the benefits of probiotics which are not present in normal ice cream. Therefore, the addition of probiotics such as B. longum to YIC should create an alternative to functional and healthy ice cream for health-conscious consumers.
However, the ice cream production process requires a process of aeration or whipping and lowering of temperature or freezing to make most of the water in the ice cream mix turn to ice. The ice and air bubbles, as well as the water in the unfrozen serum phase, are encapsulated by a three-dimensional network of fat particles in the ice cream [7]. This slows down the melting process and makes the structure of the ice cream more stable when it is consumed.
Thus, ice cream is a product with gaps or cavities inside its network structure at the microscopic level that may allow probiotic microorganisms such as B. longum to live. This specific structure could provide a channel by which B. longum can be introduced into the human body [8], but the high fat content in ice cream may affect the acceptability of the product to health-conscious consumers.
Therefore, developing ice cream products with less fat content but a high survival rate of probiotics may meet the needs of those consumers. In this study, the effects of fat content in YIC and types of prebiotics (GOS and FOS) on the survival rate of B. longum and on the physicochemical qualities of ice cream were determined. Also, the survival of B. longum in a simulated GI tract was examined.
2. Materials and Methods
2.1. Starter culture, probiotic, and reagents
B. longum subsp. longum TISTR 2195 was contributed by the Thailand Institute of Scientific and Technological Research (Pathum Thani, Thailand). Thermophilic YoFlex® culture YC-380, yogurt culture, was purchased from Chr. Hansen (Hoers Holm, Denmark). Butter fat (99%) was bought from Vicky Enterprise (Bangkok, Thailand). Fufill 400 as stabilizer/emulsifier (S/E) was purchased from SKW Biosystem (Baupte, France). Sucrose was obtained from Mitr Phol Group (Bangkok, Thailand). Glucose syrup (10-12 DE) was purchased from Thai Glucose Co., Ltd. (Nakornpathom, Thailand). Skimmed milk powder (SMP) was obtained from Fonterra (Auckland, New Zealand). Galacto-oligosaccharide (GOS, 55% (w/w)) was purchased from Yaku Famazootical Industry (Tokyo, Japan). Fructo-oligosaccharide (FOS, 90% (w/w)) was obtained from Sigma-Aldrich (St. Louis, USA). De Man Rogosa and Sharpe culture medium (MRS), Bifidobacteria Selective Count Agar Base (BSC Propionate Agar Base), and M1734 Bifido Selective Supplement A- FD250 were bought from Hi Media Laboratories (Maharashtra, India), and L-cysteine hydrochloride was obtained from Acre Organics, (New Jersey, USA).
2.2. Preparation of yogurt
A commercial starter culture (thermophilic YoFlex® culture YC-380) was used to produce yogurt. Pasteurized milk was warmed to 60 oC before adding 2% (w/w) SMP into this milk with stirring until SMP was completely dissolved. Then, it was allowed to cool to 43 oC before the starter culture was inoculated by gently stirring for 10 min. Then, it was poured into a sterilized yogurt container and cured in the yogurt incubator (YA1493, Elecream, Vanvea, France) at 43 °C until the pH of the yogurt dropped to 4.6. The yogurt was then immediately placed in a 4°C refrigerator to stop the fermentation and preserve it for use in the next experiment.
2.3. Preparation of YIC
The ingredients used to make YIC are shown in Table 1 while distilled water was added to make each formula reach 100%. After dissolving the dry ingredients in water, melted butter fat was added and the whole mix was pasteurized at 80 °C for 30 sec [9]. Then, the mix was homogenized at 2000 psi and 500 psi for the first and second stages of homogenization, respectively. The mix was cooled to room temperature before being aged at 4 oC for 24 h in a refrigerator. At the end of the aging stage, B. longum at 109 CFU g-1 of ice cream mix was added. GOS and FOS and 20% (w/w) yogurt were added into the mix. The mix was then whipped and frozen in an ice cream maker (Taylor 103-34, Illinois, USA) for 15 min. Then, the ice cream was hardened at -20 oC in a freezer (SNQ0103-170100063, Sanden intercool, Bangkok, Thailand). The survival rate of B. longum in YIC was determined every 15 days for 180 days or 6 months.
2.4. Analysis of the Physicochemical properties of YIC mix and YIC
2.4.1. Fat particle size of YIC mix
The determination of the fat particle size of YIC mix was conducted using a laser scattering particle size distribution analyzer (LA-950V2, Horiba, Tokyo, Japan). The refraction value of fat particles and water was 1.458 and 1.33, respectively, for the calculation of the fat particle size. Then, YIC mix was gently dropped into the chamber of the analyzer. The particle size value was measured and reported as the Sauter mean (d3, 2).
2.4.2. Dynamic oscillatory characteristics of YIC mix
The dynamic oscillatory test for the YIC mix was determined following Adapa, Dingeldein, Schmidt, & Herald [10]. A 4-degree angle cone and plate was used in this measurement. The gap between the YIC mix sample and the probe was 27 μm. All measurements were performed at 4 oC with a temperature-controlled rheometer (AR-G2 Rheometer, TA Instruments, New Castle, USA). The linear viscosity region (LVR) was determined by a torque sweeping test at a constant frequency of 0.08 Hz. The LVR was in the range of 0.1-1 μN.m. The YIC oscillatory properties were then examined by a frequency sweeping test from 0.1-5 Hz at a constant torque of 0.2 μN.m. Storage modulus (G’), loss modulus (G’’), and loss tangent (tanδ) were measured.
2.4.3. Total acidity and pH of YIC
Total acidity and pH according to the method of Akin, Akin, and Kirmaci [11] was determined. The pH of melted YIC was carried out at room temperature with a pH meter (MP220, Mettler, Toledo, Greifensee, Switzerland). Total acidity of YIC was measured using the acidity titration method by weighing 10 g of melted YIC titrated with 0.1 N NaOH and phenolphthalein was used as an indicator.
2.4.4. Overrun of YIC
The overrun of YIC was measured following Thaiudom [12]. Briefly, the YIC mix and YIC at the same volume were weighed. Then, the overrun was calculated by the following equation (1).
Overrun (%) = [(weight of YIC mix – weight of YIC)/weight of YIC) x 100
2.4.5. Hardness of YIC
The hardness measurement of YIC was carried out following the method of Javidi, Razavi, Behrouzian, and Alghooneh [13] using a texture analyzer (Stable Micro System, TA-XT plus, Surrey, England). A cylindrical probe with a diameter of 6 mm was used. The sample pressing distance was 15 mm and the sample pressing speed was 2 mm sec-1.
2.4.6. Melting rate of YIC
The melting rate of YIC was measured following the method of Thaiudom [12] by taking samples of YIC which were in a plastic cup of 30 mm height and 50 mm diameter and previously stored at -20 oC on a stainless-steel grid wire plate with a cone supporting the bottom of the plate. The melted YIC was passed through the grid and dropped into a beaker underneath the cone. Then, the beaker containing the melted YIC was weighed every 10 min for a period of 2 h. The weight of the melted YIC and time were plotted to determine the slope of the graph as the melting rate (g min-1).
2.5. Microstructure of YIC
The microstructure of YIC was determined following Goff, Verespej, and Smith [14] using a Low-Temperature Scanning Electron Microscope (LT-SEM; QUANTA 450, FEI, Oregon, USA). To prevent structural change due to the melting of YIC, the YIC samples were quickly submerged in liquid nitrogen after being taken out from the storage freezer. Then, the samples were fractured into small pieces (about 2-3 μm in diameter) with a blade and pincers. The samples were then placed on a specimen holder in a vacuum chamber of LT-SEM at -20 °C. The YIC samples were observed and photographed at an electrical voltage of 10 kV. At least 5 photographs were taken of each sample.
2.6. Sensory evaluation of YIC
The sensory evaluation of YIC was determined by 30 laboratory panelists who were familiar with the yogurt and yogurt ice cream. The incomplete block design (BIB) with 10 treatments (t), 9 replications (r), 30 blocks (b), and 3 experimental units per block (k) was used to determine this test. The color, aroma of yogurt, sweet taste, sour taste, firmness, sandiness, melting property in the mouth, and overall acceptance of YIC were evaluated using a structured 9-point hedonic scale in the range of 1 (did not like it at all) to 9 (liked it the most) point.
2.7. Number of survival B. longum in YIC
The number of survival B. longum was determined following the method of Akin, Akin, and Kirmaci [11]. Briefly, 10 g of ice cream were mixed with 90 mL of 0.1% (w/v) sterilized peptone solution. Then this mix was serially diluted to count the number of B. longum. The surviving B. longum were counted by pouring 1 mL of the above mix onto a sterile petri dish before pouring BSC Propionate Agar Base into the dish. After the agar hardened, the dish was turned upside down. The dish, AnaeroPack®, and Anaero-Indicator (Mitsubishi gas chemical company, Tokyo, Japan) was placed into an AnaeroPouch® (Mitsubishi gas chemical company, Tokyo, Japan) to provide the vacuum and anaerobic conditions. This pouch was incubated at 37 oC for 72 h in an incubator (BD400, Binder incubator, New York, USA). The survival of B. longum was determined by counting the colonies of B. longum in the range of 30-300 and calculated using the following equation (2).
Log CFU g-1 = log (number of colonies x dilution folds) / sample volume)
2.8. Survival of B. longum in simulated digestive system
The survival of B. longum in a simulated GI tract was determined following Abadía-García et al. [15] with a slight modification. Briefly, 10 g of YIC were well mixed with 80 mL simulated stomach solution (pH 2), comprising pepsin (from porcine gastric mucosa, Sigma-Aldrich Chemical Co., St. Louis, MO, USA) at a concentration of 3 g L-1 in a 0.5%w/v NaCl solution, and 10 mL artificial saliva solution, containing 6.2 g NaCl, 2.2 g KCl, 0.22 g CaCl2 and 1.2 g NaHCO3 in 1 L of distilled water. Then the mix was incubated at 37°C for 2 h. before being centrifuged at 10,000 g at 4°C for 10 min to receive a pellet of B. longum. Afterwards, the pellet was dissolved in an intestine solution, containing pancreatin (from porcine pancreas, Sigma-Aldrich Chemical Co., St. Louis, MO, USA) and bile (bovine, Sigma-Aldrich Chemical Co., St. Louis, MO, USA) in 0.5% w/v NaCl solution, and incubated at 37°C for 4 h. The surviving B. longum were measured every 2 hours by the pouring plate technique with Bifido Selective Supplement A-FD250 culture media while the plate was incubated at 37°C for 72 h.
2.9. Statistical analysis
All experimental data with three replicates were calculated for the analysis of variance (ANOVA) and Duncan’s Multiple Range Test (MRT) was used with SPSS Statistics 17.0 (SPSS Statistical Software, Inc., Chicago, IL, USA) at a statistical confidence level of 95%.
3. Results
3.1. Physicochemical properties of YIC
Table 2 shows that the physicochemical properties of YIC containing 10% fat (10% - fat YIC) possessed a lower pH than YIC containing 2% fat (2%-fat YIC). This may be because the YIC with a higher fat content contained a predominance of fatty acids rather than the lower fat content in YIC [16]. Thus, the higher fatty acid content could lower the pH of the YIC. Interestingly, even though the fatty acid affected the pH, it did not influence the YIC acidity since the pH is a measurement of the relative amount of free hydrogen and hydroxyl ions in the substate that is always reported in logarithmic units, thus each number of pH represents a 10-fold change in the acidity/basicness of the substate [17]. These results showed that all the samples of YIC had different pH values depending on the fat content in YIC while their acidity values were still in the same range and not significantly different. This was because the lactic acid, produced by the yogurt starter culture and B. longum and added in the same amount of yogurt (20% w/w) into the ice cream, dominated the overall acidity value of YIC. However, all YIC pH showed a slightly acidic to neutral state as is found in the pH of normal ice cream. Also, there was a similar amount of fat content, but no significant effect of GOS or FOS on the acidity and pH of YIC.
No significant differences were found in the overrun of these samples which were in the range of 34-35% which was similar to the overrun range in ice cream with synbiotics found in the study of Ahmadi et al. [18]. However, their results revealed that the added prebiotic, counted as dry matter, increased when the overrun of ice cream was also increased. However, in this work, the results were different which may have been due to a slightly different number of prebiotics (GOS and FOS) which were added to the YIC. The variable fat contents in YIC did not affect the overrun either which is similar to the study of Rolon et al. [19] who studied the amount of fat that affected the physical characteristics of vanilla ice cream. However, Akin, Akin, and Kirmaci [11] reported that ice cream with the addition of inulin as a prebiotic had an increased overrun compared to controlled ice cream because inulin has a high ability to hold water in its structure. Consequently, the serum phase of ice cream was more concentrated which could better entrap air bubbles in the ice cream. However, the main factors affecting the ice cream overrun were the timing of the blender and the efficiency of the ice cream maker [7] so, in this study, a laboratory-scale batch freezer was used, which may have resulted in a low overrun value for YIC.
Using a higher fat content in YIC resulted in a larger fat particle size. As a result, low-fat YIC possessed smaller fat particle sizes than full-fat or higher-fat YIC which is consistent with the results reported by Rolon, et al. [19]. The use of higher fat content in ice cream at the same pressure in a homogenizer and the same protein content resulted in a higher diameter of fat particles because the butter fat could easily collide with those fat particles. Moreover, the size-was reduced to small fat particles occuring during the homogenization process which resulted in an increase in the surface area of the fat [20]. The greater the surface area of the fat, the less completely adsorption of the milk protein on the surface of the fat in low fat content ice cream. Consequently, the adjacent fat particles without the adsorbed milk protein coalesced and easily merged into larger particles, resulting in a larger size of fat particles. This would not happen with less fat content since the surface of fat particles could be comoletely covered by a certain amount of milk proteins in such YIC.
Regarding the effect of prebiotics on the particle size of the fat YIC, there was no significant difference between GOS and FOS in 2% fat-YIC but the particle size of the fat was significantly different in 10% fat-YIC. This may have been due to the small amount of fat content in 2% fat-YIC that did not express the difference in fat particle size even though GOS or FOS was added into YIC and all fat particles in 2% fat-YIC may have been completely stabilized and covered with milk proteins resulting in less collision of neighboring fat particles that could have prevented fat coalescence and aggregation. However, in 10% fat-YIC, the particle size of the fat was smaller in the YIC containing FOS or GOS than that in control but the increase of FOS in YIC significantly reduced the size of the fat particles rather than GOS because FOS had a longer length of chain than GOS in this study which could occupy the space in ice cream serum phase and prevent the collision and aggregation of the fat particles, resulting in remaining the smaller fat particles in FOS-YIC rather than those in GOS-YIC. Moreover, the addition of prebiotics increased the viscosity of YIC which may have retarded and prevented the collision and aggregation of the fat particles in YIC. The longer the chain length of the prebiotics, the more the viscosity found in FOS rather than in GOS at the same concentration. This finding is similar to the results of Balthazara et al. [21].
3.2. Oscillatory property of YIC mix
The results showed that when the frequency was increased, tan δ of 2%-fat YIC mix was lower than that of 10%-YIC mix (Figure 1). This implied that the 2%-fat YIC mix behaved more like a liquid with less elasticity than the 10%-fat YIC mix. This is consistent with the studies of Adapa, Dingeldein, Schmidt, and Herald [10] who found that ice cream mix with a higher fat content always possessed elastic and solid-like behavior rather than the ice cream mix with lower fat content and the tan δ increased when the fat content in the ice cream mix was reduced. Also, Isik, Boyacioglu, Capanoglu, and Erdil [22] found that ice cream mix with a higher fat content had higher viscosity than the mix with a lower fat content. In this study, the addition of FOS and GOS increased the elasticity of the YIC mix compared to control. However, the addition of FOS provided more elasticity with a lower tan δ than the addition of GOS. This meant that FOS induced higher viscosity and solid-like behavior in YIC mix than GOS which is similar to the study of Balthazara et al. [21]. Moreover, the concentration of added prebiotics had an effect on such behavior. The more the concentration increased, the more the viscosity and solidness occurred, resulting in less collision of neighboring fat particles, as mentioned previously. This is also supported by the report of Balthazara et al. [21] which showed that the addition of GOS increased the viscosity of the ice cream mix, but the elasticity of such a mix was lower than that of the mix with FOS. The type of prebiotics also affected the rheological values of the ice cream mix due to the different structure and molecular weight of the prebiotics. A chain length of FOS had an approximate number of single-molecule sugars in the polymerization chain called ‘degree of polymerization’ ranging from 3-9 molecules, while GOS had an approximate number of from 2-5 molecules [23], consequently FOS produced hydrogen bonds more easily with water than GOS. This confirms that FOS provides higher viscosity and more solid-like or gel-like behavior than GOS. Akalin and Erisir [24] also studied the effects of inulin and FOS as prebiotics on the physical characteristics of ice cream and they found that inulin increased the viscosity of the mix more than FOS because inulin possesses a longer chain length of molecules than FOS. Thus, a longer chain of such prebiotics produced hydrogen bonding with water better than a shorter chain.
3.3. Hardness of YIC
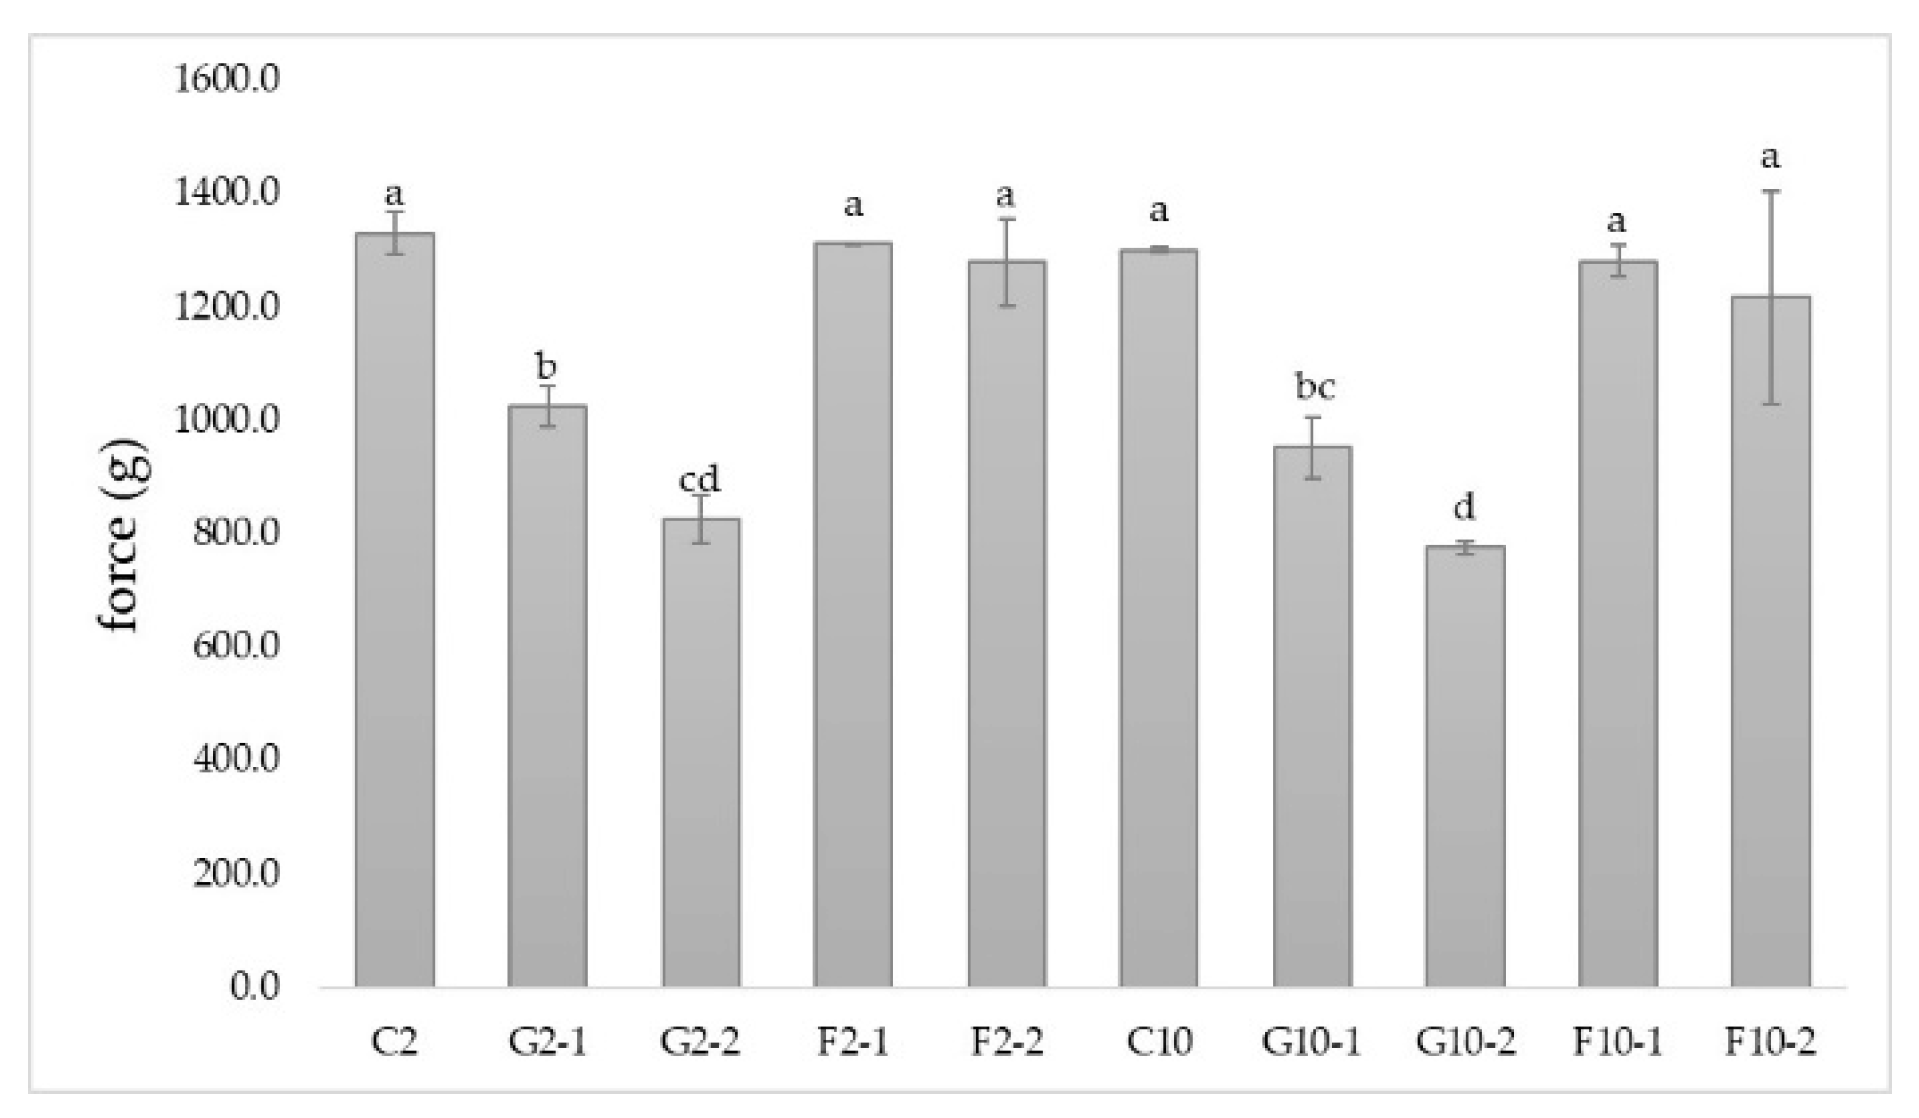
Neither 2%-fat YIC nor 10%-fat YIC provided a significantly different hardness as shown in Figure 2. Muse and Hartel [25] investigated the hardness of ice cream and they found that it was influenced by ice phase volume, ice crystal size, overrun, fat destabilization, and the rheological properties of the mix. In line with these results, we expected our oscillatory results and the hardness of the YIC would show a significant difference between 2%-fat YIC and 10%-fat YIC in all YIC samples but, in fact, there was no difference between these YICs. Also, even though the 10%-YIC mix showed solid-like characteristics as well as a higher fat destabilization than the 2%-fat YIC mix, the hardness of such YICs was not significantly different either. Although the hardness of the ice cream was inversely proportional to the amount of fat in the ice cream and the reduction of the fat content in the ice cream increased the amount of ice crystals [26], 2%-fat YIC and 10%-fat YIC still did not show any significant differences. These results might be due to the type of equipment used, for example, the texture analyzer may not have been sufficiently sensitive to detect the different hardnesses of the samples. These results are in contrast to those of the oscillatory test which showed greater sensitivity than those of the texture analyzer, as mentioned previously.
The addition of prebiotics, especially GOS, to YIC resulted in a lower hardness of YIC compared to control due to its ability to bind with water. Consequently, there was a lower water content but an increase in a concentration of the serum of YIC. This could have induced a freezing point depression of YIC [27], resulting in it melting more easily and being softer in YIC texture. Moreover, the greater the GOS concentration added to YIC, the less hardness occurred (Figure 2). In contrast, YICs with and without the addition of FOS were not significantly different in their hardness. This meant that FOS did not affect the hardness of YIC because FOS possesses a longer chain length than GOS [23] which produced a stronger and denser overall structure of YIC (for more details, see the section on microstructure) from its lower solubility which could form many microcrystals in the YIC [24]. Moreover, FOS did not depress the freezing point as much as GOS which possessed a shorter chain length and it could bind more easily with water in the unfrozen serum phase of YIC than FOS, resulting in a higher serum phase concentration as mentioned previously. Also, similar to the rheological results, because FOS-YIC mix exhibited a higher viscosity than GOS-YIC, the hardness of FOS-YIC was greater than that of GOS-YIC. This evidence confirms that FOS contributed to the hardness of YIC more than GOS.
However, it was found that the addition of GOS caused more dispersion of air bubbles in the structure of YIC (see more information in the section on microstructure), compared to control, while GOS-YIC contained many smaller air bubbles than control. This made it easier to penetrate the ice cream with a probe of the texture analyzer to obtain a hardness measurement. Moreover, generally, ice cream with large amounts of air bubbles tend to have a softer texture than ice cream with fewer air bubbles [28]. The more GOS added, the more dispersion of air cells in YIC (see section on microstructure). However, the hardness of the ice cream depended on many factors, such as overrun, viscosity of ice cream mix, the number and size of the ice crystals [29].
Figure 2.
Hardness of yogurt ice cream with different fat content and prebiotics. Different small letters on each bar indicate significant differences at p > 0.05.
Figure 2.
Hardness of yogurt ice cream with different fat content and prebiotics. Different small letters on each bar indicate significant differences at p > 0.05.
3.4. Melting rate of YIC
It was found that the melting rate of 10%-fat YIC was lower than that of 2%-fat YIC (Figure 3) because the main factor affecting the melting rate was the fat content in the ice cream. Using a larger amount of fat resulted in a better three-dimensional fat network within YIC. As a result, YIC could retain air bubbles in that network [25] behaved like an external insulation of heat transfer from the surrounding environment to the ice crystals in YIC. This prevented the ice crystals from spreading through to the melted ice crystals within the YIC structure [29], resulting in a retarding of the melting rate of the ice cream. This resulted in the ice cream becoming more stable during some periods before melting into liquid. YIC with 10%-fat also possessed more viscosity in the serum phase compared to 2%-fat YIC. Consequently, 10%-fat YIC was able to stabilize and maintain shape while melting more effectively than 2%-fat YIC. Thus, YIC with a higher fat content melted more slowly than YIC with a lower fat content [25].
The addition of GOS or FOS to 2%-fat YIC did not affect the melting rate, probably because 2%-fat YIC melted too quickly due to its large content of large ice crystals and its low serum phase viscosity. Thus, the melting rate of YICs with 2%-fat content containing GOS and FOS was not significantly different in this study. However, the addition of prebiotics to 10%-fat YIC resulted in a statistically significant higher melting rate of YIC than that of control. This might have been due to the addition of probiotics, which are composed of short chains of oligosaccharides that intensified the unfrozen serum phase of YIC, resulting in a freezing point depression [27]. Moreover, the 10%-fat YIC with GOS seemed to melt faster than YICs with FOS (both with 1 and 2%) or without GOS or FOS. This can be attributed to the chain length of FOS which could retard the movement of water in the unfrozen serum phase in YIC [30]. The longer the chain length of FOS than GOS, the more effective it is in preventing or slowing down the movement of water, resulting in a lower melting rate as found in 10%-fat YIC containing FOS. However, interestingly, the 10%-fat YIC without GOS and FOS showed the lowest melting rate. This meant that the prebiotics interfered with or reduced the strength of a three-dimensional fat network in YIC by disintegration of fat networks from neat and strong networks to weak and disrupted ones. Consequently, those fat networks could not hold the unfrozen serum phase in YIC and could not retain the YIC shape effectively when compared to the YIC without prebiotics.
3.5. Microstructure of YIC
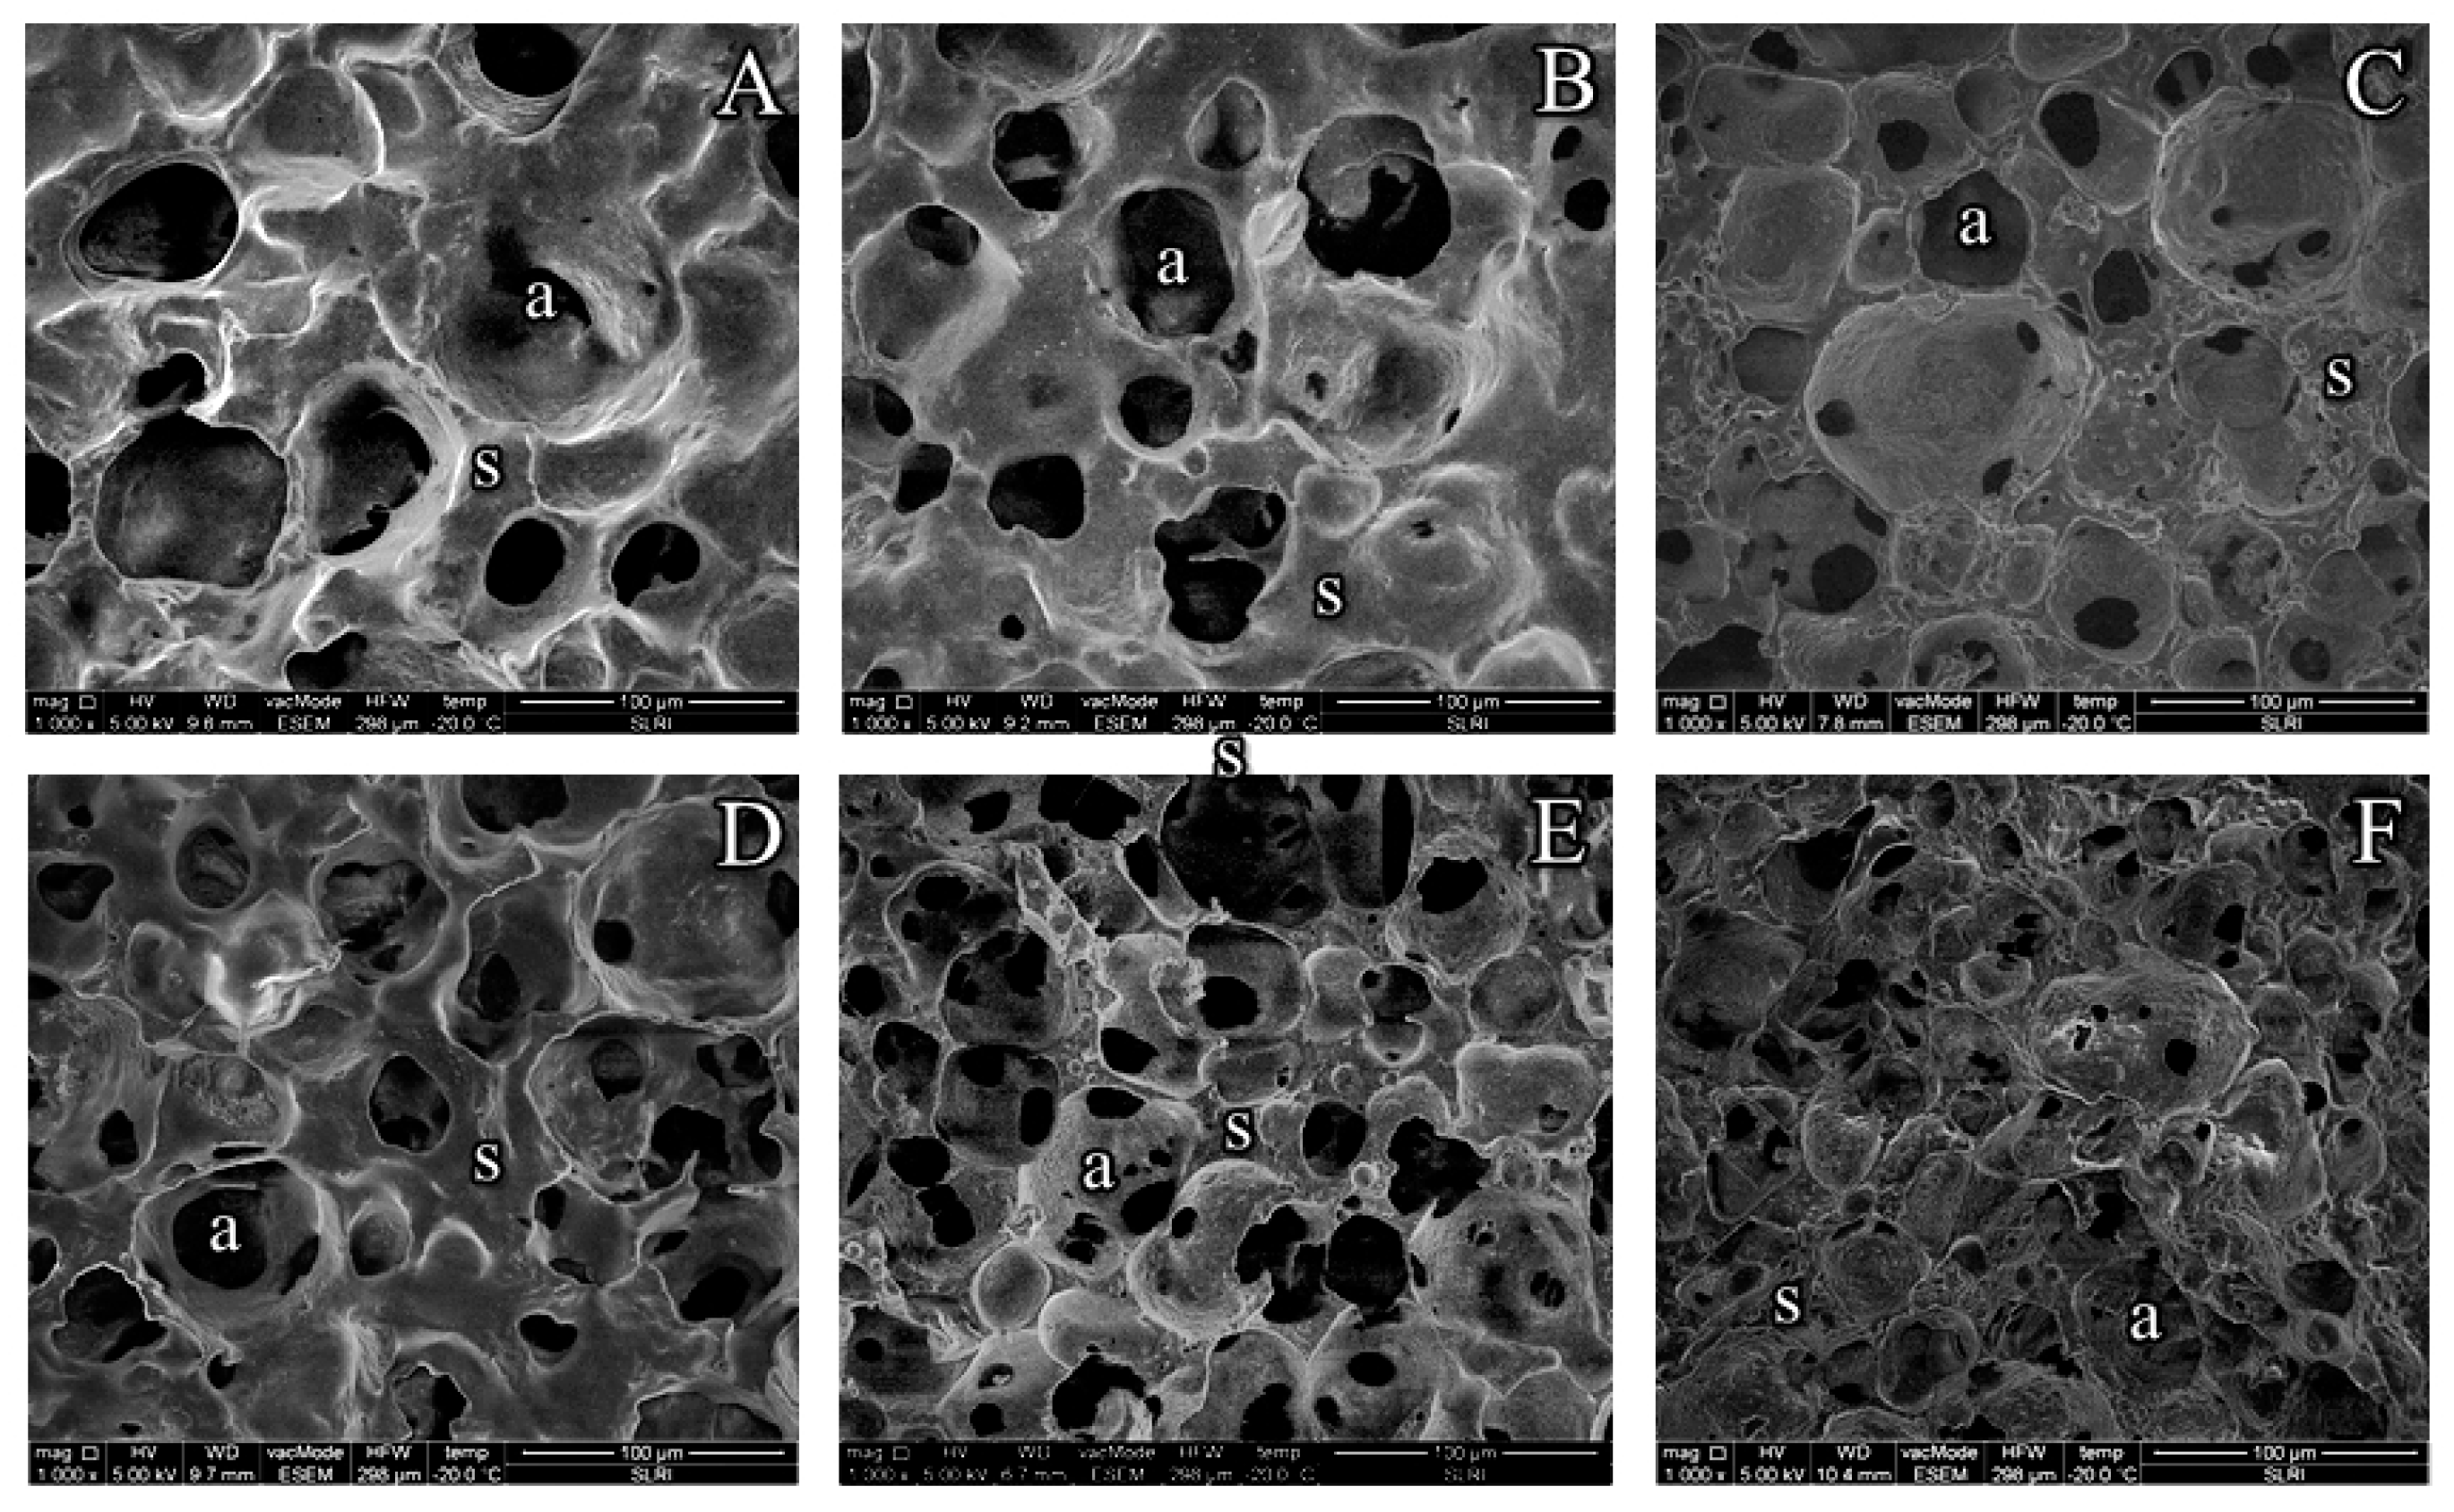
The microstructure of all YICs was explored by using LT-SME and the results are shown in Figure 4. The size and number of air cells in each YIC microstructure were noticeably different. YIC without prebiotics (Figure 4 A and D) seemed to be larger in air size but the number of air cells seemed to be smaller than the one containing prebiotics (Figures 4 B, C, E, and F). This means that the prebiotics influenced the microstructure of YIC. Thus, evidently, GOS or FOS promoted many tiny bubbles in YIC. As a result, YIC with the addition of prebiotics, especially GOS, had a lower hardness than YIC without GOS, as the probe of the texture analyzer was able to penetrate through the sample more easily than ice cream with fewer air bubbles. In particular, the addition of FOS resulted in small bubbles, and significantly outnumbered samples of YIC with GOS and control but the hardness of FOS-YIC was not significantly different from that of YIC without FOS (Figure 2). This can be attributed to the addition of FOS providing an increase in the elasticity properties of the YIC mix rather than GOS (Figure 1). Thus, FOS-YIC during the whipping and freezing processes had a greater ability to prevent the recombination of air bubbles than GOS-YIC which had lower elasticity properties. With lower elasticity, GOS had a larger bubble size than FOS-YIC because air bubbles in GOS-YIC had occasionally crashed into each other and formed larger bubbles more easily than in FOS-YIC. However, Balthazar, et al. [30] reported that GOS-fortified ice cream had more air bubbles than controlled ice cream without the addition of prebiotics because GOS increased the viscosity of the serum phase around the surface of the air bubbles, which also prevented them from reuniting. Thus, the microstructure of such ice cream seemed to possess both small and round air cells (Figure 4 B) rather than that of control YIC (Figure 4 A), resulting in a lower hardness.
However, FOS showed a greater ability to induce the dense structure of YIC than GOS in both 2% and 10%-fat YIC. This can be attributed to the fact that FOS possessed a longer chain length which might have combined with itself to produce microcrystals [24], resulting in a denser structure of FOS-YIC than in GOS-YIC. Thus, YIC with FOS seemed to provide a more complicated microstructure than GOS and provided a harder texture than GOS-YIC (Figure 2).
Regarding the effect of fat content on the microstructure of YIC, it was found that 10%-fat YIC had a greater number of air bubbles than 2%-fat YIC, and the air bubbles of 10%-fat YIC (Figures 4 D, E, and F) were smaller than those of 2%-fat YIC (Figures 4 A, B, and C), when compared with the same concentration and type of prebiotic. As a result, 10%-YIC had a lower melting rate than 2%-YIC , but it had a stronger structure with a firmer three-dimensional fat network. Therefore, the greater the amount of fat, the stronger the structure of this fat lattice body because it prevented the air bubbles and ice crystals from fusing together [25]. In addition, the use of more fat content in the ice cream ingredients provided higher elasticity that caused the size of the air bubbles in YIC to be smaller and closer in diameter length than the use of lower fat content.
Figure 4.
Microstrutures of yogurt ice cream with different fat content and prebiotics. A = Control 2% Fat (C2), B = 2% Fat + 2% galacto-oligoshaccharides (G2-2), C = 2% Fat + 2% fructo-oligoshaccharides (F2-2), D = Control 10% Fat (C10), E = 10% Fat + 2% galacto-oligoshaccharides (G10-2), and F = 10% Fat + 2% fructo-oligoshaccharides (F10-2). a = air cell, s = serum phase, the bar in the figure represents 100 μm.
3.6. Sensory evaluation of YIC
There were no significant differences among the YIC samples in the attributes of appearance, yogurt flavor, sweetness, sourness, sandiness, and melting behavior of YIC as shown in Table 3. Since those attributes, especially the appearance, yogurt flavor, sweetness, and sourness seemed to be related to the contribution of the same amount of yogurt added to all the YIC formulations. Also, the sandiness and melting behavior of YIC found in the YIC samples containing different amounts of fat content was not significant. This means that the different amounts of fat content and added prebiotics did not influence the sensorial results for those attributes. However, the scores for firmness and overall acceptance were statistically significant among the samples of YICs. The firmness score of 10%-fat YIC was mainly higher than that of 2%-YIC, except for C2, F2-1, and F2-2 formulas whose firmness was almost the same as that of 10%-fat YIC. These results were similar to the results of hardness as measured by the texture analyzer (Figure 2) that was attributed to the main effect of GOS which reduced the hardness of YIC. However, the overall results of firmness detected by the panelists in this study showed that the higher the fat content in YIC, the firmer it was. Thus, the texture of 10%-fat YIC was heavier and firmer than that of 2%-fat YIC which was due to its stronger three-dimensional fat network and better fat coalescence found in 10%-fat YIC than in 2%-fat YIC. This result is confirmed by the results of the fat destabilization which showed that a fat particle size of 10%-fat YIC mix was larger than that of 2%-fat YIC mix (Table 2). However, the overall acceptance scores were divided into two groups: group 1: C2, G2-1, F2-1, F2-2, G10-1, G10-2, and group 2: G2-2, C10, F10-1, F10-2. The overall acceptance score of group 1 is less than that of group 2. This means that the YIC samples in group 2 were more acceptable than those in group 1. This might be due to the individuals of each panelist having different sensorial experiences. However, a careful observation of the sensorial results showed that the interaction effect of the fat-content at 10% fat and FOS seemed to result in a greater acceptance level than that of 2% fat and GOS. However, Isik, Boyacioglu, Capanoglu, and Erdil [22] and Soukoulis, Fisk, and Bohn [31] stated that adding prebiotics to ice cream affected its softness, creamy taste, and greasy-feel as well.
3.7. Survival of B. longum in YIC during storage
The survival of B. longum in YIC during storage was examined and the results are shown in Figure 5. The initial upload of B. longum into the YIC mix was 109 CFU g-1 for all YIC samples. The number of colonies that survived decreased from 109 to 108.5 CFU g-1 after the YIC mix was whipped and frozen in the ice cream maker. During the whipping and freezing processes, shear forces occurred which could damage and injure the microbial cells. While the YIC cooled during the whipping process it formed ice crystals in its internal structure which could harm the B. longum cells [9] [11]. In addition, the whipping and freezing processes added air to the ice cream and B. longum which is an oxygen sensitive microorganism decreased in number [32]. Interestingly, in F2-2 YIC, the number of colonies of B. longum that survived was significantly higher than the number of colonies of the other YIC formulars throughout the storage time from day 0 - 90. This indicated that FOS at 2% in 2%-fat YIC enabled B. longum to tolerate a severe environmental condition such as a frozen state and air-filled environment in the ice cream. The same results were also exhibited in F2-1, F10-1 and F10-2 YIC containing FOS while all YIC samples with GOS seemed to show a lower survival rate of B. longum. This could be attributed to the stronger and firmer structure from FOS which formed microcystals and from the three-dimensional fat networks which could protect B. longum from such severe conditions. The number of B. longum that survived between day 90 to 120 of FOS-YIC did not seem to be significantly different for all YICs containing FOS, but this number was higher than that of YICs containing GOS. Therefore, in this study, FOS was found to be more effective in enhancing the survival of B. longum than GOS in a frozen condition like YIC. This contrasted with the findings of Criscio, et al. (2010) which showed that there was no difference in the survival number of Lactic acid bacteria in ice cream containing GOS or FOS. However, it is clear that YIC without GOS or FOS showed the lowest number of surviving B. longum after days 120 - 180 in this study. This strongly confirmed that such prebiotics could strengthen the survival of B. longum and is similar to the study of Akalin and Erisir [24] who found that adding inulin and FOS as prebiotics to ice cream helped to increase the survival rate of Lactobacillus acidophilus La-5 and B. animalis Bb-12 because such prebiotics are a source of carbon and energy for such microorganisms. However, when the YICs were stored and frozen at a very low temperature (-20 OC) for a long time, larger ice crystals formed. Thus, such ice crystals injured the B. longum cells inside the ice cream [24].
Regarding the effect of fat content on the survival of probiotics in ice cream, Alamprese, Foschino, Rossi, and Pompei [33] and Santos Leandro, Araújo, Conceição, Moraes, and Carvalho [34] found that there was no statistically significant difference in the numbers of surviving probiotics used in their experiments in the ice cream samples with low, medium, and high fat content, stored at -16 oC for 30 - 40 days, respectively. These results are consistent with those of this study even though their probiotics were Lactobacillus rhamnosus GG and Lactobacillus delbrueckii UFV H2b20, respectively. This confirms that even if different strains of probiotics are used with different storage times, the survival of probiotic were the same. In conclusion, however, the amount of B. longum which survived in this study was more than 106 CFU g-1 over the entire storage period of 180 days.
3.7. Survival of B. longum in a simulated GI tract
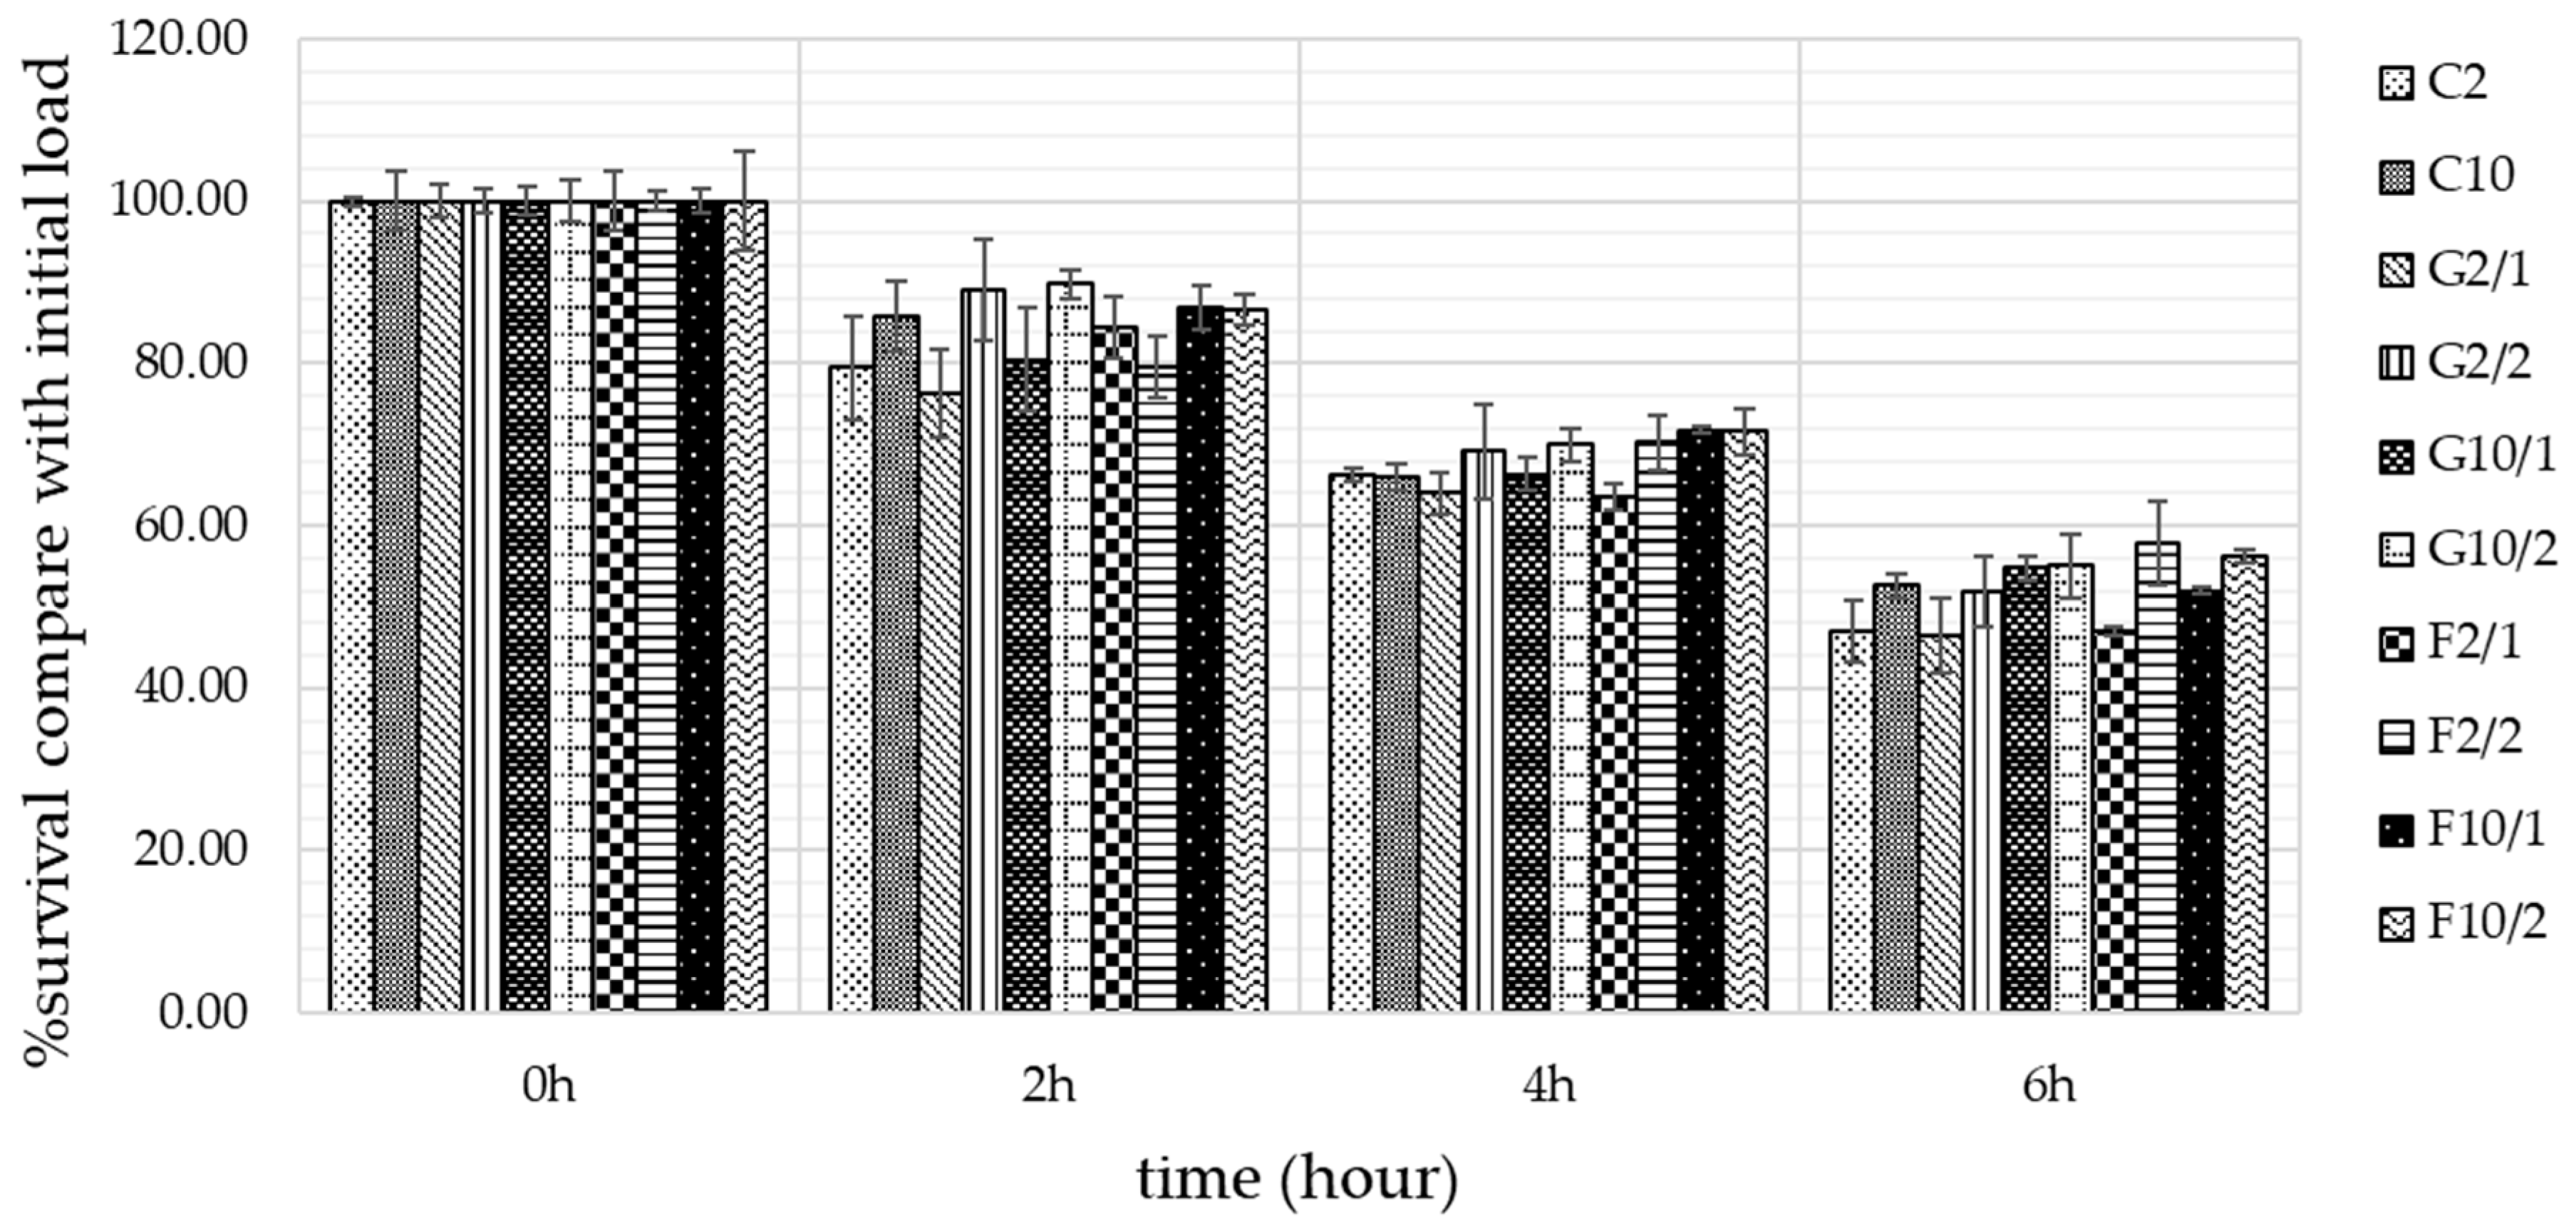
After storing YIC for 15 days at -20 oC, the YIC samples were used to determine the survival of B. longum in a simulated GI tract. The results showed that the average number of B. longum that survived in a simulated stomach condition decreased by 1.71 log CFU g-1 or 16.18% from the initial load of 100% within 2 h for all YIC samples (Figure 6). In a simulated intestine condition, the average number of B. longum which survived decreased by 1.69 log CFU g-1 or 15.93% and 1.67 log CFU g-1 or 15.82% from the initial load of 100% within 4 and 6 h, respectively, for all YIC samples. The decrease in the number of B. longum that survived in the simulated GI tract occurred because the pH in this tract (pH in stomach was 2.0 and pH in intestine was about 7.4) was not suitable for B. longum which can survive more easily in pH 6-7 [35], so some of the B. longum died. In addition, the bile in the intestine destroyed the cell walls of B. longum and caused cell destabilization and damage because gram-positive bacteria such as B. longum generally has a low resistance to bile [36].
Regarding the effects of fat on the survival of B. longum, it was found that fat contributed to statistically significant increases in the degree of survivability of this microorganism (Figure 6). This might be because fat particles encapsulated and prevented microbial cells from coming into direct contact with digestive juice in gastric and intestinal conditions. As well as the effect of fat, prebiotics such as GOS and FOS also affected the survival of B. longum in the simulated GI tract. Figure 6 shows that the number of B. longum which survived in the YIC with GOS or FOS was higher than that of YIC without GOS or FOS. However, it also seemed that the number of B. longum which survived in the FOS-YIC was higher than that in GOS-YIC. Moreover, YIC with a higher concentration of prebiotics in this study showed the number of B. longum that survived was higher than in YIC with a lower concentration of such prebiotics. Thus, the content of fat, concentration of prebiotics, and type of prebiotics affected the number of B. longum that survived in the YIC in this study.
Figure 6.
Means and standard deviations of percentage survival B. longum in yogurt ice cream with. different fat content and prebiotics in simulated gastrointestinal tract with different times.
Figure 6.
Means and standard deviations of percentage survival B. longum in yogurt ice cream with. different fat content and prebiotics in simulated gastrointestinal tract with different times.
4. Conclusions
The fat particle size and pH as the physicochemical properties of yogurt ice cream mix containing B. longum as probiotics and GOS or FOS varied among the mixes containing different fat content. The higher the fat content in the ice cream, the larger the fat particle size and the lower the pH of the mixes. FOS provided elasticity to those mixes rather than GOS, resulting in more solid-like characteristics which contributed to a greater hardness in the yogurt ice cream. This could have caused the ice cream to melt more slowly but it showed a denser structure with a complicated three-dimensional fat network and smaller air cells than the yogurt ice cream containing GOS. Moreover, the higher fat content in 10%-fat yogurt ice cream contributed to a greater hardness than that in 2%-fat yogurt ice cream. However, both GOS and FOS in yogurt ice cream played an important role in the survival of a number of B. longum by 106 CFU g-1 in the ice cream during the storage time of up to 180 days and resulted in a higher percentage of survival in the simulated gastrointestinal tract when compared to that of the yogurt ice cream without either GOS or FOS. These findings could be useful to ice cream manufacturers for the production of low fat and full fat yogurt ice cream containing prebiotics and probiotics like B. longum as a functional and healthy food. However, to enhance the survival rate of such probiotics, the encapsulation technique should be studied further.
Author Contributions
Conceptualization, S.T.; methodology, S.T. and W.T.; laboratory procedures, W.T.; formal analysis, S.T. and W.T.; data curation: S.T.; writing-original draft preparation, W.T.; writing-review and editing, S.T.; supervision, S.T.; funding, S.T. Both authors have read and proved this published manuscript.
Funding
Suranaree University of Technology Research and Development Fund provided funding for this study.
Institute Review Board Statement
Not applicable.
Informed Consent Statement
Not applicable.
Data Availability Statement
Data available upon request.
Acknowledgements
The authors would like to thank Suranaree University of Technology Research and Development Fund.
Conflicts of Interest
There is no conflict of interest in this study.
References
- F. Clydesdale, "FOOD TECHNOLOGY MAGAZINE," 1 December 2004. [Online]. Available: https://www.ift.org/news-and-publications/food-technology-magazine/issues/2004/december/features/functional-foods-opportunities-and-challenges.
- N. M. Khair, N. A. A. Rahman, . A. S. Baharuddin, H. . S. Hafid and M. Wakisaka, "Capturing the impact of nanobubble liquid in enhancing the physical quality of ice cream," Journal of Agricultural and Food Engineering 2, pp. 1-4, 2020.
- Y.-K. Lee and S. Salminen, "The coming of age of probiotics," Trends in Food Science & Technology, pp. 241-245, 1995. [CrossRef]
- D. J. O’Sullivan, "Primary sources of probiotic cultures," in Probiotics in Food Safety and Human Health, Oxfordshire, Taylor & Francis Group, 2005, pp. 91-108.
- G. R. Gibson, "Fibre and effects on probiotics (the prebiotic concept)," Clinical Nutrition Supplements, pp. 25-31, 2004. [CrossRef]
- T. R. Marshall, H. D. Goff and R. W. Hartel, Ice cream, New York: Springer, 2003.
- H. D. Goff, Ice Cream and Frozen Desserts, New Jersey : Wiley, 2015.
- G. Cruz, A. E. Antunes, A. L. Sousa, . J. A. Faria and S. M. Saad, "Ice-cream as a probiotic food carrier," Food Research International, pp. 1233-1239, 2009. [CrossRef]
- Haynes and M. J. Playne, "Survival of probiotic cultures in low-fat ice-cream," Australian Journal of Dairy Technology, pp. 10-14, 2002.
- S. Adapa, H. Dingeldein, K. Schmidt and T. Herald, "Rheological Properties of Ice Cream Mixes and Frozen Ice Creams Containing Fat and Fat Replacers," Journal of Dairy Science, pp. 2224-2229, 2000. [CrossRef]
- M. Akin, M. Akin and Z. Kirmaci, "Effects of inulin and sugar levels on the viability of yogurt and," Food Chemistry , pp. 93-99, 2007. [CrossRef]
- S. Thaiudom "Effect of ratio of milk fat to soy bean oil and whipping time on qualities of milk ice cream," Songklannakarin Journal of Science and Technology, (in Thai), vol. 29, no. 1, pp. 191-204, 2007.
- F. Javidi, S. M. A. Razavi, F. Behrouzian and A. Alghooneh, "The influence of basil seed gum, guar gum and their blend on the rheological, physical and sensory properties of low fat ice cream," Food Hydrocolloids, pp. 625-633, 2016. [CrossRef]
- H. Goff, E. Verespej and A. Smith, "A study of fat and air structures in ice cream," International Dairy Journal, pp. 817-829, 1999. [CrossRef]
- L. Abadía-García, A. Cardador, S. T. Martín del Campo, S. M. Arvízu, E. Castaño-Tostado, C. Regalado-González, B. García-Almendarez and S. L. Amaya-Llano, "Influence of probiotic strains added to cottage cheese on generation of potentially antioxidant peptides, anti-listerial activity, and survival of probiotic microorganisms in simulated gastrointestinal conditions," International Dairy Journal, vol. 33, no. 2, pp. 191-197, 2013. [CrossRef]
- M. Abo-srea, E. Emara and T. H. EL-Sawah, "Impact of Konjac Glucomannan on Ice Cream-like Properties," International Journal of Dairy Science, pp. 177-183, 2017. [CrossRef]
- C. Tyl and G. D. Sadler, "pH and Titratable Acidity," in Food Analysis, Berlin, Springer, 2017. [CrossRef]
- Ahmadi, E. Milani, A. Madadlou, S. A. Mortazavi, R. R. Mokarram and D. Salarbashi, "Synbiotic yogurt-ice cream produced via incorporation of microencapsulated lactobacillus acidophilus (la-5) and fructooligosaccharide," Journal of Food Science and Technology, vol. 51, pp. 1568-1574, 2012. [CrossRef]
- M. L. Rolon, A. J. Bakke, J. N. Coupland, J. E. Hayes and R. F. Roberts, "Effect of fat content on the physical properties and consumer acceptability of vanilla ice cream," Journal of Dairy Science, pp. 5217-5227, 2017. [CrossRef]
- Floury, A. Desrumaux and J. Lardières, "Effect of high-pressure homogenization on droplet size distributions and rheological properties of model oil-in-water emulsions," Innovative Food Science & Emerging Technologies, pp. 127-134, 2000. [CrossRef]
- C. Balthazara, H. L. Silva, A. Vieira, R. Neto, L. Cappato, P. Coimbra, J. Moraes, M. Andrade, V. Calado, D. Granato, M. Freitas, M. Tavares, R. Raices, M. Silva and A. Cruze, "Assessing the effects of different prebiotic dietary oligosaccharides in sheep milk ice cream," Food Research International, pp. 38-46, 2017. [CrossRef]
- U. Isik, D. Boyacioglu, E. Capanoglu and D. N. Erdil, "Frozen yogurt with added inulin and isomalt," Journal of Dairy Science, pp. 1647-1656, 2011. [CrossRef]
- G. R. Gibson, "Fibre and effects on probiotics (the prebiotic concept)," Clinical Nutrition Supplements, pp. 25-31, 2004. [CrossRef]
- Akalin and D. Erisir, "Effects of Inulin and Oligofructose on the Rheological Characteristics and Probiotic Culture Survival in Low-Fat Probiotic Ice Cream," Journal of Food Science, pp. 184-188, 2008. [CrossRef]
- M. Muse and R. Hartel, "Ice Cream Structural Elements that Affect Melting Rate and Hardness," Journal of Dairy Science, pp. 1-10, 2004. [CrossRef]
- X. Guinard, C. Zoumas-Morse, L. Mori, V. Uatoni, D. Panyam and A. Kilara, "Sugar and fat effects on sensory properties of ice cream," Journal Of Food Science, pp. 1087-1094, 1997. [CrossRef]
- Akbari, M. H. Eskandari, M. Niakosari and A. Bedeltavana, "The effect of inulin on the physicochemical properties and sensory attributes of low-fat ice cream," International Dairy Journal, pp. 52-55, 2016. [CrossRef]
- R. Wlibey and T. Cooke, "Effects of solute concentration, overrun and storage on the hardness of ice cream," International Dairy Federation, pp. 186-187, 1998.
- R. P. Sofjan and R. W. Hartel, "Effects of overrun on structural and physical characteristics of ice cream," International Dairy Journal, pp. 255-262, 2004. [CrossRef]
- C. Balthazar, H. A. Silva, A. Vieira, R. Neto, L. Cappato, P. Coimbra, J. Moraes, M. Andrade, V. Calado, D. Granato, M. Freitas, M. Tavares, R. Raices, M. Silva and A. C. Erdil, "Prebiotics addition in sheep milk ice cream: A rheological, microstructural and sensory study," Journal of Functional Foods, pp. 564-573, 2017. [CrossRef]
- C. Soukoulis, I. D. Fisk and T. Bohn, "Ice Cream as a Vehicle for Incorporating Health-Promoting Ingredients: Conceptualization and Overview of Quality and Storage Stability," Comprehensive Reviews in Food Science and Food Safety, pp. 627-655, 2014. [CrossRef]
- K. Kailasapathy and K. Sultana, "Survival and beta-D-galactosidase activity of encapsulated and free Lactobacillus acidophilus and Bifidobacterium lactis in ice-cream," Australian Journal of Dairy Technology, pp. 223-227, 2003.
- C. Alamprese, R. Foschino, M. Rossi and C. Pompei, "Effects of Lactobacillus rhamnosus GG addition in ice cream," International Journal of Dairy Technology, pp. 200-206, 2005. [CrossRef]
- E. Santos Leandro, E. A. Araújo, L. L. Conceição, C. A. Moraes and A. F. Carvalho, "Survival of Lactobacillus delbrueckii UFV H2b20 in ice cream produced with different fat levels and after submission to stress acid and bile salts," Journal of Functional Foods, pp. 503-507, 2013. [CrossRef]
- P. Shah, "Functional cultures and health benefits," International Dairy Journal, pp. 1262-1277, 2007. [CrossRef]
- Begley, C. G. Gahan and C. Hill, "The interaction between bacteria and bile," FEMS Microbiology Reviews, pp. 625-651, 2005. [CrossRef]
Figure 1.
tan δ of yogurt ice cream mix at a range of differentfrequencies.
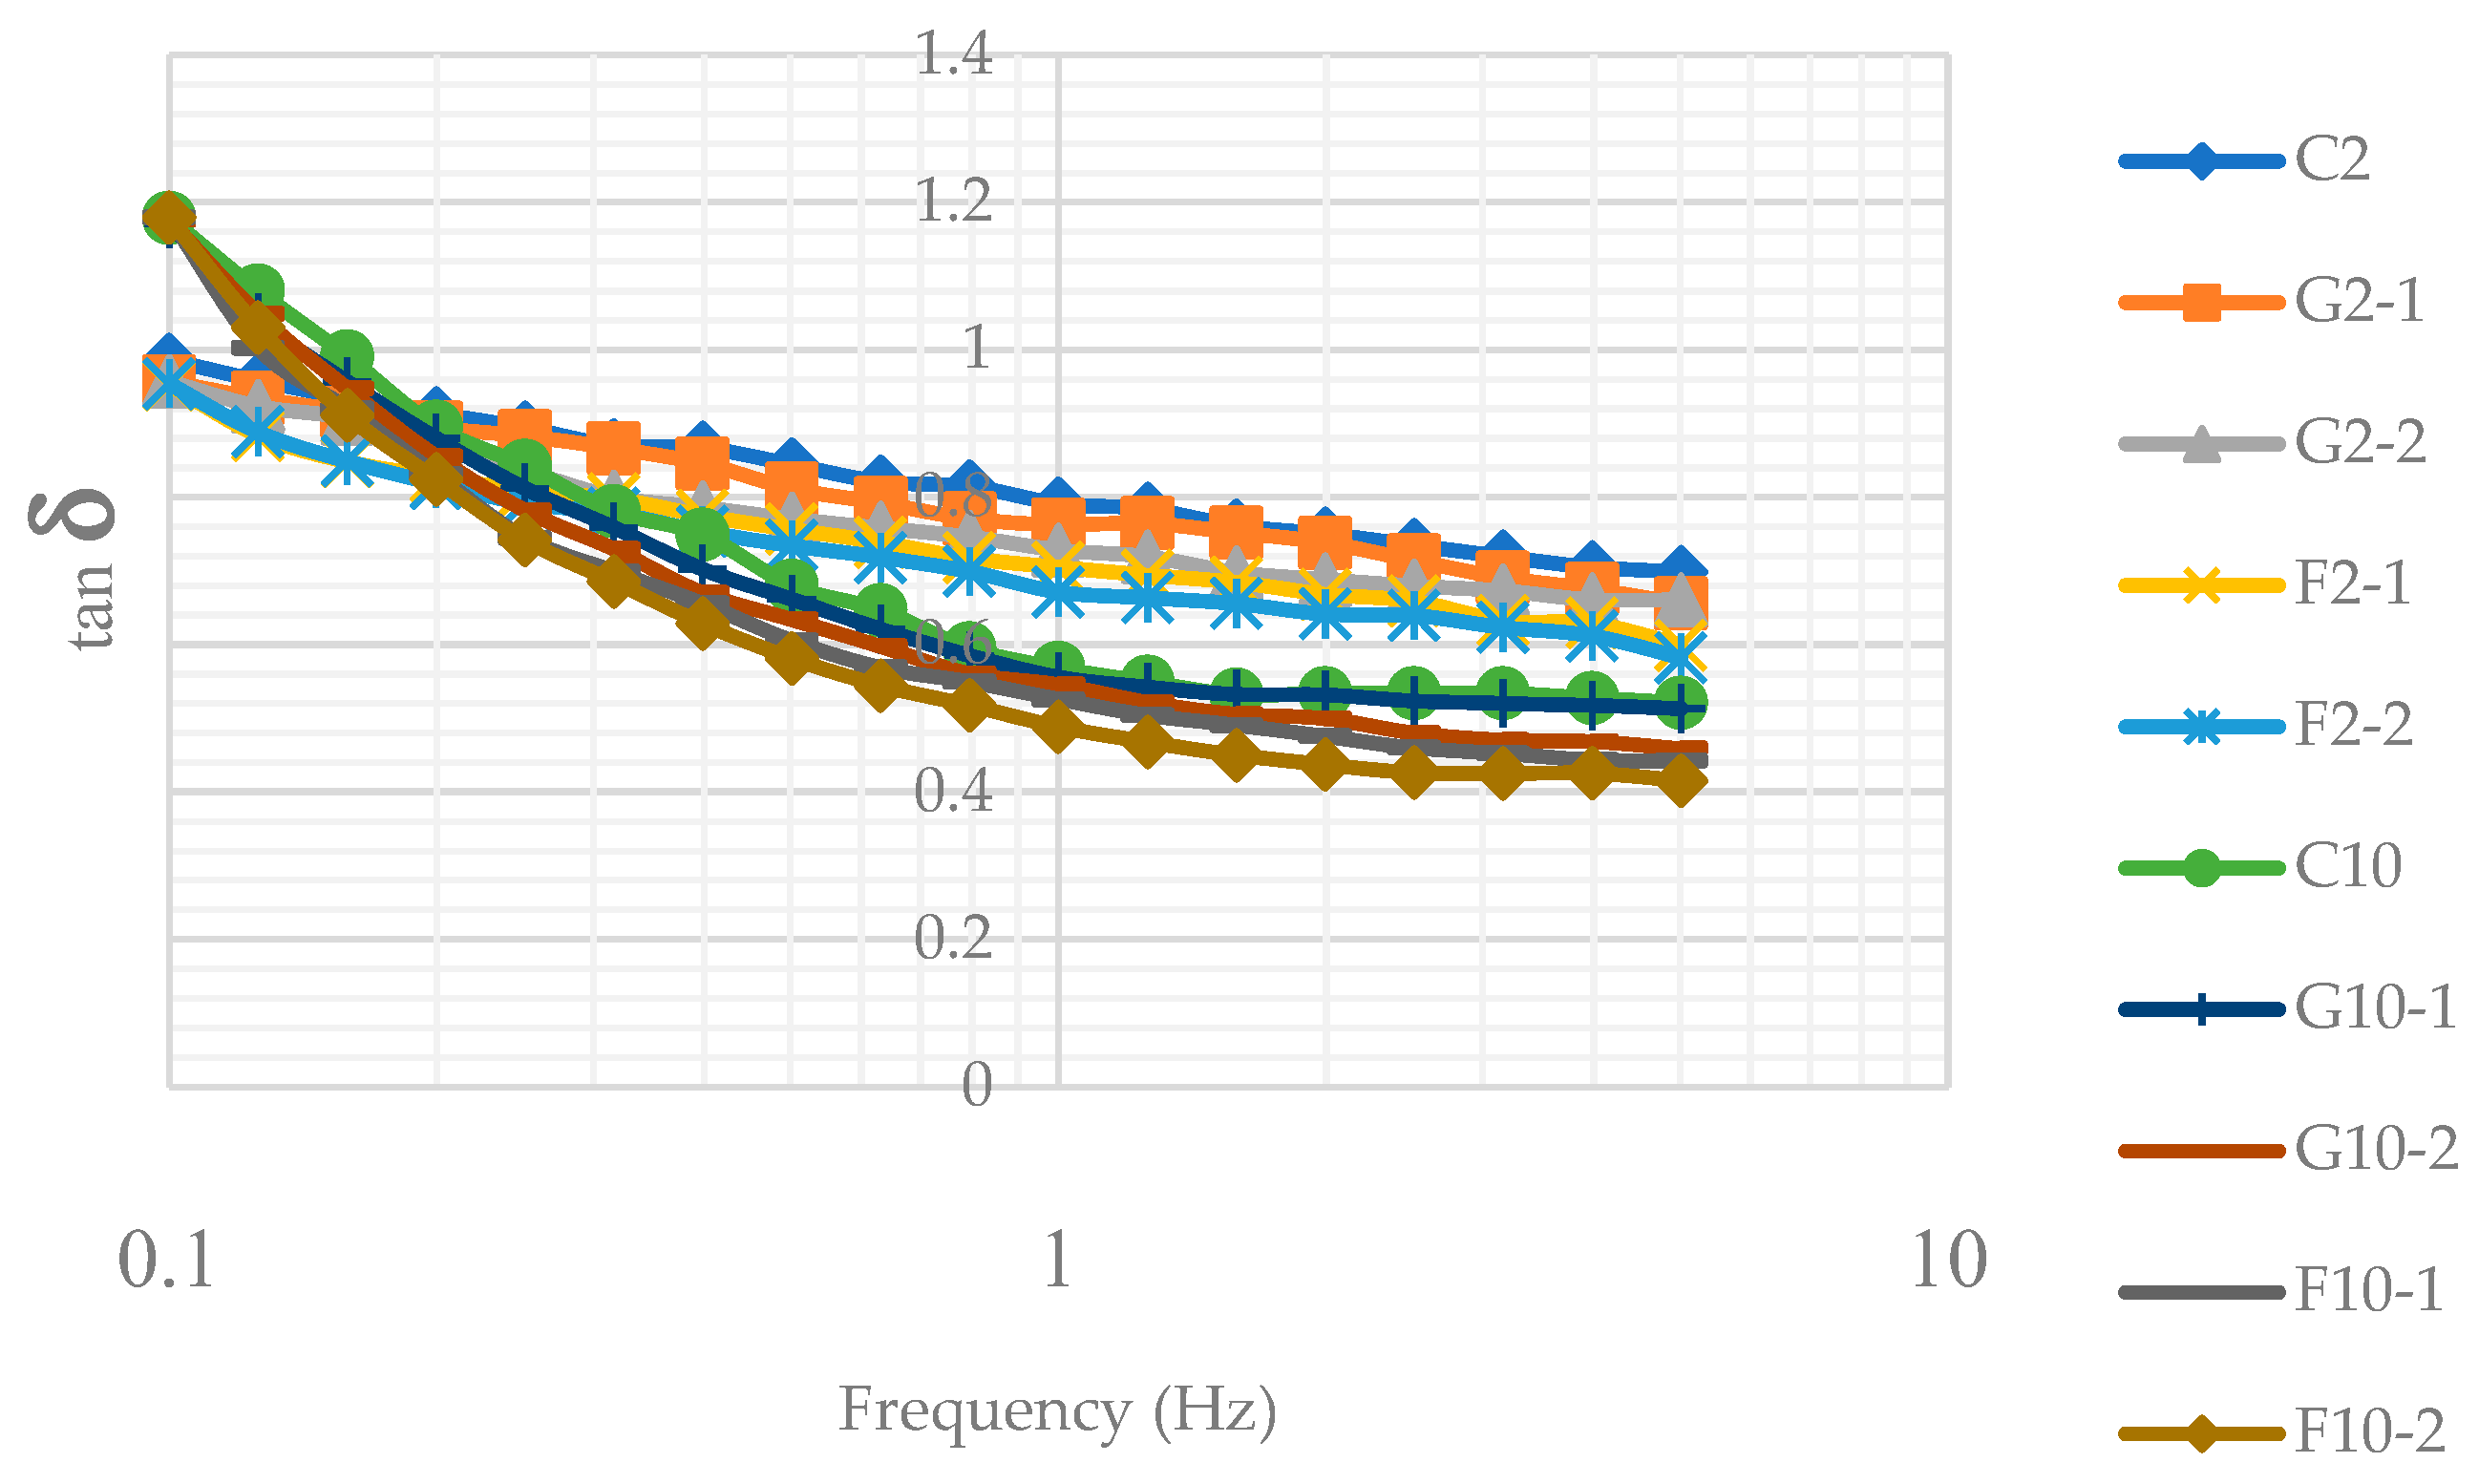
Figure 3.
Melting curve of yogurt ice cream with different fat content and prebiotics.
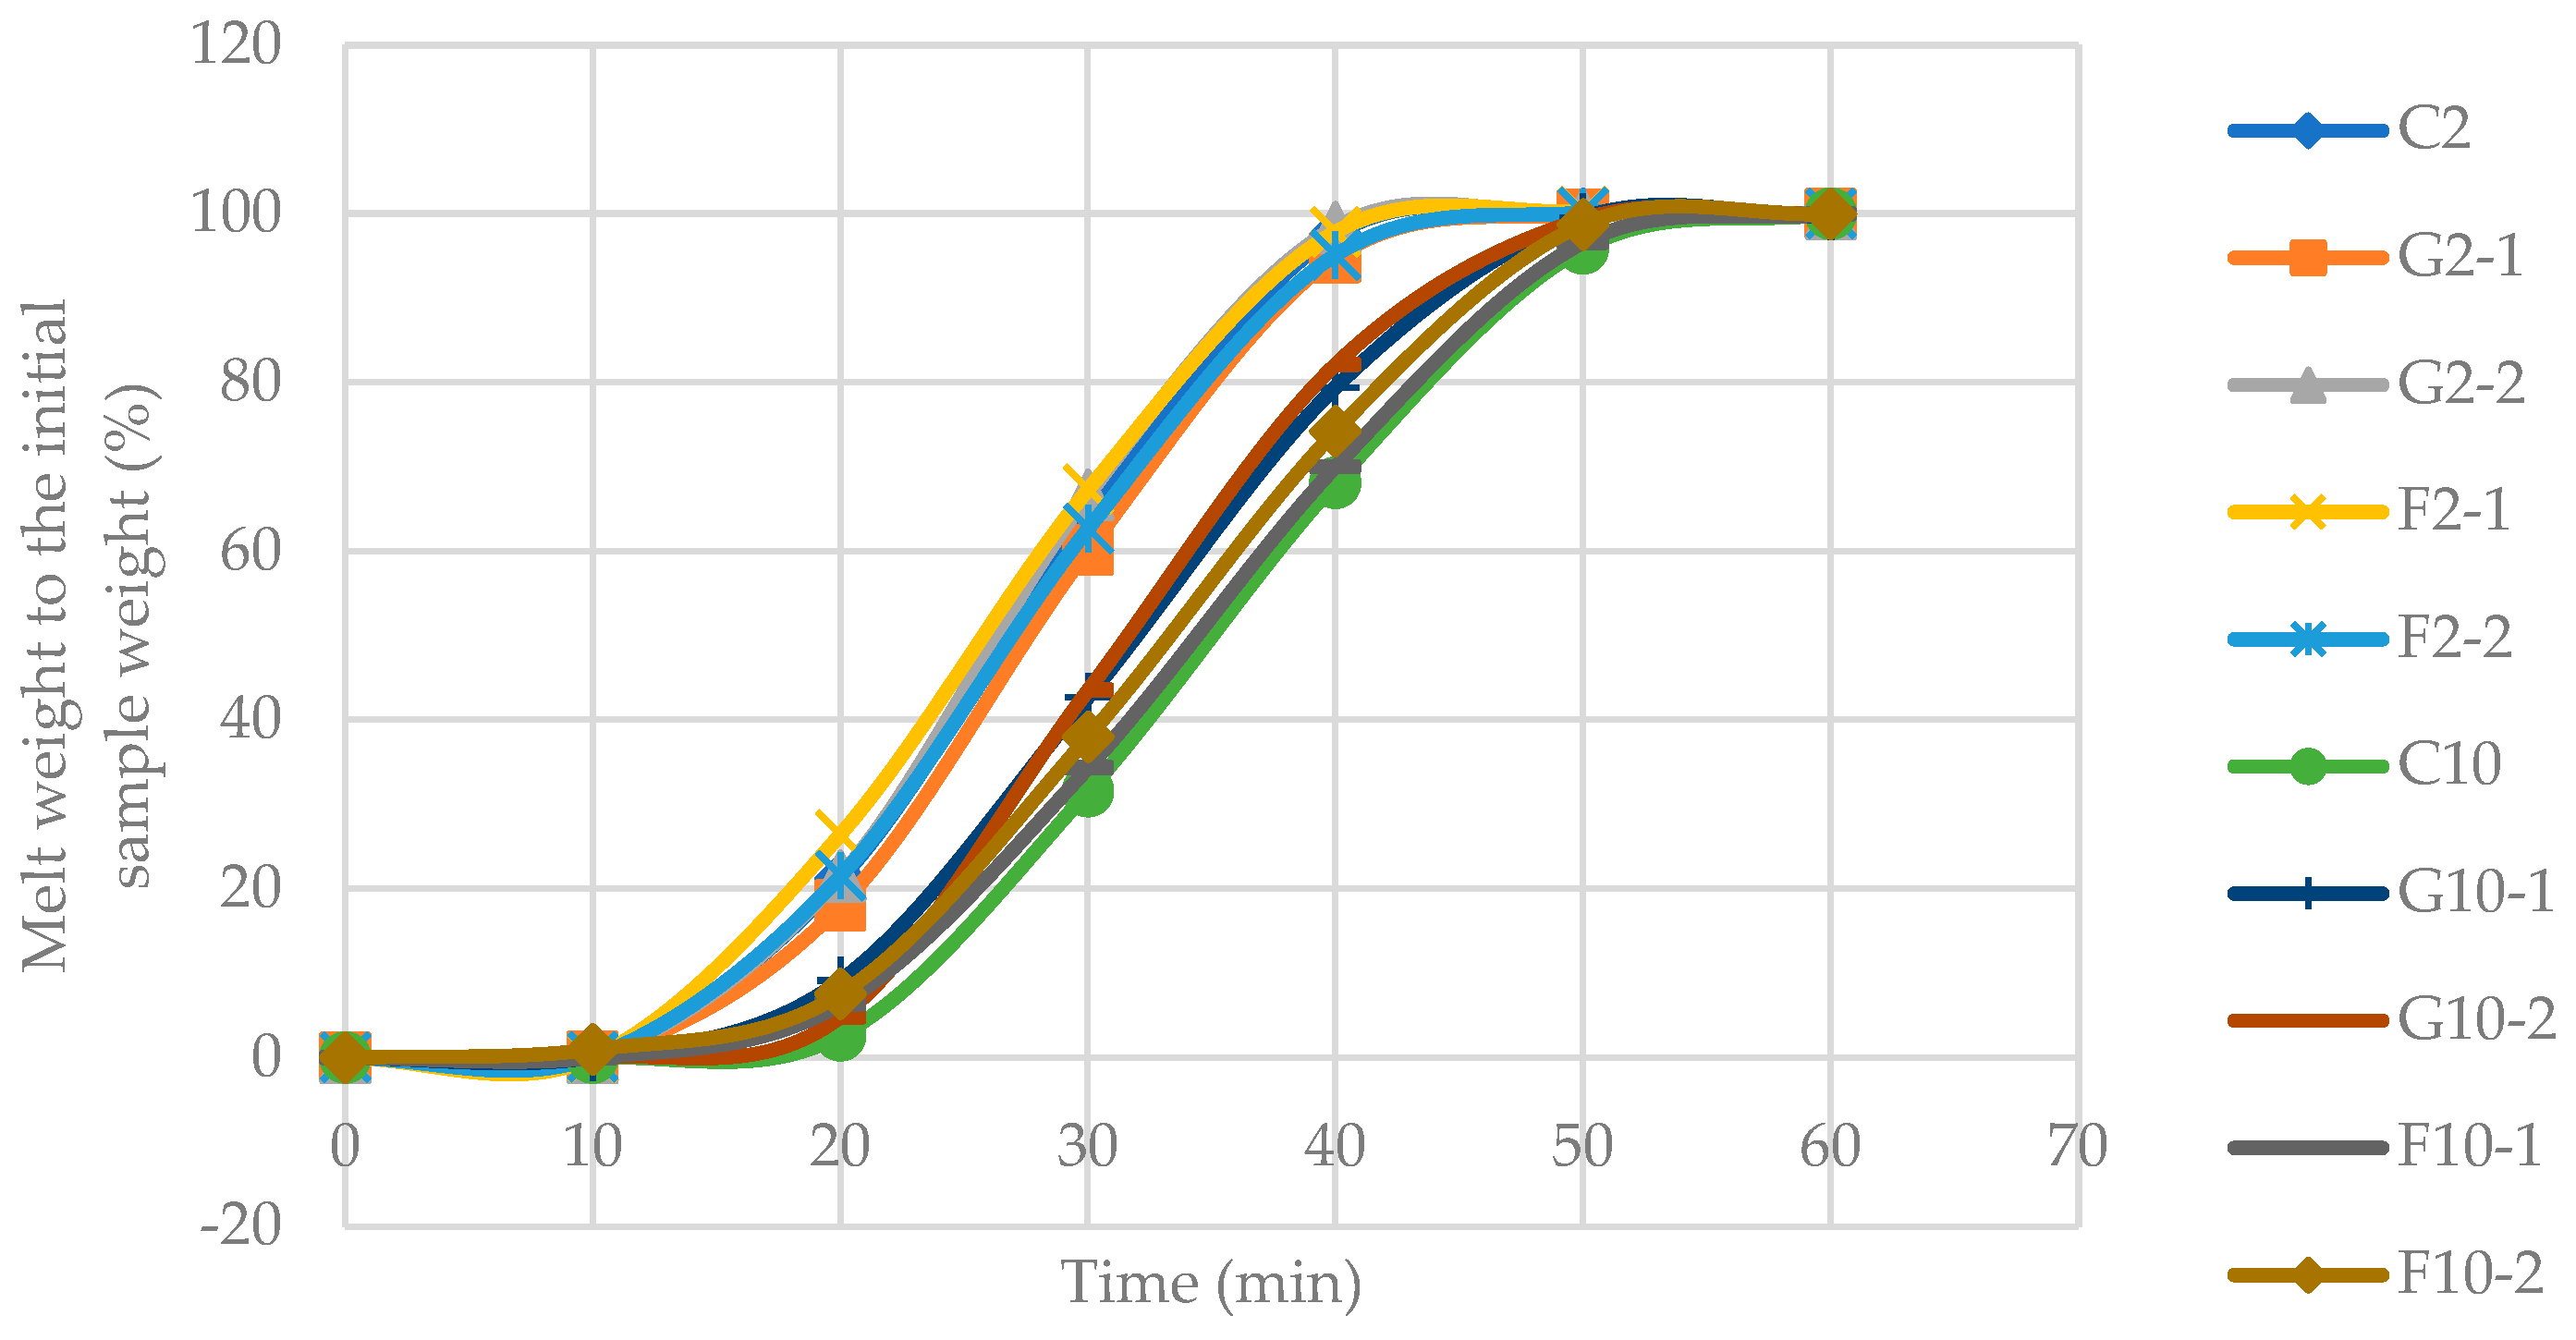
Figure 5.
Viable count of B. longum in yogurt ice cream with different fat content and prebiotics during storage for 6 months.
Figure 5.
Viable count of B. longum in yogurt ice cream with different fat content and prebiotics during storage for 6 months.
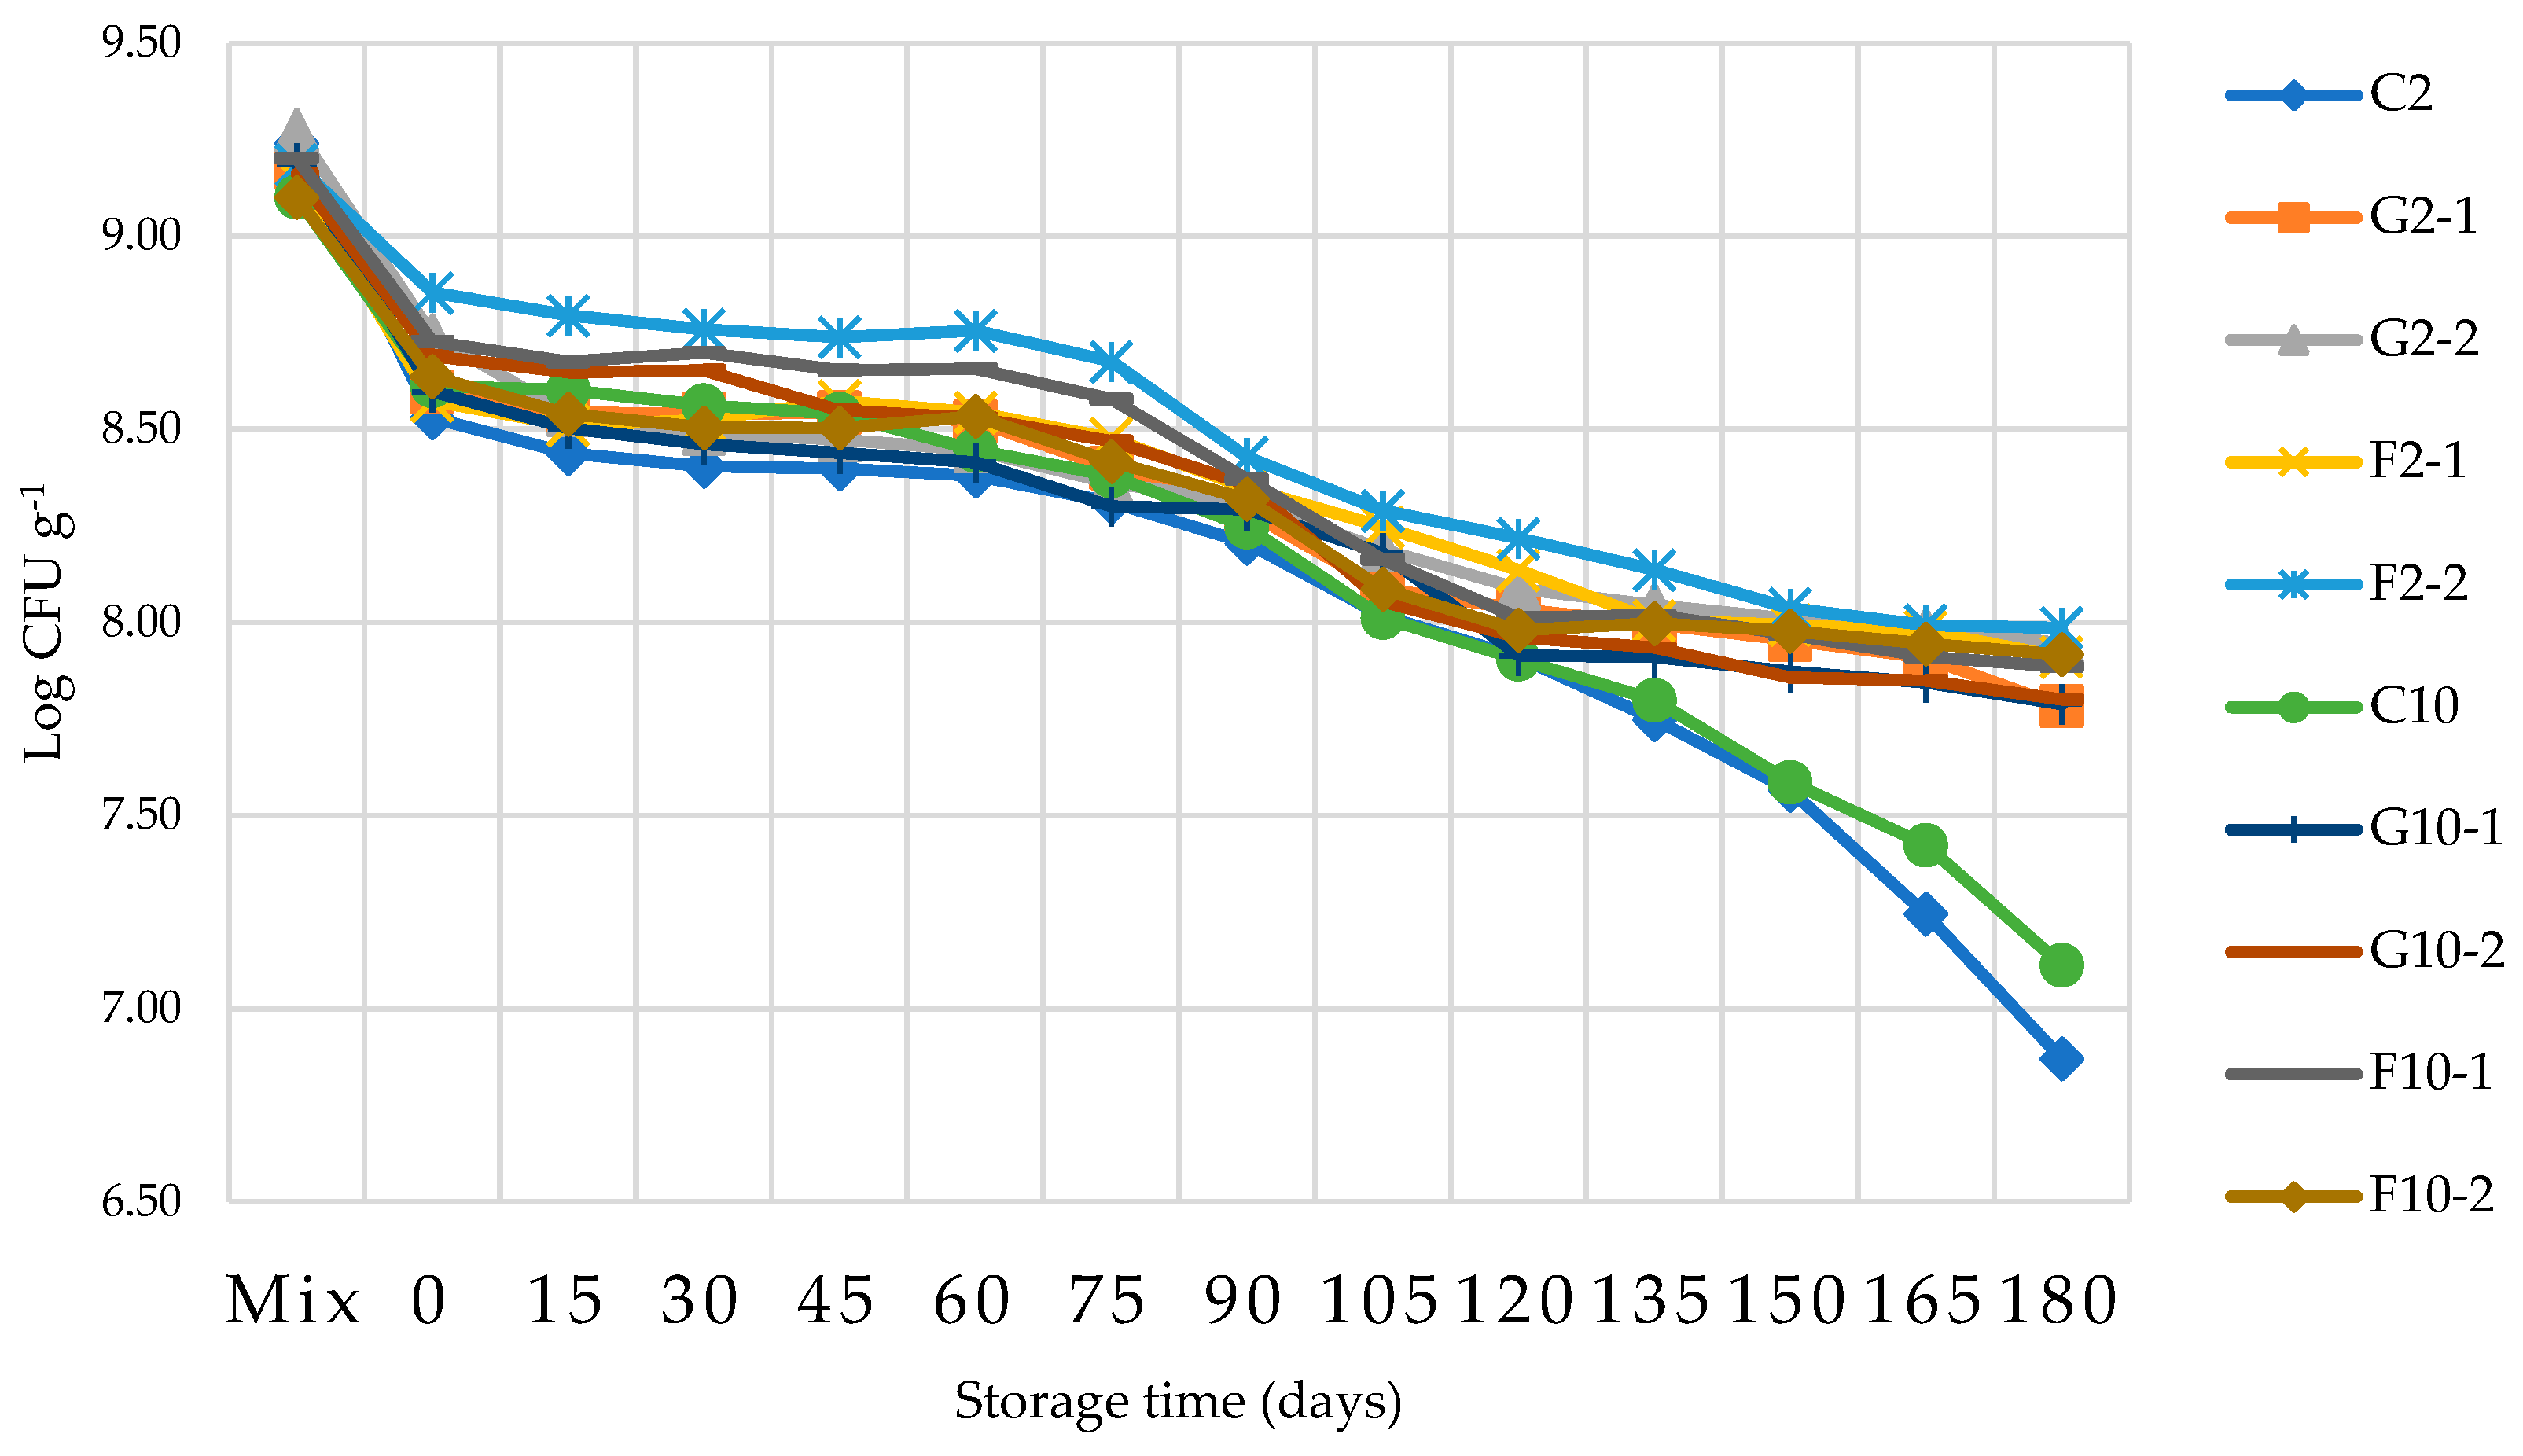

Table 1.
The formulas and ingredients used to produce yogurt ice cream (% w/w).
| Ice cream formulas |
code | SMP | sucrose | glucose | butter fat | S/E | FOS | GOS |
|---|---|---|---|---|---|---|---|---|
| Control with 2% fat | C2 | 13 | 11 | 6 | 2 | 0.4 | - | - |
| Control with 10% fat | C10 | 13 | 11 | 6 | 10 | 0.4 | - | - |
| 2% fat + 1% FOS | F2-1 | 13 | 11 | 6 | 2 | 0.4 | 1 | - |
| 2% fat + 2% FOS | F2-2 | 13 | 11 | 6 | 2 | 0.4 | 2 | - |
| 10% fat + 1% FOS | F10-1 | 13 | 11 | 6 | 10 | 0.4 | 1 | - |
| 10% fat + 2% FOS | F10-2 | 13 | 11 | 6 | 10 | 0.4 | 2 | - |
| 2% fat + 1% GOS | G2-1 | 13 | 11 | 6 | 2 | 0.4 | - | 1 |
| 2% fat + 2% GOS | G2-2 | 13 | 11 | 6 | 2 | 0.4 | - | 2 |
| 10% fat + 1% GOS | G10-1 | 13 | 11 | 6 | 10 | 0.4 | - | 1 |
| 10% fat + 2% GOS | G10-2 | 13 | 11 | 6 | 10 | 0.4 | - | 2 |
Table 2.
Physicochemical properties of YIC prepared with different prebiotic and fat content.
| Sample | pH | Total acidityns (%) |
Overrunns (%) |
Fat particle size (µm) |
|---|---|---|---|---|
| C2 | 6.464±0.01b | 0.289±0.01 | 34.54±1.41 | 0.25736a |
| G2-1 | 6.447±0.00ab | 0.279±0.01 | 34.86±0.71 | 0.23105a |
| G2-2 | 6.449±0.00ab | 0.276±0.00 | 34.30±0.54 | 0.22300a |
| F2-1 | 6.454±0.00b | 0.265±0.00 | 34.42±1.69 | 0.22198a |
| F2-2 | 6.463±0.00b | 0.272±0.00 | 35.36±0.49 | 0.21595a |
| C10 | 6.433±0.00a | 0.273±0.02 | 34.27±1.29 | 1.09153d |
| G10-1 | 6.429±0.01a | 0.285±0.00 | 34.57±1.38 | 1.01056c |
| G10-2 | 6.433±0.00a | 0.279±0.00 | 35.30±1.46 | 1.00952c |
| F10-1 | 6.429±0.00a | 0.277±0.01 | 34.62±0.79 | 0.99850c |
| F10-2 | 6.432±0.02a | 0.272±0.02 | 34.74±1.47 | 0.92681b |
Values in the same column are the average of three experimental data with standard deviation. Different superscript letters indicate significant differences at p > 0.05. ns = not significantly different.
Table 3.
Sensorial results of yogurt ice cream with different fat content and prebiotics.
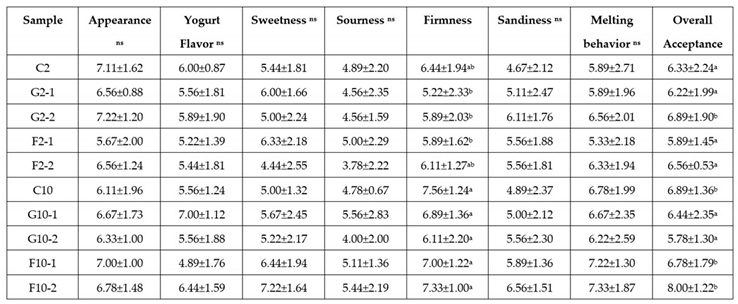
Values in the same column are the means with standard deviation. Different superscript letters indicate significant differences at p > 0.05. ns = non-significantly different.
Disclaimer/Publisher’s Note: The statements, opinions and data contained in all publications are solely those of the individual author(s) and contributor(s) and not of MDPI and/or the editor(s). MDPI and/or the editor(s) disclaim responsibility for any injury to people or property resulting from any ideas, methods, instructions or products referred to in the content. |
© 2023 by the authors. Licensee MDPI, Basel, Switzerland. This article is an open access article distributed under the terms and conditions of the Creative Commons Attribution (CC BY) license (http://creativecommons.org/licenses/by/4.0/).
Copyright: This open access article is published under a Creative Commons CC BY 4.0 license, which permit the free download, distribution, and reuse, provided that the author and preprint are cited in any reuse.
Submitted:
25 October 2023
Posted:
25 October 2023
You are already at the latest version
Alerts
This version is not peer-reviewed
Submitted:
25 October 2023
Posted:
25 October 2023
You are already at the latest version
Alerts
Abstract
Yogurt ice cream (YIC) containing Bifidobacterum longum subsp. longum TISTR 2195 (B. longum) with different fat contents (2 and 10% fat) and prebiotics (galacto-oligosaccharide, GOS and fructo-oligosaccharide, FOS) was investigated for its physicochemical properties, microstructure, and survival of B. longum during storage time and in a simulated gastrointestinal tract. Fat contents affected pH, fat particle size, hardness, melting rate, and solid-like characteristic of ice cream while FOS seemed to enhance the hardness and elasticity of YIC better than GOS due to less solubility and denser microstructure which exhibited more solid-like properties than YIC containing GOS. The interaction effect of fat content at 10% fat and FOS in YIC seemed to promote more sensorial acceptance than the ice cream containing 2% fat and GOS. The fat content, concentration of prebiotics, and type of prebiotics were attributed to the survival of B. longum in YIC. Moreover, the survival number of B. longum in YIC during storage for 180 days and in the simulated gastrointestinal tract was still in 106 CFU g-1, which is considered to benefit human health. Finally, probiotic YIC in this study could be used as a guide for functional ice cream manufacture future.
Keywords:
Subject: Biology and Life Sciences - Food Science and Technology
1. Introduction
The International Food Information Council Foundation (IFIC) defines functional food as food containing substances that are beneficial to health. In addition to having nutritious nutrients which help to prevent or cure diseases [1], alternative foods are becoming more popular nowadays as consumers pay more attention to their health. Ice cream is one of the most popular desserts in the world which is sold in many eateries, and it is recognized as the perfect dessert [2]. Developing ice cream products with higher nutritional value by reducing fat content but increasing microorganisms called (probiotics) that benefit the human gastrointestinal tract (GI tract), and nutrients (prebiotics) that also benefit human microflora could be one solution that gives consumers more choice in their ice cream consumption. Such ice cream is recognized as a synbiotic food product.
Probiotics refer to microorganisms, especially bacteria that can survive in the human GI tract, resulting in a balanced human GI tract as well as allowing beneficial microflora to grow and work more efficiently. These probiotics can resist extreme conditions in the human GI tract. The amount of probiotics that can survive in the GI tract which is considered effective in promoting human health is equal to a reference value of 106 CFU g-1 or milliliter of the finished product before consumption. Consuming 106 to 109 live probiotic cells brings the maximum benefit to the human body [3]. Probiotics which are generally used in food products include Lactobacilli microorganisms such as Lactobacillus acidophilus, Lactobacillus agilis, Lactobacillus rhamnosus, and Bifidobacteria such as Bifidobacterum longum and Bifidobacterum bufidum. Lactobacillus is a bacterium that lives in the small intestine and Bifidobacterium lives in the colon [4].
Prebiotics refer to food components that cannot be digested but are beneficial for the growth of intestinal microorganisms. These microorganisms are capable of performing the activity of the microorganisms themselves, which has a positive effect on the bodies of those who consume prebiotics. Fructo-oligosaccharides (FOS), inulin, galacto-oligosaccharides (GOS), lactulose, and lactosucrose are popular prebiotics used in food products [5].
Yogurt ice cream (YIC) or frozen yogurt is milk ice cream which contains yogurt of at least 10-20% of the weight of the ice cream and it is becoming more popular nowadays because it has a sweet and sour taste and it also has the same health benefits as yogurt, as well as providing a refreshing coolness, which is a distinctive feature of ice cream. YIC meets the needs of consumers who do not like the sharp sour taste and texture of yogurt [6] but still value the benefits of probiotics which are not present in normal ice cream. Therefore, the addition of probiotics such as B. longum to YIC should create an alternative to functional and healthy ice cream for health-conscious consumers.
However, the ice cream production process requires a process of aeration or whipping and lowering of temperature or freezing to make most of the water in the ice cream mix turn to ice. The ice and air bubbles, as well as the water in the unfrozen serum phase, are encapsulated by a three-dimensional network of fat particles in the ice cream [7]. This slows down the melting process and makes the structure of the ice cream more stable when it is consumed.
Thus, ice cream is a product with gaps or cavities inside its network structure at the microscopic level that may allow probiotic microorganisms such as B. longum to live. This specific structure could provide a channel by which B. longum can be introduced into the human body [8], but the high fat content in ice cream may affect the acceptability of the product to health-conscious consumers.
Therefore, developing ice cream products with less fat content but a high survival rate of probiotics may meet the needs of those consumers. In this study, the effects of fat content in YIC and types of prebiotics (GOS and FOS) on the survival rate of B. longum and on the physicochemical qualities of ice cream were determined. Also, the survival of B. longum in a simulated GI tract was examined.
2. Materials and Methods
2.1. Starter culture, probiotic, and reagents
B. longum subsp. longum TISTR 2195 was contributed by the Thailand Institute of Scientific and Technological Research (Pathum Thani, Thailand). Thermophilic YoFlex® culture YC-380, yogurt culture, was purchased from Chr. Hansen (Hoers Holm, Denmark). Butter fat (99%) was bought from Vicky Enterprise (Bangkok, Thailand). Fufill 400 as stabilizer/emulsifier (S/E) was purchased from SKW Biosystem (Baupte, France). Sucrose was obtained from Mitr Phol Group (Bangkok, Thailand). Glucose syrup (10-12 DE) was purchased from Thai Glucose Co., Ltd. (Nakornpathom, Thailand). Skimmed milk powder (SMP) was obtained from Fonterra (Auckland, New Zealand). Galacto-oligosaccharide (GOS, 55% (w/w)) was purchased from Yaku Famazootical Industry (Tokyo, Japan). Fructo-oligosaccharide (FOS, 90% (w/w)) was obtained from Sigma-Aldrich (St. Louis, USA). De Man Rogosa and Sharpe culture medium (MRS), Bifidobacteria Selective Count Agar Base (BSC Propionate Agar Base), and M1734 Bifido Selective Supplement A- FD250 were bought from Hi Media Laboratories (Maharashtra, India), and L-cysteine hydrochloride was obtained from Acre Organics, (New Jersey, USA).
2.2. Preparation of yogurt
A commercial starter culture (thermophilic YoFlex® culture YC-380) was used to produce yogurt. Pasteurized milk was warmed to 60 oC before adding 2% (w/w) SMP into this milk with stirring until SMP was completely dissolved. Then, it was allowed to cool to 43 oC before the starter culture was inoculated by gently stirring for 10 min. Then, it was poured into a sterilized yogurt container and cured in the yogurt incubator (YA1493, Elecream, Vanvea, France) at 43 °C until the pH of the yogurt dropped to 4.6. The yogurt was then immediately placed in a 4°C refrigerator to stop the fermentation and preserve it for use in the next experiment.
2.3. Preparation of YIC
The ingredients used to make YIC are shown in Table 1 while distilled water was added to make each formula reach 100%. After dissolving the dry ingredients in water, melted butter fat was added and the whole mix was pasteurized at 80 °C for 30 sec [9]. Then, the mix was homogenized at 2000 psi and 500 psi for the first and second stages of homogenization, respectively. The mix was cooled to room temperature before being aged at 4 oC for 24 h in a refrigerator. At the end of the aging stage, B. longum at 109 CFU g-1 of ice cream mix was added. GOS and FOS and 20% (w/w) yogurt were added into the mix. The mix was then whipped and frozen in an ice cream maker (Taylor 103-34, Illinois, USA) for 15 min. Then, the ice cream was hardened at -20 oC in a freezer (SNQ0103-170100063, Sanden intercool, Bangkok, Thailand). The survival rate of B. longum in YIC was determined every 15 days for 180 days or 6 months.
2.4. Analysis of the Physicochemical properties of YIC mix and YIC
2.4.1. Fat particle size of YIC mix
The determination of the fat particle size of YIC mix was conducted using a laser scattering particle size distribution analyzer (LA-950V2, Horiba, Tokyo, Japan). The refraction value of fat particles and water was 1.458 and 1.33, respectively, for the calculation of the fat particle size. Then, YIC mix was gently dropped into the chamber of the analyzer. The particle size value was measured and reported as the Sauter mean (d3, 2).
2.4.2. Dynamic oscillatory characteristics of YIC mix
The dynamic oscillatory test for the YIC mix was determined following Adapa, Dingeldein, Schmidt, & Herald [10]. A 4-degree angle cone and plate was used in this measurement. The gap between the YIC mix sample and the probe was 27 μm. All measurements were performed at 4 oC with a temperature-controlled rheometer (AR-G2 Rheometer, TA Instruments, New Castle, USA). The linear viscosity region (LVR) was determined by a torque sweeping test at a constant frequency of 0.08 Hz. The LVR was in the range of 0.1-1 μN.m. The YIC oscillatory properties were then examined by a frequency sweeping test from 0.1-5 Hz at a constant torque of 0.2 μN.m. Storage modulus (G’), loss modulus (G’’), and loss tangent (tanδ) were measured.
2.4.3. Total acidity and pH of YIC
Total acidity and pH according to the method of Akin, Akin, and Kirmaci [11] was determined. The pH of melted YIC was carried out at room temperature with a pH meter (MP220, Mettler, Toledo, Greifensee, Switzerland). Total acidity of YIC was measured using the acidity titration method by weighing 10 g of melted YIC titrated with 0.1 N NaOH and phenolphthalein was used as an indicator.
2.4.4. Overrun of YIC
The overrun of YIC was measured following Thaiudom [12]. Briefly, the YIC mix and YIC at the same volume were weighed. Then, the overrun was calculated by the following equation (1).
Overrun (%) = [(weight of YIC mix – weight of YIC)/weight of YIC) x 100
2.4.5. Hardness of YIC
The hardness measurement of YIC was carried out following the method of Javidi, Razavi, Behrouzian, and Alghooneh [13] using a texture analyzer (Stable Micro System, TA-XT plus, Surrey, England). A cylindrical probe with a diameter of 6 mm was used. The sample pressing distance was 15 mm and the sample pressing speed was 2 mm sec-1.
2.4.6. Melting rate of YIC
The melting rate of YIC was measured following the method of Thaiudom [12] by taking samples of YIC which were in a plastic cup of 30 mm height and 50 mm diameter and previously stored at -20 oC on a stainless-steel grid wire plate with a cone supporting the bottom of the plate. The melted YIC was passed through the grid and dropped into a beaker underneath the cone. Then, the beaker containing the melted YIC was weighed every 10 min for a period of 2 h. The weight of the melted YIC and time were plotted to determine the slope of the graph as the melting rate (g min-1).
2.5. Microstructure of YIC
The microstructure of YIC was determined following Goff, Verespej, and Smith [14] using a Low-Temperature Scanning Electron Microscope (LT-SEM; QUANTA 450, FEI, Oregon, USA). To prevent structural change due to the melting of YIC, the YIC samples were quickly submerged in liquid nitrogen after being taken out from the storage freezer. Then, the samples were fractured into small pieces (about 2-3 μm in diameter) with a blade and pincers. The samples were then placed on a specimen holder in a vacuum chamber of LT-SEM at -20 °C. The YIC samples were observed and photographed at an electrical voltage of 10 kV. At least 5 photographs were taken of each sample.
2.6. Sensory evaluation of YIC
The sensory evaluation of YIC was determined by 30 laboratory panelists who were familiar with the yogurt and yogurt ice cream. The incomplete block design (BIB) with 10 treatments (t), 9 replications (r), 30 blocks (b), and 3 experimental units per block (k) was used to determine this test. The color, aroma of yogurt, sweet taste, sour taste, firmness, sandiness, melting property in the mouth, and overall acceptance of YIC were evaluated using a structured 9-point hedonic scale in the range of 1 (did not like it at all) to 9 (liked it the most) point.
2.7. Number of survival B. longum in YIC
The number of survival B. longum was determined following the method of Akin, Akin, and Kirmaci [11]. Briefly, 10 g of ice cream were mixed with 90 mL of 0.1% (w/v) sterilized peptone solution. Then this mix was serially diluted to count the number of B. longum. The surviving B. longum were counted by pouring 1 mL of the above mix onto a sterile petri dish before pouring BSC Propionate Agar Base into the dish. After the agar hardened, the dish was turned upside down. The dish, AnaeroPack®, and Anaero-Indicator (Mitsubishi gas chemical company, Tokyo, Japan) was placed into an AnaeroPouch® (Mitsubishi gas chemical company, Tokyo, Japan) to provide the vacuum and anaerobic conditions. This pouch was incubated at 37 oC for 72 h in an incubator (BD400, Binder incubator, New York, USA). The survival of B. longum was determined by counting the colonies of B. longum in the range of 30-300 and calculated using the following equation (2).
Log CFU g-1 = log (number of colonies x dilution folds) / sample volume)
2.8. Survival of B. longum in simulated digestive system
The survival of B. longum in a simulated GI tract was determined following Abadía-García et al. [15] with a slight modification. Briefly, 10 g of YIC were well mixed with 80 mL simulated stomach solution (pH 2), comprising pepsin (from porcine gastric mucosa, Sigma-Aldrich Chemical Co., St. Louis, MO, USA) at a concentration of 3 g L-1 in a 0.5%w/v NaCl solution, and 10 mL artificial saliva solution, containing 6.2 g NaCl, 2.2 g KCl, 0.22 g CaCl2 and 1.2 g NaHCO3 in 1 L of distilled water. Then the mix was incubated at 37°C for 2 h. before being centrifuged at 10,000 g at 4°C for 10 min to receive a pellet of B. longum. Afterwards, the pellet was dissolved in an intestine solution, containing pancreatin (from porcine pancreas, Sigma-Aldrich Chemical Co., St. Louis, MO, USA) and bile (bovine, Sigma-Aldrich Chemical Co., St. Louis, MO, USA) in 0.5% w/v NaCl solution, and incubated at 37°C for 4 h. The surviving B. longum were measured every 2 hours by the pouring plate technique with Bifido Selective Supplement A-FD250 culture media while the plate was incubated at 37°C for 72 h.
2.9. Statistical analysis
All experimental data with three replicates were calculated for the analysis of variance (ANOVA) and Duncan’s Multiple Range Test (MRT) was used with SPSS Statistics 17.0 (SPSS Statistical Software, Inc., Chicago, IL, USA) at a statistical confidence level of 95%.
3. Results
3.1. Physicochemical properties of YIC
Table 2 shows that the physicochemical properties of YIC containing 10% fat (10% - fat YIC) possessed a lower pH than YIC containing 2% fat (2%-fat YIC). This may be because the YIC with a higher fat content contained a predominance of fatty acids rather than the lower fat content in YIC [16]. Thus, the higher fatty acid content could lower the pH of the YIC. Interestingly, even though the fatty acid affected the pH, it did not influence the YIC acidity since the pH is a measurement of the relative amount of free hydrogen and hydroxyl ions in the substate that is always reported in logarithmic units, thus each number of pH represents a 10-fold change in the acidity/basicness of the substate [17]. These results showed that all the samples of YIC had different pH values depending on the fat content in YIC while their acidity values were still in the same range and not significantly different. This was because the lactic acid, produced by the yogurt starter culture and B. longum and added in the same amount of yogurt (20% w/w) into the ice cream, dominated the overall acidity value of YIC. However, all YIC pH showed a slightly acidic to neutral state as is found in the pH of normal ice cream. Also, there was a similar amount of fat content, but no significant effect of GOS or FOS on the acidity and pH of YIC.
No significant differences were found in the overrun of these samples which were in the range of 34-35% which was similar to the overrun range in ice cream with synbiotics found in the study of Ahmadi et al. [18]. However, their results revealed that the added prebiotic, counted as dry matter, increased when the overrun of ice cream was also increased. However, in this work, the results were different which may have been due to a slightly different number of prebiotics (GOS and FOS) which were added to the YIC. The variable fat contents in YIC did not affect the overrun either which is similar to the study of Rolon et al. [19] who studied the amount of fat that affected the physical characteristics of vanilla ice cream. However, Akin, Akin, and Kirmaci [11] reported that ice cream with the addition of inulin as a prebiotic had an increased overrun compared to controlled ice cream because inulin has a high ability to hold water in its structure. Consequently, the serum phase of ice cream was more concentrated which could better entrap air bubbles in the ice cream. However, the main factors affecting the ice cream overrun were the timing of the blender and the efficiency of the ice cream maker [7] so, in this study, a laboratory-scale batch freezer was used, which may have resulted in a low overrun value for YIC.
Using a higher fat content in YIC resulted in a larger fat particle size. As a result, low-fat YIC possessed smaller fat particle sizes than full-fat or higher-fat YIC which is consistent with the results reported by Rolon, et al. [19]. The use of higher fat content in ice cream at the same pressure in a homogenizer and the same protein content resulted in a higher diameter of fat particles because the butter fat could easily collide with those fat particles. Moreover, the size-was reduced to small fat particles occuring during the homogenization process which resulted in an increase in the surface area of the fat [20]. The greater the surface area of the fat, the less completely adsorption of the milk protein on the surface of the fat in low fat content ice cream. Consequently, the adjacent fat particles without the adsorbed milk protein coalesced and easily merged into larger particles, resulting in a larger size of fat particles. This would not happen with less fat content since the surface of fat particles could be comoletely covered by a certain amount of milk proteins in such YIC.
Regarding the effect of prebiotics on the particle size of the fat YIC, there was no significant difference between GOS and FOS in 2% fat-YIC but the particle size of the fat was significantly different in 10% fat-YIC. This may have been due to the small amount of fat content in 2% fat-YIC that did not express the difference in fat particle size even though GOS or FOS was added into YIC and all fat particles in 2% fat-YIC may have been completely stabilized and covered with milk proteins resulting in less collision of neighboring fat particles that could have prevented fat coalescence and aggregation. However, in 10% fat-YIC, the particle size of the fat was smaller in the YIC containing FOS or GOS than that in control but the increase of FOS in YIC significantly reduced the size of the fat particles rather than GOS because FOS had a longer length of chain than GOS in this study which could occupy the space in ice cream serum phase and prevent the collision and aggregation of the fat particles, resulting in remaining the smaller fat particles in FOS-YIC rather than those in GOS-YIC. Moreover, the addition of prebiotics increased the viscosity of YIC which may have retarded and prevented the collision and aggregation of the fat particles in YIC. The longer the chain length of the prebiotics, the more the viscosity found in FOS rather than in GOS at the same concentration. This finding is similar to the results of Balthazara et al. [21].
3.2. Oscillatory property of YIC mix
The results showed that when the frequency was increased, tan δ of 2%-fat YIC mix was lower than that of 10%-YIC mix (Figure 1). This implied that the 2%-fat YIC mix behaved more like a liquid with less elasticity than the 10%-fat YIC mix. This is consistent with the studies of Adapa, Dingeldein, Schmidt, and Herald [10] who found that ice cream mix with a higher fat content always possessed elastic and solid-like behavior rather than the ice cream mix with lower fat content and the tan δ increased when the fat content in the ice cream mix was reduced. Also, Isik, Boyacioglu, Capanoglu, and Erdil [22] found that ice cream mix with a higher fat content had higher viscosity than the mix with a lower fat content. In this study, the addition of FOS and GOS increased the elasticity of the YIC mix compared to control. However, the addition of FOS provided more elasticity with a lower tan δ than the addition of GOS. This meant that FOS induced higher viscosity and solid-like behavior in YIC mix than GOS which is similar to the study of Balthazara et al. [21]. Moreover, the concentration of added prebiotics had an effect on such behavior. The more the concentration increased, the more the viscosity and solidness occurred, resulting in less collision of neighboring fat particles, as mentioned previously. This is also supported by the report of Balthazara et al. [21] which showed that the addition of GOS increased the viscosity of the ice cream mix, but the elasticity of such a mix was lower than that of the mix with FOS. The type of prebiotics also affected the rheological values of the ice cream mix due to the different structure and molecular weight of the prebiotics. A chain length of FOS had an approximate number of single-molecule sugars in the polymerization chain called ‘degree of polymerization’ ranging from 3-9 molecules, while GOS had an approximate number of from 2-5 molecules [23], consequently FOS produced hydrogen bonds more easily with water than GOS. This confirms that FOS provides higher viscosity and more solid-like or gel-like behavior than GOS. Akalin and Erisir [24] also studied the effects of inulin and FOS as prebiotics on the physical characteristics of ice cream and they found that inulin increased the viscosity of the mix more than FOS because inulin possesses a longer chain length of molecules than FOS. Thus, a longer chain of such prebiotics produced hydrogen bonding with water better than a shorter chain.
3.3. Hardness of YIC
Neither 2%-fat YIC nor 10%-fat YIC provided a significantly different hardness as shown in Figure 2. Muse and Hartel [25] investigated the hardness of ice cream and they found that it was influenced by ice phase volume, ice crystal size, overrun, fat destabilization, and the rheological properties of the mix. In line with these results, we expected our oscillatory results and the hardness of the YIC would show a significant difference between 2%-fat YIC and 10%-fat YIC in all YIC samples but, in fact, there was no difference between these YICs. Also, even though the 10%-YIC mix showed solid-like characteristics as well as a higher fat destabilization than the 2%-fat YIC mix, the hardness of such YICs was not significantly different either. Although the hardness of the ice cream was inversely proportional to the amount of fat in the ice cream and the reduction of the fat content in the ice cream increased the amount of ice crystals [26], 2%-fat YIC and 10%-fat YIC still did not show any significant differences. These results might be due to the type of equipment used, for example, the texture analyzer may not have been sufficiently sensitive to detect the different hardnesses of the samples. These results are in contrast to those of the oscillatory test which showed greater sensitivity than those of the texture analyzer, as mentioned previously.
The addition of prebiotics, especially GOS, to YIC resulted in a lower hardness of YIC compared to control due to its ability to bind with water. Consequently, there was a lower water content but an increase in a concentration of the serum of YIC. This could have induced a freezing point depression of YIC [27], resulting in it melting more easily and being softer in YIC texture. Moreover, the greater the GOS concentration added to YIC, the less hardness occurred (Figure 2). In contrast, YICs with and without the addition of FOS were not significantly different in their hardness. This meant that FOS did not affect the hardness of YIC because FOS possesses a longer chain length than GOS [23] which produced a stronger and denser overall structure of YIC (for more details, see the section on microstructure) from its lower solubility which could form many microcrystals in the YIC [24]. Moreover, FOS did not depress the freezing point as much as GOS which possessed a shorter chain length and it could bind more easily with water in the unfrozen serum phase of YIC than FOS, resulting in a higher serum phase concentration as mentioned previously. Also, similar to the rheological results, because FOS-YIC mix exhibited a higher viscosity than GOS-YIC, the hardness of FOS-YIC was greater than that of GOS-YIC. This evidence confirms that FOS contributed to the hardness of YIC more than GOS.
However, it was found that the addition of GOS caused more dispersion of air bubbles in the structure of YIC (see more information in the section on microstructure), compared to control, while GOS-YIC contained many smaller air bubbles than control. This made it easier to penetrate the ice cream with a probe of the texture analyzer to obtain a hardness measurement. Moreover, generally, ice cream with large amounts of air bubbles tend to have a softer texture than ice cream with fewer air bubbles [28]. The more GOS added, the more dispersion of air cells in YIC (see section on microstructure). However, the hardness of the ice cream depended on many factors, such as overrun, viscosity of ice cream mix, the number and size of the ice crystals [29].
Figure 2.
Hardness of yogurt ice cream with different fat content and prebiotics. Different small letters on each bar indicate significant differences at p > 0.05.
Figure 2.
Hardness of yogurt ice cream with different fat content and prebiotics. Different small letters on each bar indicate significant differences at p > 0.05.
3.4. Melting rate of YIC
It was found that the melting rate of 10%-fat YIC was lower than that of 2%-fat YIC (Figure 3) because the main factor affecting the melting rate was the fat content in the ice cream. Using a larger amount of fat resulted in a better three-dimensional fat network within YIC. As a result, YIC could retain air bubbles in that network [25] behaved like an external insulation of heat transfer from the surrounding environment to the ice crystals in YIC. This prevented the ice crystals from spreading through to the melted ice crystals within the YIC structure [29], resulting in a retarding of the melting rate of the ice cream. This resulted in the ice cream becoming more stable during some periods before melting into liquid. YIC with 10%-fat also possessed more viscosity in the serum phase compared to 2%-fat YIC. Consequently, 10%-fat YIC was able to stabilize and maintain shape while melting more effectively than 2%-fat YIC. Thus, YIC with a higher fat content melted more slowly than YIC with a lower fat content [25].
The addition of GOS or FOS to 2%-fat YIC did not affect the melting rate, probably because 2%-fat YIC melted too quickly due to its large content of large ice crystals and its low serum phase viscosity. Thus, the melting rate of YICs with 2%-fat content containing GOS and FOS was not significantly different in this study. However, the addition of prebiotics to 10%-fat YIC resulted in a statistically significant higher melting rate of YIC than that of control. This might have been due to the addition of probiotics, which are composed of short chains of oligosaccharides that intensified the unfrozen serum phase of YIC, resulting in a freezing point depression [27]. Moreover, the 10%-fat YIC with GOS seemed to melt faster than YICs with FOS (both with 1 and 2%) or without GOS or FOS. This can be attributed to the chain length of FOS which could retard the movement of water in the unfrozen serum phase in YIC [30]. The longer the chain length of FOS than GOS, the more effective it is in preventing or slowing down the movement of water, resulting in a lower melting rate as found in 10%-fat YIC containing FOS. However, interestingly, the 10%-fat YIC without GOS and FOS showed the lowest melting rate. This meant that the prebiotics interfered with or reduced the strength of a three-dimensional fat network in YIC by disintegration of fat networks from neat and strong networks to weak and disrupted ones. Consequently, those fat networks could not hold the unfrozen serum phase in YIC and could not retain the YIC shape effectively when compared to the YIC without prebiotics.
3.5. Microstructure of YIC
The microstructure of all YICs was explored by using LT-SME and the results are shown in Figure 4. The size and number of air cells in each YIC microstructure were noticeably different. YIC without prebiotics (Figure 4 A and D) seemed to be larger in air size but the number of air cells seemed to be smaller than the one containing prebiotics (Figures 4 B, C, E, and F). This means that the prebiotics influenced the microstructure of YIC. Thus, evidently, GOS or FOS promoted many tiny bubbles in YIC. As a result, YIC with the addition of prebiotics, especially GOS, had a lower hardness than YIC without GOS, as the probe of the texture analyzer was able to penetrate through the sample more easily than ice cream with fewer air bubbles. In particular, the addition of FOS resulted in small bubbles, and significantly outnumbered samples of YIC with GOS and control but the hardness of FOS-YIC was not significantly different from that of YIC without FOS (Figure 2). This can be attributed to the addition of FOS providing an increase in the elasticity properties of the YIC mix rather than GOS (Figure 1). Thus, FOS-YIC during the whipping and freezing processes had a greater ability to prevent the recombination of air bubbles than GOS-YIC which had lower elasticity properties. With lower elasticity, GOS had a larger bubble size than FOS-YIC because air bubbles in GOS-YIC had occasionally crashed into each other and formed larger bubbles more easily than in FOS-YIC. However, Balthazar, et al. [30] reported that GOS-fortified ice cream had more air bubbles than controlled ice cream without the addition of prebiotics because GOS increased the viscosity of the serum phase around the surface of the air bubbles, which also prevented them from reuniting. Thus, the microstructure of such ice cream seemed to possess both small and round air cells (Figure 4 B) rather than that of control YIC (Figure 4 A), resulting in a lower hardness.
However, FOS showed a greater ability to induce the dense structure of YIC than GOS in both 2% and 10%-fat YIC. This can be attributed to the fact that FOS possessed a longer chain length which might have combined with itself to produce microcrystals [24], resulting in a denser structure of FOS-YIC than in GOS-YIC. Thus, YIC with FOS seemed to provide a more complicated microstructure than GOS and provided a harder texture than GOS-YIC (Figure 2).
Regarding the effect of fat content on the microstructure of YIC, it was found that 10%-fat YIC had a greater number of air bubbles than 2%-fat YIC, and the air bubbles of 10%-fat YIC (Figures 4 D, E, and F) were smaller than those of 2%-fat YIC (Figures 4 A, B, and C), when compared with the same concentration and type of prebiotic. As a result, 10%-YIC had a lower melting rate than 2%-YIC , but it had a stronger structure with a firmer three-dimensional fat network. Therefore, the greater the amount of fat, the stronger the structure of this fat lattice body because it prevented the air bubbles and ice crystals from fusing together [25]. In addition, the use of more fat content in the ice cream ingredients provided higher elasticity that caused the size of the air bubbles in YIC to be smaller and closer in diameter length than the use of lower fat content.
Figure 4.
Microstrutures of yogurt ice cream with different fat content and prebiotics. A = Control 2% Fat (C2), B = 2% Fat + 2% galacto-oligoshaccharides (G2-2), C = 2% Fat + 2% fructo-oligoshaccharides (F2-2), D = Control 10% Fat (C10), E = 10% Fat + 2% galacto-oligoshaccharides (G10-2), and F = 10% Fat + 2% fructo-oligoshaccharides (F10-2). a = air cell, s = serum phase, the bar in the figure represents 100 μm.
Figure 4.
Microstrutures of yogurt ice cream with different fat content and prebiotics. A = Control 2% Fat (C2), B = 2% Fat + 2% galacto-oligoshaccharides (G2-2), C = 2% Fat + 2% fructo-oligoshaccharides (F2-2), D = Control 10% Fat (C10), E = 10% Fat + 2% galacto-oligoshaccharides (G10-2), and F = 10% Fat + 2% fructo-oligoshaccharides (F10-2). a = air cell, s = serum phase, the bar in the figure represents 100 μm.
3.6. Sensory evaluation of YIC
There were no significant differences among the YIC samples in the attributes of appearance, yogurt flavor, sweetness, sourness, sandiness, and melting behavior of YIC as shown in Table 3. Since those attributes, especially the appearance, yogurt flavor, sweetness, and sourness seemed to be related to the contribution of the same amount of yogurt added to all the YIC formulations. Also, the sandiness and melting behavior of YIC found in the YIC samples containing different amounts of fat content was not significant. This means that the different amounts of fat content and added prebiotics did not influence the sensorial results for those attributes. However, the scores for firmness and overall acceptance were statistically significant among the samples of YICs. The firmness score of 10%-fat YIC was mainly higher than that of 2%-YIC, except for C2, F2-1, and F2-2 formulas whose firmness was almost the same as that of 10%-fat YIC. These results were similar to the results of hardness as measured by the texture analyzer (Figure 2) that was attributed to the main effect of GOS which reduced the hardness of YIC. However, the overall results of firmness detected by the panelists in this study showed that the higher the fat content in YIC, the firmer it was. Thus, the texture of 10%-fat YIC was heavier and firmer than that of 2%-fat YIC which was due to its stronger three-dimensional fat network and better fat coalescence found in 10%-fat YIC than in 2%-fat YIC. This result is confirmed by the results of the fat destabilization which showed that a fat particle size of 10%-fat YIC mix was larger than that of 2%-fat YIC mix (Table 2). However, the overall acceptance scores were divided into two groups: group 1: C2, G2-1, F2-1, F2-2, G10-1, G10-2, and group 2: G2-2, C10, F10-1, F10-2. The overall acceptance score of group 1 is less than that of group 2. This means that the YIC samples in group 2 were more acceptable than those in group 1. This might be due to the individuals of each panelist having different sensorial experiences. However, a careful observation of the sensorial results showed that the interaction effect of the fat-content at 10% fat and FOS seemed to result in a greater acceptance level than that of 2% fat and GOS. However, Isik, Boyacioglu, Capanoglu, and Erdil [22] and Soukoulis, Fisk, and Bohn [31] stated that adding prebiotics to ice cream affected its softness, creamy taste, and greasy-feel as well.
3.7. Survival of B. longum in YIC during storage
The survival of B. longum in YIC during storage was examined and the results are shown in Figure 5. The initial upload of B. longum into the YIC mix was 109 CFU g-1 for all YIC samples. The number of colonies that survived decreased from 109 to 108.5 CFU g-1 after the YIC mix was whipped and frozen in the ice cream maker. During the whipping and freezing processes, shear forces occurred which could damage and injure the microbial cells. While the YIC cooled during the whipping process it formed ice crystals in its internal structure which could harm the B. longum cells [9] [11]. In addition, the whipping and freezing processes added air to the ice cream and B. longum which is an oxygen sensitive microorganism decreased in number [32]. Interestingly, in F2-2 YIC, the number of colonies of B. longum that survived was significantly higher than the number of colonies of the other YIC formulars throughout the storage time from day 0 - 90. This indicated that FOS at 2% in 2%-fat YIC enabled B. longum to tolerate a severe environmental condition such as a frozen state and air-filled environment in the ice cream. The same results were also exhibited in F2-1, F10-1 and F10-2 YIC containing FOS while all YIC samples with GOS seemed to show a lower survival rate of B. longum. This could be attributed to the stronger and firmer structure from FOS which formed microcystals and from the three-dimensional fat networks which could protect B. longum from such severe conditions. The number of B. longum that survived between day 90 to 120 of FOS-YIC did not seem to be significantly different for all YICs containing FOS, but this number was higher than that of YICs containing GOS. Therefore, in this study, FOS was found to be more effective in enhancing the survival of B. longum than GOS in a frozen condition like YIC. This contrasted with the findings of Criscio, et al. (2010) which showed that there was no difference in the survival number of Lactic acid bacteria in ice cream containing GOS or FOS. However, it is clear that YIC without GOS or FOS showed the lowest number of surviving B. longum after days 120 - 180 in this study. This strongly confirmed that such prebiotics could strengthen the survival of B. longum and is similar to the study of Akalin and Erisir [24] who found that adding inulin and FOS as prebiotics to ice cream helped to increase the survival rate of Lactobacillus acidophilus La-5 and B. animalis Bb-12 because such prebiotics are a source of carbon and energy for such microorganisms. However, when the YICs were stored and frozen at a very low temperature (-20 OC) for a long time, larger ice crystals formed. Thus, such ice crystals injured the B. longum cells inside the ice cream [24].
Regarding the effect of fat content on the survival of probiotics in ice cream, Alamprese, Foschino, Rossi, and Pompei [33] and Santos Leandro, Araújo, Conceição, Moraes, and Carvalho [34] found that there was no statistically significant difference in the numbers of surviving probiotics used in their experiments in the ice cream samples with low, medium, and high fat content, stored at -16 oC for 30 - 40 days, respectively. These results are consistent with those of this study even though their probiotics were Lactobacillus rhamnosus GG and Lactobacillus delbrueckii UFV H2b20, respectively. This confirms that even if different strains of probiotics are used with different storage times, the survival of probiotic were the same. In conclusion, however, the amount of B. longum which survived in this study was more than 106 CFU g-1 over the entire storage period of 180 days.
3.7. Survival of B. longum in a simulated GI tract
After storing YIC for 15 days at -20 oC, the YIC samples were used to determine the survival of B. longum in a simulated GI tract. The results showed that the average number of B. longum that survived in a simulated stomach condition decreased by 1.71 log CFU g-1 or 16.18% from the initial load of 100% within 2 h for all YIC samples (Figure 6). In a simulated intestine condition, the average number of B. longum which survived decreased by 1.69 log CFU g-1 or 15.93% and 1.67 log CFU g-1 or 15.82% from the initial load of 100% within 4 and 6 h, respectively, for all YIC samples. The decrease in the number of B. longum that survived in the simulated GI tract occurred because the pH in this tract (pH in stomach was 2.0 and pH in intestine was about 7.4) was not suitable for B. longum which can survive more easily in pH 6-7 [35], so some of the B. longum died. In addition, the bile in the intestine destroyed the cell walls of B. longum and caused cell destabilization and damage because gram-positive bacteria such as B. longum generally has a low resistance to bile [36].
Regarding the effects of fat on the survival of B. longum, it was found that fat contributed to statistically significant increases in the degree of survivability of this microorganism (Figure 6). This might be because fat particles encapsulated and prevented microbial cells from coming into direct contact with digestive juice in gastric and intestinal conditions. As well as the effect of fat, prebiotics such as GOS and FOS also affected the survival of B. longum in the simulated GI tract. Figure 6 shows that the number of B. longum which survived in the YIC with GOS or FOS was higher than that of YIC without GOS or FOS. However, it also seemed that the number of B. longum which survived in the FOS-YIC was higher than that in GOS-YIC. Moreover, YIC with a higher concentration of prebiotics in this study showed the number of B. longum that survived was higher than in YIC with a lower concentration of such prebiotics. Thus, the content of fat, concentration of prebiotics, and type of prebiotics affected the number of B. longum that survived in the YIC in this study.
Figure 6.
Means and standard deviations of percentage survival B. longum in yogurt ice cream with. different fat content and prebiotics in simulated gastrointestinal tract with different times.
Figure 6.
Means and standard deviations of percentage survival B. longum in yogurt ice cream with. different fat content and prebiotics in simulated gastrointestinal tract with different times.
4. Conclusions
The fat particle size and pH as the physicochemical properties of yogurt ice cream mix containing B. longum as probiotics and GOS or FOS varied among the mixes containing different fat content. The higher the fat content in the ice cream, the larger the fat particle size and the lower the pH of the mixes. FOS provided elasticity to those mixes rather than GOS, resulting in more solid-like characteristics which contributed to a greater hardness in the yogurt ice cream. This could have caused the ice cream to melt more slowly but it showed a denser structure with a complicated three-dimensional fat network and smaller air cells than the yogurt ice cream containing GOS. Moreover, the higher fat content in 10%-fat yogurt ice cream contributed to a greater hardness than that in 2%-fat yogurt ice cream. However, both GOS and FOS in yogurt ice cream played an important role in the survival of a number of B. longum by 106 CFU g-1 in the ice cream during the storage time of up to 180 days and resulted in a higher percentage of survival in the simulated gastrointestinal tract when compared to that of the yogurt ice cream without either GOS or FOS. These findings could be useful to ice cream manufacturers for the production of low fat and full fat yogurt ice cream containing prebiotics and probiotics like B. longum as a functional and healthy food. However, to enhance the survival rate of such probiotics, the encapsulation technique should be studied further.
Author Contributions
Conceptualization, S.T.; methodology, S.T. and W.T.; laboratory procedures, W.T.; formal analysis, S.T. and W.T.; data curation: S.T.; writing-original draft preparation, W.T.; writing-review and editing, S.T.; supervision, S.T.; funding, S.T. Both authors have read and proved this published manuscript.
Funding
Suranaree University of Technology Research and Development Fund provided funding for this study.
Institute Review Board Statement
Not applicable.
Informed Consent Statement
Not applicable.
Data Availability Statement
Data available upon request.
Acknowledgements
The authors would like to thank Suranaree University of Technology Research and Development Fund.
Conflicts of Interest
There is no conflict of interest in this study.
References
- F. Clydesdale, "FOOD TECHNOLOGY MAGAZINE," 1 December 2004. [Online]. Available: https://www.ift.org/news-and-publications/food-technology-magazine/issues/2004/december/features/functional-foods-opportunities-and-challenges.
- N. M. Khair, N. A. A. Rahman, . A. S. Baharuddin, H. . S. Hafid and M. Wakisaka, "Capturing the impact of nanobubble liquid in enhancing the physical quality of ice cream," Journal of Agricultural and Food Engineering 2, pp. 1-4, 2020.
- Y.-K. Lee and S. Salminen, "The coming of age of probiotics," Trends in Food Science & Technology, pp. 241-245, 1995. [CrossRef]
- D. J. O’Sullivan, "Primary sources of probiotic cultures," in Probiotics in Food Safety and Human Health, Oxfordshire, Taylor & Francis Group, 2005, pp. 91-108.
- G. R. Gibson, "Fibre and effects on probiotics (the prebiotic concept)," Clinical Nutrition Supplements, pp. 25-31, 2004. [CrossRef]
- T. R. Marshall, H. D. Goff and R. W. Hartel, Ice cream, New York: Springer, 2003.
- H. D. Goff, Ice Cream and Frozen Desserts, New Jersey : Wiley, 2015.
- G. Cruz, A. E. Antunes, A. L. Sousa, . J. A. Faria and S. M. Saad, "Ice-cream as a probiotic food carrier," Food Research International, pp. 1233-1239, 2009. [CrossRef]
- Haynes and M. J. Playne, "Survival of probiotic cultures in low-fat ice-cream," Australian Journal of Dairy Technology, pp. 10-14, 2002.
- S. Adapa, H. Dingeldein, K. Schmidt and T. Herald, "Rheological Properties of Ice Cream Mixes and Frozen Ice Creams Containing Fat and Fat Replacers," Journal of Dairy Science, pp. 2224-2229, 2000. [CrossRef]
- M. Akin, M. Akin and Z. Kirmaci, "Effects of inulin and sugar levels on the viability of yogurt and," Food Chemistry , pp. 93-99, 2007. [CrossRef]
- S. Thaiudom "Effect of ratio of milk fat to soy bean oil and whipping time on qualities of milk ice cream," Songklannakarin Journal of Science and Technology, (in Thai), vol. 29, no. 1, pp. 191-204, 2007.
- F. Javidi, S. M. A. Razavi, F. Behrouzian and A. Alghooneh, "The influence of basil seed gum, guar gum and their blend on the rheological, physical and sensory properties of low fat ice cream," Food Hydrocolloids, pp. 625-633, 2016. [CrossRef]
- H. Goff, E. Verespej and A. Smith, "A study of fat and air structures in ice cream," International Dairy Journal, pp. 817-829, 1999. [CrossRef]
- L. Abadía-García, A. Cardador, S. T. Martín del Campo, S. M. Arvízu, E. Castaño-Tostado, C. Regalado-González, B. García-Almendarez and S. L. Amaya-Llano, "Influence of probiotic strains added to cottage cheese on generation of potentially antioxidant peptides, anti-listerial activity, and survival of probiotic microorganisms in simulated gastrointestinal conditions," International Dairy Journal, vol. 33, no. 2, pp. 191-197, 2013. [CrossRef]
- M. Abo-srea, E. Emara and T. H. EL-Sawah, "Impact of Konjac Glucomannan on Ice Cream-like Properties," International Journal of Dairy Science, pp. 177-183, 2017. [CrossRef]
- C. Tyl and G. D. Sadler, "pH and Titratable Acidity," in Food Analysis, Berlin, Springer, 2017. [CrossRef]
- Ahmadi, E. Milani, A. Madadlou, S. A. Mortazavi, R. R. Mokarram and D. Salarbashi, "Synbiotic yogurt-ice cream produced via incorporation of microencapsulated lactobacillus acidophilus (la-5) and fructooligosaccharide," Journal of Food Science and Technology, vol. 51, pp. 1568-1574, 2012. [CrossRef]
- M. L. Rolon, A. J. Bakke, J. N. Coupland, J. E. Hayes and R. F. Roberts, "Effect of fat content on the physical properties and consumer acceptability of vanilla ice cream," Journal of Dairy Science, pp. 5217-5227, 2017. [CrossRef]
- Floury, A. Desrumaux and J. Lardières, "Effect of high-pressure homogenization on droplet size distributions and rheological properties of model oil-in-water emulsions," Innovative Food Science & Emerging Technologies, pp. 127-134, 2000. [CrossRef]
- C. Balthazara, H. L. Silva, A. Vieira, R. Neto, L. Cappato, P. Coimbra, J. Moraes, M. Andrade, V. Calado, D. Granato, M. Freitas, M. Tavares, R. Raices, M. Silva and A. Cruze, "Assessing the effects of different prebiotic dietary oligosaccharides in sheep milk ice cream," Food Research International, pp. 38-46, 2017. [CrossRef]
- U. Isik, D. Boyacioglu, E. Capanoglu and D. N. Erdil, "Frozen yogurt with added inulin and isomalt," Journal of Dairy Science, pp. 1647-1656, 2011. [CrossRef]
- G. R. Gibson, "Fibre and effects on probiotics (the prebiotic concept)," Clinical Nutrition Supplements, pp. 25-31, 2004. [CrossRef]
- Akalin and D. Erisir, "Effects of Inulin and Oligofructose on the Rheological Characteristics and Probiotic Culture Survival in Low-Fat Probiotic Ice Cream," Journal of Food Science, pp. 184-188, 2008. [CrossRef]
- M. Muse and R. Hartel, "Ice Cream Structural Elements that Affect Melting Rate and Hardness," Journal of Dairy Science, pp. 1-10, 2004. [CrossRef]
- X. Guinard, C. Zoumas-Morse, L. Mori, V. Uatoni, D. Panyam and A. Kilara, "Sugar and fat effects on sensory properties of ice cream," Journal Of Food Science, pp. 1087-1094, 1997. [CrossRef]
- Akbari, M. H. Eskandari, M. Niakosari and A. Bedeltavana, "The effect of inulin on the physicochemical properties and sensory attributes of low-fat ice cream," International Dairy Journal, pp. 52-55, 2016. [CrossRef]
- R. Wlibey and T. Cooke, "Effects of solute concentration, overrun and storage on the hardness of ice cream," International Dairy Federation, pp. 186-187, 1998.
- R. P. Sofjan and R. W. Hartel, "Effects of overrun on structural and physical characteristics of ice cream," International Dairy Journal, pp. 255-262, 2004. [CrossRef]
- C. Balthazar, H. A. Silva, A. Vieira, R. Neto, L. Cappato, P. Coimbra, J. Moraes, M. Andrade, V. Calado, D. Granato, M. Freitas, M. Tavares, R. Raices, M. Silva and A. C. Erdil, "Prebiotics addition in sheep milk ice cream: A rheological, microstructural and sensory study," Journal of Functional Foods, pp. 564-573, 2017. [CrossRef]
- C. Soukoulis, I. D. Fisk and T. Bohn, "Ice Cream as a Vehicle for Incorporating Health-Promoting Ingredients: Conceptualization and Overview of Quality and Storage Stability," Comprehensive Reviews in Food Science and Food Safety, pp. 627-655, 2014. [CrossRef]
- K. Kailasapathy and K. Sultana, "Survival and beta-D-galactosidase activity of encapsulated and free Lactobacillus acidophilus and Bifidobacterium lactis in ice-cream," Australian Journal of Dairy Technology, pp. 223-227, 2003.
- C. Alamprese, R. Foschino, M. Rossi and C. Pompei, "Effects of Lactobacillus rhamnosus GG addition in ice cream," International Journal of Dairy Technology, pp. 200-206, 2005. [CrossRef]
- E. Santos Leandro, E. A. Araújo, L. L. Conceição, C. A. Moraes and A. F. Carvalho, "Survival of Lactobacillus delbrueckii UFV H2b20 in ice cream produced with different fat levels and after submission to stress acid and bile salts," Journal of Functional Foods, pp. 503-507, 2013. [CrossRef]
- P. Shah, "Functional cultures and health benefits," International Dairy Journal, pp. 1262-1277, 2007. [CrossRef]
- Begley, C. G. Gahan and C. Hill, "The interaction between bacteria and bile," FEMS Microbiology Reviews, pp. 625-651, 2005. [CrossRef]
Figure 1.
tan δ of yogurt ice cream mix at a range of differentfrequencies.
Figure 3.
Melting curve of yogurt ice cream with different fat content and prebiotics.
Figure 5.
Viable count of B. longum in yogurt ice cream with different fat content and prebiotics during storage for 6 months.
Figure 5.
Viable count of B. longum in yogurt ice cream with different fat content and prebiotics during storage for 6 months.
Table 1.
The formulas and ingredients used to produce yogurt ice cream (% w/w).
| Ice cream formulas |
code | SMP | sucrose | glucose | butter fat | S/E | FOS | GOS |
|---|---|---|---|---|---|---|---|---|
| Control with 2% fat | C2 | 13 | 11 | 6 | 2 | 0.4 | - | - |
| Control with 10% fat | C10 | 13 | 11 | 6 | 10 | 0.4 | - | - |
| 2% fat + 1% FOS | F2-1 | 13 | 11 | 6 | 2 | 0.4 | 1 | - |
| 2% fat + 2% FOS | F2-2 | 13 | 11 | 6 | 2 | 0.4 | 2 | - |
| 10% fat + 1% FOS | F10-1 | 13 | 11 | 6 | 10 | 0.4 | 1 | - |
| 10% fat + 2% FOS | F10-2 | 13 | 11 | 6 | 10 | 0.4 | 2 | - |
| 2% fat + 1% GOS | G2-1 | 13 | 11 | 6 | 2 | 0.4 | - | 1 |
| 2% fat + 2% GOS | G2-2 | 13 | 11 | 6 | 2 | 0.4 | - | 2 |
| 10% fat + 1% GOS | G10-1 | 13 | 11 | 6 | 10 | 0.4 | - | 1 |
| 10% fat + 2% GOS | G10-2 | 13 | 11 | 6 | 10 | 0.4 | - | 2 |
Table 2.
Physicochemical properties of YIC prepared with different prebiotic and fat content.
| Sample | pH | Total acidityns (%) |
Overrunns (%) |
Fat particle size (µm) |
|---|---|---|---|---|
| C2 | 6.464±0.01b | 0.289±0.01 | 34.54±1.41 | 0.25736a |
| G2-1 | 6.447±0.00ab | 0.279±0.01 | 34.86±0.71 | 0.23105a |
| G2-2 | 6.449±0.00ab | 0.276±0.00 | 34.30±0.54 | 0.22300a |
| F2-1 | 6.454±0.00b | 0.265±0.00 | 34.42±1.69 | 0.22198a |
| F2-2 | 6.463±0.00b | 0.272±0.00 | 35.36±0.49 | 0.21595a |
| C10 | 6.433±0.00a | 0.273±0.02 | 34.27±1.29 | 1.09153d |
| G10-1 | 6.429±0.01a | 0.285±0.00 | 34.57±1.38 | 1.01056c |
| G10-2 | 6.433±0.00a | 0.279±0.00 | 35.30±1.46 | 1.00952c |
| F10-1 | 6.429±0.00a | 0.277±0.01 | 34.62±0.79 | 0.99850c |
| F10-2 | 6.432±0.02a | 0.272±0.02 | 34.74±1.47 | 0.92681b |
Values in the same column are the average of three experimental data with standard deviation. Different superscript letters indicate significant differences at p > 0.05. ns = not significantly different.
Table 3.
Sensorial results of yogurt ice cream with different fat content and prebiotics.
Values in the same column are the means with standard deviation. Different superscript letters indicate significant differences at p > 0.05. ns = non-significantly different.
Disclaimer/Publisher’s Note: The statements, opinions and data contained in all publications are solely those of the individual author(s) and contributor(s) and not of MDPI and/or the editor(s). MDPI and/or the editor(s) disclaim responsibility for any injury to people or property resulting from any ideas, methods, instructions or products referred to in the content. |
© 2023 by the authors. Licensee MDPI, Basel, Switzerland. This article is an open access article distributed under the terms and conditions of the Creative Commons Attribution (CC BY) license (http://creativecommons.org/licenses/by/4.0/).
Copyright: This open access article is published under a Creative Commons CC BY 4.0 license, which permit the free download, distribution, and reuse, provided that the author and preprint are cited in any reuse.
Functional, Physicochemical, Rheological, Microbiological, and Organoleptic Properties of Synbiotic Ice Cream Produced from Camel Milk Using Black Rice Powder and Lactobacillus acidophilus LA-5
Wael Elkot
et al.
Fermentation,
2022
Fermentation of Dietary Fibre-Added Milk with Yoghurt Bacteria and L. rhamnosus and Use in Ice Cream Production
Elif Sezer
et al.
Fermentation,
2022


MDPI Initiatives
Important Links
© 2024 MDPI (Basel, Switzerland) unless otherwise stated