Preprint
Article

Front Movement and Sweeping Rules of CO2 Flooding under Different Oil Displacement Patterns

Altmetrics

Downloads

94

Views

28

Comments

0

A peer-reviewed article of this preprint also exists.

Submitted:

25 October 2023

Posted:

25 October 2023

You are already at the latest version

Alerts
Abstract
CO2 flooding stands as a pivotal technique for significantly enhancing oil recovery in low-permeability reservoirs. The movement and sweeping rules at the front of CO2 flooding play a critical role in its oil recovery, yet a comprehensive quantitative analysis remains an area in need of refinement. In this study, we have developed 1D and 2D numerical simulation models to explore the sweeping behavior of miscible, immiscible, and partly-miscible CO2 flooding patterns. The front position and movement rules of the three CO2 flooding patterns are determined. A novel approach of the contour area calculation method is introduced to quantitatively characterize the sweep coefficients, and the sweeping rules are discussed regarding geological parameters, oil viscosity, and injection-production parameters. Furthermore, the Random Forest (RF) algorithm is employed to identify the controlling factor of the sweep coefficient, as determined by out-of-bag (OOB) data displacement analysis. The results show that the miscible front is located at the point of maximum CO2 content in the oil phase. The immiscible front occurs at the point of maximum interfacial tension near the production well. Remarkably, the immiscible front moves at a faster rate compared to the miscible front. Geological parameters, including porosity, permeability, and reservoir thickness, significantly impact the gravity segregation effect, thereby influencing the CO2 sweep coefficient. Immiscible flooding exhibits the highest degree of gravity segregation, with a maximum gravity segregation degree (GSD) reaching 78.1. The permeability ratio is a crucial factor, with a lower limit of approximately 5.0 for reservoirs suitable for CO2 flooding. Injection-production parameters also play a pivotal role in sweep coefficient. Decreased well spacing and increased gas injection rates are found to enhance sweep coefficients by suppressing gravity segregation. Additionally, higher gas injection rates can improve the miscibility degree of partly-miscible flooding from 0.69 to 1.0. Oil viscosity proves to be a significant factor influencing the sweep coefficients, with high seepage resistance due to increasing oil viscosity dominating the miscible and partly-miscible flooding patterns. Conversely, gravity segregation primarily governs the sweep coefficient in immiscible flooding. In terms of controlling factors, the permeability ratio emerges as a paramount influence, with a factor importance value (FI) reaching 1.04. these results provide a theoretical foundation for the application of CO2 flooding, enhancing the understanding of the critical factors governing its success.
Keywords: 
Subject: Engineering  -   Energy and Fuel Technology

1. Introduction

As reservoir exploration continues, the proportion of conventional medium and high-permeability reservoir reserves is gradually decreasing, while the discovery of low-permeability reservoir reserves is steadily increasing[1,2,3,4]. In comparison to water flooding, carbon dioxide (CO2) possesses a lower density and viscosity, enabling it to penetrate even the tiny pores and consequently improving the micro-sweep coefficient[5,6,7]. When pressure exceeds the minimum miscible pressure (MMP), CO2 can eliminate the interfacial tension between oil and gas through multi-contact miscibility, thus significantly enhancing oil displacement efficiency [8,9,10,11,12]. Consequently, CO2 flooding holds promising prospects for effectively enhancing oil recovery in low-permeability reservoirs.
The oil recovery within a reservoir is a product of both the sweep coefficient and the displacement efficiency[13]. In the case of miscible CO2 flooding, the theoretical oil displacement efficiency can attain a remarkable 100%. Therefore, precise quantitative characterization of the CO2 sweep coefficient holds immense importance in evaluating the enhanced oil recovery potential of CO2 flooding. In addition, Furthermore, in low permeability reservoirs, the challenges of severe heterogeneity, gravity segregation, and viscous fingering can lead to issues such as gas channeling and a low sweep coefficient [14,15]. To address these challenges effectively, conformance control technologies like WAG flooding and foam flooding become necessary[16,17,18] The quantitative analysis of the sweep coefficient serves as the foundational basis for evaluating the efficacy of these conformance control technologies.
Characterizing the sweep coefficient primarily involves both experimental and numerical simulation approaches [19,20,21,22]. In the aspect of experimental simulation, Bergit. et al. [23] used high-resolution micro-positron emission tomography (μPET) to analyze the distribution of CO2 in the core with the change of PV number during CO2 injection, and the sweeping effect is characterized qualitatively. Wang. et al. [24] used a high-resolution nuclear magnetic resonance method and normalized MI value to distinguish the sweeping range of CO2 in the core and studied the sweep characteristics of miscible and immiscible flooding. The results showed that the CO2 front of immiscible flooding is more unstable, which affects the sweep coefficient of CO2 flooding. Duraid. et al. [25] used X-ray CT imaging technology to identify the distribution of oil and water in the heterogeneous core after CO2 flooding. The results showed that the proportion of residual oil in the low-permeability part is significantly higher than that in the high-permeability part, which indirectly characterized the sweeping rules of CO2 flooding. The experimental simulation method can visually reflect the microcosmic sweeping characteristics of CO2 in the core, while the numerical simulation method can reflect the macroscopic sweeping rules. Lewis. et al. [26] established a quarter-five-point numerical model to study water, gas, and WAG flooding sweep coefficients. The conformance coefficients are calculated assuming that the oil displacement efficiency of gas flooding is 100%. Hao. et al. [27] established a numerical simulation model of miscible flooding, delineating the contour line with oil and gas interfacial tension equal to 0.1 dyn/cm as the rear edge of the miscible zone, and taking the CO2 content in the oil phase equal to 20% as the front edge of the miscible zone, thus obtaining the sweep coefficient of CO2 miscible flooding. Li. et al. [28] established a mathematical model of miscible flooding considering CO2 diffusion and adsorption, and defined the location where the C/C0=0.5 as the miscible front and the place where C/C0=0.95 as the gas phase front to study the migration rule of the CO2. When the adsorption is weak, the increases in porosity and initial injection rate accelerate the mass transfer and diffusion process. The stronger the diffusion effect, the larger the miscible region and the earlier the gas breakthrough. The enhanced adsorption reduces the sweeping range of the miscible zone. Li. et al. [29] established a numerical simulation model of CO2 flooding with a five-spot well pattern and inverted nine-spot well pattern and proposed that the location where the viscosity of crude oil drops to a certain extent is defined as the miscible front, thus studying the CO2 flooding sweeping rules of different well patterns. The results showed that the sweep coefficient of the inverted nine-spot well pattern is higher than that of the five-spot well pattern.
The factors affecting the CO2 sweep coefficient include geological factors, fluid properties, injection-production relationship, and so on [13,30,31]. The analysis of the main controlling factor affecting the CO2 sweep coefficient is propitious to choose the suitable conformance control technology to improve the application efficacy of CO2 flooding. Limited research has delved into identifying the main controlling factor on the CO2 sweep coefficient, with prevalent methodologies encompassing fuzzy analysis and orthogonal analysis [32,33]. Li. et al. [34] evaluated the influence degrees of multiple factors on gas channeling through fuzzy analysis and concluded that fractures and heterogeneity are the most critical factors affecting gas channeling. Cui. et al. [35] analyzed by orthogonal analysis that the main controlling factor affecting the CO2 sweep coefficient is well distance and established the calculation formula of the CO2 sweep coefficient using multiple nonlinear regression methods. However, it’s important to note that the selection of the weight matrix in fuzzy analysis is somewhat subjective, potentially impacting the precision of the main controlling factor analysis. Moreover, the limited data samples employed in orthogonal studies can lead to specific errors in the analysis of primary controlling factors. Consequently, there exists a need for further exploration of methodologies for analyzing the main controlling factor influencing the CO2 flooding sweep coefficient.
In this study, CO2 flooding is categorized into three distinct patterns - miscible, immiscible, and partly-miscible flooding- based on the pressure distribution between injection and production wells. Section 4.1 and Section 4.2 are dedicated to the fitting of PVT (Pressure-Volume-Temperature) and slim tube experiment results carried out in the Jilin low-permeability oilfield. Based on the fitting results, 1-D and 2-D numerical simulation models of CO2 flooding are developed. Section 4.3 focuses on pinpointing the locations of both miscible and immiscible fronts through an analysis of fluid property variations between wells within the 1-D model. In Section 4.4, based on the contour area method, the CO2 sweep coefficients for different flooding patterns within the 2D model are calculated using MATLAB software. Furthermore, we introduce parameters such as GSD (Gravity Segregation Degree) and Dm (Miscible Degree), investigating the impact of various factors on the sweep coefficients, gravity segregation degree, and miscible degree in the three CO2 flooding patterns. These factors are discussed from three aspects: geology, oil viscosity, and injection-production parameters. Section 4.5 employs the out-of-bag replacement method within the Random Forest algorithm to identify the main controlling factors influencing the CO2 sweep coefficients. Finally, our study concludes with a presentation of findings in Section 5.

2. Materials and Methods

2.1. Materials

The crude oil and formation water used in the experiments are sampled from the Jilin oilfield, and the crude oil fractions are shown in Table 1. The CO2 is purchased from Beijing Analytical Instrument Factory, and the purity of CO2 is 99.95 mol%.

2.2. Apparatus

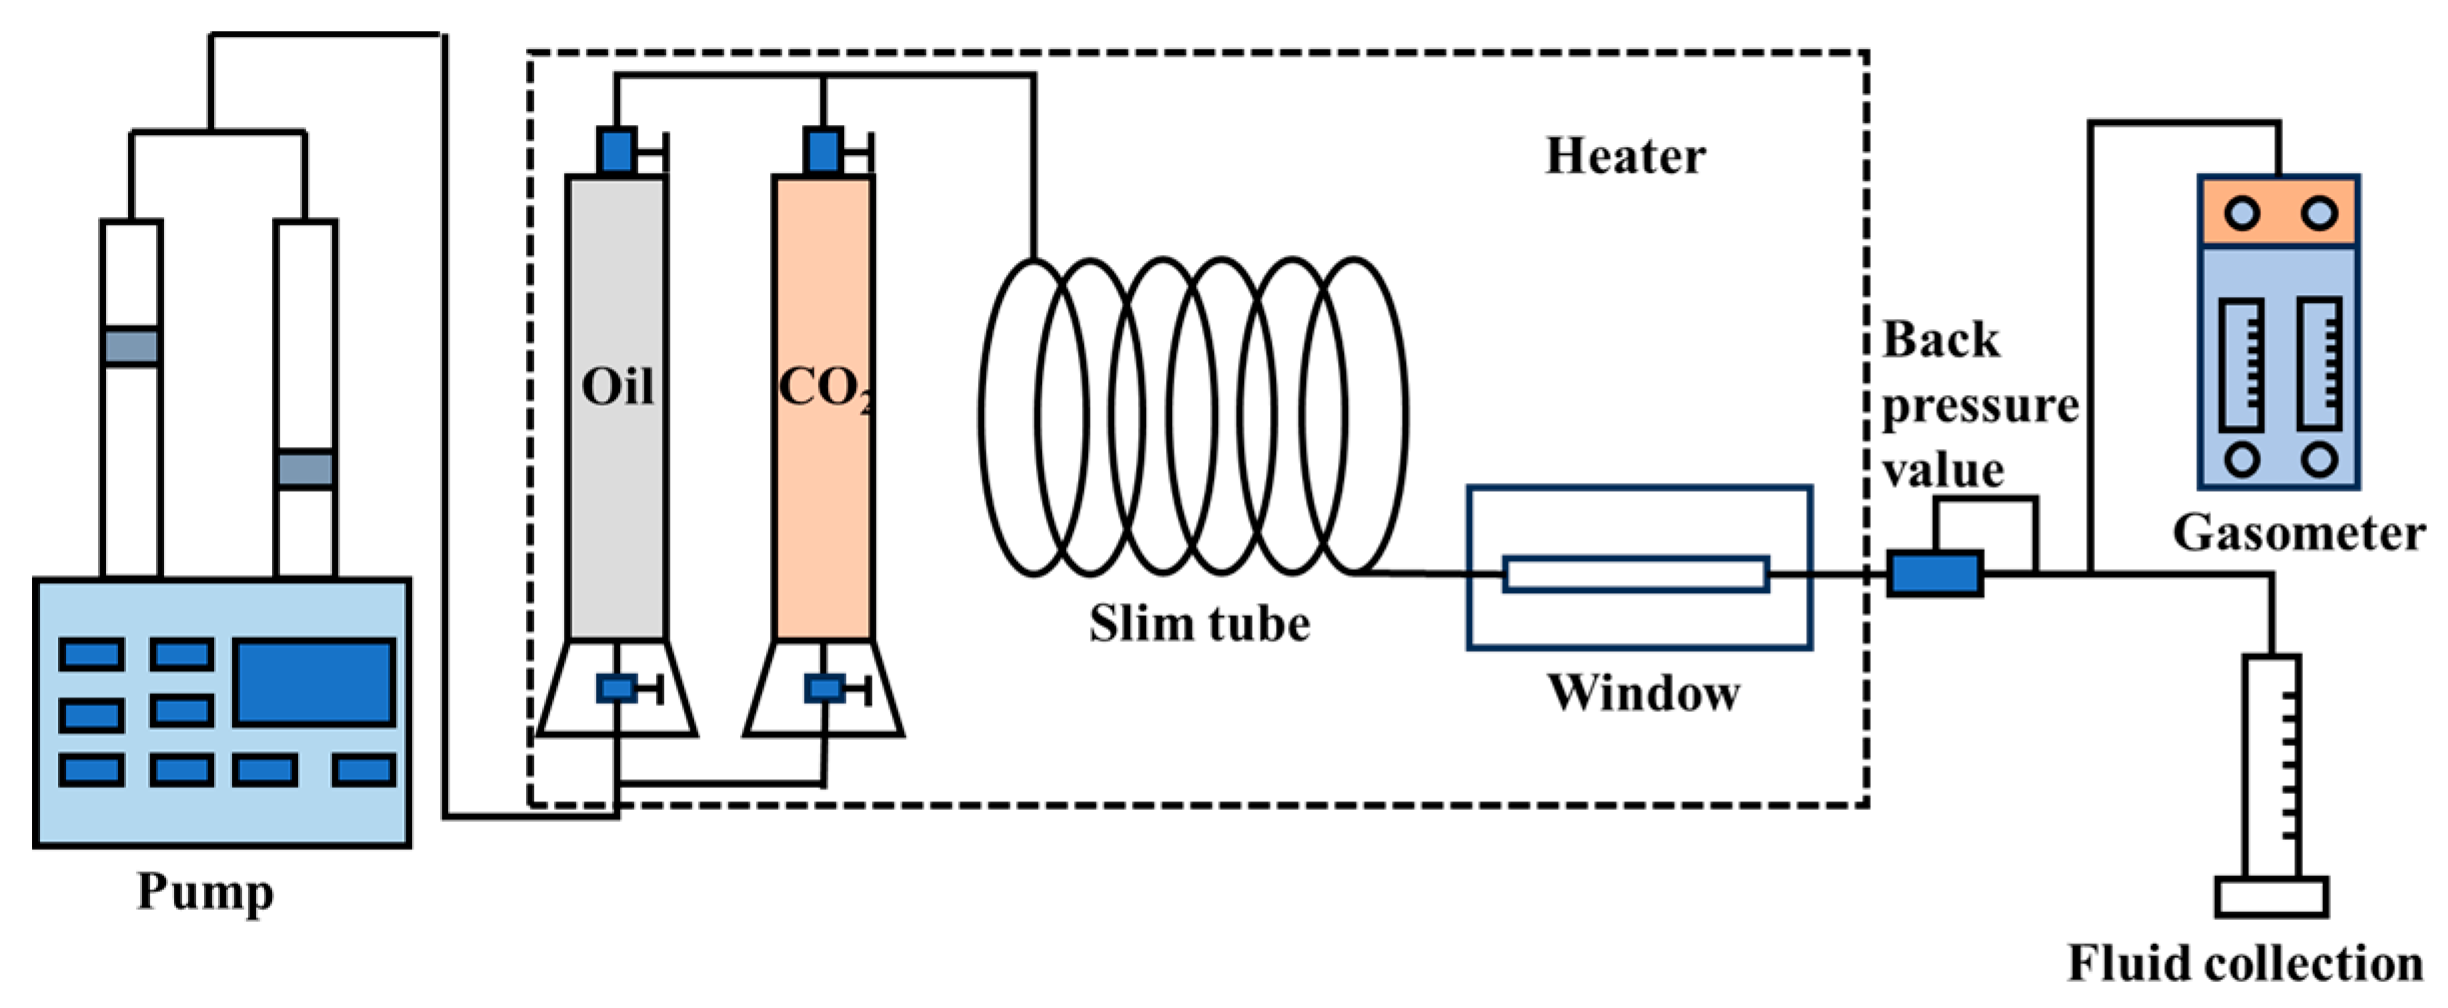
The PVT analyzer (purchased from DBR, Canada) has a maximum working pressure of 103 MPa and a full operating temperature of 180°C. The flow chart of the PVT analyzer is shown in Figure 1. The slim tube experimental device is formed in the laboratory. The tube length is 16.0 m, the inner diameter is 3.86 mm, the outer diameter is 6.35 mm, the porosity is 33%, and the permeability of the gas measurement is 1.0 μm2. The flow chart of the slim tube experiment is shown in Figure 2.

2.3. Methods

2.3.1. PVT Experiments

  • Constant Composition Expansion experiments (CCE)
Constant composition expansion experiments are used to determine the relationship between volume and pressure of crude oil with constant mass at reservoir temperature to obtain parameters such as saturation pressure, compression coefficient, relative volume, and density of formation fluids. The steps are as follows: The PVT analyzer is evacuated at a temperature of 97.3°C, then a certain amount of crude oil is transferred to the PVT analyzer in a single phase at a constant temperature for more than 4 hours, and the crude oil is pressurized to a pressure P1, which is higher than the reservoir pressure. Above the saturation pressure, pressurization is carried out by stepwise depressurization with 1~2MPa per step; below the saturation pressure, volume expansion is carried out with 1~20cm3 per step. After each depressurization step and expansion, the sample is stirred and stabilized thoroughly, and the pressure and volume are recorded. The experiment is stopped when the sample had been expanded to twice the original sample.
2.
Differential Liberation experiments (DL)
Differential liberation or multi-degassing experiments involve degassing crude oil at reservoir temperature in multi-graded pressure reductions to measure the relationship between oil and gas properties and composition with pressure. The crude oil is kept in a single phase, fully stirred to equilibrate, and then stabilized at saturation pressure. The sample is depressurized in 3-5 pressure steps, with each depressurization recording the sample volume and the volume of gas produced.
3.
Swelling Tests (ST)
Swelling tests measured the relationship between the density and viscosity of crude oil with the molar fraction of CO2 by gradually increasing the molar fraction of injected CO2. Firstly, the volume of the crude oil is tested at saturation pressure, and then a certain amount of CO2 is injected into the crude oil at this pressure. The pressure is increased until all the CO2 is dissolved to test the saturation pressure, swelling factor, oil viscosity, and other parameters of the CO2-crude oil system. The above experimental steps are repeated until the molar content of CO2 in the system reaches about 80% when the experiment is stopped.

2.3.2. Slim Tube Experiments

The slim tube model is heated at the experimental temperature, and the slim tube is evacuated for more than 12 hours. The pore volume is measured by injecting toluene into the tube model. The slim tube model is saturated with crude oil at the experimental pressure. CO2 is injected at a constant rate of 15.00 cm3/h to displace the crude oil. Whenever a certain amount of CO2 is injected, the output oil and gas volumes, injection pressure, and back pressure are measured. Fluid phase and color changes are observed through a high-pressure observation window. The experiment is stopped after injecting 1.2 times the pore volume of CO2. Repeat the above experiments by changing the experimental pressure to determine the minimum miscible pressure for CO2 flooding.

3. Numerical Simulation

3.1. Simulation for Slim Tube Experiments and 1-D CO2 Flooding

3.1.1. Simulation for Slim Tube Experiments

1-D numerical simulation model based on parameters of slim tube experiment. The cumulative CO2 injection volume is 1.2 PV. The fluid parameters simulated for the slim tube experiments are obtained based on the fitting results of CCE, DL, and ST experiments with the WinProp module of the CMG software. The parameters of the thin tube model are shown in Table 2.

3.1.2. Simulation for 1-D CO2 Flooding

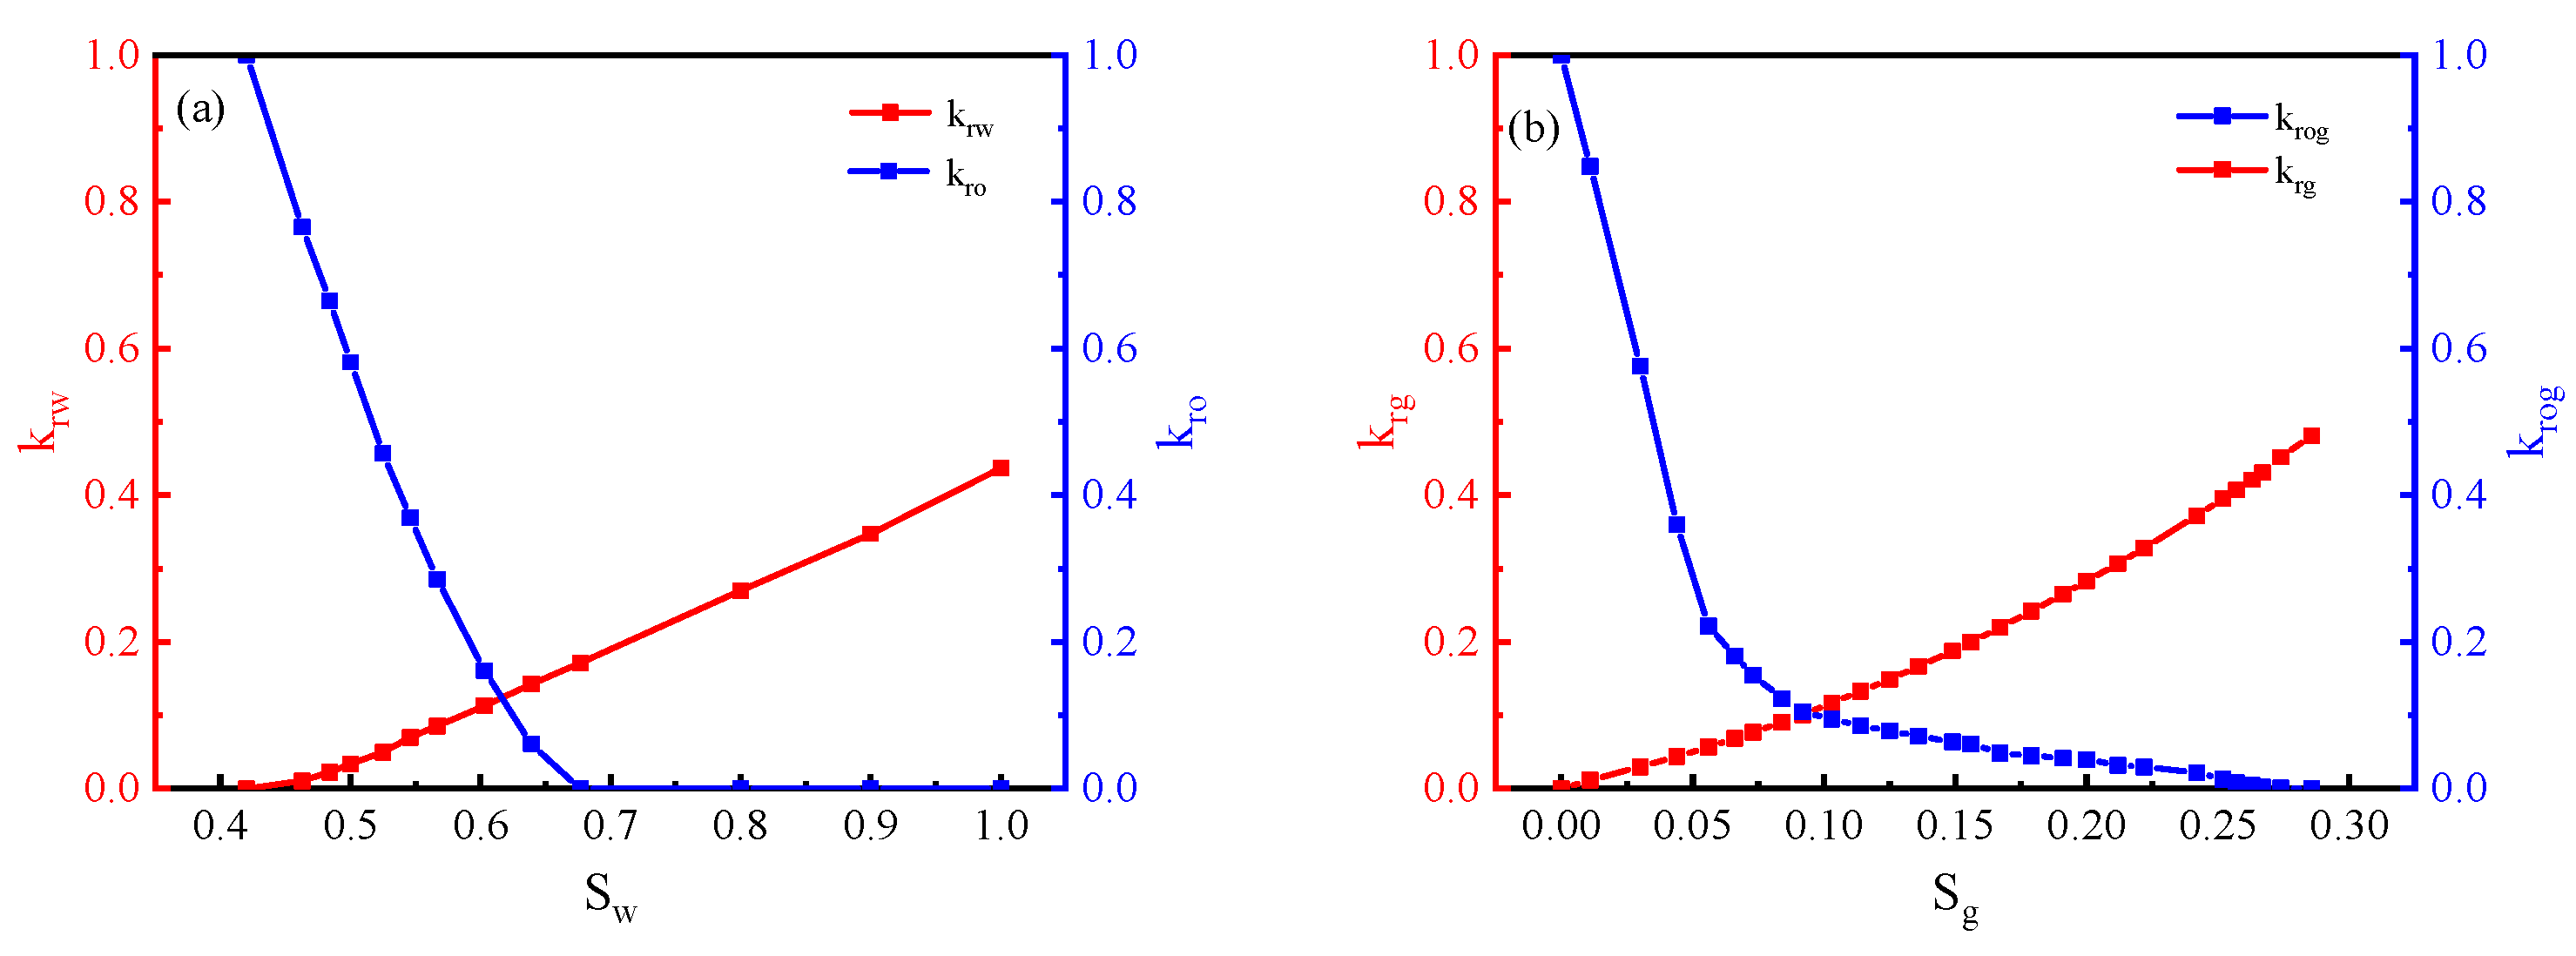
The GEM module of CMG software is used to establish a 1-D numerical simulation model of CO2 flooding, the EOS of which is fitted by the WinProp module of CMG software. The values of the model parameters (porosity, permeability, saturation, and so on) are consistent with those in the Jilin Oilfield, and the processes of miscible flooding, immiscible flooding, and partly-miscible flooding are simulated by setting different original reservoir pressures. To ensure the accuracy of the solution, the model is solved by a fully implicit method. The relative permeability curves are shown in Figure 3. The relative permeability of the oil, gas, and water phases is calculated using the Stone II method. The characterization of the miscible state is based on the Coats’ component model theory, which describes the miscible state through the relationship between the relative permeability and the interfacial tension of oil & gas. The reference interfacial tension σogr is set to 0.5 mN/m. When the interfacial tension σog is higher than 0.5 mN/m, the interfacial tension does not affect the relative permeability curves. When the interfacial tension σog is lower than 0.5 mN/m, oil starts to be displaced in the form of miscible flooding. The relative permeability curve of miscible flooding is determined by interfacial tension interpolation. The interpolation equations are shown in equations (1)-(3). The values of the 1-D model parameters are shown in Table 3.
k rom = m × k ro + ( 1 m ) × k row ( S w ) + k rg ( S g ) 2 × S o ( 1 S w )
k r g m = m × k r g + ( 1 m ) × ( k r o w ( S W ) + k r g ( S g ) 2 × S g ( 1 S w )
m = { 1 σ o g > σ o g r ( σ o g σ o g r ) n σ o g σ o g r
where krom and krgm are the relative permeability of oil and gas after interpolation; kro and krg are the relative permeability of oil phase and gas before interpolation; Sw, Sg, So are the saturation of water gas, and oil, respectively. krow is the relative permeability of water in the oil-water relative permeability curve, which is a function of water saturation Sw; krg is the relative permeability of gas in the oil-gas relative permeability curve, which is a function of gas saturation Sg; σog is the actual oil-gas interfacial tension in the model; σogr is the reference interfacial tension, which takes the value of 0.5 mN/m; m is the interpolated value, the value of which depends on the relationship between the σog and σogr.

3.2. Simulation for 2-D CO2 Flooding with Quarter Five-Spot Well Pattern

A 2-D numerical simulation model of CO2 flooding components is established using the GEM module of CMG software, the EOS equations and relative permeability curves of which are consistent with the 1-D model. The model’s porosity, permeability, and saturation are set with reference to Jilin Oilfield. The miscible, immiscible, and partly-miscible flooding processes are simulated by setting different original reservoir pressures. Continuous gas injection (CGI) is simulated with a constant gas injection period of 40 years. The model parameters are shown in Table 4.
Compared with the traditional numerical simulation model for CO2 flooding, a series of improvements are made in this model: To enhance the model convergence and the solution accuracy, the model is solved using the fully implicit method instead of the traditional IMPSE method. In the iterative solution method, a nine-point difference format is used to suppress the grid orientation effect of CO2 flooding instead of the conventional five-point difference format. For the general seepage equation Δu = f, the five-point differential and nine-point differential solution equations for the center point ui,j are shown in equation (4) and equation (5), respectively.
1 h 2 ( u i 1 , j 2 u i , j + u i + 1 , j ) + 1 h 2 ( u i , j 1 2 u i , j + u i , j + 1 ) = f i j
1 h 2 ( u i 1 , j + 1 + u i + 1 , j + 1 + u i 1 , j 1 + u i + 1 , j 1 + 4 ( u i , j + 1 + u i , j 1 + u i 1 , j + u i + 1 , j ) 20 u i , j ) = f i j

3.3. Solution of Sweep Coefficient for CO2 Flooding

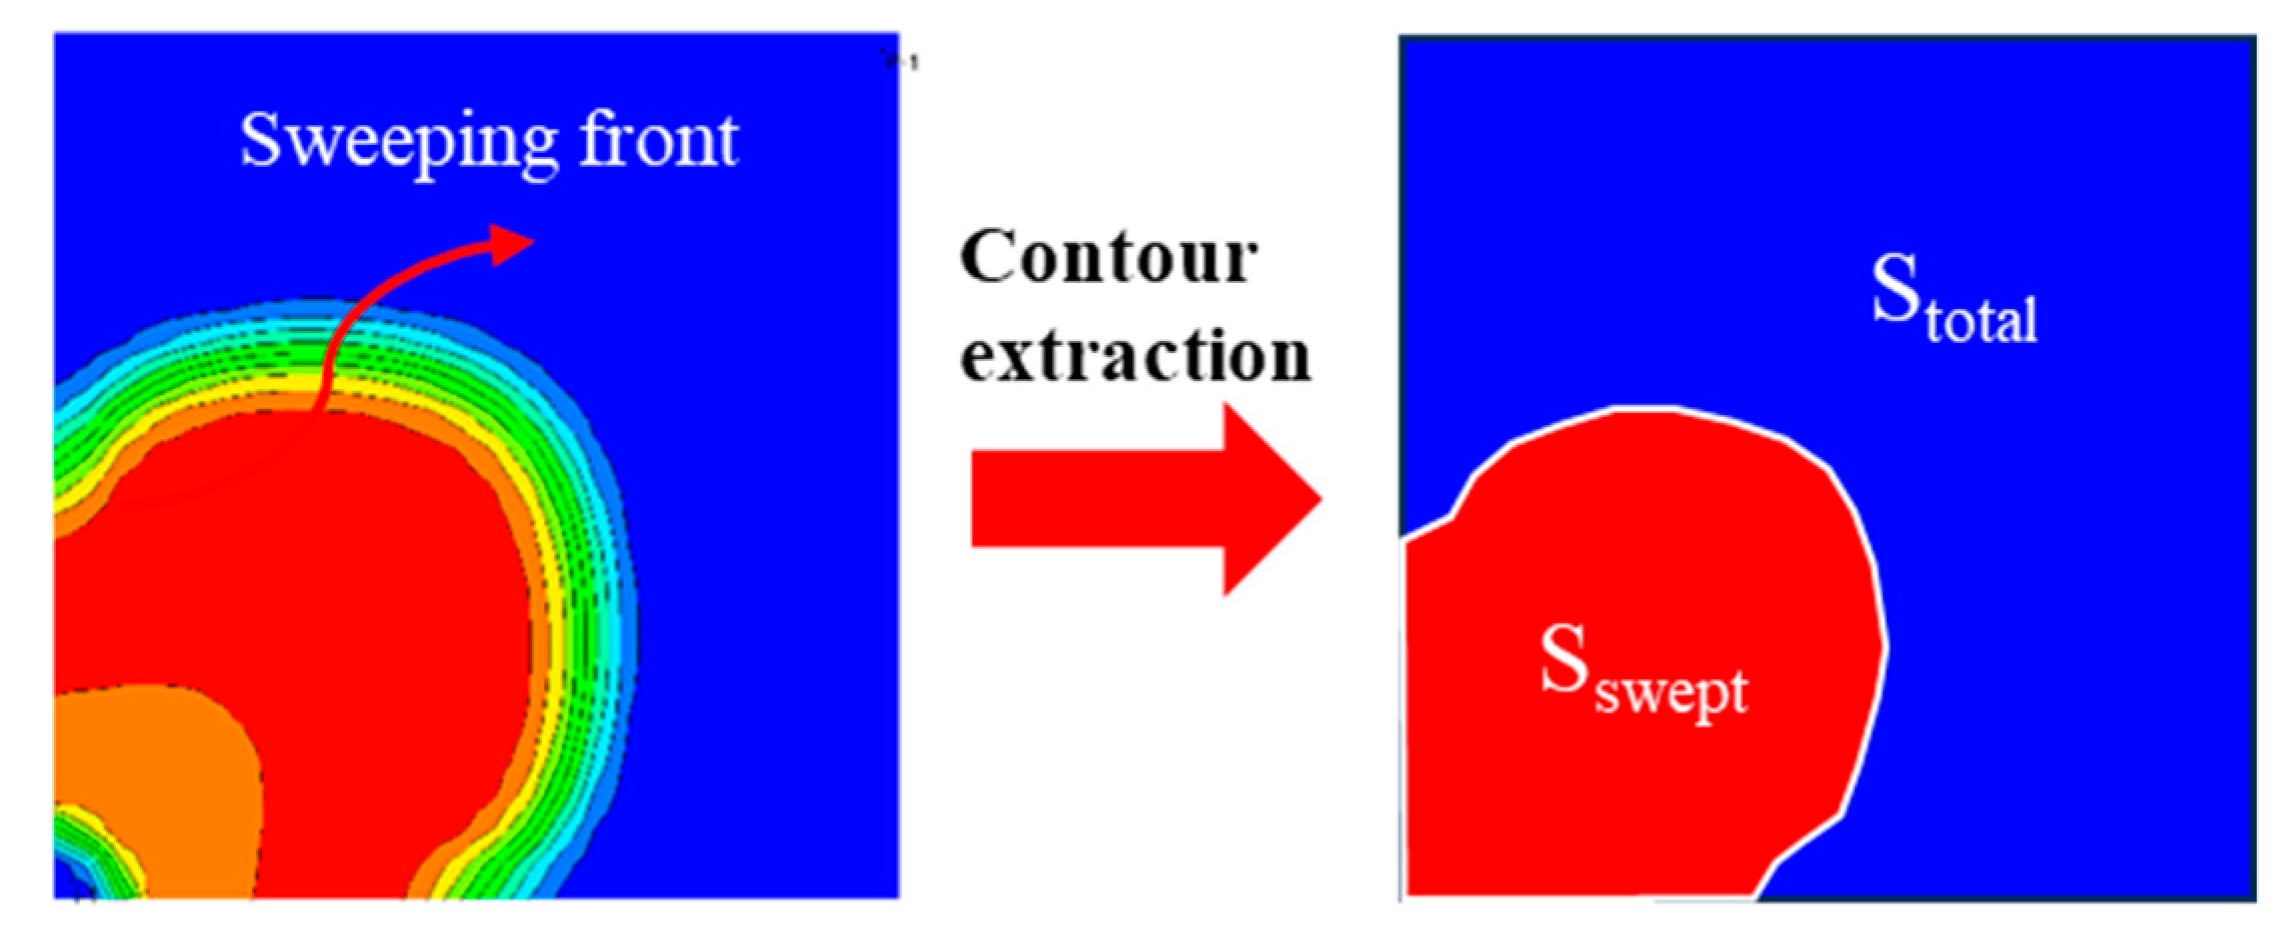
Parameters such as CO2 content in oil and interfacial tension of each grid obtained from the solution of the 2-D numerical model are imported into MATLAB by programming a data reading algorithm. The discrete grid data is expanded using linear or cubic interpolation methods. Contour maps of CO2 content in oil and interfacial tension at different moments of CO2 flooding are drawn. The contour lines corresponding to the miscible and immiscible front of CO2 flooding are extracted. The polygon areas surrounded by the contour lines are solved, and the sweep coefficient at the corresponding time can be obtained compared with the total grid area. The mechanism is shown in Figure 4, and the sweep coefficient Esweep is calculated as shown in equation (6).
E s w e e p = S s w e p t S t o t a l × 100 %
where Sswept and Stotal are the areas enclosed by the contour line of the CO2 front and the coordinate axis and the total grid area, respectively.

3.4. Main Controlling Factor Assessment of CO2 Flooding Based on Random Forest Algorithm

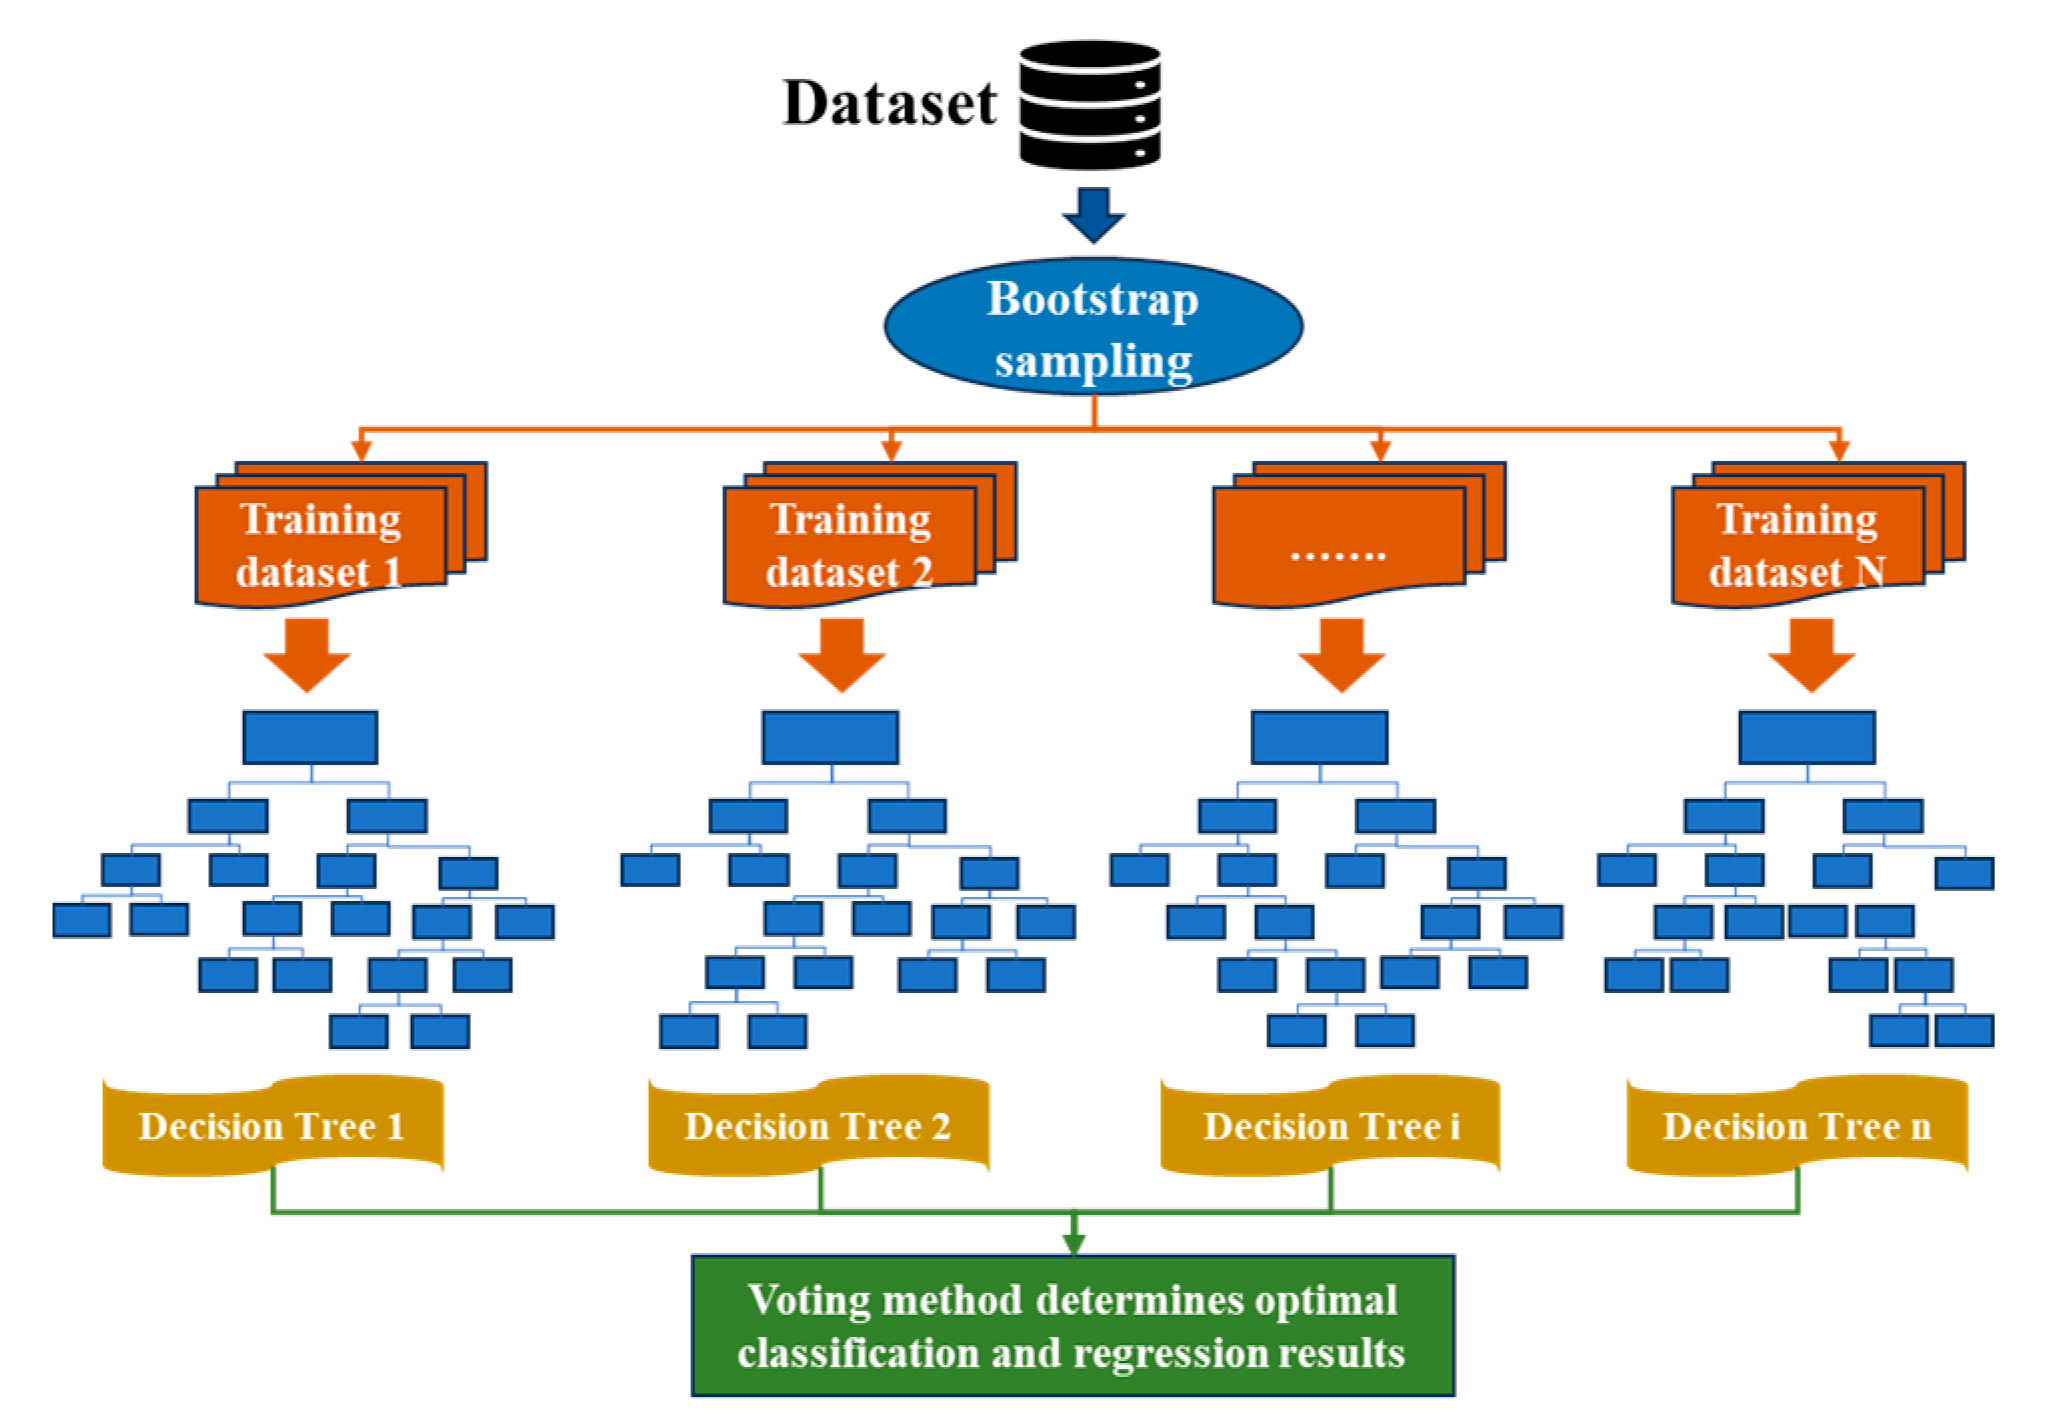
Different ranges of values are assigned to each parameter affecting the sweep coefficients of CO2 flooding, and 1000 sets of numerical simulation models with different combinations of parameters are formed using the Latin hypercube design method, which can make the values of each parameter satisfy the normal distribution. The range of values for each parameter is shown in Table 5. The sweep coefficients of CO2 flooding for different parameter combinations are obtained by solving the 1000 sets of models. The Bootstrap sampling method is used to form 800 training sets and 200 prediction sets. The 800 training sets are used to construct multiple decision trees to develop a Random Forest model. Predictions are made on the prediction sets, and the ballot method decides the regression or classification results. Different numbers of decision trees and leaves are set to form different Random Forest models and solve the prediction errors (MSE) of the different Random Forest models. The numbers of decision trees and leaves with minimum MSE are preferred as the parameters of the optimal Random Forest model. The principle of the Random Forest algorithm is shown in Figure 5. Based on the out-of-bag data replacement method (OOB), the optimized Random Forest model is used to evaluate the importance of each influencing factor (FI). The main steps are as follows: (1) For decision tree i, the prediction error rate e1 of out-of-bag data is calculated. (2) After randomly replacing the observations of the influencing factor Xj, the decision tree is constructed again and the prediction error rate e2 of the out-of-bag data is calculated. (3) The differences between the two error rates are calculated and standardized to calculate the average MDAj in all decision trees, which is the factor importance value (FIj). The larger the FIj value, the higher the importance of the parameter Xj. The calculation of FIj is shown in Equation (7) [36].
F I j = M D A j = 1 T t T [ 1 | D t | ( X i j D t j ( R k ( X i j ) y i k ) 2 X i D t k ( R k ( X i ) y i k ) 2 ]
where T is the number of decision trees; (Xi,yi) is the training set; xij is the sample after a random exchange of the j-type influence parameter of Xi; Dt is the out-of-bag sample set of the decision tree t, and Dtj is the sample set formed after the j th type of influence parameter exchange; R(Xi) is the predicted output of sample Xi. yik is the regression output of the k-type influence parameter under multi-objective regression.

4. Discussion

4.1. PVT Fitting and Establishment of EOS Equation for Reservoir Fluid

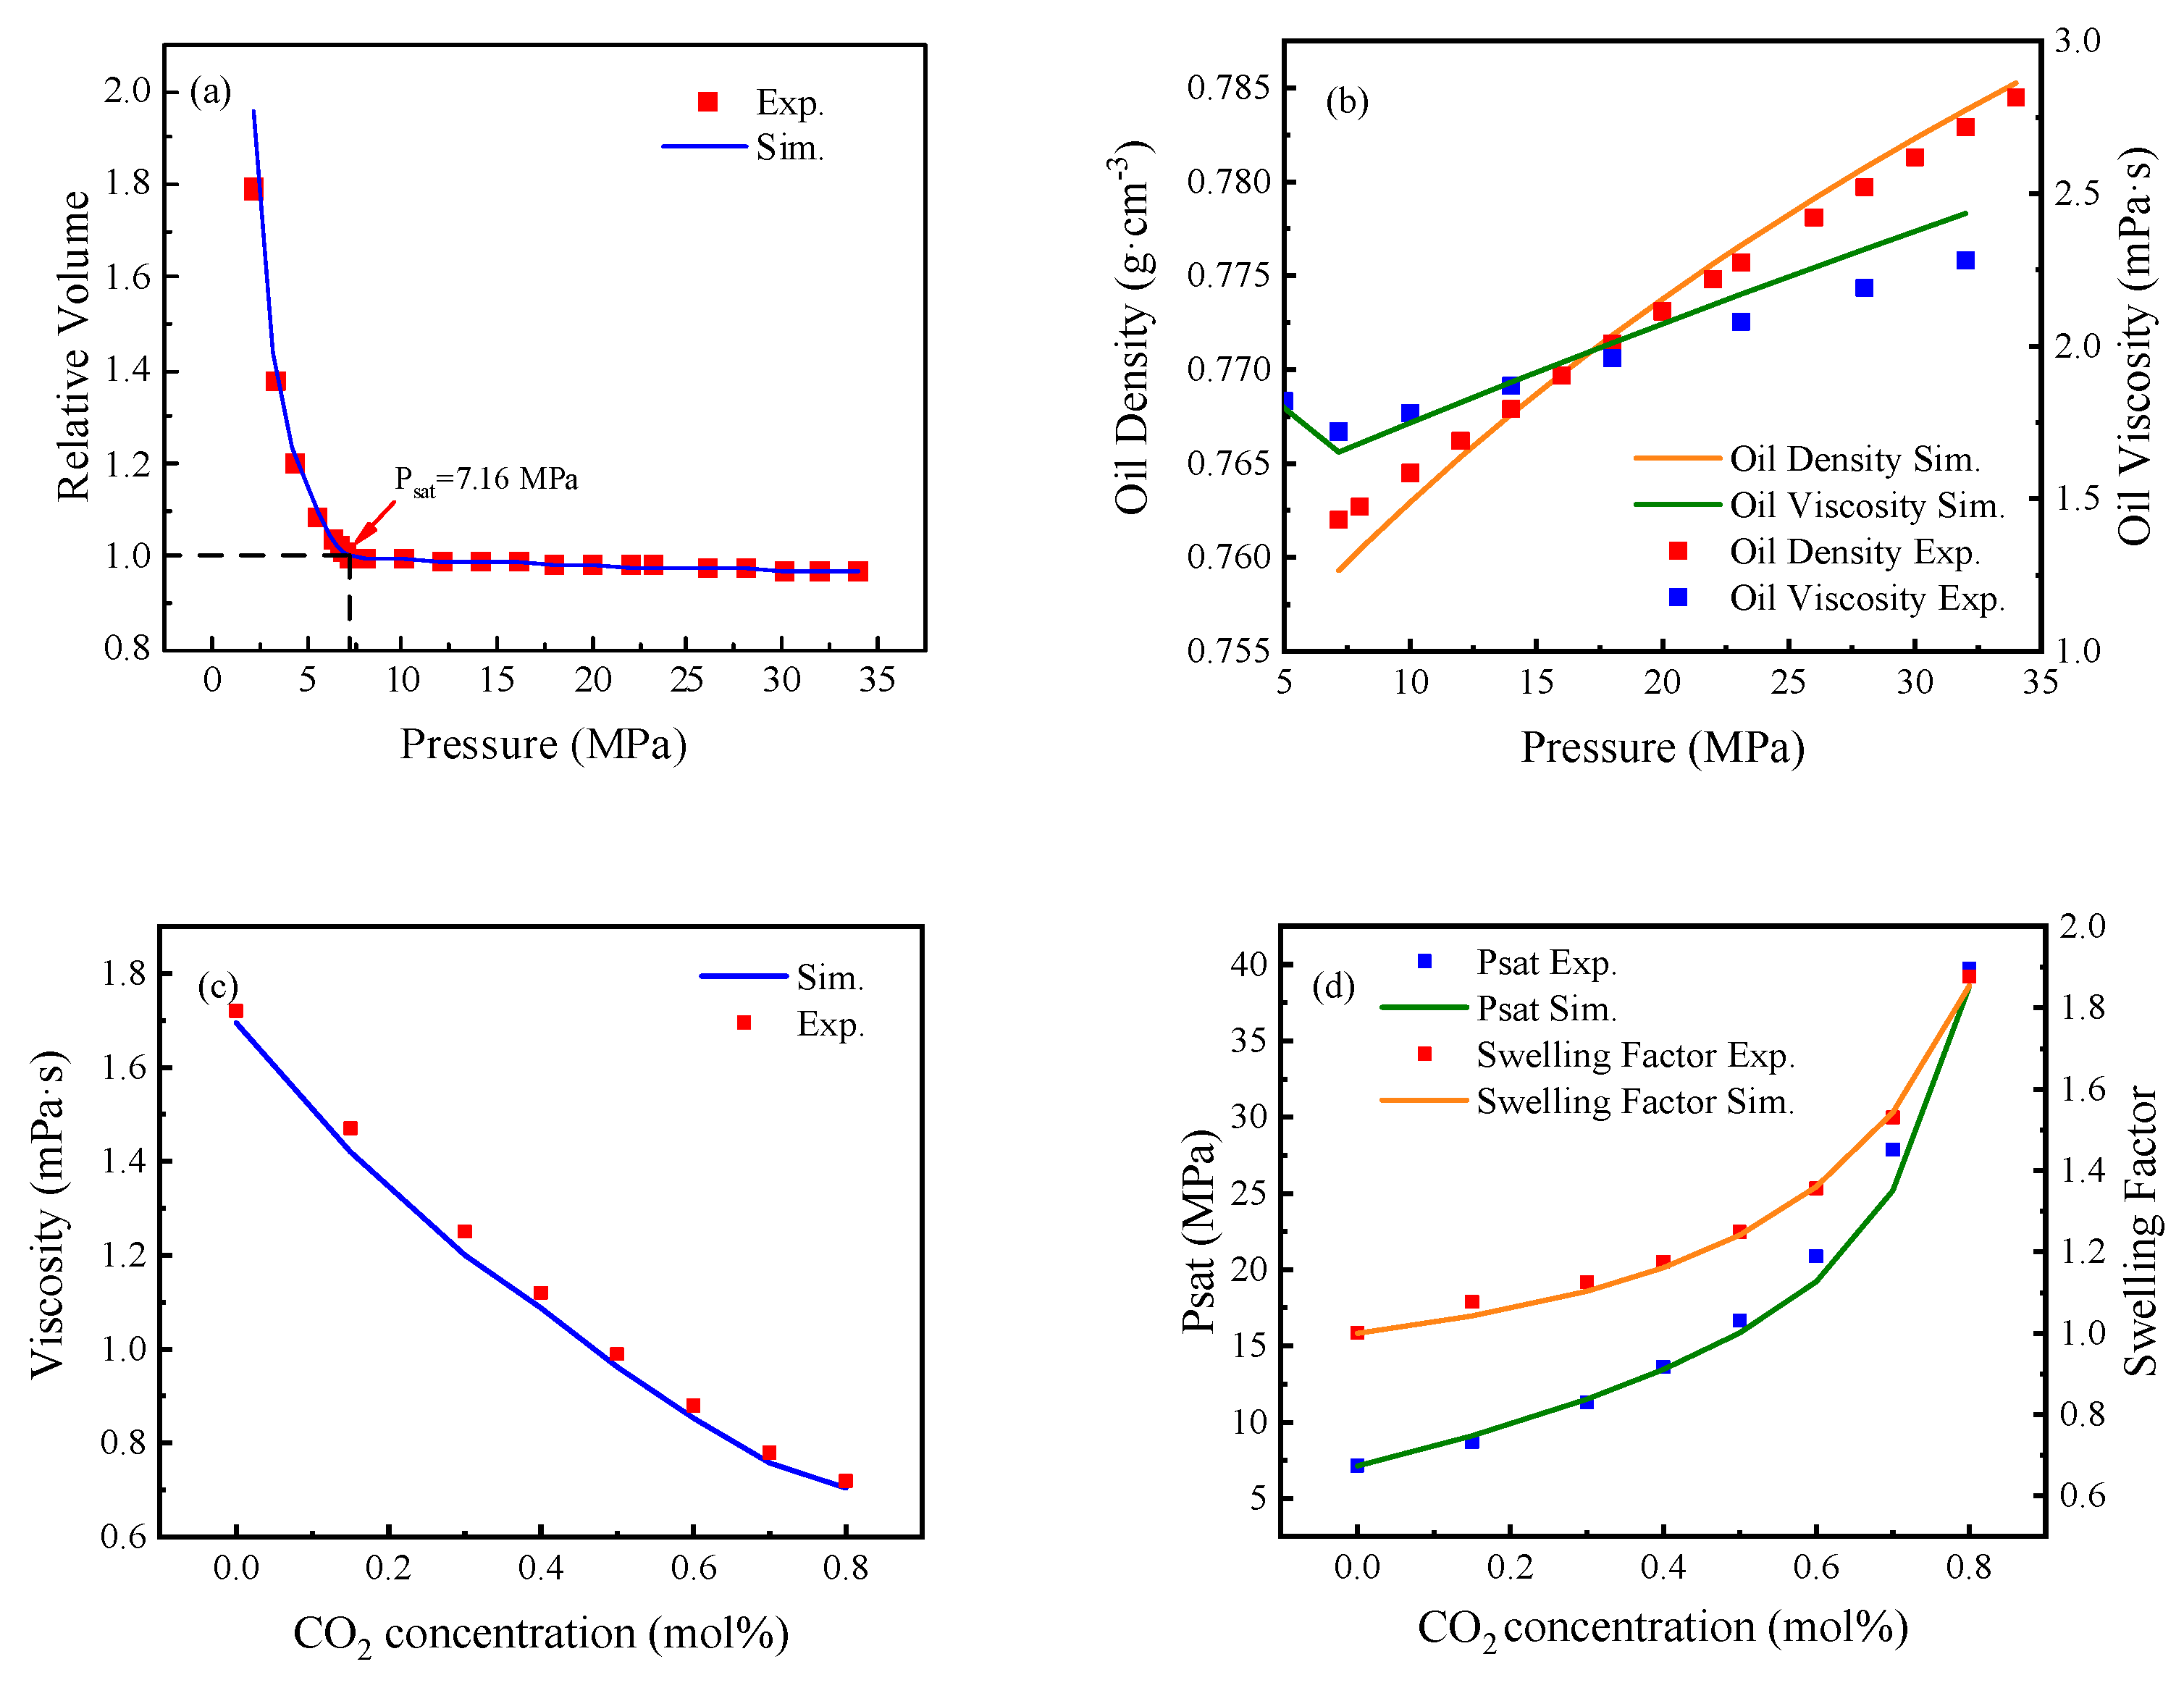
The saturation pressure Psat, relative volume, oil phase density, viscosity, and swelling factor of reservoir fluid are measured by CCE, DL, and ST experiments. The C17+ component of the formation oil is divided into three components: C17-C26, C27-C39, and C40+, and the C1-C16 components are merged into five components: C1, C2, C3+C4, C5+C6, and C7-C16. By adjusting the critical pressure Pc, critical temperature Tc, binary interaction coefficient, and other parameters of the heavy components, the fluid component model is obtained based on fitting the results of PVT experiments. The results are shown in Figure 6. Some parameters of the EOS after PVT fitting are shown in Table 6. It can be seen from Figure 6 that the saturation pressure of the pure oil phase used in the experiment is 7.16 MPa, and the viscosity at saturation pressure is 1.74 mPa·s. When the mole fraction of injected CO2 is 80 %, the oil saturation pressure increases to 39.7 MPa, the viscosity decreases to 0.72 mPa·s, and the swelling factor increases to 1.8762. The swelling and viscosity reduction effects of CO2 on crude oil are propitious to enhancing oil recovery. The experimental results are compared with the fitting results. It can be seen that the above component, the splitting and merging scheme for oil phase components, can accurately fit the results of PVT experiments, and the obtained EOS parameters can better simulate the high-temperature and high-pressure physical properties of crude oil in reservoirs.

4.2. Determination of Minimum Miscible Pressure Based on Slim Tube Experiment Simulation

The CO2 displacement experiment is carried out with a slim tube model at the formation temperature of 97.3 °C, and the displacement pressure ranges from 18 MPa to 30 MPa. The cumulative amount of injected CO2 is 1.2 PV. The recovery factors of CO2 flooding under different displacement pressures are calculated, and the results are shown in Figure 7a. When the displacement pressure is less than 22.10 MPa, the recovery factor of CO2 flooding is low, which is an immiscible displacement process, and the recovery factor increases rapidly with the increase of displacement pressure. When the displacement pressure increases from 18 MPa to 23.11 MPa, the recovery degree rises from 76.89 % to 94.53 %. When the displacement pressure is higher than 22.10 MPa, the CO2 flooding pattern turns to miscible flooding, and the increase of recovery factor slows down. When the displacement pressure increases from 23.11 MPa to 30.0 MPa, the recovery degree only increases from 94.53 % to 96.08 %. The sections of immiscible and miscible displacement are fitted, respectively, and the displacement pressure corresponding to the intersection of the fitting lines is 22.10 MPa. Based on the EOS equation formed in Section 4.1, a 1-D slim tube numerical model is established to simulate the results of the tube experiment. The results are shown in Figure 7b. The maximum fitting error of recovery factor under immiscible flooding is about 7 %, and the maximum fitting error of recovery degree under miscible flooding is about 0.8 %. The simulation results show that the Minimum Miscible Pressure is 23.30 MPa, and the error compared with the experimental results is 5.4 %, which indicates that the EOS equation formed by PVT fitting can accurately reflect the characteristics of crude oil and can be used for subsequent numerical simulation work.

4.3. Front Movement Rules of CO2 Flooding under Different Flooding Patterns

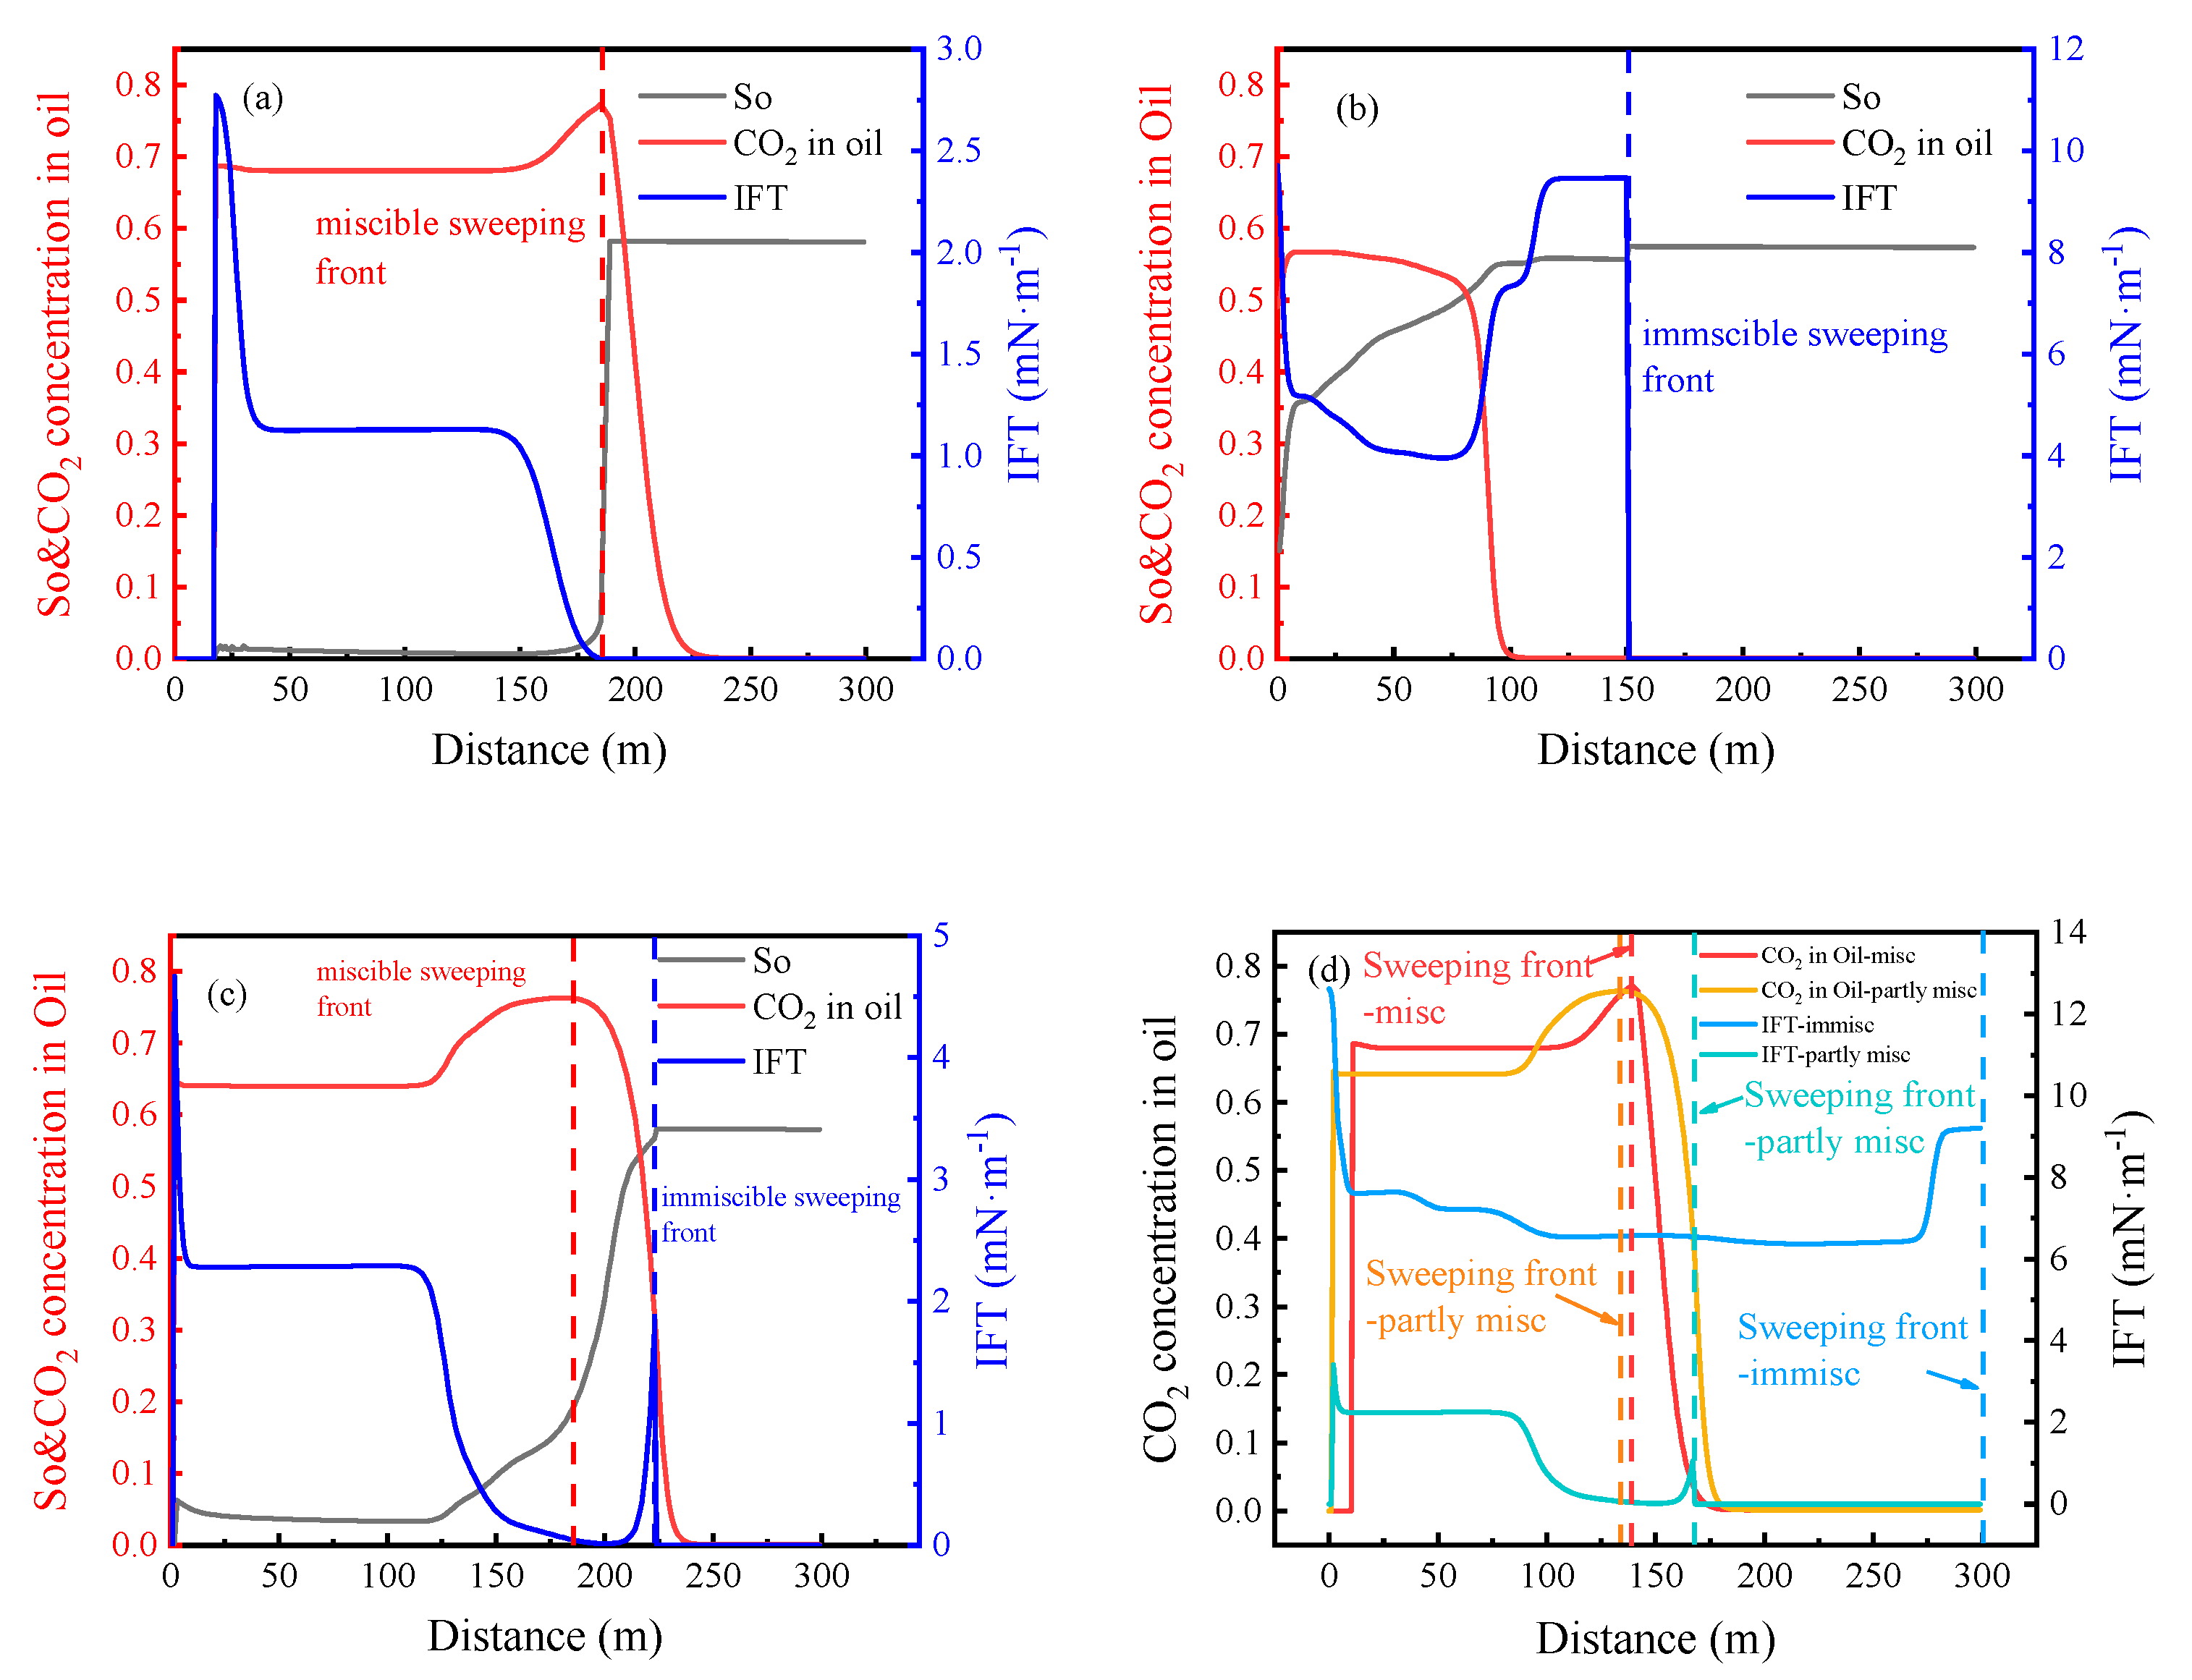
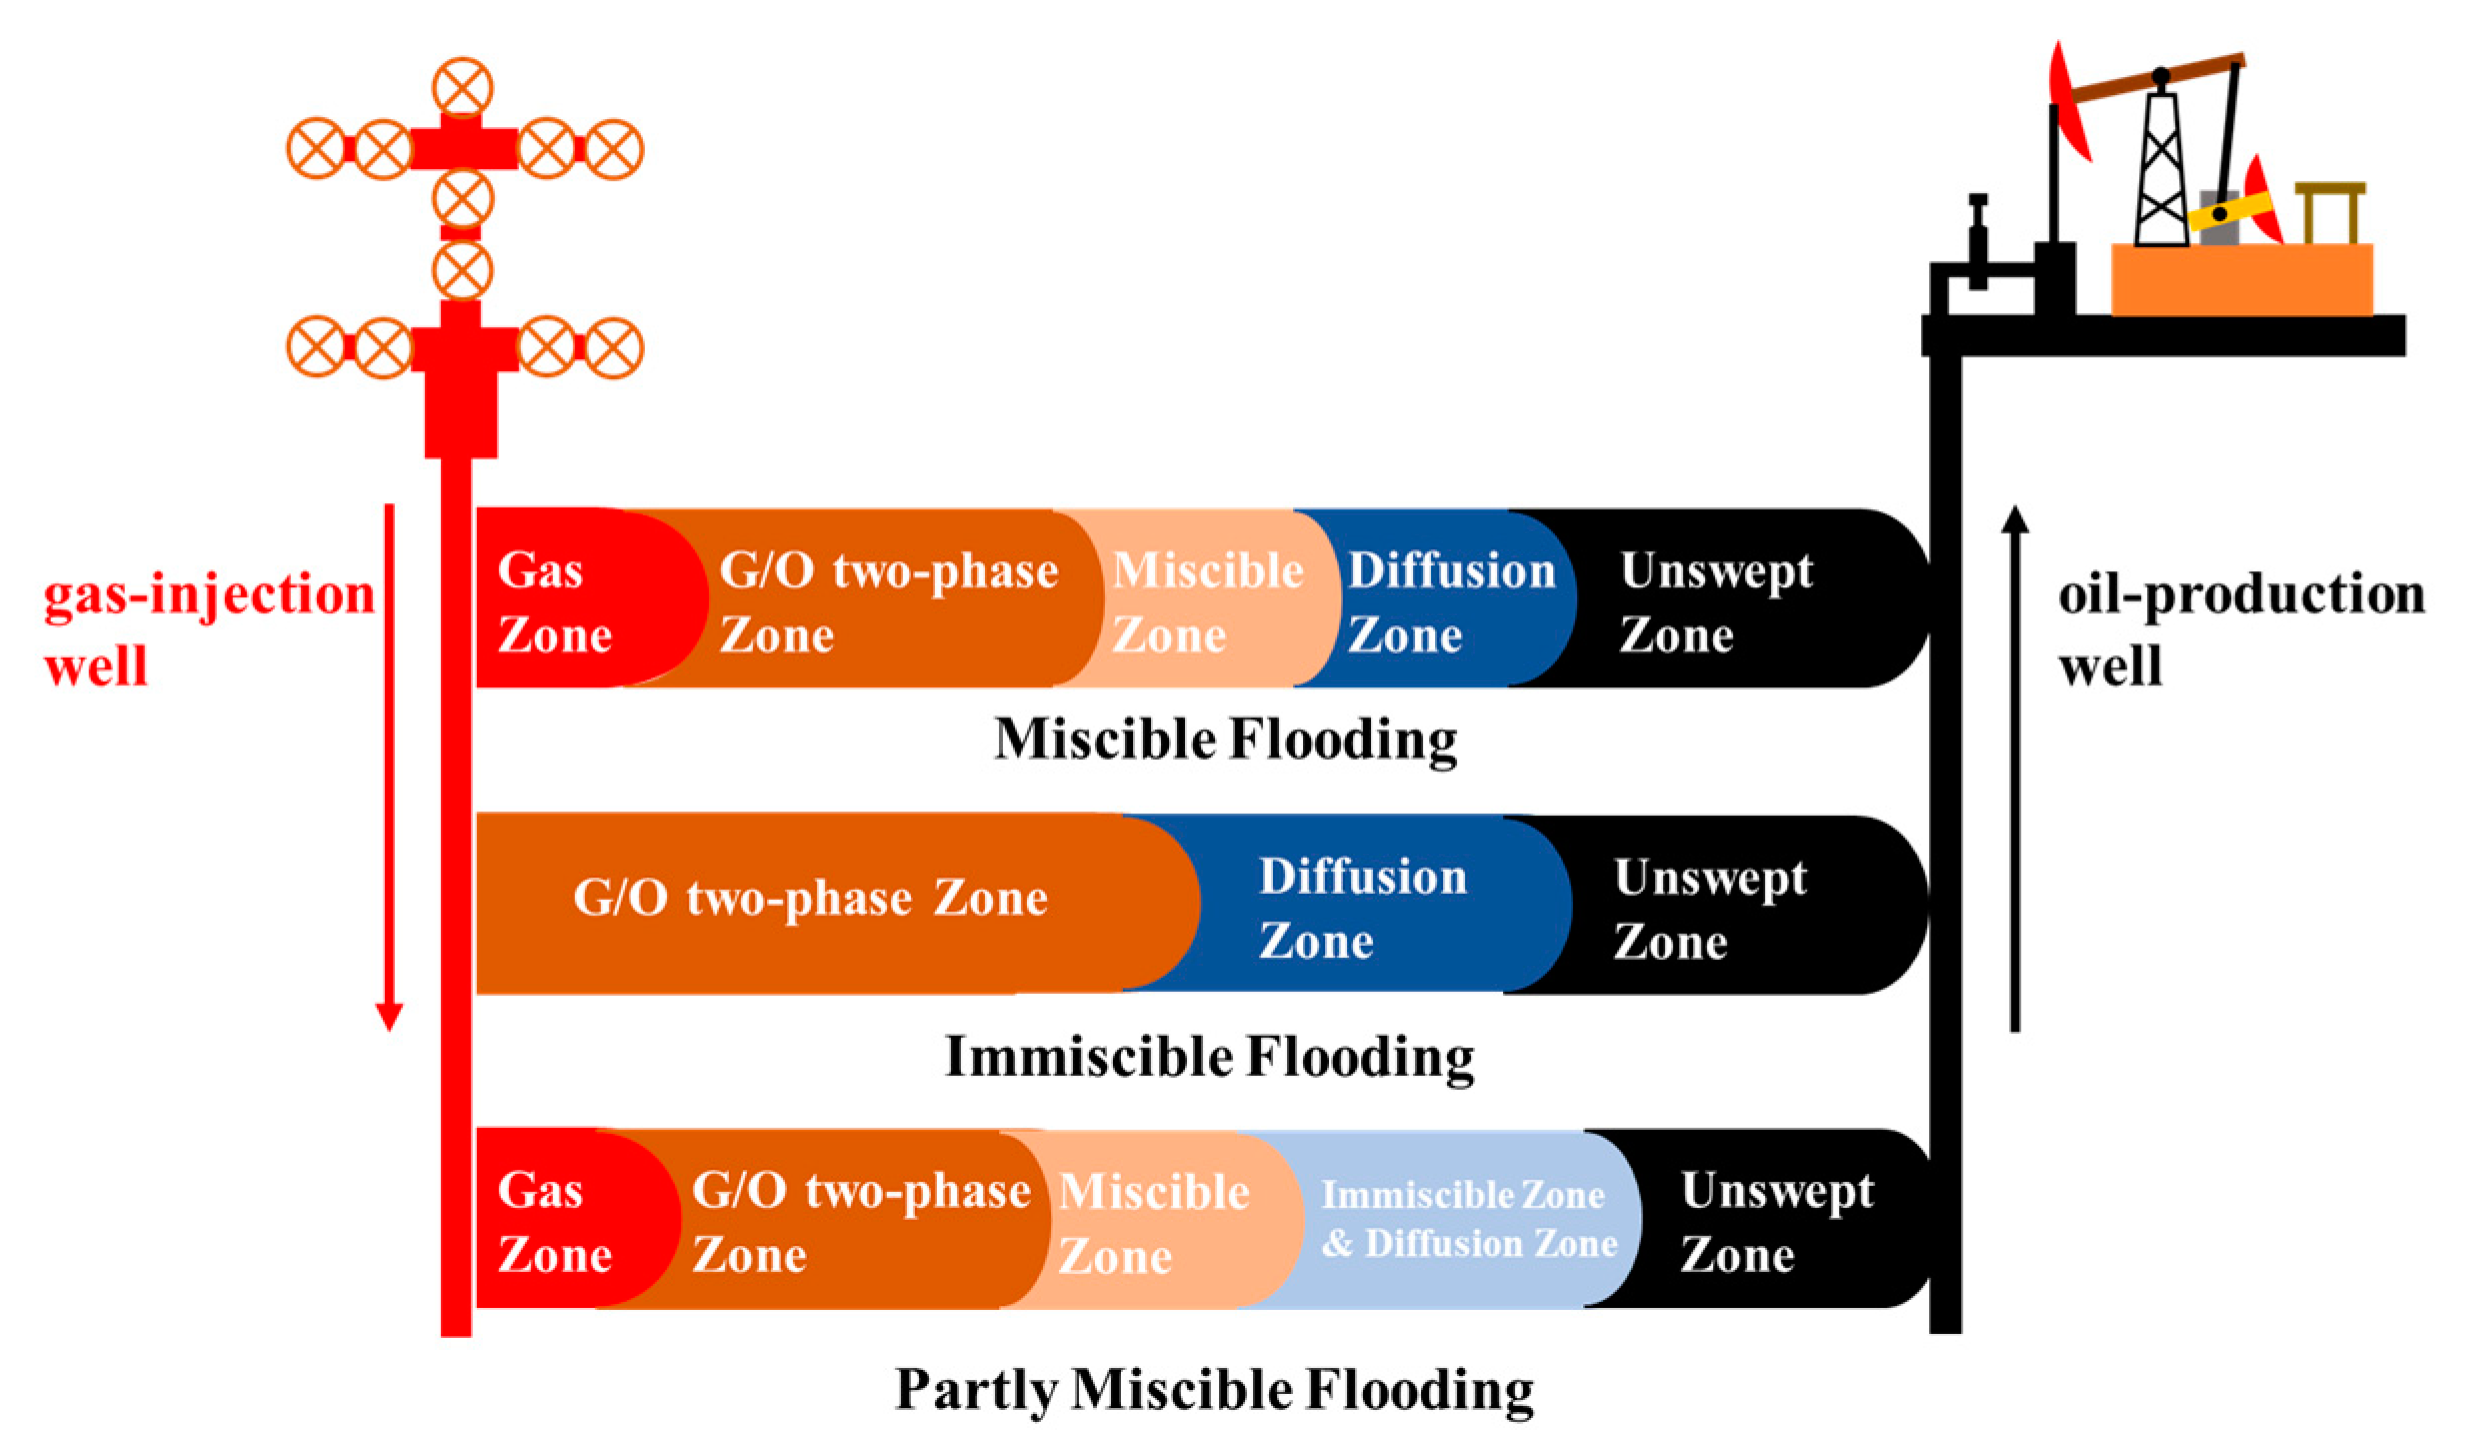
Currently, the classification of CO2 flooding is mainly based on the relationship between original reservoir pressure and minimum miscible pressure, which is divided into miscible flooding, immiscible flooding, and near miscible flooding. However, in the oilfield development process, the reservoir pressure field is in dynamic change due to the conduction between injection and production wells, which causes the change of miscible degree. Therefore, according to the miscible degree, CO2 flooding is divided into three displacement patterns in this study: (1) Miscible flooding: The pressure between injection and production wells is higher than the minimum miscible pressure, and the miscible degree is 1.0. (2) Partly-miscible flooding: the original formation pressure of the reservoir is lower than the minimum miscible pressure, but the pressure near the injection well is higher than the minimum miscible pressure due to the reservoir energy enhancement of gas injection, thus forming a miscible flooding zone. The oil production of production wells decreases reservoir pressure, and the immiscible flooding zone is formed within a certain range near the production well. The miscible degree of partly-miscible flooding is between 0 and 1.0. (3) Immiscible flooding: The pressure between injection and production wells after gas injection is lower than the minimum miscible pressure, and the displacement process maintains immiscible flooding. The miscible degree of immiscible flooding is 0. By establishing a 1-D numerical simulation model, the distribution of CO2 composition in the oil phase, oil saturation, and oil-gas interfacial tension between injection and production wells under different displacement patterns of CO2 flooding is studied, respectively, and the miscible/immiscible front position and front movement rules of are determined. The results are shown in Figure 8. Figure 8a shows the distribution of fluid properties between injection and production wells in miscible flooding. The oil saturation of miscible flooding maintains a meager value with the distance increase. Then, it increases rapidly to the initial oil saturation Soi, showing the characteristics of piston-like displacement. The interfacial tension increases rapidly with the distance and then gradually decreases to the platform value. When the distance reaches a certain value, it gradually decreases to 0. The CO2 content in the oil phase increases rapidly and reaches the platform value. The CO2 content then increases gradually to the maximum value after increasing a certain distance and finally decreases to the original CO2 content in the oil phase. According to the distribution of the above three parameters, the inter-well phase zone of miscible flooding is divided into a pure gas zone, two-phase zone, miscible zone, diffusion zone, and unswept zone. The gas zone is near the gas injection well area, where the oil saturation and interfacial tension are zero due to continuous CO2 injection and miscibility. Two-phase zone: The light components gradually evaporate into the gas phase, forming rich gas to migrate to production wells, which significantly increases the content of heavy components in crude oil at the miscible rare edge, thus forming an oil-gas two-phase zone. The crude oil in this zone is mainly the residual oil with high heavy component content. Due to the subsequent injection and dissolution of CO2, the CO2 content in this zone is significantly higher than the initial level. Miscible zone: The rich gas in the miscible front contacts the crude oil through the condensate miscible effect, so the light component and CO2 content in the oil phase increase significantly. The difference in component content between oil and gas decreases, and the interfacial tension, therefore, gradually decreases and finally reaches zero interfacial tension. The oil saturation suddenly changes to the initial oil saturation in this zone. Diffusion zone: CO2 enters the crude oil mainly through diffusion. As the distance increases, the diffusion effect gradually weakens, and the CO2 content decreases to the initial level. Unswept zone: The unswept zone only contains the pure oil phase. The interfacial tension is zero, the oil saturation is equal to the initial oil saturation, and the CO2 content in the oil phase is equal to the initial value. The above analysis shows that the front of the miscible zone should be located at the maximum CO2 content in the oil phase. Figure 8b shows the distribution of fluid properties between injection and production wells in immiscible flooding. With the increased distance, the oil saturation of immiscible flooding increases slowly to the initial oil saturation, forming a wide range of two-phase zone. The interfacial tension decreases rapidly with the distance increase, then increases sharply after a certain distance, and finally decreases to zero. The content of CO2 in the oil phase decreased slightly at first and then decreased significantly to the initial level after a certain distance. Similarly, the injection-production inter-well phase zone of immiscible flooding is divided into two-phase, diffusion and unswept zones. In the two-phase zone, due to the dissolution of CO2 in the oil phase, the interfacial tension is reduced to 4 mN / m, and the CO2 content in the oil phase is increased to about 0.55, which is lower than the CO2 content of miscible flooding. In the diffusion zone, the interfacial tension increases gradually due to the formation of CO2 concentration diffusion gradient. The interfacial tension reaches the maximum at the junction of the diffusion zone and the unswept zone, defined as the immiscible front of the immiscible flooding. Figure 8c shows the distribution of fluid properties between injection and production wells in partly-miscible flooding. The oil saturation of partly-miscible flooding first maintains a meager value (residual oil saturation) with increased distance. It then gradually increases to the initial oil saturation Soi, but the increase amplitude is less than that of miscible flooding. The interfacial tension has two extreme values with the increase in distance. The CO2 content in the oil phase gradually increases from the platform value of about 0.63 to the maximum value of 0.75. It then gradually decreases to the original CO2 content in the oil phase. Unlike miscible and immiscible flooding, partly-miscible flooding has both miscible and immiscible zones. In the miscible zone, due to condensate miscibility, the CO2 content in the oil phase reaches the maximum value, and the interfacial tension is reduced to zero, reaching the miscible state. In the immiscible zone, as the distance increases, the pressure between the injection and production wells decreases to less than the minimum miscible pressure, and the CO2 in the oil phase re-evaporates into the gas phase, resulting in the gradual decrease of the CO2 content in the oil phase and the rapid increase of the interfacial tension. The displacement process changes from miscible flooding to immiscible flooding. The inter-well fluid zone divisions of the three displacement patterns are summarized in Figure 9. Besides, the gas injection volume is fixed at 0.3 HCPV, and the front movement position of miscible flooding, partly-miscible flooding, and immiscible flooding are compared, as shown in Figure 7d. The front movement of immiscible flooding is the fastest, which has reached the production well. The front of the immiscible zone in partly-miscible flooding is located at 170 m, and the front of the miscible zone is located at 134 m, which indicates that the front movement velocity of the immiscible zone in partly-miscible flooding is faster than that of the miscible zone. Therefore, immiscible flooding is more likely to cause gas channeling problems than miscible and partly-miscible flooding.

4.4. Front Movement Rules of CO2 Flooding under Different Flooding Patterns

According to the fluid phase zone division results of miscible, immiscible, and partly-miscible flooding proposed in Section 4.3, the reservoir numerical simulation models of three displacement patterns are established based on the quarter-five-point well pattern. The distribution of oil-gas interfacial tension and CO2 content in the oil phase under different displacement patterns are output by MATLAB programming, and the contour map is formed. The effective sweep coefficient of CO2 under different displacement patterns is solved by programming. In addition, the ratio of the maximum sweep coefficient Esmax to the minimum sweep coefficient Esmin between layers is defined as the gravity overlap degree (GSD), as shown in Equation 8, to characterize the strength of gravity overlap during CO2 flooding. The larger the GSD value is, the stronger the gravity overlap effect of the displacement process is. The ratio of miscible zone swept volume Vs-mis to total swept volume Vs-total of partly-miscible flooding is defined as miscible degree (Dm), as shown in Equation 9, to characterize the strength of miscible degree in the process of partly-miscible flooding. The larger the Dm, the stronger the influence of miscibility on the sweep coefficient in the partly-miscible flooding, and the range of miscible degree Dm is 0 ~ 1.0. The effect of different factors on the sweep coefficient of CO2 under three displacement patterns is studied from geological parameters, crude oil viscosity, and injection-production parameters.
G S D = E s max E s min
D m = V s m i s V s t o t a l

4.4.1. Geological Parameters

  • Permeability
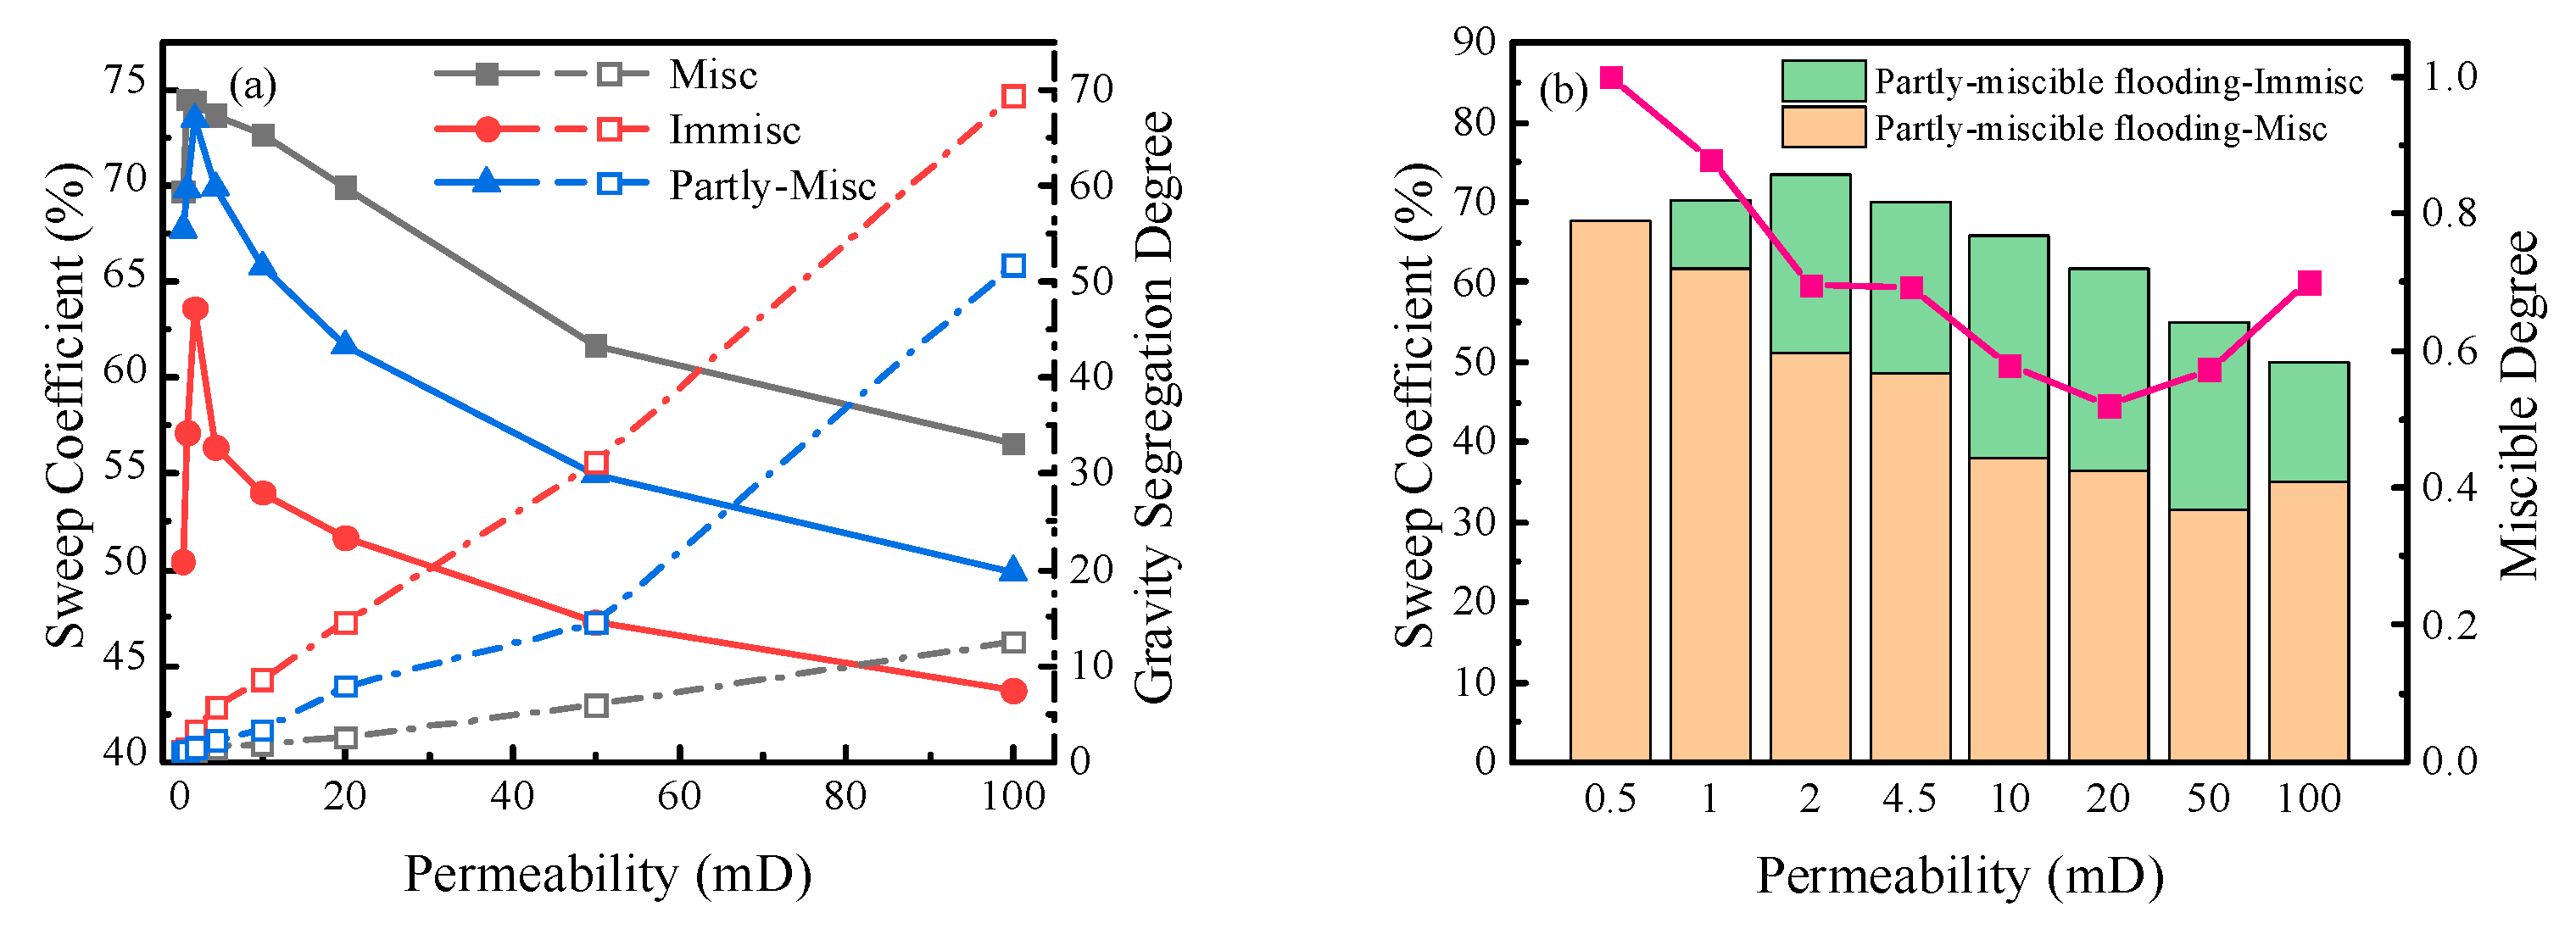
The relationships between permeability and sweep coefficients of miscible flooding, partly-miscible flooding, and immiscible flooding are compared in Figure 10a. The sweep coefficients of CO2 under the three flooding patterns increase first and then decrease with increased permeability. However, the sweep coefficient of miscible flooding is higher than that of partly-miscible and immiscible flooding. When the permeability is low, the sweep coefficients of the three displacement patterns are low due to the high seepage resistance in the reservoir, which is the main controlling factor affecting the sweep coefficient. When the permeability increases to 2 mD, the sweep coefficient gradually increases due to decreased seepage resistance. The sweep coefficient of miscible flooding reaches 74.46 %, while the partly-miscible and immiscible flooding are 73.50 % and 63.62 %, respectively. When the permeability further increases, the sweep coefficients of the three displacement patterns gradually decrease. This is because the viscosity and density of CO2 are lower than that of crude oil, and it is easy to produce gravity overlap in the reservoir with low seepage resistance, move to the top of the reservoir, and produce the crude oil in the top layer. The gravity segregation degrees (GSD values) of the three displacement patterns are analyzed, and the results are shown in Figure 10a. The GSD values of the three displacement patterns increase with increased permeability. When the permeability reaches 100mD, the GSD values of miscible, immiscible, and partly-miscible flooding are 12.47,69.44 and 51.75, respectively. The gravity segregation degree of miscible flooding is the lowest, followed by partly-miscible flooding, and immiscible flooding is the highest. This is because the miscible effect makes CO2 continuously enriched in the displacement process, and its density and viscosity are gradually similar to those of crude oil, so gravity segregation is significantly weakened. Figure 10b shows the variation of sweep coefficient and miscible degree of partly-miscible flooding with permeability. When the permeability is 0.5mD, due to the large seepage resistance and high gas injection pressure, the overall pressure of the reservoir is increased so that CO2 displaces crude oil in the form of miscible flooding, and the miscible degree (Dm value) is 1.0. With the increase of permeability, the seepage resistance decreases, and CO2 flooding begins to show the characteristics of partly-miscible flooding, where both miscible and immiscible zones can be observed. When the permeability increases to 20mD, the Dm value decreases to 0.52. This is mainly because the increase of permeability leads to the enhancement of overlap, and CO2 is easy to channel along the top of the reservoir, resulting in the continuous decrease of formation pressure, thus reducing the miscible degree. When the permeability increases to 100mD, the miscibility rises to 0.70. The increased permeability reduces the seepage resistance, and the migration velocity of the immiscible front is accelerated. After gas channeling, the sweeping volume of the immiscible zone decreases due to the weak ability of the immiscible zone to sweep oil in both sides of the main streamline, while the miscible front continues to move and displace the oil on both sides, thus increasing the miscible degree.
2.
Porosity
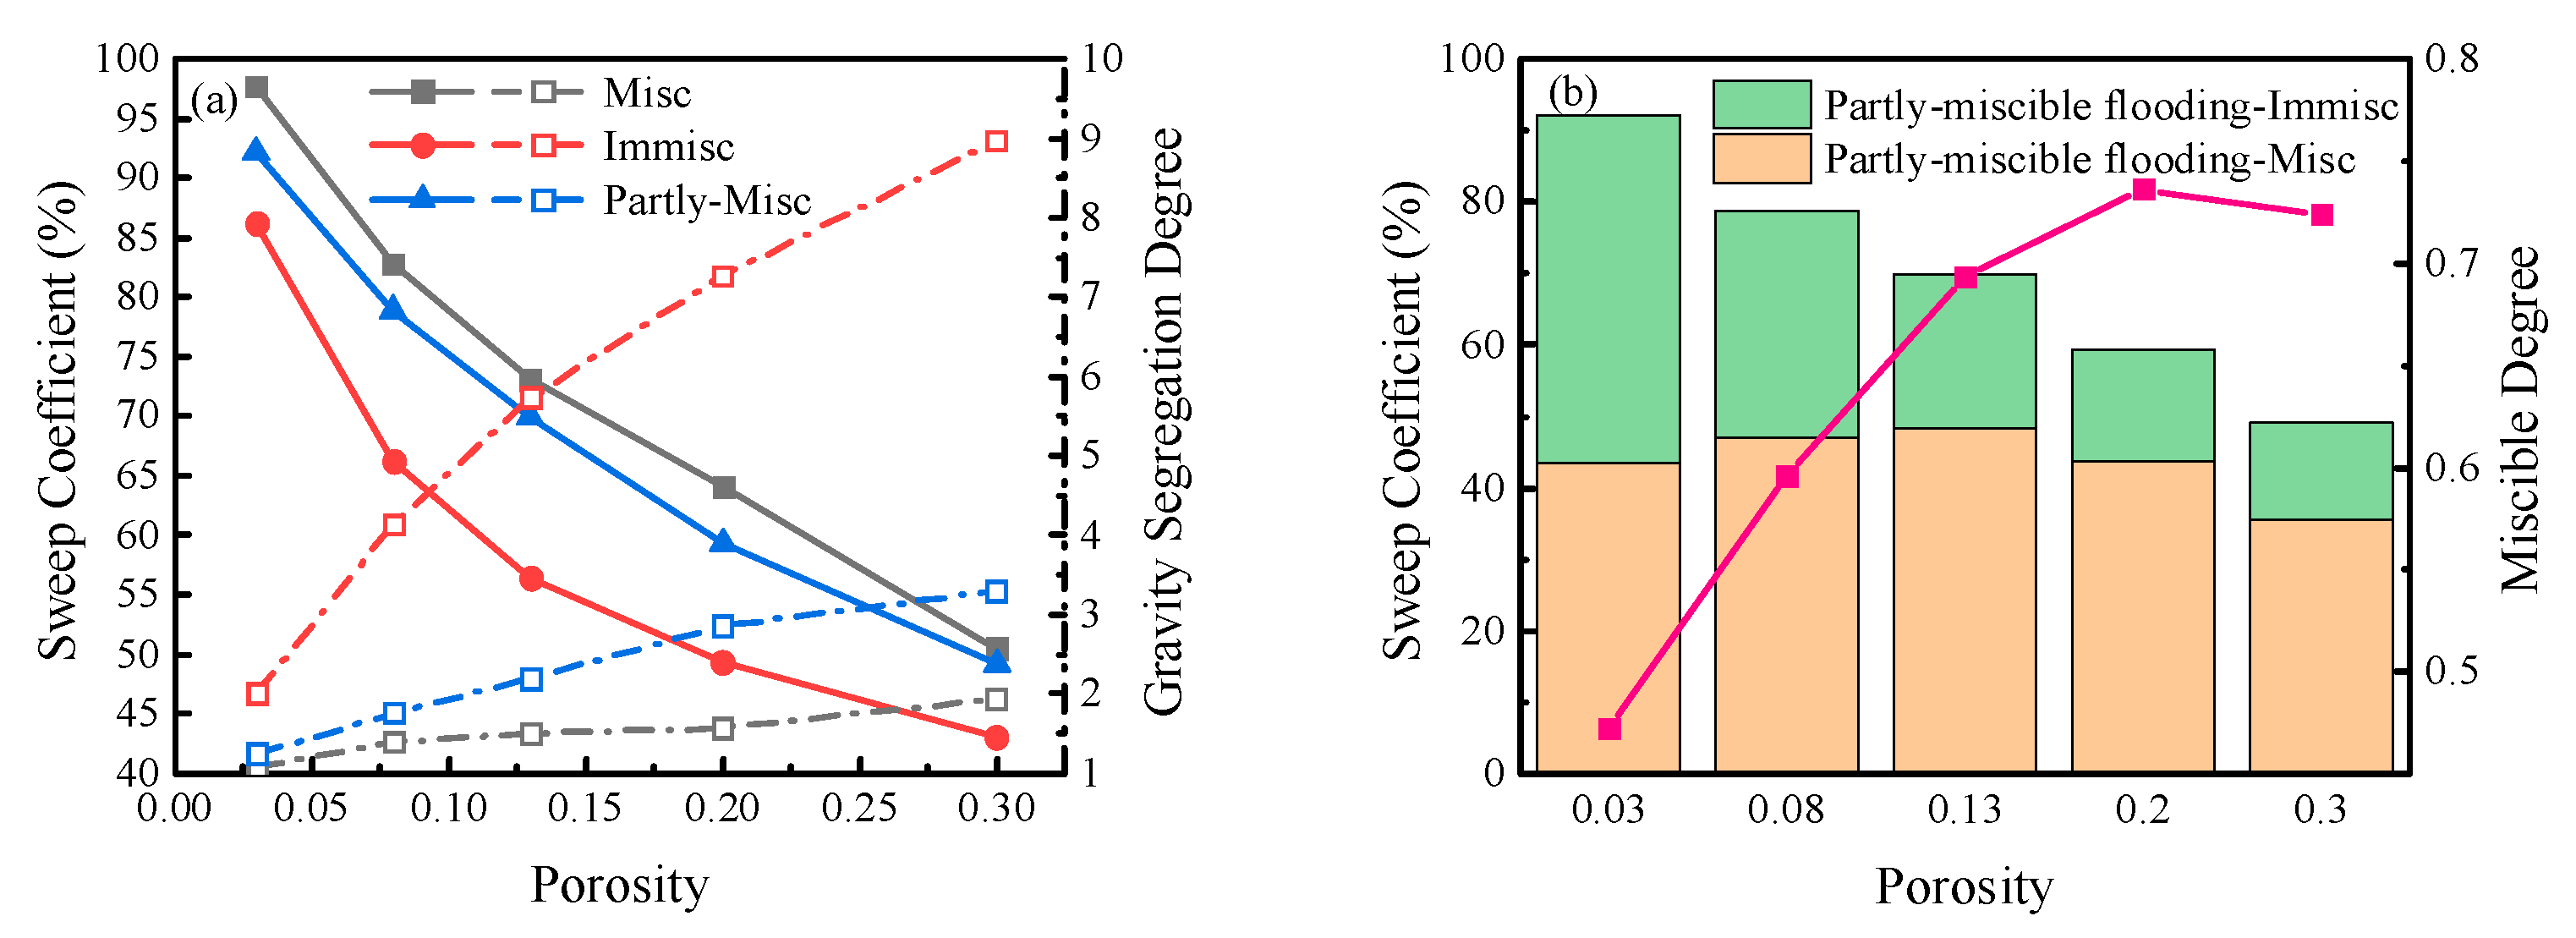
The relationship between porosity and sweep coefficient under three displacement patterns is compared, and the results are shown in Figure 11a. With the increase of porosity, the sweep coefficients of the three displacement patterns decrease gradually, and the sweep coefficients of miscible flooding and partly-miscible flooding are higher than those of immiscible flooding. When the porosity is 0.03, the sweep coefficients of miscible, immiscible, and partly-miscible flooding are 97.70 %, 86.20 %, and 92.13 %, respectively. When the porosity increases to 0.3, the sweep coefficients of the three displacement patterns decrease to 50.46 %, 42.98 %, and 49.15 %, respectively. Porosity affects the sweep coefficient mainly attributed to the gravity segregation degree. It can be seen from Figure 10a that the GSD values of the three displacement patterns increase with the increase of porosity, and the GSD value of immiscible flooding is always greater than those of miscible flooding and partly-miscible flooding. When the porosity is 0.3, the GSD value of immiscible flooding is 8.97, while the GSD values of miscible and partly-miscible flooding are 1.93 and 13.57, respectively. The sweep coefficient and miscible degree of partly-miscible flooding are analyzed, and the results are shown in Figure 11b. With the increase of porosity, the sweep coefficient of the immiscible zone of partly-miscible flooding decreases significantly, but the sweep coefficient of miscible zone increases slightly and then decreases slowly, and the sweep coefficient of miscible zone decreases from 43.52 % to 35.58 %. The miscible degree rises from 0.47 to 0.72. On the one hand, the increase in porosity accelerates the movement of the immiscible front and miscible front to production wells, but the moving velocity of the miscible front is slower. On the other hand, it is beneficial to the multi-contact miscibility in the movement of the miscible front, thus enhancing the miscible degree.
3.
Reservoir thickness
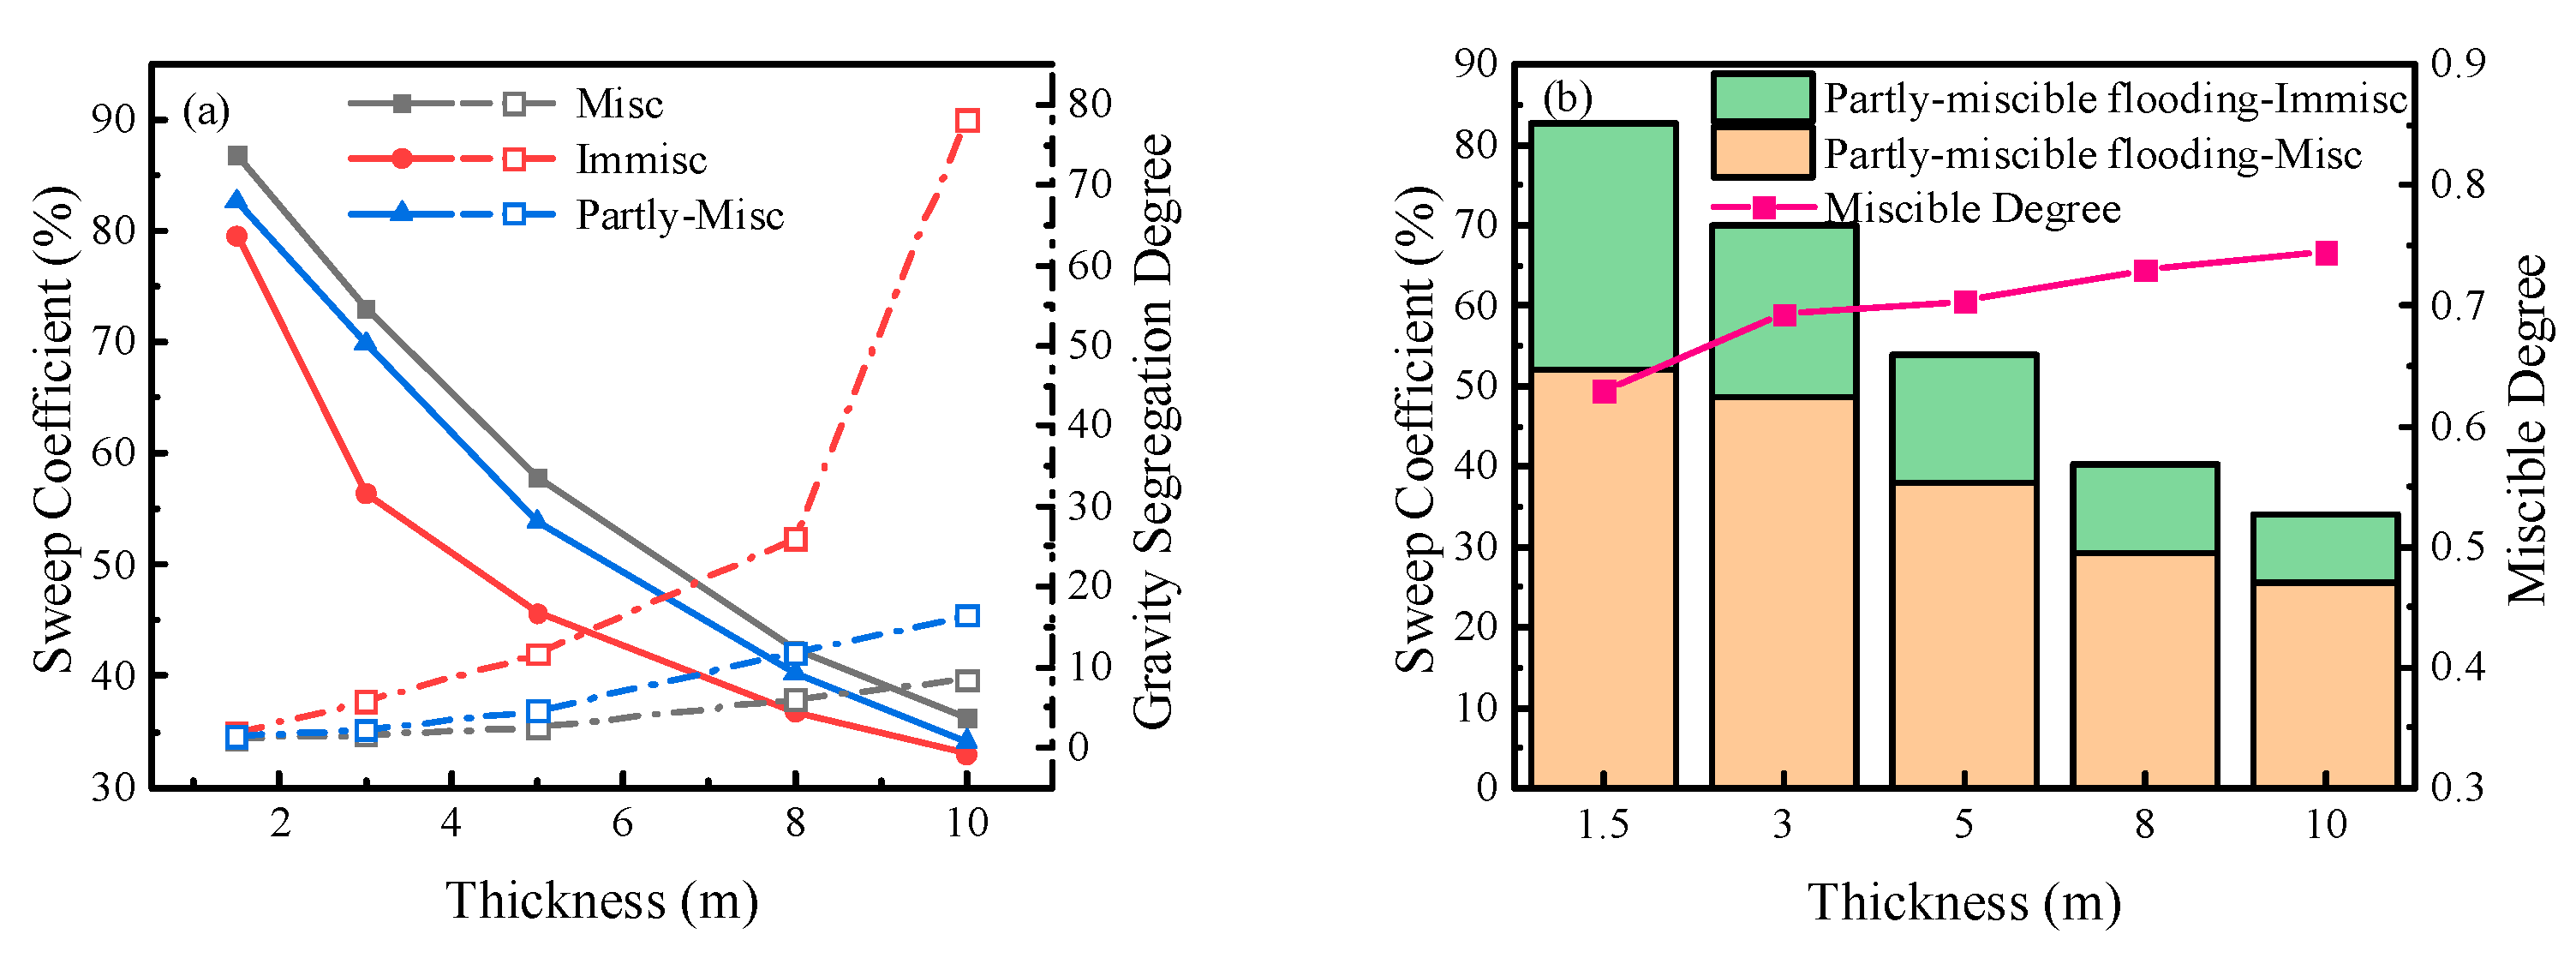
The influence of reservoir thickness on CO2 sweep coefficients of miscible flooding, partly-miscible flooding, and immiscible flooding is studied by changing the reservoir thickness from 1.5m to 10.0m. The results are shown in Figure 12a. The sweep coefficients of CO2 in the three displacement patterns decrease with the increase of reservoir thickness. When the reservoir thickness is 1.5m, the sweep coefficients of miscible, partly-miscible, and immiscible flooding are 86.85 %, 82.75 %, and 79.65 %, respectively. When the reservoir thickness increases to 10.0 m, the sweep coefficients of the three displacement patterns decrease to 36.19 %, 34.18 %, and 33.01 %, respectively. Besides, the GSD values of the three displacement patterns are 1.1~1.3, with a reservoir thickness of 1.5 m. When the reservoir thickness increases to 10.0 m, the GSD values of miscible flooding, partly-miscible flooding, and immiscible flooding increase to 8.4,16.4 and 78.1, respectively. Reservoir thickness has the most significant influence on immiscible flooding. Therefore, the variation of gravity segregation degree caused by the change in reservoir thickness is the critical factor affecting the sweep coefficient. The sweep coefficient and miscible degree of partly-miscible flooding are analyzed, and the results are shown in Figure 12b. With the increase of reservoir thickness, the sweep coefficients of miscible and immiscible zones of partly-miscible flooding decrease gradually, but the miscible degree increases slightly from 0.62 to 0.74. This is mainly because the effect of gravity segregation degree on the immiscible zone is stronger than that on the miscible zone. The increase in reservoir thickness makes the immiscible and miscible fronts move to the production well on the horizon and expand vertically simultaneously. The movement of the immiscible front is faster than that of the miscible front, so the immiscible zone quickly breaks through to the production well in the high part of the reservoir. The sweeping of the miscible zone is more uniform, which ultimately improves the miscible degree.
4.
Permeability Ratio
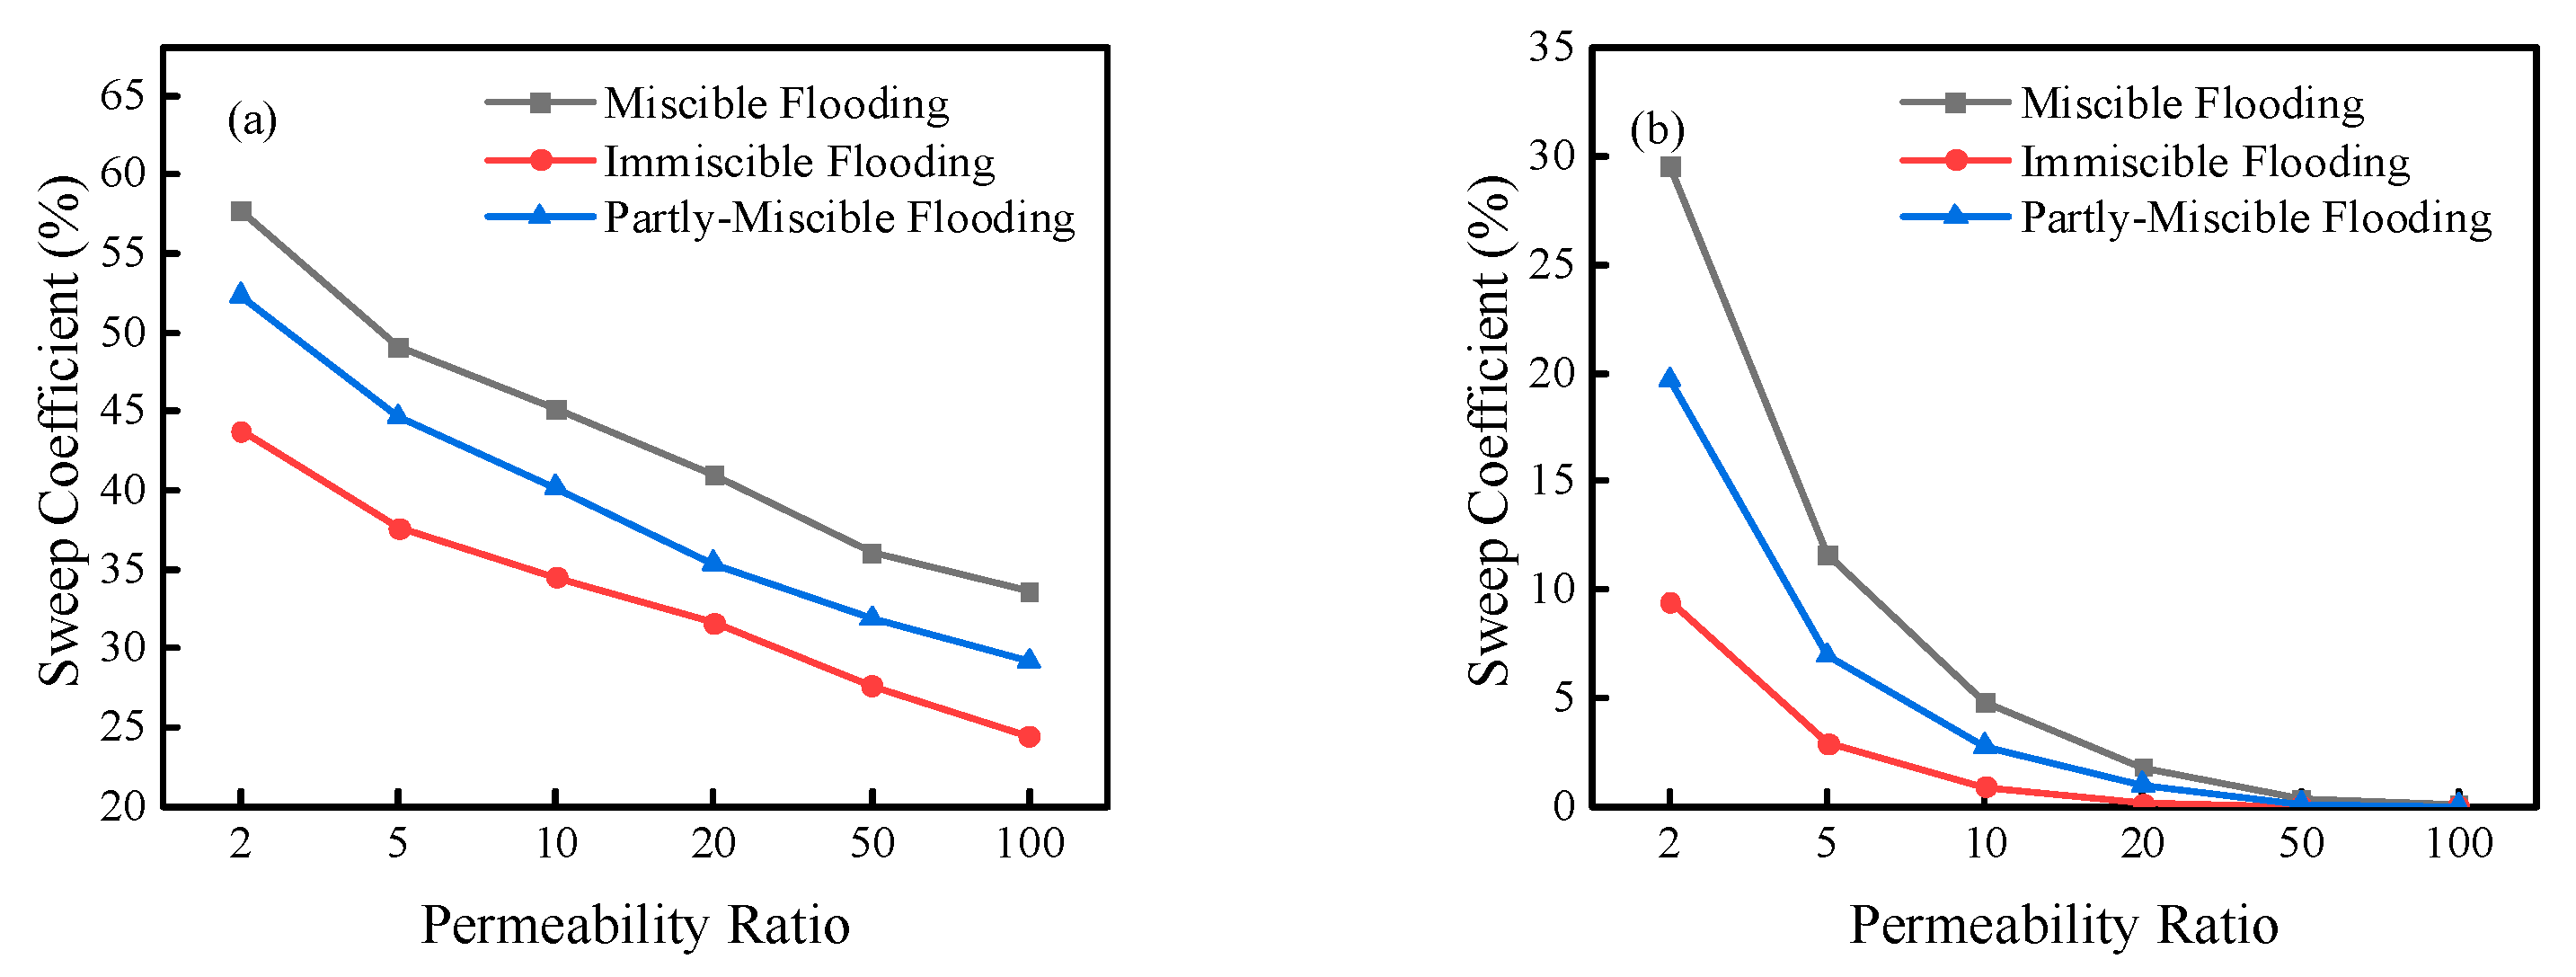
Two-layer heterogeneous models are established to study the influence of permeability ratio on sweep coefficients. The permeabilities of different layers change in an anti-rhythmic pattern, the ratio of which ranges from 2 to 100. The results are shown in Figure 13a,b. The sweep coefficients of the whole layers and low permeable zone decrease significantly under the three displacement patterns with the increased permeability ratio. When the permeability ratio is 10, the sweep coefficients of immiscible flooding is only 0.89 %. In comparison, the sweep coefficient of miscible and partial miscible flooding is 4.8 % and 2.8 %, respectively, lower than 5 %. The result indicates the influence of heterogeneity on miscible flooding, and partly-miscible flooding is weaker than immiscible flooding. Under different displacement patterns, the upper limit of the anti-rhythm reservoir permeability ratio suitable for applying CO2 flooding is about 5.0.

4.4.2. Injection-Production Parameters

  • Well spacing
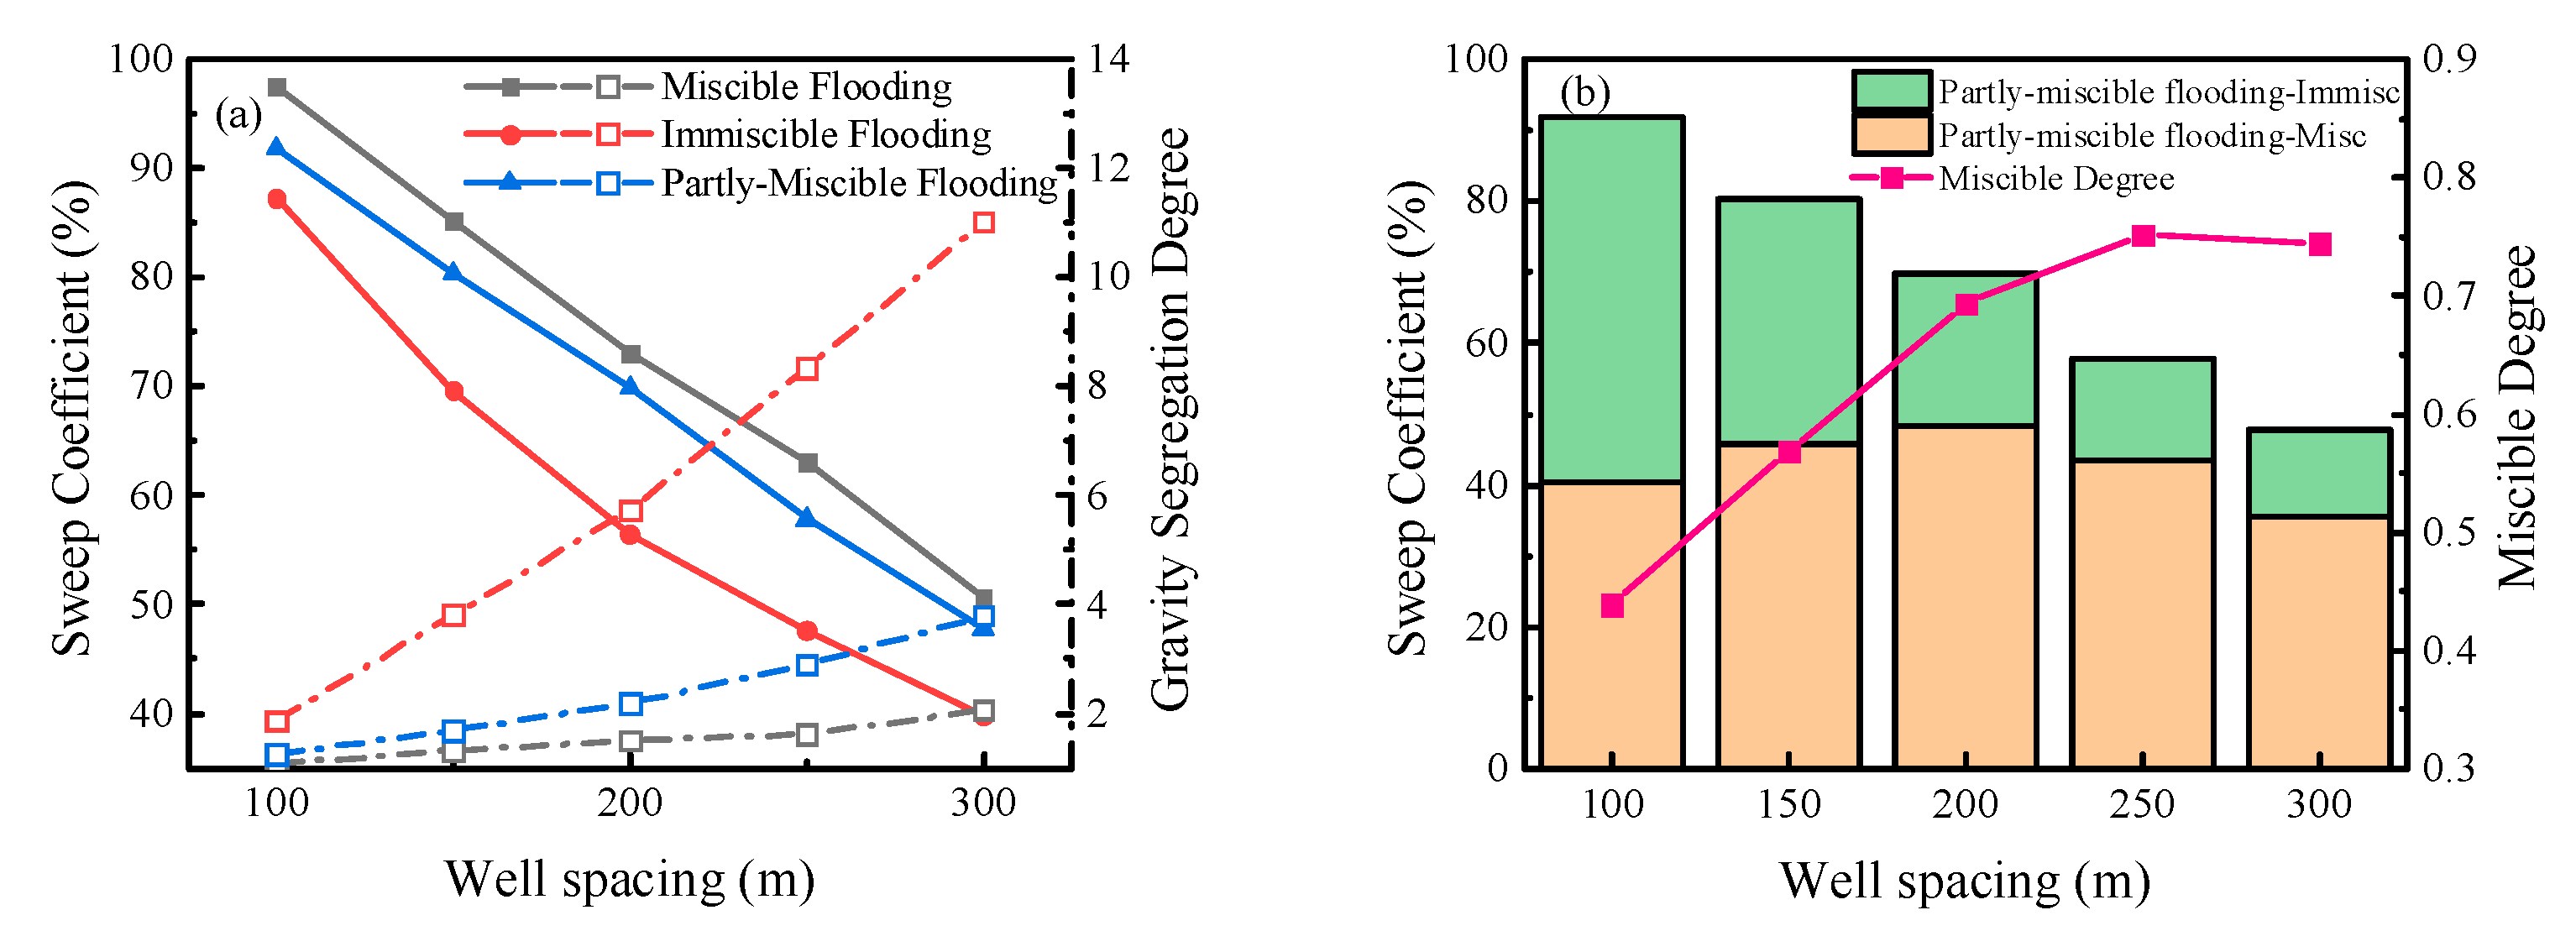
The influence of injection-production well spacing on CO2 sweep coefficients of miscible flooding, partly-miscible flooding, and immiscible flooding is studied with the well spacing variation range of 100~300m. The results are shown in Figure 14a. The sweep coefficients in the three displacement patterns decrease with the increase of well spacing. The increase of well spacing delays the movement velocity of miscible and immiscible fronts to production well in the horizontal direction. It significantly enhances the gravity overlap of CO2 in the vertical direction, so the sweep coefficients are reduced considerably. However, the reduction of the sweep coefficients of miscible and partly-miscible flooding is mainly dominated by the weakening of the front movement velocity in the horizontal direction, and the gravity segregation degree does not change. When the well spacing increases to 300 m, the GSD values of miscible and partly-miscible flooding increase from 1.0 and 1.2 to 2.1 and 3.6, respectively. The decrease in the sweep coefficient of immiscible flooding is mainly affected by gravity overlap, and the GSD value increases from 1.8 to 11.0. Figure 14b shows the influence of well spacing on the sweep coefficient and miscible degree of partly-miscible flooding. Although the increase in well spacing reduces the total sweep coefficient of partly-miscible flooding, the sweep coefficient of the miscible zone increases first and then decreases, and the miscible degree rises from 0.44 to 0.74. This is attributed to the delay in the miscible front move through the production well. The effect of miscible flooding can be exploited adequately. When the well spacing is further increased, the gravity overlap of the miscible front is gradually enhanced, moving to the top of the reservoir and breaking through to the production well so that crude oil in the bottom of the reservoir cannot be effectively displaced. When the well spacing is 200 m, it can not only ensure a higher sweep coefficient and miscible degree but also maximize the sweep coefficient of the miscible zone, giving full play to the role of miscible flooding.
2.
Gas injection rate
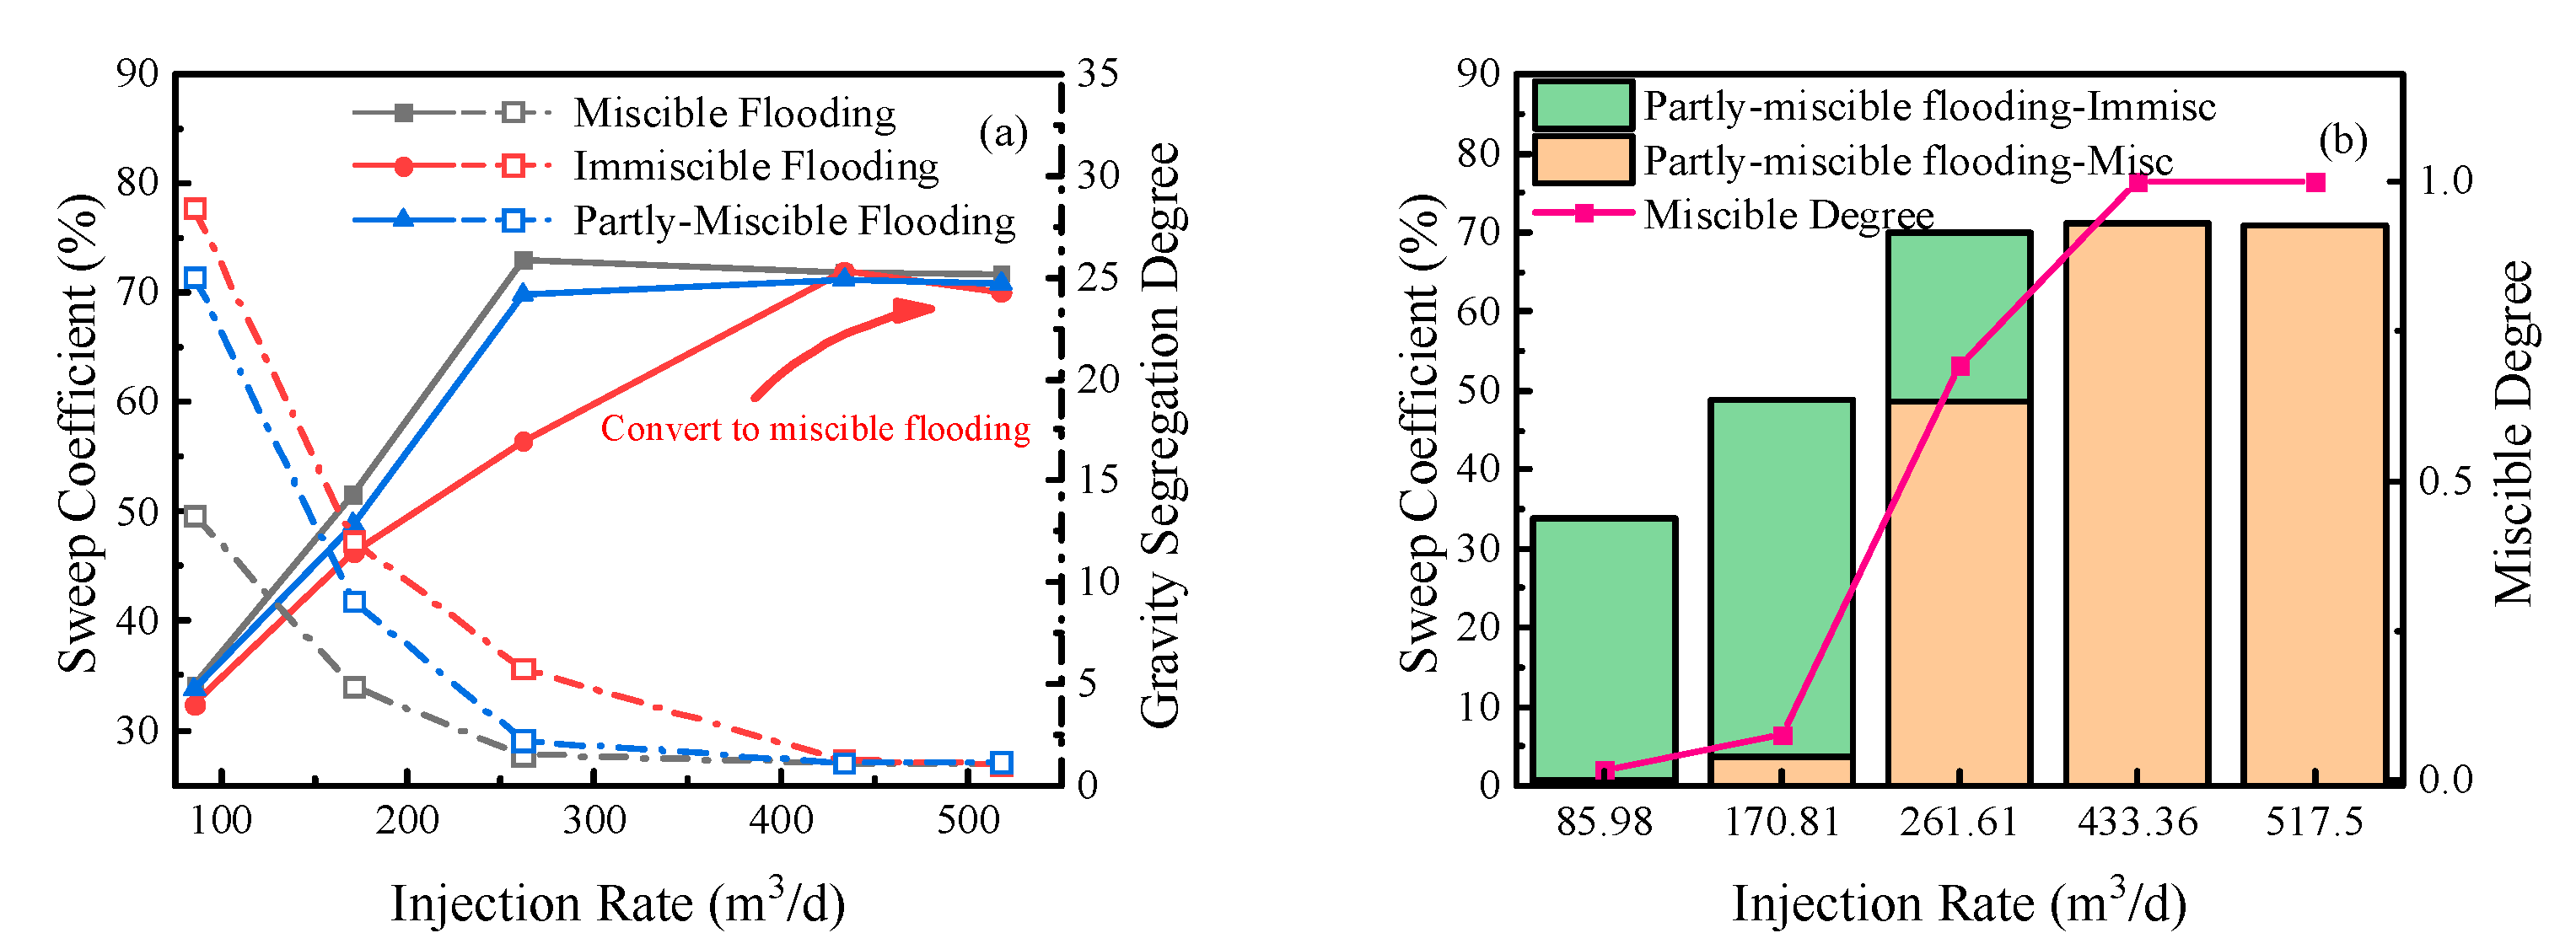
The influence of gas injection rate on sweep coefficients of the three CO2 flooding patterns is studied with the gas injection rate variation range of 85.98~517.5m3/d. The results are shown in Figure 15a. The sweep coefficients of CO2 in the three CO2 flooding patterns increase significantly first and then decrease slightly with the gas injection rate increase. When the gas injection rate reaches 517.5 m3/d, the sweep coefficients of the three are about 70 %. The GSD values of the three displacement patterns are significantly weakened with the increase in gas injection rate. When the gas injection rate increases to 517.5 m3/d, the GSD values of the three displacement patterns are about 1.01-1.07, which can achieve uniform displacement of each layer. The gas injection rate has two effects on the increase of the CO2 sweep coefficient. On the one hand, the higher gas injection rate is beneficial to recover the reservoir energy, increasing the formation pressure to above the minimum miscible pressure, which makes partly-miscible flooding and immiscible flooding transition to miscible flooding. On the other hand, it promotes the seepage velocity of the miscible and immiscible fronts in the horizontal direction and inhibits vertical movement. However, the overhigh gas injection rate will accelerate gas channeling in production wells. Hence, the sweep coefficients of the three displacement patterns decrease slightly after an increased gas injection rate. Figure 15b shows the influence of gas injection rate on the sweep coefficient and miscible degree of partly-miscible flooding. When the gas injection rate is lower than 170.81 m3/d, the sweep coefficient of the miscible zone and miscible degree are almost zero. When the gas injection rate exceeds 261.61 m3/d, the sweep coefficient of the miscible zone reaches 70 %, and the miscible degree increases from 0.69 to 1.0. The miscible degree and sweep coefficient can be enhanced by appropriately increasing the gas injection rate for partly-miscible and immiscible flooding.

4.4.3. Crude Oil Viscosity

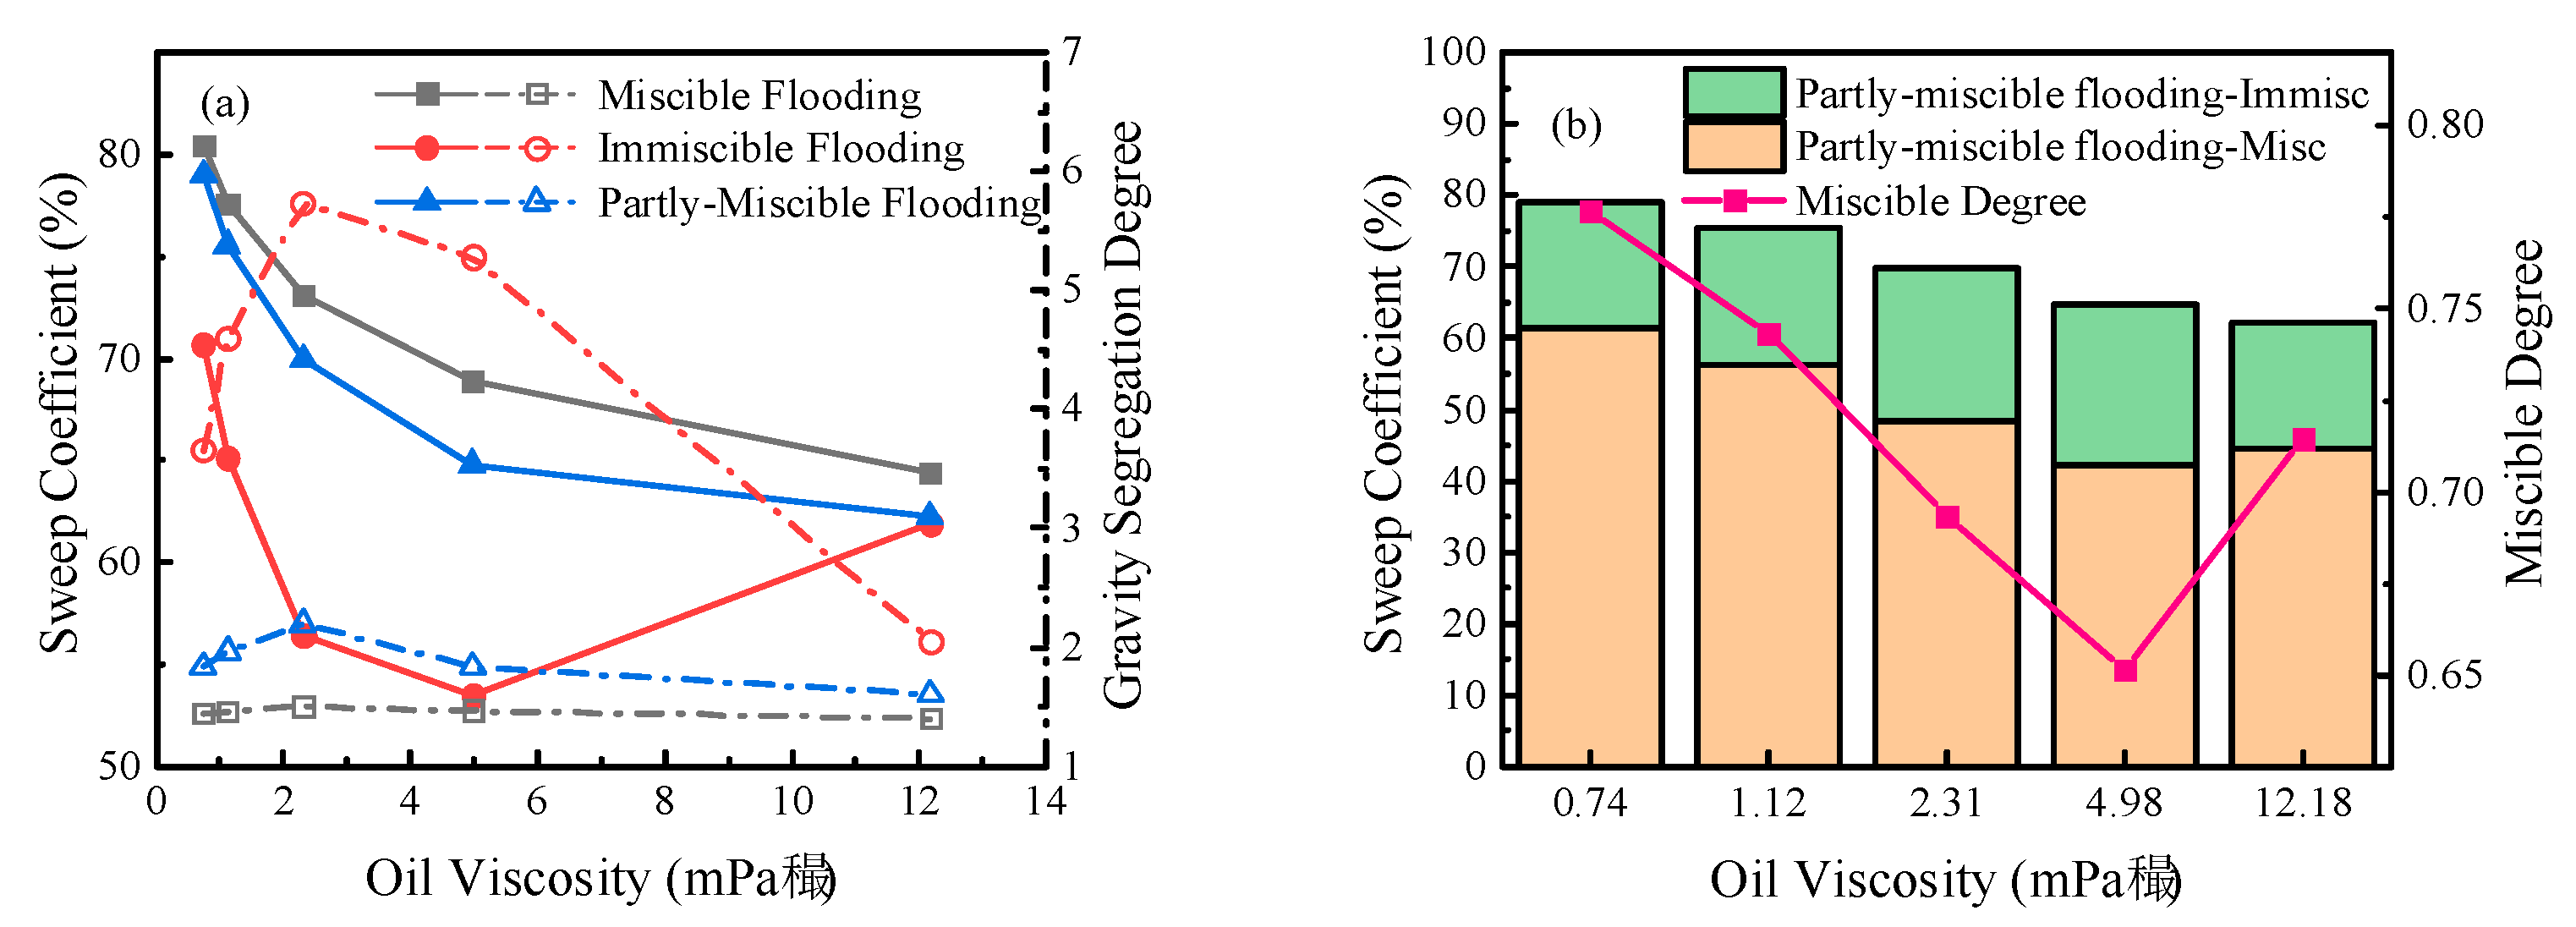
The influence of crude oil viscosity on sweep coefficients of the three CO2 flooding patterns is studied with the gas injection rate variation range of 0.74~12.18 mPa·s. The results are shown in Figure 16a. The sweep coefficients of miscible and partly-miscible flooding decrease with the increase of crude oil viscosity. When the viscosity of crude oil increases to 12.18 mPa·s, the sweep coefficients of miscible flooding and partly-miscible flooding decrease from 80.42 % and 78.98% to 64.42 % and 49.92 %, respectively. However, the gravity segregation degrees of miscible and partly-miscible flooding remain almost unchanged with the increase of crude oil viscosity, which are 1.40 and 1.60, respectively. Therefore, the decreases in sweep coefficients of miscible flooding and partly-miscible flooding are mainly due to the high seepage resistance caused by the increase of crude oil viscosity, and the influence of gravity overlap on the sweep coefficient is relatively small. The sweep coefficient of immiscible flooding decreases first and then increases with the increase of crude oil viscosity, and the GSD value rises first and then decreases. When the viscosity of crude oil is 4.98 mPa·s, the sweep coefficient of immiscible flooding reaches the minimum value of 53 %, and the GSD value increases to 5.27. When the viscosity of crude oil rises to 12.18 mPa·s, the sweep coefficient of immiscible flooding increases to 61.89 %, and the GSD value decreases to 2.05. The change of sweep coefficient of immiscible flooding has an excellent corresponding relationship with the variation of gravity segregation degree. The influence of crude oil viscosity on the sweep coefficient and miscible degree of partly-miscible flooding is shown in Figure 16b. The miscible degree of partly-miscible flooding decreases first and then increases with the increase of crude oil viscosity, and finally drops from 0.78 to 0.71. When the viscosity of crude oil increases by 12.18 mPa·s, the sweep coefficient of the miscible zone decreases from 61.34 % to 44.45 %. In contrast, the sweep coefficient of the immiscible zone first increases to 22.59 % and then drops to 17.76 %. The increase of crude oil viscosity makes the multi-contact miscibility between CO2 and crude oil more difficult, decreasing the sweep coefficient of the miscible zone. Besides, the increase of crude oil viscosity inhibits the horizontal movement of the immiscible zone and intensifies the vertical overlap, thus decreasing the miscible degree. However, the overhigh viscosity of crude oil strengthens the horizontal viscous fingering, making the immiscible zone break through the production well more easily along the horizontal direction.

4.5. Analysis of the Main Controlling Factors of CO2 Flooding Sweep Coefficient Based on the Random Forest Algorithm

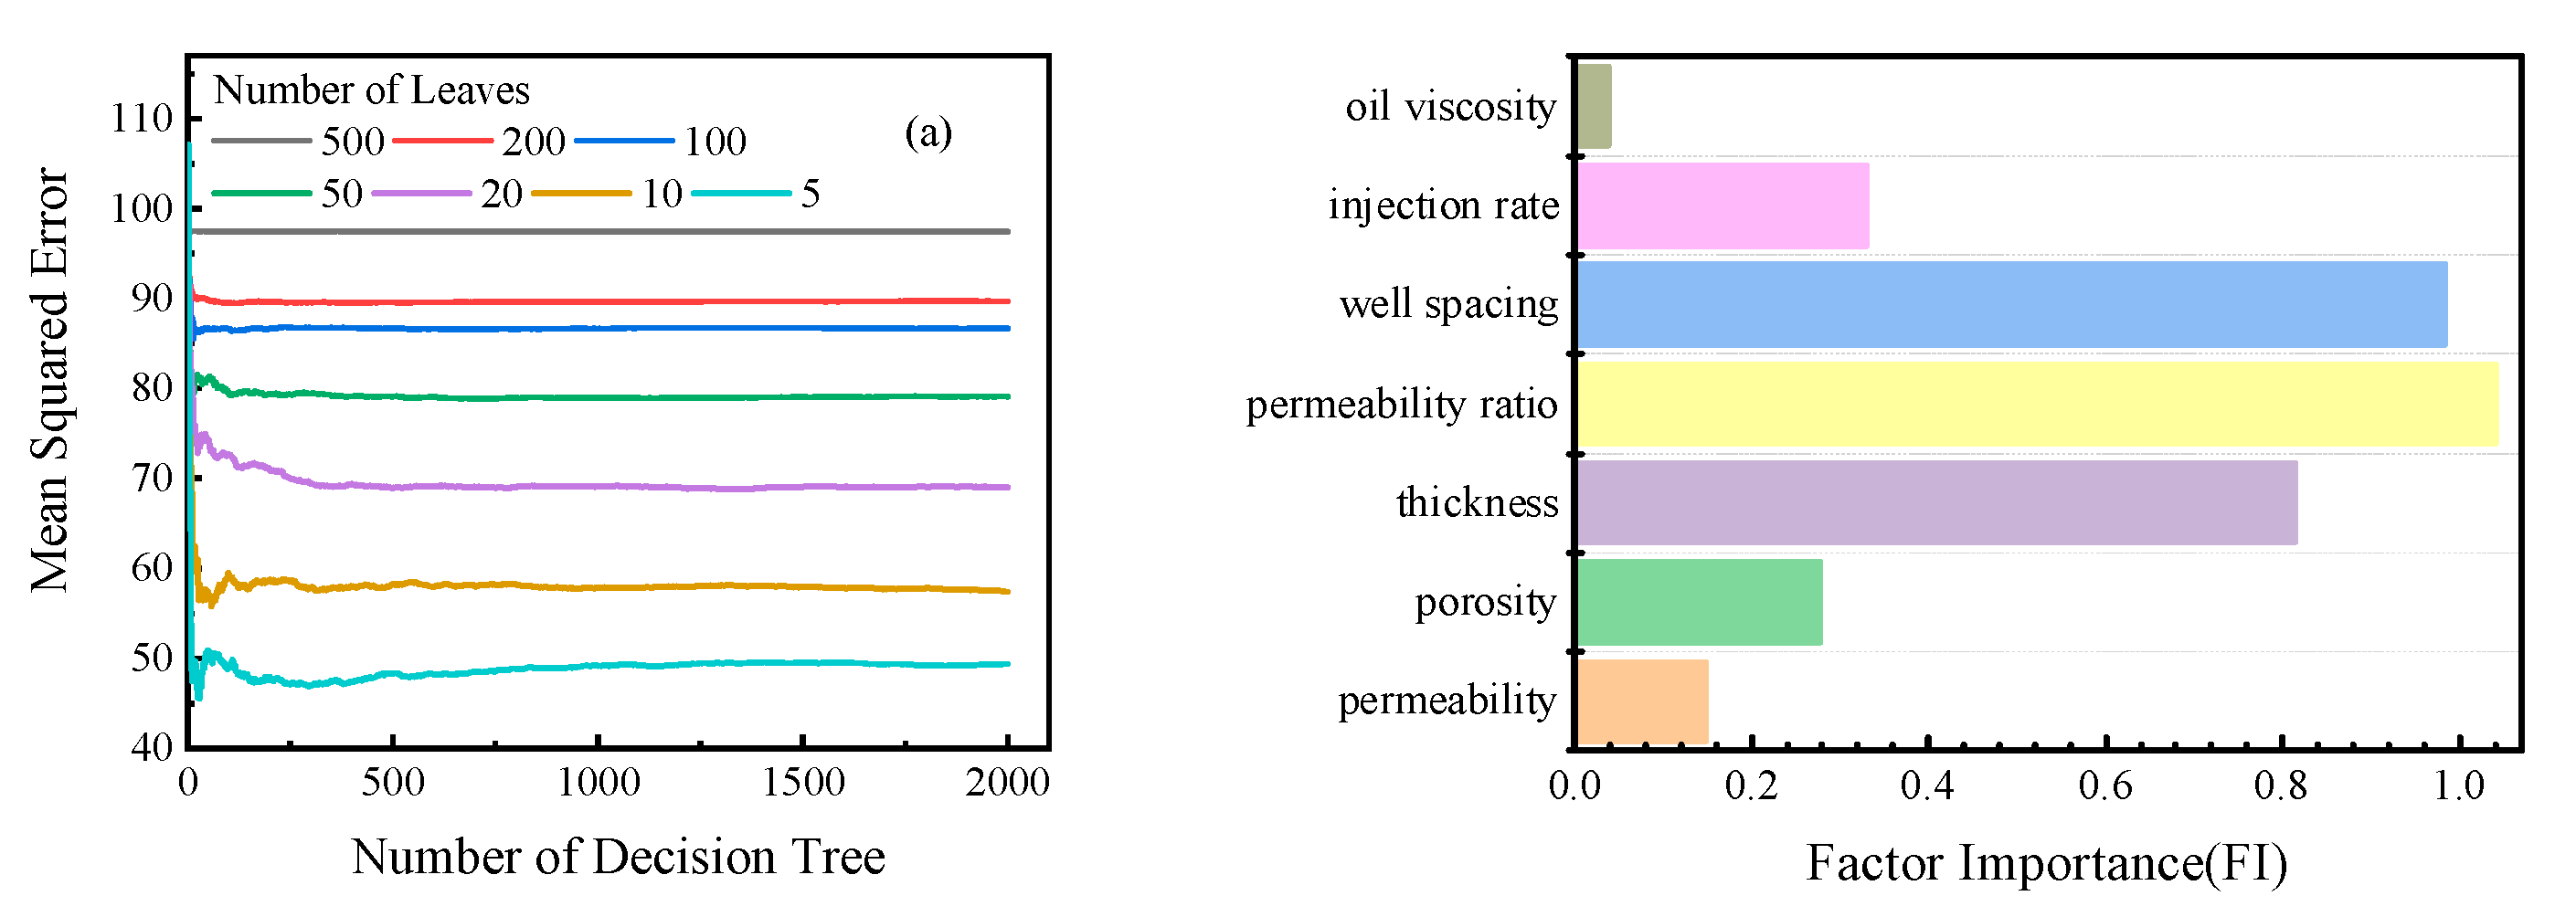
Based on the single factor analysis of the CO2 flooding sweep coefficient in Section 4.4, the parameter variation ranges of different influencing factors are set, and 1000 sets of CO2 flooding numerical simulation models are formed by Latin hypercube design. The Bootstrap sampling method is used to create 800 training sets and 200 testing sets. The random forest model is established by constructing multiple decision trees using the 800 training sets. The testing sets are predicted, and the voting method determines the prediction results. The number of decision trees and the number of leaves in the random forest model are optimized to obtain the optimal model parameters. The optimized Random Forest model is used to calculate the decrease rate MDA of the prediction accuracy before and after the replacement of the out-of-bag data of a certain influencing factor (such as porosity, permeability, etc.), which is used as a parameter to evaluate the importance degree (FI) of the influencing factor. The larger the FI value, the greater the influence of the factors on the sweep coefficient. The parameter optimization results of random forest are shown in Figure 17a. Under the same number of leaves, the mean square error MSE of the prediction results decreases rapidly with the increase in the number of decision trees. However, when the number of decision trees increases to 500, MSE almost does not change. Increasing the number of decision trees will lead to overfitting the model, so the optimal number of decision trees is 500. In addition, under the same number of decision trees, MSE increases with the increase in the number of leaves. Thereby, the optimal number of leaf nodes is 5. The importance degree of the influencing factors of the CO2 flooding sweep coefficient is shown in Figure 17b. The factors affecting the sweep coefficient of CO2 flooding are ranked in order of importance degree (FI) as follows: Permeability ratio, well spacing, reservoir thickness, gas injection rate, porosity, permeability, and crude oil viscosity. The main controlling factor affecting the sweep coefficients of CO2 flooding is the permeability ratio, the importance degree (FI) of which reaches 1.04. In the field application of CO2 flooding, attention should be paid to the problem that the low permeability layer caused by the high permeability ratio cannot be effectively utilized and the gravity overlap problem of CO2 flooding in thick reservoirs.

5. Conclusions

Based on the fitting results of the PVT and slim tube experiments in the Jilin Oilfield, the 1-D and 2-D reservoir numerical simulation models of CO2 flooding are developed to analyze the movement rules of CO2 front in miscible, partly-miscible, and immiscible flooding, along with the influence of different factors on the sweep coefficient. The main controlling factors affecting the sweep coefficient of CO2 flooding are determined using the out-of-bag data replacement method based on the Random Forest algorithm. The results show that the miscible front is located at the point of maximum CO2 content in the oil phase, and the immiscible front is located at the point of maximum interfacial tension near the production well. The movement speed of the immiscible front is faster than that of the miscible front, so gas channeling is more likely to occur in immiscible flooding. Comparatively, miscible and partly-miscible flooding yield higher sweep coefficients than immiscible flooding, underscoring the advantageous effect of miscibility in achieving uniform CO2 sweeping within the reservoir. Regarding geological factors, the increases in porosity, permeability, and reservoir thickness intensify the gravity overlap effect and reduce the sweep coefficients of CO2 under the three displacement patterns. The increase in permeability ratio also notably reduces the sweep coefficient, albeit to a lesser extent in miscible and partly-miscible flooding when compared to immiscible flooding. The upper limit of the reservoir permeability ratio suitable for applying CO2 flooding under different displacement patterns is about 5. In the aspect of injection-production parameters, the increase in well spacing amplifies seepage resistance in the horizontal direction, leading to reduced sweep coefficients in miscible and partly-miscible flooding. In immiscible flooding, the reduction in sweep coefficients is predominantly attributed to gravity overlap. Elevating the gas injection rate enhances the miscibility degree in partly-miscible flooding and immiscible flooding while inhabiting the gravity overlap, thus enhancing the sweep coefficient of CO2 flooding. Crude oil viscosity primarily governs the sweep coefficients in miscible and partly-miscible flooding by elevating seepage resistance, whereas in immiscible flooding, gravity overlap takes precedence in determining the sweep coefficient. The main controlling factor affecting the sweep coefficient of CO2 flooding is the permeability difference, and the factor importance FI reaches 1.04. In the field application of CO2 flooding, attention should be paid to the problem of ineffective displacement in low permeable zones in heterogeneous reservoirs.

Author Contributions

Conceptualization, X.Q. and T.Z.; methodology, X.Q.; software, X.Q.; validation, W.L., Y.S. and M.D.; formal analysis, W.L.; investigation, Z.L.; resources, X.Q.; data curation, X.Q., M.W.; writing—original draft preparation, X.Q.; writing—review and editing, W.L.; visualization, D.H.; supervision, D.H.; project administration, D.H.; funding acquisition, W.L.

Funding

Please add: This research is funded by the Major Science and Technology Project of the CNPC, grant number 2021ZZ01-03.

Data Availability Statement

The raw/processed data required to reproduce these findings cannot be shared at this time, as the data also forms part of an ongoing study.

Acknowledgments

The authors are grateful for the financial support of the CNPC in China.

Conflicts of Interest

The authors declare no conflict of interest.

References

  1. Yue, P.; Zhang, R.; Sheng, J. J.; Yu, G.; Liu, F. Study on the Influential Factors of CO2 Storage in Low Permeability Reservoir. Energies 2022, 15(1), 344. [Google Scholar] [CrossRef]
  2. Tsopela, A.; Bere, A.; Dutko, M.; Kato, J.; Niranjan, S. C.; Jennette, B. G.; Hsu, S. Y.; Dasari, G. R. CO2 injection and storage in porous rocks: coupled geomechanical yielding below failure threshold and permeability evolution. Petroleum Geoscience 2022, (1), 28. [Google Scholar] [CrossRef]
  3. Haeri, F.; Myshakin, E. M.; Sanguinito, S.; Moore, J.; Crandall, D.; Gorecki, C. D.; Goodman, A. L. , Simulated CO2 storage efficiency factors for saline formations of various lithologies and depositional environments using new experimental relative permeability data. International Journal of Greenhouse Gas Control 2022. [Google Scholar] [CrossRef]
  4. Wei, J. W., Anlun, Experimental and simulation investigations of carbon storage associated with CO2 EOR in low-permeability reservoir. International Journal of Greenhouse Gas Control 2021, 104, (1). [CrossRef]
  5. Li, L.; Su, Y.; Sheng, J. J.; Hao, Y.; Wang, W.; Lv, Y.; Zhao, Q.; Wang, H., Experimental and Numerical Study on CO2 Sweep Volume during CO2 Huff-n-Puff EOR Process in Shale Oil Reservoirs. Energy & Fuels 2019, 33, (MAY), 4017-4032. [CrossRef]
  6. Wang, X.; Gu, Y., Oil Recovery and Permeability Reduction of a Tight Sandstone Reservoir in Immiscible and Miscible CO2 Flooding Processes. Industrial & Engineering Chemistry Research 2011, 50, (4), 2388-2399. [CrossRef]
  7. Bikkina, P.; Wan, J.; Kim, Y.; Kneafsey, T. J.; Tokunaga, T. K. Influence of wettability and permeability heterogeneity on miscible CO2 flooding efficiency. Fuel 2016, 166(FEB.15), 219–226. [Google Scholar] [CrossRef]
  8. Zargar, G.; Bagheripour, P.; Asoodeh, M.; Gholami, A. Oil-CO2 minimum miscible pressure (MMP) determination using a stimulated smart approach. The Canadian Journal of Chemical Engineering 2015, 93(10), 1730–1735. [Google Scholar] [CrossRef]
  9. Han, L.; Gu, Y., Optimization of Miscible CO2 Water-Alternating-Gas Injection in the Bakken Formation. Energy & Fuels 2014, 28, (nov.-dec.), 6811-6819. [CrossRef]
  10. Li, L.; Zhou, X.; Su, Y.; Xiao, P.; Chen, Z.; Zheng, J., Influence of Heterogeneity and Fracture Conductivity on Supercritical CO2 Miscible Flooding Enhancing Oil Recovery and Gas Channeling in Tight Oil Reservoirs. Energy & Fuels 2022. [CrossRef]
  11. Guo, Y.; Liu, F.; Qiu, J.; Xu, Z.; Bao, B. Microscopic transport and phase behaviors of CO2 injection in heterogeneous formations using microfluidics. Energy 2022, 256. [Google Scholar] [CrossRef]
  12. Alhosani, A.; Lin, Q.; Scanziani, A.; Andrews, E.; Blunt, M. J. Pore-scale characterization of carbon dioxide storage at immiscible and near-miscible conditions in altered-wettability reservoir rocks. International Journal of Greenhouse Gas Control 2021, 105, 103232. [Google Scholar] [CrossRef]
  13. Zhao, X.; Liao, X., Evaluation Method of CO2 Sequestration and Enhanced Oil Recovery in an Oil Reservoir, as Applied to the Changqing Oilfields, China. Energy & Fuels 2012, 26, (8), 5350–5354. [CrossRef]
  14. Xiaolong, C.; Yiqiang, L.; Xiang, T.; Huan, Q.; Xuebing, S.; Jianghao, L. Effect of gravity segregation on CO2 flooding under various pressure conditions: Application to CO2 sequestration and oil production. Energy 2021, 226. [Google Scholar] [CrossRef]
  15. Al Hinai, N. M.; Saeedi, A.; Wood, C. D.; Myers, M.; Valdez, R.; Sooud, A. K.; Sari, A., Experimental Evaluations of Polymeric Solubility and Thickeners for Supercritical CO2 at High Temperatures for Enhanced Oil Recovery. Energy & Fuels 2018, 32, (2), 1600-1611. [CrossRef]
  16. Sun, X.; Long, Y.; Bai, B.; Wei, M.; Suresh, S., Evaluation and Plugging Performance of Carbon Dioxide-Resistant Particle Gels for Conformance Control. SPE Journal 2020, (04). [CrossRef]
  17. Li, Z.; Su, Y.; Li, L.; Hao, Y.; Wang, W.; Meng, Y.; Zhao, A. Evaluation of CO2 storage of water alternating gas flooding using experimental and numerical simulation methods. Fuel 2022, 311, 122489. [Google Scholar] [CrossRef]
  18. Alsumaiti, A. M.; Hashmet, M. R.; Alameri, W. S.; Antodarkwah, E., Laboratory Study of CO2 Foam Flooding in High Temperature, High Salinity Carbonate Reservoirs Using Co-injection Technique. 2018. [CrossRef]
  19. Song, Y.; Yang, W.; Wang, D.; Yang, M.; Jiang, L.; Liu, Y.; Zhao, Y.; Dou, B.; Wang, Z. Magnetic resonance imaging analysis on the in-situ mixing zone of CO2 miscible displacement flows in porous media. Journal of Applied Physics 2014, 115(24), 401–410. [Google Scholar] [CrossRef]
  20. Wang, H.; Tian, L.; Chai, X.; Wang, J.; Zhang, K. Effect of pore structure on recovery of CO2 miscible flooding efficiency in low permeability reservoirs. Journal of Petroleum Science and Engineering 2021. [Google Scholar] [CrossRef]
  21. Chen, M.; Cheng, L.; Cao, R.; Lyu, C.; Rao, X., Carbon dioxide transport in radial miscible flooding in consideration of rate-controlled adsorption. Arabian Journal of Geosciences 2020, 13, (1). [CrossRef]
  22. Coats, K. H.; Smith, B. D. Dead-End Pore Volume and Dispersion in Porous Media. Society of Petroleum Engineers Journal 1964, 4(1), 73–84. [Google Scholar] [CrossRef]
  23. Brattekås, B.; Haugen, M. , Explicit tracking of CO2-flow at the core scale using micro-Positron Emission Tomography (μPET). Journal of Natural Gas Science and Engineering 2020, 77, 103268. [Google Scholar] [CrossRef]
  24. Wang, S.; Jiang, L.; Cheng, Z.; Liu, Y.; Song, Y., Experimental study on the CO2-decane displacement front behavior in high permeability sand evaluated by magnetic resonance imaging. Energy 2021, 217, (119433). [CrossRef]
  25. Duraid, A. B.; Ali, S.; Quan, X.; Myers, M. B.; Cameron, W. Influence of Permeability Heterogeneity on Miscible CO2 Flooding Efficiency in Sandstone Reservoirs: An Experimental Investigation. Transport in Porous Media 2018, 125, 341–356. [Google Scholar] [CrossRef]
  26. Lewis, E.; Dao, E.; Mohanty, K. K. Sweep coefficient of Miscible Floods in a High-Pressure Quarter Five-Spot Model. SPE Journal 2006. [Google Scholar] [CrossRef]
  27. Hao, Y.; Li, J.; Kong, C.; Guo, Y.; Lv, G.; Chen, Z.; Wei, X., Migration behavior of CO2-crude oil miscible zone. Petroleum Science and Technology 2021, 39, (21-22), 959-971. [CrossRef]
  28. Li, J.; Cui, C.; Wu, Z.; Wang, Z.; Wang, Z.; Yang, H. Study on the migration law of CO2 miscible flooding front and the quantitative identification and characterization of gas channeling. Journal of Petroleum Science and Engineering 2022, 218, 110970. [Google Scholar] [CrossRef]
  29. Li, N.; Tian, J.; Ren, Z. The research on spread rule of CO2 miscible region in low permeability reservoir. Well Testing 2014. [Google Scholar] [CrossRef]
  30. Al-Abri, A.; Sidiq, H.; Amin, R., Mobility ratio, relative permeability and sweep coefficient of supercritical CO2 and methane injection to enhance natural gas and condensate recovery: Coreflooding experimentation. Journal of Natural Gas Science & Engineering 2012, 9, (none), 166-171. [CrossRef]
  31. Perrin, J. C.; Benson, S. An Experimental Study on the Influence of Sub-Core Scale Heterogeneities on CO2 Distribution in Reservoir Rocks. Transport in Porous Media 2010, 82(1), 93–109. [Google Scholar] [CrossRef]
  32. Lu, Y.; Liu, R.; Wang, K.; Tang, Y.; Cao, Y., A study on the fuzzy evaluation system of carbon dioxide flooding technology. Energy Science & Engineering 2021. [CrossRef]
  33. Bai, S.; Song, K. P.; Yang, E. L., Optimization of water alternating gas injection parameters of CO2 flooding based on orthogonal experimental design. Special Oil & Gas Reservoirs 2011. [CrossRef]
  34. Chenglong, L., Gas Channeling Influencing Factors and Patterns of CO2-flooding in Ultra-Low Permeability Oil Reservoir. Special Oil & Gas Reservoirs 2018. [CrossRef]
  35. Cui, C.; Yan, D.; Yao, T.; Wang, J.; Zhang, C.; Wu, Z., Prediction method of migration law and gas channeling time of CO2 flooding front: A case study of Gao 89-1 Block in Shengli Oilfield. Petroleum Reservoir Evaluation and Development 2022, 12, (05), 741-747+763. [CrossRef]
  36. Sinha, U.; Dindoruk, B.; Soliman, M. Y. In Prediction of CO2 Minimum Miscibility Pressure MMP Using Machine Learning Techniques, SPE-Improved Oil Recovery Conference, 2020, 2020; 2020.
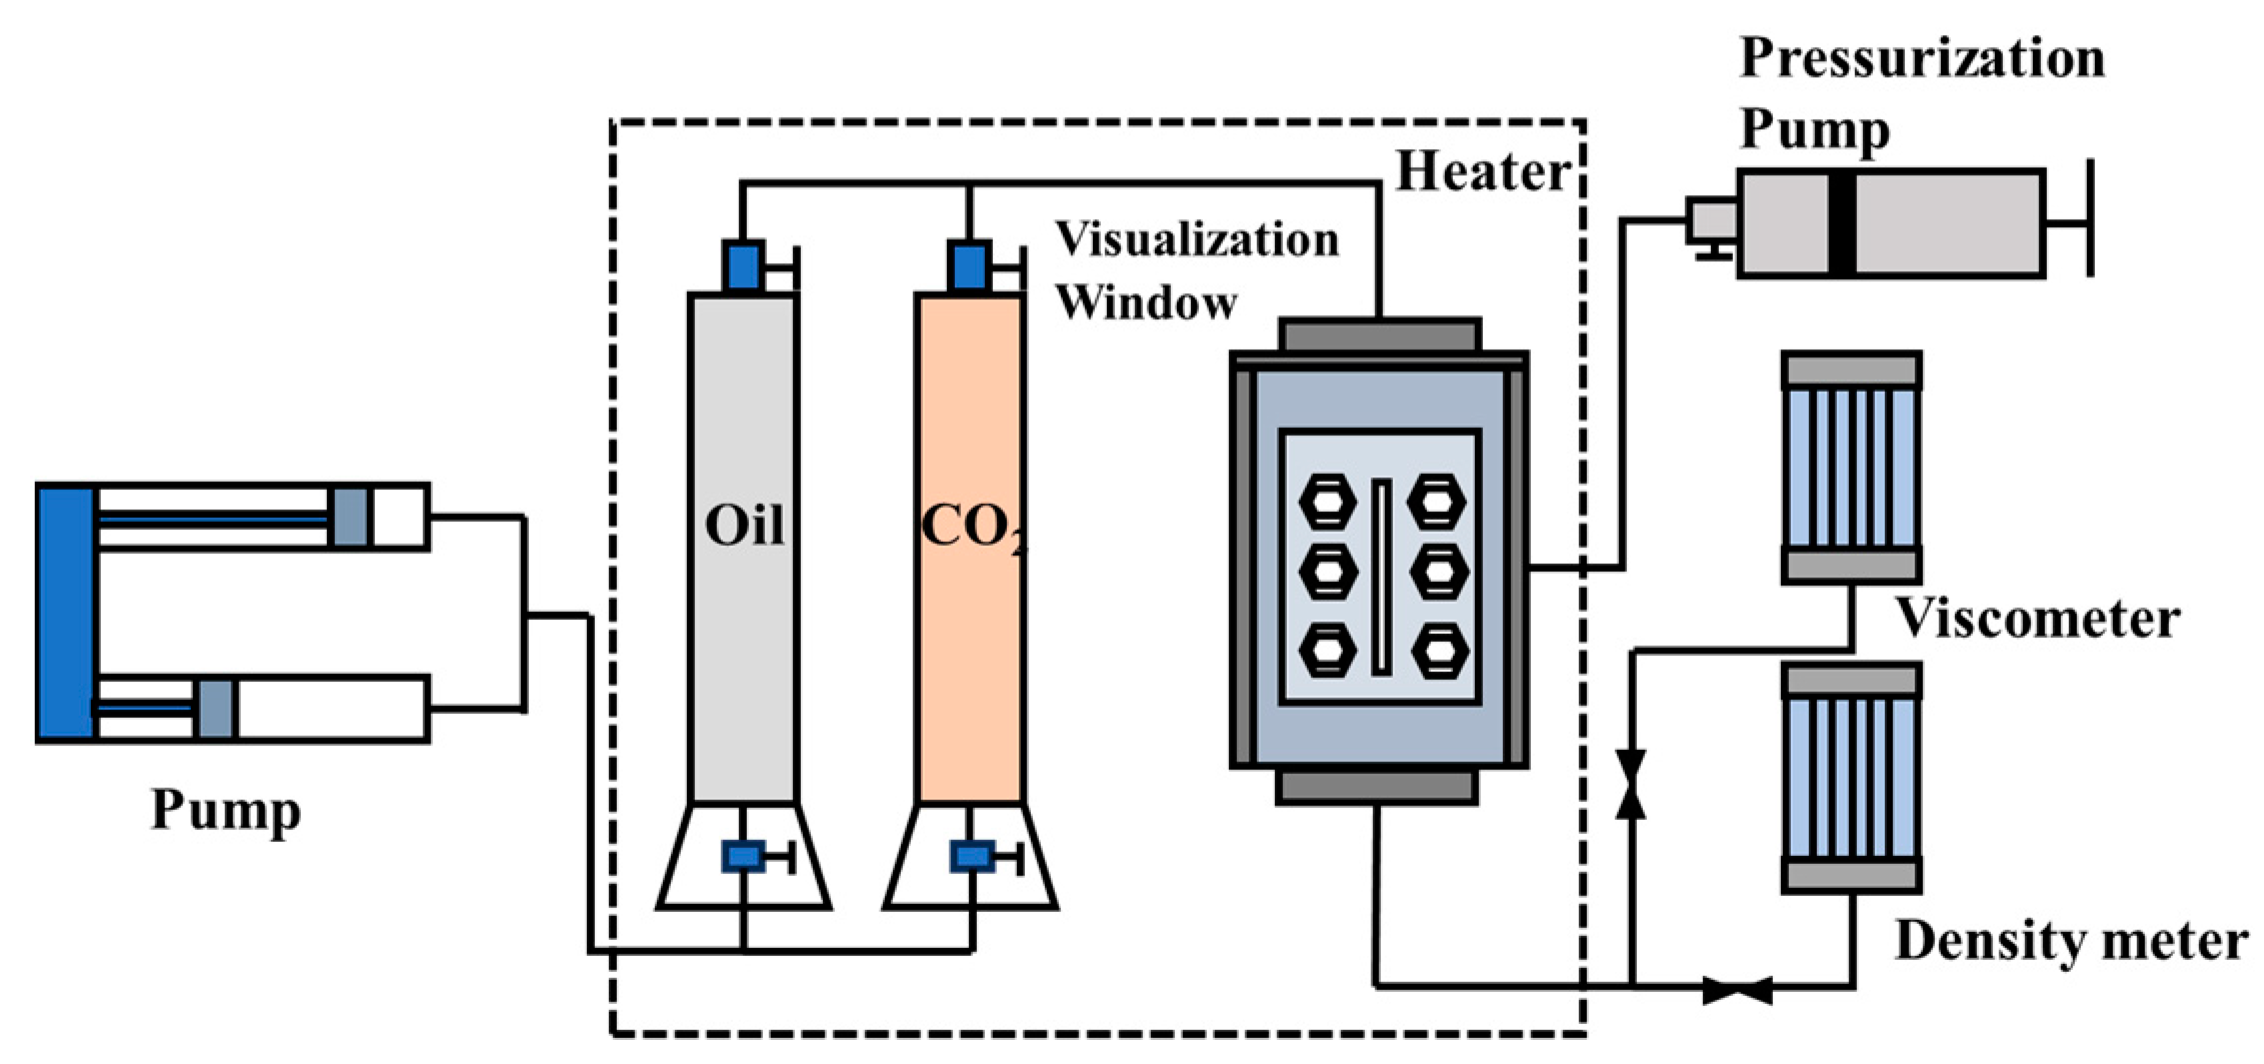
Figure 1. The diagram of the PVT analyzer.
Preprints 88708 g001
Figure 2. The diagram of the slim tube experiment.
Preprints 88708 g002
Figure 3. Relative permeability curve (a) water/oil; (b) gas/oil.
Preprints 88708 g003
Figure 4. Schematic diagram of sweep coefficient calculation.
Preprints 88708 g004
Figure 5. Schematic diagram of sweep coefficient calculation.
Preprints 88708 g005
Figure 6. Results of PVT fitting (a) Relative volume fitting; (b) Oil density and oil viscosity fitting; (c) Swelling test fitting; (e) Saturation pressure and Swelling factor fitting.
Preprints 88708 g006
Figure 7. Results of PVT fitting (a) Relative volume fitting; (b) Oil density and oil viscosity fitting; (c) Swelling test fitting; (e) Saturation pressure and Swelling factor fitting.
Preprints 88708 g007
Figure 8. Distribution of fluid properties between wells (a) Miscible flooding; (b) Immiscible flooding; (c) Partly-miscible flooding;(d) Comparison chart (0.3HCPV).
Preprints 88708 g008
Figure 9. Division of inter-well fluid phase zones for three CO2 displacement patterns.
Preprints 88708 g009
Figure 10. Relationship between permeability and sweep coefficient. (a) Comparison chart; (b) Sweep coefficient and miscible degree of partly-miscible flooding.
Preprints 88708 g010
Figure 11. Relationship between porosity and sweep coefficient (a) Comparison chart; (b) Sweep coefficient and miscible degree of partly-miscible flooding.
Preprints 88708 g011
Figure 12. Relationship between thickness and sweep coefficient (a) Comparison chart; (b) Sweep coefficient and miscible degree of partly-miscible flooding.
Preprints 88708 g012
Figure 13. Relationship between permeability and sweep coefficient (a) total sweep coefficient; (b) sweep coefficient of low permeable zone.
Preprints 88708 g013
Figure 14. Relationship between well distance and sweep coefficient (a) Comparison chart; (b) sweep coefficient and miscible degree of partly-miscible flooding.
Preprints 88708 g014
Figure 15. Relationship between injecting rate and sweep coefficients (a) Comparison chart; (b) Sweep coefficient and miscible degree of partly-miscible flooding.
Preprints 88708 g015
Figure 16. Relationship between oil viscosity and sweep coefficient (a) Comparison chart; (b) Sweep coefficients and miscible degree of partly-miscible flooding.
Preprints 88708 g016
Figure 17. Analysis results of main controlling factors of CO2 flooding sweep coefficient (a) Optimization of random forest parameters; (b) Factor importance of CO2 flooding (FI).
Preprints 88708 g017
Table 1. Crude oil composition.
Comp. mol. (%) Comp. mol. (%) Comp. mol. (%) Comp. mol. (%)
CO2 0.153 C7 3.835 C17 2.249 C27 1.062
N2 2.818 C8 5.131 C18 1.999 C28 1.024
C1 16.193 C9 4.225 C19 1.921 C29 0.936
C2 3.938 C10 3.897 C20 1.764 C30 0.905
C3 3.224 C11 3.36 C21 1.604 C31 0.7
IC4 1.675 C12 3.256 C22 1.554 C32 0.716
NC4 2.978 C13 3.271 C23 1.431 C33 0.548
IC5 0.904 C14 2.697 C24 1.385 C34 0.532
NC5 2.594 C15 2.746 C25 1.232 C35 0.476
C6 2.431 C16 2.208 C26 1.153 C36+ 5.275
Table 2. Slim tube model parameters.
Parameters Values
Number of grids 50×1×1
Grid size 32cm×5.8mm×5.8mm
Porosity/% 0.33
Permeability/mD 1000
Injection pressure constraints/MPa 35.0
Gas injection rate/(PV/d) 0.1
Table 3. 1-D numerical simulation parameters.
Parameters Values
Number of grids 300×1×1
Grid size 1m×1m×1m
Porosity/% 0.13
Temperature/°C 97.3
Permeability/mD 4.5
Initial formation pressure/MPa 16.0 (Immiscible flooding)
22.0 (Partly-miscible flooding)
26.0 (Miscible flooding)
Gas injection rate/(m3/d) 0.00195
Well bottom pressure constraint/MPa 40.0 (upper limit)
10.0 (lower limit)
Table 4. 2-D numerical simulation parameters.
Parameters Values
Number of grids 25×25×5
Grid size 8m×8m×0.6m
Porosity/% 0.13
Temperature/°C 97.3
Permeability/mD 4.5
Initial formation pressure/MPa 16.0 (Immiscible flooding)
22.0 (Partly-miscible flooding)
26.0 (Miscible flooding)
Gas injection rate/(m3/d) 261.61
Well bottom pressure constraint/MPa 40.0 (upper limit)
10.0 (lower limit)
Table 5. Range of values for each parameter.
Parameters Minimum Value Maximum Value Unit
Permeability 0.5 100 mD
Porosity 0.05 0.2 /
Reservoir Thickness 3.0 30.0 m
Permeability Ratio 1.1 100 /
Well Spacing 50 300 M
Injection Rate 0.1 2.0 m2/d (RC)
Oil Viscosity 0.74 33.52 mPa·s
Table 6. Parameters of EOS after PVT fitting.
Components mol. (%) Pc (atm) Tc (K) Mw(g/mol) Vc (m3/kmol)
CO2 0.153 72.80 304.20 44.01 0.0940
N2 2.818 33.50 126.20 27.99 0.0898
C1 16.193 45.40 190.60 16.05 0.0990
C2 3.938 48.20 305.40 30.09 0.1480
C3+C4 7.877 39.02 406.11 52.38 0.2371
C5+C6 5.929 31.51 486.50 76.99 0.3335
C7-C16 31.58 19.82 624.24 148.05 0.5701
C17-C26 15.87 13.63 653.87 289.86 1.2768
C27-C39 9.478 11.76 878.05 444.69 1.8926
C40+ 6.164 10.60 989.31 716.21 3.2964
Disclaimer/Publisher’s Note: The statements, opinions and data contained in all publications are solely those of the individual author(s) and contributor(s) and not of MDPI and/or the editor(s). MDPI and/or the editor(s) disclaim responsibility for any injury to people or property resulting from any ideas, methods, instructions or products referred to in the content.
Copyright: This open access article is published under a Creative Commons CC BY 4.0 license, which permit the free download, distribution, and reuse, provided that the author and preprint are cited in any reuse.
Prerpints.org logo

Preprints.org is a free preprint server supported by MDPI in Basel, Switzerland.

Subscribe

© 2024 MDPI (Basel, Switzerland) unless otherwise stated