Submitted:
25 October 2023
Posted:
26 October 2023
You are already at the latest version
Abstract
Keywords:
1. Introduction
2. Visualization of gas intrusion
2.1. Experimental system
2.2. Experimental materials
2.3. Experimental procedure
3. Results and Analysis
3.1. Simulation of gas intrusion into the wellbore under shutdown conditions
3.1.1. Variations of the intrusion bubble size
3.1.2. Modeling gas intrusion rate under shut-in well conditions
3.2. Simulation of intrusive gas transportation velocity in wellbore under shut-in conditions
3.2.1. Single bubble transport experiment
3.2.2. Experiments on the transport of bubble populations
4. Conclusions
Acknowledgments
References
- Yin H, Si M, Li Q, Zhang J, Dai L. Kick Risk Forecasting and Evaluating During Drilling Based on Autoregressive Integrated Moving Average Model. Energies. 2019, 12(18): 3540. [CrossRef]
- Rommetveit R, Vefring E H. Comparison of results from an advanced gas kick simulator with surface and downhole data from scale gas kick experiments in an inclined well. SPE 22558, 1991. [CrossRef]
- Stefan M, Samuel G, Azar J. Modeling of pressure buildup on a kicking well and its practical application. Permian Basin Oil and Gas Recovery Conference, 1996. [CrossRef]
- Davies R M, Taylor G. The mechanics of large bubbles rising through extended liquids and through liquids in tubes. Dynamics of Curved Fronts, 1988, 200(1062): 377-392. [CrossRef]
- Harmathy T Z. Velocity of large drops and bubbles in media of infinite or restricted extent. Aiche Journal, 1960, 6(2): 281-288. [CrossRef]
- Wallis G B. One dimensional two-phase flows. International Journal of Multiphase Flow, 1969(1-2): 97-112. [CrossRef]
- Fan W Y. Study of Bubble Behaviors and Flow Field around Moving Bubble in Non-Newtonian Fluid. Tianjin: Tianjin University, 2008.
- Wang T, Li H X, Li Y. Numerical Investigation on Coaxial Coalescence of Two Gas Bubbles. Journal of Xi’an Jiaotong University, 2013, 47(07): 1-6.
- Liu Y P, Wang P Y, Lin S N. Correlation of Position of Taylor Bubble Formation in Cryogenic Tube. Journal of Shanghai Jiaotong University, 2013,47(10): 1509- 1514, 1519.
- Krzan M, Lotfi M, Kovalchuk V I, et al. Influence of β-lactoglobulin and its surfactant mixtures on velocity of the rising bubbles. Colloids & Surfaces A Physicochemical & Engineering Aspects, 2014, 460: 361-368. [CrossRef]
- Azzopardi B J, Pioli L, Abdulkareem L A. The properties of large bubbles rising in very viscous liquids in vertical columns. International Journal of Multiphase Flow, 2014, 67: 160-173. [CrossRef]
- Keshavarzi G, Pawell R S, Barber T J, et al. Transient analysis of a single rising bubble used for numerical validation for multiphase flow. Chemical Engineering Science, 2014, 112(12): 25-34. [CrossRef]
- Cano-Lozano J C, Bolaños-Jiménez R, Gutiérrez-Montes C, et al. The use of volume of fluid technique to analyze multiphase flows: specific case of bubble rising in still liquids. Applied Mathematical Modeling, 2015, 39(12): 3290-3305. [CrossRef]
- Yan X, Zheng K, Jia Y, et al. Drag Coefficient Prediction of a Single Bubble Rising in Liquids.Industrial & Engineering Chemistry Research, 2018, 57(15): 5385-5393. [CrossRef]
- Khodayar J, Davoudian S H. Surface Wettability Effect on the Rising of a Bubble Attached to a Vertical Wall. International Journal of Multiphase Flow, 2018, 109:178-190. [CrossRef]
- Du J, Zhao C, Bo H, Ren X. The Modeling of Bubble Lift-Off Diameter in Vertical Subcooled Boiling Flow. Energies. 2022, 15(18): 6857. [CrossRef]
- Mangani F, Soligo G. Influence of density and viscosity on deformation, breakage, and coalescence of bubbles in turbulence. Physical Review Fluids, 2022,7(5):34. [CrossRef]
- He H, Liu Z, Ji J, Li S. Analysis of Interaction and Flow Pattern of Multiple Bubbles in Shear-Thinning Viscoelastic Fluids. Energies. 2023, 16(14): 5345. [CrossRef]
- Guo Y L. Study on Gas Invasion Mechanism and Wellbore Pressure during Well Shut-in in Deepwater Drilling. Qingdao: China University of Petroleum, 2018.
- Jianguo Zhang, Dianfa Du, Jian Hou. Seepage mechanics of oil and gas reservoirs. Second edition. Dongying: China University of Petroleum Press, 2009. (In Chinese).
- Sun B, Guo Y, Wang Z, et al. Experimental study on the drag coefficient of single bubbles rising in static non-Newtonian fluids in wellbore. Journal of Natural Gas Science and Engineering, 2015, 26(07): 867-872. [CrossRef]
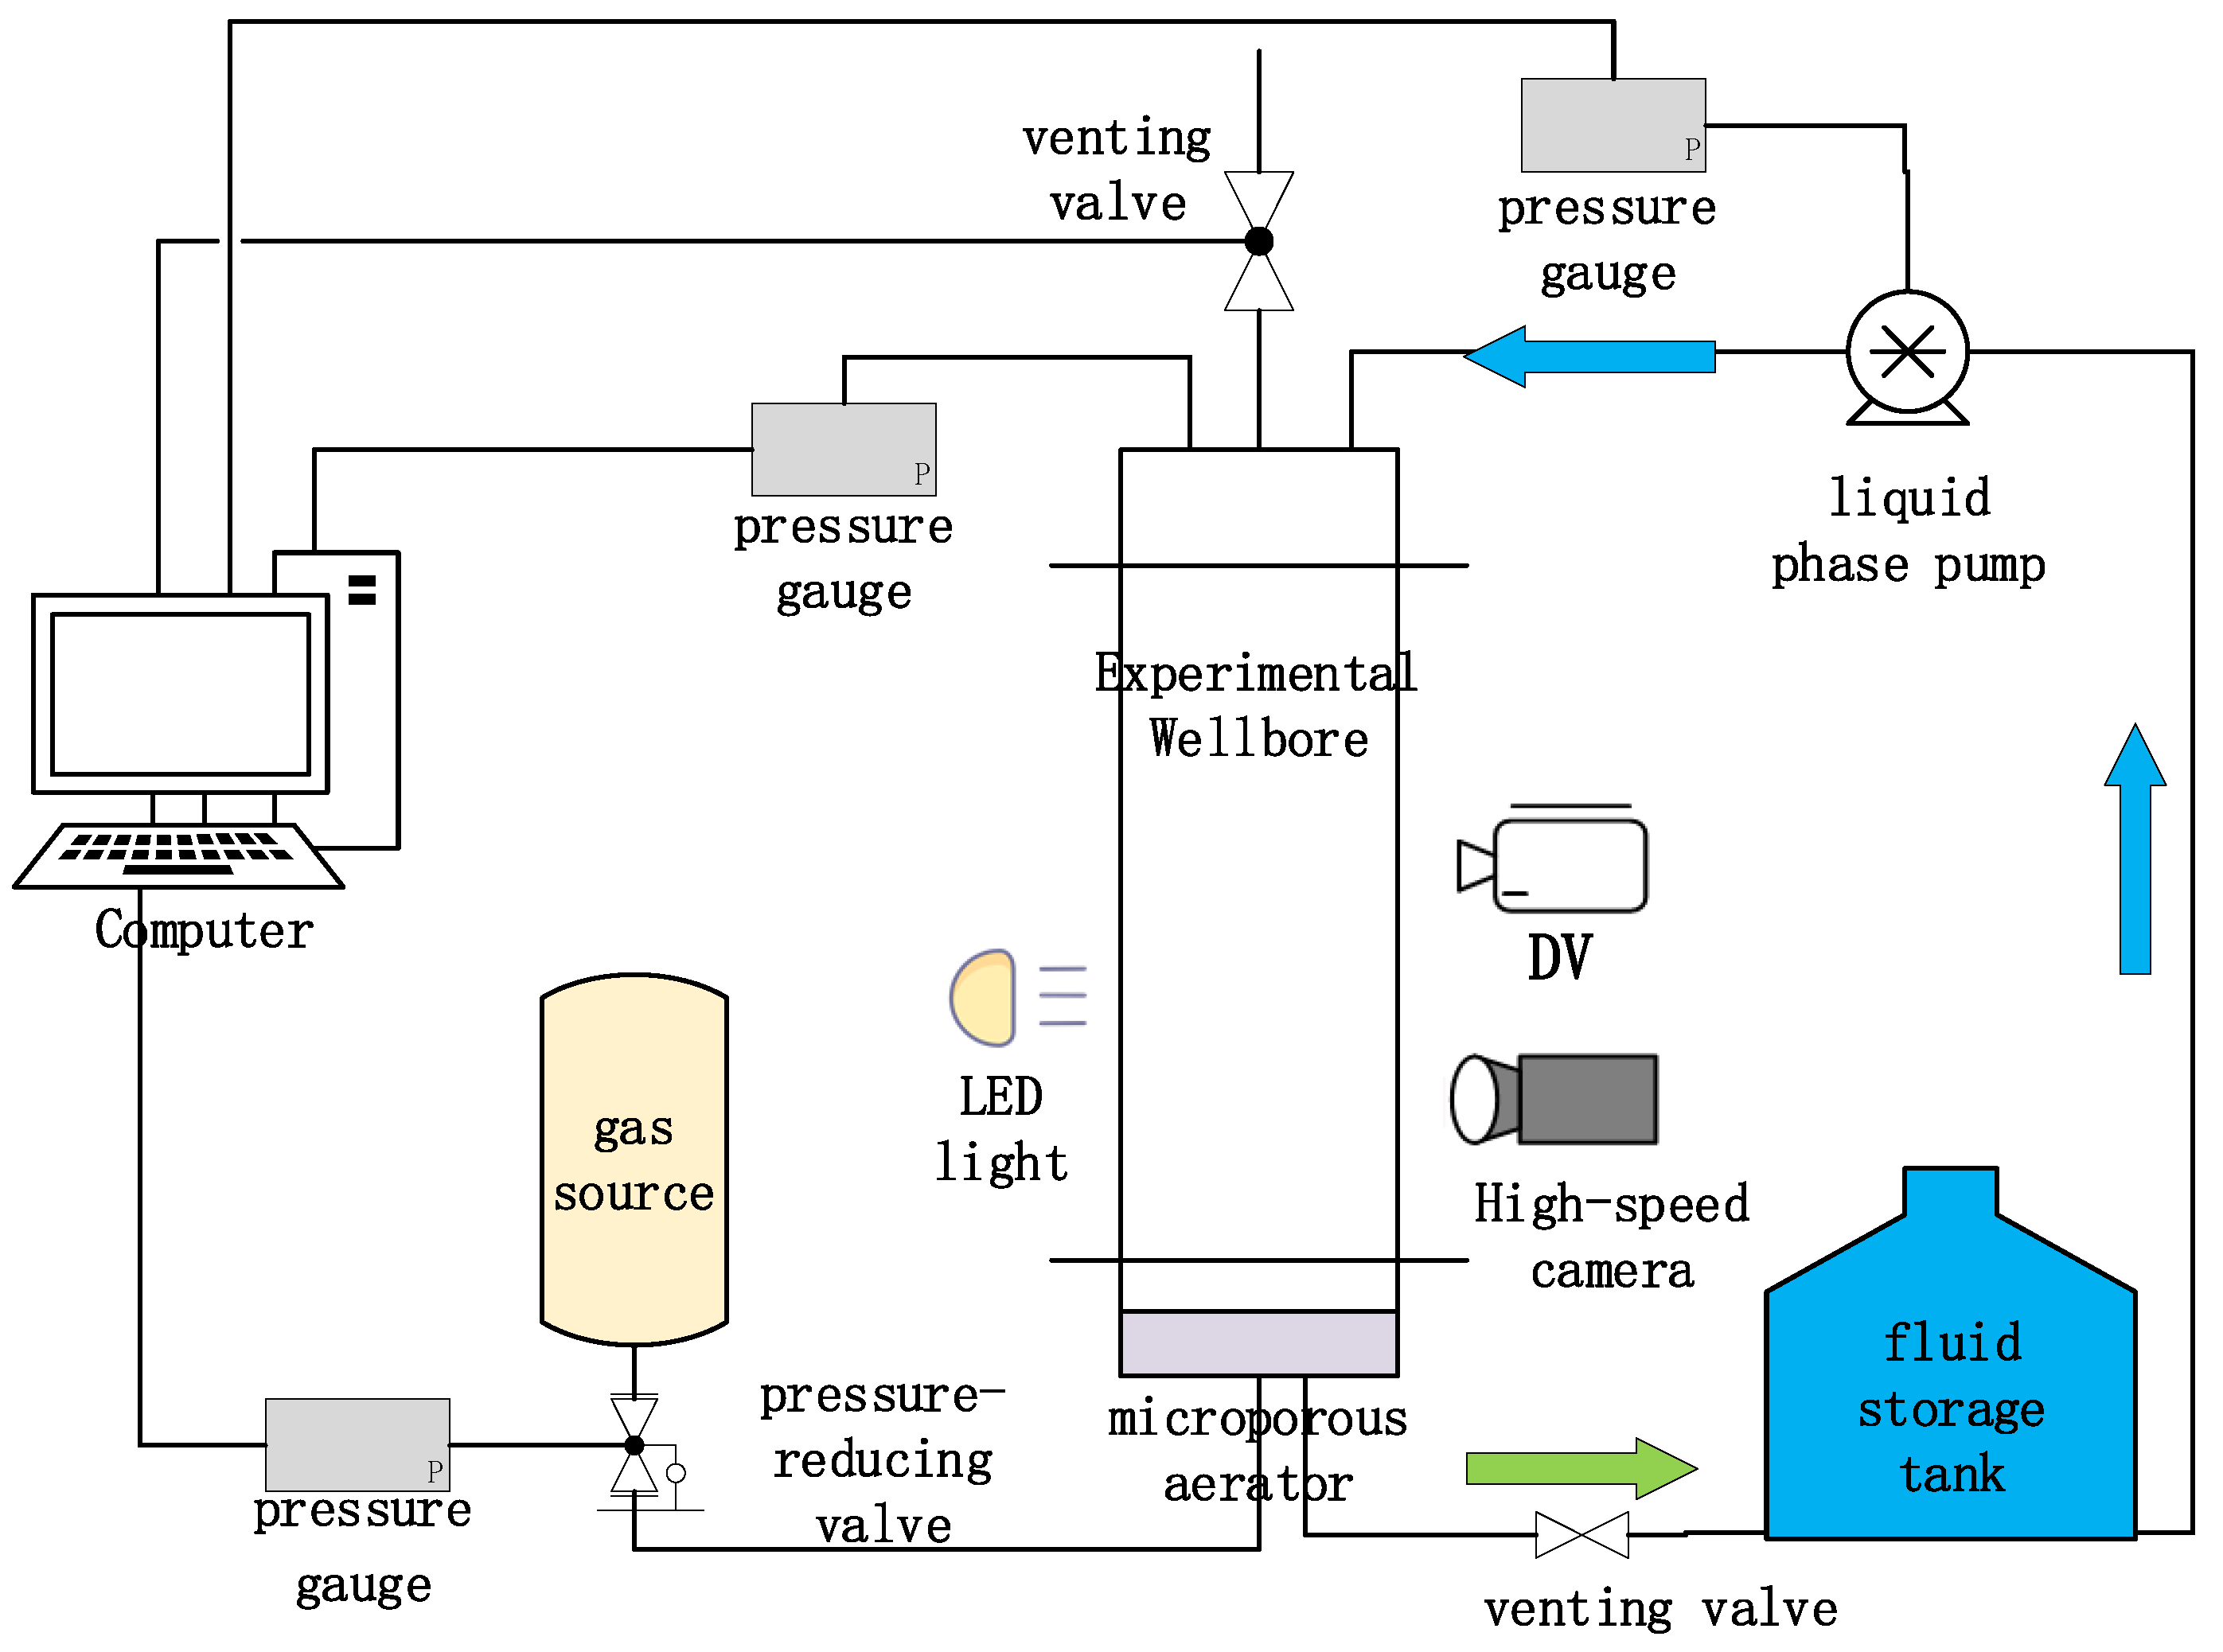
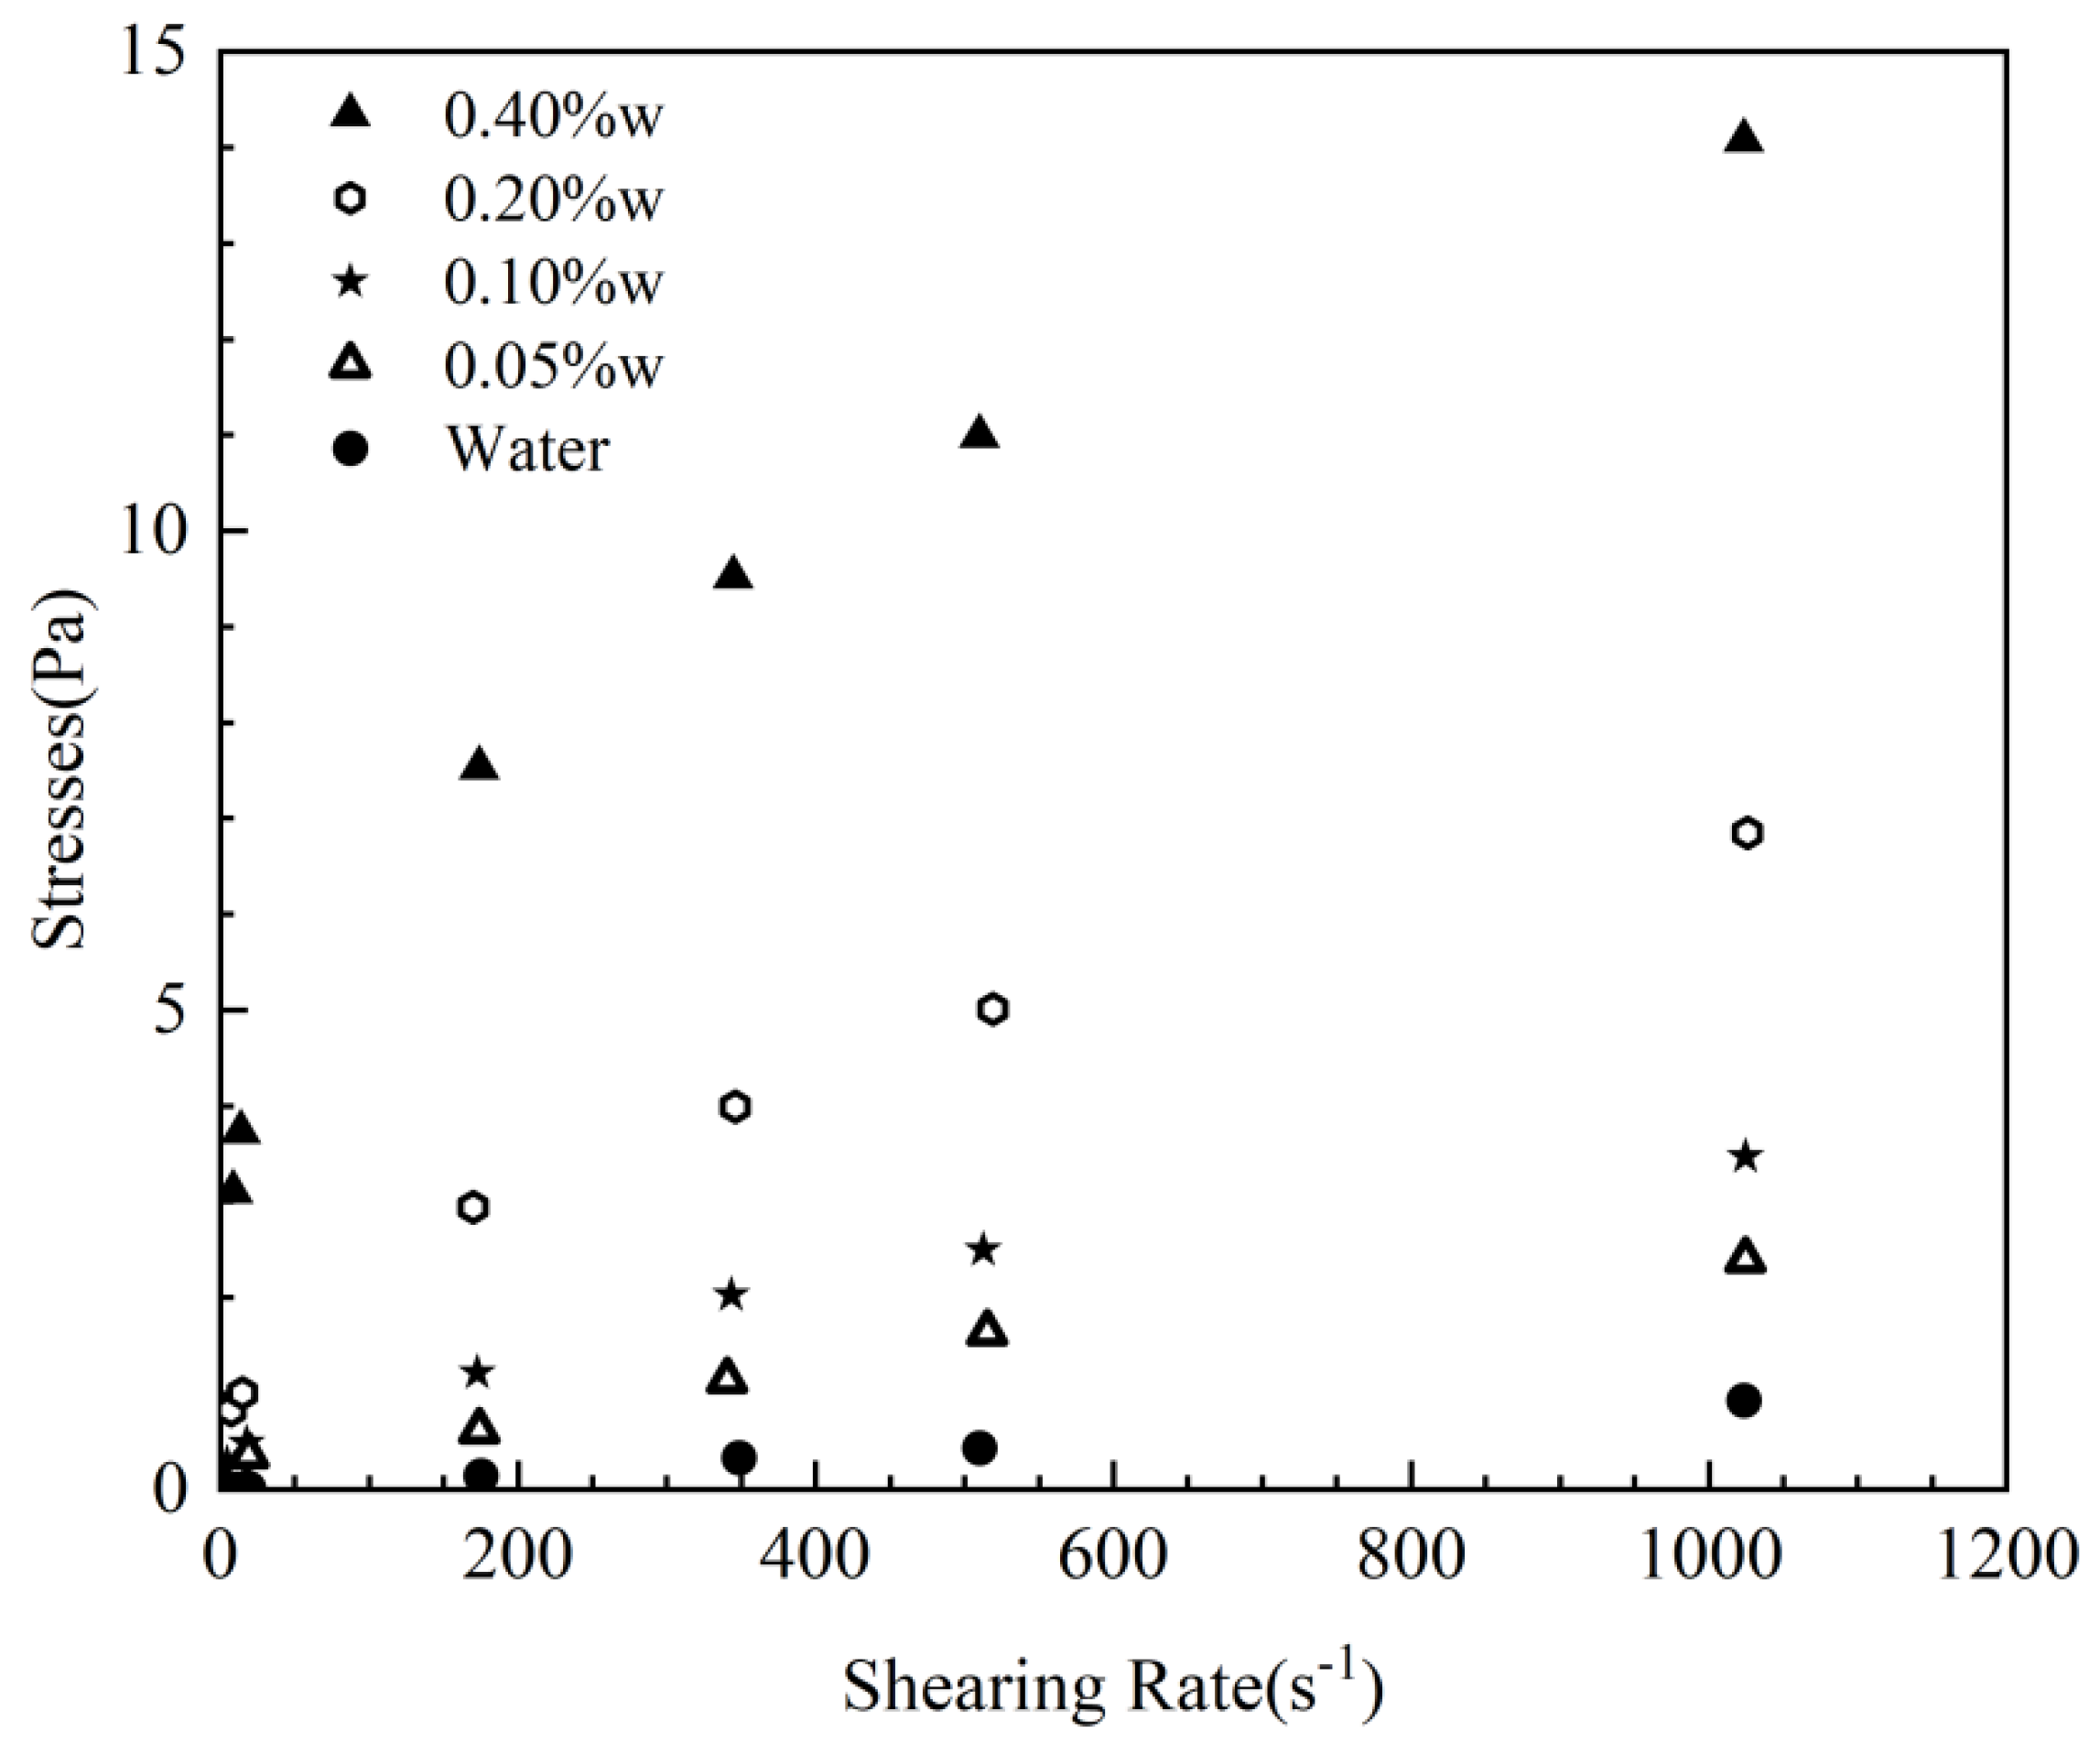
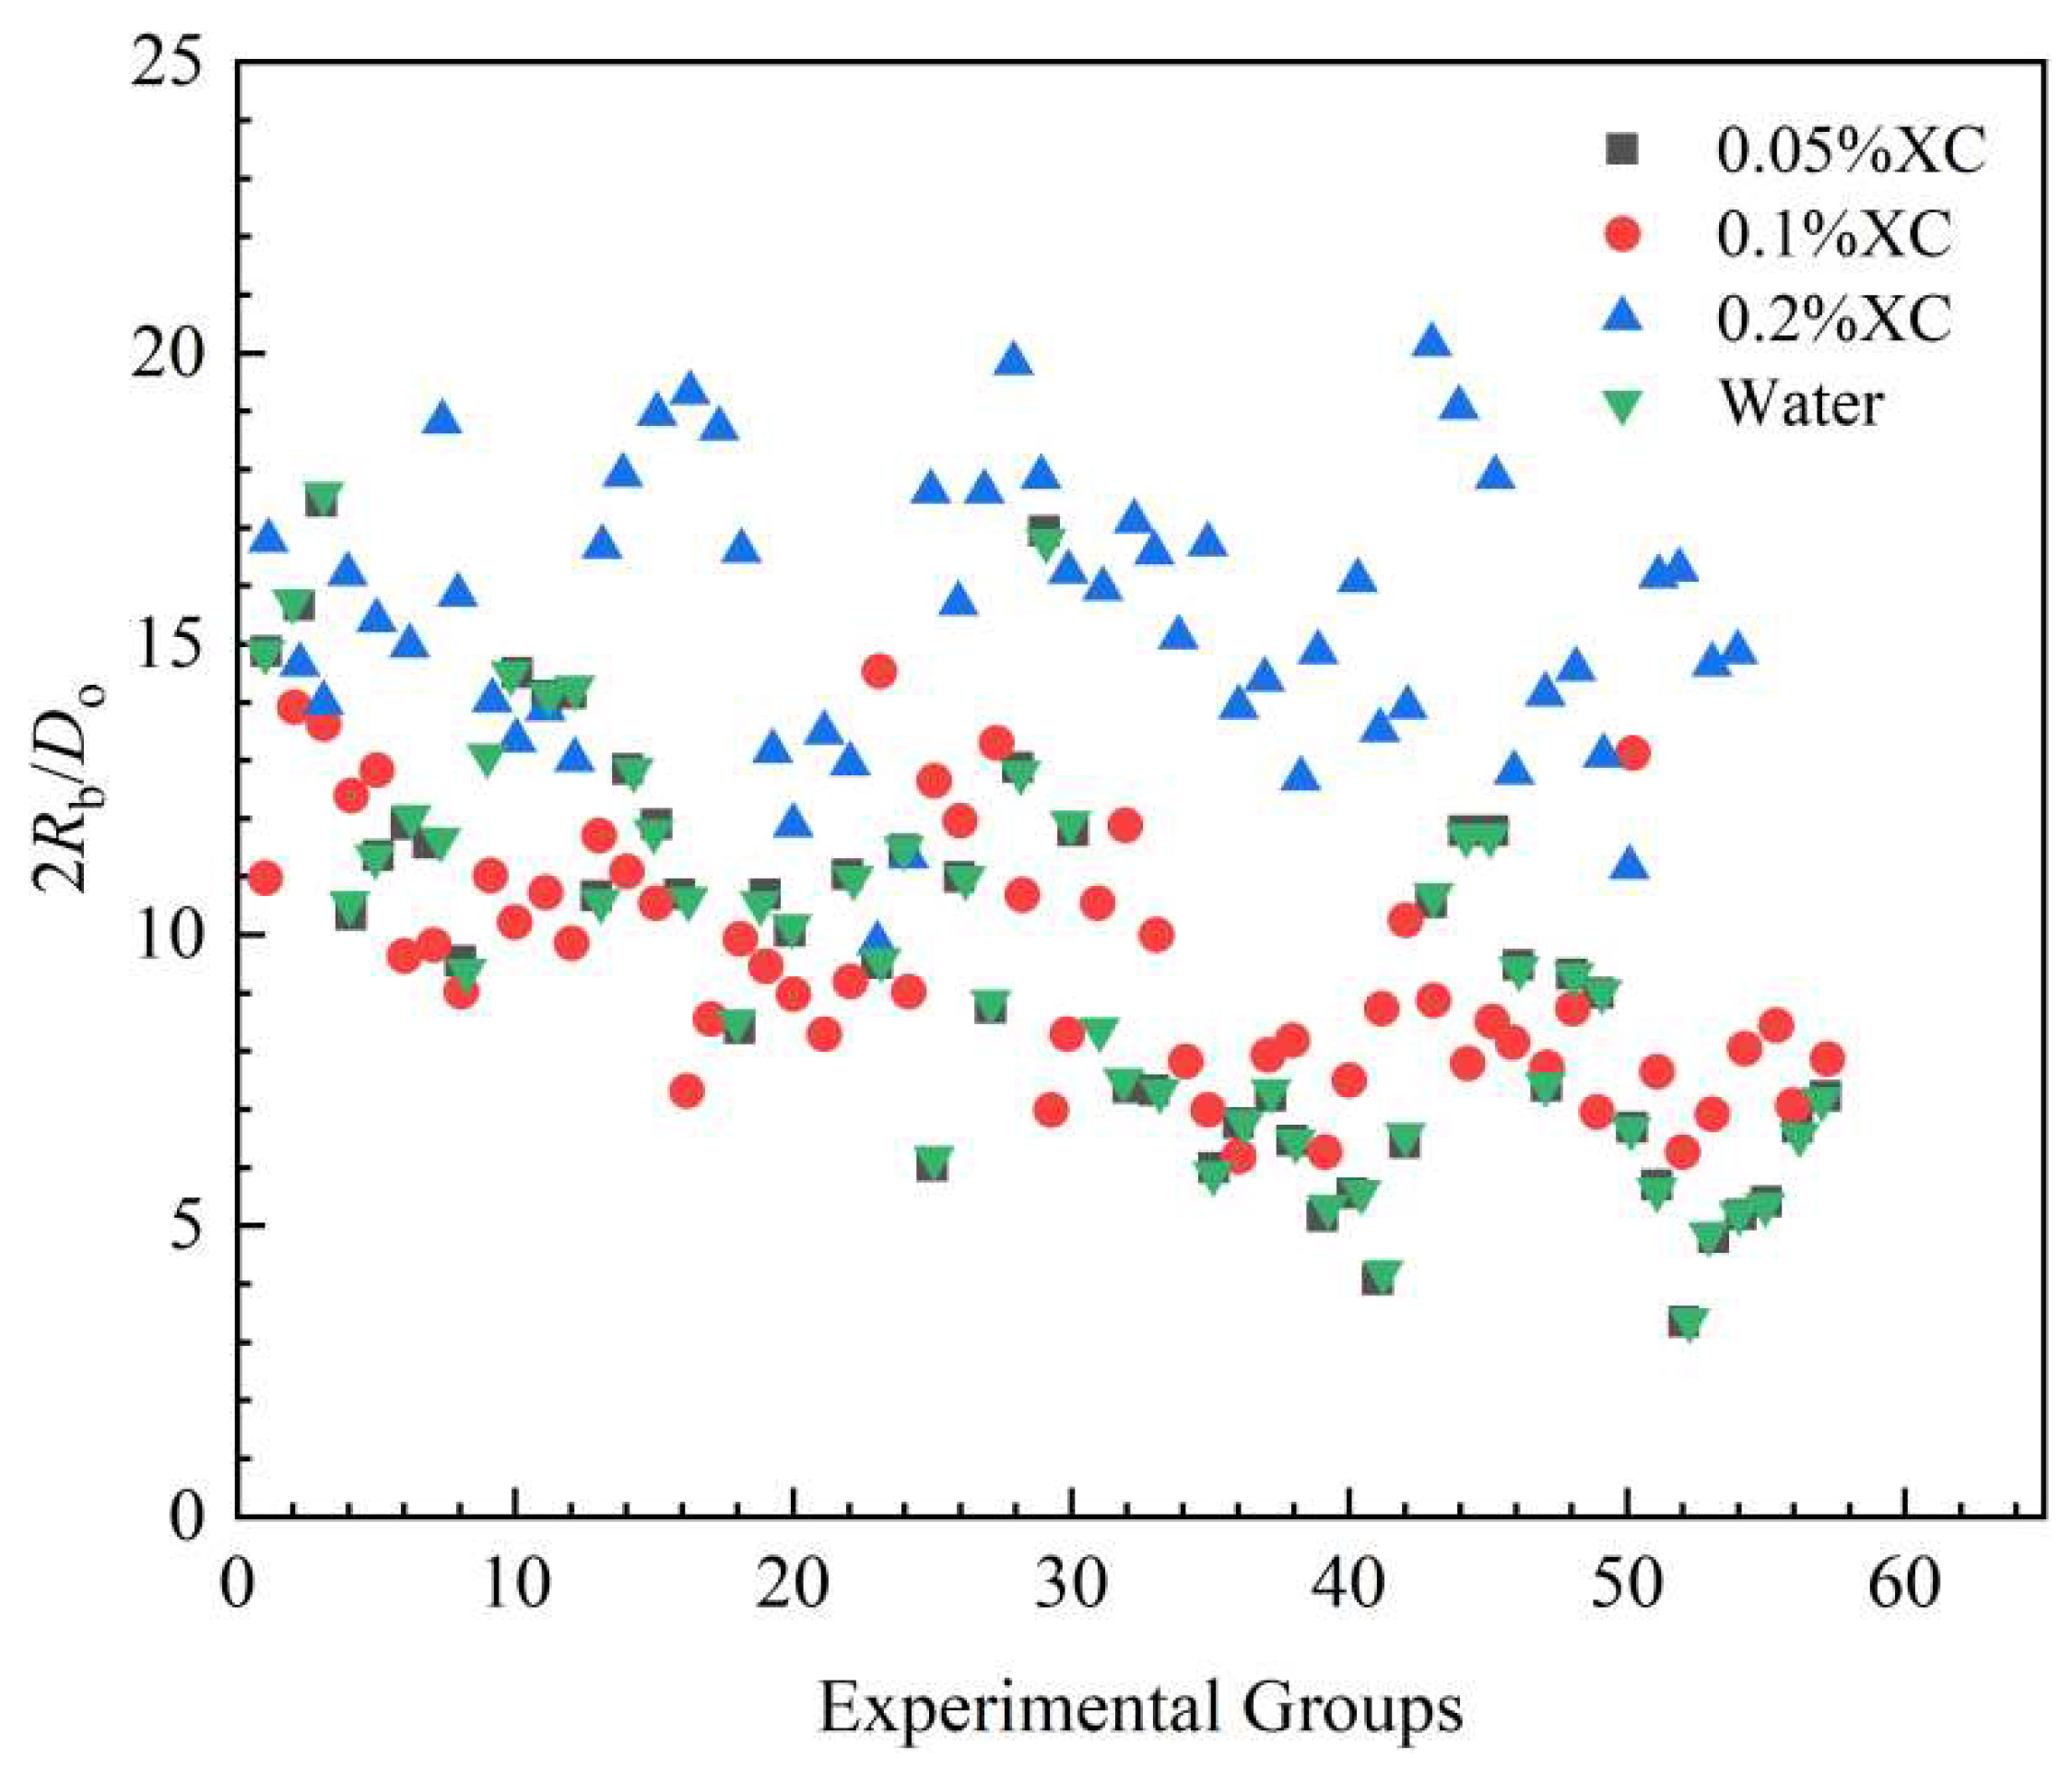
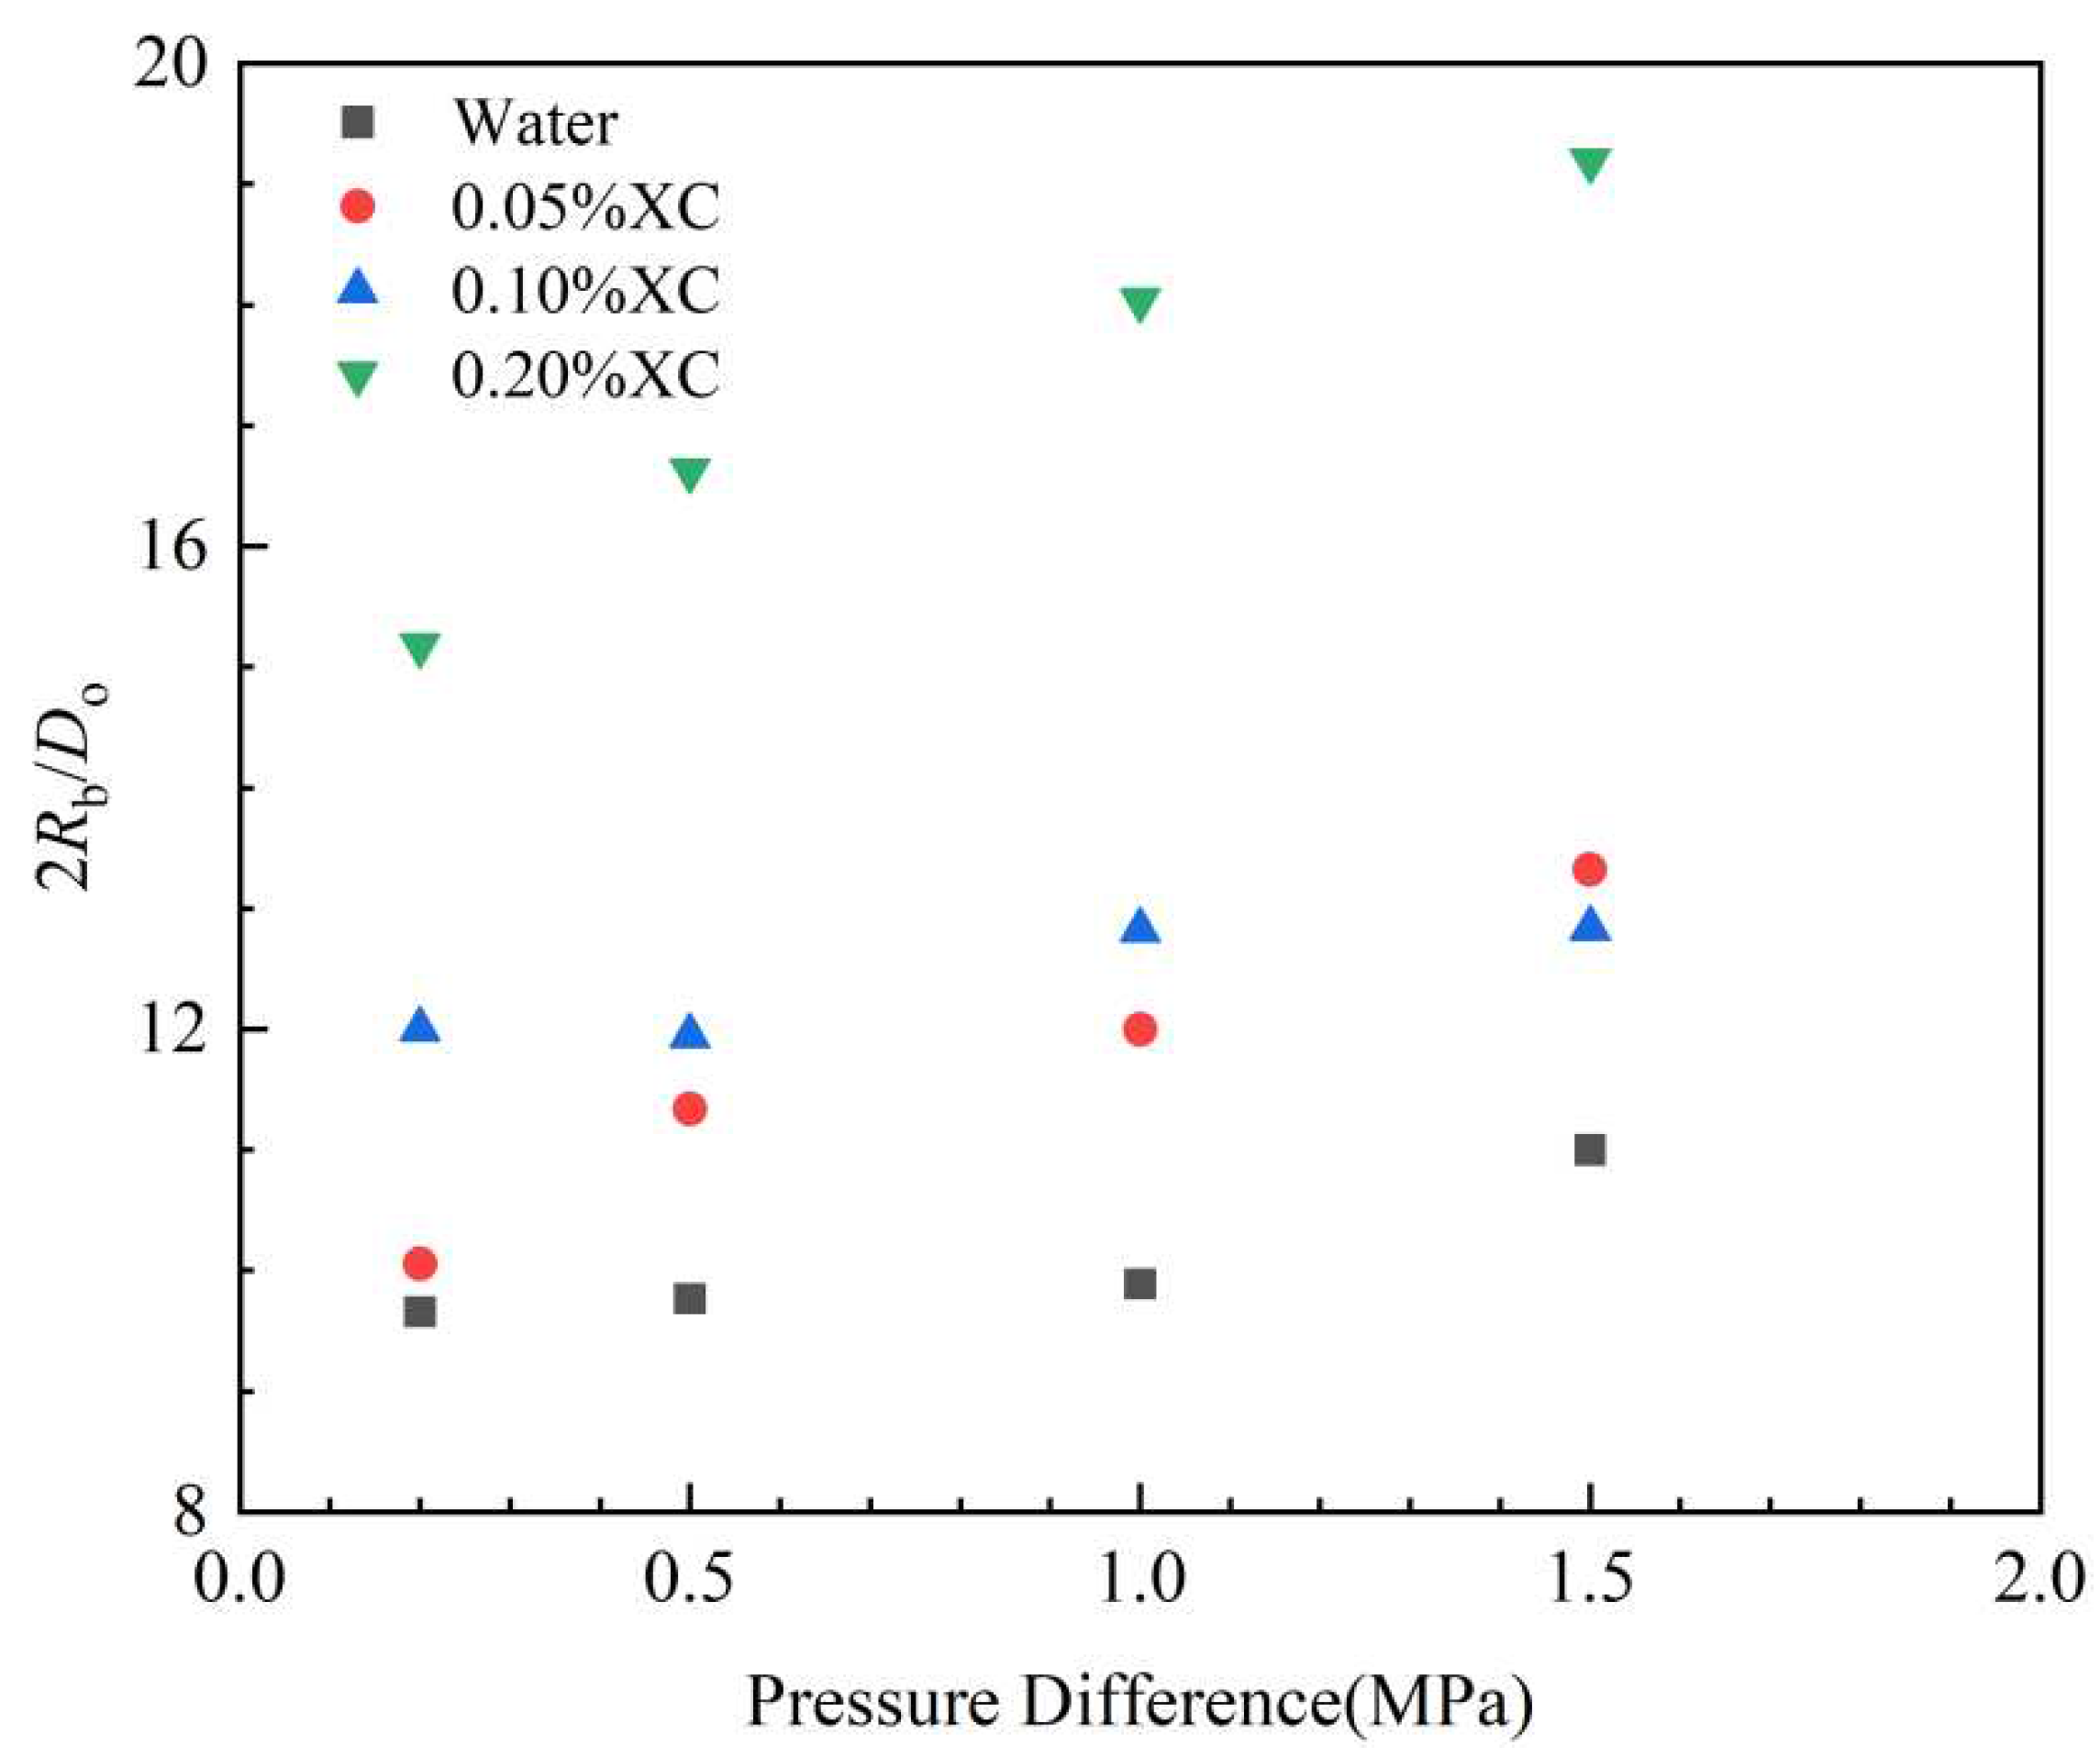

| Type | Consistency factor K (Pa·s-n) |
Fluidity index n | Density (kg·m-3) |
Surface tension (N·m-1) |
|---|---|---|---|---|
| Water | 0.01 | 1 | 1000 | 72.35 |
| 0.05%XC | 0.07224 | 0.51458 | 1000 | 73.67 |
| 0.1%XC | 0.12377 | 0.48544 | 1000 | 74.24 |
| 0.2%XC | 0.34337 | 0.43297 | 1000 | 75.05 |
| 0.4%XC | 1.28381 | 0.34793 | 1000 | 76.75 |
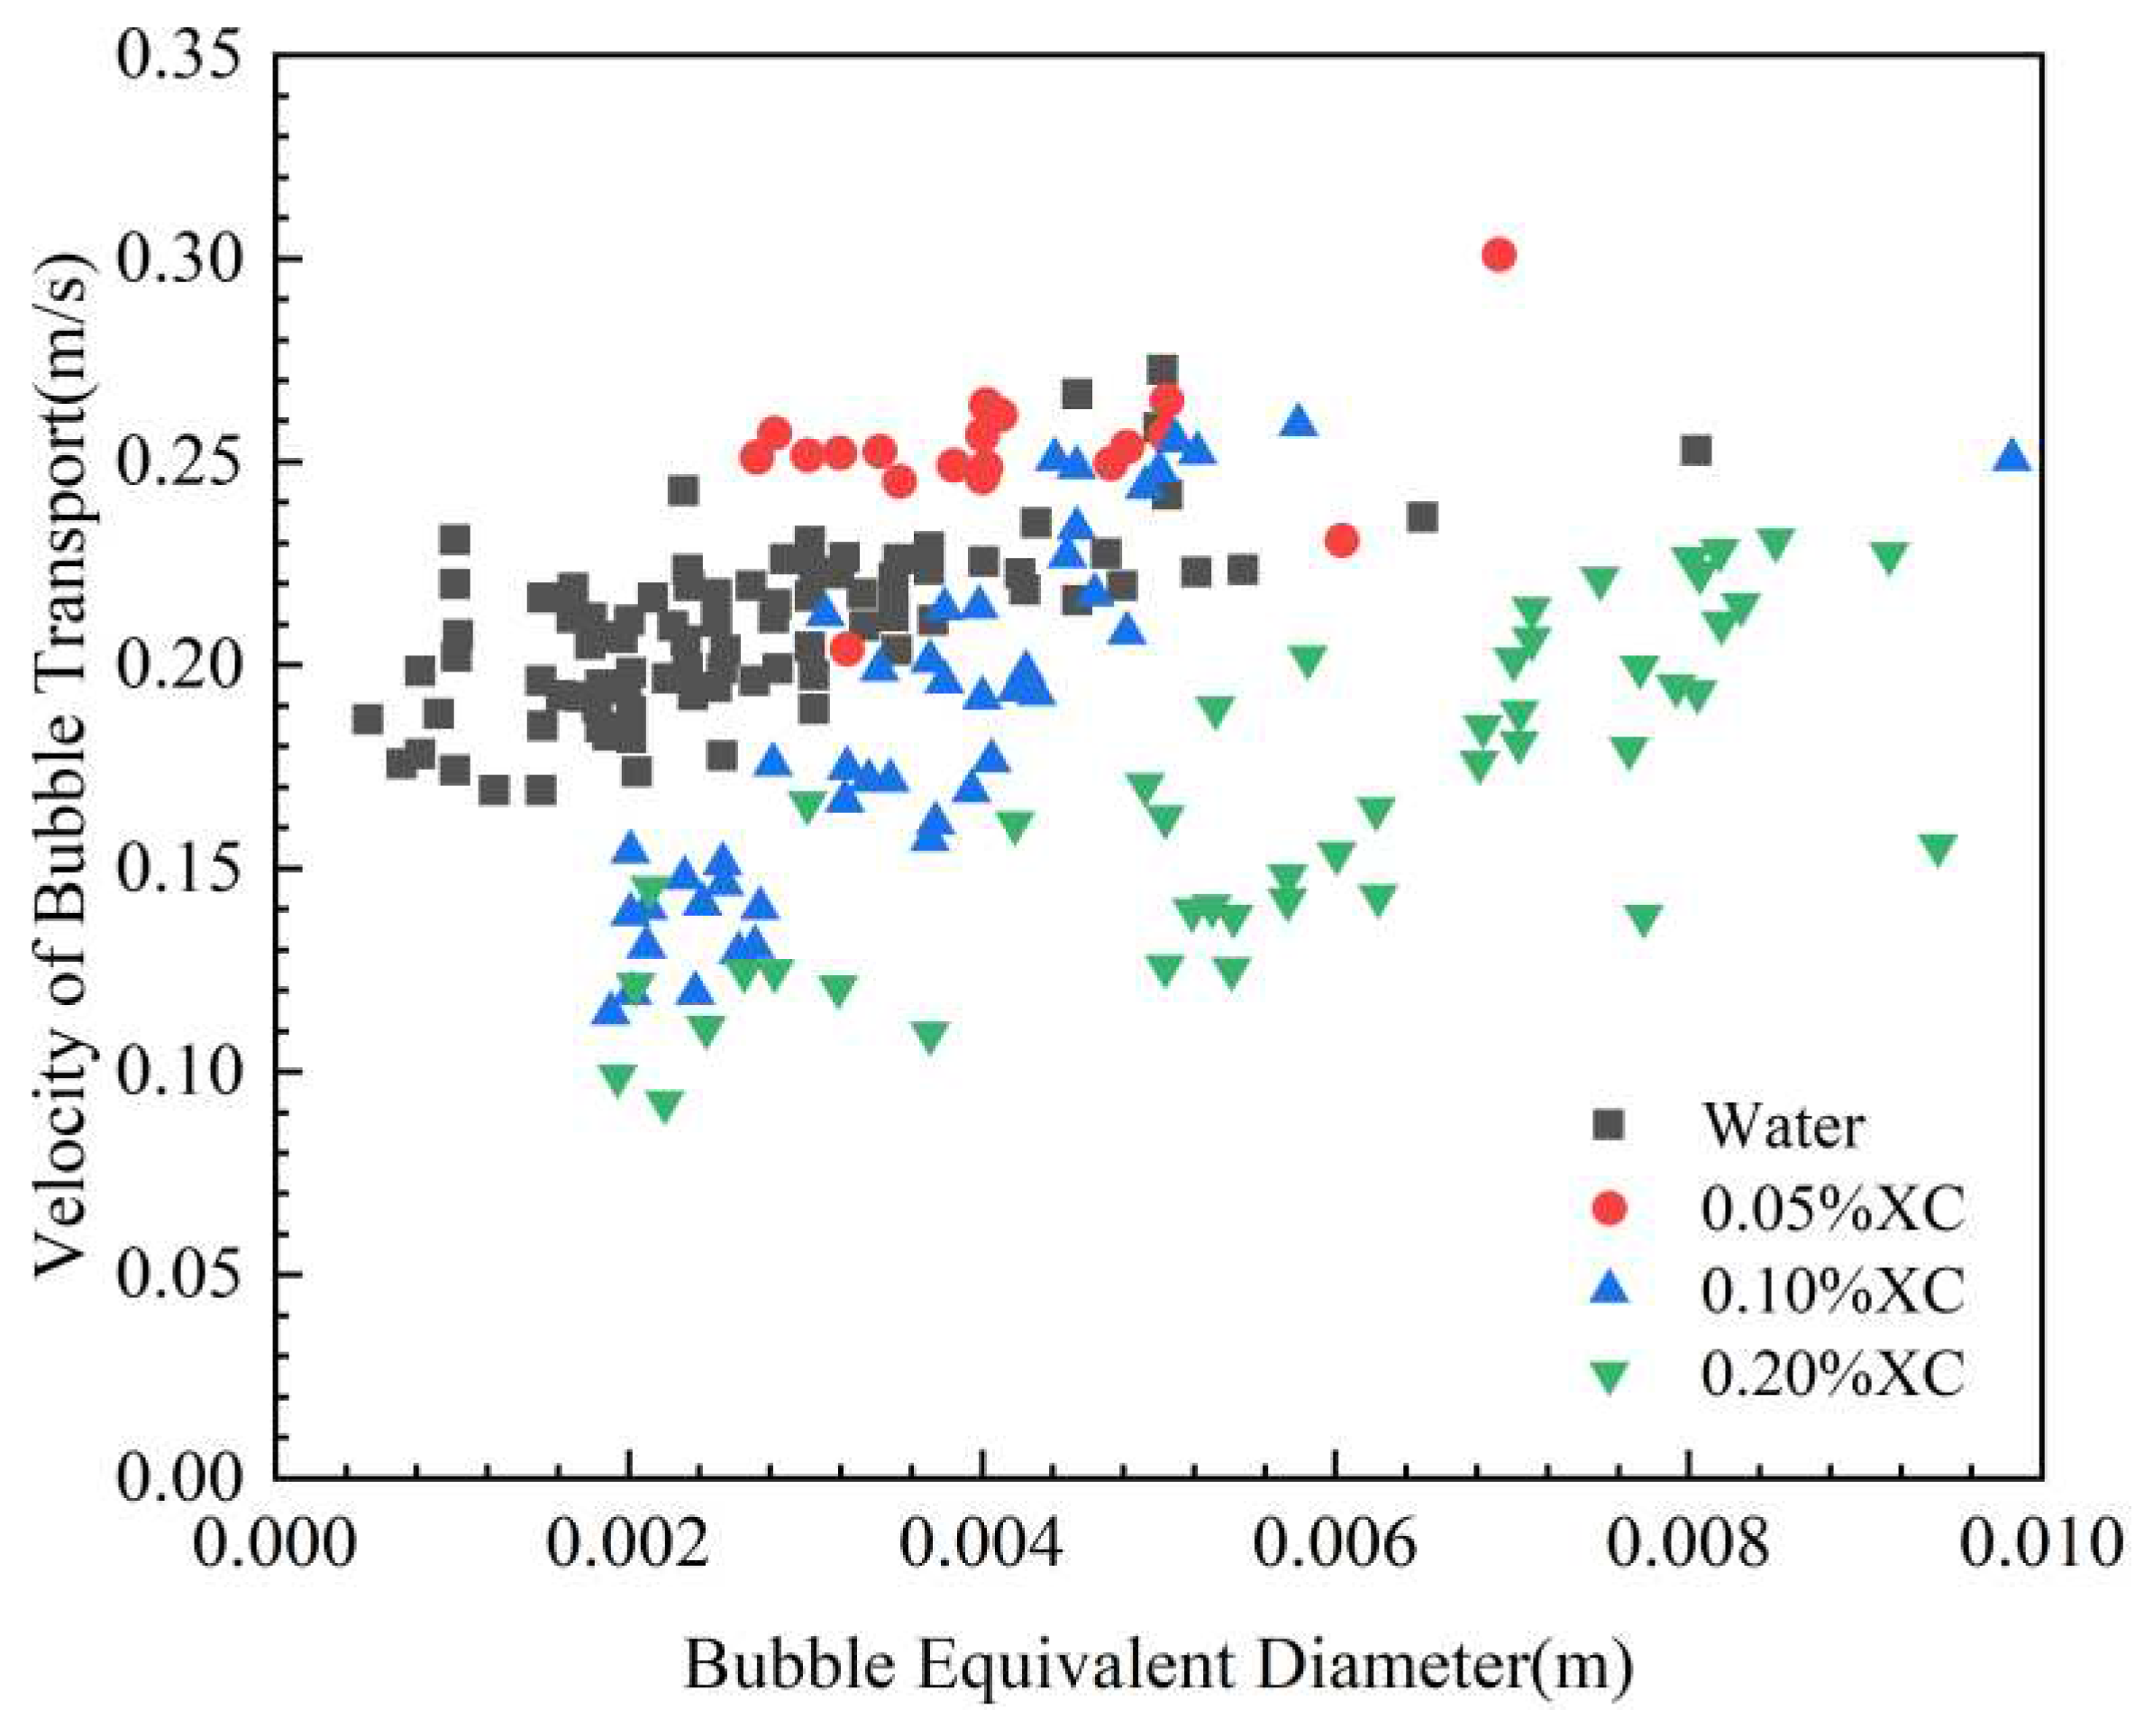
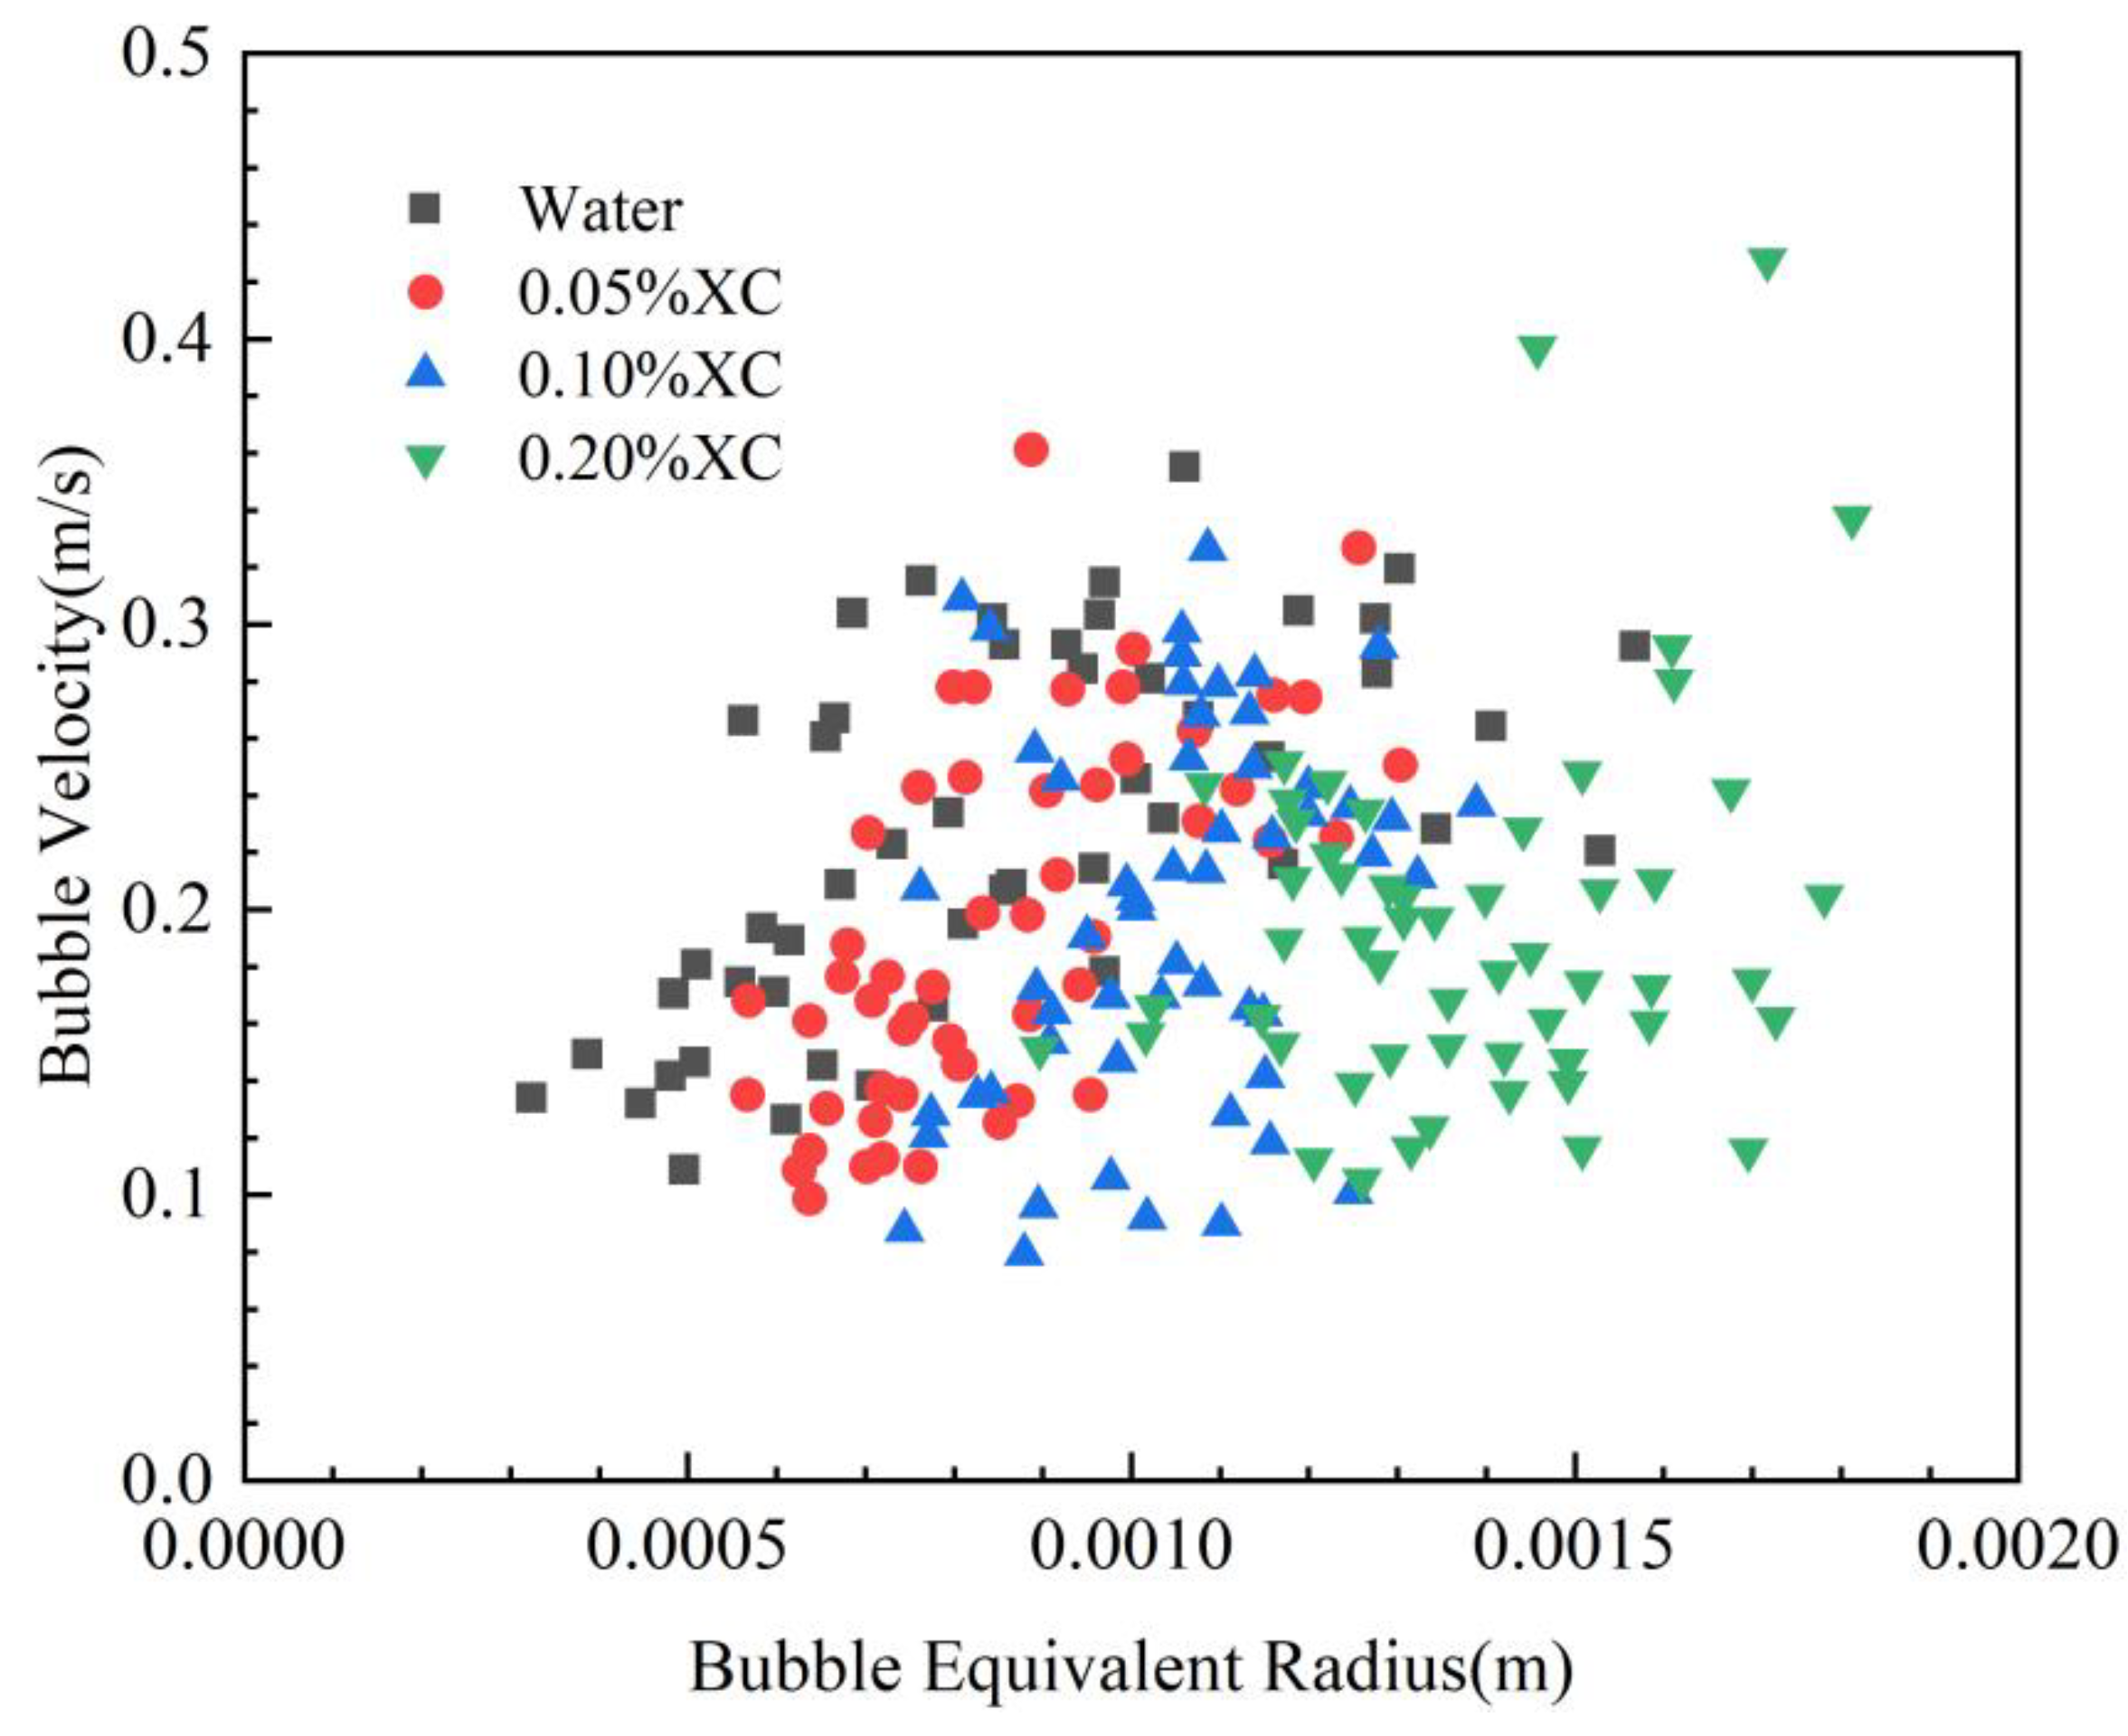
| Type | Range of bubble equivalent radius (mm) | Bubble velocity range (mm/s) | ||
|---|---|---|---|---|
| Single-bubble | Bubble group | Single-bubble | Bubble group | |
| Water | 0.5-8 | 0.32-1.6 | 170-267 | 110-330 |
| 0.05%XC | 2.7-6.9 | 0.56-1.29 | 213-303 | 100-360 |
| 0.1%XC | 2-9.8 | 0.74-1.43 | 116-259 | 77.9-321 |
| 0.2%XC | 1.9-9.4 | 0.89-1.81 | 95-231 | 106-428 |
Disclaimer/Publisher’s Note: The statements, opinions and data contained in all publications are solely those of the individual author(s) and contributor(s) and not of MDPI and/or the editor(s). MDPI and/or the editor(s) disclaim responsibility for any injury to people or property resulting from any ideas, methods, instructions or products referred to in the content. |
© 2023 by the authors. Licensee MDPI, Basel, Switzerland. This article is an open access article distributed under the terms and conditions of the Creative Commons Attribution (CC BY) license (http://creativecommons.org/licenses/by/4.0/).


