1. Introduction
In Japan, floods occur nationwide almost every year. For instance, in 2019, Typhoon Hagibis brought record-breaking heavy rain to a wide area of eastern Japan. This resulted in 142 levee breaches and over 950 landslides, mainly in the Kanto and Tohoku Regions [
1]. The damage caused by this flooding amounted to approximately 1.88 trillion yen, making it the most economically damaging flood since statistical records began.
Against this background, in July 2020, the National Land Development Council of the Ministry of Land, Infrastructure, Transport and Tourism (MLIT) published the report “Water-Related Disaster Risk Reduction Considering Climate Change -Transition to River Basin Disaster Resilience and Sustainability by All”.
This new policy promotes cooperation among regions and cities when designing water management policy for rivers, implementing localized and widespread flood prevention measures, and designing communities for convenience, comfort, safety, and security. To develop more effective measures, the MLIT amended nine acts as part of the Act for Partial Amendment of the Act on Countermeasures against Flood Damage of Specified Rivers, commonly known as the flood control-related laws.
The Japanese government’s “River Basin Disaster Resilience and Sustainability by All” policy can be broadly divided into measures to ➀ prevent and reduce flooding as much as possible, ➁ reduce the number of victims, and ➂ mitigate damage for faster recovery and rebuilding. The countermeasures in ➀ mainly relate to the development of rivers and rainwater storage and permeation facilities, use of reservoirs and other forms of water management, water management through dams, and improved water retardation through land use. The countermeasures included in ➁ go far beyond conventional water management measures to include regulations and guidance on land use, promoting relocation, providing flood risk information during real estate transactions, and considering the role of financial guidance. Finally, the main countermeasures in ➂ include addressing gaps in flood risk information, providing multistage flood risk information, improving flood prediction, promoting BCP (Business Community Plan), providing flood risk information during real estate transactions, and promoting flood countermeasures through financial products.
Many of the measures in “River Basin Disaster Resilience and Sustainability by All” are merely summaries of conventional water management measures. Therefore, as a new measure, this study proposes proactive floodwater diversion using the backwater phenomenon in agricultural drainage channel networks, considering the crop calendar. Hayashi [
2] estimated that rice paddies had a flood control capacity of approximately 1.06 billion m
3, while that of fields was about 800 million m
3. Thus, fields have huge potential for water storage, and expectations that agricultural lands can mitigate floods have been increasing in recent years.
In Korea and Taiwan, which also grow rice, the flood mitigation function of agricultural land has also attracted attention. Kim et al. [
3] evaluated the multifunctionality of paddy fields and estimated their storage capacity during flooding in Korea to be 2,500 million m
3. Huang et al. [
4] examined the multifunctional nature of paddy fields in Taiwan and estimated they had a storage capacity of 624.5 million m
3, which equates to US
$389 million annually.
Regarding flood control using fields, Ishikawa [
5] proposed a flow-through floodplain that ensures the safety of downstream areas by channeling floodwaters through overflow embankments at specific locations when river levels exceed the planned high-water level. Sato [
6] analyzed the position and role of fields in “River Basin Disaster Resilience and Sustainability by All” and identified the following possible contributions of the agricultural sector to flood control: reservoir construction; emergency floodwater diversion; control of runoff after rainfall; and flood reduction through agricultural irrigation dams and reservoirs. In Japan, flood control is being actively implemented to minimize the damage caused by floods.
Regarding floodwater diversion to fields, it is very important to consider the crop calendar and the time of flooding of the field to reduce damage to crops. By considering the crop calendar, it is possible to identify when flooding can be tolerated, thereby reducing the impact on farming, and facilitating cooperation from farmers. Regarding flood damage to crops, the Manual for Flood Control Economic Surveys (draft) [
7] calculates the amount of damage to agricultural products by multiplying the assets by the depth and number of days of inundation. In the case of paddy rice, however, damage varies greatly depending on the growth stage, so understanding the rice growth stage and the timing of flooding is important. For example, Minagawa et al. [
8] proposed a damage estimation method using a paddy rice yield reduction scale based on flooding tests and yield surveys.
To increase the number of farmers who will cooperate with flood control projects by allowing use of their fields, it is essential to conduct more precise quantitative evaluations and obtain more detailed data. However, microtopography survey data to prevent flooding of houses around fields are lacking, and enhancing the spatial resolution of numerical models increases computational costs.
In this study, we examine the possibility of proactive floodwater diversion to fields via backwater in numerical experiments using multiple elevation data products with different spatial resolutions and explore the optimal timing of water diversion from the perspective of crop calendars.
2. Outline of the Study Area
2.1. Jinzu River Basin
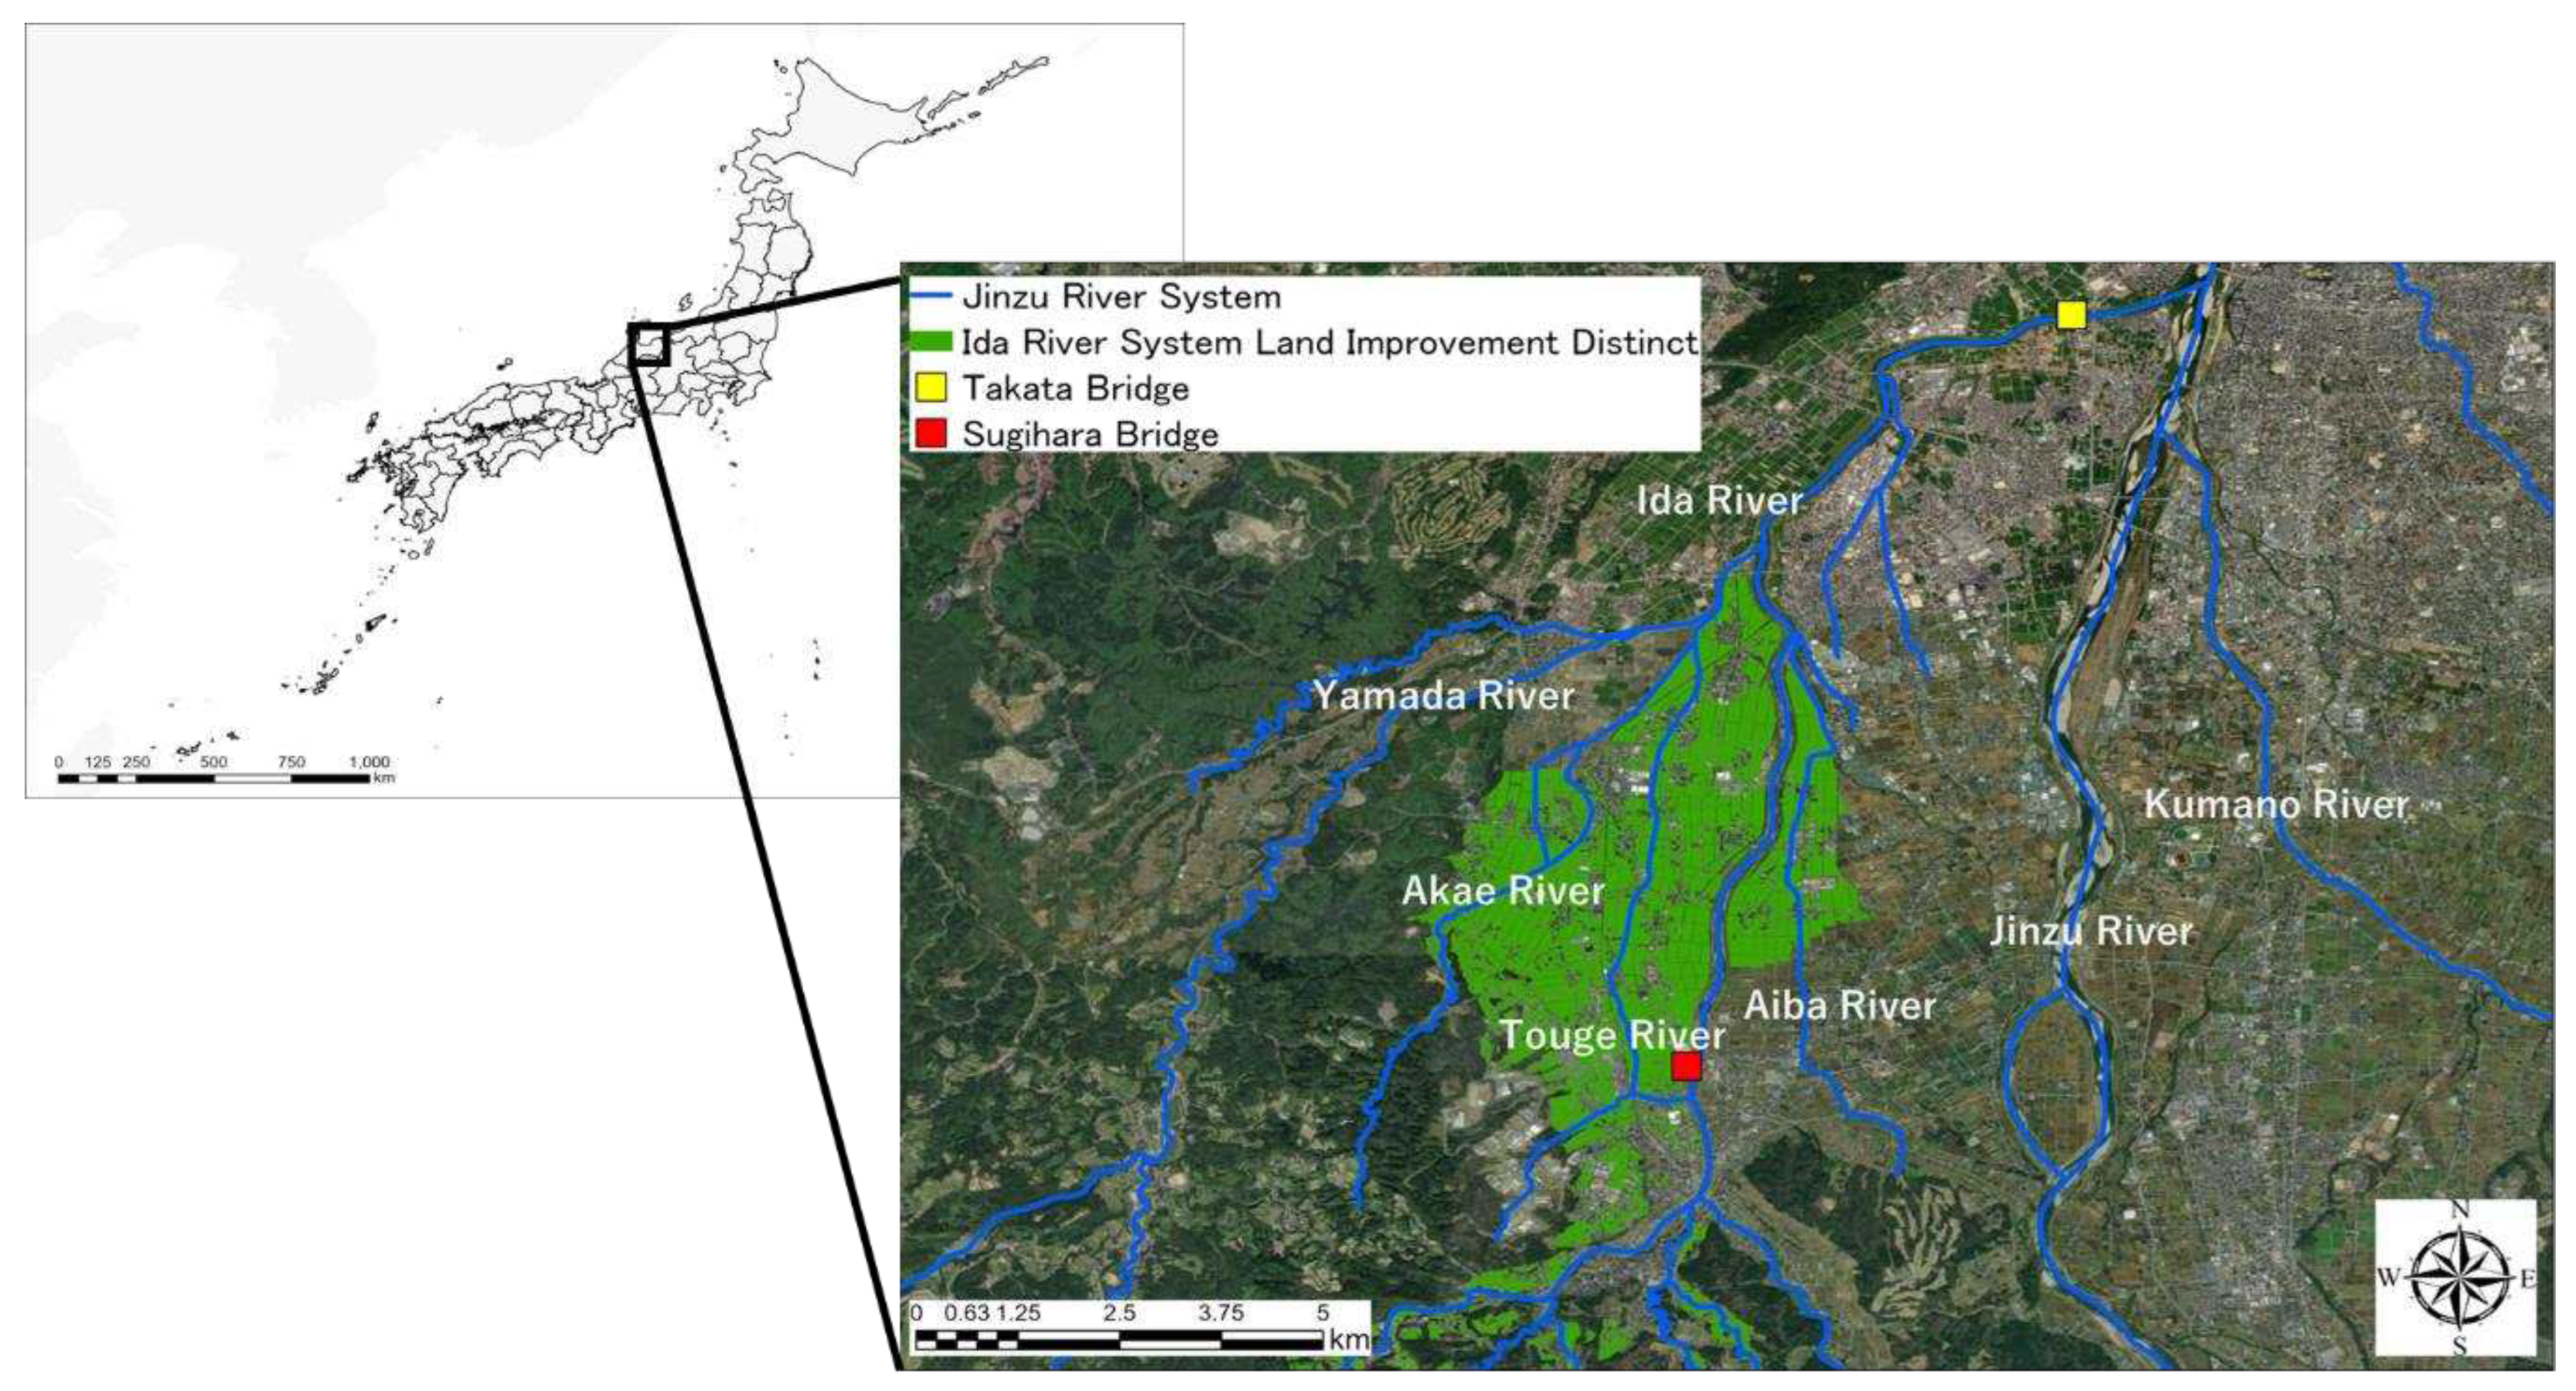
This study targeted the Ida River System Land Improvement District, which has beneficiary lands on both banks of the Ida River, one of the tributaries of the class A Jinzu River that flows through Toyama and Gifu Prefectures in the Hokuriku and Chubu Regions of Japan.
Figure 1 shows the study area. The Ida River is a class A river with a trunk channel extending about 48.4 km and a basin area of about 407.1 km
2, flowing through the Toyama Plain and joining the Jinzu River.
The Jinzu River basin is divided into upper, middle, and lower reaches, with the Hida Plateau spreading out in the upper reaches and steep terrain and river terraces characterizing the lower reaches. In the middle reaches, there are low mountains and valleys, and in the lower reaches, the Jinzu and Joganji Rivers form a fan-shaped complex where the Toyama Plain spreads out [
9]. The riverbed gradient is approximately 1/20–1/150 in the upper reaches, 1/150–1/250 in the middle reaches, and 1/250 to nearly horizontal in the lower reaches; although the gradient becomes more moderate at the river mouth, it is nevertheless one of the steepest rivers in Japan. The geology of the river basin includes the Hida Metamorphic Belt, which forms the foundation of the Japanese Islands, and sedimentary and igneous rocks of the Paleozoic and Mesozoic eras in the upper reaches. The hills in the middle reaches are composed of Neogene strata, while the plateau and plains in the lower reaches are composed of Pleistocene and Alluvial strata [
9].
The climate of the Jinzu River basin is classified as “Sea of Japan side climate” in the lower reaches and “Inland climate zone” in the upper reaches. The lower reaches have high summer temperatures, heavy winter snowfall, and an average annual precipitation of 2,200~2,500 mm. Although there are several irrigation dams on the Jinzu River, there are no flood control dams on the main Jinzu River branch, so flood control measures can only be implemented through the river channel. As a result, flood damage has occurred in the Jinzu River basin in the past. In 1969, the piers of the Toyama Bridge sank, and the bridge was closed when the Jinzu River rose. In 2004, 2006, and 2014, heavy rains caused by typhoons flooded houses. In 2004, there were heavy rains caused by a typhoon in the Jinzu River basin, and rainfall and water level observatories in the basin recorded the heaviest rainfall ever observed. The Kawakami River, an upstream tributary, broke its banks, and the confluence of the Jinzu and Ida Rivers also suffered damage from inland flooding. According to the Toyama City Hazard Map [
10], inundation can cover a large area of the watersheds of the Ida and Yamada Rivers, which are the target of this study, with the basic assumption of inundation by rainfall occurring once every 30–150 years. Inundation of 5.0–10.0 m is assumed at the confluence of the Ida and Yamada Rivers, making the Jinzu River Basin a high-risk area for flood damage.
2.2. Land Improvement District
Land improvement districts are public corporations established with the approval of the prefectural governor based on the provisions of the Land Improvement Law [
11]. Such districts are responsible for projects involving the construction of new, or altering existing, agricultural drainage and irrigation channels, improving farmland, and maintaining and managing facilities created by land improvement projects. Land improvement districts support Japanese agriculture through land improvement projects. In addition, by managing agricultural reservoirs and irrigation/drainage channels properly, they perform multifaceted functions such as providing water for fire prevention and ecosystem preservation and contribute greatly to agricultural production while maintaining and preserving a good rural environment [
11].
In Japan, based on the volume of water withdrawn in 2019, water usage was approximately 78.5 billion m
3. Of this, about 53.3 billion m
3, approximately 68% of the total, was used for agricultural purposes [
12]. The total length of major irrigation and drainage channels is 40,000 km, which is approximately four times the total length of Japan’s class A rivers, and together with the terminal waterways forms a 400,000-km network [
13].
Water rights for agricultural use in Japan are classified into permitted water rights granted by river administrators based on the River Law and conventional water rights granted based on recognition of the fact that water has been extracted and used legitimately since before the enactment of the River Law [
14]. Permitted water rights specify details such as the maximum volume of water permitted per period and the total annual volume allowed according to water usage regulations. For agricultural water usage, the necessary water volume is reassessed during the renewal process every 10 years. Conventional water rights have been gradually converted into permitted water rights, although some minor rights remain.
Another characteristic of Japanese agriculture is that irrigation and drainage systems are separate. There are various methods for irrigating paddy fields, including “kakenagashi”, in which water flows over the field continuously. Other methods involve a combination of irrigation and drainage using channels, or separating irrigation and drainage channels. These methods are used in accordance with the local conditions, taking advantage of their respective features. Separate irrigation and drainage systems prevent the mixing of wastewater, preserving water quality. This also eliminates sunken areas in the water channels, which has advantages. In recent years, this approach has been adopted in many regions [
15].
The Ida River System Land Improvement District was established in February 2016 and comprises 12.6 km2 of beneficiary land centered on Toyama, Toyama Prefecture. It has about 1,600 members. The irrigation and drainage system of this land improvement district is based on separate systems for irrigation and drainage. The district has facilities such as the Ida River headworks (irrigated area = 473 ha) and Ishido water intake (irrigated area = 139 ha) and maintains and manages these facilities. In recent years, efforts have been made to use the irrigation channels within the improvement district for small-scale hydroelectric power generation. The electricity generated is used to operate agricultural water supply facilities and is also sold to reduce maintenance costs for land improvement facilities.
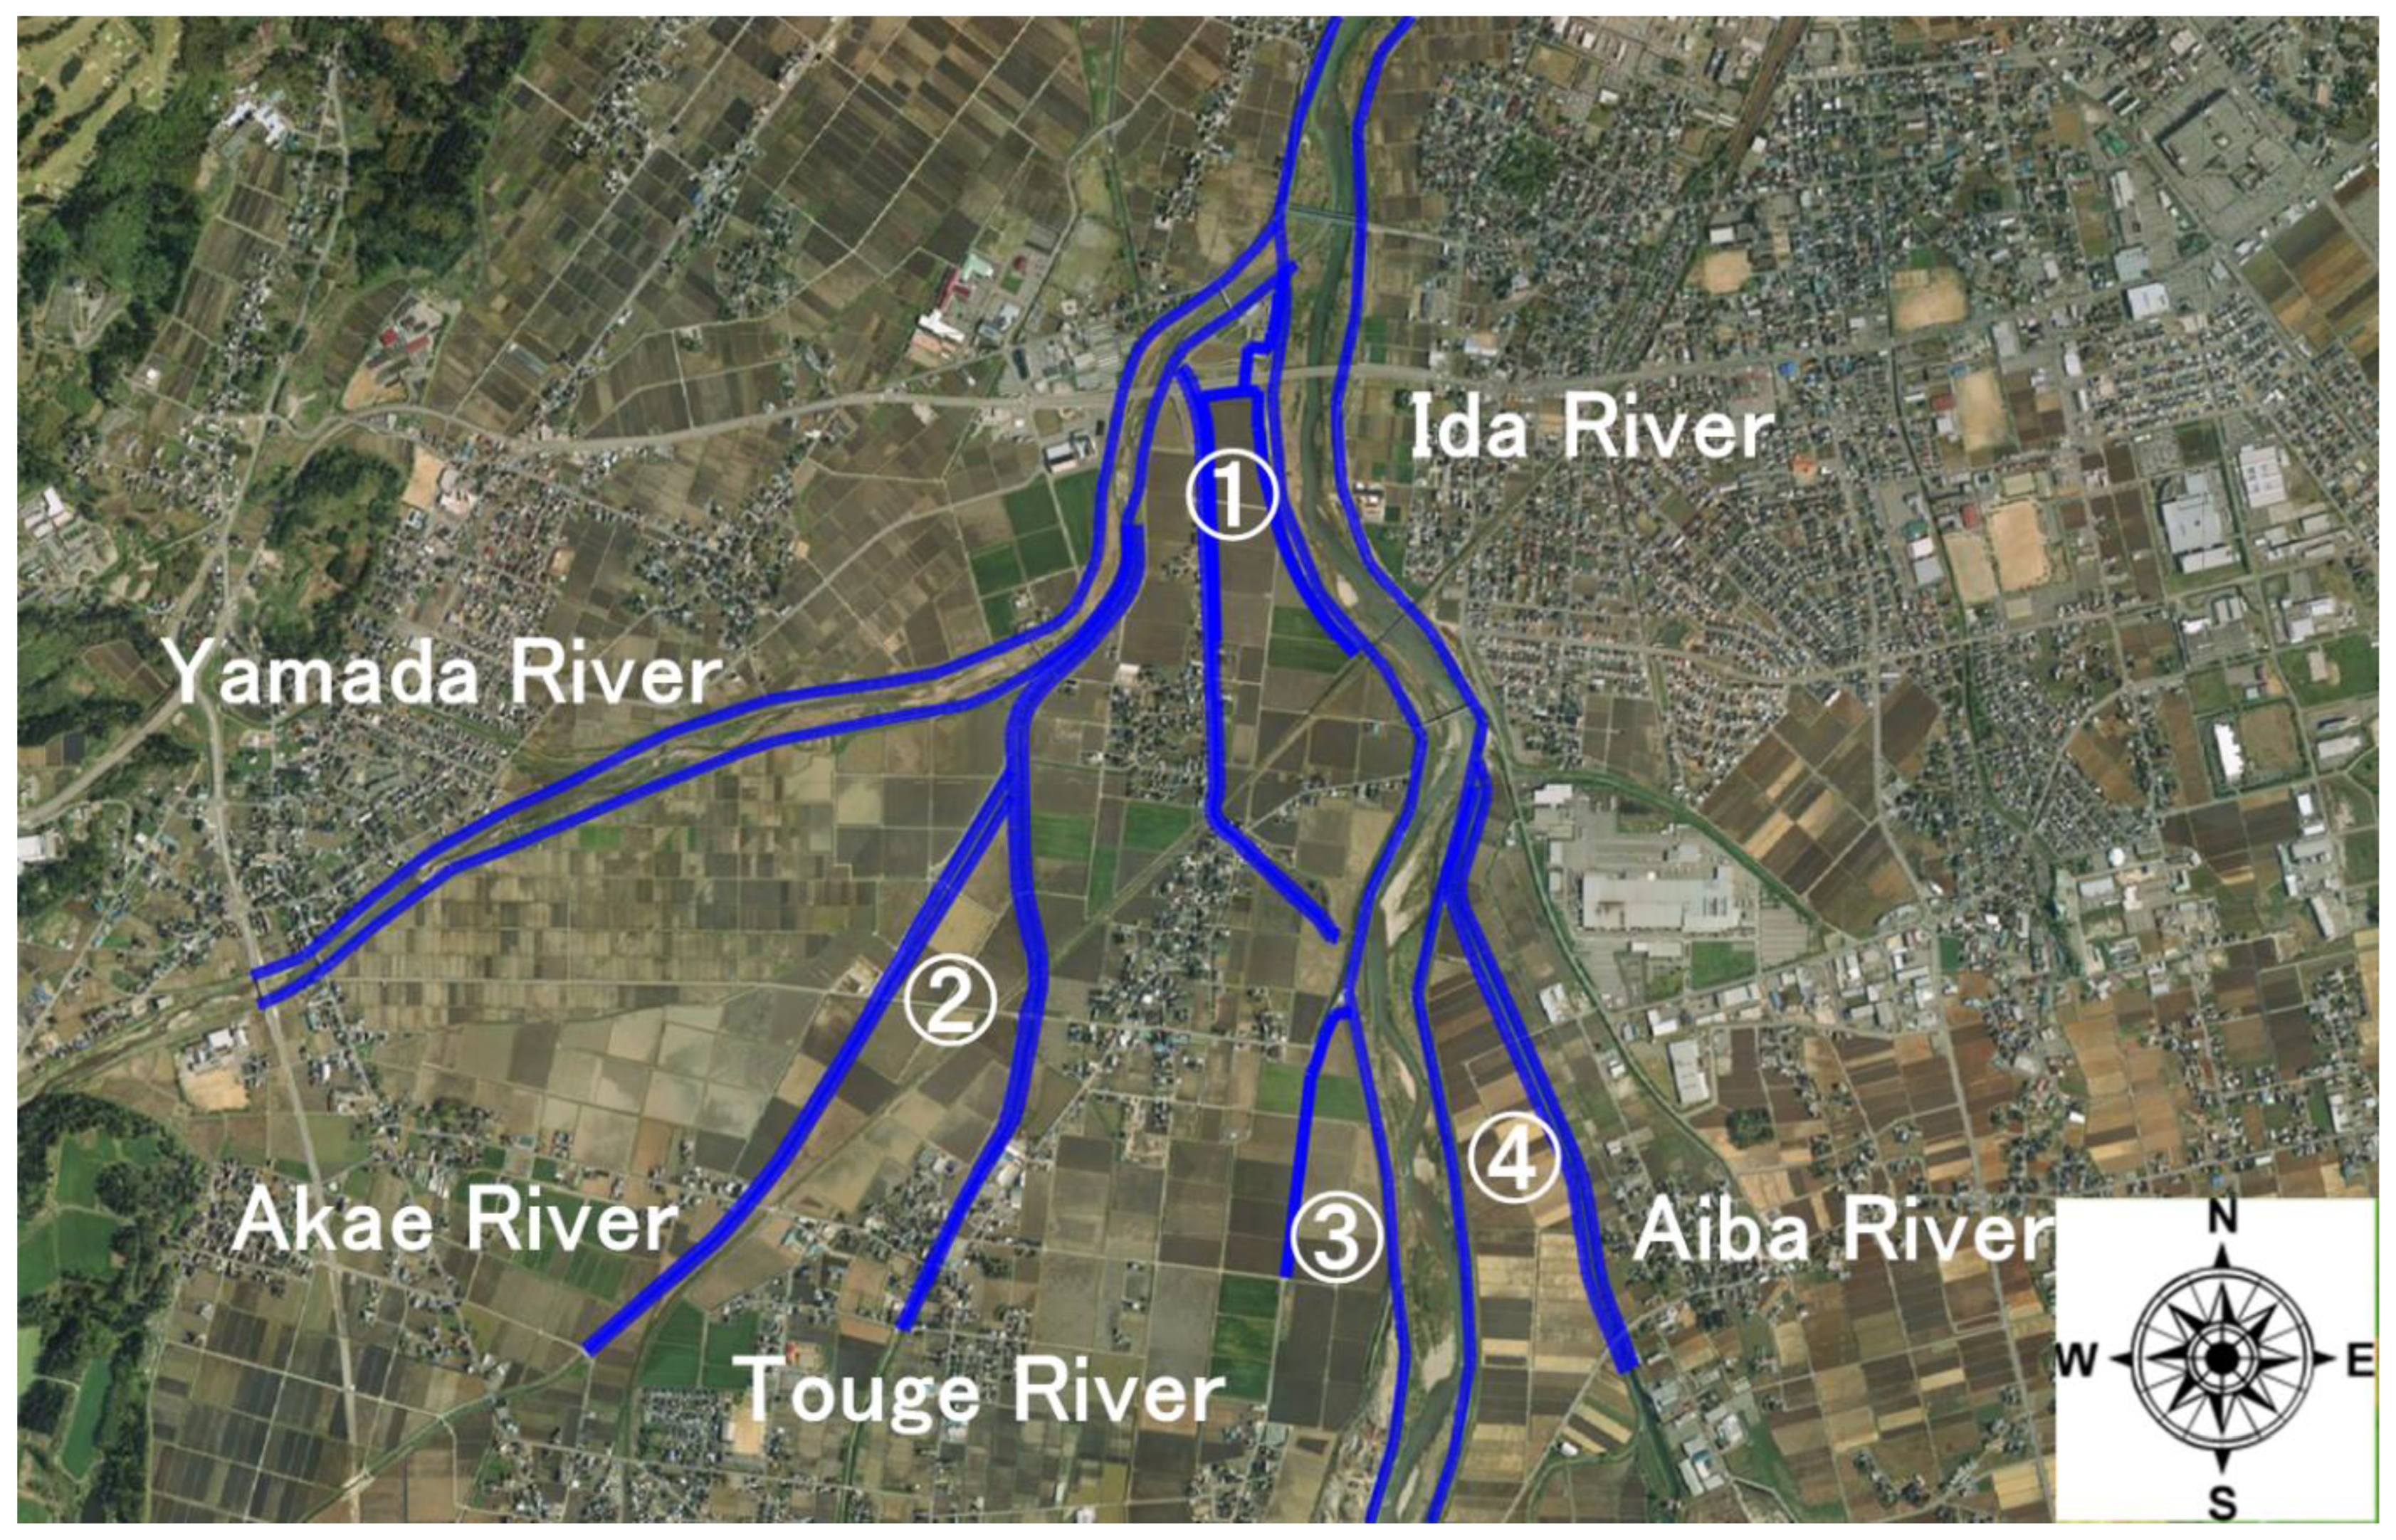
Figure 2 shows the rivers, drainage channels, and four candidate sites for flood water diversion (➀–➃). The target rivers are the Ida, Aiba, Yamada, Akae, and Toge Rivers, and the irrigation and drainage channels that run through the land improvement district. At the confluence of drainage channels with rivers (➀–➂), sluice gates are installed to prevent backflow into the drainage channels when the river water level rises.
3. Research Methods
3.1. Numerical Experiment
The ground data for the watershed and flood-prone areas were obtained using the Fundamental Geospatial Data Digital Elevation Model (5-m resolution) of the Geospatial Information Authority of Japan and high-resolution LP (Laser Profiler) survey data (1-m resolution) provided by Toyama Prefecture.
Table 1 shows the elevation data products used in this study. To validate the accuracy of various topographic data, the research team collected photogrammetric data (with a resolution of 2 cm) and used real-time kinematic (RTK) surveys of the actual target area.
In the numerical experiments, the analysis area was set within the target area, and a mesh of approximately 5 m was created for the analysis. Since the point density of the LP data is inconstant, it was necessary to create a digital elevation model (DEM) for the numerical experiments. To do so, first, a TIN (Triangulated Irregular Network) was created from the LP ground data, and the TIN was converted into a raster. The raster was then converted into points, and the point data were averaged and aggregated on the analysis mesh to create a DEM of approximately 5 m. The calculation results were compared between the 5mDEM and the 5mDEM derived from the LP survey (“LP-derived approximately 5mDEM”).
For the Ida River, which is managed by the national government, we used the 2016 periodic cross-sectional survey data provided by the MLIT. The management of other rivers is entrusted to the prefectural government, and there is very little river channel data for rivers managed by the prefectural government. Therefore, river channel models were created based on the 5mDEM and LP survey data provided by the Geospatial Information Authority of Japan (GSI) for the Aiba and Yamada Rivers, which have relatively wide channels among the small and medium-sized rivers. For the Akae and Toge Rivers, which have narrow channels, river channel models were created based on RTK-GPS survey data. For the irrigation and drainage channels, river channel models were created based on the specification data, including the length and height of the irrigation and drainage channels provided by the land improvement district. This process involved direct on-site verification using RTK-GPS data in conjunction with the Fundamental Geospatial Data of the GSI. For the irrigation and drainage channels, river channel models were created based on various data provided by the land improvement districts, such as channel length and height, and through direct confirmation in the field using the Fundamental Geospatial Data Digital Elevation Model of the GSI and RTK-GPS.
This study used DioVISTA Flood Professional software provided by Hitachi Power Solutions [
16]. It allows coupled calculations of distributed runoff, one-dimensional unsteady flow, and two-dimensional unsteady flow. The computation covered a 24-hour period, and the computational grid was 5 m. It is important to note that for this numerical experiment, the calculations did not consider the sluice gates in the drainage channels.
3.2. Computational Conditions
For the boundary conditions of the numerical experiments, pseudo-hydrographs were applied at the upstream end of each river because some of the rivers studied lacked basic river improvement policies and plans, and information on planned high water flow rates, etc., could not be obtained. Equation (1) was used to create the pseudo-hydrograph:
where
(m
3/s),
(m
3/s),
time (h),
peak time (h),and
curvature (
).
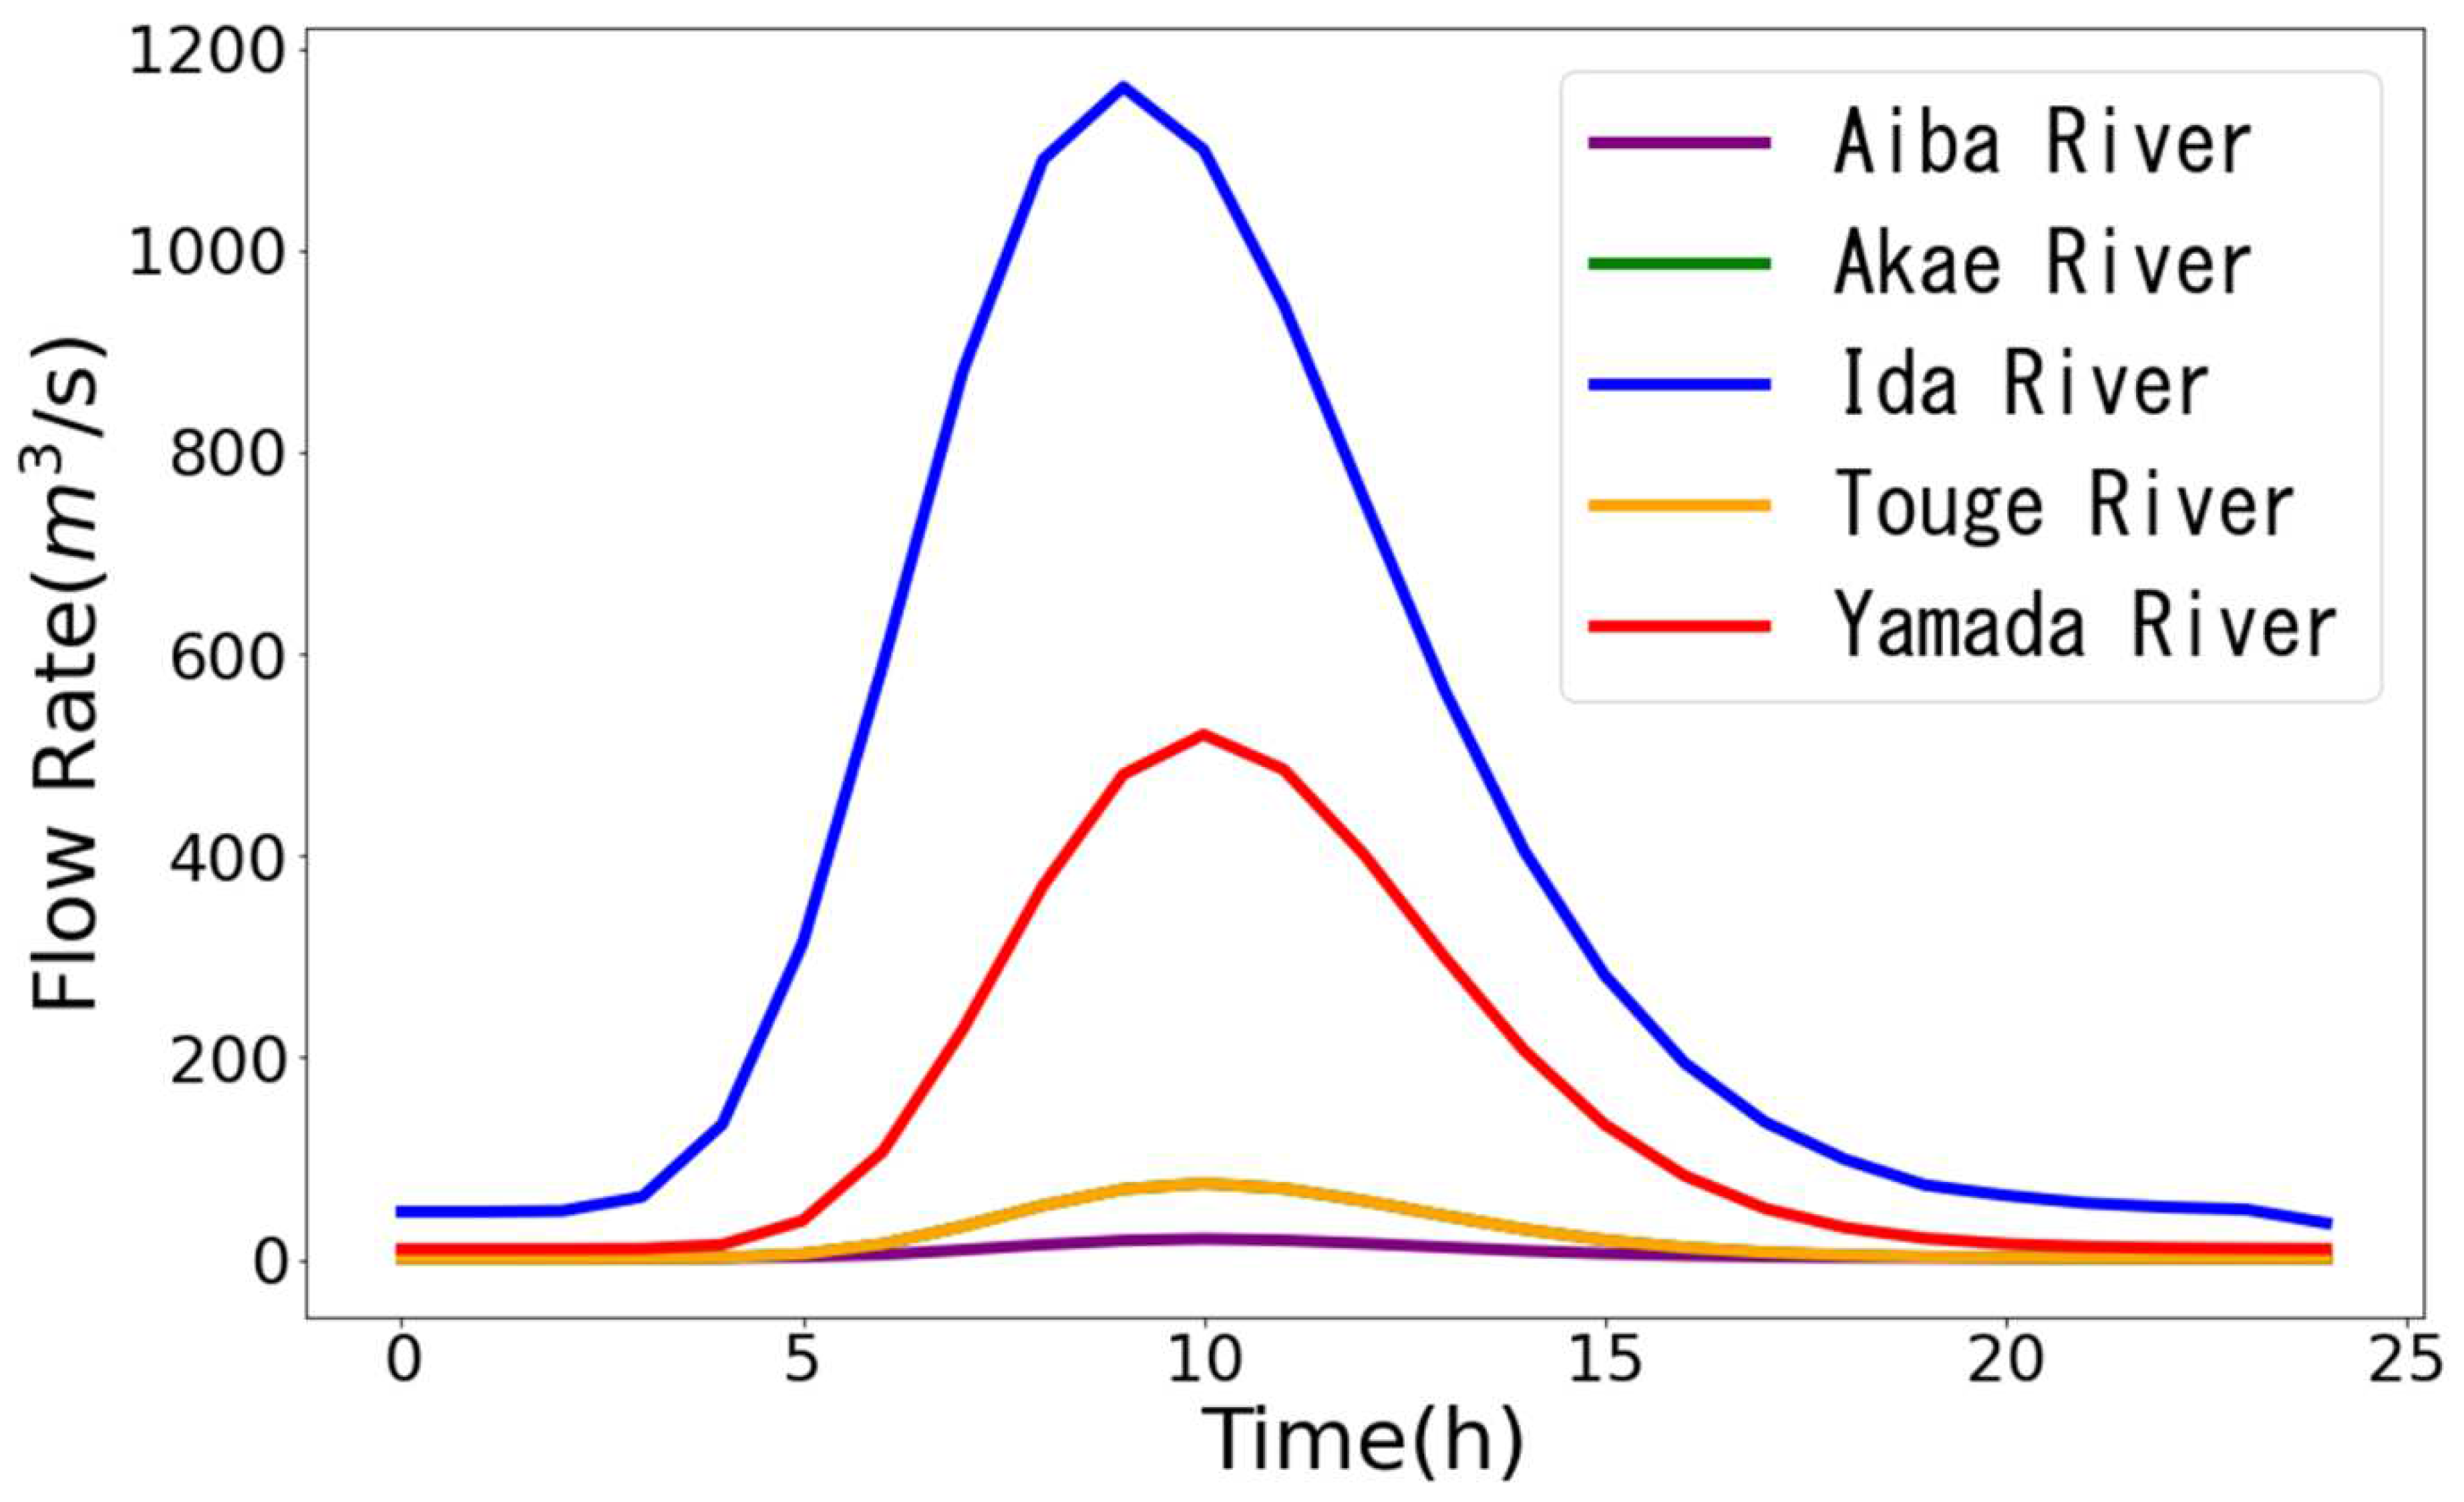
Figure 3 shows the hydrographs in this numerical experiment, and
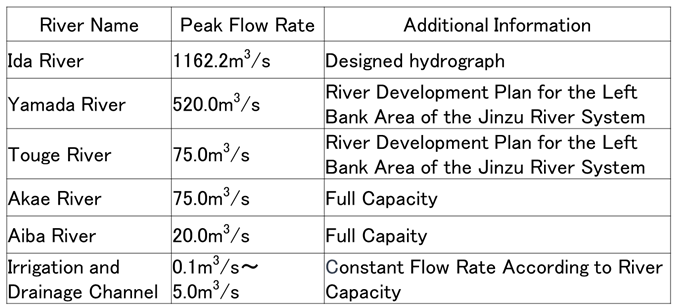
Table 2 shows the peak flow rates and settings for each river. For the Ida River, the peak flow rate of the planned hydrograph at the Sugihara Bridge on the Ida River provided by the MLIT was set as the peak flow rate of the pseudo-hydrograph. For the Yamada and Toge Rivers, the planned high water flow rate described in the River Development Plan for the Left Bank Area of the Jinzu River System [
17] was set as the peak flow rate. For the Aiba and Akae Rivers, the peak flows were set to 20 and 75 m
3/s, respectively, estimated from the river channel cross-sections prepared in the previous section, because neither basic policy for river improvement nor a river improvement plan has yet been formulated. For the irrigation and drainage channels, the constant flow rate was 0.1–5.0 m
3/s, depending on the capacity of each channel. In this study, assuming the worst-case scenario, the peak times were adjusted so that the peak flows of all rivers overlapped at the confluence of the Ida and Yamada Rivers to give a pseudo-hydrograph.
3.3. Crop Calendar
Crop calendars are indispensable for agricultural activities, such as planting and harvesting, water management, and fertilizer application, and they differ by region, crop, and variety. In this study, we referred to the Aoba Rice Cultivation Handbook prepared by JA Aoba [
18], which covers the target area. We examined the crop calendar based on previous studies and interviews with land improvement districts.
4. Results and Discussions
4.1. Comparison of Elevation Data Products
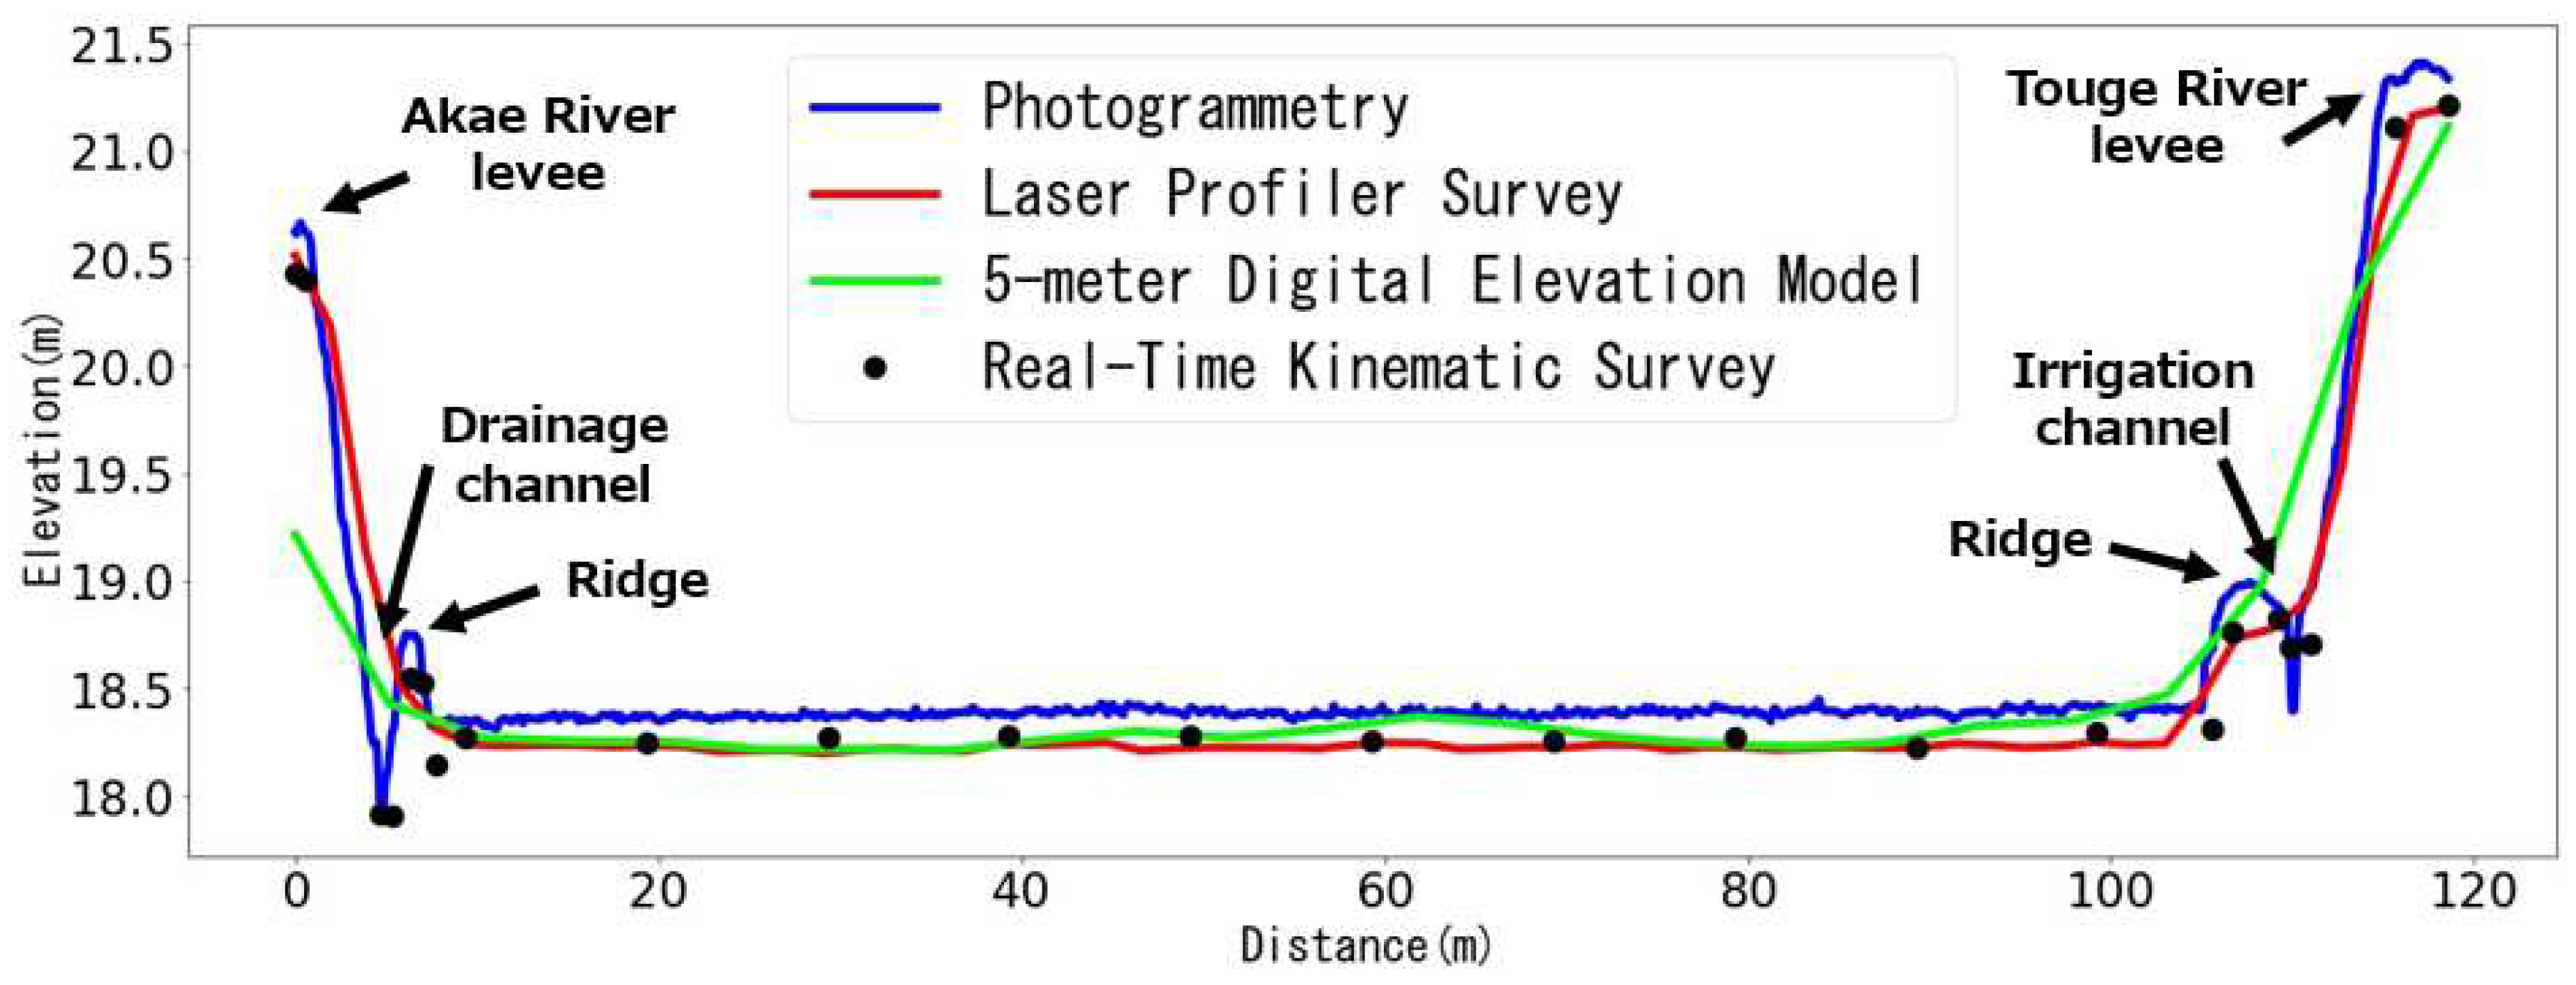
Figure 4 compares survey data for a cross-section at a candidate flood diversion site. In this study, RTK surveying was conducted at approximately 10-m intervals, and the RTK survey conducted in the field was assumed to provide the true values. The comparison shows that the 5mDEM data differ by > 1.0 m from the RTK-measured embankment height of the Akae River, which is a small- to medium-sized river, and the 5mDEM value for the height of the embankment of a small- to medium-sized river was not captured. The LP survey captures the bank heights of small- and medium-sized rivers with an accuracy of within 10 cm. However, LP data cannot capture the microtopography or structures around the fields, such as drainage channels and irrigation ditches with a width of < 50 cm. The photogrammetric data include aspects of microtopography, such as drainage channels and the height of footpaths. However, the values within the field are affected by the timing of image capture, and are about 10 cm higher than the RTK, 5mDEM, and LP data. Note that both the LP and photogrammetry data are affected by crops and other factors depending on the timing of image capture.
4.2. Results of Numerical Experiments
The numerical experiments examined two cases using a 5mDEM and LP-derived approximately 5mDEM.
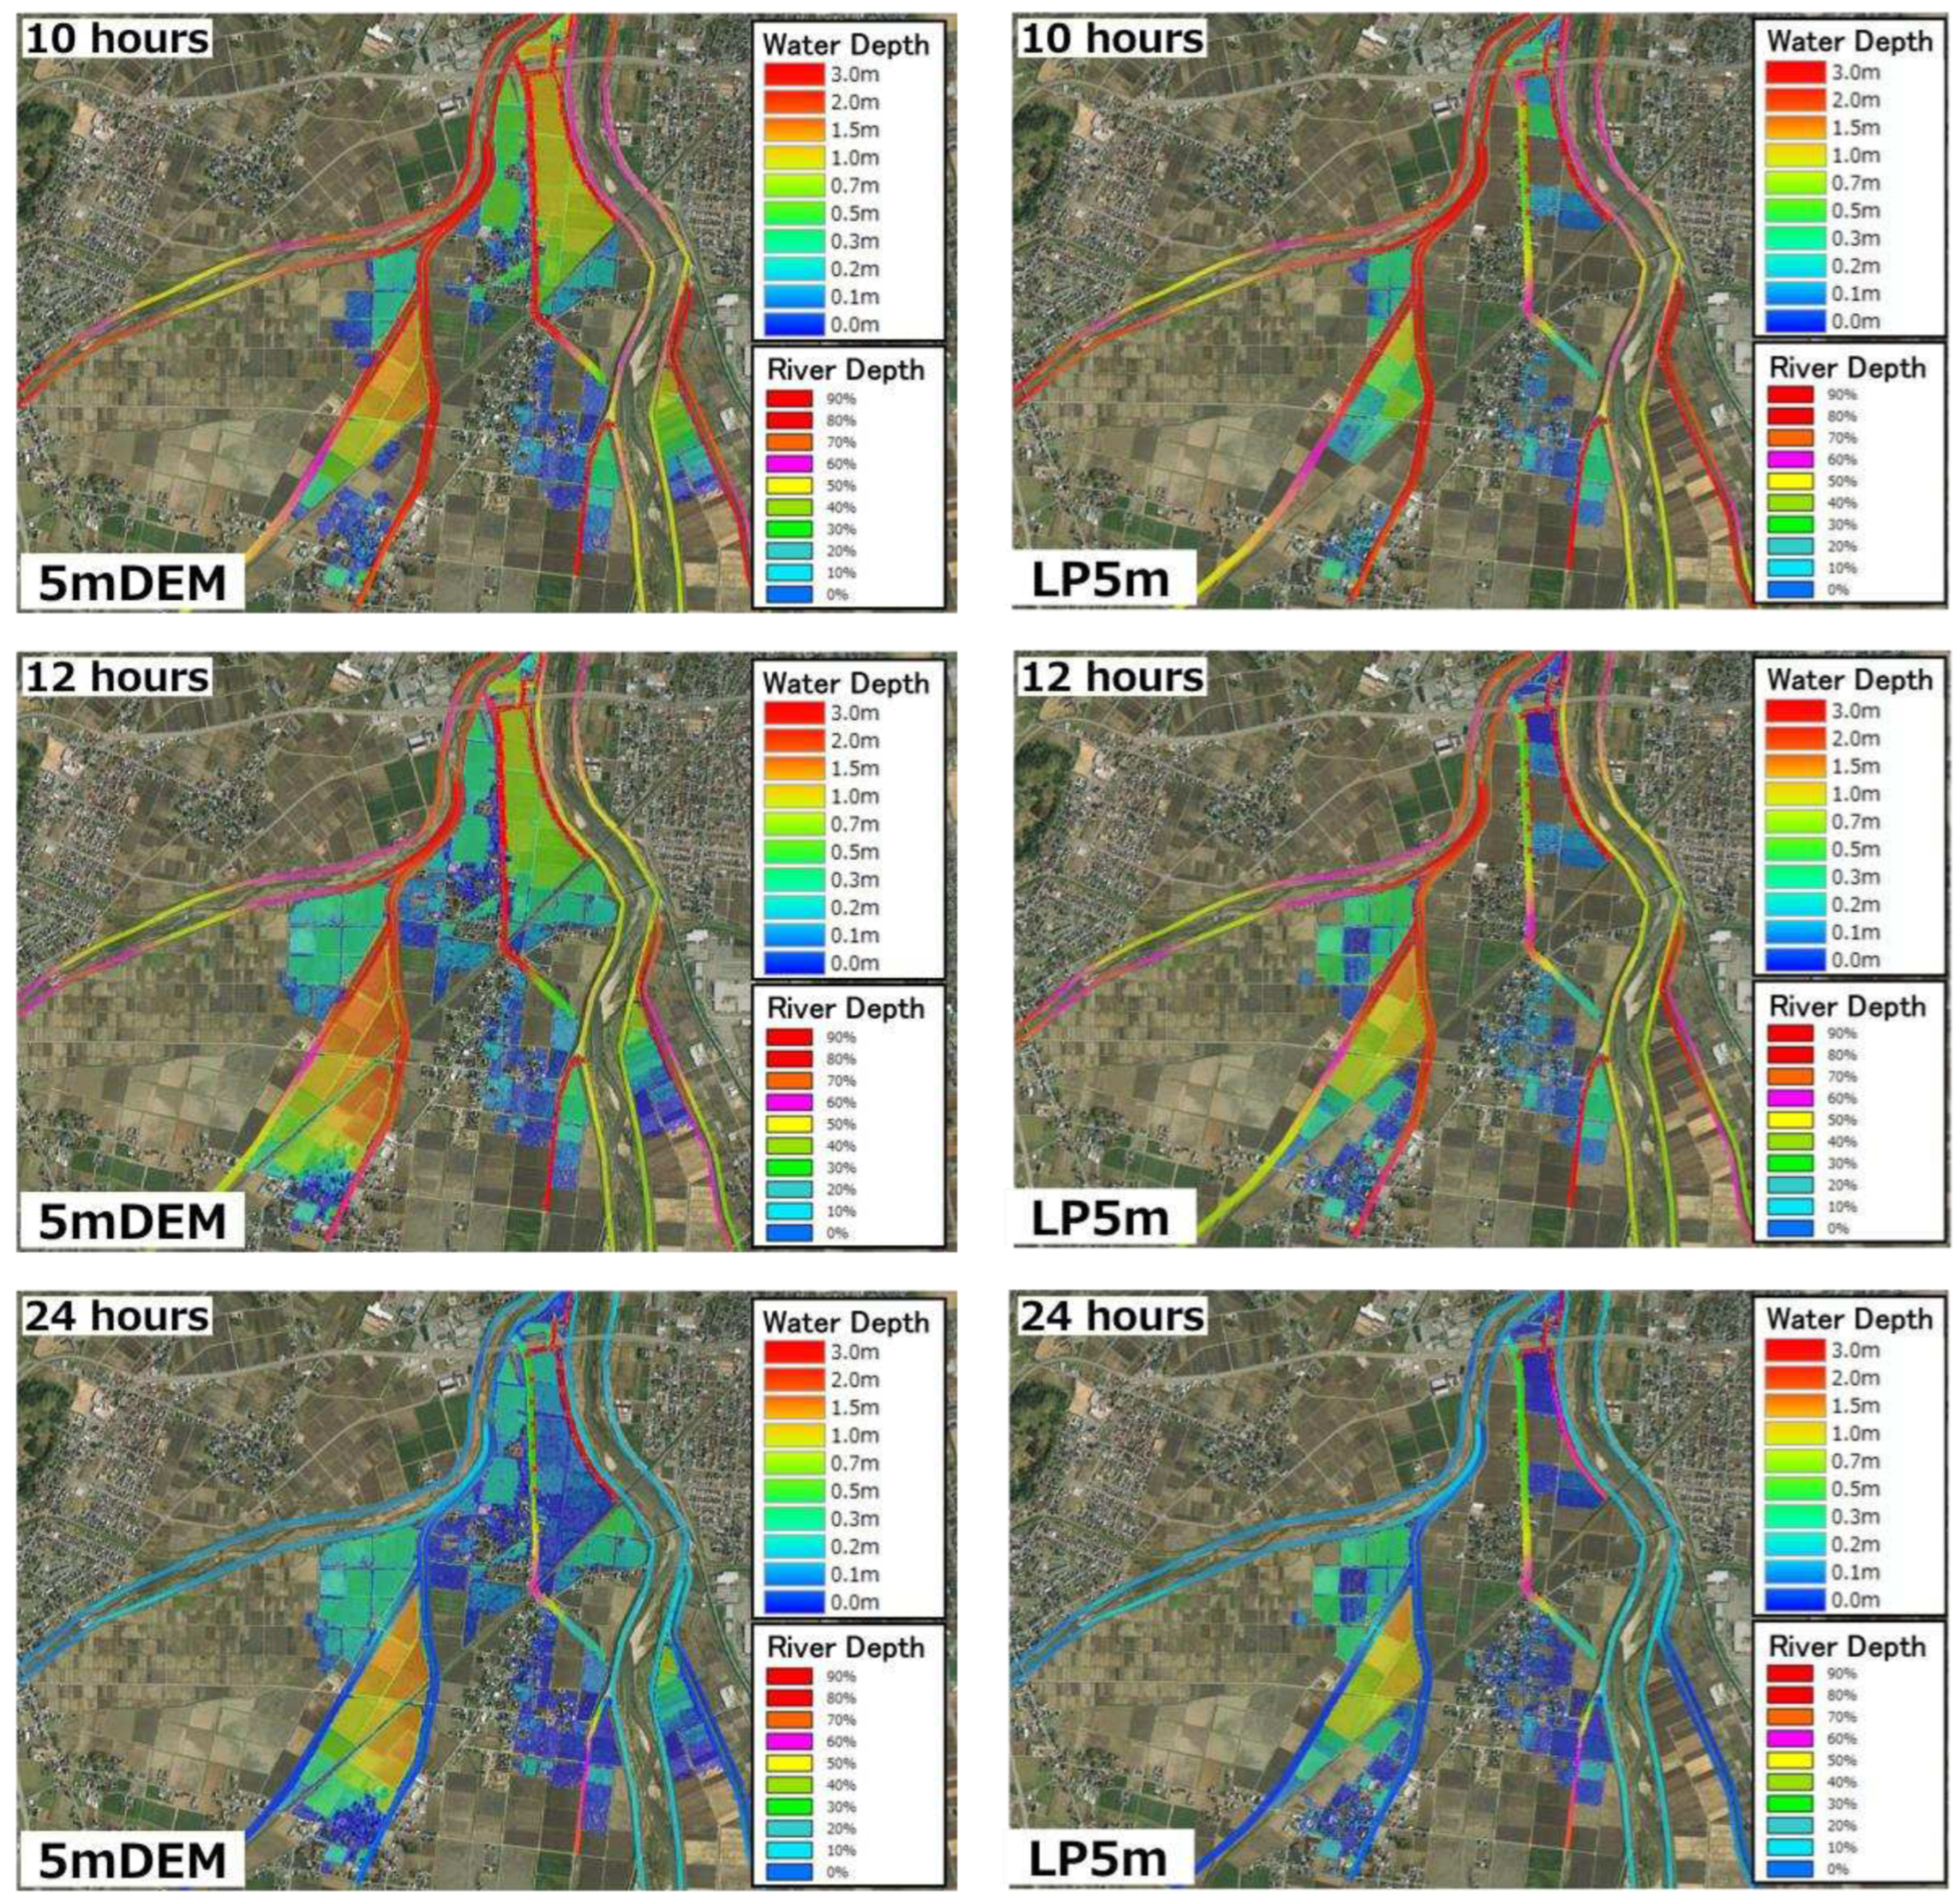
Figure 5 shows the distribution of inundation depth at 8, 10, 12, and 24 hours after the start of the simulation obtained from the 5mDEM and LP-derived approximately 5mDEM.
Figure 6 shows the distribution of the maximum inundation depth obtained from the numerical experiments, and
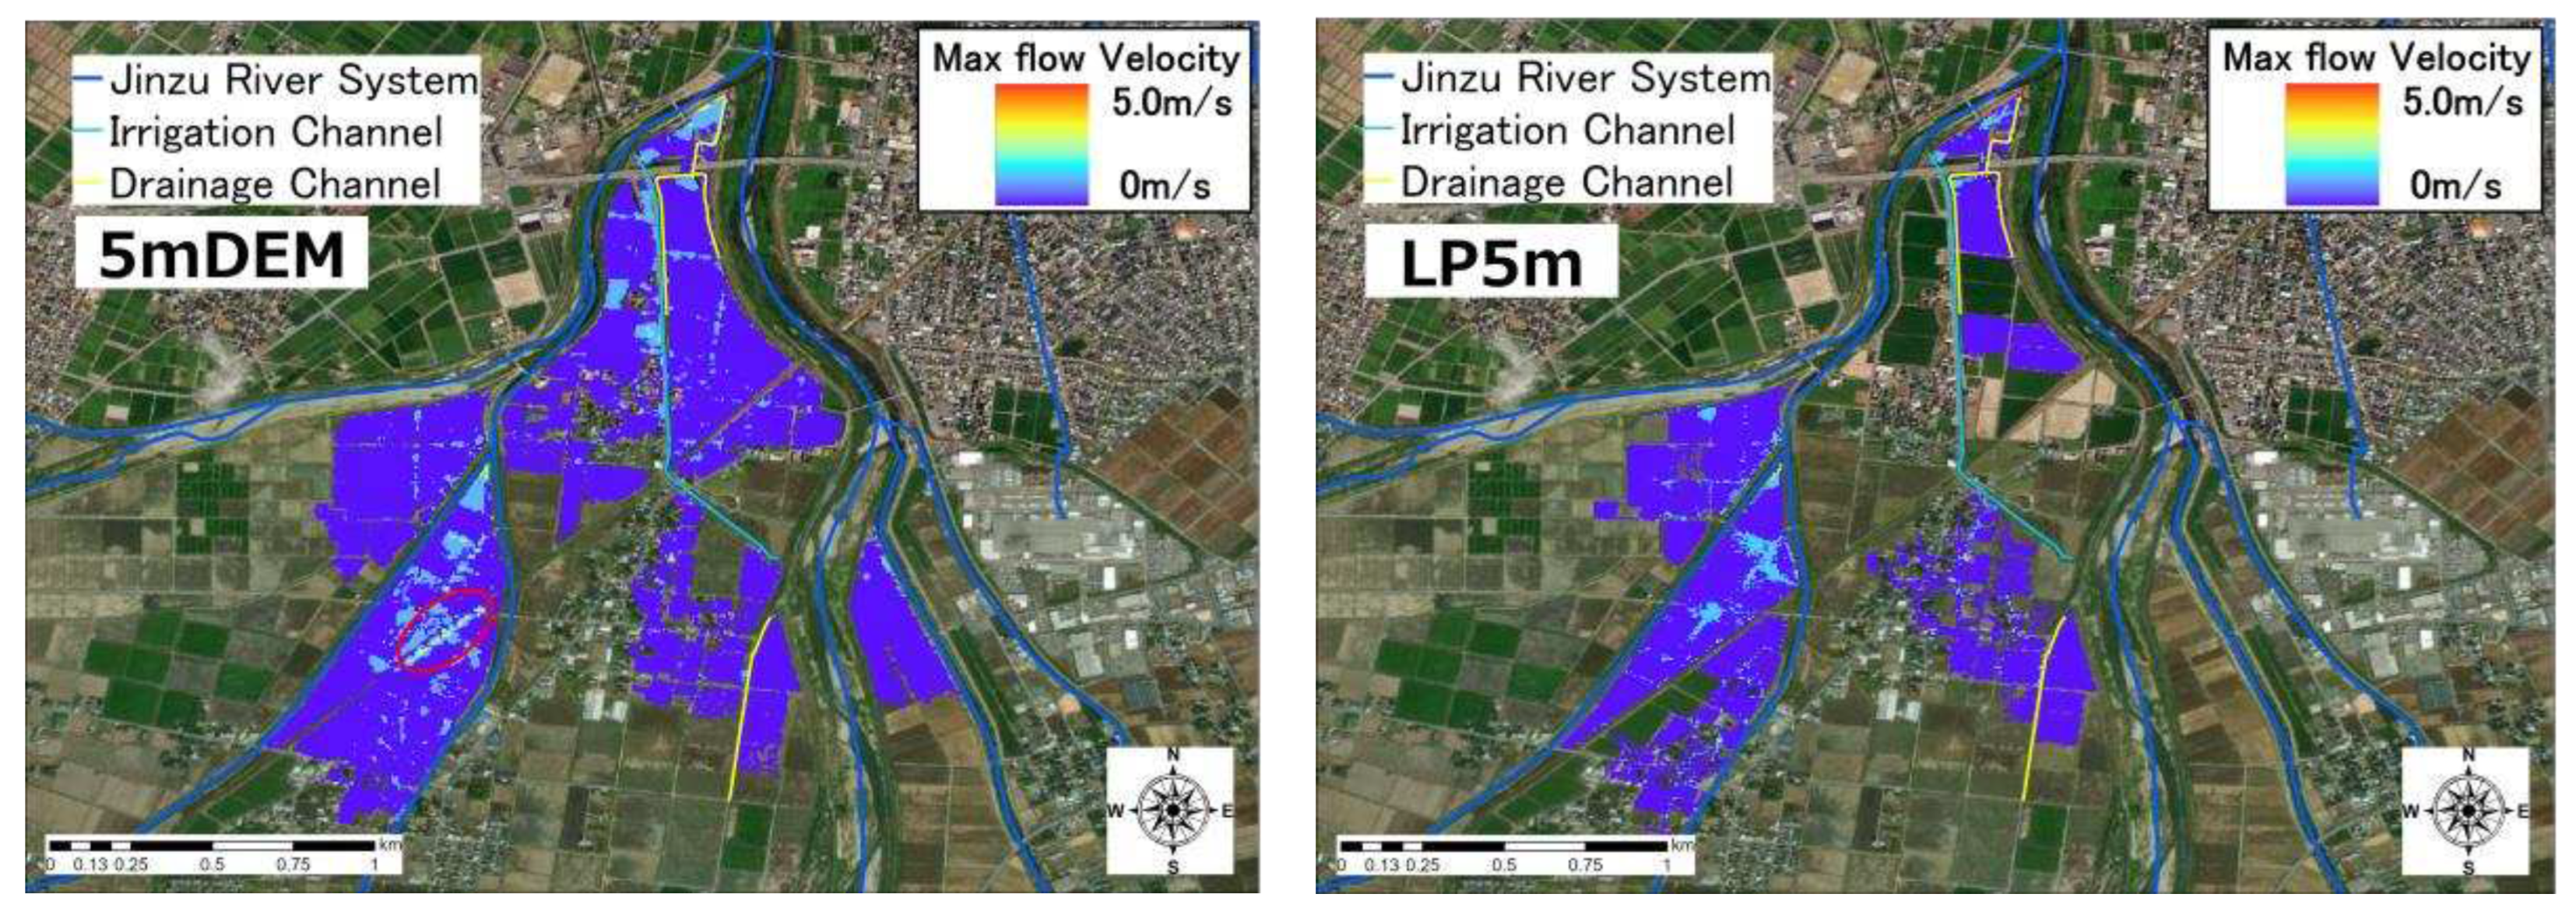
Figure 7 shows the distribution of the maximum flow velocities. The maximum inundation area and volume calculated using the 5mDEM were approximately 1.0 km
2 and 710,000 m
3, respectively. In comparison, the maximum inundated area and water volume using the LP-derived approximately 5mDEM were approximately 0.5 km
2 and 240,000 m
3, respectively.
In the area near the confluence of the Ida and Yamada Rivers in the flood water diversion studied (candidate ➀), the drainage channel connected to the confluence overflowed and gradually flooded the fields of the beneficiary area from downstream. In the calculation using the 5mDEM, the inundation depth in the field was 1.0–1.5 m, indicating that the entire area in ➀ is extensively inundated. In comparison, with the calculation using the LP-derived approximately 5mDEM, the inundation depth within the field was 0.3–0.6 m, and the inundated area was significantly smaller than with the 5mDEM. The area in ➀ is a mixture of residential land and fields, and a detailed analysis such as this is appropriate. The flow velocity was < 1.0 m/s in the field, although the velocity was higher in some areas where there was a road or fill.
At the confluence of the Akae and Toge Rivers, in candidate flood water diversion site ➁, the water level of the Yamada River, which joins the rivers further downstream, rose, causing backwater in the Akae River and flooding from the river to the beneficiary area near the confluence. The maximum inundation depth in this area exceeded 2.0 m at the 5mDEM in the field bounded by the Akae and Toge Rivers. In comparison, for the LP-derived approximately 5mDEM, the maximum inundation depth exceeded 2.0 m in most downstream plots surrounded by the Akae and Toge Rivers, while the upstream plots were between 1.0 and 1.5 m. The maximum inundation depths in the upstream plots were between 1.0 and 1.5 m. The flow velocity is higher at the confluence of the Akae and Toge Rivers and in parts of the field. The higher flow velocity in the field is due to the undulations caused by the presence of a farm road. In the case of the 5m DEM, the inundation extends over the railroad track that runs through the area circled in red in
Figure 6 and into another field, resulting in high flow velocities near the track.
In the drainage channel in candidate flood management site ➂, the rising water level of the Ida River generates backwater, causing overflow on both banks of the drainage channel. The maximum inundation depth in the field is < 0.5 m.
At the confluence of the Aiba and Ida Rivers in candidate floodway area ➃, backwater occurs in the Aiba River, and flooding occurs in the field. This area is flooded only according to the 5mDEM. In addition, there are areas where the flow velocity is greater along the Aiba River.
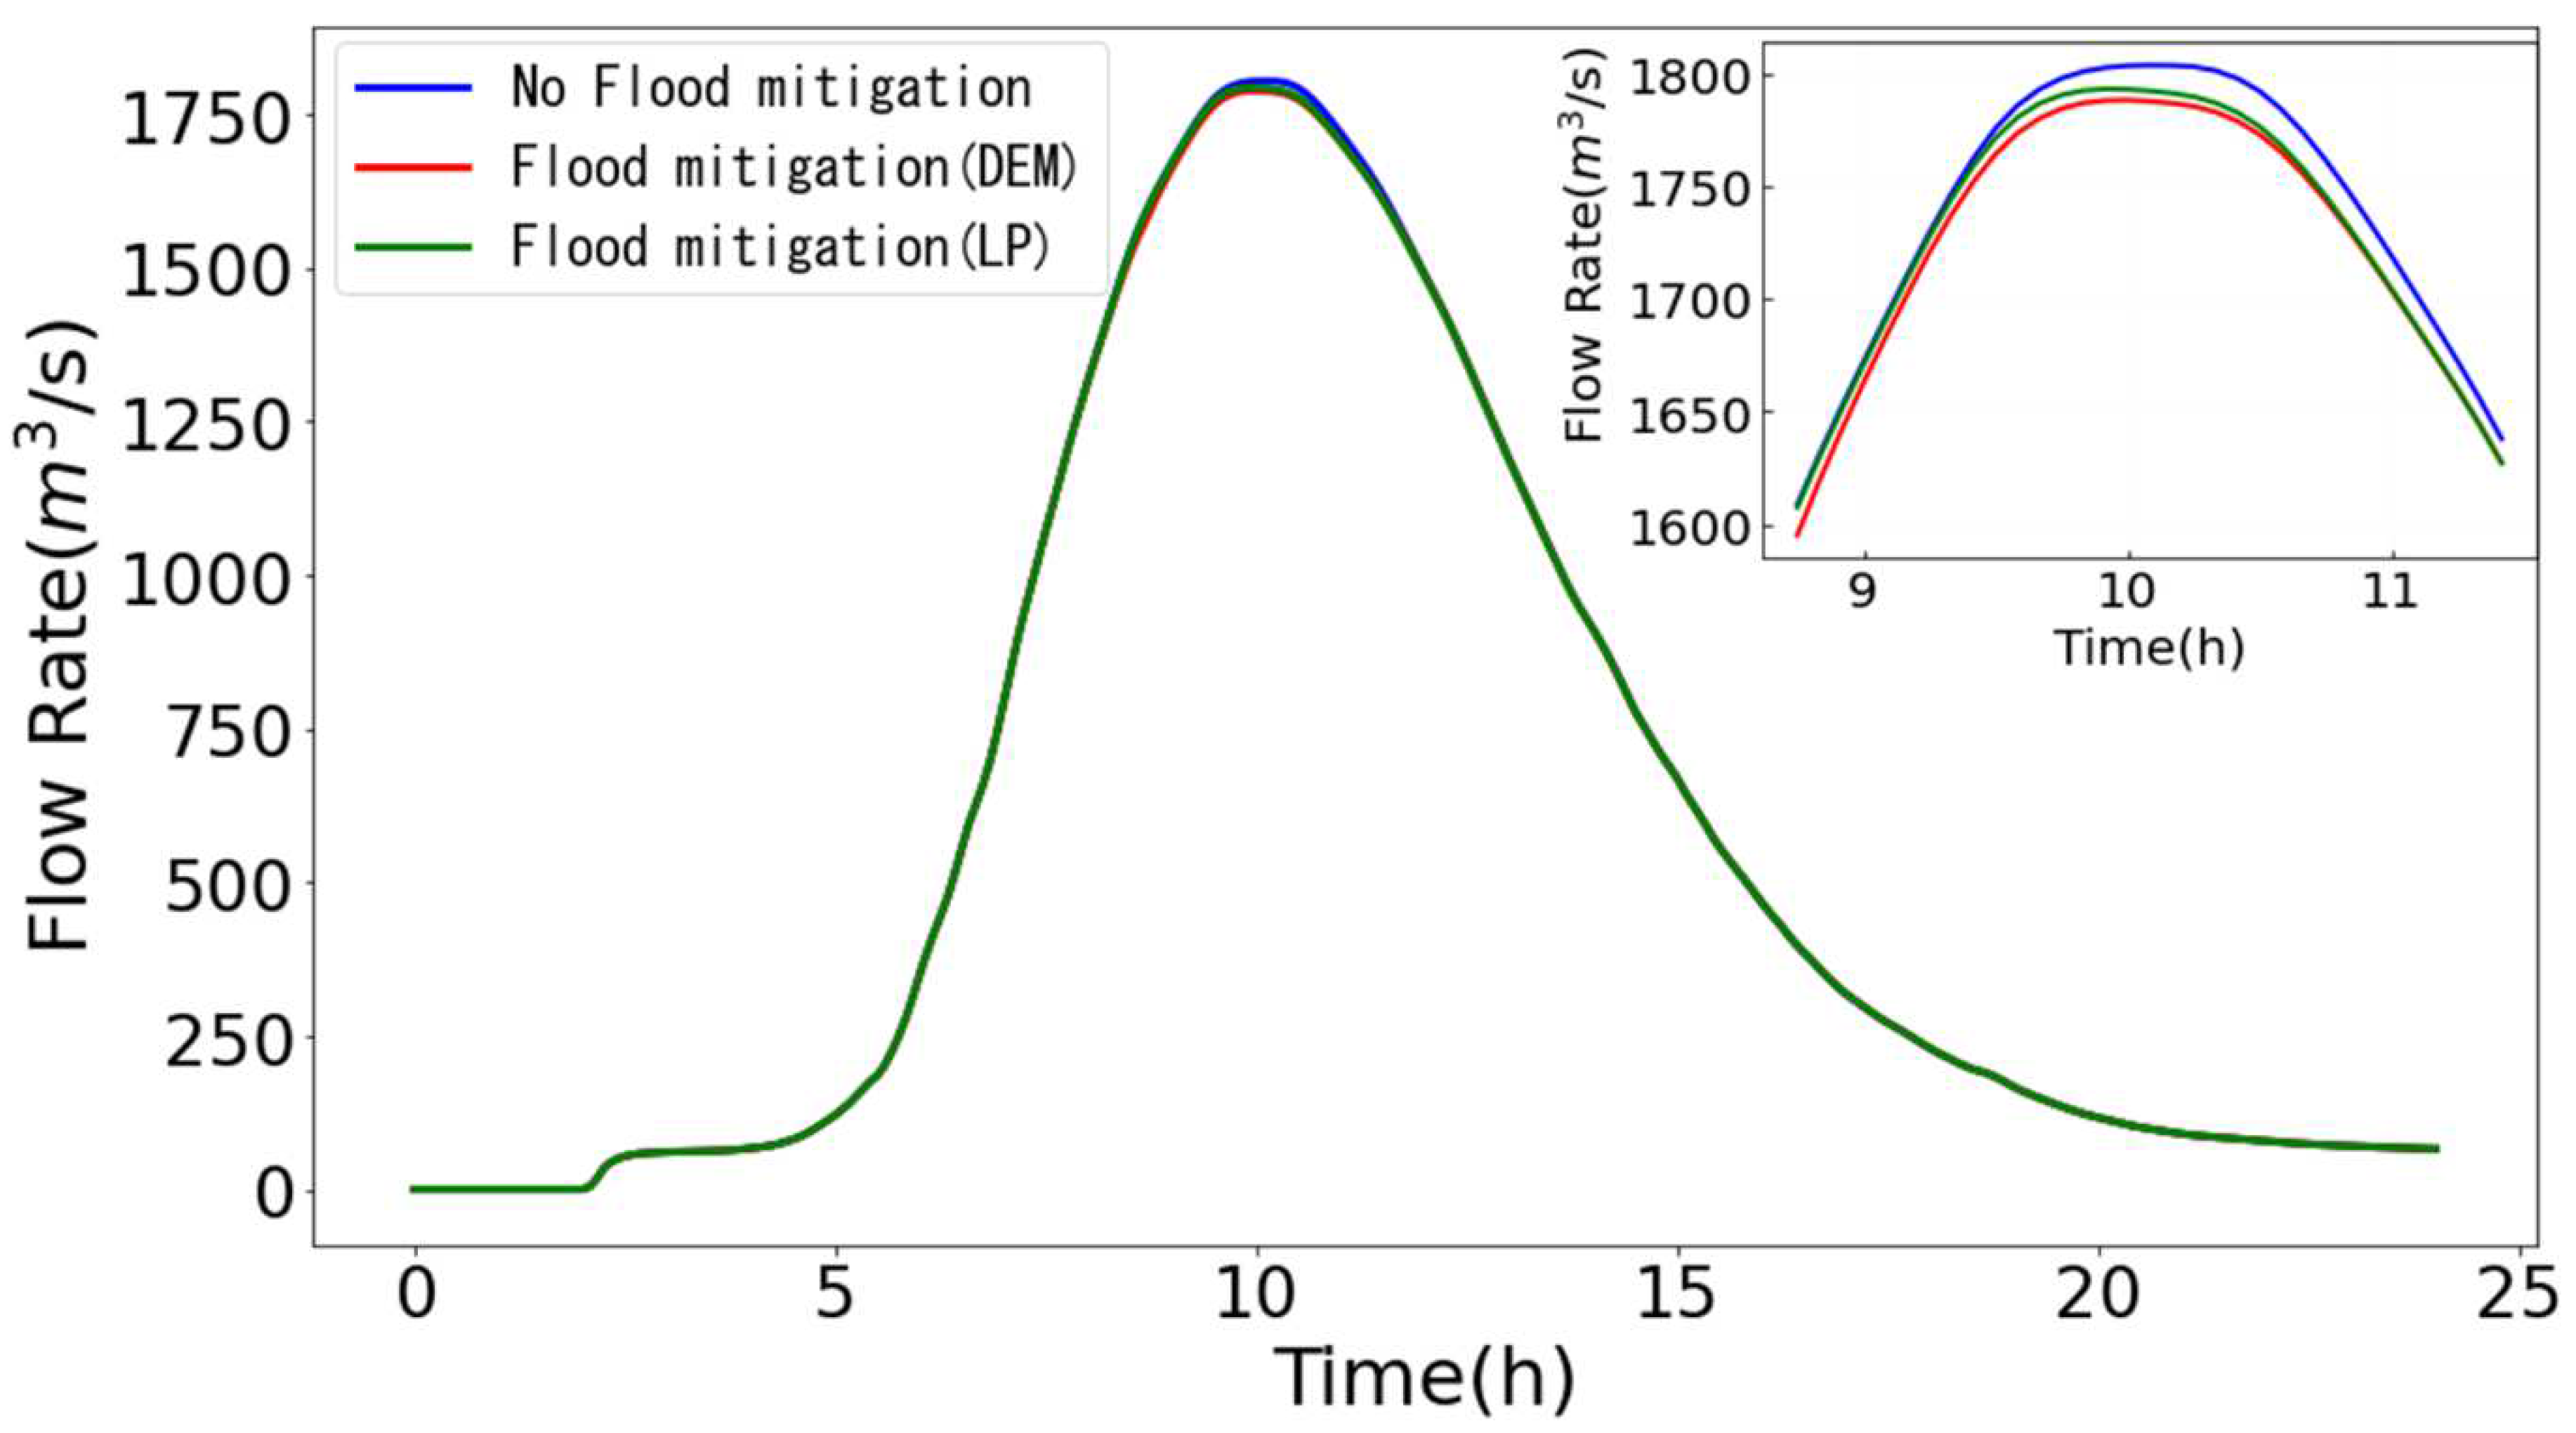
Figure 8 compares flow hydrographs at the Takada Bridge on the Ida River between a case in which a virtual wall was built on the river to prevent flooding and a case with water diversion to fields. The floodwater diversion reduced the peak flow by about 19.2 m
3/s with the 5mDEM and by about 16.0 m
3/s with the LP-derived approximately 5mDEM.
The results of this numerical experiment showed that the flow velocity in the field was < 1.0 m/s or moderate. The relationship between flow velocity and rice damage is summarized in the “Estimation Scale for Rice Flood Damage and Drought Loss” survey table [
19] however, this survey was conducted in 1950, and there are only three qualitative classifications of flow velocity: medium, fast, and high. According to the survey, the percentage of damage was 9% when the flow velocity was medium during the ear emergence period and 31% during the flowering period, indicating that the percentage of damage was greater during the flowering period than during the ear emergence period for all flow velocities. Furthermore, no studies have investigated the relationship between flow velocity and damage to rice crops. Fukuoka et al. [
20] conducted local experiments on other plants belonging to the family Poaceae with rice, such as reeds (Yoshi). They reproduced the flood flow in a double-section channel, clarified the relationships among the velocity distribution, reed behavior, roughness coefficient, and water surface profile, and presented a method for estimating the area of reed overtopping during floods and a method for evaluating the flow capacity of reeds. According to the results, reeds will collapse when the depth of the high-water table exceeds 2 m and the mean velocity of the high water table exceeds 0.4 m/s. This suggests that the flow velocity at which rice plants collapse exceeds 0.4 m/s. Although the resistance of rice plants to overthrow depends on the variety and growth conditions, the results of this numerical experiment suggest that the proposed floodwater diversion will have little impact on rice plants.
4.3. Crop Calendar
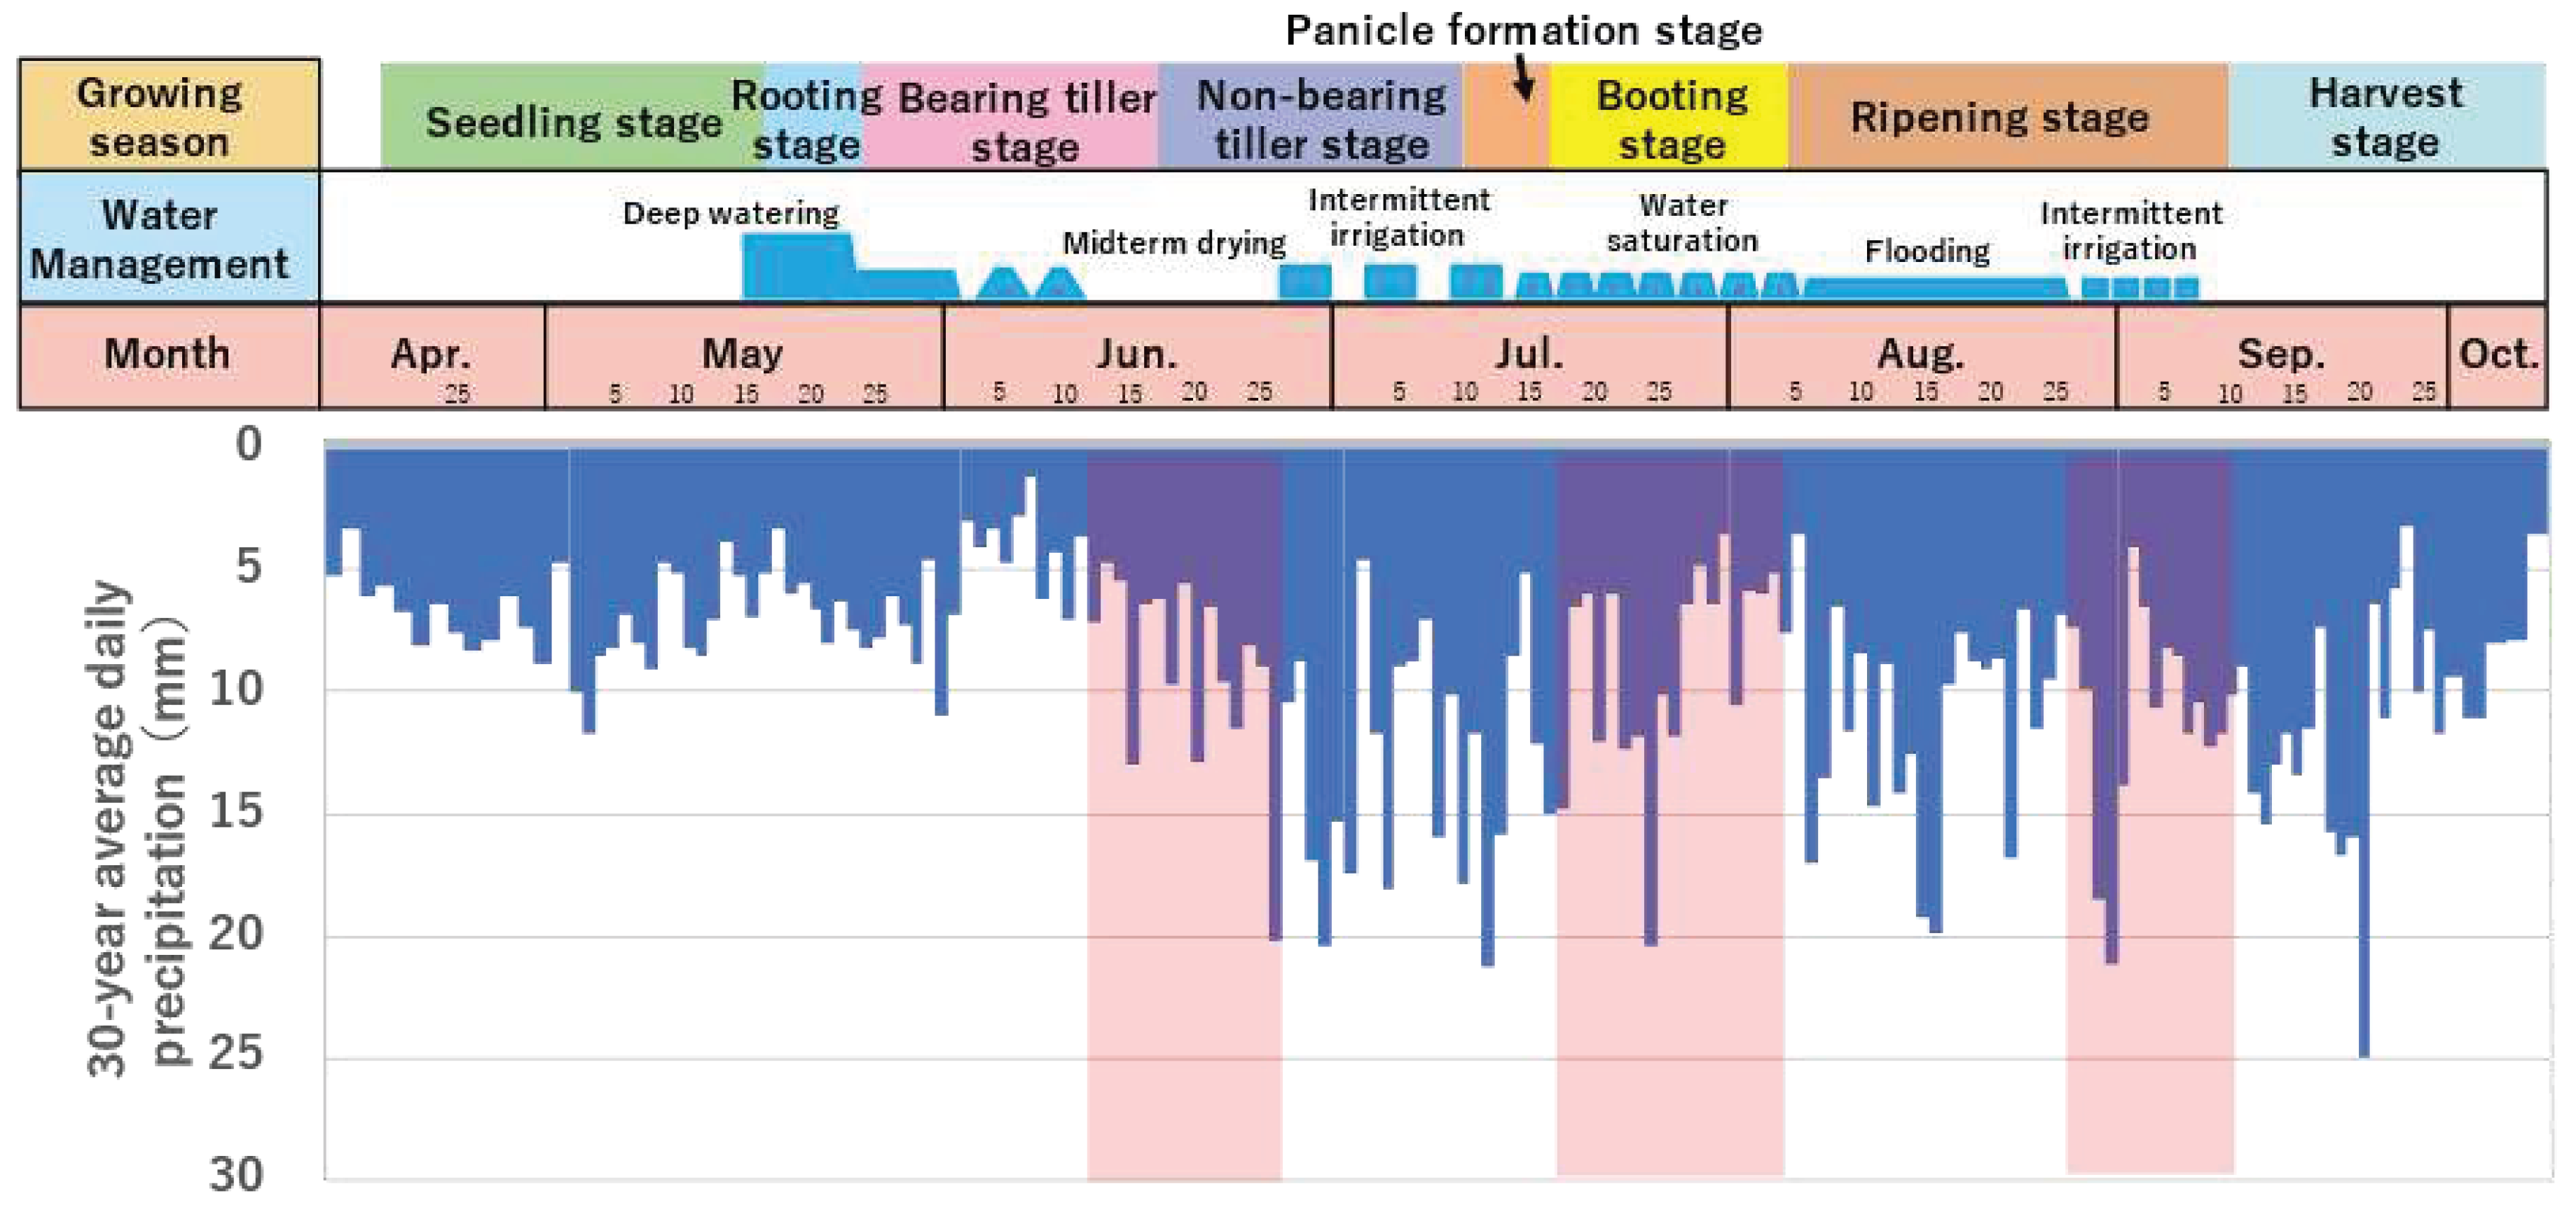
Figure 9 shows the 2023 Koshihikari crop calendar and the 30-year average daily precipitation in the target area observed at the Toyama District Meteorological Observatory from 1990 to 2020. Toyama has a climate on the Sea of Japan side, and precipitation is greater in winter than in summer. The growth stages of rice are shown in the figure. Water management in the field varies according to the growth stage, including the mid-drying period, when the field is dried without water, and the intermittent irrigation period, when water is turned on and off to promote rice growth.
According to the “Estimation Scale for Rice Flood Damage and Drought Loss” survey table [
19], the damage was greatest during the ear-burst period, accounting for 27.7% of the total damage in the case of 1 day of flooding. The next highest percentage of damage was at the highest split stage, when the number of split rows was highest (22.5%), and the highest percentage of damage was at the ear-scattering stage in 2- and 3-day floods. Minagawa et al. [
21] conducted a simulated flooding test in an actual rice paddy field to develop a paddy rice yield reduction scale. They found that prolonged flooding during the ear-burst stage caused damage such as wilting of leaves and stems, and flooding for > 3 days with muddy water delayed the ear emergence stage. Experimental results showed that the growth stage most vulnerable to flooding was the ear-burst stage, followed by the ear emergence, dividing, and ripening stages.
5. Conclusion
In this study, we investigated the possibility of proactive floodwater diversion to fields using backwater through numerical experiments with several elevation data products having different spatial resolutions and examined the possible timing of water diversion from perspective of crop calendars. First, a comparison of the elevation data products revealed that photogrammetric data can capture microtopography, such as the footpaths between rice paddies and drainage channels around a field.
Numerical experiments using two elevation data products, 5mDEM and LP-derived approximately 5mDEM, revealed that floodwater diversion can reduce the peak to about 19.2 m3/s when using the 5mDEM and can reduce the peak to 16.0 m3/s when using the LP-derived approximately 5mDEM.
Interviews with land improvement districts and a review of previous studies revealed that the ear-burst period is particularly vulnerable to flooding. Although the effect of flood peak reduction is reduced due to flooding of the field, it is possible that floodwater can be channeled during the ripening period in August and in late September and October when the ears have been harvested.
In recent years, flood damage has become more frequent, and with the expectation of increased precipitation in the future, “River Basin Disaster Resilience and Sustainability by All” is an urgent issue. The proposed method has the advantage of minimizing damage to field structures and crops by using existing facilities, without incurring costs or requiring construction work. The Ministry of Agriculture, Forestry and Fisheries is currently developing drainage channels connected to rivers, which are expected to overflow during heavy rainfall.
We propose that the development of drainage facilities in fields should be a part of river maintenance, as an element of the basic river maintenance policy and river maintenance plan set by the river administrator. In areas where residential and agricultural lands are interspersed, we believe that studies of measures to consolidate residential and agricultural lands and the management of early, medium-, and late-maturing crops by farmers as a risk hedge will increase the flood-conducting potential of the fields and enhance flood control.
Author Contributions
Conceptualization, T.T.; validation, Y.U. and T.T.; formal analysis, M.I. and A.N.; investigation, Y.U., T.T., K.N., and K.Y.; writing—original draft preparation, Y.U., and T.T.; writing—review and editing, Y.U., T.T., K.N., and K.Y.; All authors have read and agreed to the published version of the manuscript.
Funding
This research was supported by the Ministry of Land, Infrastructure, Transportation and Tourism, KASENSABO GIJUTSUKAIHATSU R4-R5 and the Japan Science and Technology Agency (JST), Co-creative Research and Development Program for Achieving SDGs (Solution Creation Phase) (Representative: Prof. Taikan OKI).
Data Availability Statement
Not applicable.
Conflicts of Interest
The authors declare no conflict of interest.
References
- Ministry of Land, Infrastructure, Transport and Tourism, The total damage cost caused by the water-related disasters in 2019, including the Typhoon Hagibis, was the highest since the start of the statistical records. Available online: https://www.mlit.go.jp/report/press/content/001396912.pdf (accessed on 28 September 2023).
- Hayashi, N. Relation between the change of land use and multi-functional roles of agriculture and forestry. Central Research Institute of Electric Power Industry, 2012.
- Kim, TC.; Gim, US.; Kim, JS.; Kim, DS. The multi-functionality of paddy farming in Korea. Paddy and Water Environment 2006, 4, 169–179. [Google Scholar] [CrossRef]
- Huang, CC.; Tsai, MH.; Ho, YF.; Tan, CH. Multifunctionality of paddy fields in Taiwan. Paddy and Water Environment 2006, 4, 199–204. [Google Scholar] [CrossRef]
- Ishikawa, T. Planned Inundation in Future Excess Floods, Journal of Japan Society of Hydrology & Water Resources, 2020,32,263-270.
- Satoh, M. Position and Role of Agricultural Land in the New Policy of Integrated Watershed Flood Management of Japan. Journal of Japan Society of Hydrology & Water Resources, 2022, 35, 41–57. [Google Scholar] [CrossRef]
- Ministry of Land, Infrastructure, Transport and Tourism, Manual for Flood Control Economic Surveys (draft). Available online: https://www.mlit.go.jp/river/basic_info/seisaku_hyouka/gaiyou/hyouka/r204/chisui.pdf (accessed on 28 September 2023).
- Minagawa, H.; Kitagawa, I.; Masumoto, T. Estimation Method of Flood Damage on Rice Paddies for Watershed Management as Flood Risk Mitigation, Journal of the Japanese Society of Irrigation, Drainage and Rural Engineering, 2016,84,271-279.
- Ministry of Land, Infrastructure, Transport and Tourism, Jinzu River Basin Fundamental River Management Policy. Available online: https://www.mlit.go.jp/river/basic_info/jigyo_keikaku/gaiyou/seibi/zindu_index.html (accessed on 23 October 2023).
- Toyama City, Toyama City Flood Hazard Map 2022. Available online: https://www.city.toyama.lg.jp/_res/projects/default_project/_page_/001/006/974/00_map3.pdf (accessed on 10 October 2023).
- National Federation of Land Improvement Associations, What is Land Improvement? Available online: https://www.inakajin.or.jp/land-improvement (accessed on 28 September 2023).
- Ministry of Land, Infrastructure, Transport and Tourism, Water Resources Utilization. Available online: https://www.mlit.go.jp/mizukokudo/mizsei/mizukokudo_mizsei_tk2_000014.html (accessed on 28 September 2023).
- Ministry of Agriculture, Forestry and Fisheries, Characteristics of Japanese Irrigation and Recent Issues. Available online: https://www.maff.go.jp/j/nousin/keityo/mizu_sigen/pdf/panf05_j.pdf (accessed on 28 September 2023).
- Ministry of Agriculture, Forestry and Fisheries, Water rights for agricultural use. Available online: https://www.maff.go.jp/j/nousin/mizu/kurasi_agwater/k_agri/pdf/detail_jp.pdf (accessed on 28 September 2023).
- Ministry of Agriculture, Forestry and Fisheries, Land Improvement Project Plan Design Standard Plan "Water for Agricultural Use (Paddy Field). Available online: https://www.maff.go.jp/j/nousin/noukan/tyotei/kizyun/pdf/00_yousui_suiden_gijutsusho_zentaiban.pdf (accessed on 28 September 2023).
- Yamaguchi, S.; Muro, K.; Iwamura, K. Development of a flood simulator for a flood risk communication tool, Annual journal of Hydraulic Engineering, 2005,49,421-426. [CrossRef]
- Toyama Prefecture, River Development Plan for the Left Bank Area of the Jinzu River System. Available online: https://www.pref.toyama.jp/documents/5164/01452229.pdf (accessed on 28 September 2023).
- Japan Agricultural Cooperatives of Aoba, Aoba Rice Cultivation Calendar. Available online: https://ja-aoba.jp/archives/001/202302/令和5年産移植『コシヒカリ』.pdf (accessed on 28 September 2023).
- Nippon Agricultural Research Institute, “Estimation Scale for Rice Flood Damage and Drought Loss” survey table.1956, p65.
- Fukuoka, S.; Shimatani, Y.; Tamura, H.; Tomari, K.; Nakayama, M.; Takase, A. Field experiments on reed deformation and falling and roughness coefficient on floodchannel by flows,Advances in river engineering, 2010,9,219-224.
- Minagawa, H.; Masumoto, T.; Horikawa, N.; Yoshida, T.; Kudo, R.; Kitagawa, I.; Zukemura, C. A pseudo-flooding experiment under real inundation conditions by using clean and turbid water plots to formulate reduction scales in rice yield, Technical Reports of the National Institute for Rural Engineering, 2013,214,111-121.
|
Disclaimer/Publisher’s Note: The statements, opinions and data contained in all publications are solely those of the individual author(s) and contributor(s) and not of MDPI and/or the editor(s). MDPI and/or the editor(s) disclaim responsibility for any injury to people or property resulting from any ideas, methods, instructions or products referred to in the content. |
© 2023 by the authors. Licensee MDPI, Basel, Switzerland. This article is an open access article distributed under the terms and conditions of the Creative Commons Attribution (CC BY) license (http://creativecommons.org/licenses/by/4.0/).
