Preprint
Article

Examine Website Defacement Dataset by Exploiting Some Classifiers’ Capabilities

Altmetrics

Downloads

191

Views

96

Comments

0

Submitted:

26 October 2023

Posted:

27 October 2023

You are already at the latest version

Alerts
Abstract
Website defacement is an illegal electronic act of changing a website. In this paper, robust machine learning classifiers’ capabilities were exploited to select the best input feature set for evaluating a website’s defacement risk. Zone-H, a private organization, offered us a defacement mining dataset. A sample of 93644 datapoints was concisely pre-processed and used for modelling purposes. Considering multidimensional features as input, reason and hackmode variables were chosen as outputs. Massive machine learning models were examined; however, decision tree (DT), k-nearest neighbour (k-NN), and random forest (RF) were the most powerful algorithms used to predict the target model. The input variables 'domain', 'system', 'web_server','redefacement', 'type', 'def_grade', and 'reason/hackmode' were tested and used to shape the final model. Using the cross-validation (CV) technique, the model’s key performance factors were calculated and reported. After calculating the average scores for the hyperbolic metrics (i.e., max-depth, min-sample-leaf, weight, max-features, and CV), both targets were evaluated, and the learning algorithms were ranked as RF, DT, and k-NN. The reason and hackmode variables were thoroughly analysed. The average score accuracies for the reason and hackmode targets were 0.85 and 0.585, respectively. The results showed a significant development in terms of modelling and optimizing website defacement risk. The study also successfully addresses the main cybersecurity concerns, in particular website defacement.
Keywords: 
Subject: Computer Science and Mathematics  -   Computer Science

Introduction

Top ranking cybercrime references define website defacement as an illegal electronic attack (hack) of a webpage, changing the webpage’s appearance [1,2,3]. Such changes include replacing the site’s content with any type of political, ideological, profane, or inappropriate content [4]. Defacement may be carried out on servers owned by the organization that the attacker(s) have chosen [1,5]. Papers [6,7] outlined the common types of website defacement attacks; such attacks include unauthorized access, SQL injection, cross-site scripting (XSS), DNS hijacking, and malware infection [8,9]. Standard methods to address website defacement follow the public wisdom that concludes that “prevention is better than a cure” [10]. Indeed, a very effective way to secure a website is to be aware of attackers and data breaches rather than to detect breaches and fix them. Some methods limit offenders’ ability to upload files and their access to the server and controls within the organization, while others use a secure socket layer (SSL) certificate for confidential security across HTTPs and apply strong rules for securing login information, particularly usernames and passwords [11].
Currently, most webpages are vulnerable to defacement and hacktivism [1,12]. Very often, mindful and continuously aware websites are the only websites that may be considered safe from destructive defacement threats. Defacement attacks can damage a company/organization’s reputation, leading to the loss of trust and money, and an affected website may be banned from search engine results, such as Google. Strengthening the resilience of a website to prevent or become immune to defacement risks is the ultimate goal that each institution strives to achieve. In this regard, many techniques have been used to address website defacement [12,13,14]; however, prediction-based methods are ultimately preferred. These techniques embed a powerful computation mechanism and can be used in a simple manner to grasp the final design.
Many proposals have been introduced to utilize robust machine learning algorithms to assess website defacement. Nevertheless, the best method has not yet been designed [15]. A devastating website defacement attack motivated the exploitation of neural networks as a promising research method for addressing issues related to website defacement and cybercrime threats [16]. This analytic method is modelled after the process of deep learning to realize the facts that are rooted inside the raw data points by learning from the existing data. In this regard, the following proposals have achieved advanced successes in terms of website defacement classification and prediction [3,6,8,17,18,19,20,21].
Our main idea is to collect a massive number of website defacement inputs evidence, preprocess and filter these raw data, and examine several machine learning modelling scenarios until the best prediction model is determined. In this aspect, our model is used to estimate two different outputs named ‘reason’ and ‘hackmode’. When predicting ‘reason’,hackmode’ is considered as an input feature, and when predicting ‘hackmode’, ‘reason’ is considered as an input feature. Therefore, our input key features include ‘domain’, ‘system’, ‘web_server’,’redefacement’, ‘type’,’reason/hackmode’ and ‘def_grade’. However, the dependent output variables are only ‘reason’ and ‘hackmode’. For computations, our method employs three popular powerful machine learning prediction algorithms. They are decision tree (DT), random forest (RF), and k-nearest neighbour (k-NN). For each algorithm, many models are tested, and the averages are reported based on the vital hyperparameter set. These popular hyperparameter sets include factors such as CV, max-depth, min_sample_leaf, weights, maximum features, and neuron node neighbours. In summary, performance measures for the correlation coefficient, model timing, and average error rates are calculated. The attack reason(s) and hackmode type(s) are correctly developed. Furthermore, the study successes to answer the biggest concerns for cybersecurity issues, particular website defacement.
This manuscript is organized as follows. In Section 2, the literature review are reviewed. In Section 3, presented the method and outline the dataset generation. The results and discussion are displayed in Section 4. Finally Section 5, the study is concluded and followed by the references.

Related works

To assess websites’ defacement and hacktivism risks, it is obvious that Zone-H is an indispensable data source from which to fetch information [5,21]. In this regard, articles [22,23,24,25,26] addressed attack types and profiling trends and presented a questionnaire taken by 119 active hackers. Paper [22] examined hackers’ typologies by analysing their feedback on the their responses.
Considering an environmental criminology perspective, many studies have validated this fact [24,26,27]. In this regard, vitiable findings were compared in the discussion section.
In [27], factors such as the peak signal-to-noise ratio, cyclic redundancy check, secure hash algorithm, and structural similarity measure were calculated.
Excellent research on detecting website defacement based on machine learning [28,29,30,31,32,33,34] has been published. For example, [34] performed an extensive experiment and showed an overall accuracy of more than 99.26% and a false-positive rate of approximately 0.27%. Work in [34,35] focused on defacement heterogeneity, and [35,36] targeted reference group motivated hackers and ordered their motivations as for fun, for challenge, to be the best, for patriotism, for political reasons, and for revenge.
To better understand Islamic Jihadism, defacement features [37,38,39,40] were obtained. Regression was the key factor used to validate the outcome. However [41,42,43] utilized the classification and case-based reasoning mathematic for the outputs.
[34] used a detection method for both website defacement and signature-based detection methods. Machine learning capabilities were examined, and classification metrics of 99.26% for accuracy and 0.26% for false positive rate were reported. Thus, the authors argued that only the scalar assessment of machine learning classifiers is necessary. However, many graphic metrics can be fetched using this method.
[35] classified active hackers into mass/single hackers by using a massive dataset from Zone-H. The features used for modelling were defacement type, hacker type, operating system, hacker motivation, webpage type, site re-defacement, and method of attack. Concerning the analysis method, the study utilized the Poisson distribution, and multinomial logistic regression classifier as predictors. We concluded that this study can provide information on criminological direction.
In [36], Jihadist features were characterized to differentiate them from features of common website attackers. This research reflects excellent work in assessing hacktivism; however, a traditional and less computation analysis-based approach was taken. Utilizing a binary regression model, it was concluded that a Jihadist offensive was the least likely among other kinds of website defacement.
Summarizing website defacement development across Jihadist groups, [37] reported interesting results. For example, 20000 websites have been attacked by these groups. Attack strategies have rapidly changed from cyberattacks to cyberterrorism, and attacks have changed in terms of both number and sophistication. Moreover, this study introduced issues such as the Cyber Caliphate and Inspire Jihadist groups as well as digital natives’ age (16-24). The CIA’s World Factbook 2018-2019 [38], which reports a comprehensive world picture and classification, supports these facts concerning website defacement.
In [39], the classification and differences between traditional terrorism and cyberterrorism using Al Qaeda’s network were described in detail to understand how they exploit e-mail services to support Jihad e-mail.
Interesting research has been conducted to address the relationship between ideology and lethality [40]. A dataset was fetched from the Global Terrorism Database, and the Global Jihadist Movement was determined the be the deadliest. In this research, only logistic regression was used, and models were counted by using variables and incident counting.
Reference [41] combined similarity measures with clustering to assess website defacement. This method supports a case-based reasoning technique. Good results were achieved by inferring the hacker’s attitudes to find evidence of website defacement. Indeed, such research demonstrates data-driven power as support for evaluating website defacement.
After obtaining global website defacement and hacking data source files from Zone-H, [42] extracted website defacer samples from 114 nations and examined them to explore/understand the relationship between the countries’ communication capabilities and the number of websites defaced. In this regard, routine activities factors and a methodological framework were used in this study. It was assumed that victimization is caused by a combination of website attackers, the website itself, and a lack of secure systems with respect to time and within a hosting server. The analysis tools were machine learning’ typical correlation factors for the output variables. Finally, the study findings verified the hypothesis that website protection (guardianship) will limit defacement numbers in a country-wise manner.
Papers [34,35,36,37,38,39,40,41] focused on usability in machine learning to assess website defacement and hacktivism classifications. However, the approaches were varied in terms of the algorithm(s) and dataset used, performance measures employed to evaluate the outcomes, and the study assumptions. These variations resulted in slightly different final comparisons; however, the machine learning methods were clarified, empowering our approach.
The current study differs from the literature review in that valuable hyperbolic modelling performance measures such as max_depth, min_sample_leaf, n_neighbours, accuracy, average errors, and model evaluation time were considered, and the prediction models across three different algorithms were validated. A large number of modelling permutations/computations were examined to grasp the current final models. Moreover, the mean score prediction was measured, and the effect of increasing the size of n_neighbour on the mean accuracy was calculated for both reason and hackmode. Variation was also mentioned by using max_depth with respect to the mean test score for the DT & RF algorithm(s).

Materials and methods

There are several active cybersecurity data science source that track hacking records, but very often, “ZONE-H” is the leading source of unrestricted and authenticated websites defacements information. It provides an archive of defaced websites from all around the world [5]. The study population obtained by using a dataset of terra-records offered by Zone-H and for the research purposes. The original dataset package has 93644 items with 16 dimensions and 16 features. As a result of preprocessing, only 8 features remain relevant to the final dataset. The input and output variables and their meaning statistics are presented in Table 1. Based on the eight features with 80382 items (rows), the final dataset contains 9 columns.
Figure 2 gives the chi square correlation computation matrix that perfectly measures the variable relations.
Equations below give the mathematical relationships for X2 (chi square) [10]:
X 2 = i = 1 n ( O b s e r v e d E x p e c t e d ) 2 E x p e c t e d 2
r A , B = i = 1 n ( a i A ) ( b i B ) ( n 1 ) σ A σ B
r A , B = i = 1 n ( ( a i b i ) n A B ) ( n 1 ) σ A σ B
where n is the number of tuples, A a n d   B are the respective means of A and B, σ A   a n d   σ B are the respective standard deviations of A and B, and i = 1 n ( a i b i )   is the sum of the AB cross-product. From the equations above, the computations are performed as follows:
Preprocessing is an indispensable process in any machine learning prediction method(s). The quality of the raw dataset is measured to facilitate a multidimensional view. In this process, several measures are validated to obtain a clean dataset. These measures include 1) checking for correct/incorrect input(s), 2) examining the completeness of data, 3) testing the consistency of data (i.e., some modified, dangling data), 4) updating the timelines, 5) assessing the believability in terms of trustworthy input(s), and 5) examining the interpretability (i.e., how easily the data can be understood).
The machine learning feature selection process is an effective means of predicting both ‘reason’ and ‘hackmode’. Many approaches could be employed to validate the selected features.
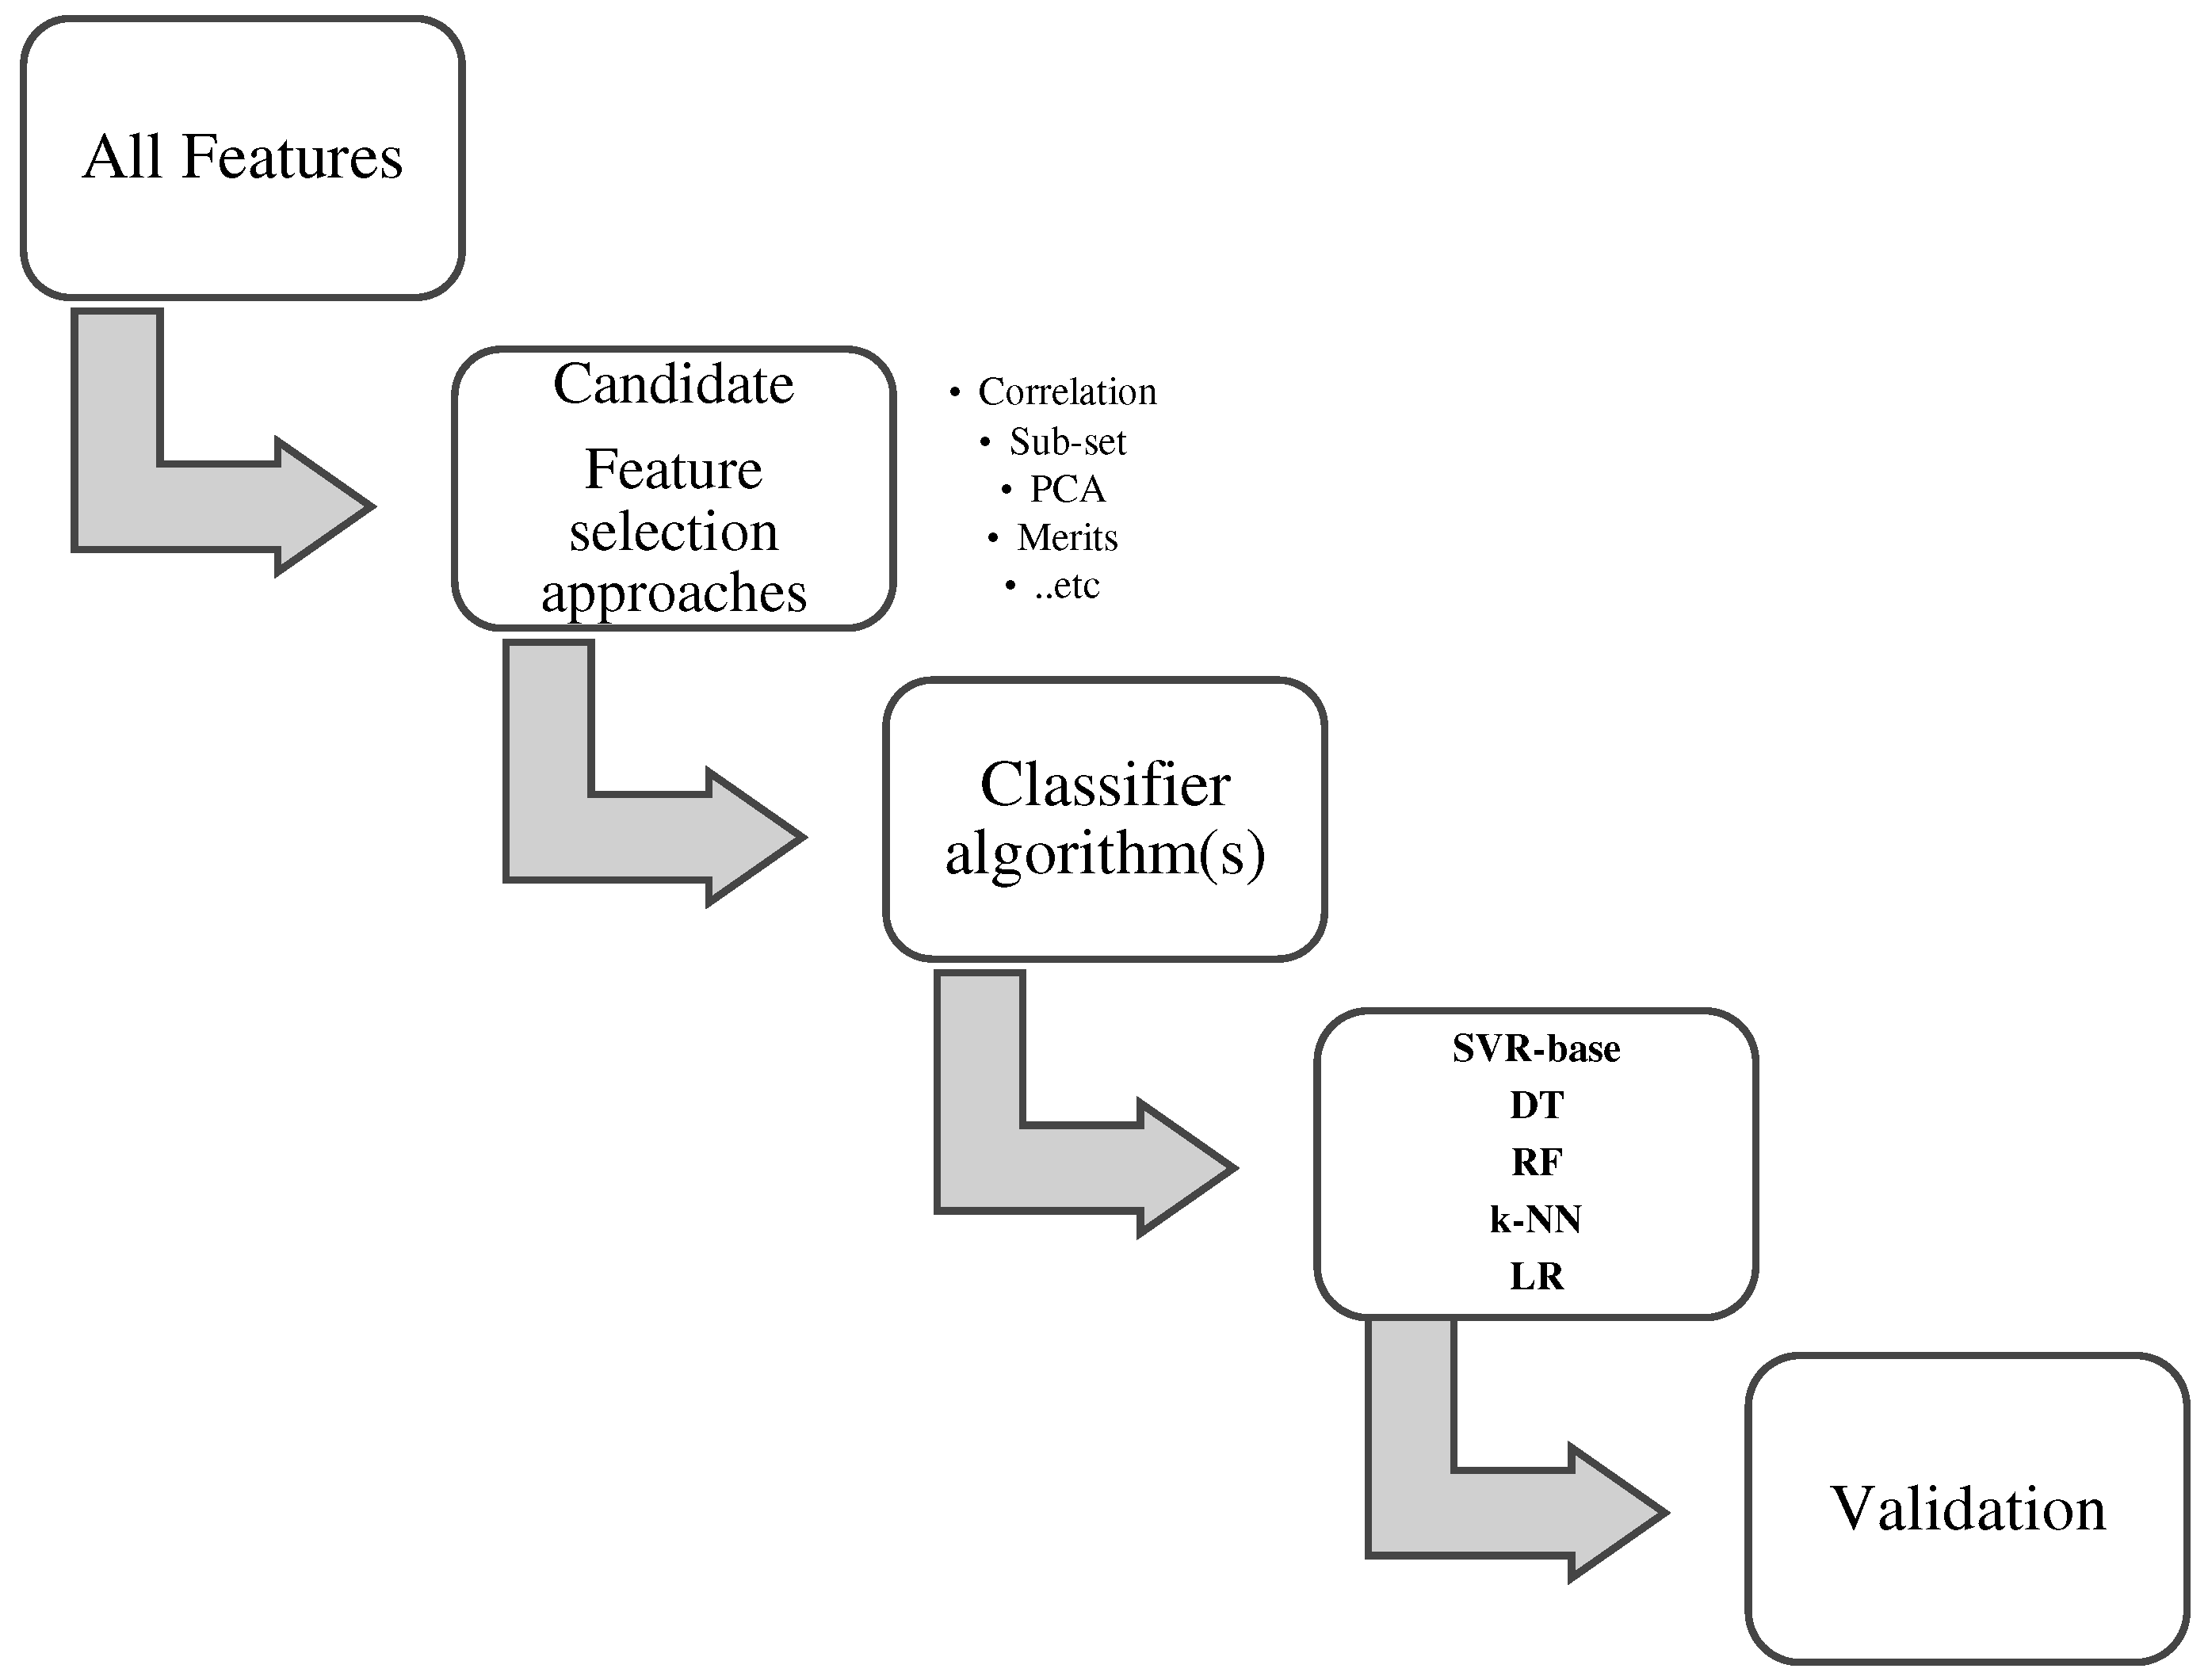
Figure 3 shows the details of the method applied in this manuscript. The 16 features were examined based on seven features of some related algorithm(s) (i.e., ‘Domain’, ‘system’, ‘web_server’, ‘hackmode’, ‘redefacement’, ‘type’, and ‘def_grade’). These features were sorted and selected to produce the final input feature set. The targets were determined as ‘reason’ or ‘hackmode’, and the features were examined under five different powerful machine learning kernel algorithms, including the decision tree, random forest, k-nearest neighbours, SVR-based, and LR algorithms.
Five basic processes are shown in Figure 3. First, all the input features are summed and passed into a feature selection phase that accurately computes and filters the inputs using the correlation between the input parameters and the desired output. In this process, many techniques can be applied; however, correlation, PCA, and merits are the leading algorithms. Multilayer perceptron and ANNs were very effective contributor forming the outputs and they were introduced in [3,8].
For the calculating the performance measures the following equations used [44,45,46,47,48]:
y t ' = f ( x t , w ) ,
where w is the ensemble of the synaptic weights and xt are the input variables currently being fed into the network with errors.
E ( w ) = 1 2 1 N ( y t y t ' ( x t , w ) ) 2
Then, optimization is derived by [44]
w = arg min E ( w ) = arg min ( 1 2 1 N ( y t y t ' ( x t , w ) ) 2 )
Accuracy (Acc) represents the first measure used for assessing the classification performance, and it is:
A c c = T P + T N T P + T N + F P + F N  
where P and N indicate the number of positive and negative samples, respectively.
Error rate (ERR) is:
E R R = 1 A c c
E R R = ( F P + F N ) ( T P + T N + F P + F N )  
Python is the best programming language to use to develop our complicated learning models for classification and prediction.

Results and discussion

Table 2 gives the key hyperbolic features for the models used in the study. The inputs used are: ‘domain’, ‘system’, ‘web_server’,’redefacement’, ‘type’, and ‘def_grade’. The dependent output variables were chosen as ‘reason’ for the first set and ‘hackmode’ for the second set. In Table 2, the output parameters (i.e., reason/hackmode) are highlighted in grey.
Simplifying the computation process, inputs and outputs were normalized to a mean of zero and a variance of unity. Than-sigmoid was chosen as an activation function with Levenberg–Marduardt (LM) algorithm.
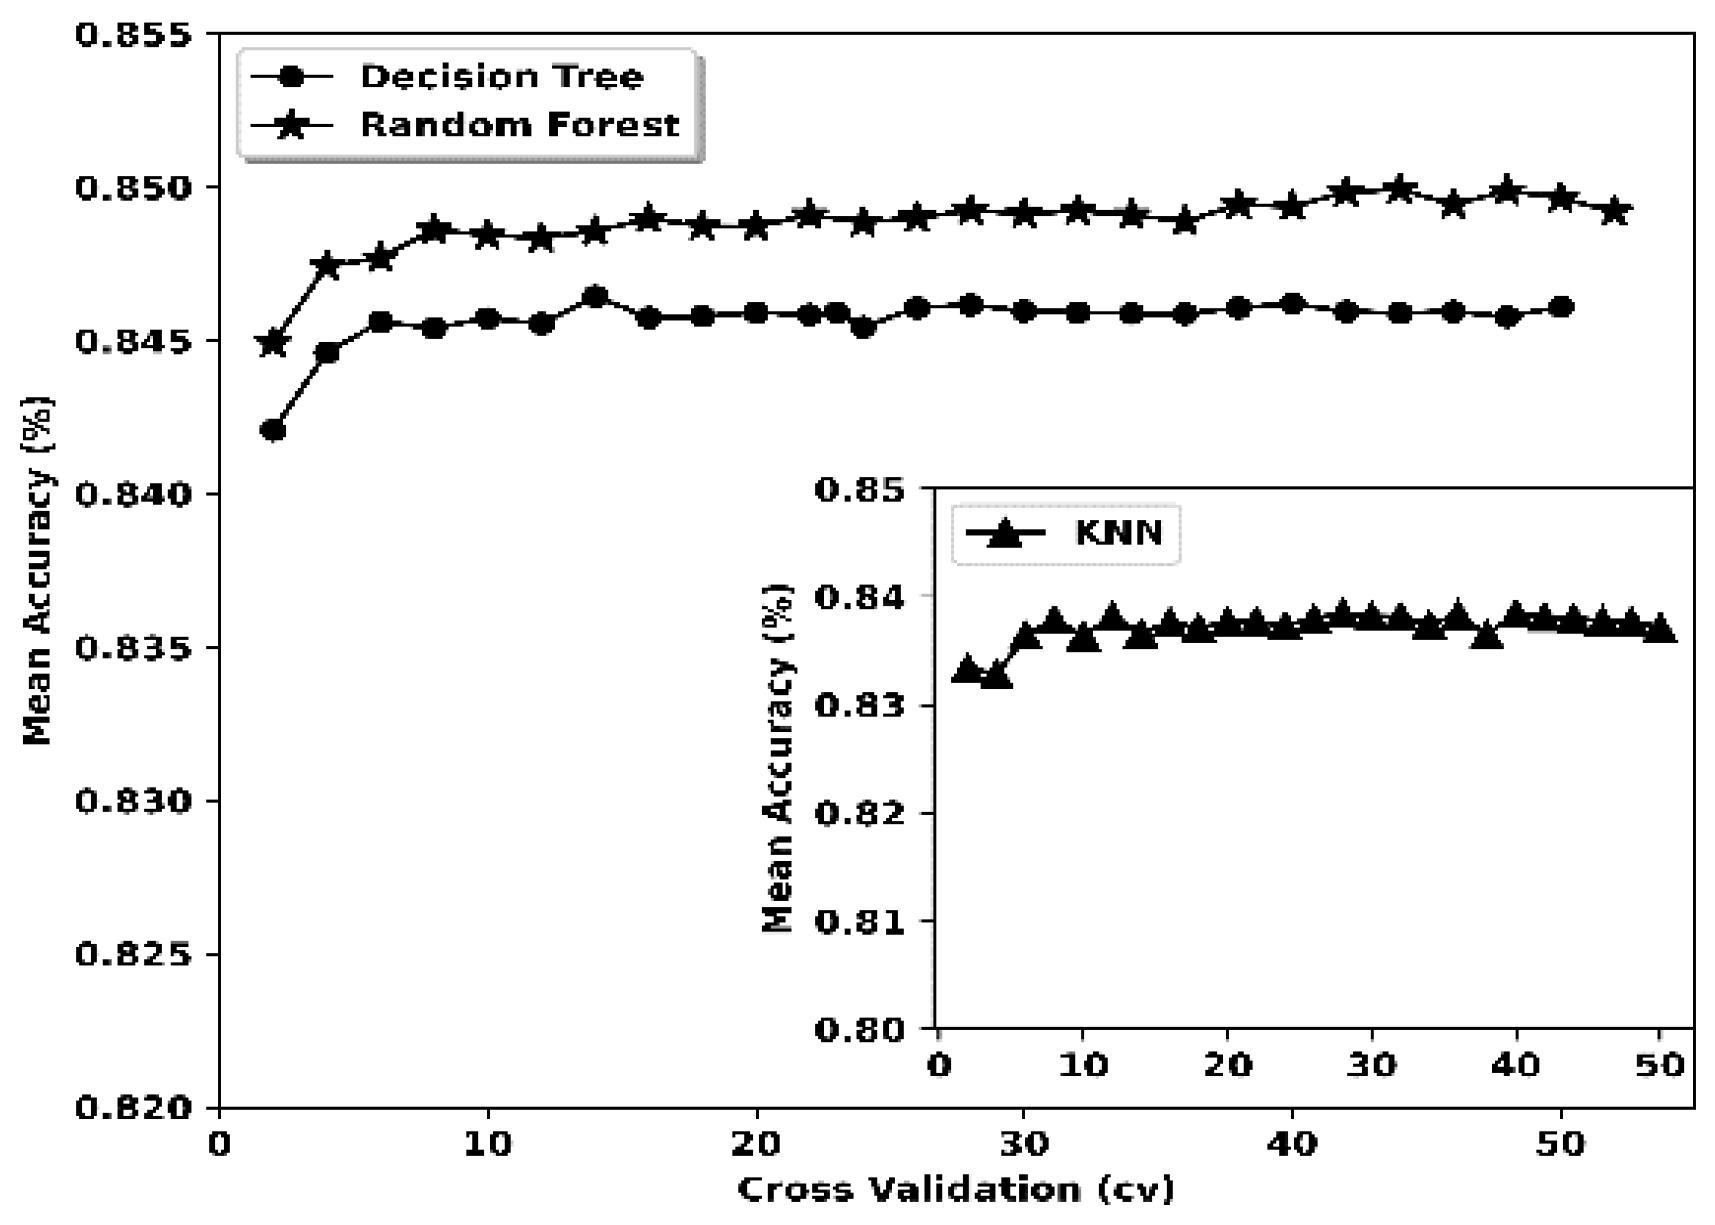
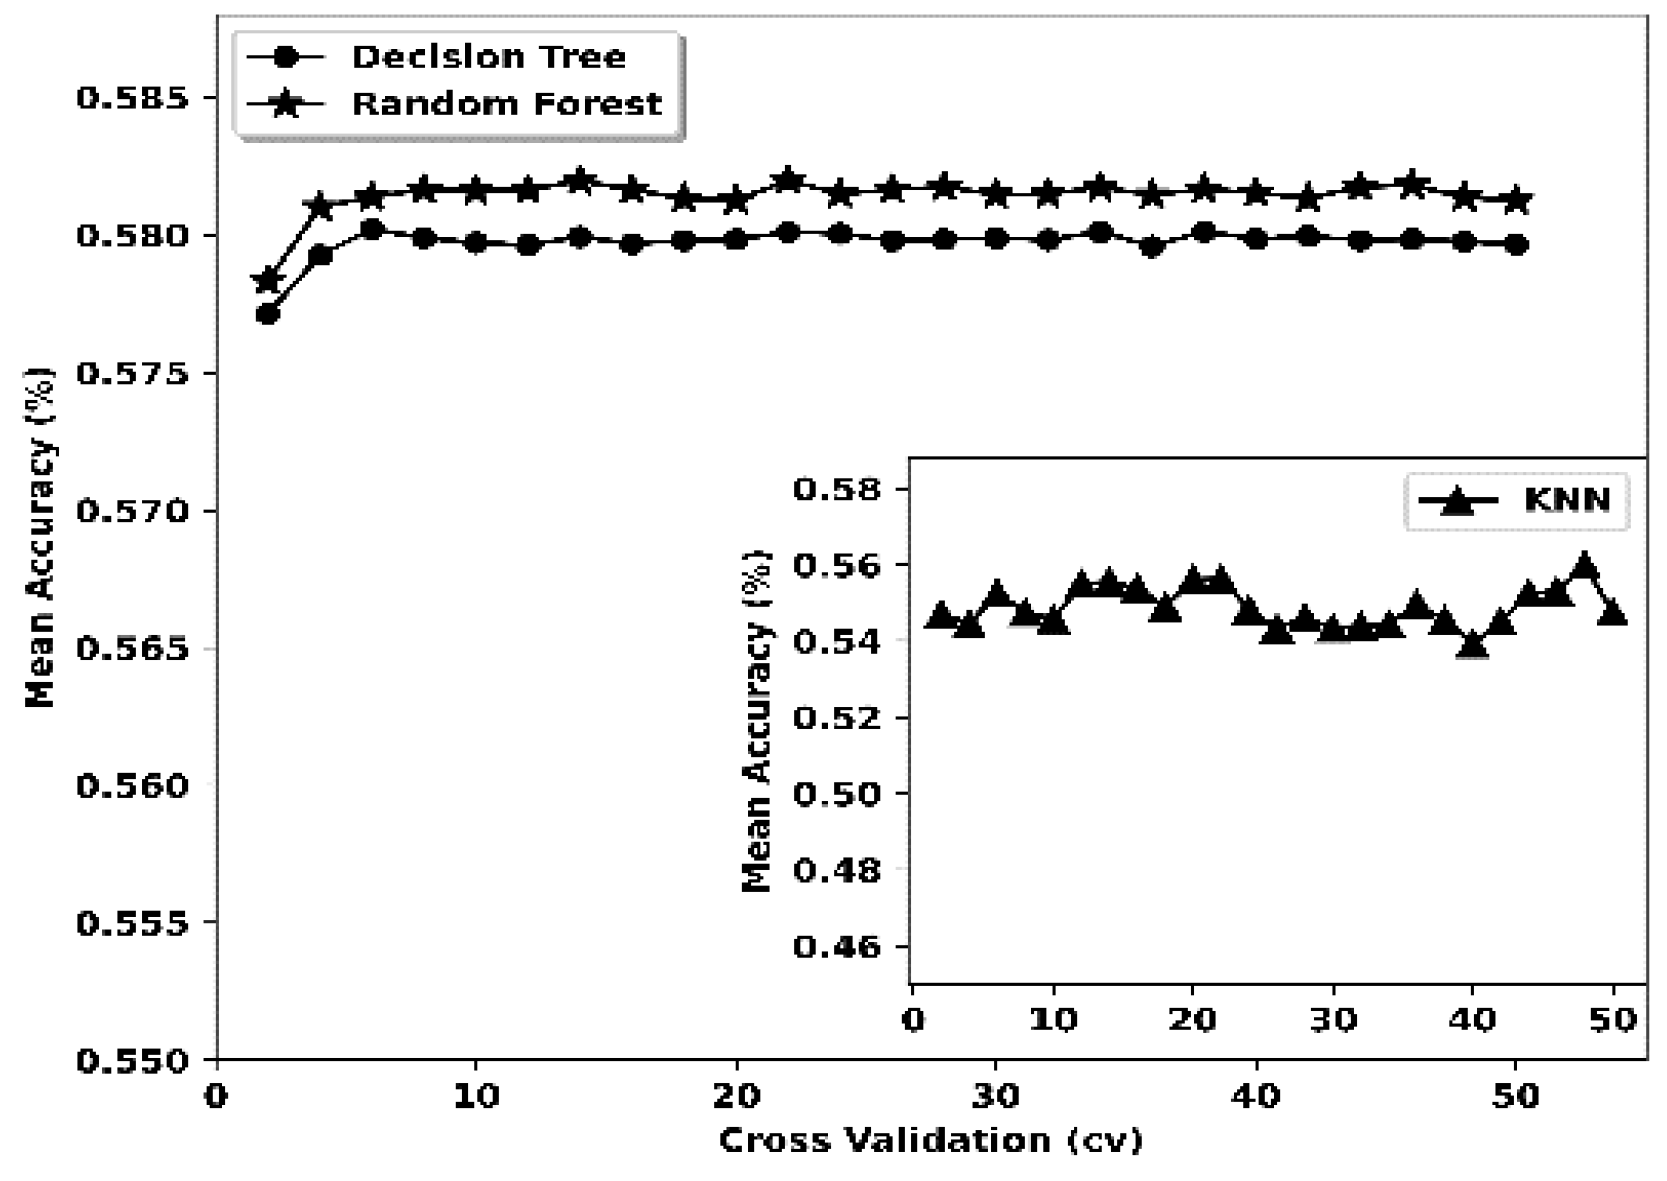
A GridSearch CV technique was performed to tune the hyperparameters of the three selected models: the DT, RF, and k-NN classifiers. These hyperparameters were permuted and tuned until the best score(s) were obtained in each case, as reported in the table. The most significant parameter in all three models was accurately adjusted by maintaining the above method and tuned for further improvement of the models; max_depth and min_sample_leaf were considered for the case of DT, and RF and n_neighbours were considered for the case of k-NN. In addition to the above hyperparameter, max_features was tuned, particularly for RF. The variation in these parameters as a function of the average score was computed and is reported in Figure 4, Figure 5, Figure 6, Figure 7, Figure 8, Figure 9, Figure 10 and Figure 11.
In Table 2, the CV values range from 14-16 for all algorithms. The hyperbolic parameters in the random forest model are equal for both targets (i.e., reason and hackmode). For the k-NN algorithm, the subalgorithm used was ball_tree, the leaf_size was set to 9, and the n-neighbour values were 18 and 7 for reason and hackmode, respectively. Different values for the leaf per algorithm(s) variable were recognized. The remaining parameters are primarily classifier-based values.
When the final model was obtained, we were able to perform a large number of permutations and combinations by tuning the hyperparameters using the machine learning method, from which the best combination for the dataset at hand was determined. The models were used to evaluate and validate how well they predicted unseen data. All models were used to predict two targets: the reason for hacking (‘reason’) and how hacking was performed (‘hackmode’). The CV training method had the highest training algorithm fit for all models, and its performance metrics using these three models are presented in Figure 4, Figure 5, Figure 6, Figure 7, Figure 8, Figure 9, Figure 10 and Figure 11. The performance of the models selected was evaluated starting with the mean score with respect to cross-validation for the DT, RF, and k-NN algorithms.
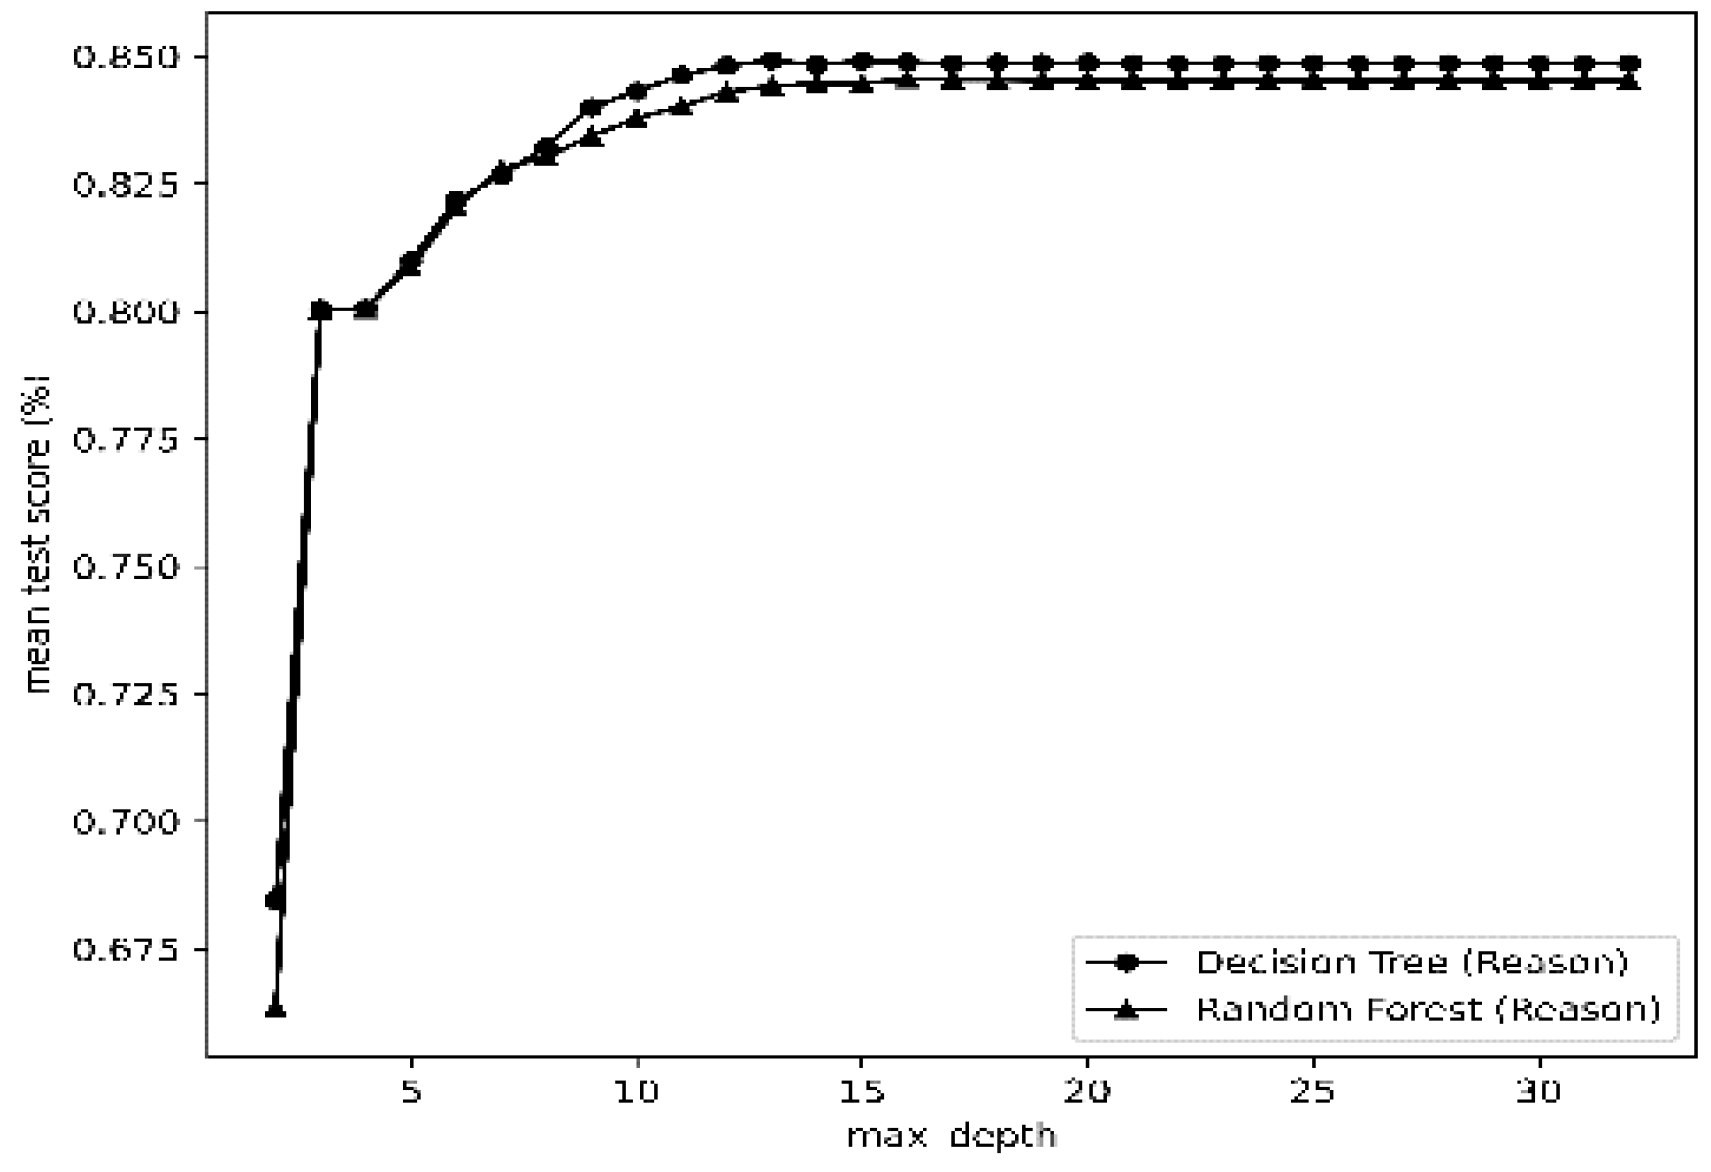
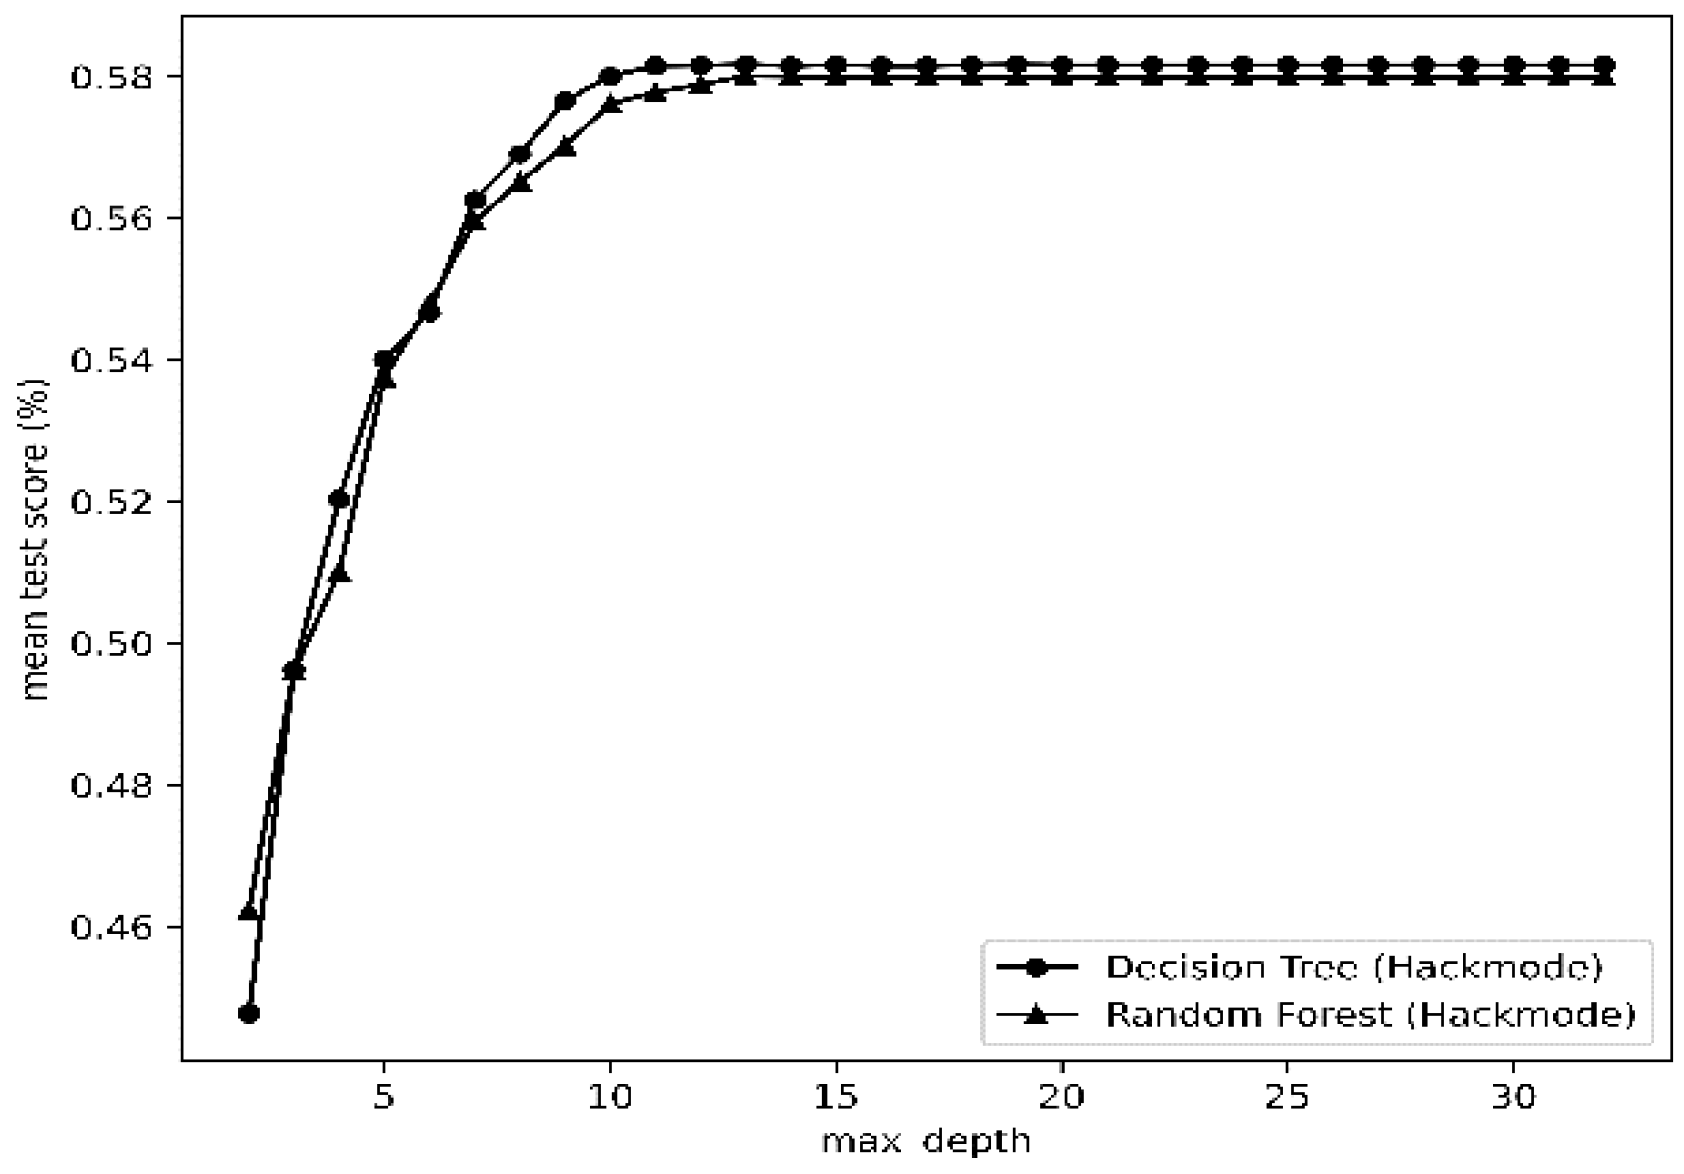
The hyperparameters were then optimized, and only the most relevant parameters were tuned. Starting with max_depth, the optimized values for DT and RF were obtained, as shown in Figure 6 and Figure 7.
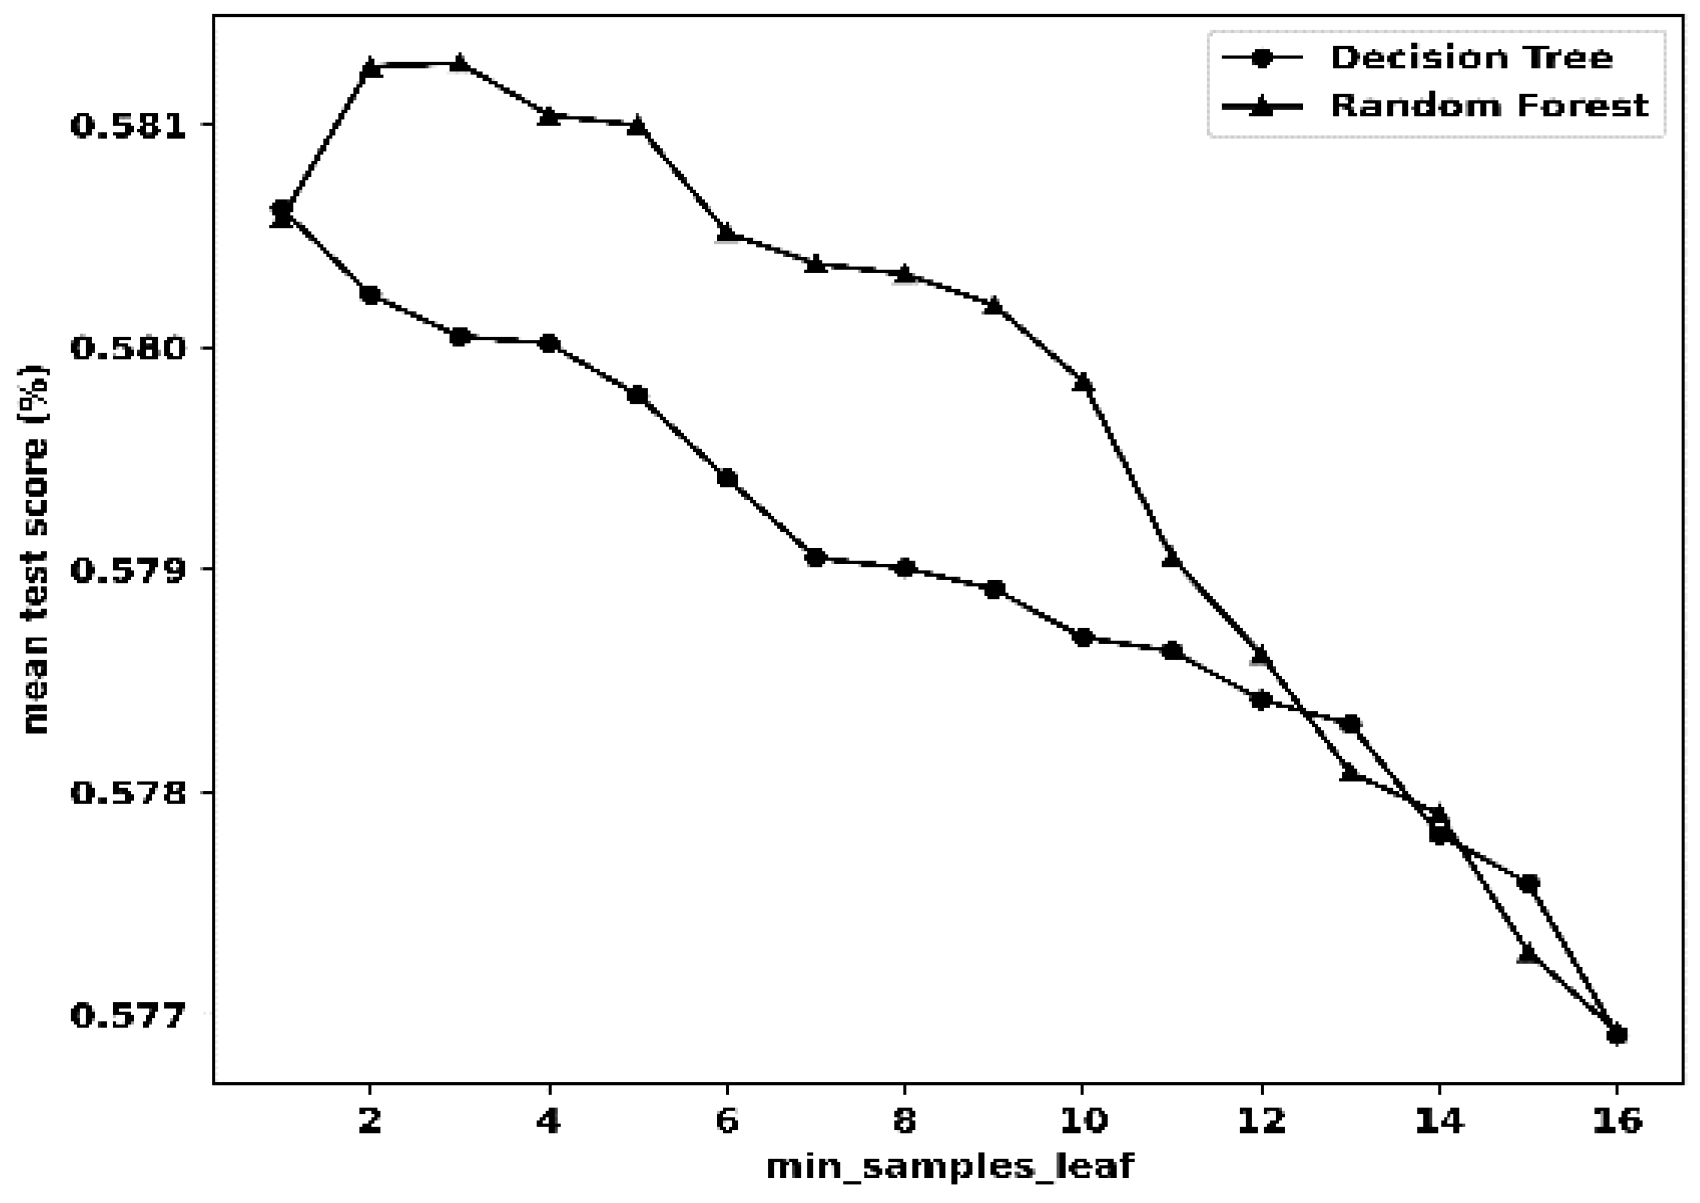
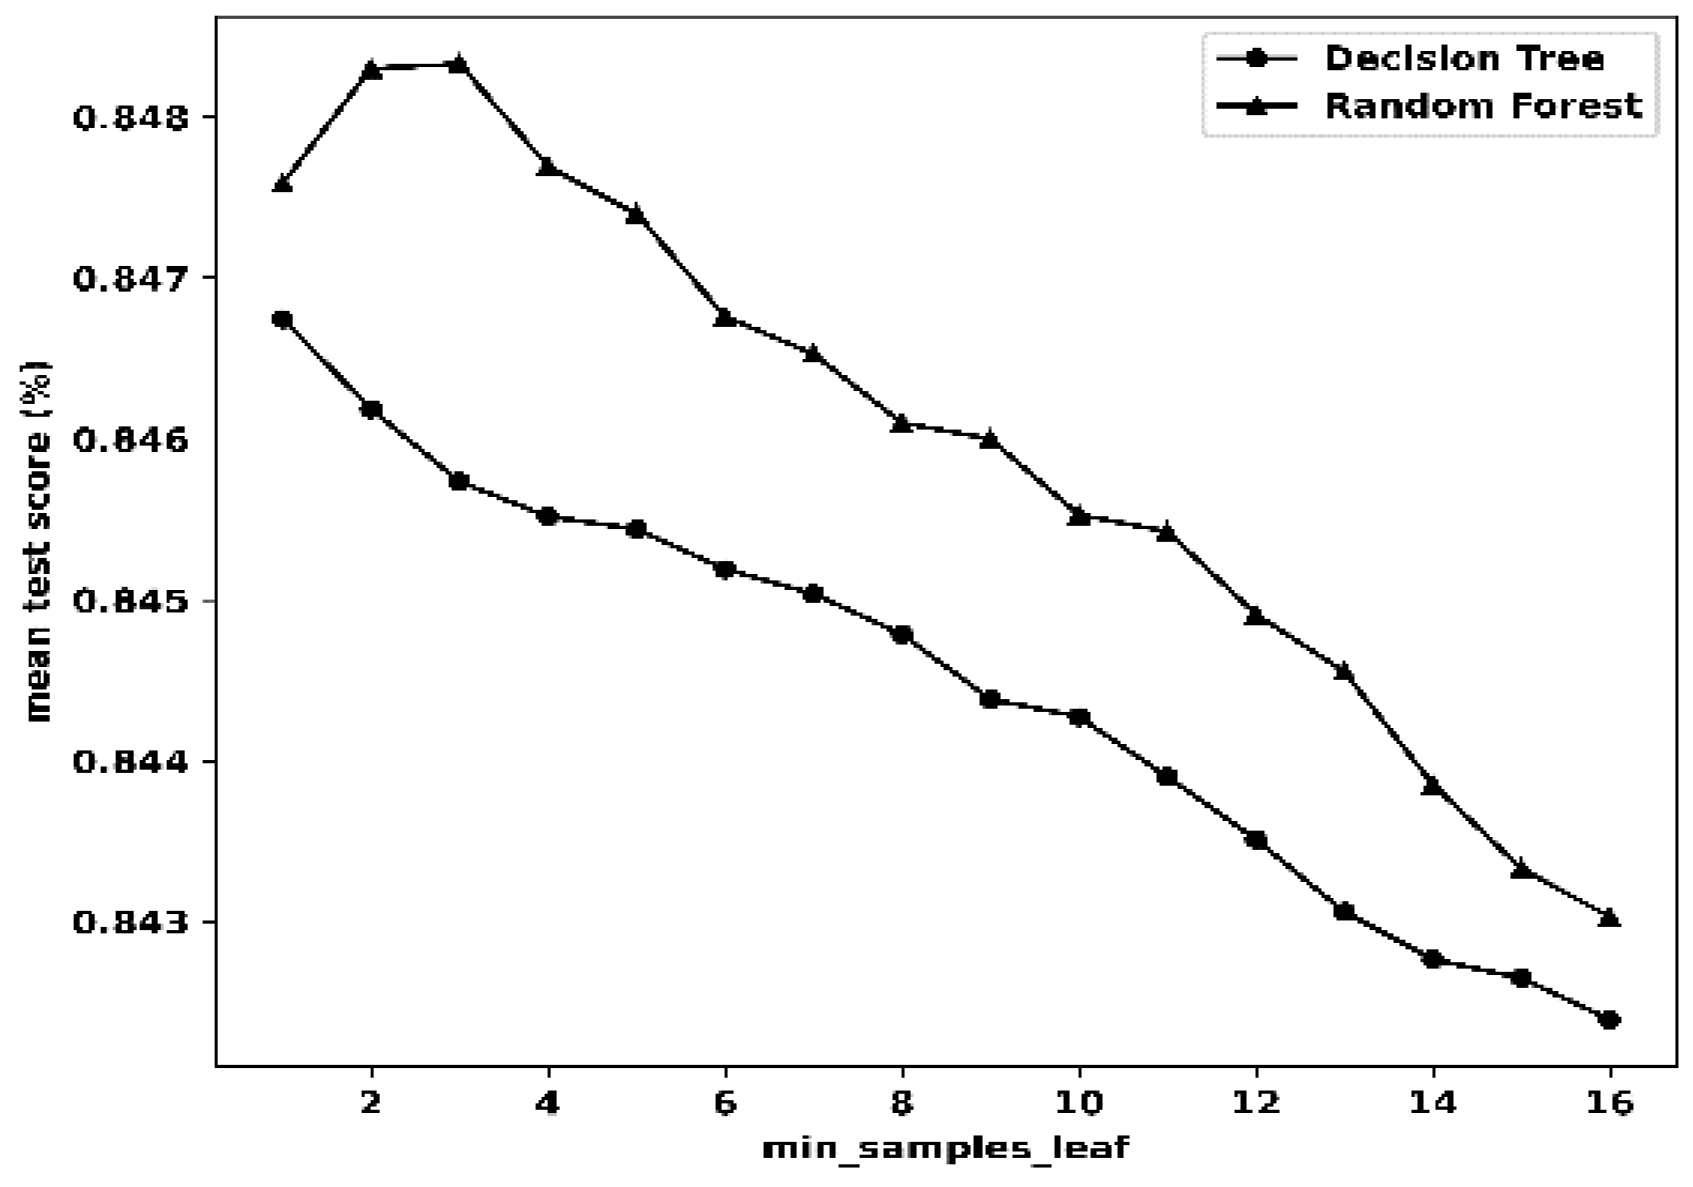
The minimum number of sample leaves (min_sample_leaf) was tuned after max_depth. The variations with respect to the mean score are presented in Figure 8 and Figure 9. It is obvious that the mean score decreases as the min_sample_leaf parameter increases for DT and increases and then decreases continuously for RF.
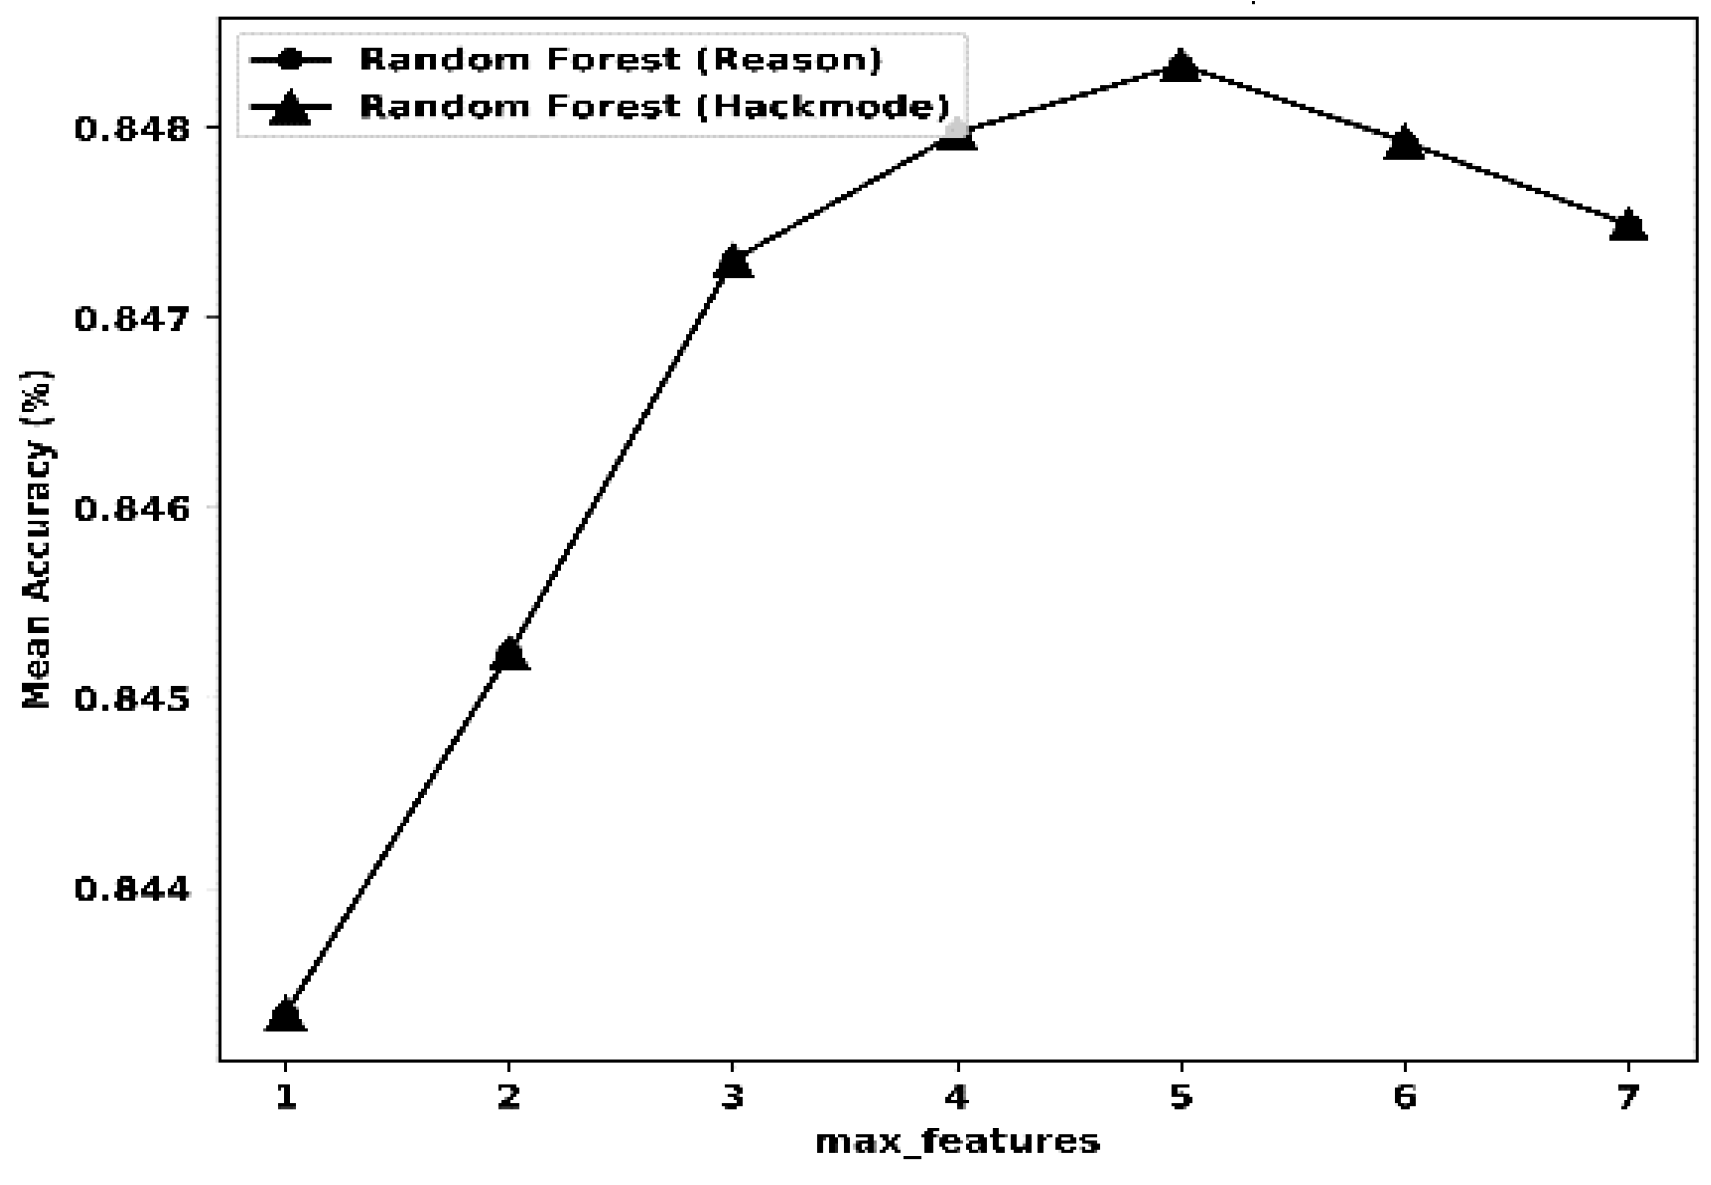
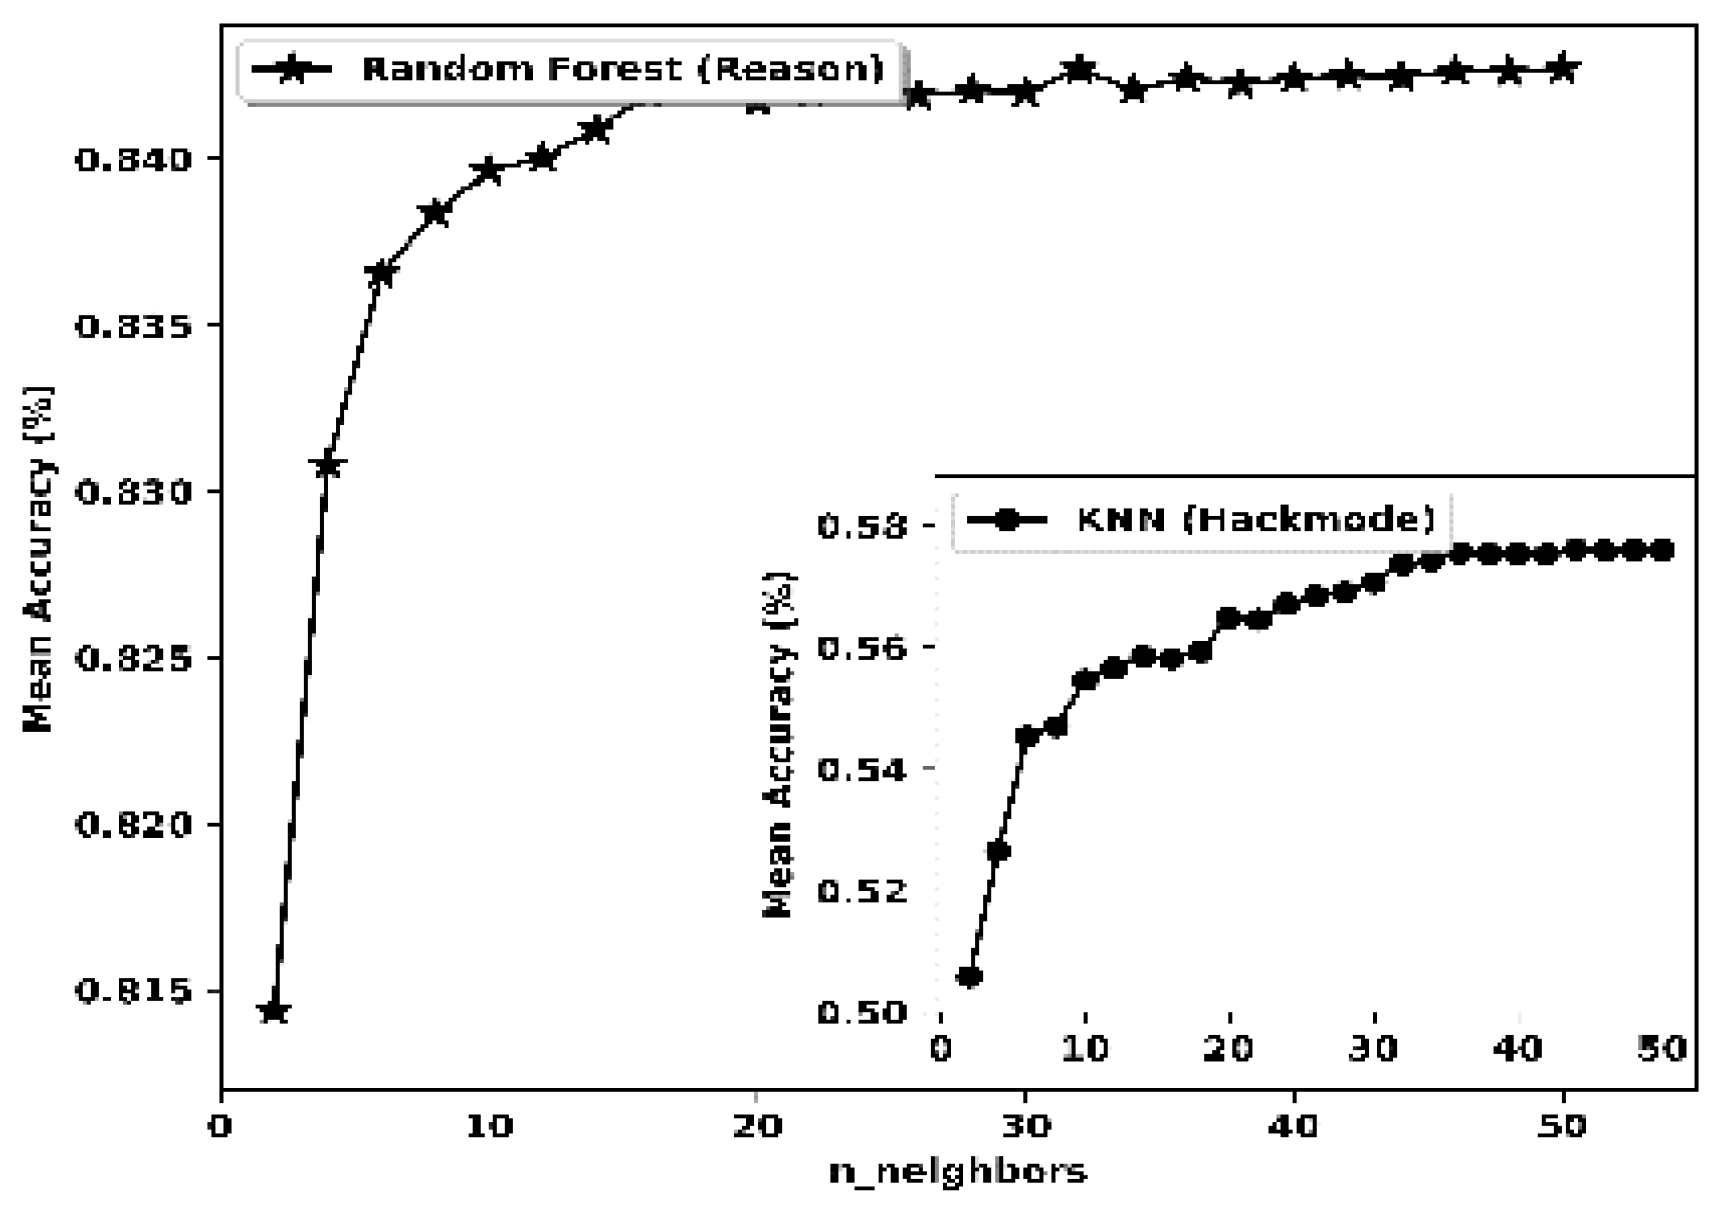
As presented in Figure 10 and Figure 11, the max_features and n_neighbours parameters were tuned for RF (reason and hackmode) and RF (reason) with k-NN (hackmode). The best values of each parameter were considered.
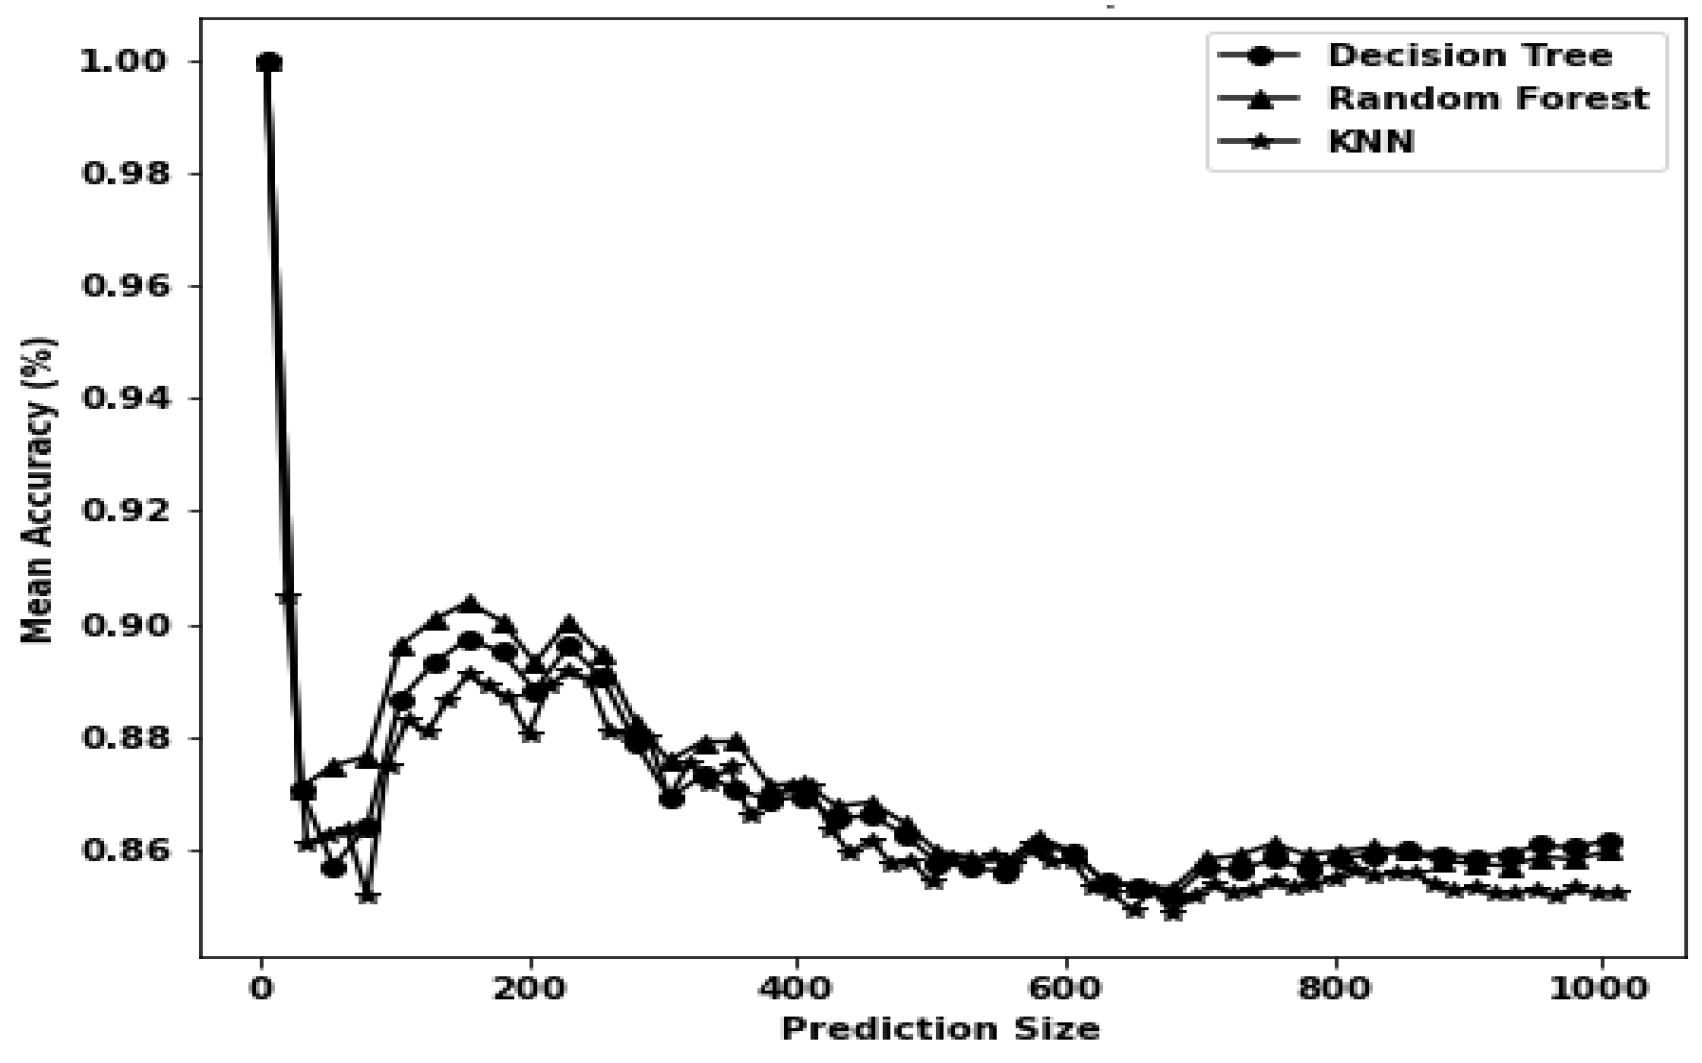
After model training, an accurate prediction of the target reason/hackmode can be made. The mean score of the model depends on the amount of the dataset being used as features to predict the targets. The mean score decreases with an increase in the number of prediction datasets. An accurate prediction can be made with 99% certainty in the case of a relatively small dataset (typical size of 1 to 5), and this is true for the DT, RF and k-NN models. In this study, when predicting the reason for the hack, the mean score decreases exponentially with an increase in the number of prediction datasets.
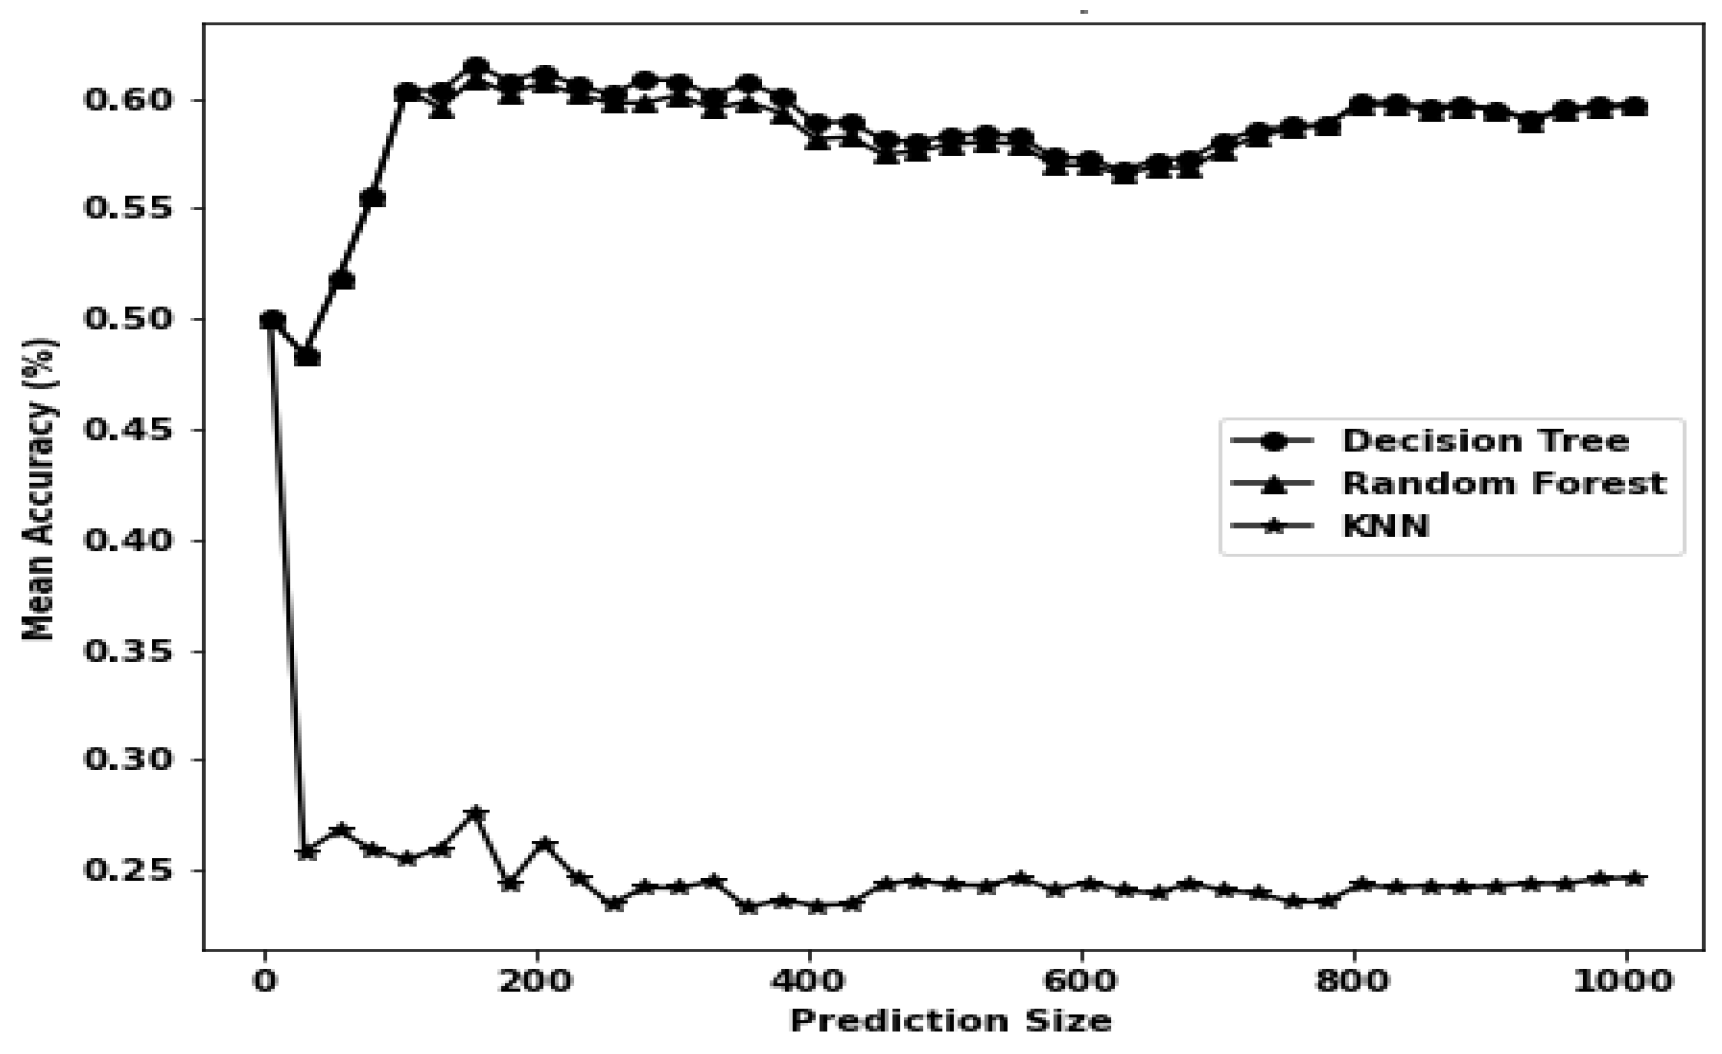
When predicting hackmode as the target, a different (opposite) interpretation to that when predicting reason is obtained. Here, two models, RF and DT, started with a mean score accuracy of 0.5 with a relatively small dataset for prediction, and this score increased as the number of datasets (i.e., test sets) increased from 50 to 200. The mean accuracy of these two models for predicting hackmode ranged between 0.5 for a relatively small test set and 0.6 for a relatively large test set. Finally, the k-NN model performed poorly when predicting hackmode for the datasets under consideration. The mean score decreased rapidly with an increasing number of test sets, as shown in Figure 13 and Figure 14.
Model selection involves choosing the best performance score with minimal mean error(s). It also involves the average time for training, evaluating and testing the model, among others. The best model for a given dataset will be the model with the highest performance and the shortest training and testing time. Table 3 shows the training and evaluation times for the three models as well as the average errors (0.148).
Table 4 lists the key factors that upset hackers’ and motivate them to hack websites. It summarizes the primary reasons for defacement in the study, which are given in order as follows: to be the best defacer, for fun, for political reasons, as a challenge, for patriotism, and for revenge. Keeping in mind that these are not the only reasons given in the study, they represent the top six reasons. The ratio column gives the percentage of each reason. It is clear that being the best defacer has the highest percentage (27.1%), and revenge against a website is the lowest ranking reason in the table (2.675%). Indeed, such findings motivate us to increase the amount of computing-based ethics in our communities’ education phases. In this regard, searching for what factors are transforming and promoting defacers offers great information. In addition, addressing what trends have increased the risks of using information technology in an unethical manner may decrease website issues.
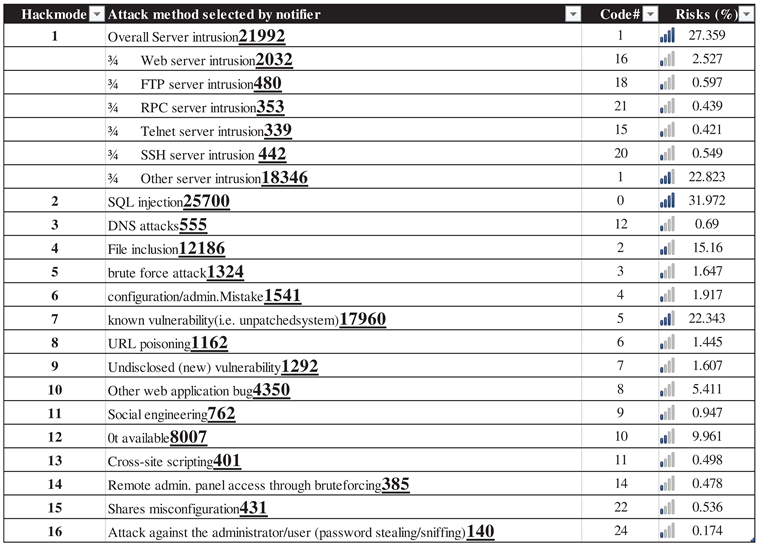
Table 5 details the method(s) of attack chosen by the attacker with the corresponding risk measurement as a percentage. This table outlines the hacking methods in descending order and lists only the fifteen most frequently occurring methods. With a risk of approximately 32%, SQL injection is the highest hackmode ranking level. Usually, hackers exploit data-driven applications and easily penetrate the system via SQL injection methods. These methods represent an attacker’s direct access vector for websites; therefore, they have been extensively utilized to outbreak massive types of SQL databases. To address this problem, many proposals have been introduced; nevertheless, SQL injection threats are growing. Overall, server intrusion is the second highest attack risk (27.359%) because servers are incubators for the system.
Table 6 lists a review of the major differences in prediction models and gives the great significance of our study. In addition to clarify comparison with recent related studies.
Regarding website defacement and hacktivism, the following points are very valuable to consider:
Table 6 demonstrates that our study gives the best result for the website prediction algorithms.
When predicting website defacement, features as domain, system/OS, web_server, reason, hackmode, type, defacement, state, and location are correlated and key variables that can be used in the prediction equation.
Based on the accuracy factor, prediction algorithms can be ranked in order as follows: DT, random forest, and k-nearest neighbour.
The top five affected countries are ranked as follows: USA47.24%, UK6.59%, Germany6.18%, India6.56%, and Netherlands5.15%. Additionally, this study has revealed that all countries are routinely affected by defacement cyberattacks.
After mining the dataset, our analysis reveals a lack of Islamic-far-extremist and Jihadist defacement and hacktivism, and the findings show a very weak extremist contribution in terms of defacement (i.e., very low (0.00249%)). This fact has encouraged the authors to argue that 1) extremist Islamic groups may lack deep defacement coding skills or 2) powerful guard systems that have been recently established limit their activity and bind their cybercrime aggressiveness or both. Furthermore, 3) the continuous disassembly of entire networks may prevent them from training and acquiring superior IT skills.
Employing powerful machine learning methods for predicting website defacement and hacktivism is the researchers’ first approach to carry out their computations and achieve good results.
URL poisoning is among the leading factors responsible for 1162 cases (1.5%).
The study outcome can be utilized by safe communities, institutions, organizations, governments, and individuals to promote immunity against defacement and hacking risks.
Concerning website cybercrimes, prevention is better than detecting and avoiding.
Table 5 concludes major website hacking methods and in order: Server intrusion, SQL injection, DNS injection, File inclusion.
Overall server intrusion includes several sub-cybercrime types, and they can be listed as: web server intrusion, FTP server intrusion, SSH server intrusion, RPC server intrusion, and Telnet server.
Prediction embedded massive algorithms, however, DT, RF, are k-NN are the most fit algorithms for computing hackmode and reason outputs.
Analyse attack reason selected by attacker, “I Just want to be the best defacer” was the first (i..e. 27.1%). However, “Revenge against the website” was the lowest (i.e., 2.68%).

Conclusion

Increasing demands for safeguarding from website defacement attacks motivated the authors to conduct this research. Website defacement avoidance is better than detection and recovery. In fact, modelling represents a researchers’ gateway to secure communities and institutions’ websites from defacement hacktivism and boosts their awareness against malicious defacers.
Zone-H Inc. represents a basic data mining reference that provides accurate datasets to accomplish this type of study. Extended dimensionality for the dataset was reduced based on a feature’s contribution and by using the chi square technique. The independent variables chosen were ‘domain’, ‘system’, ‘web_server’,’redefacement’, ‘type’, and ‘def_grade’. However, the dependent output variables were chosen as ‘reason’ for the first set and ‘hackmode’ for the second set. Several machine learning algorithms were adopted to predict popular website defacement factors named ‘reason’ and ‘hackmode’. The GridSearch CV technique was performed to tune the hyperparameters of the three selected models: DT, RF, and k-NN. The hyperparameters were permuted and tuned until the best score(s) were obtained in each case and reported. The most significant parameter in all three models was accurately adjusted by tuning for further improvement of the models while maintaining the above method parameters. The performance measure factors max_depth and min_sample_leaf were considered for the case of DT and RF, and n_neighbours was considered for the case of k-NN.
Further development of this study can be performed in several ways. A deep mining-exploration can be conducted in terms of, clustering, outliers, and modelling exploiting elite neural networks algorithm(s).

References

  1. Romagna, M.; van den Hout, N. J (October 2017) Hacktivism and Website Defacement: Motivations, Capabilities and potential Threats. Proceedings of the 27th Virus Bulletin International Conference: 41–50. Retrieved 8 October 2017.
  2. Aslan, Çağrı Burak; Li, Shujun; Çelebi, Fatih V.; Tian, Hao (9 November 2020) The World of Defacers: Looking Through the Lens of Their Activities on Twitter. IEEE Access. 8: 204132–204143. [CrossRef]
  3. Hoang, Xuan Dau (2018) A Website Defacement Detection Method Based on Machine Learning Techniques. Proceedings of the Ninth International Symposium on Information and Communication Technology - SoICT 2018. Danang City, Viet Nam: ACM Press: 443–448. ISBN 978-1-4503-6539-0. [CrossRef]
  4. Bartoli, A.; Davanzo, G.; Medvet, E(2010) A Framework for Large-Scale Detection of Web Site Defacements. ACM Trans. Internet Technol. 2010, 10, 10.
  5. Zone-H. (2022) News. www.zone-h.org/listingnews. Accessed (9th June 2021).
  6. Burruss, G. W., Howell, C. J., Maimon, D., & Wang, F (2021) Website defacer classification: A finite mixture model approach. Social Science Computer Review.
  7. Davanzo, G.; Medvet, E.; Bartoli, A(2011) Anomaly detection techniques for a web defacement monitoring service. J. Expert Syst. Appl. 38, 12521–12530.
  8. Banerjee, S., Swearingen, T., Shillair, R., Bauer, T. J., & Ross, A (2021) Using machine learning to examine cyberattack motivations on web defacement data. Social Science, Computer Review.
  9. Zhang, X., Tsang, A., Yue, W. T., & Chau, M (2015) The classification of hackers by knowledge exchange behaviors. Information Systems Frontiers, 17(6), 1239–1251.
  10. Maimon, David, Andrew Fukuda, Steve Hinton, Olga Babko-Malaya, and Rebecca Cathey (2017) On the Relevance of Social Media Platforms in Predicting the Volume and Patterns of Web Defacement Attacks. in 2017 IEEE International Conference on Big Data (Big Data), 4668-4673. IEEE.
  11. Andress, J., & Winterfeld, S (2013) Cyber warfare: Techniques, tactics and tools for security practitioners. Elsevier.
  12. Howell, C. J., Burruss, B. W., Maimon, D., & Sahani, S (2019) Website defacement and routine activities: Considering the importance of hackers’ valuations of potential targets. Journal of Crime and Justice, 42, 536.
  13. Maggi, F., Balduzzi, M., Flores, R., Gu, L., & Ciancaglini, V (2018) Investigating web defacement campaigns at large. In Proceedings of the 2018 on asia conference on computer and communications security (pp. 443–456).
  14. Ooi, Kok Wei, Seung-Hyun Kim, Qiu-Hong Wang, and Kai Lung Hui (2012) Do Hackers Seek Variety? An Empirical Analysis of Website Defacements. AIS.
  15. Borgolte, K.; Kruegel, C.; Vigna, G. Meerkat (2015) Detecting Website Defacements through Image-based Object Recognition. In Proceedings of the 24th USENIX Security Symposium (USENIX Security), Washington, DC, USA, 12–14 August 2015.
  16. Yury Zhauniarovich, Issa Khalil, Ting Yu, Marc Dacier ((2018)) A Survey on Malicious Domains Detection through DNS Data Analysis, ACM Computing Survev, 1 (1), pp. 35.
  17. Rajesh Gupta, Sudeep Tanwar, Sudhanshu Tyagi, Neeraj Kumar (2020) Machine Learning Models for Secure Data Analytics: A taxonomy and threat model, Computer Communications, Volume 153, pp. 406-440. [CrossRef]
  18. Mohamed Amine Ferrag, Leandros Maglaras, Sotiris Moschoyiannis, Helge Janicke (2020) Deep learning for cyber security intrusion detection: Approaches, datasets, and comparative study, Journal of Information Security and Applications, Vol. 50, 2020, 102419. [CrossRef]
  19. News, (2003)Web defacing contest stirs up conflict, Computer Fraud & Security, Vol. 2003, 8, 2003, pp.2-3. [CrossRef]
  20. Samaneh Mahdavifar, Ali A. Ghorbani (2019) Application of deep learning to cybersecurity: A survey, Neurocomputing, Vol. 347, Pages 149-176. [CrossRef]
  21. Defacer.ID(2022). Available online: https://defacer.id (accessed on 10 April 2022).
  22. Burruss et al., (2021) Website defacer classification: a finite mixture model approach, Social Science Computer Review 1-13.
  23. Aslan, C¸ B., Li, S., C¸ elebi, F. V., & Tian, H (2020) The world of defacers: Looking through the lens of their activities on Twitter. IEEE Access, 8, 204132–204143.
  24. Fox, B. H., & Farrington, D. P (2015) An experimental evaluation on the utility of burglary profiles applied in active police investigations. Criminal Justice and Behavior, 42(2), 156–175.
  25. Braga, A. A., Turchan, B., Papachristos, A. V., & Hureau, D. M (2019) Hot spots policing of small geographic areas effects on crime. Campbell Systematic Reviews, 15(3). [CrossRef]
  26. Bruinsma, G. J. N., & Johnson, S. D. (Eds.)(2018) The oxford handbook of environmental criminology. Oxford University Press. [CrossRef]
  27. A. Moneva et al., (2022) Repeat victimization by website defacement: An empirical test of premises from an environmental criminology perspective, Computers in Human Behavior, 126 (2022), 106984.
  28. Gurjwar R.K, Sahu D.R., and Tomar D.S., (2013) An approach to reveal website defacement, International Journal of Computer Science and Information Security (IJCSIS), Vol. 11, No. 6, June 2013.
  29. Hoang, X.D (2018) A Website Defacement Detection Method based on Machine Learning. In Proceedings of the International Conference on Engineering Research and Applications (ICERA 2018), Thai-Nguyen, Vietnam, 1–2 December 2018.
  30. Banff Cyber Technologies (2022) Best Practices to Address the Issue of Web Defacement. Available online: https://www.banffcyber.com/knowledge-base/articles/best-practices-address-issue-web-defacement/ (accessed on 26 April 2022).
  31. H. Hassani, X. Huang, E. S. Silva, and M. Ghodsi (2016) A review of data mining applications in crime, Statistical Analysis and Data Mining: 9e ASA Data Science Journal, vol. 9, no. 3, pp. 139–154.
  32. Y.-H. Tseng, Z.-P. Ho, K.-S. Yang, and C.-C. Chen (2012) Mining term networks from text collections for crime investigation, Expert Systems with Applications, vol. 39, no. 11, pp. 10082– 10090.
  33. A. Malathi and S. S. Baboo, (2011) An enhanced algorithm to predict a future crime using data mining, International Journal of Computer Applications, vol. 21, no. 1, 2011.
  34. Hoang X. D. and Nguyen N. T., (2019) Detecting website defacements based on machine learning techniques and attack signatures, Computers 2019, 8, 35.
  35. S.G.A. van de Weijer et al., (2021) Heterogeneity in trajectories of cybercriminals: a longitudinal analyses of web defacements, Computers in Human Behavior Reports, 4 (2021), 100113.
  36. Holt et al., (2021) Examining the characteristics that differentiate jihadi-associated cyberattacks using routine activities theory, Social Science Computer Review, pp.1-17.
  37. Berton, B., & Pawlak, P. (2015) Cyber jihadists and their web. European Union Institute for Security Studies.
  38. Central Intelligence Agency (2018) The CIA world factbook 2018. Skyhorse Publishing Inc.
  39. Heickero¨, R (2014) Cyber terrorism: Electronic jihad. Strategic Analysis, 38(4), 554–565.
  40. Carson, J. V., & Suppenbach, M. (2018) The Global Jihadist Movement: The most lethal ideology? Homicide Studies, 22(1), 8–44.
  41. Mee Lan Han et al., (2019) CBR-based decision support methodology for cybercrime investigation: focused on the data-driven website defacement analysis, Hindawi, Security and Communication Networks, Vol. 2019, (1901548), pp.21.
  42. Howell, Jordan C., George W. Burruss, David Maimon & Shradha Sahani (2019) Website defacement and routine activities: considering the importance of hackers’ valuations of potential targets, Journal of Crime and Justice, 42, 2019, pp.536-550.
  43. Bernasco, W (2008) Them again?: Same-offender involvement in repeat and near repeat burglaries. European Journal of Criminology, 5(4), 411–431. [CrossRef]
  44. E. ALPAYDIN (2010) Introduction to Machine Learning, 2nd ed., London: MIT press, 2010, pp. 67-97.
  45. V. N. Vapnik, (2000) The nature of statistical learning theory, 2nd ed., New York: Springer, 2000, pp. 112-235.
  46. V. CHERKASSKY and Y. MA, (2004) Practical selection of SVM parameters and noise estimation for SVM regression, Neural Networks, 17, 2004, pp.113–126.
  47. Holt, T. J., Leukfeldt, R., & van de Weijer, S (2020) An examination of motivation and routine activity theory to account for cyberattacks against Dutch web sites. Criminal Justice and Behavior, 47(4), 487–505.
  48. Holt, T. J., Stonhouse, M., Freilich, J., & Chermak, S. M (2019) Examining ideologically motivated cyber-attacks performed by far-left groups. Terrorism and Political Violence, 33, 1–22.
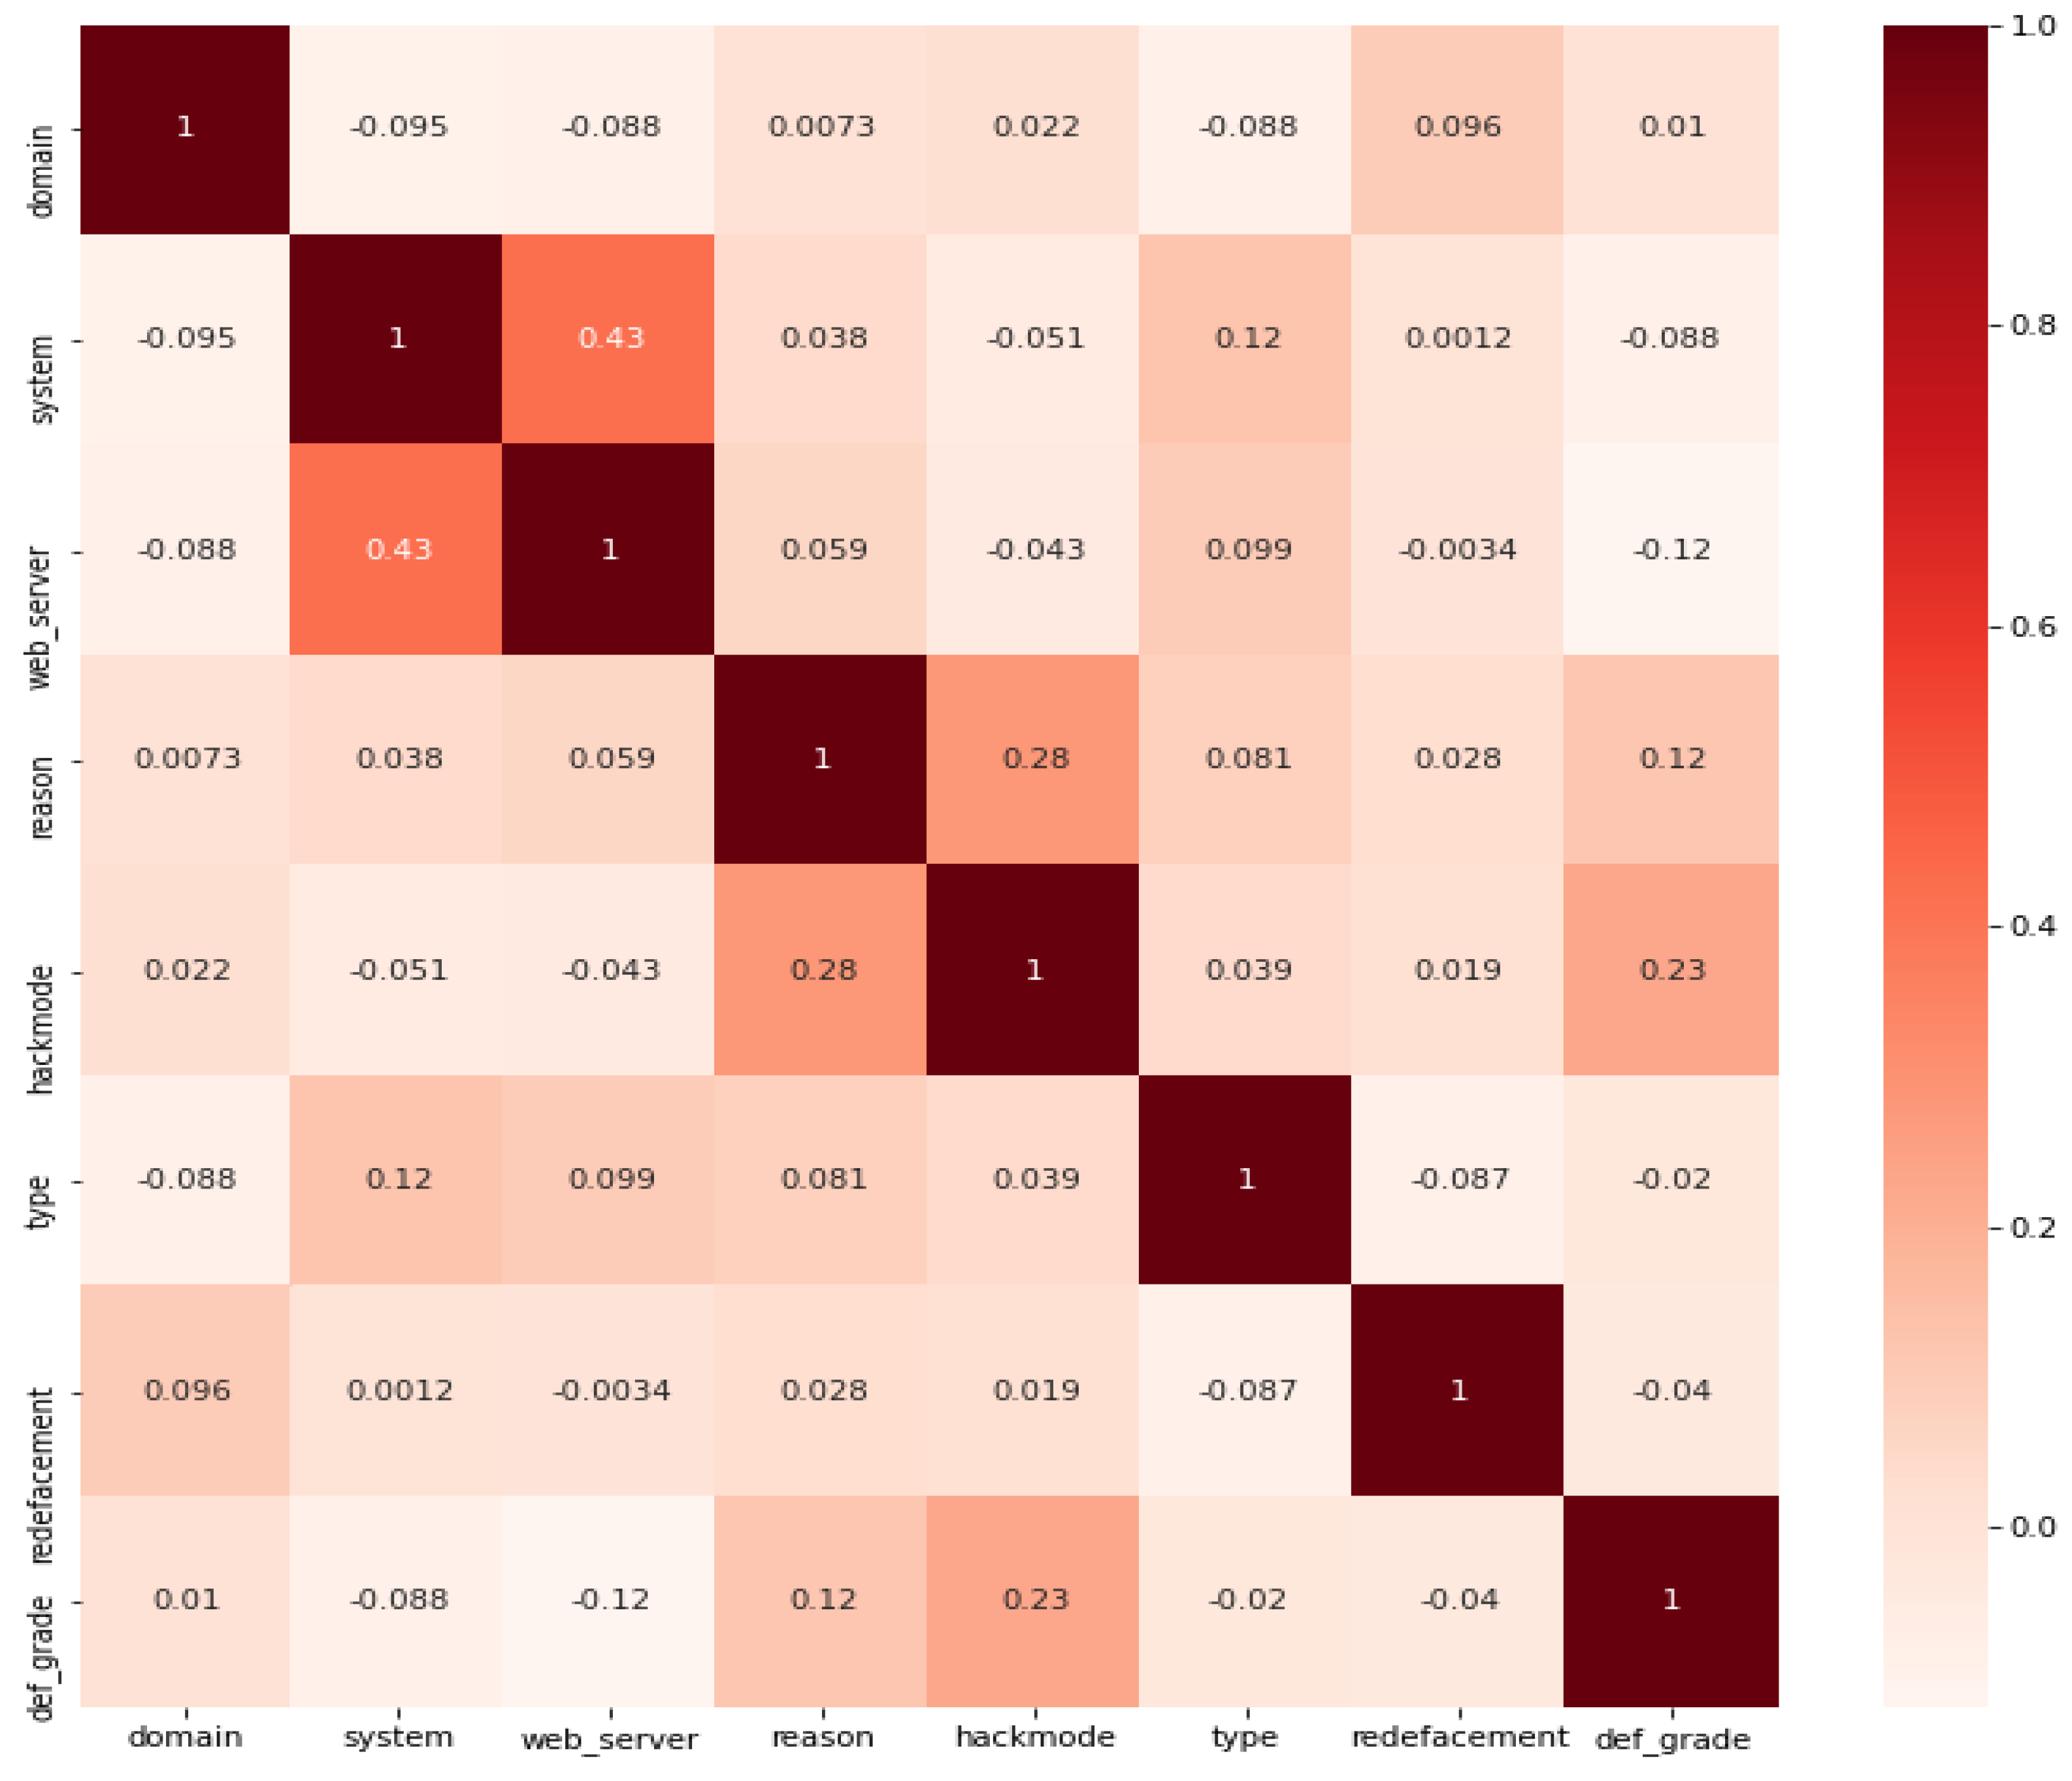
Figure 2. Correlation matrix.
Preprints 88818 g001
Figure 3. Prediction classifiers used.
Preprints 88818 g002
Figure 4. CV as a function of mean score for the reason target.
Preprints 88818 g003
Figure 5. CV as a function of mean score for the hackmode target.
Preprints 88818 g004
Figure 6. Variation of max depth with respect to the mean test score for the reason target using DT & RF.
Preprints 88818 g005
Figure 7. Variation of max_depth with respect to the mean test score for the hackmode target using DT & RF.
Preprints 88818 g006
Figure 8. Variation in min_sample_leaf as a function of mean test score for DT and RF (hackmode as the target).
Preprints 88818 g007
Figure 9. Variation in min_sample_leaf as a function of the mean test score for DT and RF (reason as the target).
Preprints 88818 g008
Figure 10. max_ features based on the mean score for RF with both reason and hackmode as targets.
Preprints 88818 g009
Figure 11. Effect of increasing the size of n_neighbour on the mean accuracy (reason & hackmode).
Preprints 88818 g010
Figure 13. Effect of increasing the number of predictions on the mean score (reason as target).
Preprints 88818 g011
Figure 14. Effect of increasing the number of predictions on the mean score (hackmode as target).
Preprints 88818 g012
Table 1. Descriptive Statistics of the Dataset.
Statistical
Metric
Dataset Features
Domain System Web_Server Reason Hackmode Type Redefacement Def_Grade Domain System
Mean 2.8 0.85 0.67 1.26 3.93 0.72 0.12 0.24 2.8 0.85
Stdv. 2.89 1.72 1.13 2.25 5.14 0.45 0.33 0.43 2.89 1.72
Min 0 0 0 0 0 0 0 0 0 0
25% 1 0 0 0 1 0 0 0 1 0
50% 1 0 0 0 2 1 0 0 1 0
75% 5 0 1 2 5 1 0 0 5 0
Max 16 17 17 10 26 1 1 1 16 17
Count 80382 80382 80382 80382 80382 80382 80382 80382 80382 80382
Stdv: Standard deviation; Min. and Max, minimum and maximum, respectively.
Table 2. Input/output features for each model.
Model Hyperparameter(s) Target Hyperparameter(s) Target
Parameter(s) Value(s) Parameter(s) Value(s)
Decision Tree (DT) CVa 16 Reason CV 14 Hackmode
max_depth 16 max_depth 14
min_sample_leaf 1 min_sample_leaf 1
Random Forest (RF) CV 15 Reason CV 16 Hackmode
max_depth 16 max_depth 16
max_features 5 max_features 5
min_sample_leaf 3 min_sample_leaf 3
K-nearest Neighbour (k-NN) CV 8 Reason CV 14 Hackmode
algorithm ball_tree Algorithm ball_tree
n_neighbours 18 n_neighbours 7
leaf_size 9 leaf_size 9
weights distance weights distance
CV: Cross-validation.
Table 3. Model training and evaluation time and mean error.
Model Training Time (s) Evaluation Time (s) Mean Error (%) Target Training Time (s) Evaluation Time (s) Mean Error (%) Target
DT 0.342 0.018 0.1488 Reason 0.228 0.018 0.4131 Hackmode
RF 17.832 1.17 0.1479 Reason 14.712 2.13 0.4135 Hackmode
k-NN 39.678 68.34 0.156 Reason 37.86 73.692 0.4372 Hackmode
Table 4. reasons & motivations.
Reason(s) Attack reason selected by attacker Ratio (%)
0 Heh...just for fun! 57046 6.277%
1 Political reasons3619 4.500%
2 I just want to be the best defacer21782 27.098%
3 Revenge against the website2151 2.675%
4 As a challenge2540 3.156%
5 Patriotism2247 2.795%
Table 5. major hacking facts.
Preprints 88818 i001
Table 6. A comparison profile for website defacement prediction models using machine learning techniques.
Author(s), year(s) Dataset SRC, Size #Objects Duration, Type Software tool Algorithm(s) Metrics Purpose
Ours Zone-H
93644 defacements
80382 objects 2015-2016, standard Python 3.10 (64-bit) - DT
- RF
-k-NN
max_depth, min_sample_leaf, n_neighbours
timing
AVG errors accuracy
Classifier prediction
Burruss et al., 2021 Zone-H
1292 defacements
119->questionnaire
119 questionnaires June-August 2017,
1062->Standard
119->Questionnaire
Stata v 16.1, gsem command(StataCrop,2017) AIC = 657.653, BIC = 668.769, Log likelihood - IRR%
- SE
Classifier prediction
A. Moneva et al., 2022 Zone-H
9117268 defacements
23.6%-single attack
76.4%-mass attack
2010-2017, standard R-package3.6.1&R-Studio1.2.5001 Statistical means - Bar charts
- Histograms
- Log10
- Percentage%
- Frequency
Regression assessment.
Gurjwar R.K, Sahu D.R., and Tomar D.S., 2013 Monitoring
250 image
MANIT, Bhopal (M.P.), INDIA
100 webpage 2013, Monitoring CentOS Linux 5.9
C#.Net
CRC32, MD5, SHA 512, PSNR and SSIM techniques. -Accuracy Pre-processed/data clean.
Hoang X. D. and Nguyen N. T., 2019 1200 English
217 Vietnamese
1200 DefacedPages
50 attack signatures 2019, standard Python Sklearn machine learning library Multinominal Naïve Bayes
Random Forest
- Accuracy
- F1 score
- Detection rate%
Raw data conducted.
S.G.A. van de Weijer et al., 2021 Zone-H
2,745,311 defacements
66,553 hackers 2010-2017, standard PL(i.e.,C++/Java) Logistic regression Hackers’ AVGs for:
- Timing
- Length
- frequency
Regression
Holt et al., 2021 Zone-H
2285172 defacements
2012-2016 @USA
29,035 attackers 2012-2016, standard STATA 13 using the cluster command Routine activity theory(RAT)
Binary logistic regression
-SE
- b
- # multicollinearity
- Tolerance
- Variance inflation
Classifier prediction
Mee Lan Han et al., 2019 Zone-H
212,093 defacements
k-hacker@DB randomly selected 100 hackers 2004-2019, standards data driven and evidence driven decision tools CBR-based - similarity measure
- clustering
Data drive.
Howell Jordan C., et al., 2019 13 M@Zone-H
United States’ Central Intelligence Agency
Freedom House
Forum of Incident Response and Security Teams(FIRST.org)
Kaspersky Lab
114 countries 2017, standard Statistical Analysis tools Negative binominal regression -IRR
- SD, AVGs
- b
Classifier prediction.
Key: AIC and BIC are the Akaike information criterion and Bayesian information criterion, respectively. AVG: average, b: binary regression, IRR: incident risk ratio IRR%, B: change in the log of counts (b).
Disclaimer/Publisher’s Note: The statements, opinions and data contained in all publications are solely those of the individual author(s) and contributor(s) and not of MDPI and/or the editor(s). MDPI and/or the editor(s) disclaim responsibility for any injury to people or property resulting from any ideas, methods, instructions or products referred to in the content.
Copyright: This open access article is published under a Creative Commons CC BY 4.0 license, which permit the free download, distribution, and reuse, provided that the author and preprint are cited in any reuse.
Prerpints.org logo

Preprints.org is a free preprint server supported by MDPI in Basel, Switzerland.

Subscribe

© 2024 MDPI (Basel, Switzerland) unless otherwise stated