Preprint
Article

Analysis of Rat Brainstem Transcriptome Changes after Acute Stress

Altmetrics

Downloads

151

Views

180

Comments

0

Submitted:

26 October 2023

Posted:

27 October 2023

You are already at the latest version

Alerts
Abstract
In this work, we tried to emphasize whole transcriptome expression changes in the Wistar rats brainstem two hours after acute stress. Most of the genes were upregulated. We detected massive shift of neuropeptides Crh, Trh,Cga, Tshb, Uts2b, Tac4, Lep and neuropeptide receptors Hcrtr1, Sstr5, Bdkrb2, Crhr2 signaling, as well as Glutamate Grin3b, Grm2 and GABA Gpr156, Acetylcholine Chrm4,Chrne, Adreno- Adra2b receptors expression uprising. Intensive increase in expression of intermediate filaments Krt83/Krt86/Krt80/Krt84/Krt87/Krt4/Krt76 and motor proteins Myo7a, Klc3 was detected. Remarkably, at this time we also observed signs of microglia activation. Both expression of anti-inflammatory cytokines Il13, Ccl24 and proinflammatory cytokin’s receptors Il9r, Il12rb1, Tnfrsf14, Tnfrsf13c, Tnfrsf25, Tnfrsf1b were increased. In the Wnt signaling pathway, we have seen increased expression of ligands-receptors Wnt1, Wnt11, Ror2, and also negative regulators Notum, Sfrp5, Sost. Also we conducted cDNA libraries normalization with duplex specific nuclease and compared results. On the basis of our RNAseq data, we chose reference genes for RT-qPCR best suitable for experiments with acute stress.
Keywords: 
Subject: Biology and Life Sciences  -   Neuroscience and Neurology

1. Introduction

Acute stress is an adaptive reaction of organisms that helps to overcome adverse environmental conditions [1,2]. During evolution, the presence of predators has formed a stereotyped behavioral response usually called “fight or fly”. Cooperative and fine tuned neuronal activity in different brain structures take part in this behavioral reaction. Among them the brainstem is worth noting - structure responsible for the autonomic control and reflexive responses to systemic and environmental stressors [3]. The brainstem contains multiple neuronal nuclei with different neurotransmitter systems that fulfill these functions [2]. Monoamines neuronal nuclei are located in this brain structure. It was shown that Locus coeruleus (LC) norepinephrine neurons modulate cognitive functions like memory and operant conditioning [4]. In the acute stress conditions activity of LC norepinephrine neurons participate in arousal reaction, together with action of elevated levels of hormones [5]. Excessive increased activity of brainstem neurons causes oxidative stress which could be a factor for further development of different psychopathologies [6].
To investigate gene expression changes in the brainstem after acute stress, whole transcriptome analysis (RNA-seq) could be used. Depending on the library preparation method, sequencing depth is different. Reads from rRNA or highly expressed transcripts consist of the majority of the overall reads. To obtain information about expression changes of rare transcripts, deep sequencing is needed, which could be expensive. To overcome this problem, rRNA is depleted before. Another approach that could be utilized is Duplex Specific Nuclease (DSN) treatment of the double stranded cDNA library after denaturation and rehybridization [7,8].
In this study, we carried out a Wistar rats brainstem RNA-seq analysis 2 hours after acute stress, which was a forced swimming test in our case. Main changes of gene expression were described together with functional annotation. DSN treatment of cDNA libraries also was done, and we compared RNAseq results of these two methods.

2. Results

2.1. Library characterization and consistency validation

As a model of acute stress we used the classical forced swim test (FST) paradigm (Figure 1). Two hours after final test samples were taken for the analysis. We prepared double stranded SMART-seq cDNA libraries with template switching technology (Figure 1).
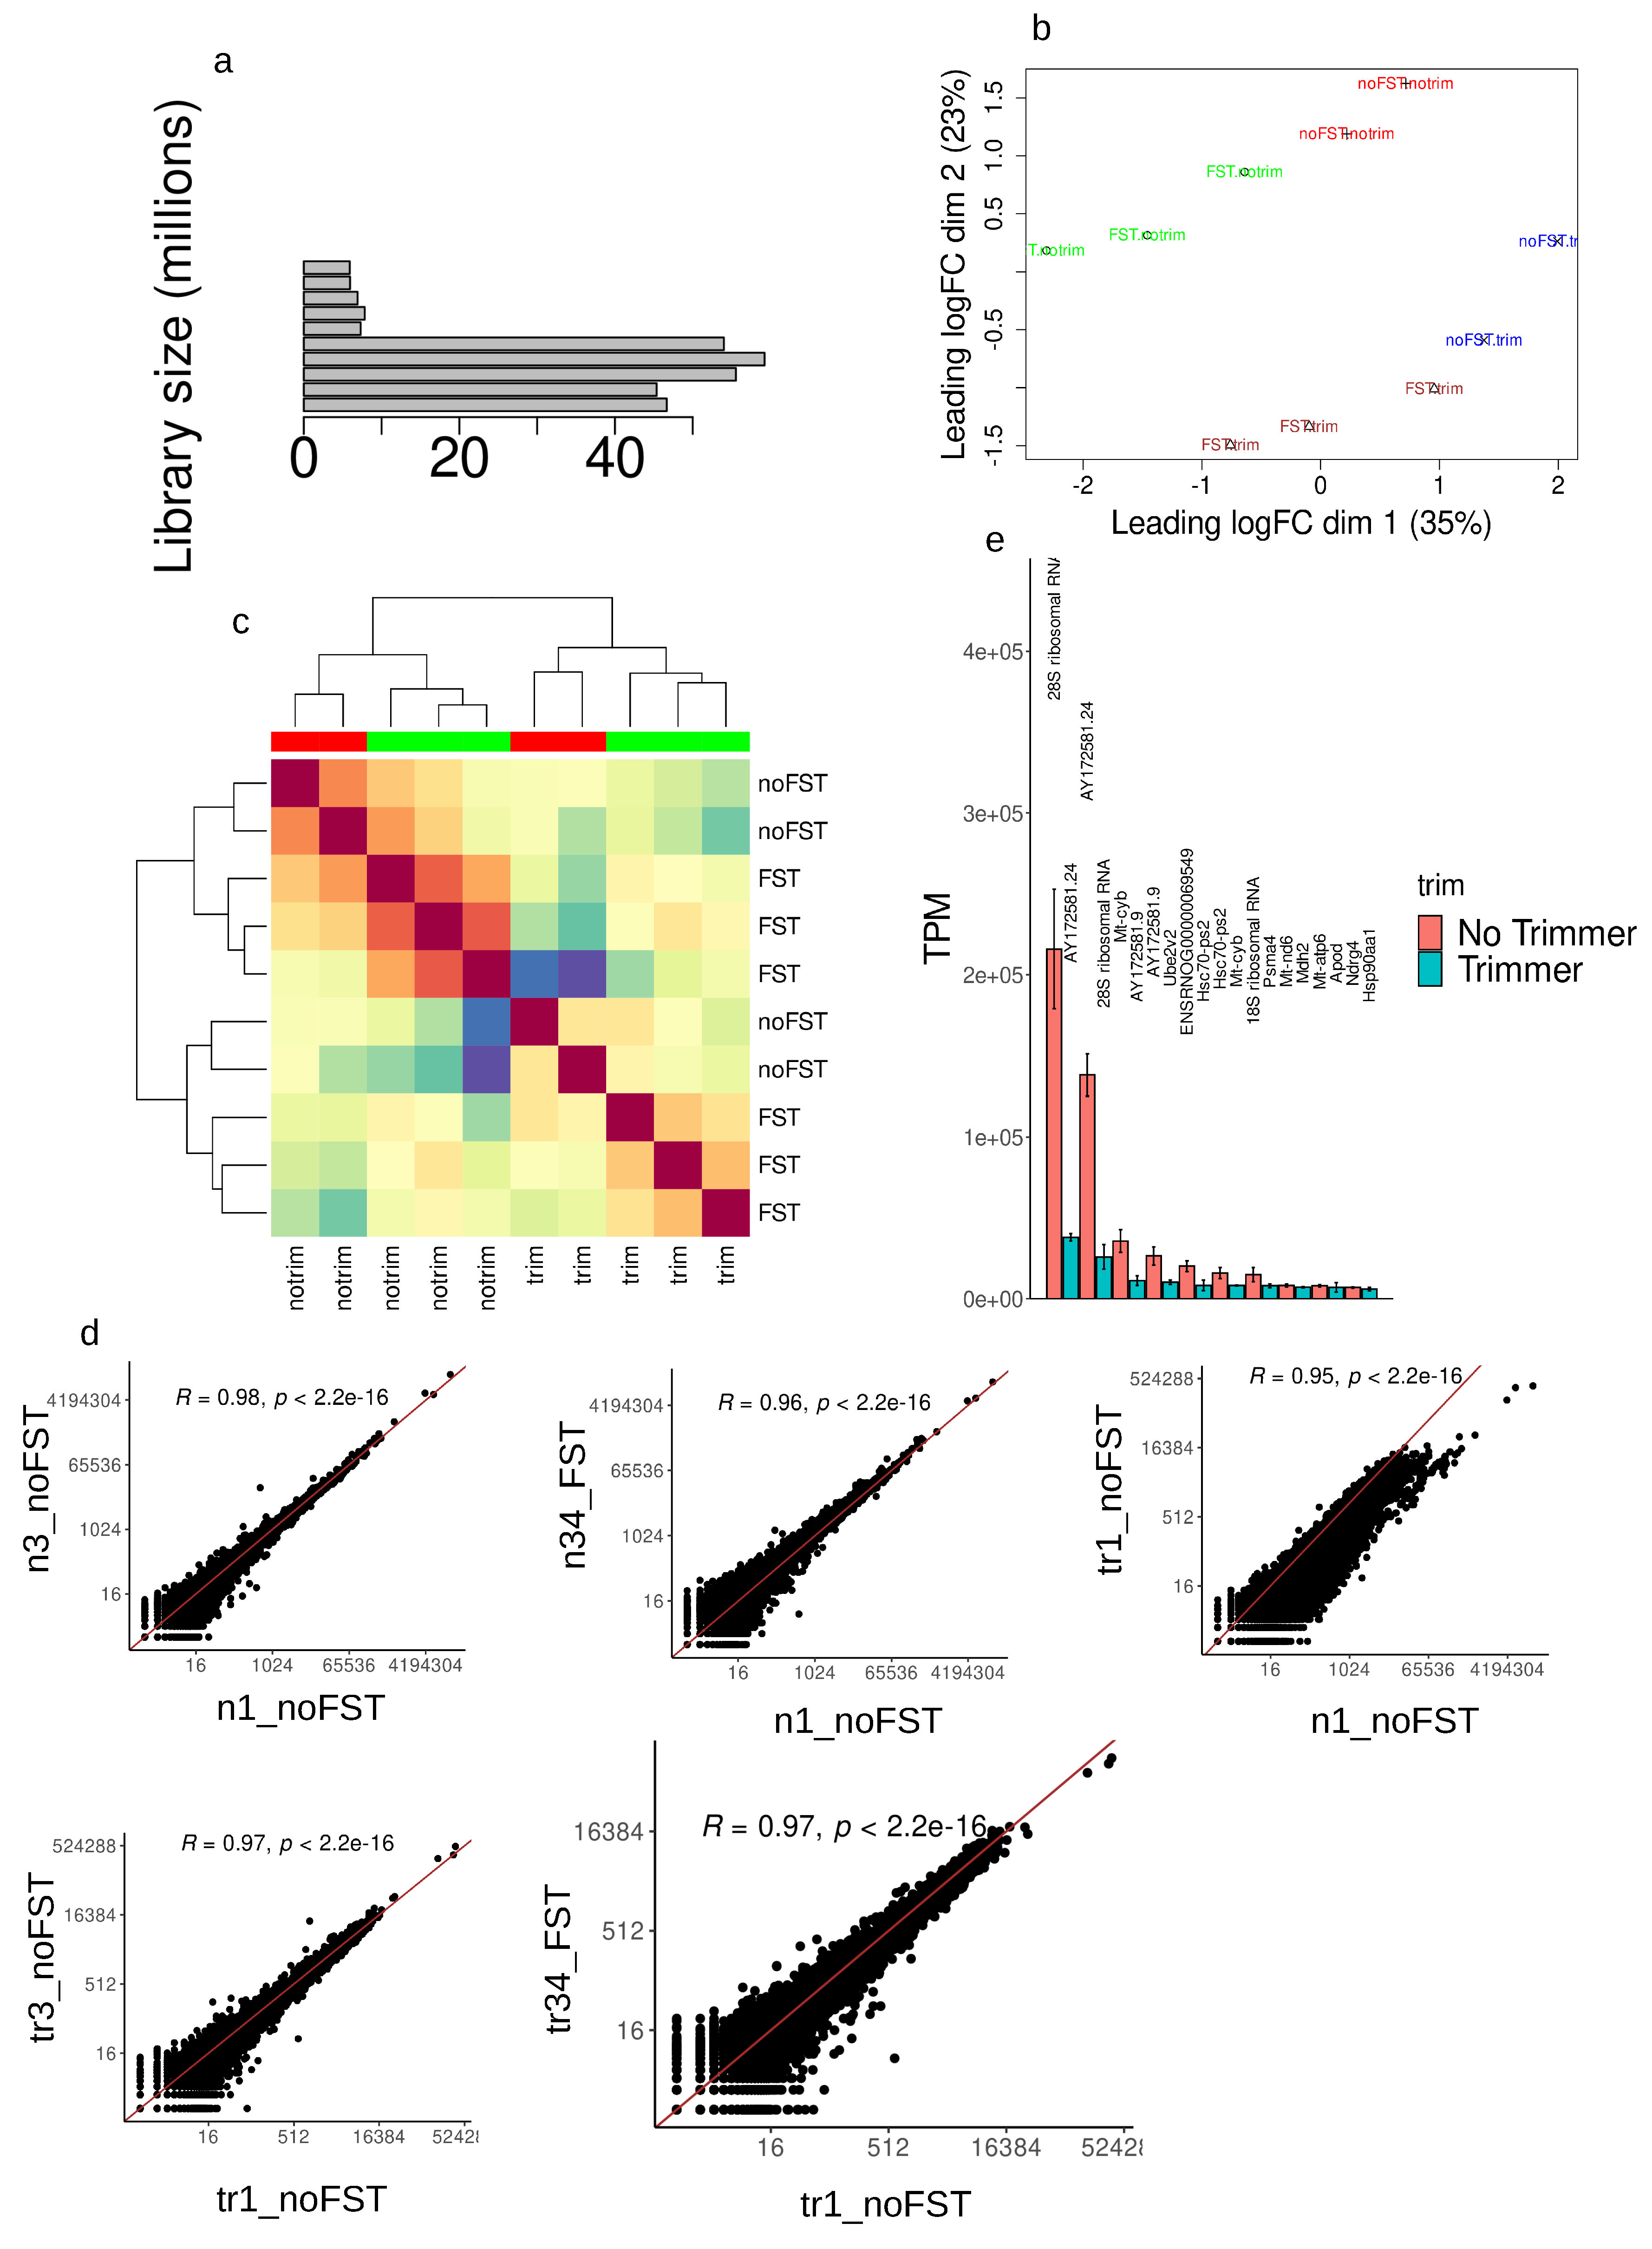
cDNA libraries normalization (trimming, i.e. DSN treatment) was done with duplex specific nuclease from Red King (Kamchatka) crab. After sequencing you can clearly see the difference in unnormalized library sizes and its reduction after DSN treatment Figure 2a. Interestingly, DSN untreated samples with FST had larger library sizes compared to respective control, which could indicate massive increases in transcription of a large number of genes (Figure 2a). Principal components analysis revealed sharp division of samples in the PCA dimensions (Figure 2b) - stressed from unstressed, DSN treated from DSN untreated as well. Hierarchical clusterization of genes count data also showed clear division of samples by group (Figure 2c). Genes read counts Pearson’s correlation was the smallest when comparing sample without DSN treatment and sample with treatment (R=0.95, p<2.2e-16, n1_noFST vs tr1_noFST, Figure 2d). It is clearly seen shifted from trend line dots on the graph (Figure 2d). Comparison of DSN untreated samples with and without stress also gives smaller correlation coefficients (R=0.96, p<2.2e-16, n1_noFST vs n34_FST, Figure 2d) in comparison with higher correlation coefficient of untreated samples from one experimental group (R=0.98, p<2.2e-16, n1_noFST vs n34_FST, Figure 2d). For the libraries preparation we used total RNA. Despite, that oligo for the first strand synthesis contained oligo(dT) sequence, majority of all reads was from rRNA in both DSN kind of libraries (28S rRNA; mitochondrial rRNA AY172581.24, AY172581.9; 18S rRNA, Hsc-70-pseudogene and some others Figure 2e). Only 28S rRNA and AY172581.24 consisted of the majority of transcripts. Mitochondrial rRNA could be polyadenylated [9]. In human cells non-abundant polyadenylated transcripts of the 18S and 28S rRNAs are detected as well [10]. Despite that it is minor species of rRNA, anyway their quantities per cell allow to occupy majority of the library. From the protein coding genes cytochrome b, NADH dehydrogenase subunit 6, ATPase subunit 6, NDRG family member 4 were present in 10 most expressed transcripts (Figure 2e). Interestingly, after DSN treatment the list of 10 most abundant transcripts changed, but anyway the majority consist of 28S rRNA, AY172581.24 with addition of Mt-cyb to them (Figure 2e).

2.2. Transcriptomic alteration and functional annotation

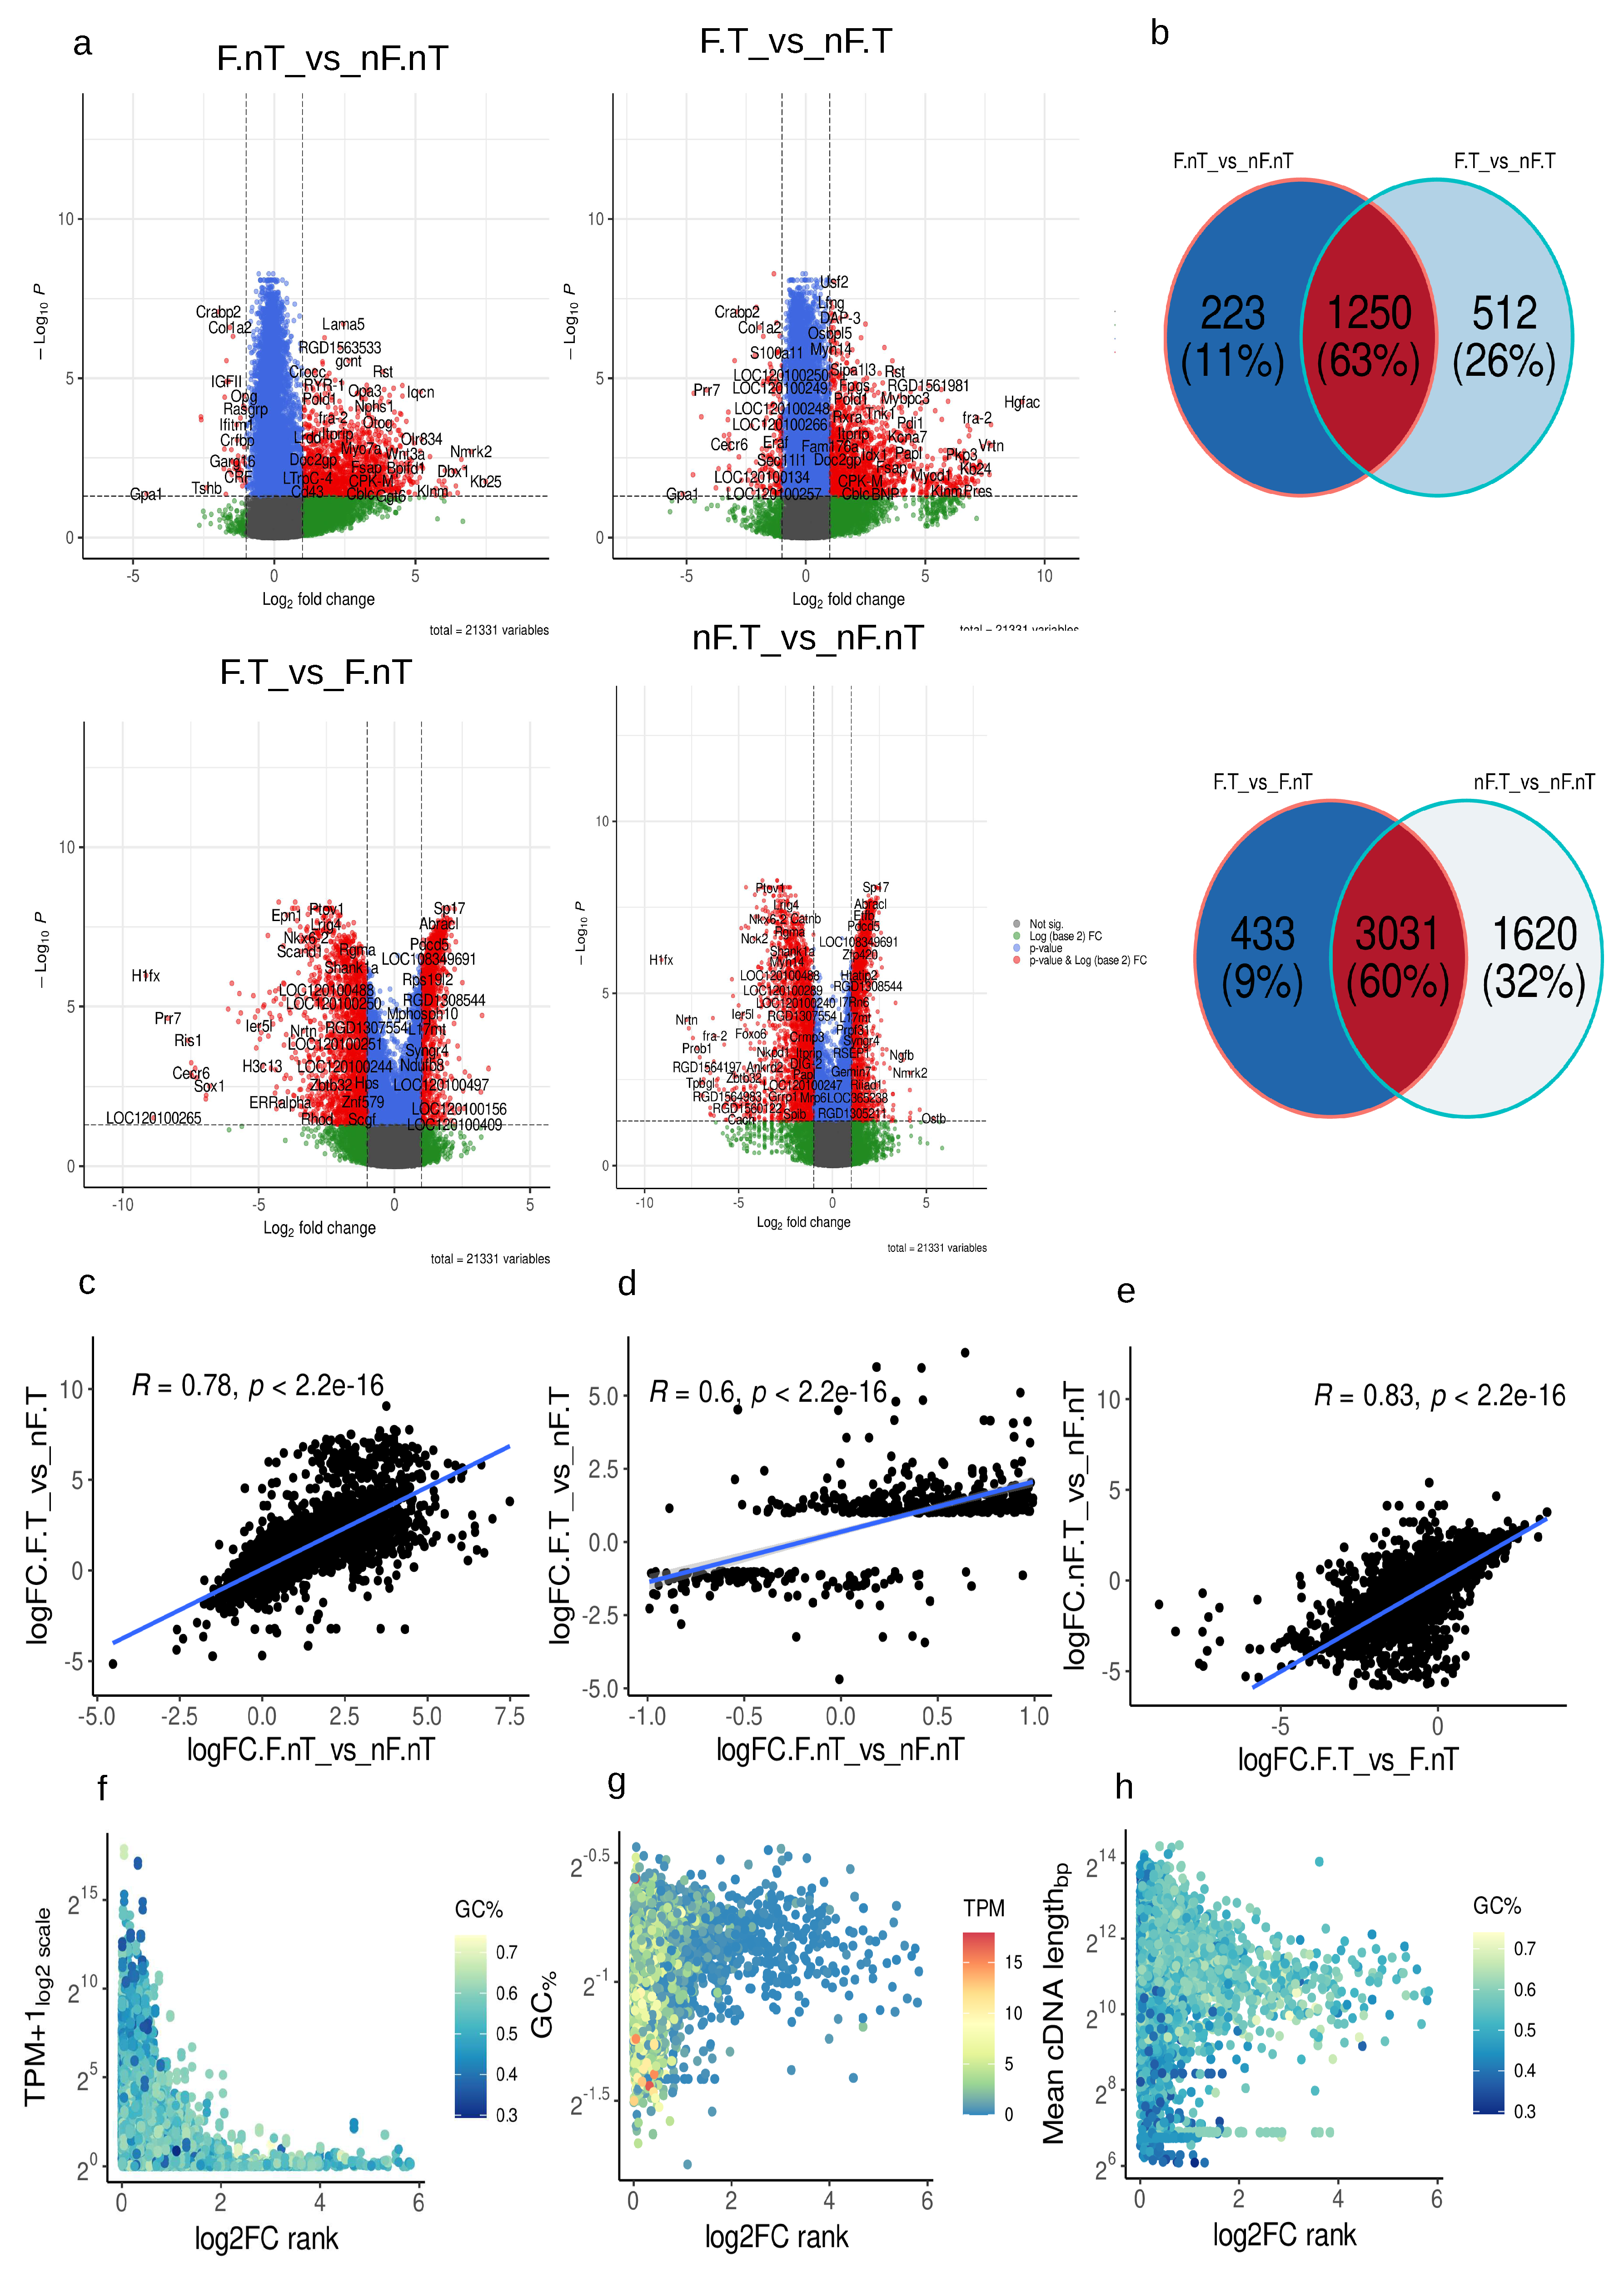
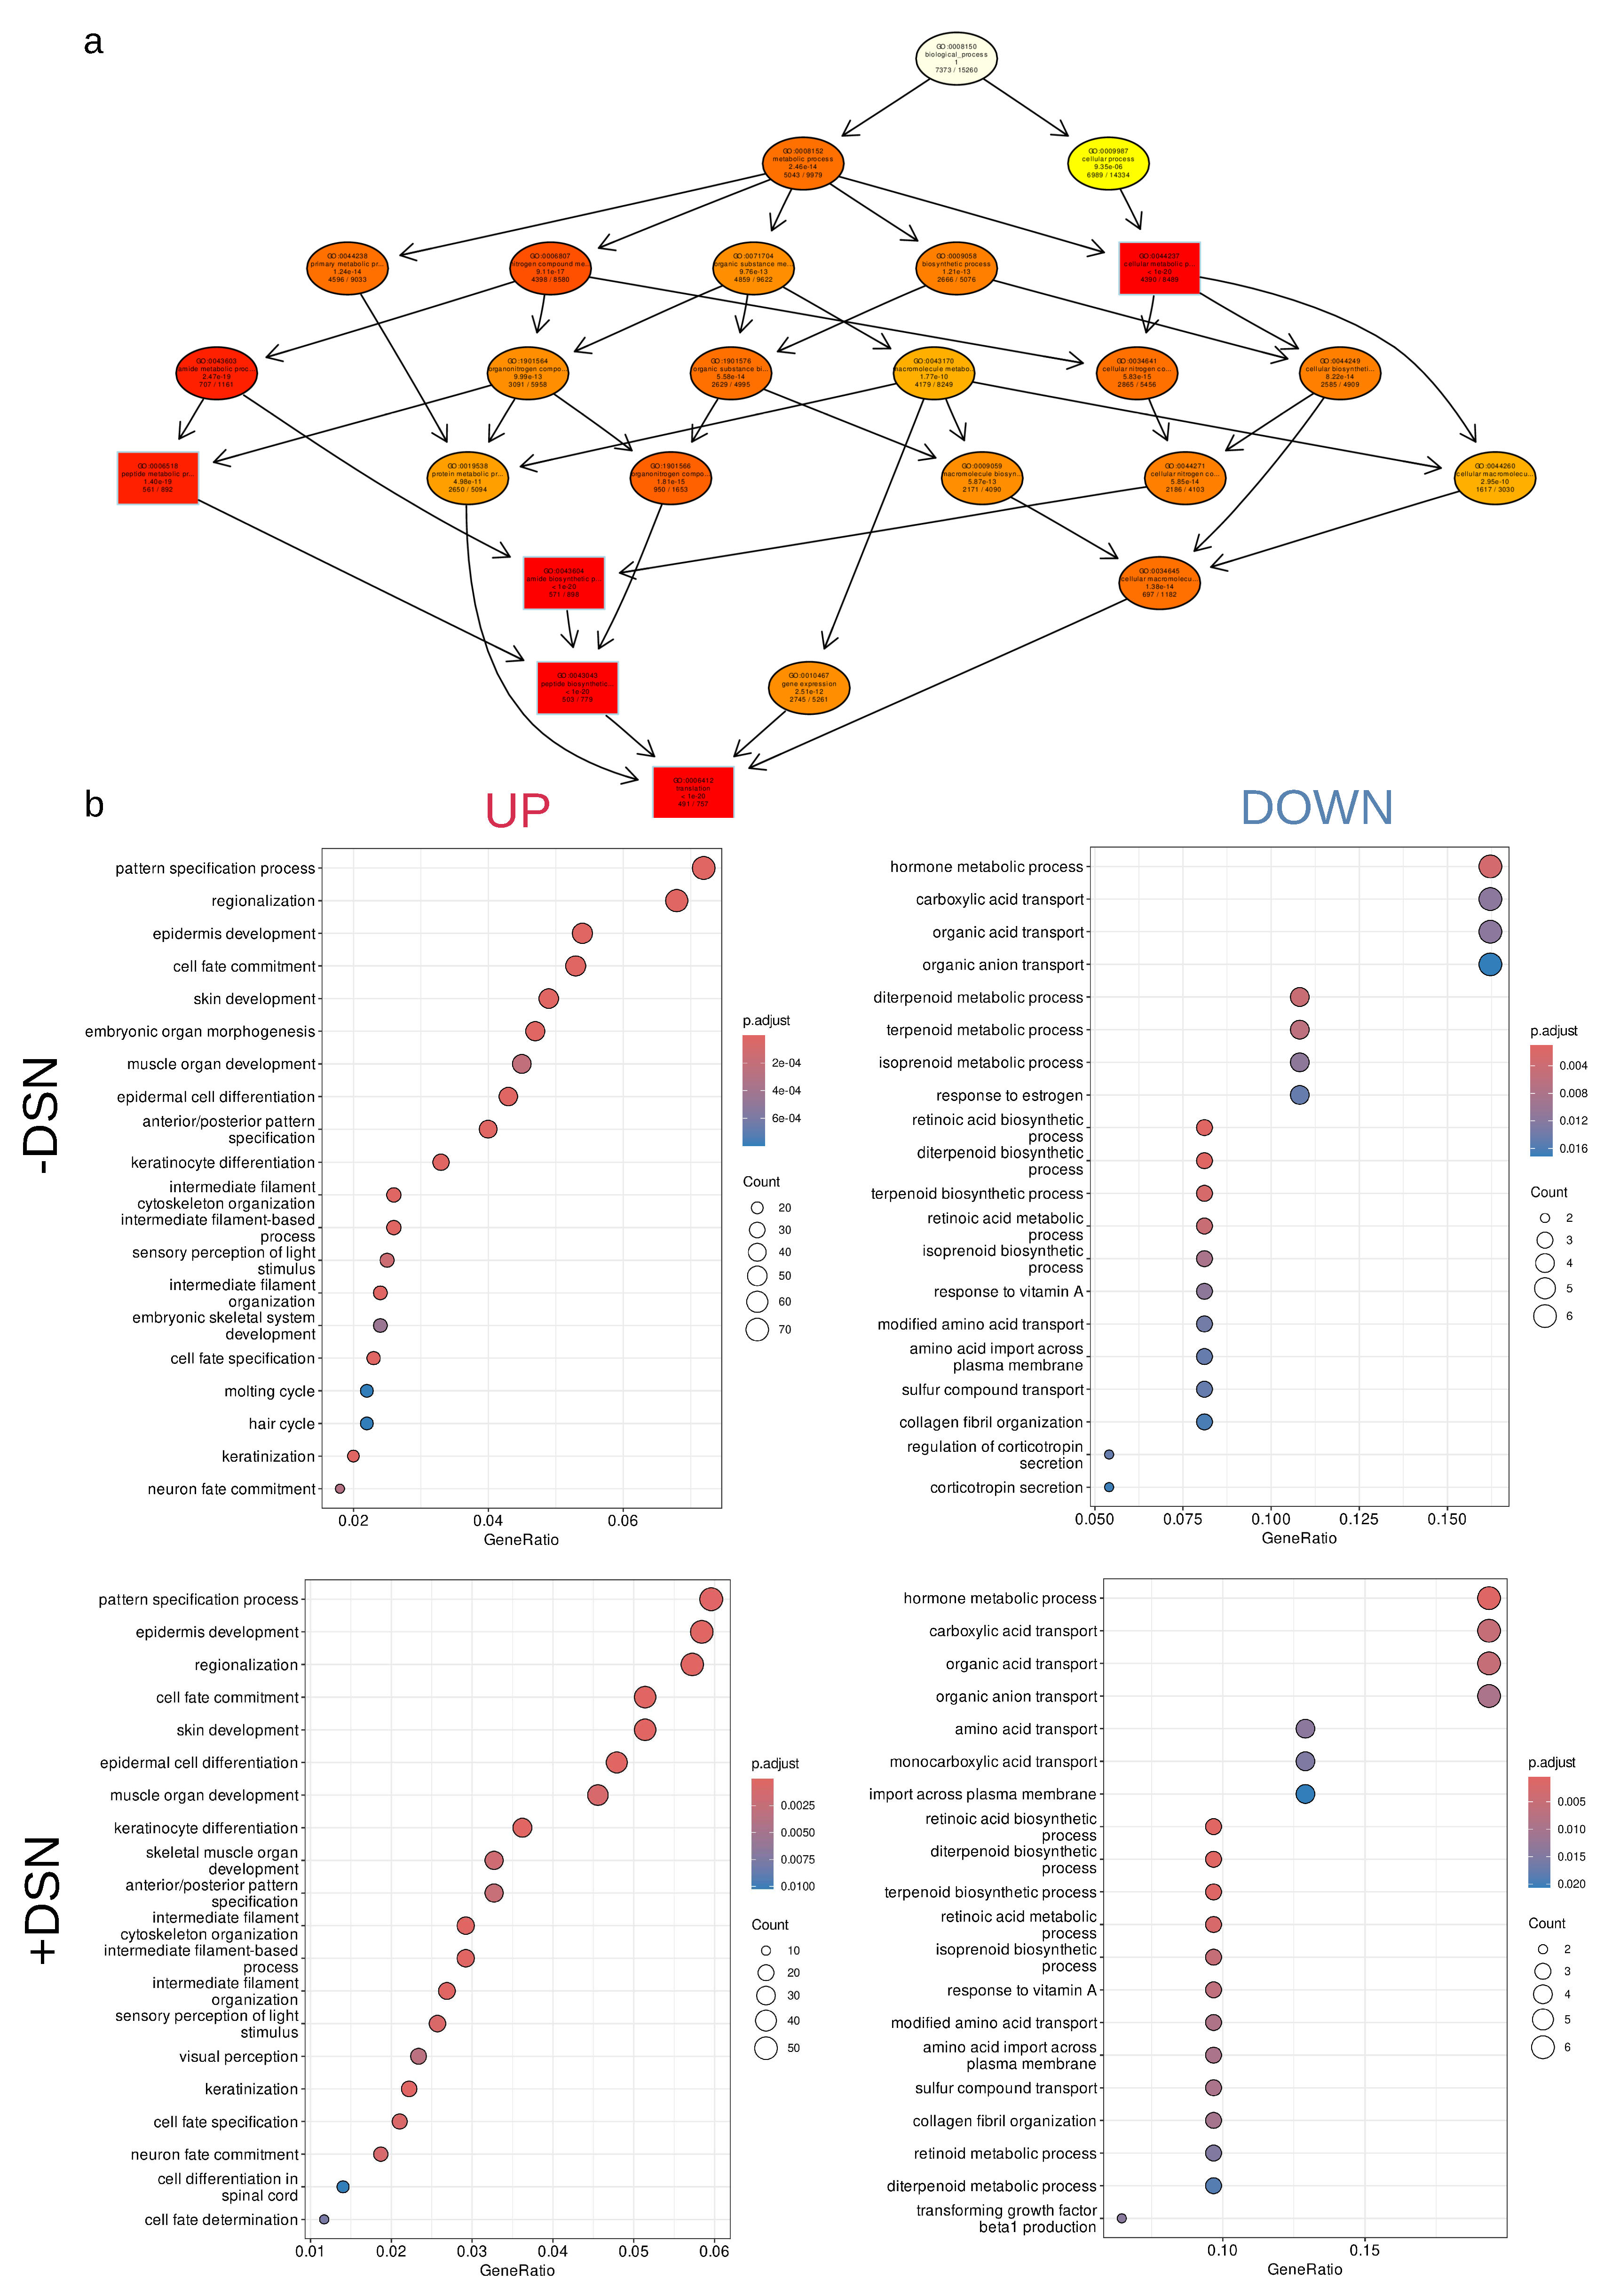
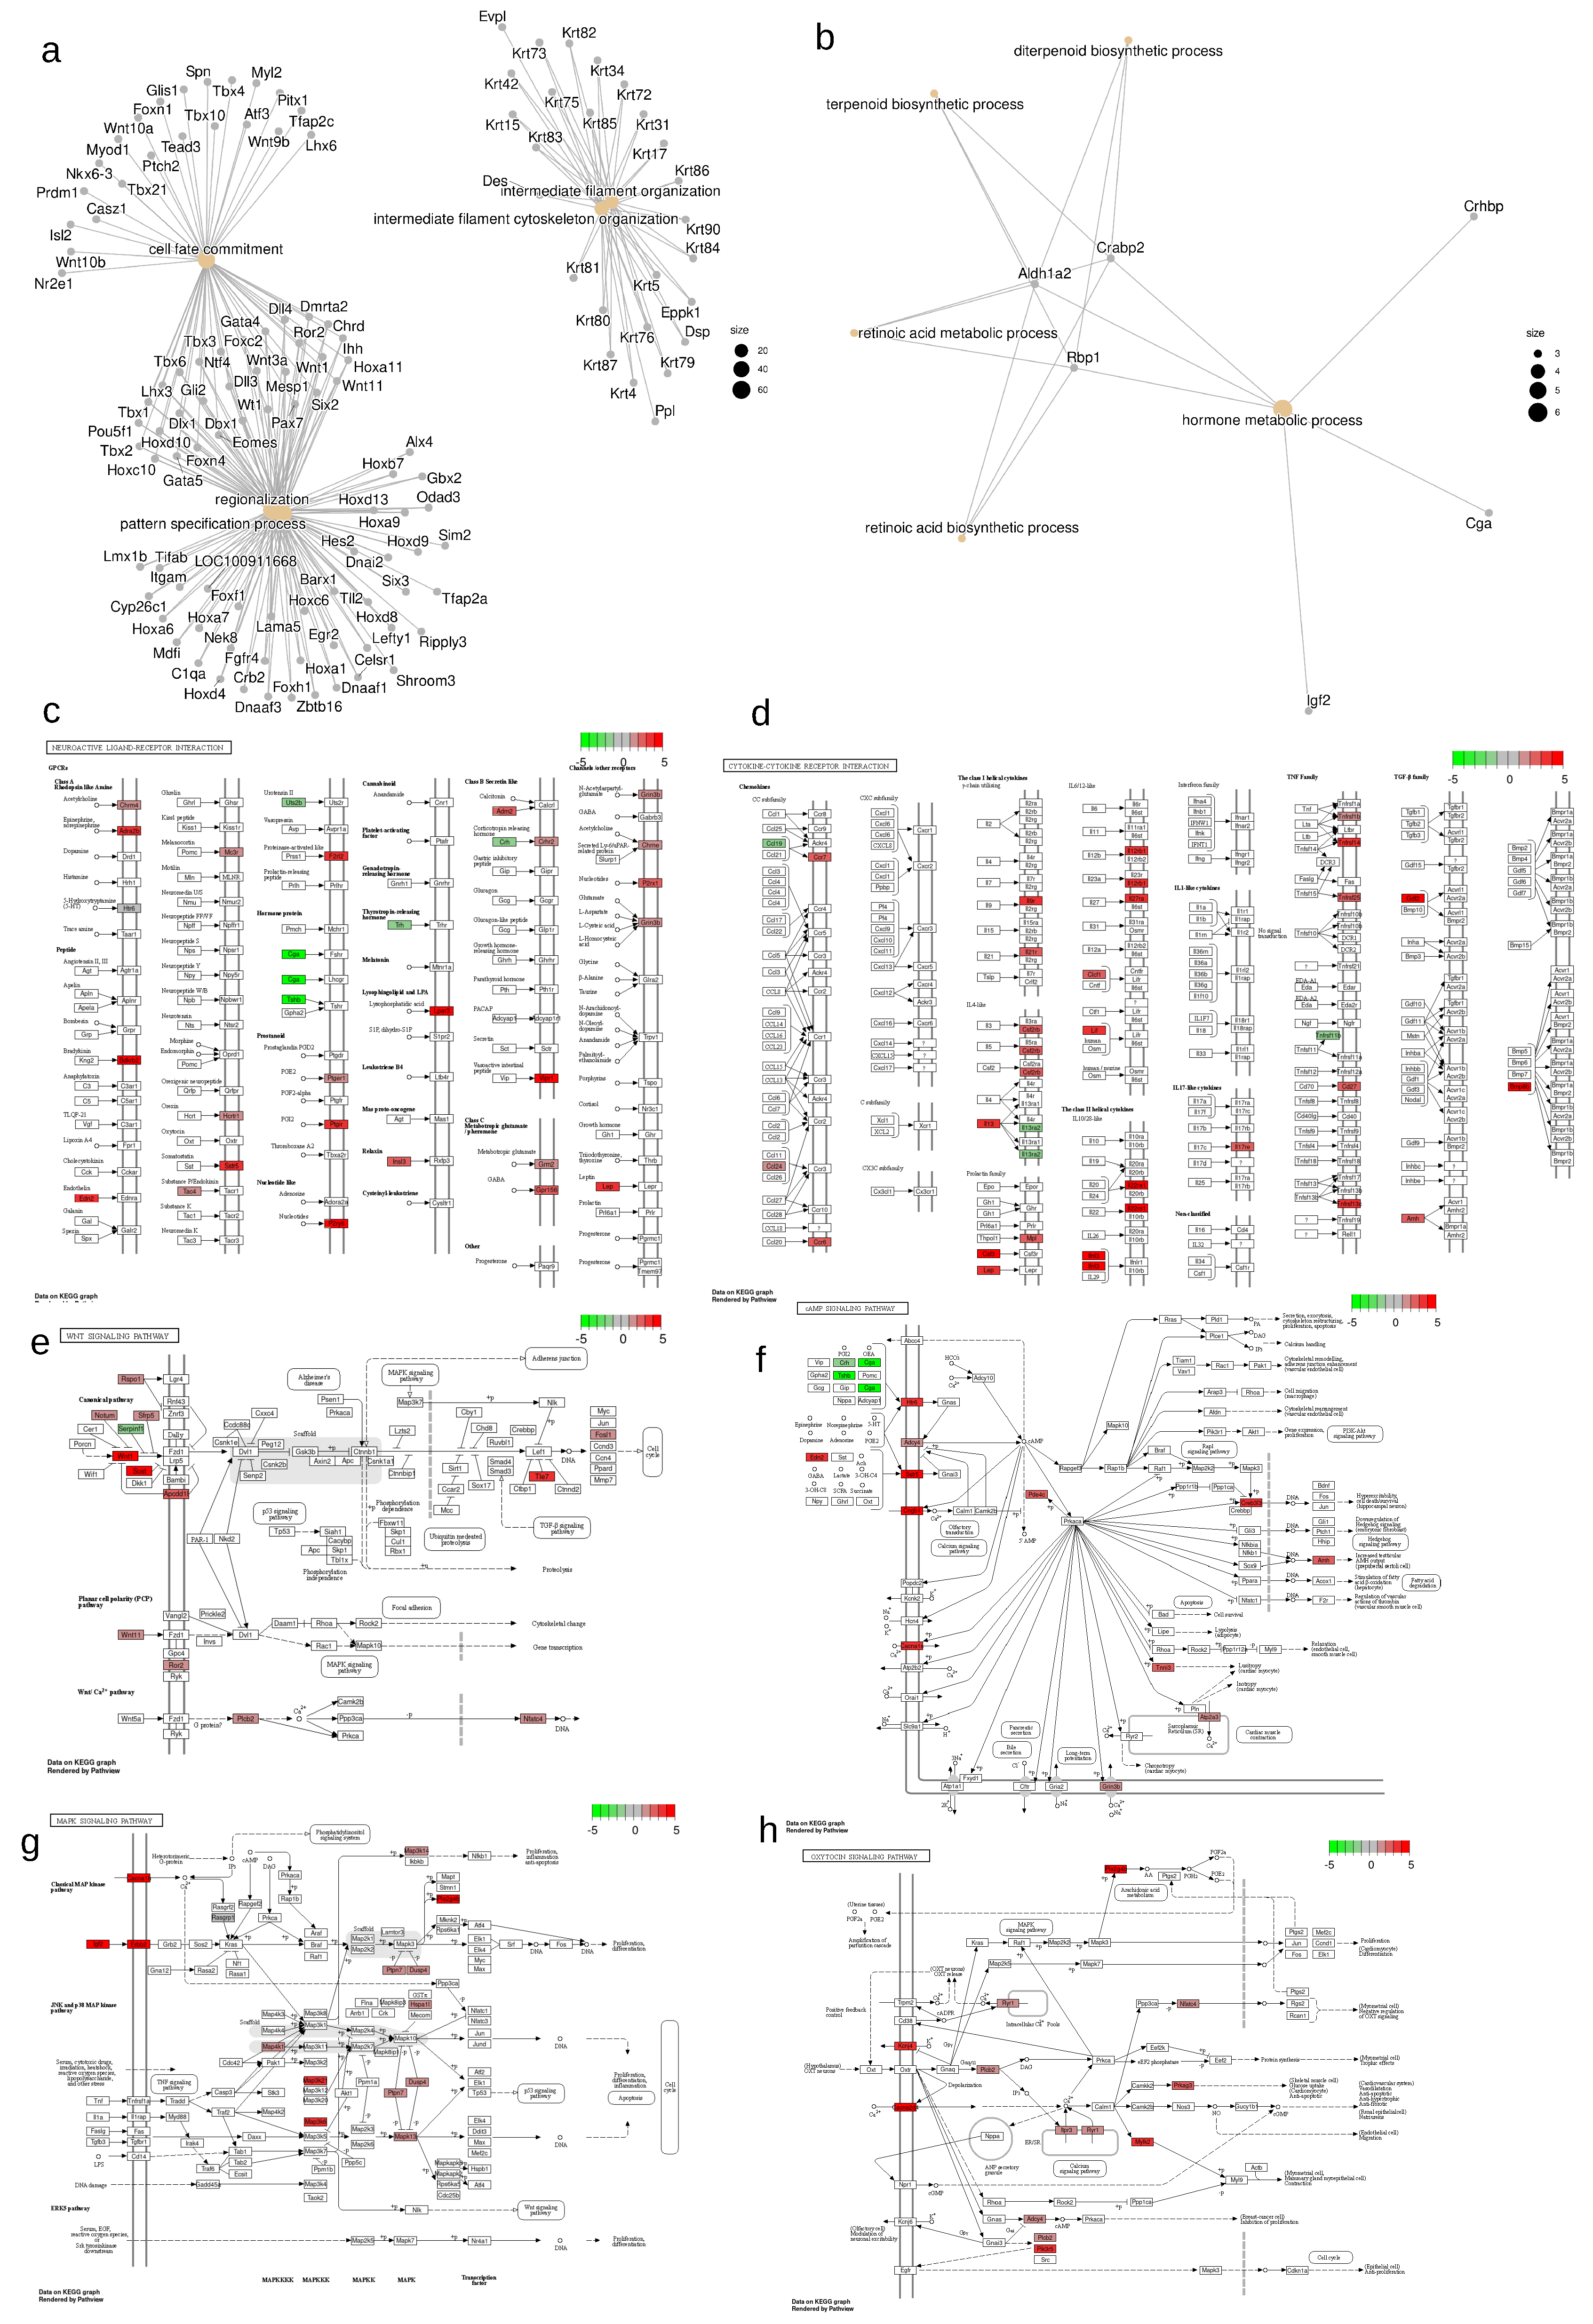
For the analysis of differentially expressed gene (DEG) we selected genes with |log2FC| > 1 and with Benjamini, Hochberg multiple comparisons correction p.adj <0.05. Acute stress generally causes an increase in gene expression that could be seen on volcano plots of DSN untreated samples (Figure 3a, Supplementary table 1). In the untreated samples (F.nT._vs_nF.nT) 1428 genes were upregulated (log2FC >1) and only 45 genes were downregulated. In the samples with DSN treatment (F.T._vs_nF.T) observed a similar picture 1583 genes were upregulated and 179 were downregulated. Increased number of genes that passed logFC selection criteria could be explained by DSN treatment. It should be noted that 63% (1250) of genes were common among treated and untreated samples in STRESS vs CTRL comparison pair Figure 3b. Only 26% (512 genes) were unique for the DSN treated STRESS vs CTRL comparison pair (F.T._vs_nF.T). Lower panel of volcano plots illustrates that DSN treatment deplete molecules from libraries and 60% (3031 genes) were common in these depletion. Pearson’s correlation of log2FC’s i.e. data from treated and untreated samples were around 80% ( R=0.78, p<2.2e-16 Figure 3c). If we will take 20% of genes that present only in DEG’s list after DSN treatment in F.T._vs_nF.T comparison pair, correlation of logFC with untreated comparison pair F.nT._vs_nF.nT were around 60% (R=0.6, p<2,2e-16, Figure 3d). Comparing logFC in comparison pairs with same STRESS condition but with and without DSN treatment (nF.T_vs_nF.nT and F.T_vs_F.nT) gives correlation around 83% (R=0.83, p<2,2e-16, Figure 3e). In general, log2FC data before and after DSN treatment correlated at a fairly high level (Figure 3c), but there were a set of genes that changed their logFC after DSN treatment to completely opposite. We decide to elucidate what is the cause of this shift and distortions. In comparison pairs with STRESS vs CTRL (F.nT_vs_nF.nT and F.T_vs_nF.T) we calculated log2FC rank before and after DSN treatment rank=||log2FC_DSN| -|log2FC_nDSN||. This parameter will describe the shift of obtained lof2FC after DSN. Then we look at dependencies of rank from transcripts quantities in the library, GC content and mean cDNA length of the transcripts. For rare transcripts with TPM 1-15 log2FC shifted more (Figure 3f). GC content and mean cDNA length also affected that process (Figure 3g). Rare transcripts with higher GC content 0.5-0.9 were mostly exposed to this effect. cDNA length also affected this process (Figure 3h) in the mean range of transcripts 1000-5000bp, but there were exceptions. Short transcripts 100-300bp with high GC content were also mostly exposed to log2FC shifting. RNAseq results functional annotation and GO (Gene Ontology) enrichment of samples without DSN treatment (comparison pair F.nT._vs_nF.nT) without log2FC cut off condition (only p.adj < 0.05) showed the 5 most enriched GOs. It were (Figure 4a, Supplementary table.2) - GO:0043604 amide biosynthetic process (571 significant genes, p.adj=1.8e-21), GO:0044237 cellular metabolic process (4390 significant genes, p.adj =2.8e-21), GO:0006412 translation (491 significant genes, p.adj=4.2e-21), GO:0043043 peptide biosynthetic process (503 significant genes, p.adj = 5.4e-21), GO:0006518 peptide metabolic process (561 significant genes, p.adj = 1.4e-19). On the scheme Figure 4a is drawn a hierarchy of 5 most significant GO terms with upstream, more generalized terms that contain them. In general, these 5 terms reflect intensive cellular metabolic processes that take place in the brainstem after arousal reaction. For the subsequent GO analysis we divided genes on UPregulated (logFC >1, p.adj < 0.05) and DOWNregulated (logFC < -1, p.adj < 0.05). GO enrichment in Biological processes (BP) of DSN untreated samples comparison pairs showed that the majority of the upregulated genes were from GOs with overlapping sets of genes (Figure 4b, Supplementary table 3) - GO:0007389 pattern specification process, GO:0003002 regionalization, GO:0008544 epidermis development, GO:0045165 cell fate commitment. It include diverse set of genes from transcription factors (Dbx1/Tbx6/Lbx1/Pax2/Tcf7l1/Hoxa11/Hoxa1/Hoxa7) and Notch ligands (Dll3/Dll4) to Integrin Subunit Alpha M (Itgam) and Neurotrophin 4 (Ntf4). Primarily transcription factors, and signaling molecules fulfill these GO terms (Figure 5a). Genes enriched in GO:0030098 lymphocyte differentiation mostly contain genes referred strictly to immune system (Ifnl1/Cd79a/Ccr6/Ccr7/Clcf1/Cd19/Nfkbid/Cd27/Lag3/Il9r/Itk). Increased expression of these genes is evidence of microglial and may be immune cells activation at some extent 2h after acute stress. So fo Ifnl1 log2FC=3.71 p.adj=0.004492, for Ccr6 log2FC=2.31 p.adj=6.206451e-03, for Ccr7 log2FC=2.48 p.adj=0.0057, Clcf1 (ENSRNOG00000018752) log2FC=2.31 p.adj=0.048. Interestingly, upregulated genes were enriched with terms GO:0045109 intermediate filament organization, GO:0045104 intermediate filament cytoskeleton organization, GO:0045103 intermediate filament-based process (Figure 4b). These terms consist of different keratins genes (Figure 5a, Supplementary table 3). This observation could be explained by massive intermediate filaments and neuronal cytoskeleton reorganization after vigorous neurotransmitters release following acute stress [11]. Expression of motor proteins and vesicle cargo protein was also upregulated Myo7a log2FC=3.06 p.adj=0.0015, Klc3 log2FC=2.50 p.adj=0.0026, Tnni3 log2FC=2.21 p.adj=0.031, Kif2c log2FC=1.66 p.adj=0.035, Tuba3a log2FC=3.56p.adj=0.016 and some others. Enrichment of downregulated genes gives following terms GO:0042445 hormone metabolic process (Igf2/Crabp2/Crhbp/Cga/Aldh1a2/Rbp1), GO:0046942 carboxylic acid transport (Slc22a2/Crabp2/Slc6a13/Trh/Rbp1/Slc6a20), GO:0016102 diterpenoid biosynthetic process (Crabp2/Aldh1a2/Rbp1), GO:0033189 response to vitamin A (Tshb/Aldh1a2/Rbp1), GO:0051458 corticotropin secretion (Crh/Crhbp) (Figure 4b, Figure 5a, Supplementary table 4). GO enrichment of comparison pairs (F.T._vs_nF.T) after DSN treatment gives similar results, but Genes Ratio were higher in the same terms by comparison without DSN treatment, because more genes passed the logFC filter (Figure 4b, Supplementary table 5-6).

2.3. Changes in neuroactive ligand-receptor interaction

For the better understanding of processes and pathways that were changed two hours after acute stress in the brainstem we conducted KEGG pathway enrichment analysis (Figure 5, Supplementary table 7). Here we try to select KEGG pathways that cover a larger number of DEGs. One of the most interesting KEGG pathway terms was rno04080 Neuroactive ligand-receptor interaction, containing 33 DEGs (Figure 5c). KEGG pathway graphs with overlaid expression information could be founded at https://lda01.shinyapps.io/tr_app2/ as interactive shiny application. It is worth noting that expression of neuropeptides Crh (corticotropin releasing hormone log2FC = -1.28 p.adj = 1.244917e-02), Crhbp (corticotropin releasing hormone binding protein, log2FC = -1.31 p.adj = 0.00087), Trh (thyrotropin releasing hormone, log2FC = -1.41 p.adj = 6.617931e-03), Tshb (thyroid stimulating hormone subunit beta, log2FC = -2.4 p.adj = 0.028), Cga (glycoprotein hormones, alpha polypeptide, on the Figure 5c scheme it was referred to FSH, LHB by the pathview package, log2FC = -4.5 p.adj = 0.043), Uts2b (urotensin 2B, log2FC = -1.26 p.adj = 0.0047) decreased. With reduced Crh and Crhbp expression, we observed increased expression of its receptor Crhr2 (log2FC = 1.53 p.adj = 0.022), which could be evidenced by the compensatory regulation loop between them. Remarkably, that increased expression of thyroglobulin Tg (log2FC = 1.78 p.adj = 3.533918e-02) was observed. At the same time mRNA level of some other neuropeptides ligands were elevated: Tac4 (Tachykinin 4, log2FC = 1.63 p.adj = 0.002), Lep (Leptin, log2FC = 3.05 p.adj = 0.021), Edn2 (Endothelin 2, log2FC = 3.84 p.adj = 0.0048), Insl3 (Insulin Like 3, log2FC = 2.94 p.adj = 0.003, on the Figure 5c scheme its expression was referred to Relaxin pathway), Adm2 (Adrenomedullin 2, log2FC = 2.76 p.adj = 0.017, on the Figure 5c scheme it was referred to Calcitonin pathway). Two hours after acute stress in the brainstem expression of neuropeptides receptors was elevated. So the mRNA level of bradykinin (Bdkrb1 log2FC = 3.95 p.adj = 9.673476e-04, Bdkrb2 log2FC = 2.37 p.adj =1.036217e-04), hypocretin (Hcrtr1 log2FC =1.05 p.adj = 0.002), somatostatin (Sstr5 log2FC = 3.42 p.adj = 0.049), Vip (Vasoactive intestinal peptide receptor Vipr1 log2FC = 4.09 p.adj = 3.582624e-02), and melanocortin (Mc3r log2FC = 1.94 p.adj = 0.034) receptors was increased. Concerning expression changes of receptors or synthesis enzymes of classical neurotransmitters there was not so much information. We did not detect expression changes of monoamines key synthesis enzymes (Dbh, Th, Tph), possibly because the peak of its gene transcription after stress was earlier. At 2h after stress we observed elevated mRNA level of GABA, Glutamate, Acetylcholine and Nor-/Epinephrine receptors - Gpr156 log2FC =2.46 p.adj = 0.001, Grm2 log2FC = 1.68 p.adj = 0.0004, Grin3b log2FC = 1.79 p.adj = 2.989798e-05, Chrne log2FC = 1.73 p.adj = 1.887657e-02, Chrm4 log2FC = 1.57 p.adj = 0.003, Adra2b log2FC = 3.33 p.adj = 0.0003. Expression shift of 5-HT receptors was controversial (because of these on Figure 5c it expression depicted in gray), with mRNA uprising of Htr6 (log2FC = 2.01 p.adj = 0.039) and Htra4 (log2FC = 2.50 p.adj = 0.045) and mRNA reduction of Htr5b (log2FC = -1.76 p.adj = 0.000039). It is also worth noting about pyrimidinergic receptor mRNA raising P2ry6 (log2FC = 1.26 p.adj = 0.004), P2rx1 (log2FC = 2.35 p.adj = 0.007). We as well observed intensification of Prostaglandin signaling that reflected in Ptgir (log2FC = 3.29 p.adj = 0.045) and Ptger1 (log2FC = 1.15 p.adj = 0.0003) mRNA elevation. Pathview software also denoted F2rl2 coagulation factor II (thrombin) receptor-like 2 referred to proteinase activated receptors, and its expression was elevated log2FC = 3.06 p.adj = 0.018.

2.4. Changes in Cytokine-cytokine receptor interaction

As was mentioned after Biological processes GO enrichment analysis we have seen signs of microglial and immune system activation. To further elucidate this phenomena, we performed KEGG pathway rno04060 Cytokine-cytokine receptor interaction Figure 5 enrichment. It contained 30 DEG. If we look at ligands only one decreased its expression Ccl19 (log2FC = -1.18 p.adj = 0.015), another 10 increased their mRNA level - Ccl24 (log2FC = 1.54 p.adj =0.033), Interleukin 13 (Il13 log2FC = 3.60 p.adj = 0.023). From the Il6/12-like family it were Clcf1, ENSRNOG00000018752 (log2FC = 2.31 p.adj=0.048) and Lif (log2FC = 3.11 p.adj = 0.006). From the class II helical cytokines IL10/28-like - Ifnl3, Interferon Lambda 3 (log2FC = 3.16 p.adj = 0.009) increased expression. From the prolactin family it was colony stimulating factor 3 Csf3 (log2FC = 4.28 p.adj = 0.027) and as was mentioned earlier Leptin. From the TGF-beta family it were Growth differentiation factor 2 (Gdf2, log2FC = 6.49 p.adj =0.039), Bone morphogenetic protein 8b (Bmp8b, log2FC = 3.07 p.adj = 0.0078), anti-Mullerian hormone (Amh, log2FC = 2.86 p.adj = 0.0017). From all cytokine receptors only Il13ra2 mRNA was reduced in our case (log2FC = -1.5 p.adj=0.01). It could be a response to Il13 increased expression. At the same time, the receptors of IL4-like family increased expression - Colony stimulating factor 2 receptor subunit beta Csf2rb (log2FC = 2.08 p.adj = 0.003). The other chemokine- and interleukin receptors also increased expression Ccr6, Ccr7, Il9r (log2FC = 3.27 p.adj = 0.03), Il21r (log2FC = 2.12 p.adj = 0.047), Il22ra1 (log2FC = 5.26 p.adj = 0.007), Il12rb1(log2FC =3.27 p.adj = 0.002), Il27ra (log2FC = 3.73 p.adj = 0.00099), Il17re (log2FC = 2.63 p.adj = 0.018). From the TNF-family receptors only Tnfrsf11b (log2FC = -1.07 p.adj = 3.591245e-05) reduced expression, Tnfrsf1b (log2FC =1.06 p.adj = 0.012), Tnfrsf13c (log2FC = 3.72 p.adj = 0.003), Tnfrsf14 (log2FC = 3.35 p.adj =0.026), Tnfrsf25 (log2FC = 2.15 p.adj = 0.03), Cd27 (log2FC = 2.59 p.adj = 0.039) increased its expression. Interestingly, from the prolactin family receptors Mpl - Proto-oncogene thrombopoietin receptor (log2FC = 2.23 p.adj = 0.009) mRNA level was elevated.

2.5. Changes in Wnt signaling pathway

Surprisingly, we observed substantial changes in the Wnt signaling pathway (Figure 5e). mRNA of canonical Wnt1 ligand was highly elevated (log2FC = 2.74 p.adj = 0.0091) and expression of planar cell polarity ligand Wnt11 (log2FC=1.82 p.adj = 0.0088) was also increased. At the same time expression of almost all Wnt signaling negative regulators Notum (log2FC = 1.16 p.adj = 0.009), Rspo1 (log2FC = 1.54 p.adj = 0.04), Sfrp5 (log2FC = 1.86 p.adj = 0.0047), Apcdd1l (log2FC = 2.44 p.adj = 0.026) was increased except Serpinf1 (log2FC = -1.03 p.adj = 1.330914e-02). mRNA level of noncanonical Wnt receptor Ror2 (log2FC = 1.86 p.adj = 0.028) was also elevated. Despite increase in expression of both ligands and negative regulators, expression of genes that were downstream on cascade were also increased Tle7 (log2FC = 3.35 p.adj = 0.03), Fosl1 (log2FC = 1.11 p.adj = 0.00068), Plcb2 (log2FC = 1.98 p.adj = 0.018), Nfatc4 (log2FC = 1.64 p.adj = 0.015).

2.6. Changes in Calcium Signaling, cAMP response and MAPK pathways

As we expected, arousal reaction gives a massive shift in a large number of signaling pathways. Intensification of Calcium signaling exhibits in voltage gated calcium channels mRNA elevation Cacna1s (log2FC = 3.09 p.adj = 8.820634e-03), Cacna1h (log2FC = 1.72 p.adj = 3.509638e-06), Cacna2d4 (log2FC =2.51 p.adj = 0.012). It is worth noting that the expression of another channel Kcnj4 was increased (log2FC = 3.31 p.adj = 0.02). Expression of inner cell ER calcium release channel Ryr1 (log2FC = 1.76 p.adj = 1.610264e-05) and inositol 1,4,5-trisphosphate receptor, type 3 Itpr3 (log2FC=1.77 p.adj = 5.324677e-07) was elevated. Upstream MAPK kinases increase in expression of Mst1 (log2FC = 4.25 p.adj = 0.0001) and Erbb2 (log2FC =1.92 p.adj = 0.0036) was observed. Then mRNA level of intracellular MAPKs was elevated - Mapk13(log2FC = 1.83 p.adj =0.01), Map3k6 (log2FC = 3.27 p.adj = 1.648089e-05), Map3k21(log2FC = 3.12 p.adj = 0.011), Map4k1 (log2FC = 1.30 p.adj =0.015). Besides this, increased expression of phosphatases Ptpn7 (log2FC = 1.00 p.adj = 0.03) and Dusp4 (log2FC = 1.17 p.adj =0.031) was also observed. It could be explained by triggering compensatory mechanisms after massive release of neurotransmitters and excitation. If we will look at cAMP signaling pathway then mRNA level of cAMP dependent Phosphodiesterase 4C Pde4c (log2FC= 2.48 p.adj = 0.0009), Troponin I3 that activates cAMP-Dependent PKA (log2FC = 2.21 p.adj = 0.03), Creb3l3 (log2FC=3.71 p.adj = 6.177769e-04), Atp2a3(log2FC=1.29 p.adj =0.0034) was also elevated.

2.7. Choosing reference gene for RT-qPCR

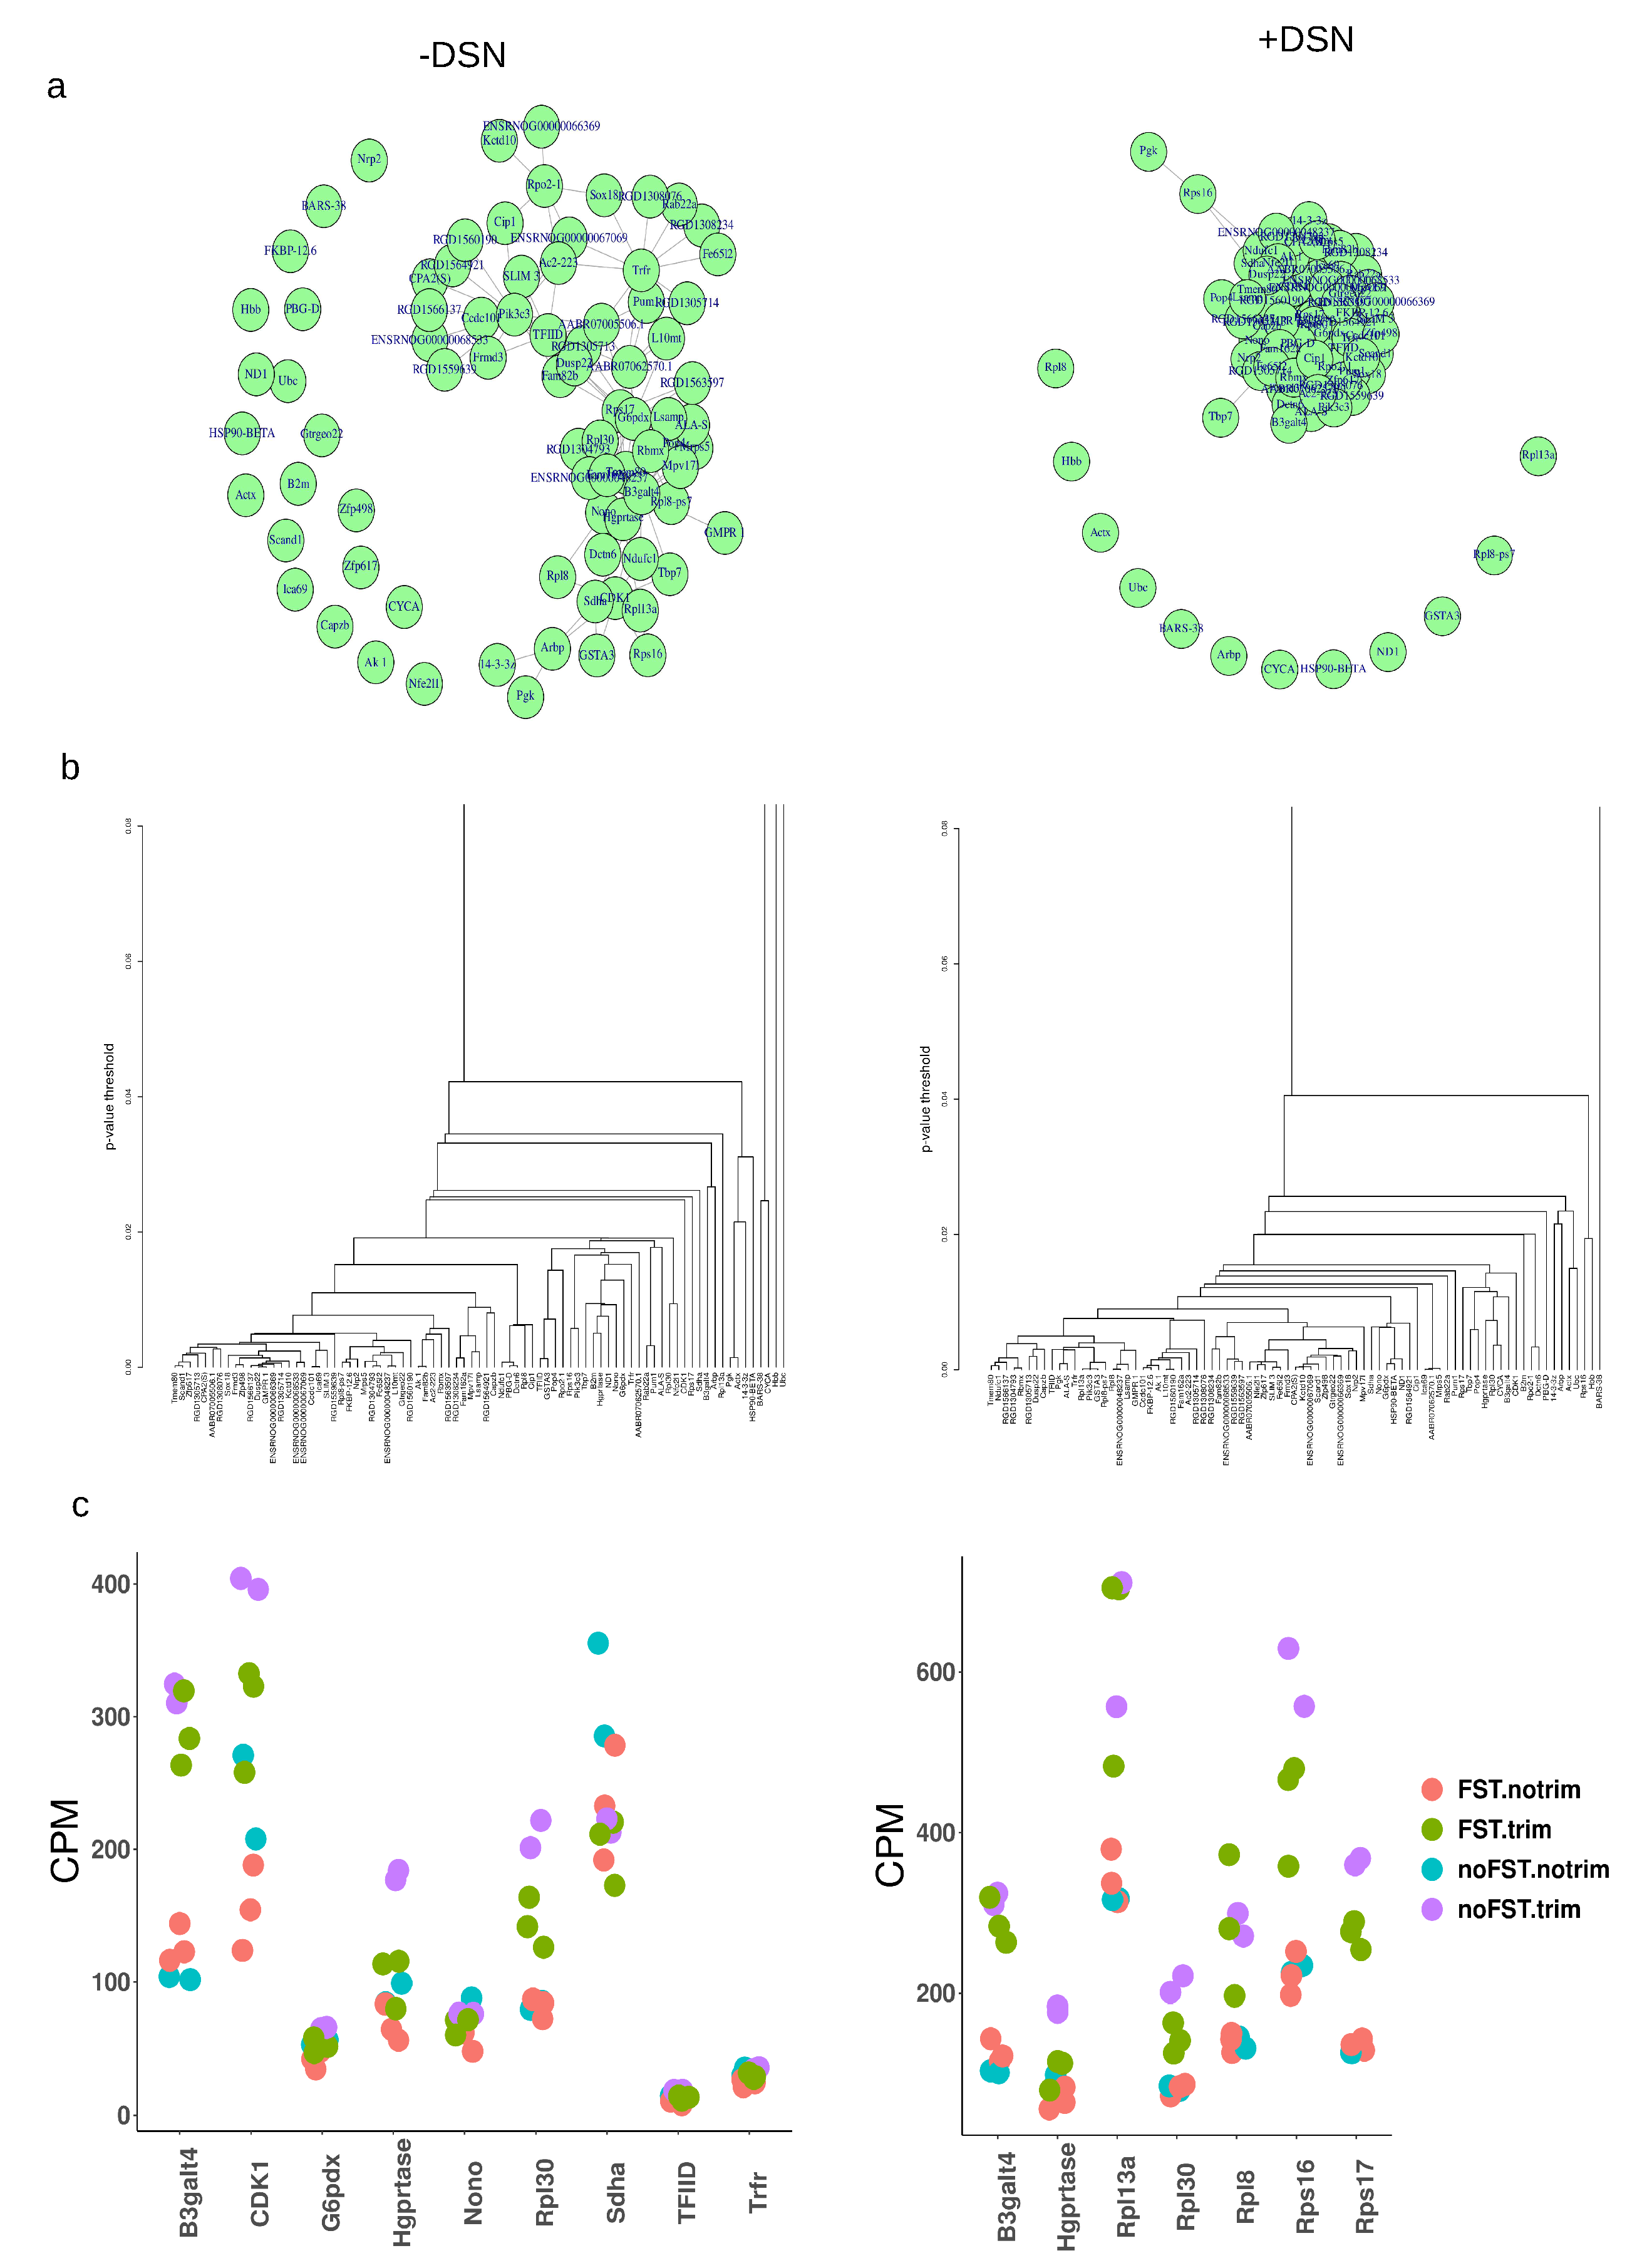
Before RT-qPCR validation we decided on the basis of our RNAseq data to choose the best suitable housekeeping reference genes for PCR expression estimation after acute stress. For this purpose we applied a method based on disjoint subgraphs [12]. Firstly, we limit sets of selected genes with |log2FC|<0.04 and that were common in STRESS vs CTRL comparison pairs (F.nT._vs_nF.nT and F.T._vs_nF.T) without and with DSN treatment. Then we add to this list commonly used reference genes like GAPDH (G6pdx), Actb (Actx), Hprt (Hgprtase), Sdha and ribosome proteins Rpl8, Rpl30, Rps13a, Rps16, Rps17. Because of discrepancies in different species databases for orthologous genes it can give different symbols, why on the pictures are given different genes symbols. Then on counts per million data we conducted analysis. Graphs Figure 6a and dendrogram Figure 6b of DSN untreated samples showing that there were nodes of closely correlated genes (Trfr, TFIID,Pik3c3 and Nono, Hgprtase, G6pdx) and single non correlated genes. Interestingly, in samples without DSN treatment Actb (Actx) and Ubc were genes that did not correlate with the majority of other genes Figure 7a,b. In libraries with DSN treatment we observed a similar situation, but nodes of the graph were much closer to each other. Scatter plot images Figure 6c of CPM data in general confirm conclusions from graphs and dendrograms.

2.8. Real-time RT-qPCR analysis

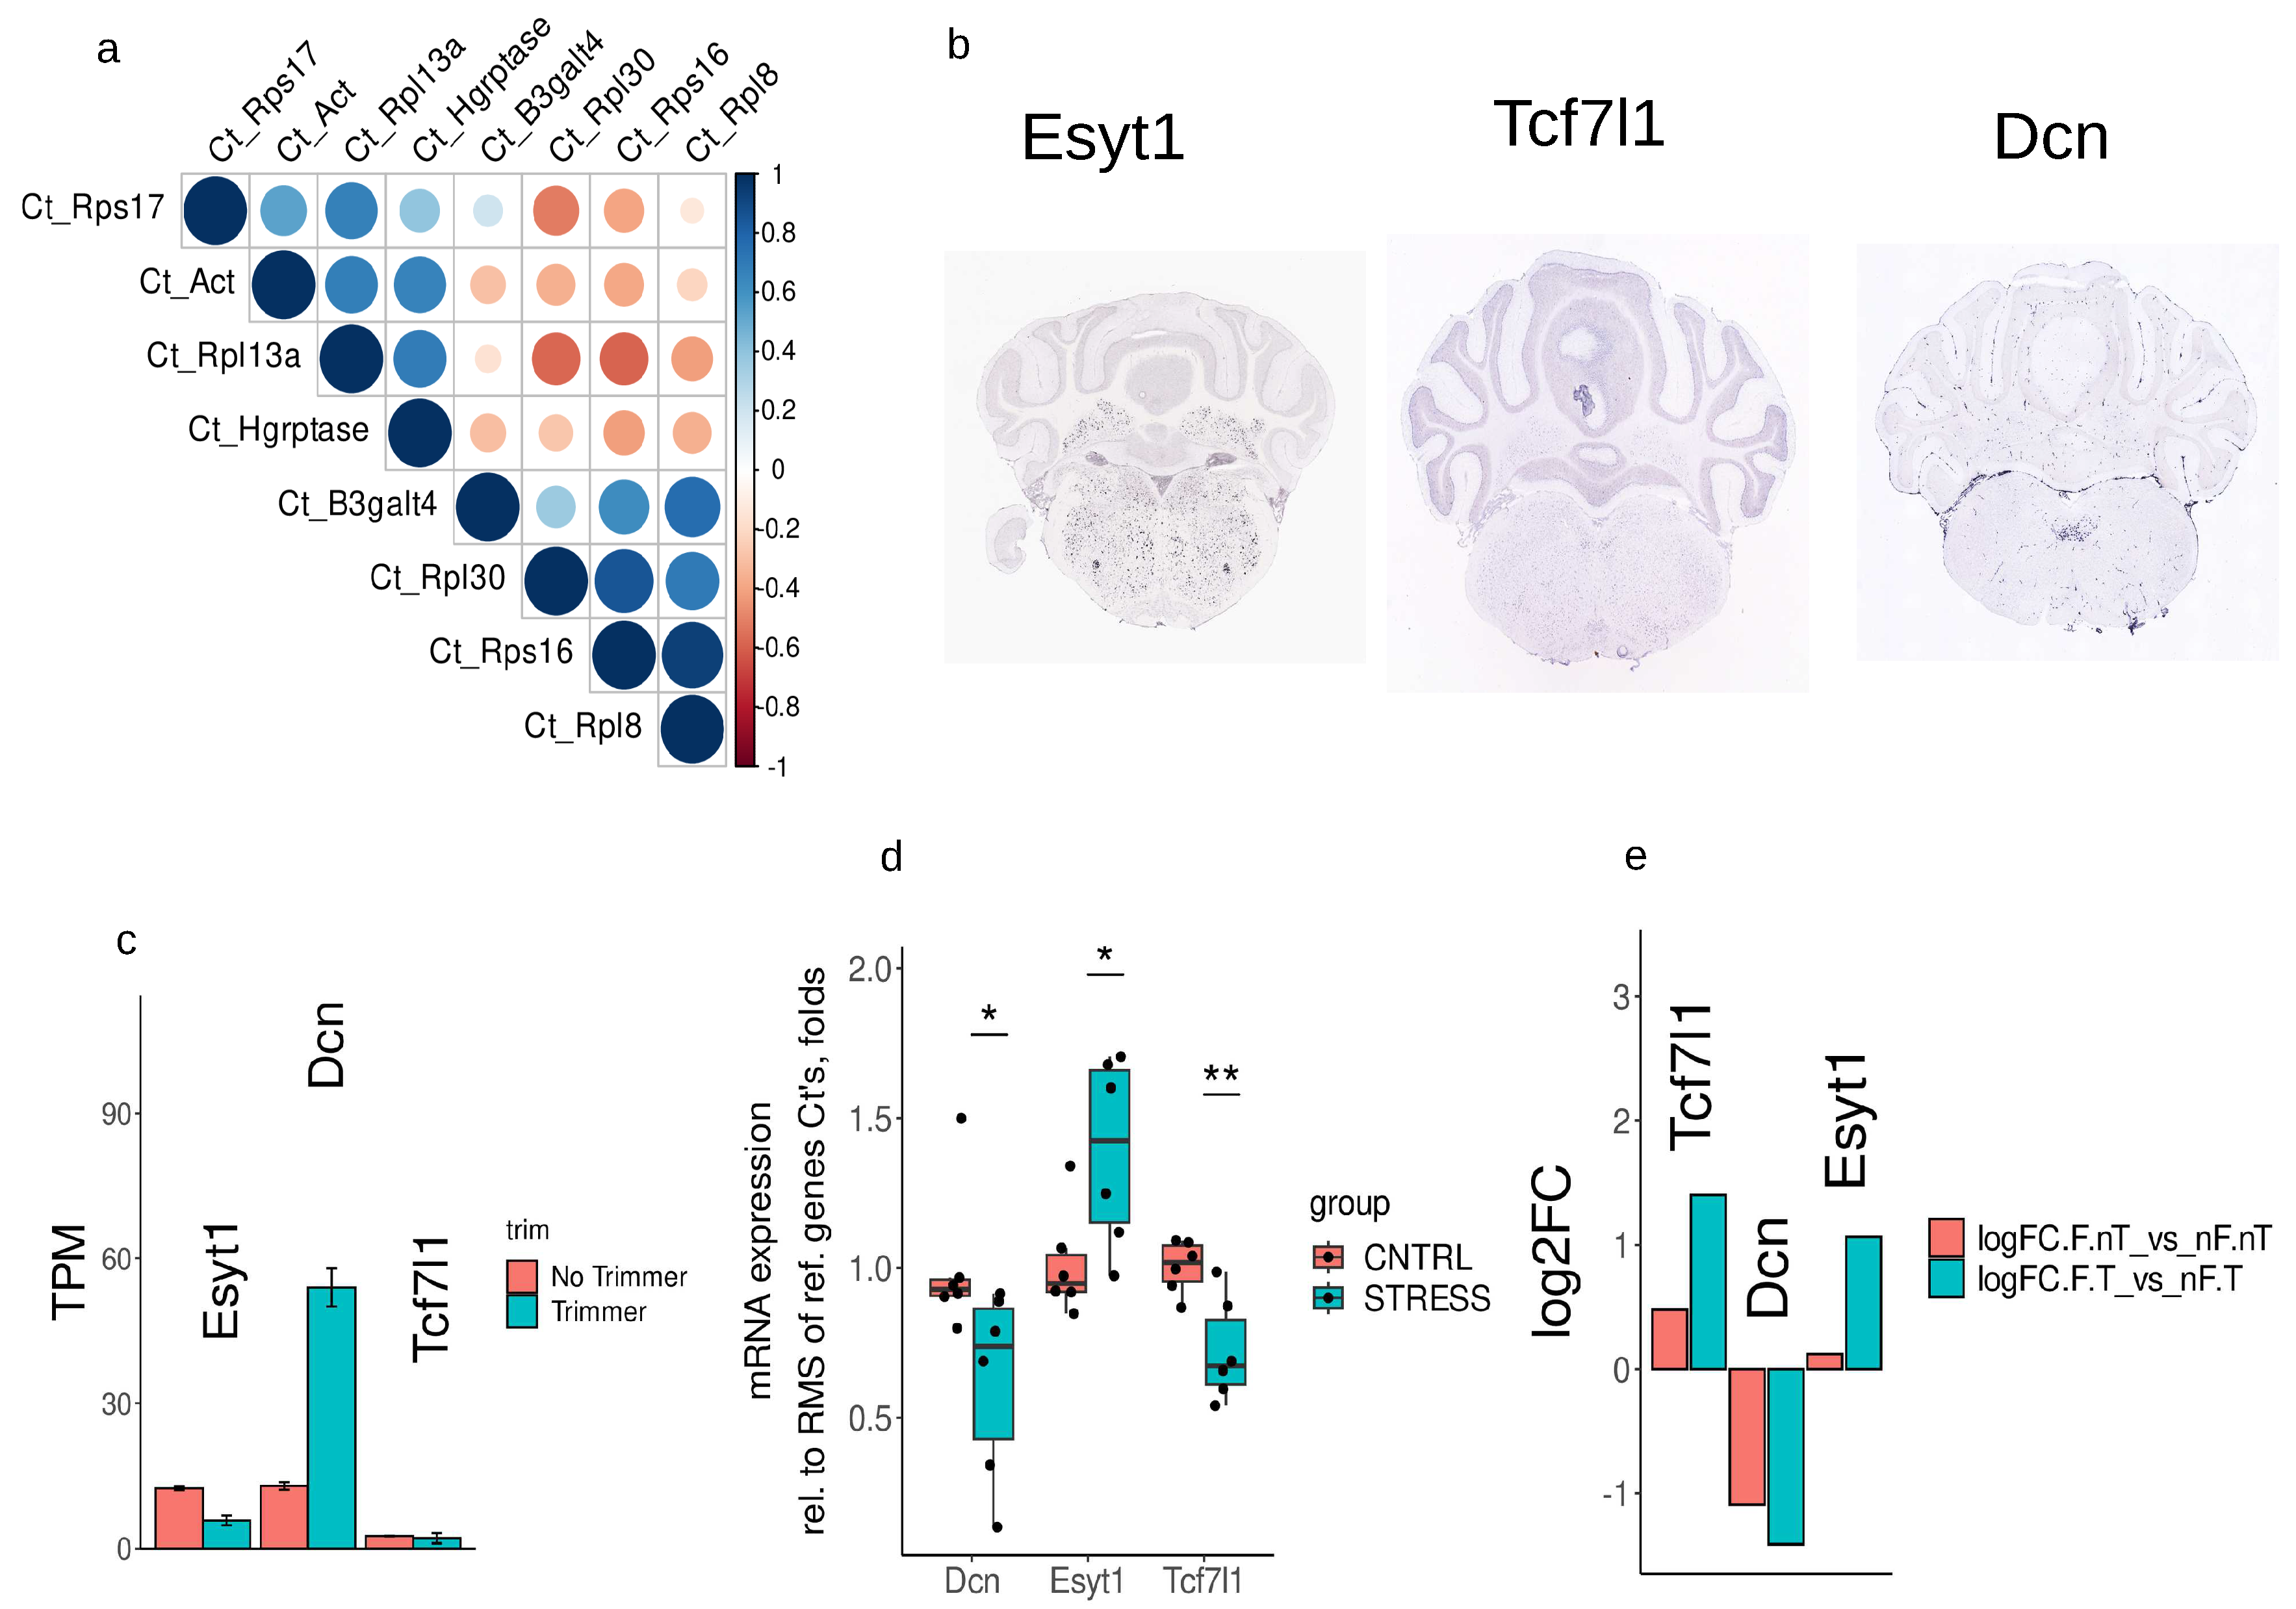
For the RT-qPCR verification the following set of reference genes was chosen: Rpl13a, Rps16, Rps17, Rpl8, Rpl30, Hgprtase, B3galt4, β-actin (Supplementary table 8). PCR validation was carried out on the RNA samples from the same experimental animals, but without pooling and reverse transcription was done in ordinary way with oligodT and MMLV reverse transcriptase. As expected, by selection method, Ct values of reference genes are differently correlated with each other. Correlation matrix is illustrated on Figure 7a. As target genes we selected genes with low expression level, or genes that are expressed in certain cell populations and did not pass selection critera for log2FC, p.adj - Esyt, Tcf7l1, Dcn Figure 7b. RNAseq data confirm that, TPM values without DSN are at low level Figure 7c. For Δ Δ Ct calculations normalization was done on the root mean square of all selected reference genes Ct’s (Supplementary table 9). Welch Two Sample t-test revealed 1.38 fold changed increase of Esyt1 mRNA (t = -2.5556, df = 7.8702, p = 0.03433) and approximately 1.61 and 1.38 fold decrease in expression of Dcn (t = 2.296, df = 9.4661, p = 0.04595) and Tcf7l1 (t = 3.5648, df = 7.4323, p = 0.008294). These observations reaffirm log2FC data from our RNAseq experiments, except Tcf7l1.

3. Discussion

Arousal reaction in response to acute stress primarily involves activation of brainstem and midbrain structures, as it is explicitly described in previous research works [2,5,13]. Interestingly, in the hippocampus after acute stress observed similar transcriptomic changes with mostly gene transcription upregulation that was not detectable after 4h [14]. Acute stress also caused an increase in phosphoproteome in the hippocampus. In our work we took a time point in between only nearest, rapid effects - minutes and time point 4h, where the effects are absent [14]. We did not detect significant changes of monoamines key synthesis enzymes (Dbh,Th, Tph), presumably because the peak of its gene transcription was previously, and they are more rapidly affected by FST. We observed increased expression of Acetylcholine Chrm4, Adra2b, Glutamate Grin3b, Gpr156 and GABA Gpr156. We have seen massive changes in neuropeptides and their receptors expression after acute stress. Roughly speaking, increase in receptors mRNA level and decrease in peptides mRNA level. For example, maintenance wakefulness is crucial for the fight or flight response. Orexin signaling is responsible for maintenance of wakefulness state [15,16], and we observed Hcrtr1 (orexin receptor) increased mRNA level. Shift of this signaling balance could lead to sleep disorders in PTSD or chronic stress [17]. Another notice that could be explained from evolutionary point of view is increase in Tachykinin 4 - substance P/enkephalin expression. Tac4 processing could produce Hemokinin-1, a peptide with antinociceptive effects [18]. This could be an evolutionary adaptation to the probability of meeting predators in stress conditions. Besides nociception, Tac4 also has been implicated to have a wide variety of biological actions including vasodilatation, smooth muscle contraction, neurogenic inflammation, and the activation of the immune system [19]. Increase in Bradykinin receptor expression serves to ensure local blood and oxygen access to organs [20]. Classical concept of adaptation to stress based on two major regulatory pathways: hypothalamic–pituitary–adrenocortical (HPA) axis and the sympathetic adrenomedullary axis. Role of corticotropin releasing hormone in HPA axis regulation is well described. Beside that, there are Crh expression neurons in different brain structures - cortex, amygdala and especially midbrain and brainstem [2]. Clear understanding of the role of these neurons in stress reaction and adaptation to stress is on the way and needs further investigation. In our case we observed intensification of only Crhr2 signaling via increase in its expression. Remarkably, besides Crh, significant Cga, Trh, Tshb and Utsb2b reduced expression was detected. These types of brainstem neurons are even more under-investigated. As was mentioned, mainly decrease in peptides i.e. ligands and increase in receptors expression could be explained that wave of elevated transcription of ligands mRNA was early. Significant downregulation of retinoic acid and Igf2 pathways was observed, confirming previous results that retinoic acid signaling affects rats emotional behavior [21]. In arousal reaction observed massive neurotransmitters release. At 2h after FST in response to this we observed widespread increased expression of intermediate filaments, keratins cytoskeleton and motor proteins. Increased expression of transcription factors, mastering regulation of various cell programs was also observed at this time. Interestingly, we have seen and detected some signs of microglial or may be immune cells activation 2h after acute stress. Primarily, this can be attributed to microglia activation because we have detected only Il13 elevated mRNA level, without IL4 or IL6 upregulation. During LPS induced microglia activation, uprising of proinflammatory cytokines Il4,Il6, Il1b,Tnfsf13b is observed [22,23]. Interleukin 13 is an anti-inflammatory cytokine that regulates microglia/macrophage polarization toward an anti-inflammatory phenotype and is expressed exclusively in activated microglia [24]. Another anti-inflammatory chemokine that was upregulated is Ccl24. This chemokine could be produced by anti-inflammatory microglia and can induce T-cell differentiation of Th2 and Treg cells [25]. Microglia is a resident macrophage of the brain and very labile cell population. It was shown that mice lacking Bdnf precisely in microglial cells have memory and synaptic plasticity impairment [26]. Microglial cells could also participate in synaptic pruning [27]. In the hypothalamus and hippocampus stress induced microglial activation occurs through β 1-AR and β 2-AR adrenergic receptors [28]. Remarkably, that together with indication of anti inflammatory microglia activation we observed increased expression of receptors to proinflammatory cytokines Il9r, Il12rb1 and TNF-receptors Tnfrsf14, Tnfrsf13c, Tnfrsf25,Tnfrsf1b and pleiotropic Il21r receptor. Such duality in activation of a pro- and anti- inflammatory signaling pathway could be explained by compensatory activation of anti-inflammatory ones in response to mostly inflammatory previous pulse. Interestingly, increased expression IFN-lambda Ifnl3, one of the key cytokines in innate antiviral defenses, was observed after stress. At the moment it could hardly be explained. Increased expression of Tgf-beta family ligands Gdf2 (Bmp9) and Bmp8b could be explained by requirement of high energy balance during arousal. Increased Leptin level could be explained also by this reason. Bmp8b has a thermogenic effect which is mediated by the inhibition of AMP-activated protein kinase (AMPK) in the ventromedial nucleus of the hypothalamus (VMH) and the subsequent increase in orexin OX signaling via the OX receptor 1 (OX1R) in the lateral hypothalamic area (LHA) [29]. Possibly similar signaling could take place in the brainstem. Another pathway that was activated after stress is Wnt. Wnt signaling regulates diverse aspects of development of the brain such as neural stem cell proliferation, neuronal differentiation, axon guidance, dendritogenesis, and synaptogenesis [30]. Recently studies revealed that activity of Wnt pathway could be critically controlled in response to neuronal activity [31]. Wnt signaling is implicated in postsynaptic NMDA and GABA receptors clustering, and synaptic plasticity. Our results concerning other cAMP, Calcium signaling and MAPK pathways line with expectations and previous works. Our RNAseq results were verified and confirmed with RT-qPCR. As a target genes we choose genes with low expression level, or expressed in restricted cell populations. Decorin (Dcn) end Tcf7l1 are genes related to Wnt/ β -catenin signaling. Tcf7l1 - transcription factor, is situated downstream on pathway, with β -catenin as a coactivator it binds to HMG high mobility group domain proteins and affects transcription [32]. Decorin is an ECM molecule regulated by Wnt7a and could be characterized as a neurogenic factor and it was downregulated after FST. Both genes from Wnt pathway was downregulated accordig our RT-qPCR results. Esyt1 is a candidate sensor protein for asynchronous neurotransmitter release [33], and was upregulated. For the RT-qPCR we made a screen for suitable reference genes. For the experiments involving acute stress it is Hprt, Gapdh, Nono, Trfr, TFIID, B3galt4, Rpl8, Rpl30, Rps13a, Rps16, Rps17. In general, results after DSN treatment correlated at a high level with RNAseq results without it, but there was a proportion of genes that shifted its logFC values. It is mostly rare transcripts with higher 0.5-0.9 GC content. This method is more suitable for normalization of screening libraries i.e. two hybrid or expression libraries. When you just need to elevate representation of rare transcripts in it. In conclusion, in this work we analyzed transcriptomic changes and main pathways affected by acute stress in the rat brainstem. Historically, characterization of arousal as a reaction with a set of mutually exclusive and opposite states [5] finds its reflection in activation of opposite molecular cascades and pathways.

4. Materials and Methods

4.1. Animals and Experimental Design

All animal procedures were approved through the Institutional Animal Care and Use Committee and conducted in compliance with the European Communities Council Directive 63/2010/EU. Adult P90 male Wistar rats were housed in groups 4 per cage, at 22-24°C, 10/14 - light/dark cycle with free access to food and water.

4.2. Force swim test and sample collections

Twenty four hours before any manipulations animals were housed in a single cage with free access to food and water. The day before test animals (n=6 per group) had a 15 min pretest in a glass 30x60cm swimming cylinder filled with water t=25°C. Following day 5 min the test session was done using the same setup. After stress animals were housed for two hours in their single cage. After that brainstem samples excluding midbrain region and cerebellum were snap freezed in liquid nitrogen.

4.3. Sequencing libraries preparation and DSN treatment

RNA from four animals were pooled for a final amount 1µg. cDNA synthesis and amplification for making double stranded libraries was carried out with Mint cDNA synthesis kit (Evrogen, SK001). Amount of needed cycles - 10, for amplification was determined with sybr-green real time PCR. DSN treatment and cDNA normalization was done with Trimmer-2 cDNA normalization kit (Evrogen, NK003). Briefly, 1.2 µg of double stranded library was taken as start material in 16ul reaction volume. Denaturation was done for 2min at 98°C. Then samples were hybridized at 68 °C for 5h DSN treatment was carried out with 0.25U of enzyme 25 min at 68°C. After that synthesis of the double stranded library was done with 11 amplification cycles. For the NGS, libraries were sheared with ultrasound on 200bp fragments. Adapters and indexes were ligated with Kappa HyperPrep Kit (Roche). The concentration of cDNA libraries was measured by the dsDNA High Sensitivity Kit on a Qubit 4.0 fluorometer (Thermo Fisher Scientific). The quality of cDNA libraries was assessed using High Sensitivity D1000 ScreenTape on a 4150 TapeStation (Agilent). Libraries were sequenced on a NextSeq 500 instrument (Illumina) using single-end 75 bp reads, with 20M reads per sample after DSN treatment and 80M reads per sample without it.

4.4. Bioinformatics analysis

Quality of the reads were assessed with FASTQC. Adapter sequences were trimmed with Trimmomatic [34]. Raw reads were aligned to Rnor7.2 reference genome with hisat2 [35].The number of mapped reads was counted by the featureCounts tool from Rsubread package [36]. Library counts normalization and glm differential gene expression were calculated using edger [37]. Functional annotation and visualization was done using clusterprofiler [38] and pathview [39] packages. Reference genes were chosen on counts per million data with SARPcompo package [12]. Rcripts used in the study could be found in Supplementary materials.

4.5. Real-time RT-qPCR analysis

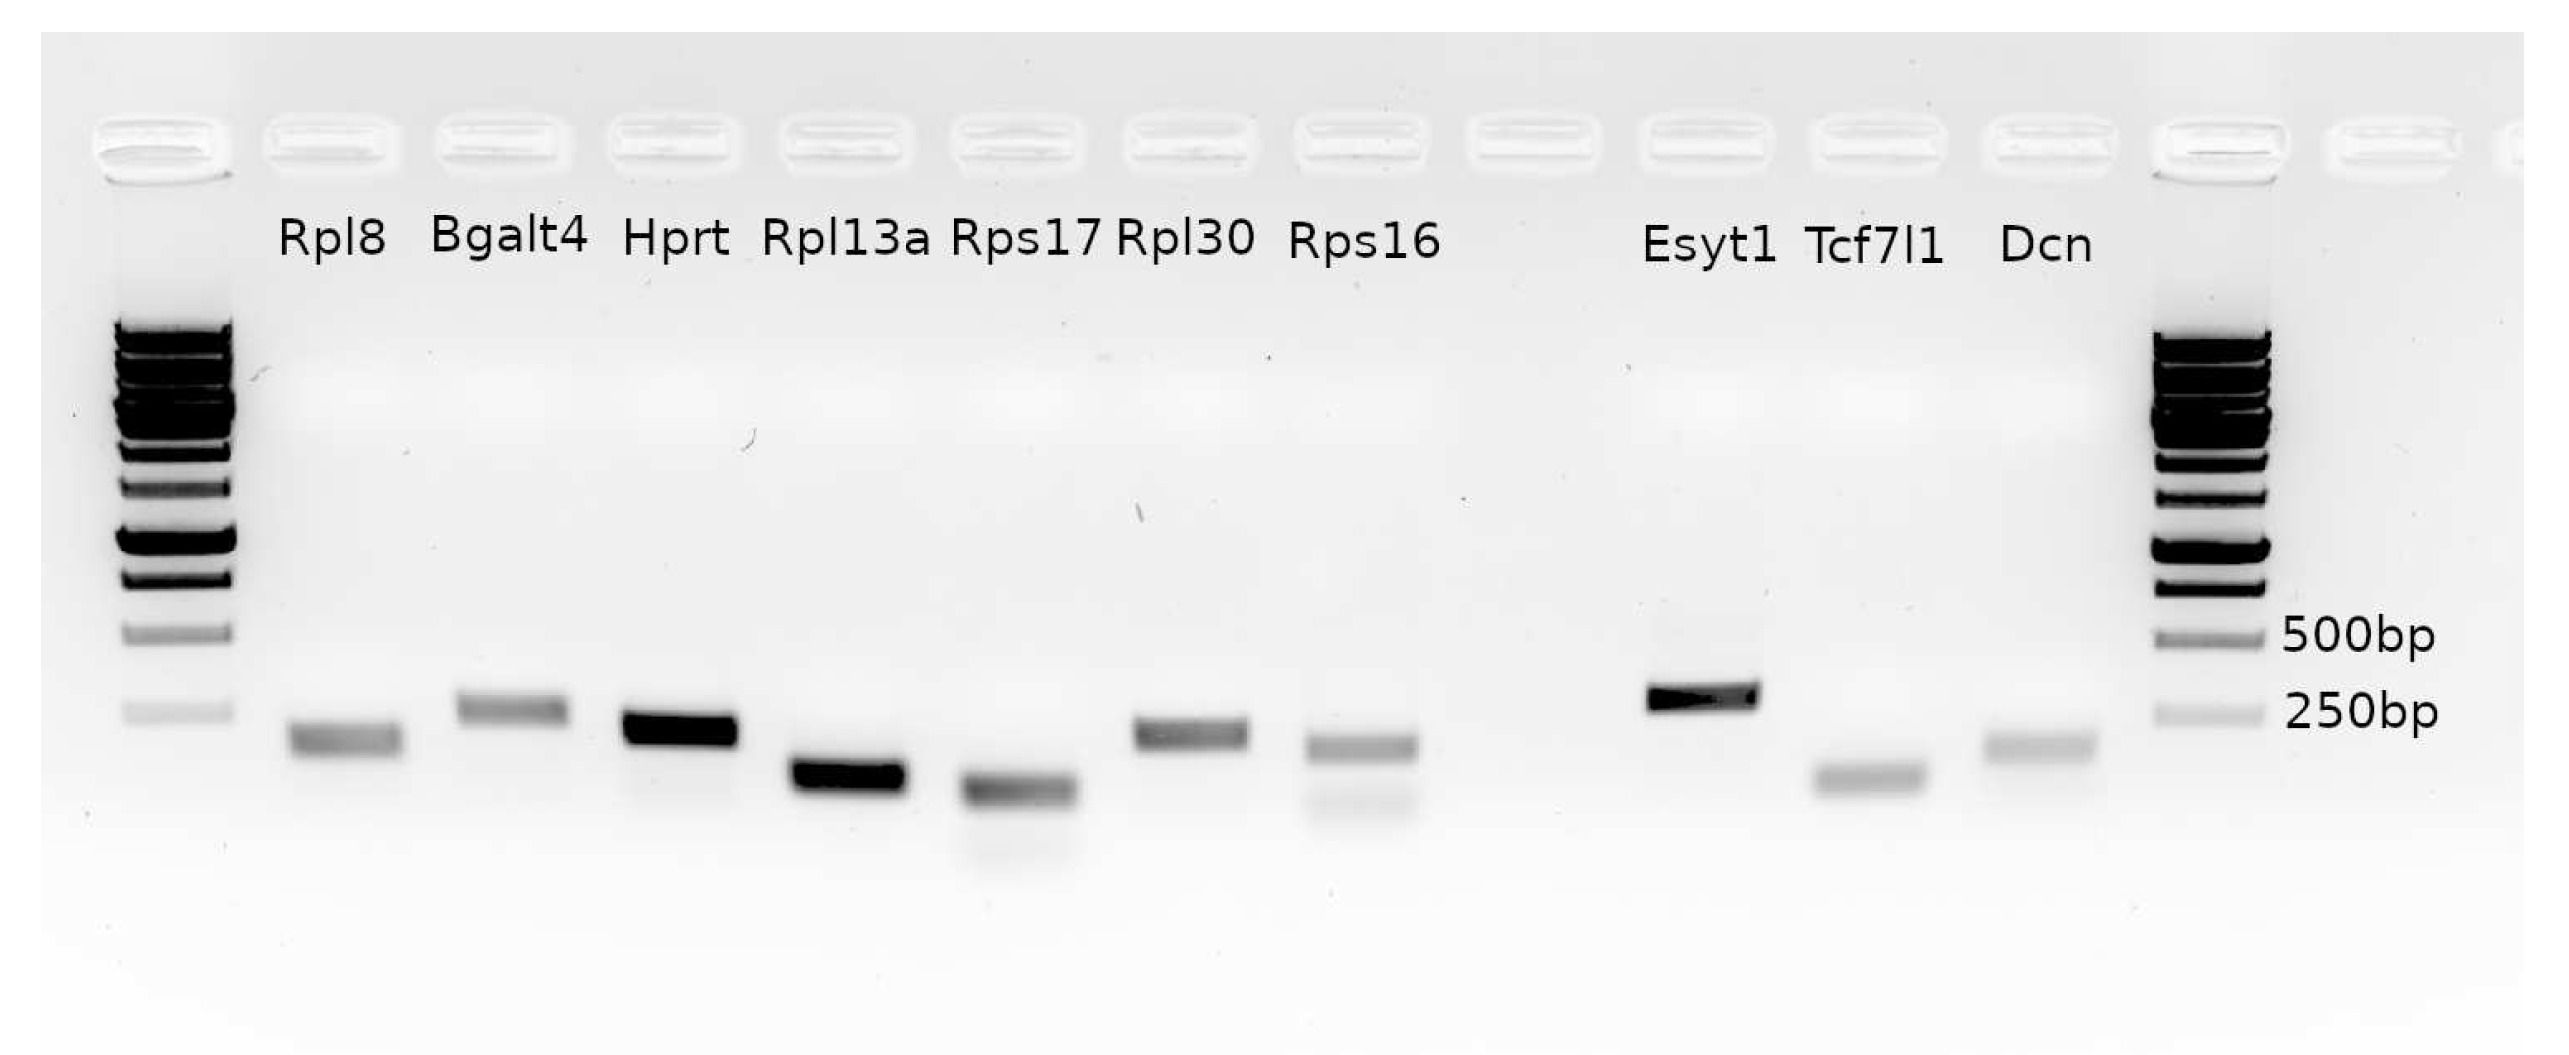
Total cellular RNA was isolated using a single-step acidic phenol extraction as previously described. Reverse transcription was performed with the MMLV Reverse Transcriptase (Sibenzyme) 1 µg total RNA was reverse transcribed with the 100U MMLV Reverse Transcriptase (Sibenzyme), 1mM dNTP, 2 mM DTT, 1 µM OligodT primer (Evrogen, SB001) and standard thermocycler temperature conditions for MMLV. All real-time PCR reactions were performed using the ABI ViiA7 system (Thermo) and cycling conditions frome supplementary materials. Amplifications were done using the real time 5X qPCRmix-HS SYBR+LowROX (Evrogen, PK156S) and primers and Taqman probes (actin) from the Supplementary material. Product sizes were checked with agarose gele electrophoresis (Supplementary Materials). Δ Δ Ct was calculated with the root mean square of all selected reference genes Ct’s in Excel, then in R tested for normality with the Shapiro-Wilk test. Group effect was tested with Welch Two Sample t-test. Significant considered values with p<0.05. Ct’s and fold change data could be found in Supplementary tables 8, 9 respectively.

Supplementary Materials

The following supporting information can be downloaded at the website of this paper posted on Preprints.org

Author Contributions

LDA. conceived the project, designed, and performed the experiments, and evaluated the data; SuEV, KTS – RNA isolation, cDNA synthesis for RT-qPCR, Mint cDNA libraries preparation, SuEV, KTS, LDA, BVV – animal testing, samples collection, LDA – Mint libraries preparations, DSN treatment, LDA – Bioinformatics analysis, AAK, TSG, EVD – KAPA cDNA library preparation, pooling, and sequencing.

Funding

Studies was supported by joint research project FWNR-2023-0002.

Institutional Review Board Statement

Not relevant

Informed Consent Statement

Not applicable

Data Availability Statement

Raw reads and sorted bam files were deposed to CNGB https://db.cngb.org/ under the project number CNP0004878. Rscript and other findings of the paper are included as supplementary tables. PCR results are also included as supplementary tables. KEGG pathway graphs with overlaid expression information could be founded at https://lda01.shinyapps.io/tr_app2/ as interactive shiny application.

Acknowledgments

RNA-sequencing was carried out in The Core Facility «Medical genomics» (Tomsk NRMC) and the Tomsk Regional Common Use Center. Bioinformatics analysis was carried out at the Information and Computing Center of Novosibirsk State University.

Conflicts of Interest

The authors declare no conflict of interest.

Appendix A. Supplementary Materials

Table A1. Oligo sequence information.
Name Seqence 5′-3′ product sze, bp Tm, °C
Rps17F AGACTGTGAAGAAGGCGGC 81 64
Rps17R CGCGCTTGTTGGTGTGAAA 81 64
Rps16F AGAGCTGTGCCTGCTTCTG 180 64
Rps16R CTACATGCCTGGGGTTGGG 180 64
Rpl8F CTGTTTGGGGGCTCTCTGG 163 62
Rpl8R TAGGATGGTCACCTGCGGA 163 62
Rpl13aF AGGTGGTGGTTGTACGCTG 109 62
Rpl13aR CGAGACGGGTTGGTGTTCA 109 62
B3galt4F TGTGGGAGTAAGCGCAAGG 240 62
B3galt4R ATGAACCGGCACCTCAAGG 240 62
Rpl30F TGCATGCATGGTCCCCATT 214 64
Rpl30R GTTCCTGGGACCCAAGAGC 214 64
HgprtaseF ATGTCGACCCTCAGTCCCA 209 62
HgprtaseR CCCTTCAGCACACAGAGGG 209 62
Esyt1F CTGACTTCTCGCCTTGCCTC 299 61.7
Esyt1R GCTGTATTTGGCATGAGCTACG 299 61.7
Tcf7l1F CCCCTTGTGCTGTGGTAGG 75 61.7
Tcf7l1R GGAGGGCAGAGAGTCAGGA 75 61.7
DcnF TGGAGCCTTGCAGGGAATG 148 63.8
DcnR TTTCAGGCTGGCTGCATCA 148 63.8
β -actin Rn00667869_m1(Thermo) - 60
Cycling conditions were as follows: 92 °C - 3min, 94 °C - 10s, Tm°C - 15s, 72 °C -10s for 40 cycles.
Figure A1. Product sizes were checked with agarose gel electrophoresis.
Preprints 88848 g0a1

References

  1. Lanshakov, D.A.; Sukhareva, E.V.; Bulygina, V.V.; Bannova, A.V.; Shaburova, E.V.; Kalinina, T.S. Single neonatal dexamethasone administration has long-lasting outcome on depressive-like behaviour, Bdnf, Nt-3, p75ngfr and sorting receptors (SorCS1-3) stress reactive expression. Scientific Reports 2021, 11, 8092. [Google Scholar] [CrossRef] [PubMed]
  2. Chaves, T.; Fazekas, C.L.; Horváth, K.; Correia, P.; Szabó, A.; Török, B.; Bánrévi, K.; Zelena, D. Stress Adaptation and the Brainstem with Focus on Corticotropin-Releasing Hormone. International Journal of Molecular Sciences 2021, 22, 9090. [Google Scholar] [CrossRef] [PubMed]
  3. Sattin, D.; Leonardi, M.; Picozzi, M. The autonomic nervous system and the brainstem: A fundamental role or the background actors for consciousness generation? Hypothesis, evidence, and future directions for rehabilitation and theoretical approaches. Brain and Behavior 2020, 10, e01474. [Google Scholar] [CrossRef] [PubMed]
  4. Giustino, T.F.; Maren, S. Noradrenergic Modulation of Fear Conditioning and Extinction. Frontiers in Behavioral Neuroscience 2018, 12, 43. [Google Scholar] [CrossRef]
  5. Ross, J.A.; Van Bockstaele, E.J. The Locus Coeruleus- Norepinephrine System in Stress and Arousal: Unraveling Historical, Current, and Future Perspectives. Frontiers in Psychiatry 2021, 11, 601519. [Google Scholar] [CrossRef] [PubMed]
  6. Chaoui, N.; Anarghou, H.; Laaroussi, M.; Essaidi, O.; Najimi, M.; Chigr, F.; Biological Engineering Laboratory, Faculty of Sciences and Techniques, Sultan Moulay Slimane University, Beni Mellal, Morocco. Long lasting effect of acute restraint stress on behavior and brain anti-oxidative status. AIMS Neuroscience 2022, 9, 57–75. [Google Scholar] [CrossRef] [PubMed]
  7. Yi, H.; Cho, Y.J.; Won, S.; Lee, J.E.; Jin Yu, H.; Kim, S.; Schroth, G.P.; Luo, S.; Chun, J. Duplex-specific nuclease efficiently removes rRNA for prokaryotic RNA-seq. Nucleic Acids Research 2011, 39, e140. [Google Scholar] [CrossRef]
  8. Zhulidov, P.A.; Bogdanova, E.A.; Shcheglov, A.S.; Vagner, L.L.; Khaspekov, G.L.; Kozhemyako, V.B.; Matz, M.V.; Meleshkevitch, E.; Moroz, L.L.; Lukyanov, S.A.; Shagin, D.A. Simple cDNA normalization using kamchatka crab duplex-specific nuclease. Nucleic Acids Research 2004, 32, e37. [Google Scholar] [CrossRef]
  9. Baserga, S.J.; Linnenbach, A.J.; Malcolm, S.; Ghosh, P.; Malcolm, A.D.; Takeshita, K.; Forget, B.G.; Benz, E.J. Polyadenylation of a human mitochondrial ribosomal RNA transcript detected by molecular cloning. Gene 1985, 35, 305–312. [Google Scholar] [CrossRef]
  10. Slomovic, S.; Laufer, D.; Geiger, D.; Schuster, G. Polyadenylation of ribosomal RNA in human cells. Nucleic Acids Research 2006, 34, 2966–2975. [Google Scholar] [CrossRef]
  11. Margiotta, A.; Bucci, C. Role of Intermediate Filaments in Vesicular Traffic. Cells 2016, 5, 20. [Google Scholar] [CrossRef] [PubMed]
  12. Curis, E.; Courtin, C.; Geoffroy, P.A.; Laplanche, J.L.; Saubaméa, B.; Marie-Claire, C. Determination of sets of covariating gene expression using graph analysis on pairwise expression ratios. Bioinformatics 2019, 35, 258–265. [Google Scholar] [CrossRef] [PubMed]
  13. Libersat, F.; Pflueger, H.J. Monoamines and the Orchestration of Behavior. BioScience 2004, 54, 17. [Google Scholar] [CrossRef]
  14. Von Ziegler, L.M.; Floriou-Servou, A.; Waag, R.; Das Gupta, R.R.; Sturman, O.; Gapp, K.; Maat, C.A.; Kockmann, T.; Lin, H.Y.; Duss, S.N.; Privitera, M.; Hinte, L.; Von Meyenn, F.; Zeilhofer, H.U.; Germain, P.L.; Bohacek, J. Multiomic profiling of the acute stress response in the mouse hippocampus. Nature Communications 2022, 13, 1824. [Google Scholar] [CrossRef] [PubMed]
  15. Alexandre, C.; Andermann, M.L.; Scammell, T.E. Control of arousal by the orexin neurons. Current Opinion in Neurobiology 2013, 23, 752–759. [Google Scholar] [CrossRef] [PubMed]
  16. Inutsuka, A.; Yamanaka, A. The physiological role of orexin/hypocretin neurons in the regulation of sleep/wakefulness and neuroendocrine functions. Frontiers in Endocrinology 2013, 4. [Google Scholar] [CrossRef] [PubMed]
  17. Kaplan, G.B.; Lakis, G.A.; Zhoba, H. Sleep-wake and arousal dysfunctions in post-traumatic stress disorder: Role of orexin systems. Brain Research Bulletin 2022, 186, 106–122. [Google Scholar] [CrossRef]
  18. Fu, C.Y.; Tang, X.L.; Yang, Q.; Chen, Q.; Wang, R. Effects of rat/mouse hemokinin-1, a mammalian tachykinin peptide, on the antinociceptive activity of pethidine administered at the peripheral and supraspinal level. Behavioural Brain Research 2007, 184, 39–46. [Google Scholar] [CrossRef] [PubMed]
  19. Page, N.M.; Bell, N.J.; Gardiner, S.M.; Manyonda, I.T.; Brayley, K.J.; Strange, P.G.; Lowry, P.J. Characterization of the endokinins: Human tachykinins with cardiovascular activity. Proceedings of the National Academy of Sciences 2003, 100, 6245–6250. [Google Scholar] [CrossRef]
  20. Golias, C.; Charalabopoulos, A.; Stagikas, D.; Charalabopoulos, K.; Batistatou, A. The kinin system–bradykinin: biological effects and clinical implications. Multiple role of the kinin system–bradykinin. Hippokratia 2007, 11, 124–128. [Google Scholar]
  21. Zhang, Y.; Crofton, E.J.; Smith, T.E.; Koshy, S.; Li, D.; Green, T.A. Manipulation of retinoic acid signaling in the nucleus accumbens shell alters rat emotional behavior. Behavioural Brain Research 2019, 376, 112177. [Google Scholar] [CrossRef] [PubMed]
  22. Babenko, V.N.; Shishkina, G.T.; Lanshakov, D.A.; Sukhareva, E.V.; Dygalo, N.N. LPS Administration Impacts Glial Immune Programs by Alternative Splicing. Biomolecules 2022, 12, 277. [Google Scholar] [CrossRef] [PubMed]
  23. Shishkina, G.T.; Kalinina, T.S.; Lanshakov, D.A.; Bulygina, V.V.; Komysheva, N.P.; Bannova, A.V.; Drozd, U.S.; Dygalo, N.N. Genes Involved by Dexamethasone in Prevention of Long-Term Memory Impairment Caused by Lipopolysaccharide-Induced Neuroinflammation. Biomedicines 2023, 11, 2595. [Google Scholar] [CrossRef] [PubMed]
  24. Chen, D.; Li, J.; Huang, Y.; Wei, P.; Miao, W.; Yang, Y.; Gao, Y. Interleukin 13 promotes long-term recovery after ischemic stroke by inhibiting the activation of STAT3. Journal of Neuroinflammation 2022, 19, 112. [Google Scholar] [CrossRef] [PubMed]
  25. Xu, Y.; Li, Y.; Wang, C.; Han, T.; Liu, H.; Sun, L.; Hong, J.; Hashimoto, M.; Wei, J. The reciprocal interactions between microglia and T cells in Parkinson’s disease: a double-edged sword. Journal of Neuroinflammation 2023, 20, 33. [Google Scholar] [CrossRef]
  26. Parkhurst, C.N.; Yang, G.; Ninan, I.; Savas, J.N.; Yates, J.R.; Lafaille, J.J.; Hempstead, B.L.; Littman, D.R.; Gan, W.B. Microglia Promote Learning-Dependent Synapse Formation through Brain-Derived Neurotrophic Factor. Cell 2013, 155, 1596–1609. [Google Scholar] [CrossRef] [PubMed]
  27. Paolicelli, R.C.; Bolasco, G.; Pagani, F.; Maggi, L.; Scianni, M.; Panzanelli, P.; Giustetto, M.; Ferreira, T.A.; Guiducci, E.; Dumas, L.; Ragozzino, D.; Gross, C.T. Synaptic Pruning by Microglia Is Necessary for Normal Brain Development. Science 2011, 333, 1456–1458. [Google Scholar] [CrossRef] [PubMed]
  28. Sugama, S.; Takenouchi, T.; Hashimoto, M.; Ohata, H.; Takenaka, Y.; Kakinuma, Y. Stress-induced microglial activation occurs through β-adrenergic receptor: noradrenaline as a key neurotransmitter in microglial activation. Journal of Neuroinflammation 2019, 16, 266. [Google Scholar] [CrossRef]
  29. Martins, L.; Seoane-Collazo, P.; Contreras, C.; González-García, I.; Martínez-Sánchez, N.; González, F.; Zalvide, J.; Gallego, R.; Diéguez, C.; Nogueiras, R.; Tena-Sempere, M.; López, M. A Functional Link between AMPK and Orexin Mediates the Effect of BMP8B on Energy Balance. Cell Reports 2016, 16, 2231–2242. [Google Scholar] [CrossRef]
  30. Teo, S.; Salinas, P.C. Wnt-Frizzled Signaling Regulates Activity-Mediated Synapse Formation. Frontiers in Molecular Neuroscience 2021, 14, 683035. [Google Scholar] [CrossRef]
  31. Tang, S.J. Synaptic Activity-Regulated Wnt Signaling in Synaptic Plasticity, Glial Function and Chronic Pain. CNS & Neurological Disorders - Drug Targets 2014, 13, 737–744. [Google Scholar] [CrossRef]
  32. Bem, J.; Brożko, N.; Chakraborty, C.; Lipiec, M.A.; Koziński, K.; Nagalski, A.; Szewczyk, M.; Wiśniewska, M.B. Wnt/β-catenin signaling in brain development and mental disorders: keeping TCF7L2 in mind. FEBS Letters 2019, 593, 1654–1674. [Google Scholar] [CrossRef] [PubMed]
  33. Balle, F.; Kaiserslautern, T.U. (Eds.) Tagungsband / Young Researcher Symposium (YRS) 2013; Fraunhofer Verlag: Stuttgart, 2013. [Google Scholar]
  34. Bolger, A.M.; Lohse, M.; Usadel, B. Trimmomatic: a flexible trimmer for Illumina sequence data. Bioinformatics 2014, 30, 2114–2120. [Google Scholar] [CrossRef]
  35. Kim, D.; Langmead, B.; Salzberg, S.L. HISAT: a fast spliced aligner with low memory requirements. Nature Methods 2015, 12, 357–360. [Google Scholar] [CrossRef] [PubMed]
  36. Liao, Y.; Smyth, G.K.; Shi, W. The R package Rsubread is easier, faster, cheaper and better for alignment and quantification of RNA sequencing reads. Nucleic Acids Research 2019, 47, e47–e47. [Google Scholar] [CrossRef] [PubMed]
  37. McCarthy, D.J.; Chen, Y.; Smyth, G.K. Differential expression analysis of multifactor RNA-Seq experiments with respect to biological variation. Nucleic Acids Research 2012, 40, 4288–4297. [Google Scholar] [CrossRef] [PubMed]
  38. Wu, T.; Hu, E.; Xu, S.; Chen, M.; Guo, P.; Dai, Z.; Feng, T.; Zhou, L.; Tang, W.; Zhan, L.; Fu, X.; Liu, S.; Bo, X.; Yu, G. clusterProfiler 4.0: A universal enrichment tool for interpreting omics data. The Innovation 2021, 2, 100141. [Google Scholar] [CrossRef]
  39. Luo, W.; Brouwer, C. Pathview: an R/Bioconductor package for pathway-based data integration and visualization. Bioinformatics 2013, 29, 1830–1831. [Google Scholar] [CrossRef]
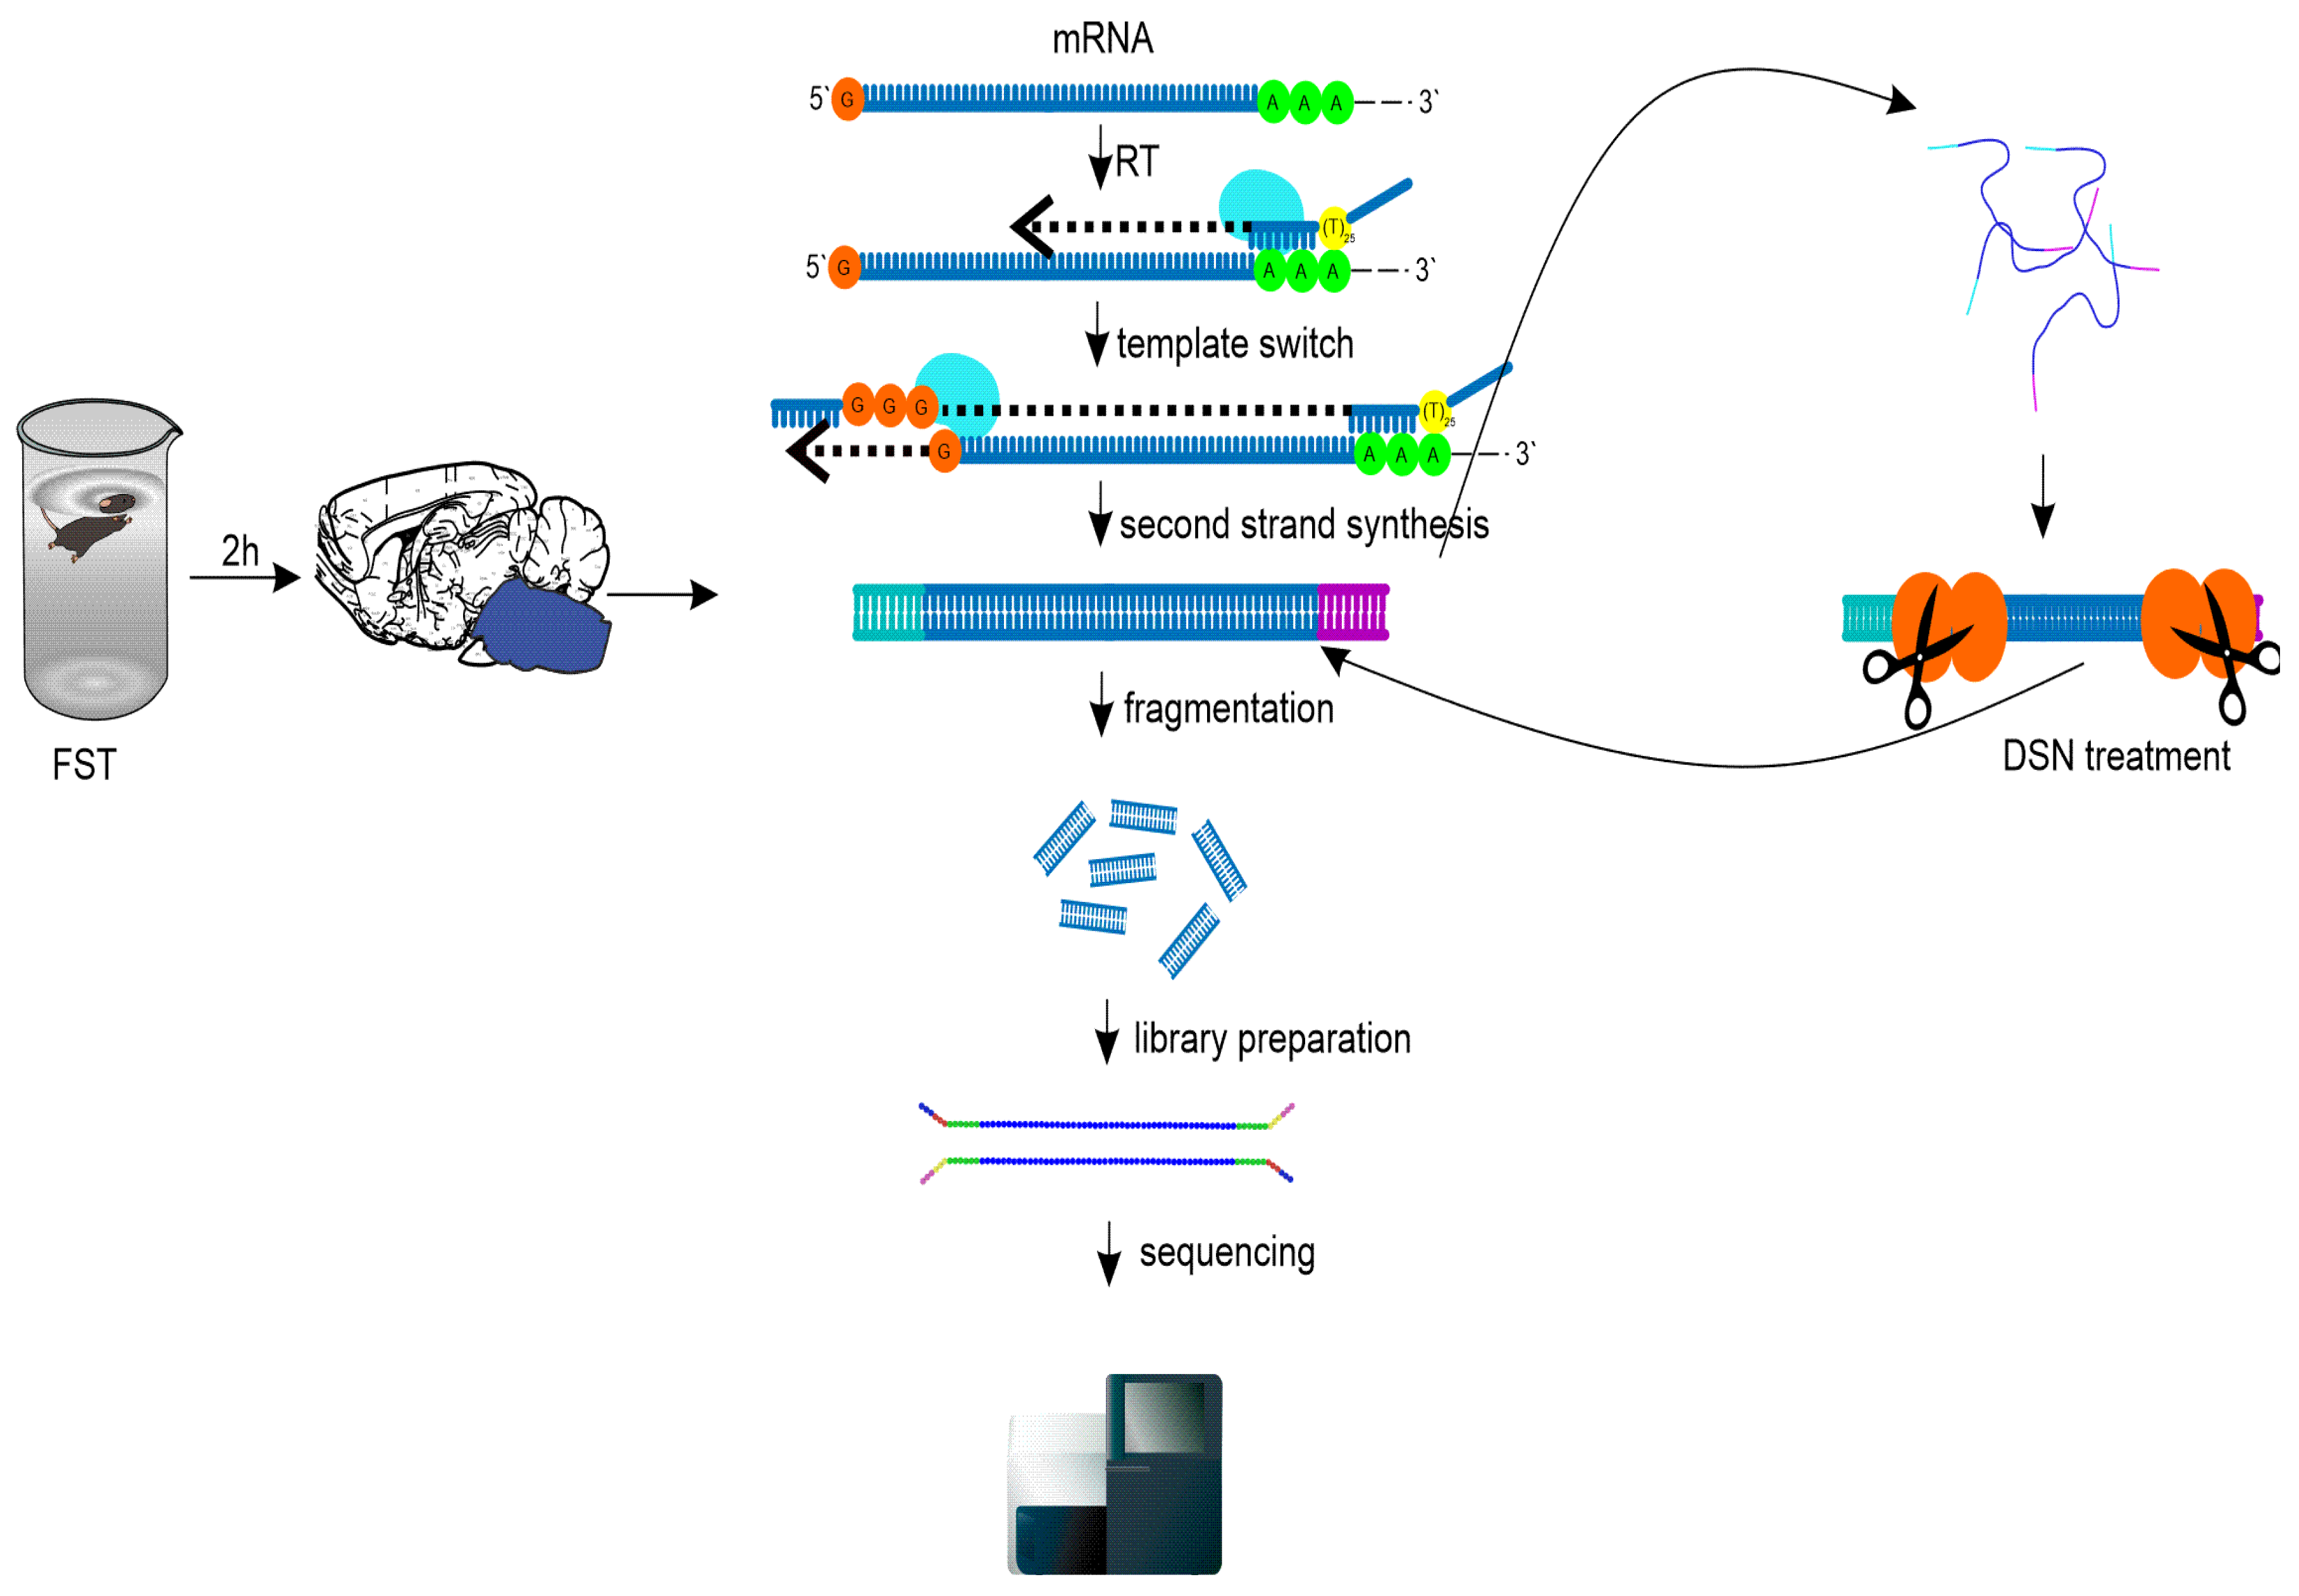
Figure 1. Principal scheme of the experiments. Two hours after FST, the brainstem region was isolated, cDNA libraries were prepared with SMART, template switching technology, and part of the libraries underwent double stranded nuclease normalization. Then all libraries were sequenced on NextSeq 500.
Preprints 88848 g001
Figure 2. Library characterization and consistency validation of the data. First analysis of NGS data showed sizes of unnormalized libraries sizes (a) and sample distribution after normalization in pca dimensions (b). (c) - heatmap showing distribution and hierarchical clustering of the samples. (d) - read counts correlation in different samples n1,n3 - untreated CTRL, n34 -unreated FST, tr - respective DSN treatment sample. (e) Representation of 10 most abundant transcripts in the libraries, TPM - transcripts per millions.
Preprints 88848 g002
Figure 3. Differentially expressed genes (DEG). (a) - Volcano plots showing elected DEGs, cut off filter |log2FC|>1, p.adj <0.05, in the name of comparison pairs F=FST or noFST=nF, second letter stands for treatment T=DSN treated or nT=DSN NON treated (b) Venn diagrams showing quantity of common and separate genes from selected DEGs lists (ce) correlation of logFC data in different comparison pairs (gh) Dependency of logFC rank describing discrepancies in the data after DSN from transcripts representation, cDNA mean length and GC content.
Preprints 88848 g003
Figure 4. Functional annotation of transcriptomic data. (a) Five most significant GO terms in Biological processes from enrichment of all significant genes p.adj < 0.05 and hierarchy with more generalizing GO terms. (b) Main Biological processes GO terms of |log2FC|>1, p.adj.<0.05 genes.
Preprints 88848 g004
Figure 5. Main genes and pathways changed after FST. (a) - network of most enriched BP GO terms in UP regulated genes (b) network of most enriched BP GO terms in DOWN regulated genes (c-h) main KEGG enriched pathways with depicted genes expression information on it. KEGG pathway graphs with overlaid expression information could be founded at https://lda01.shinyapps.io/tr_app2/ as interactive shiny application.
Preprints 88848 g005
Figure 6. Selection of reference genes for RT-qPCR with method based on disjoint subgraphs. (a) resulting graphs where nodes represent RNA quantities of covariating gene (b) dendrogram representation of the graphs (c) scatterplots of CPM data for selected genes.
Preprints 88848 g006
Figure 7. Results of RT-qPCR (a) Reference genes Ct’s correlation matrix (b) expression of selected target genes in brainstem Image credit: Allen Institute for Brain Science (c) - transcripts abundance of target genes, TPM - transcripts per million (d) fold change expression after RT-qPCR, Welch Two Sample t-test * - p<0.05, ** - p < 0.01 (e) log2FC data of selected target genes from RNAseq data.
Preprints 88848 g007
Disclaimer/Publisher’s Note: The statements, opinions and data contained in all publications are solely those of the individual author(s) and contributor(s) and not of MDPI and/or the editor(s). MDPI and/or the editor(s) disclaim responsibility for any injury to people or property resulting from any ideas, methods, instructions or products referred to in the content.
Copyright: This open access article is published under a Creative Commons CC BY 4.0 license, which permit the free download, distribution, and reuse, provided that the author and preprint are cited in any reuse.
Prerpints.org logo

Preprints.org is a free preprint server supported by MDPI in Basel, Switzerland.

Subscribe

© 2024 MDPI (Basel, Switzerland) unless otherwise stated