1. Introduction
The challenge of managing urban mobility becomes more difficult as cities grow. Signalized intersections play a crucial role in ensuring the smooth operation of cities [1–4]. These intersections serve as critical nodes in the transportation network, orchestrating the flow of vehicles, pedestrians, and cyclists. The efficacy of traffic control at these junctions is essential for mitigating congestion, reducing emissions, and ensuring the safety of all road users [1,4–6]. In pursuit of enhanced intersection efficiency, recent years have witnessed the emergence of smart and data-driven traffic management systems. Among these innovations, LiDAR (Light Detection and Ranging) technology has shown great promise in revolutionizing the precision and adaptability of signalized intersection control. LiDAR sensors, with their ability to capture detailed, real-time data about the movement and behavior of vehicles and pedestrians, offer an opportunity to advance traffic management to a new level of sophistication [1–4,6–8,11,13].
This study focuses on a signalized intersection in MD, USA that equipped with two LiDAR sensors. In order to investigate the advantages of LiDAR sensor technology in signalized intersections, a practical study was conducted to explore the synergistic potential of LiDAR and microsimulation in optimizing the allocation of green time at signalized intersections. Smart green time allocation, tailored to the real-time traffic dynamics, can bring substantial improvements in intersection throughput, reduced delays, and lowered environmental impact [1]. Two LiDAR sensors continuously monitored the traffic flow at different intersection’s approaches. This data is then processed and analyzed to create dynamic traffic profiles, enabling the traffic signal controller to make informed decisions about green time allocation. The integration of LiDAR data with AIMSUN microsimulation provides a robust framework for assessing the impact of this technology on intersection efficiency under diverse traffic conditions.
The research presents the impacts of dynamic green
time allocation on traffic performance, safety, and environmental
sustainability. Furthermore, the implications of these findings for urban
planners, traffic engineers, and policymakers were explored aiming to address
the ever-growing challenges of urban mobility. In essence, this study
underscores the potential of LiDAR technology to usher in a new era of smart,
data-driven traffic management, and the pivotal role it can play in enhancing
intersection efficiency to meet the demands of urbanization and create
sustainable urban environments.
2. Data Analysis
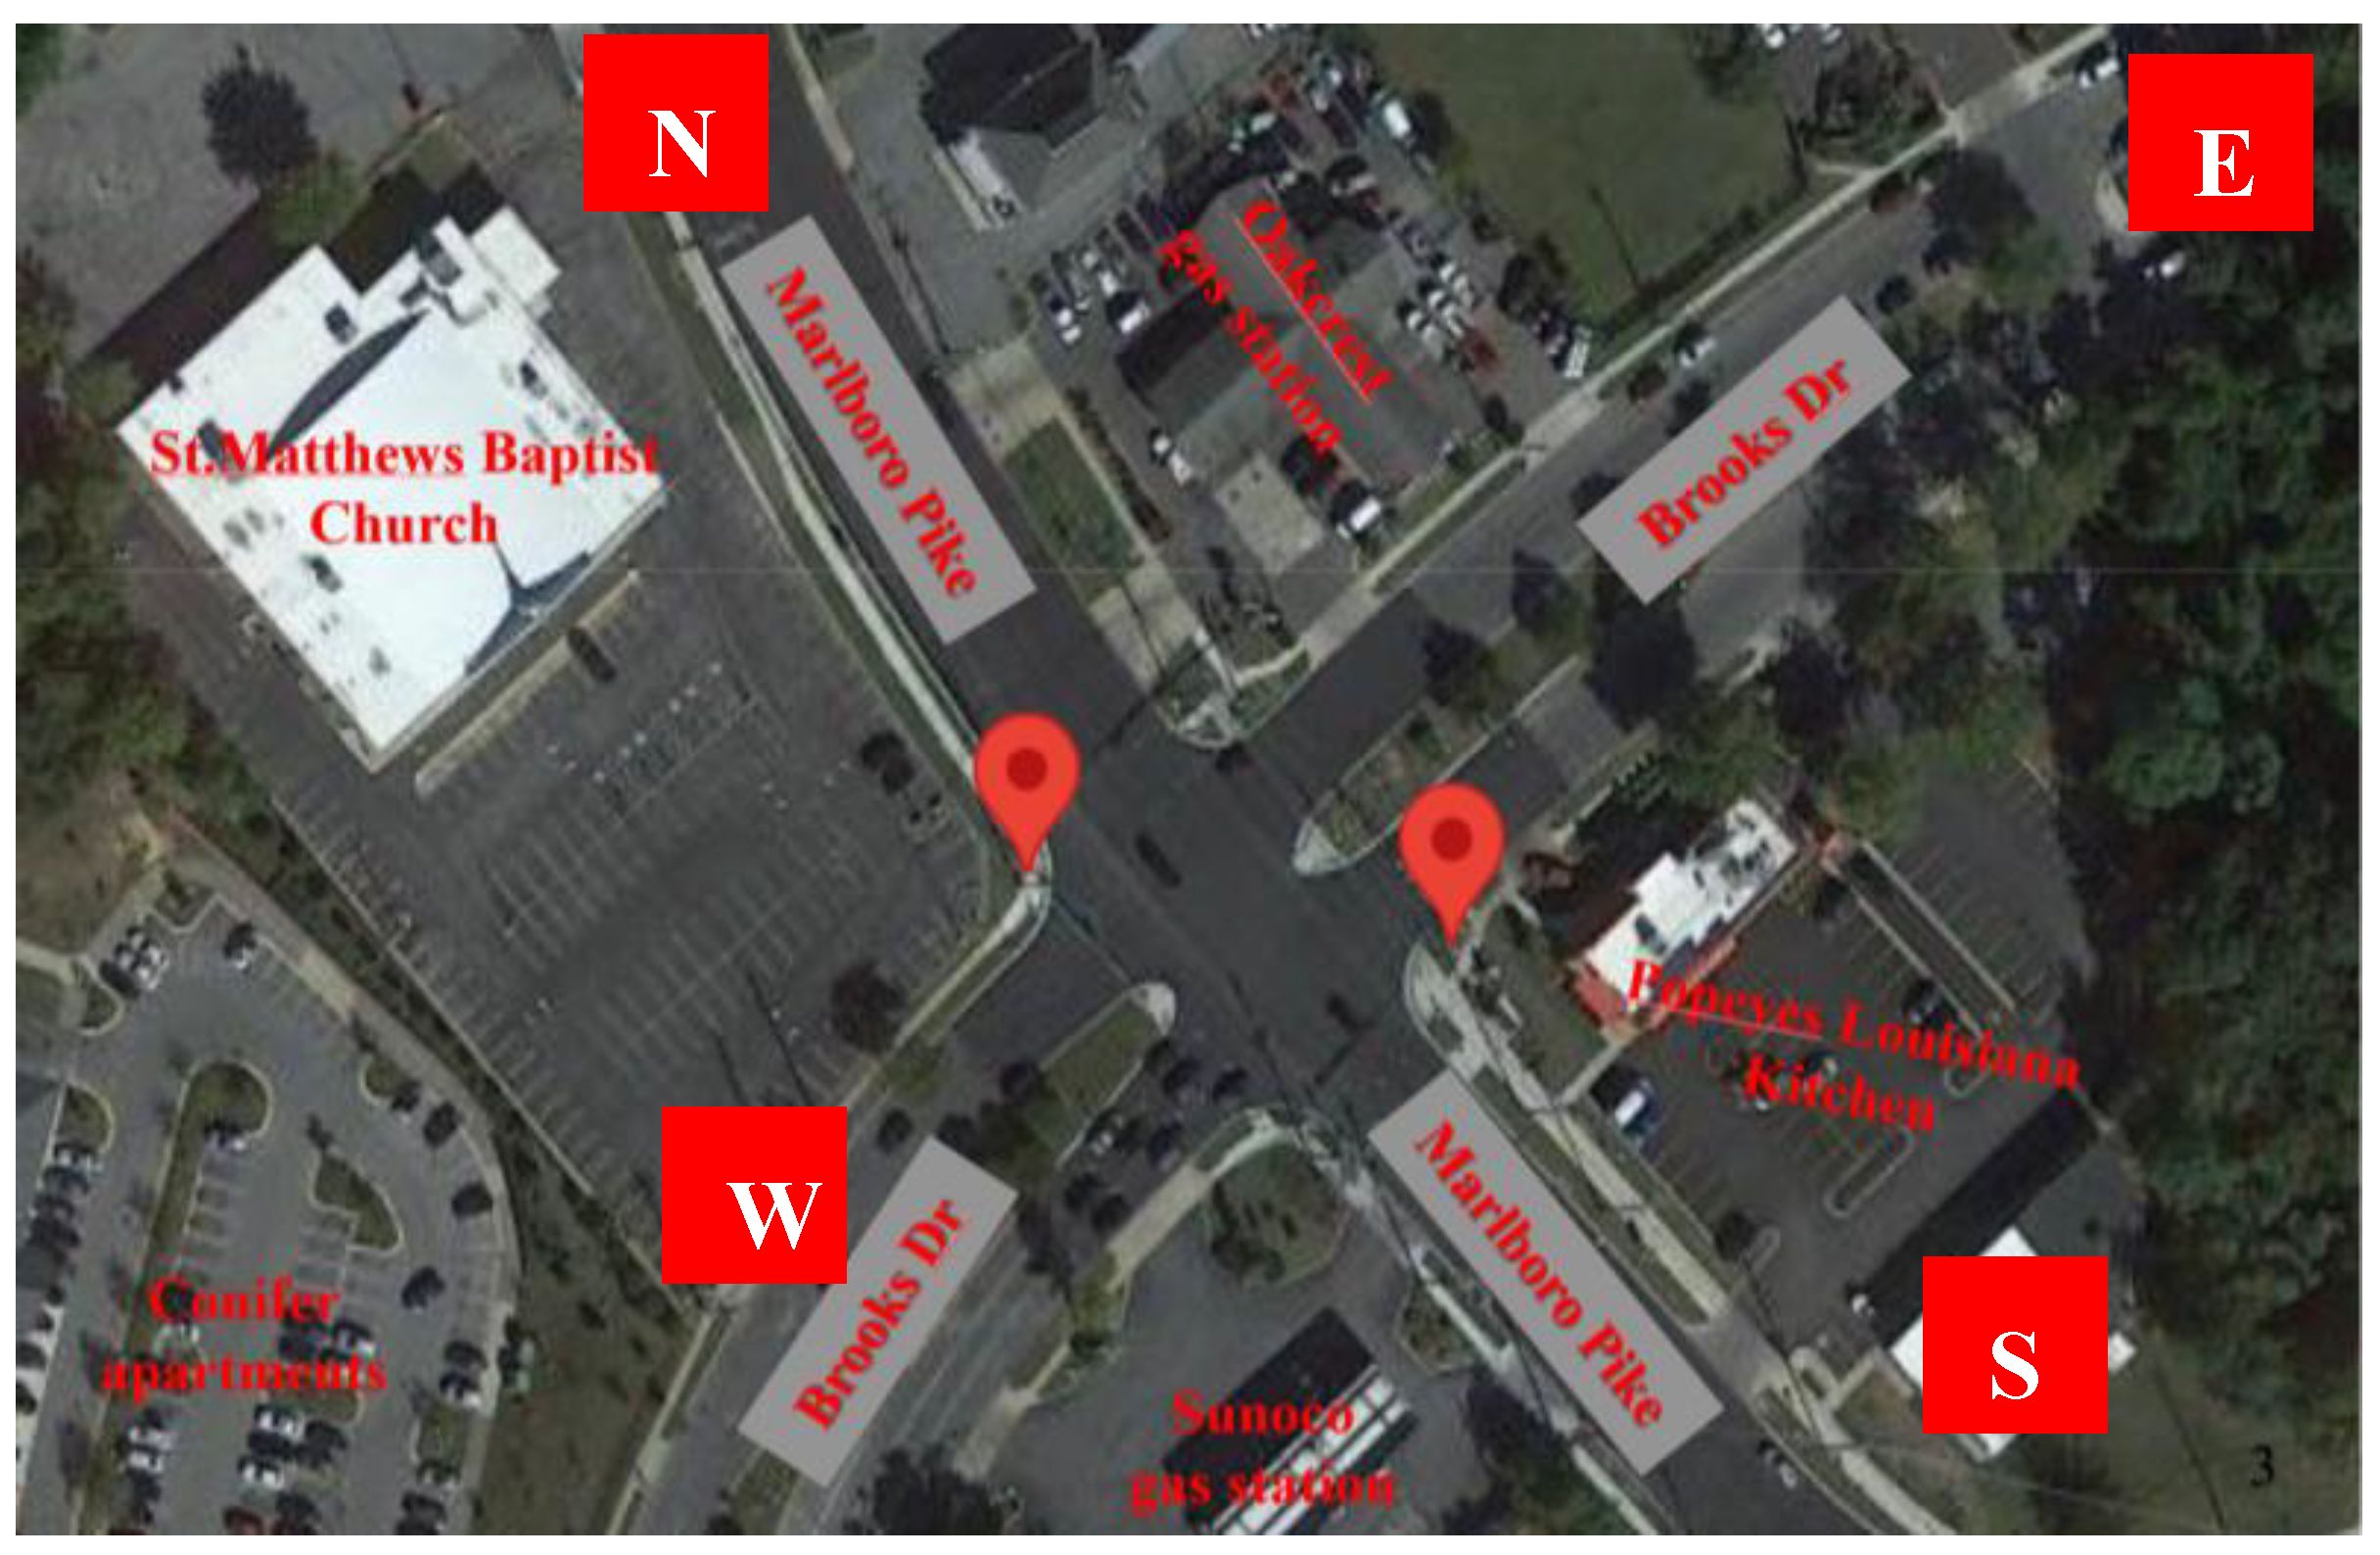
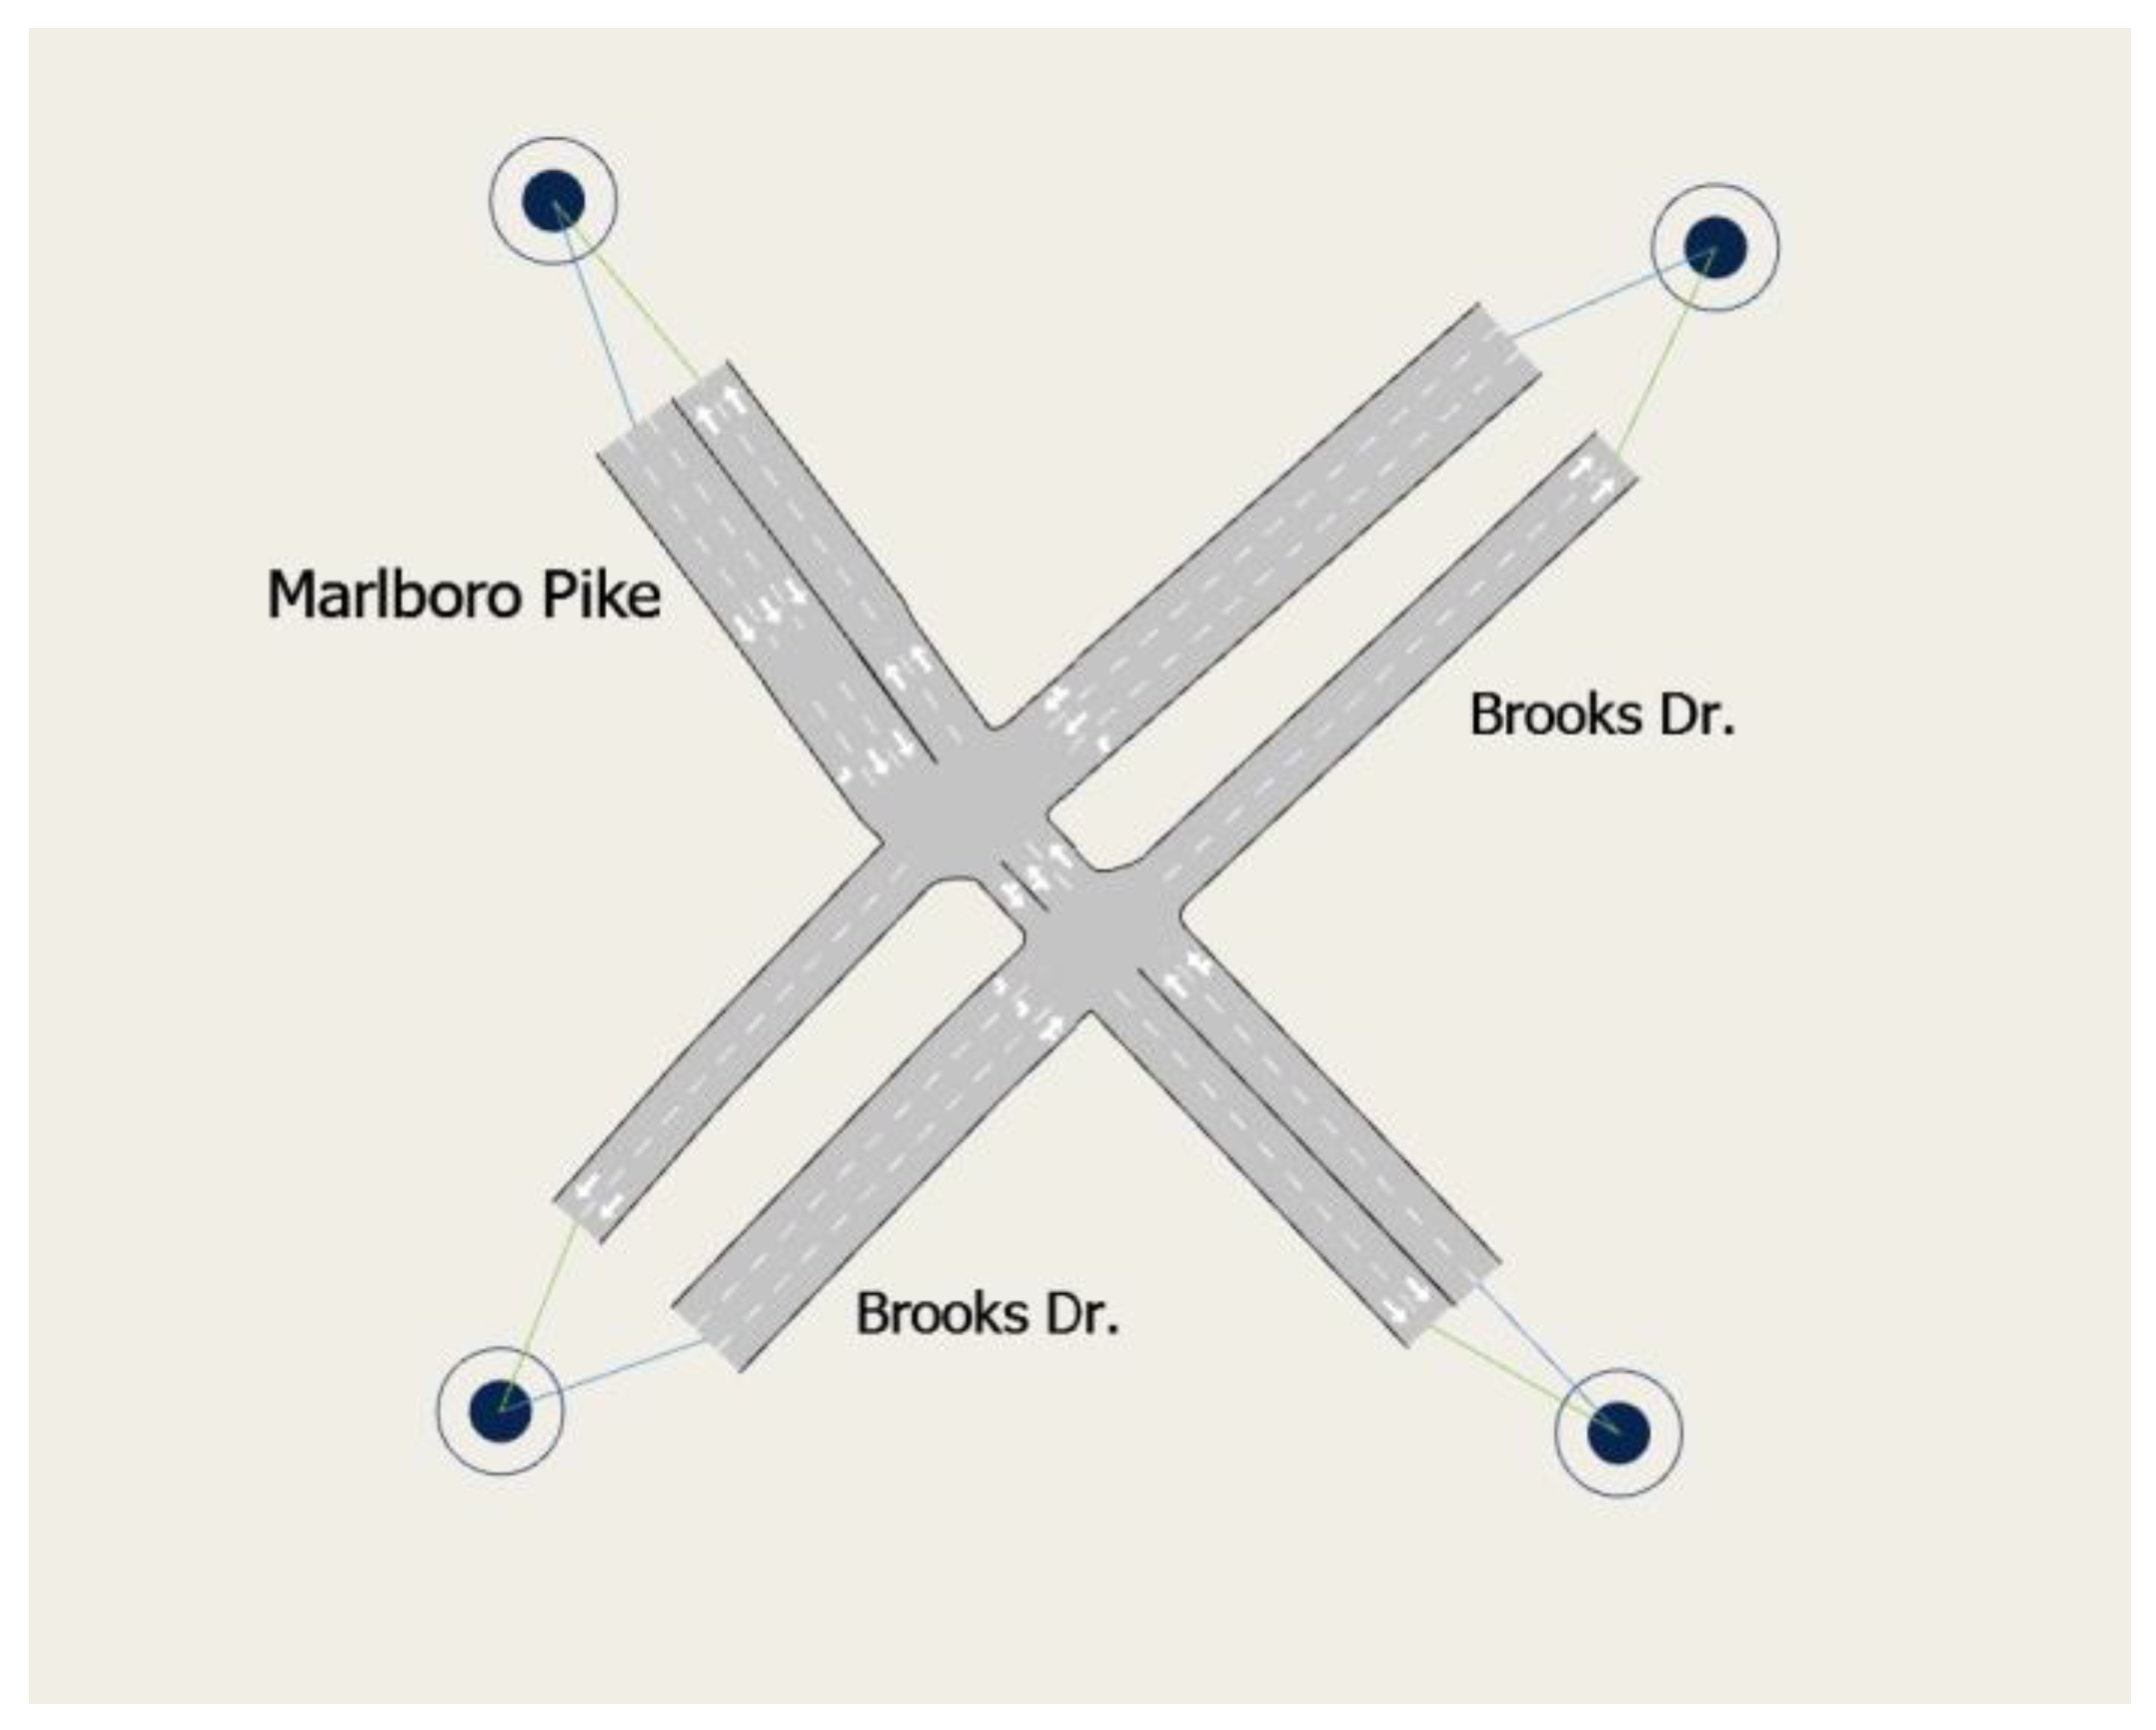
As the case study, the intersection of Marlboro Pike - Brooks Dr. in Coral Hills, MD, USA was selected. This intersection is
located in Prince George's County of Maryland state and it is surrounded by
various commercial land-uses. In order to understand intersection signal timing
conditions, LiDAR data from October 1st to 15th, 2023 was analyzed.
Figure 1
shows the location of the intersection and the main land uses surrounding it. LiDAR sensors are depicted by two red circles.
Figure 1.
Marlboro Pike & Brooks Dr. intersection [
1].
Figure 1.
Marlboro Pike & Brooks Dr. intersection [
1].
During the specified time interval (the first two
weeks of October 2023), the volume of vehicles, pedestrians, and bicyclists was
analyzed. Southbound of the intersection has three lanes (one for SBR, one for
SBT, and one for SBL). The research focuses on the phase #6 of the traffic
signal that controls South Bound Straight Thru (SBT), and South Bound Left Turn
(SBL). Due to the high frequency of yellow and red light runners, as well as
conflict between V2V and V2P, this phase was selected. In order to minimize
vehicle delays and congestion at the intersection, this study attempts to
determine the optimal green allocation based on these two crucial movements.
Table
1 illustrates the vehicle counts (total of NS and NE movements) from
October 1st to 15th.
Table 1.
Hourly Vehicle Volume Collected by the LiDAR Sensor.
Table 1.
Hourly Vehicle Volume Collected by the LiDAR Sensor.
| Hourly Time Interval |
1-Oct |
2-Oct |
3-Oct |
4-Oct |
5-Oct |
6-Oct |
7-Oct |
8-Oct |
9-Oct |
10-Oct |
11-Oct |
12-Oct |
13-Oct |
14-Oct |
15-Oct |
| 00:00 - 01:00 AM |
123 |
68 |
55 |
58 |
66 |
95 |
93 |
100 |
63 |
64 |
68 |
52 |
75 |
103 |
68 |
| 01:00 - 02:00 AM |
114 |
42 |
34 |
31 |
37 |
55 |
80 |
55 |
54 |
35 |
40 |
27 |
48 |
52 |
68 |
| 02:00 - 03:00 AM |
58 |
24 |
27 |
20 |
37 |
37 |
48 |
35 |
37 |
25 |
34 |
18 |
25 |
46 |
26 |
| 03:00 - 04:00 AM |
49 |
31 |
29 |
39 |
32 |
41 |
44 |
37 |
15 |
19 |
25 |
20 |
29 |
47 |
21 |
| 04:00 - 05:00 AM |
43 |
35 |
51 |
35 |
30 |
45 |
23 |
36 |
28 |
32 |
33 |
42 |
45 |
48 |
22 |
| 05:00 - 06:00 AM |
32 |
78 |
70 |
74 |
74 |
84 |
41 |
35 |
47 |
75 |
71 |
63 |
79 |
63 |
49 |
| 06:00 - 07:00 AM |
60 |
93 |
105 |
110 |
112 |
104 |
78 |
54 |
90 |
95 |
113 |
93 |
104 |
50 |
49 |
| 07:00 - 08:00 AM |
106 |
219 |
222 |
218 |
218 |
187 |
145 |
106 |
125 |
228 |
224 |
205 |
182 |
129 |
86 |
| 08:00 - 09:00 AM |
222 |
272 |
261 |
281 |
302 |
300 |
207 |
192 |
205 |
314 |
307 |
331 |
306 |
220 |
181 |
| 09:00 - 10:00 AM |
283 |
287 |
257 |
264 |
319 |
328 |
273 |
292 |
275 |
287 |
304 |
319 |
349 |
276 |
281 |
| 10:00 - 11:00 AM |
377 |
357 |
291 |
295 |
309 |
404 |
262 |
320 |
321 |
259 |
333 |
367 |
385 |
304 |
292 |
| 11:00 - 12:00 AM |
396 |
343 |
352 |
379 |
416 |
408 |
337 |
332 |
349 |
328 |
387 |
300 |
386 |
351 |
363 |
| 12:00 - 13:00 PM |
527 |
395 |
358 |
357 |
354 |
454 |
481 |
475 |
446 |
350 |
396 |
405 |
461 |
309 |
449 |
| 13:00 - 14:00 PM |
525 |
412 |
328 |
446 |
376 |
393 |
497 |
502 |
394 |
408 |
409 |
395 |
358 |
325 |
460 |
| 14:00 - 15:00 PM |
452 |
466 |
416 |
446 |
493 |
432 |
411 |
464 |
466 |
465 |
376 |
425 |
490 |
397 |
437 |
| 15:00 - 16:00 PM |
414 |
426 |
504 |
448 |
524 |
564 |
392 |
375 |
464 |
451 |
543 |
435 |
498 |
336 |
396 |
| 16:00 - 17:00 PM |
393 |
565 |
561 |
598 |
572 |
568 |
462 |
447 |
437 |
589 |
617 |
564 |
542 |
413 |
396 |
| 17:00 - 18:00 PM |
424 |
633 |
608 |
606 |
646 |
566 |
500 |
343 |
460 |
627 |
603 |
629 |
595 |
377 |
352 |
| 18:00 - 19:00 PM |
326 |
494 |
626 |
627 |
582 |
439 |
476 |
326 |
432 |
481 |
539 |
572 |
502 |
297 |
334 |
| 19:00 - 20:00 PM |
343 |
367 |
421 |
390 |
336 |
355 |
381 |
251 |
317 |
366 |
363 |
408 |
461 |
283 |
304 |
| 20:00 - 21:00 PM |
248 |
225 |
307 |
338 |
308 |
334 |
266 |
223 |
266 |
269 |
281 |
289 |
356 |
193 |
248 |
| 21:00 - 22:00 PM |
178 |
187 |
211 |
228 |
173 |
280 |
200 |
143 |
174 |
153 |
178 |
220 |
271 |
132 |
123 |
| 22:00 - 23:00 PM |
126 |
130 |
128 |
145 |
150 |
227 |
186 |
106 |
129 |
121 |
156 |
176 |
230 |
161 |
125 |
| 23:00 - 24:00 PM |
89 |
100 |
112 |
104 |
108 |
162 |
145 |
94 |
70 |
91 |
103 |
103 |
162 |
139 |
90 |
| ADT* |
246 |
260 |
264 |
272 |
274 |
286 |
251 |
223 |
236 |
256 |
271 |
269 |
289 |
210 |
218 |
Between October 1st and 15th, the number of pedestrians passing from the southbound direction is shown in
Table 2.
Table 2.
Hourly Pedestrian Volume Collected by the LiDAR Sensor.
Table 2.
Hourly Pedestrian Volume Collected by the LiDAR Sensor.
| Hourly Time Interval |
1-Oct |
2-Oct |
3-Oct |
4-Oct |
5-Oct |
6-Oct |
7-Oct |
8-Oct |
9-Oct |
10-Oct |
11-Oct |
12-Oct |
13-Oct |
14-Oct |
15-Oct |
| 00:00 - 01:00 AM |
1 |
1 |
0 |
2 |
0 |
0 |
2 |
3 |
1 |
1 |
0 |
3 |
0 |
0 |
0 |
| 01:00 - 02:00 AM |
0 |
1 |
0 |
1 |
0 |
1 |
2 |
0 |
1 |
0 |
0 |
0 |
0 |
0 |
1 |
| 02:00 - 03:00 AM |
0 |
0 |
0 |
0 |
1 |
0 |
0 |
0 |
2 |
1 |
1 |
0 |
0 |
0 |
0 |
| 03:00 - 04:00 AM |
0 |
0 |
0 |
3 |
0 |
0 |
1 |
0 |
0 |
0 |
0 |
0 |
0 |
0 |
0 |
| 04:00 - 05:00 AM |
0 |
1 |
1 |
0 |
2 |
3 |
1 |
0 |
3 |
3 |
3 |
1 |
1 |
0 |
0 |
| 05:00 - 06:00 AM |
1 |
2 |
2 |
2 |
0 |
1 |
0 |
0 |
1 |
0 |
0 |
2 |
2 |
0 |
0 |
| 06:00 - 07:00 AM |
0 |
4 |
0 |
4 |
4 |
4 |
1 |
1 |
2 |
3 |
5 |
3 |
2 |
0 |
0 |
| 07:00 - 08:00 AM |
0 |
7 |
5 |
3 |
3 |
2 |
0 |
2 |
0 |
4 |
7 |
5 |
2 |
1 |
4 |
| 08:00 - 09:00 AM |
3 |
11 |
11 |
7 |
4 |
7 |
5 |
2 |
2 |
10 |
7 |
5 |
4 |
2 |
0 |
| 09:00 - 10:00 AM |
8 |
9 |
6 |
7 |
3 |
2 |
1 |
4 |
5 |
7 |
4 |
7 |
6 |
1 |
6 |
| 10:00 - 11:00 AM |
4 |
10 |
0 |
4 |
5 |
8 |
4 |
5 |
3 |
6 |
4 |
3 |
10 |
2 |
6 |
| 11:00 - 12:00 AM |
5 |
5 |
8 |
3 |
6 |
1 |
5 |
4 |
5 |
7 |
8 |
2 |
9 |
3 |
4 |
| 12:00 - 13:00 PM |
6 |
9 |
8 |
2 |
6 |
10 |
10 |
4 |
8 |
6 |
4 |
4 |
3 |
2 |
8 |
| 13:00 - 14:00 PM |
4 |
12 |
1 |
4 |
3 |
5 |
6 |
11 |
8 |
9 |
2 |
4 |
3 |
5 |
5 |
| 14:00 - 15:00 PM |
11 |
10 |
6 |
5 |
6 |
9 |
7 |
5 |
12 |
0 |
3 |
6 |
10 |
3 |
6 |
| 15:00 - 16:00 PM |
5 |
9 |
9 |
13 |
10 |
5 |
8 |
10 |
11 |
8 |
2 |
4 |
5 |
1 |
3 |
| 16:00 - 17:00 PM |
4 |
8 |
5 |
9 |
5 |
5 |
11 |
3 |
7 |
5 |
9 |
5 |
8 |
6 |
3 |
| 17:00 - 18:00 PM |
13 |
8 |
13 |
5 |
8 |
13 |
4 |
6 |
13 |
7 |
7 |
8 |
1 |
7 |
5 |
| 18:00 - 19:00 PM |
14 |
7 |
4 |
9 |
17 |
7 |
4 |
8 |
5 |
8 |
9 |
14 |
7 |
1 |
9 |
| 19:00 - 20:00 PM |
8 |
10 |
8 |
7 |
9 |
7 |
9 |
2 |
6 |
7 |
9 |
1 |
9 |
6 |
12 |
| 20:00 - 21:00 PM |
3 |
4 |
9 |
6 |
3 |
9 |
6 |
6 |
1 |
3 |
6 |
5 |
4 |
4 |
2 |
| 21:00 - 22:00 PM |
0 |
1 |
3 |
4 |
8 |
5 |
7 |
0 |
11 |
3 |
0 |
11 |
6 |
2 |
2 |
| 22:00 - 23:00 PM |
5 |
0 |
0 |
2 |
0 |
3 |
6 |
0 |
8 |
2 |
4 |
5 |
12 |
5 |
0 |
| 23:00 - 24:00 PM |
2 |
0 |
2 |
7 |
1 |
3 |
1 |
3 |
3 |
0 |
3 |
1 |
4 |
0 |
0 |
| ADT |
4 |
5 |
4 |
5 |
4 |
5 |
4 |
3 |
5 |
4 |
4 |
4 |
5 |
2 |
3 |
Between October 1st and 15th,
Table 3 shows the number of bicyclists passing from the southbound direction hourly.
Table 3.
Hourly Bicyclist Volume Collected by the LiDAR Sensor.
Table 3.
Hourly Bicyclist Volume Collected by the LiDAR Sensor.
| Hourly Time Interval |
1-Oct |
2-Oct |
3-Oct |
4-Oct |
5-Oct |
6-Oct |
7-Oct |
8-Oct |
9-Oct |
10-Oct |
11-Oct |
12-Oct |
13-Oct |
14-Oct |
15-Oct |
| 00:00 - 01:00 AM |
0 |
0 |
0 |
0 |
4 |
3 |
0 |
0 |
0 |
0 |
0 |
0 |
0 |
0 |
0 |
| 01:00 - 02:00 AM |
0 |
0 |
0 |
0 |
0 |
0 |
0 |
0 |
0 |
1 |
0 |
0 |
0 |
0 |
0 |
| 02:00 - 03:00 AM |
5 |
1 |
0 |
0 |
0 |
0 |
1 |
0 |
0 |
0 |
0 |
0 |
0 |
0 |
0 |
| 03:00 - 04:00 AM |
0 |
0 |
0 |
0 |
0 |
0 |
0 |
0 |
0 |
0 |
0 |
0 |
0 |
0 |
0 |
| 04:00 - 05:00 AM |
3 |
0 |
1 |
0 |
0 |
0 |
0 |
0 |
0 |
0 |
0 |
0 |
0 |
0 |
0 |
| 05:00 - 06:00 AM |
0 |
1 |
0 |
0 |
1 |
0 |
0 |
0 |
1 |
0 |
0 |
0 |
0 |
1 |
0 |
| 06:00 - 07:00 AM |
0 |
0 |
0 |
0 |
0 |
0 |
0 |
0 |
0 |
0 |
0 |
3 |
0 |
0 |
0 |
| 07:00 - 08:00 AM |
0 |
0 |
1 |
0 |
1 |
0 |
0 |
0 |
0 |
0 |
0 |
2 |
1 |
0 |
0 |
| 08:00 - 09:00 AM |
0 |
0 |
2 |
1 |
1 |
0 |
0 |
0 |
0 |
1 |
0 |
0 |
0 |
0 |
1 |
| 09:00 - 10:00 AM |
1 |
1 |
0 |
4 |
2 |
1 |
0 |
0 |
0 |
1 |
0 |
0 |
2 |
0 |
0 |
| 10:00 - 11:00 AM |
0 |
0 |
1 |
1 |
2 |
2 |
0 |
1 |
1 |
1 |
1 |
0 |
2 |
0 |
0 |
| 11:00 - 12:00 AM |
1 |
1 |
1 |
1 |
0 |
0 |
1 |
0 |
0 |
1 |
1 |
0 |
3 |
1 |
1 |
| 12:00 - 13:00 PM |
0 |
0 |
0 |
0 |
0 |
0 |
1 |
0 |
1 |
0 |
0 |
1 |
1 |
1 |
0 |
| 13:00 - 14:00 PM |
2 |
0 |
0 |
1 |
0 |
0 |
0 |
1 |
0 |
1 |
2 |
0 |
1 |
0 |
1 |
| 14:00 - 15:00 PM |
0 |
0 |
0 |
1 |
0 |
0 |
0 |
1 |
0 |
0 |
4 |
1 |
1 |
1 |
1 |
| 15:00 - 16:00 PM |
0 |
1 |
1 |
2 |
1 |
2 |
3 |
1 |
1 |
1 |
2 |
0 |
1 |
4 |
0 |
| 16:00 - 17:00 PM |
2 |
1 |
0 |
1 |
0 |
1 |
0 |
3 |
2 |
1 |
0 |
2 |
1 |
0 |
0 |
| 17:00 - 18:00 PM |
2 |
2 |
1 |
3 |
2 |
0 |
3 |
0 |
2 |
0 |
1 |
5 |
2 |
0 |
2 |
| 18:00 - 19:00 PM |
0 |
2 |
2 |
0 |
2 |
1 |
4 |
0 |
0 |
0 |
0 |
1 |
0 |
0 |
0 |
| 19:00 - 20:00 PM |
2 |
0 |
1 |
1 |
0 |
3 |
3 |
2 |
1 |
2 |
0 |
0 |
0 |
0 |
0 |
| 20:00 - 21:00 PM |
1 |
0 |
10 |
2 |
2 |
1 |
0 |
2 |
1 |
2 |
0 |
1 |
4 |
0 |
1 |
| 21:00 - 22:00 PM |
1 |
0 |
3 |
2 |
1 |
0 |
0 |
0 |
3 |
1 |
0 |
0 |
1 |
0 |
0 |
| 22:00 - 23:00 PM |
2 |
0 |
0 |
0 |
0 |
1 |
0 |
1 |
0 |
0 |
0 |
0 |
2 |
0 |
0 |
| 23:00 - 24:00 PM |
0 |
0 |
1 |
0 |
2 |
0 |
4 |
0 |
0 |
0 |
0 |
2 |
0 |
0 |
0 |
| ADT |
1 |
0 |
1 |
1 |
1 |
1 |
1 |
1 |
1 |
1 |
0 |
1 |
1 |
0 |
0 |
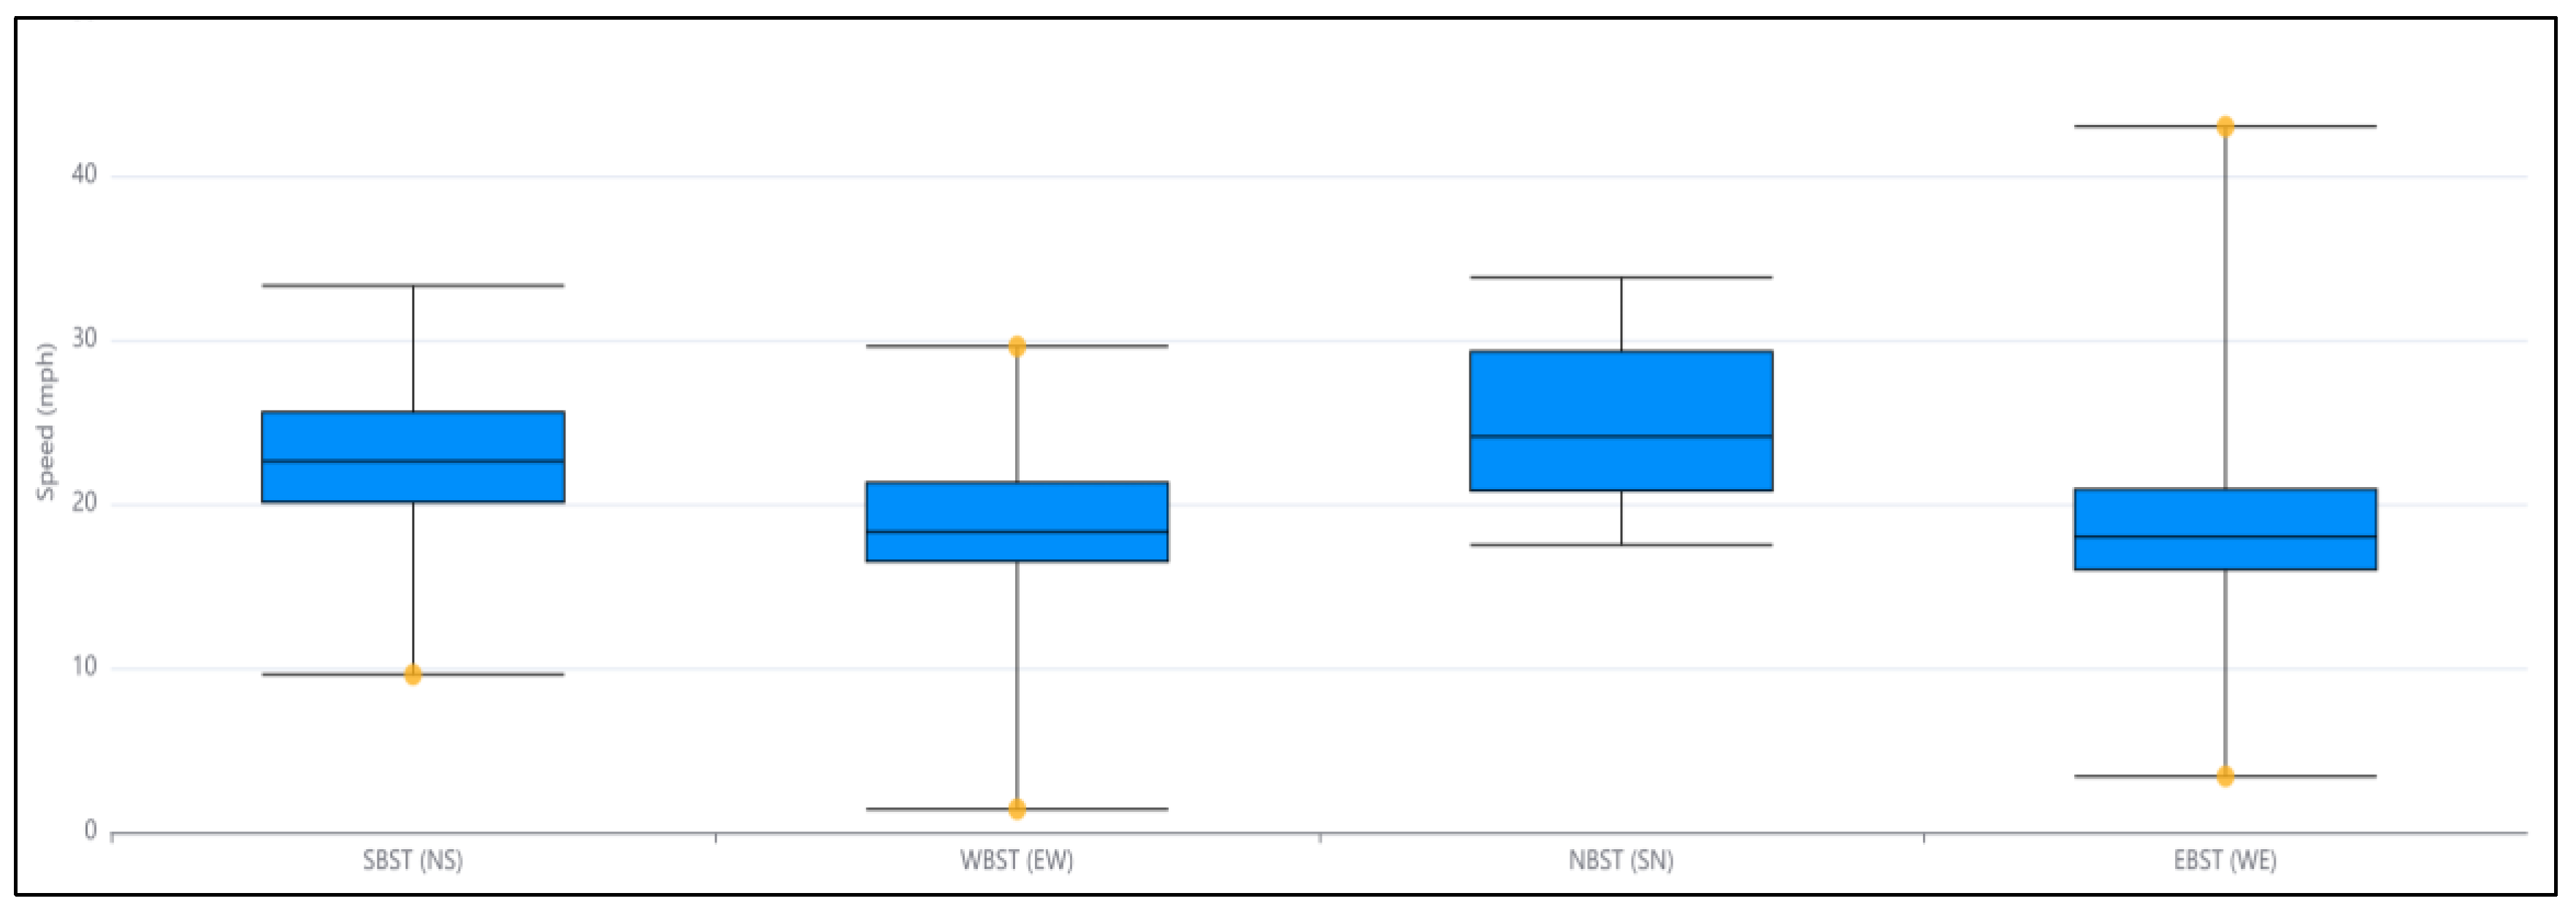
Figure 2 shows the changes in speed at the intersection's different approaches.
Figure 2.
Speed Changes In Different Intersection's Approaches - From October 1st to 15th.
Figure 2.
Speed Changes In Different Intersection's Approaches - From October 1st to 15th.
LiDAR sensors collect 22.6 mile/h, 18.3 mile/h, 24.1 mile/h, and 18 mile/h as the average speeds for NS (SBT), EW (WBT), SN (NBT), and WE (EBT) movements. According to the speed diagram (Figure 2), north-south approaches to the intersection have higher diurnal speeds.
3. Smart Green Time Allocation
Smart Green Time Allocation (SGTA) is a dynamic traffic signal control strategy that adapts green time allocations in response to real-time traffic conditions. SGTA relies on data from various sensors, including LiDAR, to make informed decisions and optimize signal timings for improved traffic flow. Traditional signal control strategies often rely on fixed-time plans, which are not adaptive to fluctuating traffic conditions [
9,
10,
12]. The advantages of implementing SGTA at a signalized intersection equipped with LiDAR sensors are multi-fold including:
- 1)
Improved Traffic Flow: SGTA dynamically adjusts green time allocations, ensuring that traffic moves smoothly, reducing delays, and optimizing vehicle progression through the intersection.
- 2)
Reduced Congestion: Queue lengths during peak hours are significantly reduced as SGTA efficiently manages signal timings, reducing stop-and-go traffic patterns and associated congestion.
- 3)
Enhanced Safety: SGTA reduces the likelihood of crashes and conflicts at the intersection by optimizing signal timings and reducing the chances of rear-end collisions.
- 4)
Environmental Impact: By minimizing congestion and keeping traffic moving efficiently, SGTA leads to reduced fuel consumption, emissions, and improved air quality.
SGTA relies on processed LiDAR data to make real-time decisions about signal timing. The system assesses the current traffic conditions, identifying congestion, queues, and traffic patterns. Based on this assessment, SGTA dynamically adjusts green time allocations for different phases of the intersection, optimizing traffic flow. SGTA interacts with the traffic signal control system to implement the adjusted green time allocations. This integration ensures that the signals respond promptly to the changing traffic conditions, allowing for smoother traffic flow and reduced congestion. The advantages of SGTA with LiDAR sensors are numerous. It offers dynamic and real-time signal control, reducing delays and improving traffic flow. It also minimizes congestion and lowers the likelihood of traffic crashes. However, challenges such as data processing complexities, sensor maintenance, and cost considerations should not be overlooked. Considering the previous author’s study [
1], and after monitoring the intersection's southbound movements accurately from October 1st to 15th, the hourly GTA (green time allocation) was identified for phase #6. The optimal green time allocation for phase #6 can be seen in
Table 4.
Table 4.
Optimal Green Time Allocation (sec) for Phase #6.
Table 4.
Optimal Green Time Allocation (sec) for Phase #6.
| Hourly Time |
1-Oct |
2-Oct |
3-Oct |
4-Oct |
5-Oct |
6-Oct |
7-Oct |
8-Oct |
9-Oct |
10-Oct |
11-Oct |
12-Oct |
13-Oct |
14-Oct |
15-Oct |
| 00:00 - 01:00 AM |
34.5 |
31.3 |
32.6 |
32.5 |
32.6 |
31.9 |
33.0 |
34.3 |
33.1 |
32.9 |
34.3 |
32.6 |
32.1 |
32.3 |
31.3 |
| 01:00 - 02:00 AM |
32.7 |
27.8 |
29.5 |
26.2 |
28.5 |
29.6 |
30.6 |
32.8 |
31.8 |
28.2 |
28.3 |
32.1 |
27.9 |
31.6 |
32.3 |
| 02:00 - 03:00 AM |
31.0 |
24.2 |
23.7 |
23.9 |
26.1 |
24.4 |
29.6 |
31.1 |
26.2 |
23.3 |
23.2 |
24.3 |
24.5 |
29.0 |
30.7 |
| 03:00 - 04:00 AM |
28.9 |
22.6 |
23.2 |
22.9 |
22.6 |
23.1 |
27.5 |
28.9 |
25.6 |
22.5 |
22.9 |
22.5 |
23.8 |
28.8 |
28.1 |
| 04:00 - 05:00 AM |
26.6 |
24.1 |
23.5 |
24.8 |
25.0 |
24.8 |
27.4 |
31.3 |
25.8 |
24.1 |
24.3 |
24.4 |
24.2 |
27.2 |
25.7 |
| 05:00 - 06:00 AM |
24.9 |
25.4 |
24.6 |
25.4 |
25.6 |
25.7 |
27.1 |
25.4 |
26.1 |
24.6 |
25.4 |
23.4 |
25.8 |
27.2 |
25.8 |
| 06:00 - 07:00 AM |
24.9 |
25.7 |
25.6 |
28.4 |
26.3 |
27.4 |
27.9 |
25.8 |
25.7 |
26.1 |
26.9 |
26.5 |
25.6 |
25.9 |
26.7 |
| 07:00 - 08:00 AM |
26.5 |
25.5 |
27.0 |
25.7 |
29.5 |
26.9 |
28.0 |
27.2 |
26.2 |
26.2 |
26.5 |
27.0 |
26.4 |
27.3 |
27.0 |
| 08:00 - 09:00 AM |
28.4 |
26.6 |
25.5 |
25.3 |
27.2 |
28.1 |
27.3 |
28.1 |
26.3 |
27.3 |
26.4 |
26.1 |
26.6 |
27.4 |
26.9 |
| 09:00 - 10:00 AM |
28.2 |
26.6 |
25.9 |
25.7 |
26.5 |
26.0 |
26.9 |
27.4 |
25.5 |
28.3 |
26.1 |
26.6 |
25.9 |
26.9 |
27.5 |
| 10:00 - 11:00 AM |
27.8 |
26.8 |
28.1 |
28.2 |
27.7 |
27.0 |
27.7 |
28.3 |
26.5 |
26.9 |
26.6 |
27.7 |
27.8 |
27.0 |
26.0 |
| 11:00 - 12:00 AM |
26.5 |
28.3 |
28.6 |
27.4 |
28.9 |
27.8 |
27.2 |
27.2 |
27.6 |
26.7 |
27.8 |
27.1 |
29.4 |
26.3 |
26.1 |
| 12:00 - 13:00 PM |
27.6 |
29.1 |
29.4 |
29.8 |
30.5 |
28.9 |
27.5 |
26.6 |
27.4 |
28.9 |
29.0 |
29.1 |
29.9 |
26.9 |
26.4 |
| 13:00 - 14:00 PM |
27.1 |
29.9 |
29.9 |
30.5 |
30.4 |
29.2 |
27.4 |
26.6 |
27.1 |
30.5 |
29.2 |
29.3 |
28.9 |
26.2 |
25.8 |
| 14:00 - 15:00 PM |
24.7 |
27.5 |
29.2 |
29.6 |
28.6 |
28.3 |
27.4 |
26.6 |
26.2 |
28.2 |
27.3 |
29.9 |
30.4 |
26.3 |
26.0 |
| 15:00 - 16:00 PM |
26.1 |
26.0 |
26.6 |
25.6 |
26.5 |
26.8 |
26.1 |
24.5 |
27.1 |
25.8 |
26.2 |
26.7 |
27.2 |
27.3 |
27.4 |
| 16:00 - 17:00 PM |
25.6 |
25.6 |
26.0 |
25.6 |
27.1 |
25.2 |
25.7 |
26.2 |
25.5 |
25.8 |
25.8 |
26.0 |
25.3 |
25.6 |
26.0 |
| 17:00 - 18:00 PM |
25.7 |
24.9 |
24.9 |
26.2 |
25.5 |
24.6 |
24.6 |
26.3 |
27.3 |
25.5 |
21.4 |
24.7 |
26.1 |
24.7 |
26.2 |
| 18:00 - 19:00 PM |
26.8 |
28.3 |
27.4 |
26.2 |
26.7 |
25.2 |
26.0 |
27.3 |
28.1 |
26.7 |
26.0 |
25.9 |
26.2 |
26.7 |
27.9 |
| 19:00 - 20:00 PM |
29.6 |
29.4 |
28.2 |
27.9 |
27.4 |
26.6 |
27.6 |
29.1 |
30.2 |
28.7 |
30.7 |
29.0 |
26.7 |
31.6 |
29.4 |
| 20:00 - 21:00 PM |
31.7 |
32.4 |
31.7 |
31.5 |
30.6 |
28.2 |
30.4 |
29.0 |
30.6 |
33.0 |
31.8 |
30.3 |
29.3 |
28.3 |
31.2 |
| 21:00 - 22:00 PM |
33.6 |
34.3 |
33.4 |
33.5 |
32.2 |
31.7 |
31.5 |
33.9 |
32.7 |
34.0 |
32.2 |
33.3 |
31.6 |
32.4 |
33.5 |
| 22:00 - 23:00 PM |
34.1 |
33.4 |
33.7 |
34.1 |
33.4 |
31.3 |
31.5 |
34.0 |
34.7 |
33.7 |
34.3 |
34.6 |
31.7 |
30.2 |
35.1 |
| 23:00 - 24:00 PM |
35.1 |
34.8 |
34.2 |
34.5 |
34.1 |
32.6 |
33.4 |
34.9 |
35.2 |
34.9 |
35.9 |
34.4 |
32.6 |
33.1 |
34.0 |
| Daily Average Green Time |
28.7 |
27.9 |
28.0 |
28.0 |
28.3 |
27.5 |
28.3 |
28.9 |
28.3 |
28.0 |
27.8 |
28.1 |
27.7 |
28.2 |
28.5 |
As shown in
Table 4, the optimal GTA was determined based on the total number of cycles per hour, and the average optimal GTA was calculated for all cycles. Basically, green time allocation at signalized intersections involves a dynamic allocation of time to different traffic movements (e.g., northbound, eastbound, left turns, through movements) during a signal cycle. The specific equations used for green time allocation can vary depending on the control strategy and software used. Green time allocation equations might also include constraints, such as minimum and maximum green time limits for each movement, coordination with adjacent intersections, and phase sequence constraints [
14,
15,
16]. The specific mathematical model used for green time allocation can vary widely, and more advanced traffic signal control systems often utilize complex optimization algorithms, including linear programming, genetic algorithms, and simulation-based optimization.
It is important to note that while these are simplified representations of the equations involved in green time allocation, real-world traffic signal control systems can be highly complex and use advanced algorithms to optimize signal timing based on real-time data and specific objectives [
16,
17]. These systems often use proprietary equations and are developed based on the specific intersection requirements and control strategy. In order to assign optimal green time allocation to signalized intersections, the following equations are presented.
1. Traffic Flow and Demand (Q):
Q_ij: Traffic demand for movement i at phase j. This can be estimated as the number of vehicles per unit of time (e.g., vehicles per hour).
2. Cycle Length (C):
C: The total duration of a signal cycle in seconds. There is usually a fixed value for this, but it can be adjusted.
3. Green Time Allocation (GT_ij):
GT_ij: The green time allocated to movement i at phase j during one cycle.
4. Percentage Split (PS_ij):
PS_ij: The percentage of green time allocated to movement i at phase j relative to the total green time during the cycle. It is calculated as shown in
Equation (1):
5. Optimization Objectives:
The specific equations for green time allocation can vary depending on the optimization objectives. Common objectives include:
a. Maximizing Throughput (Capacity): Maximize the number of vehicles that can pass through the intersection during the cycle. This can be expressed as shown in
Equation (2):
b. Minimizing Delay: Minimize the total delay experienced by vehicles at the intersection. In delay equations, the number of vehicles in the queue and the time they spend waiting can be taken into account as shown in
Equation (3):
Where:
QL_ij: Queue length for movement i at phase j
L_ij: Average vehicle length
c. Minimizing Stops: Minimize the number of vehicle stops at the intersection. The equation could include the number of stops for each movement as can be seen in
Equation (4):
Where:
Stops_ij: Number of stops for movement i at phase j
d. Minimizing Environmental Impact: Minimize emissions and fuel consumption, which can be related to the delay and queue length for each movement as can be seen in
Equation (5).
Where:
Emissions_ij: Emissions associated with movement i at phase j
4. Data Analysis Results
To investigate the optimal green time allocation from LiDAR sensors at the intersection of Marlboro Pike and Brooks Dr. in Coral Hills, MD, USA (
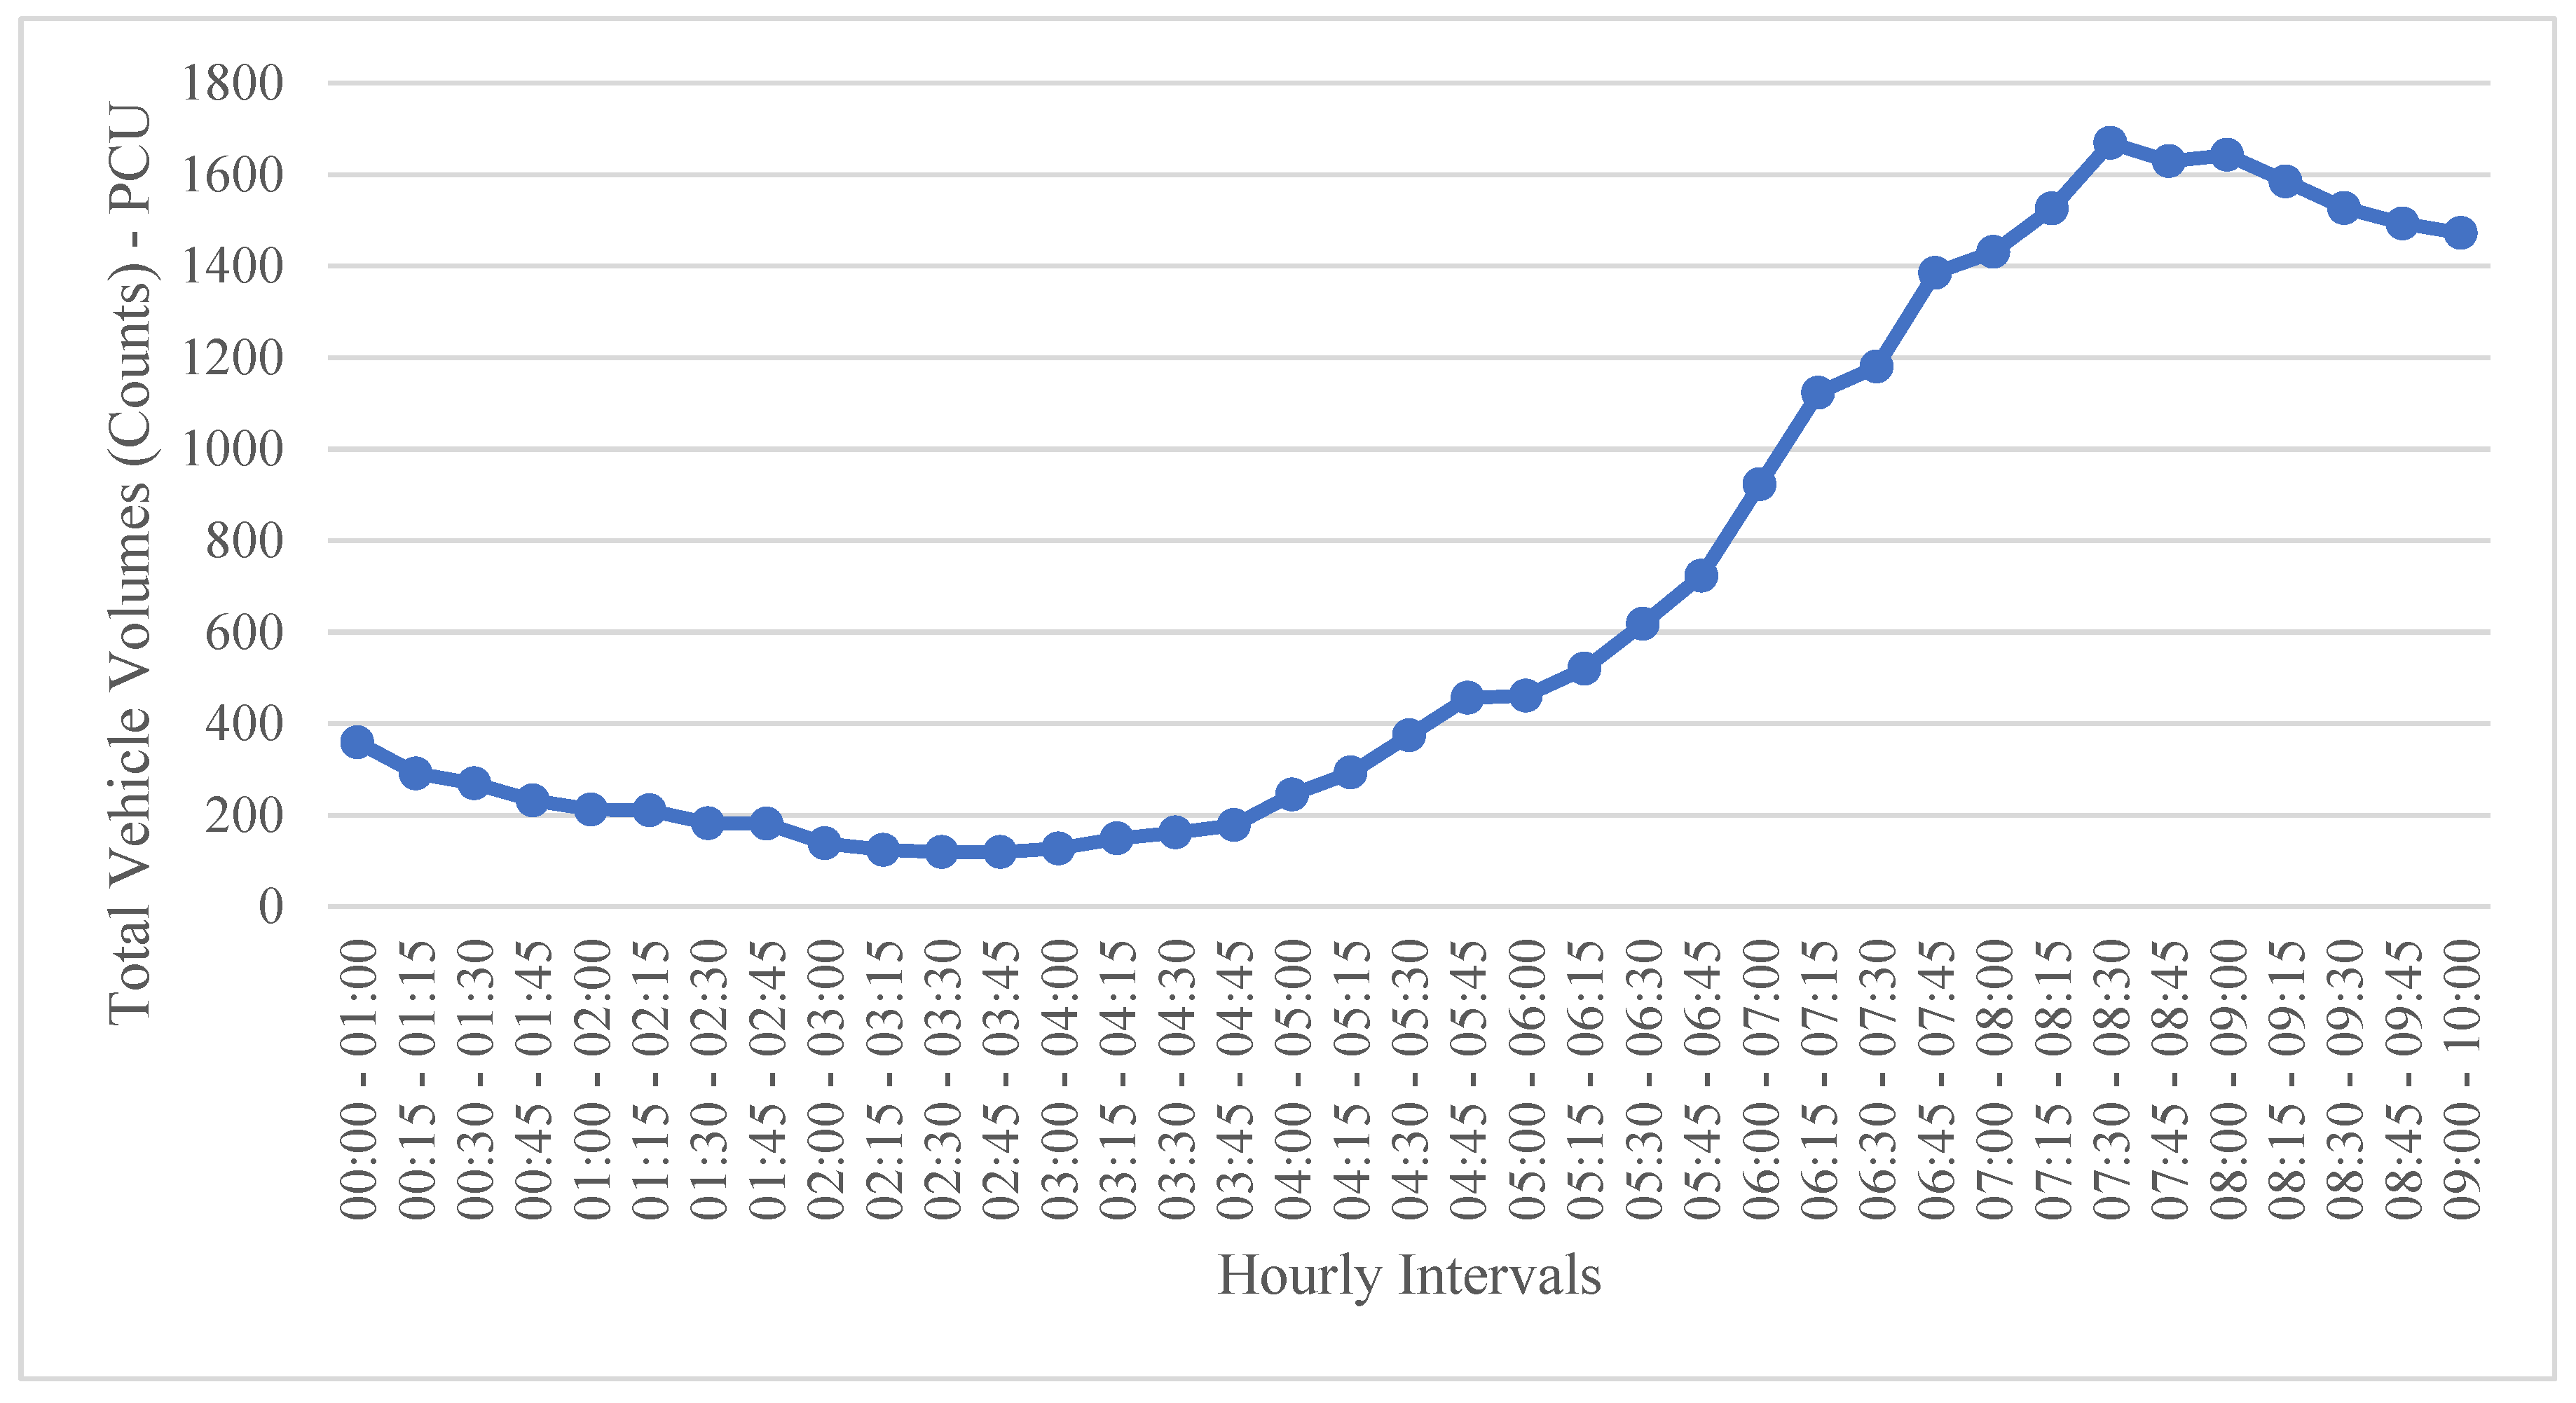
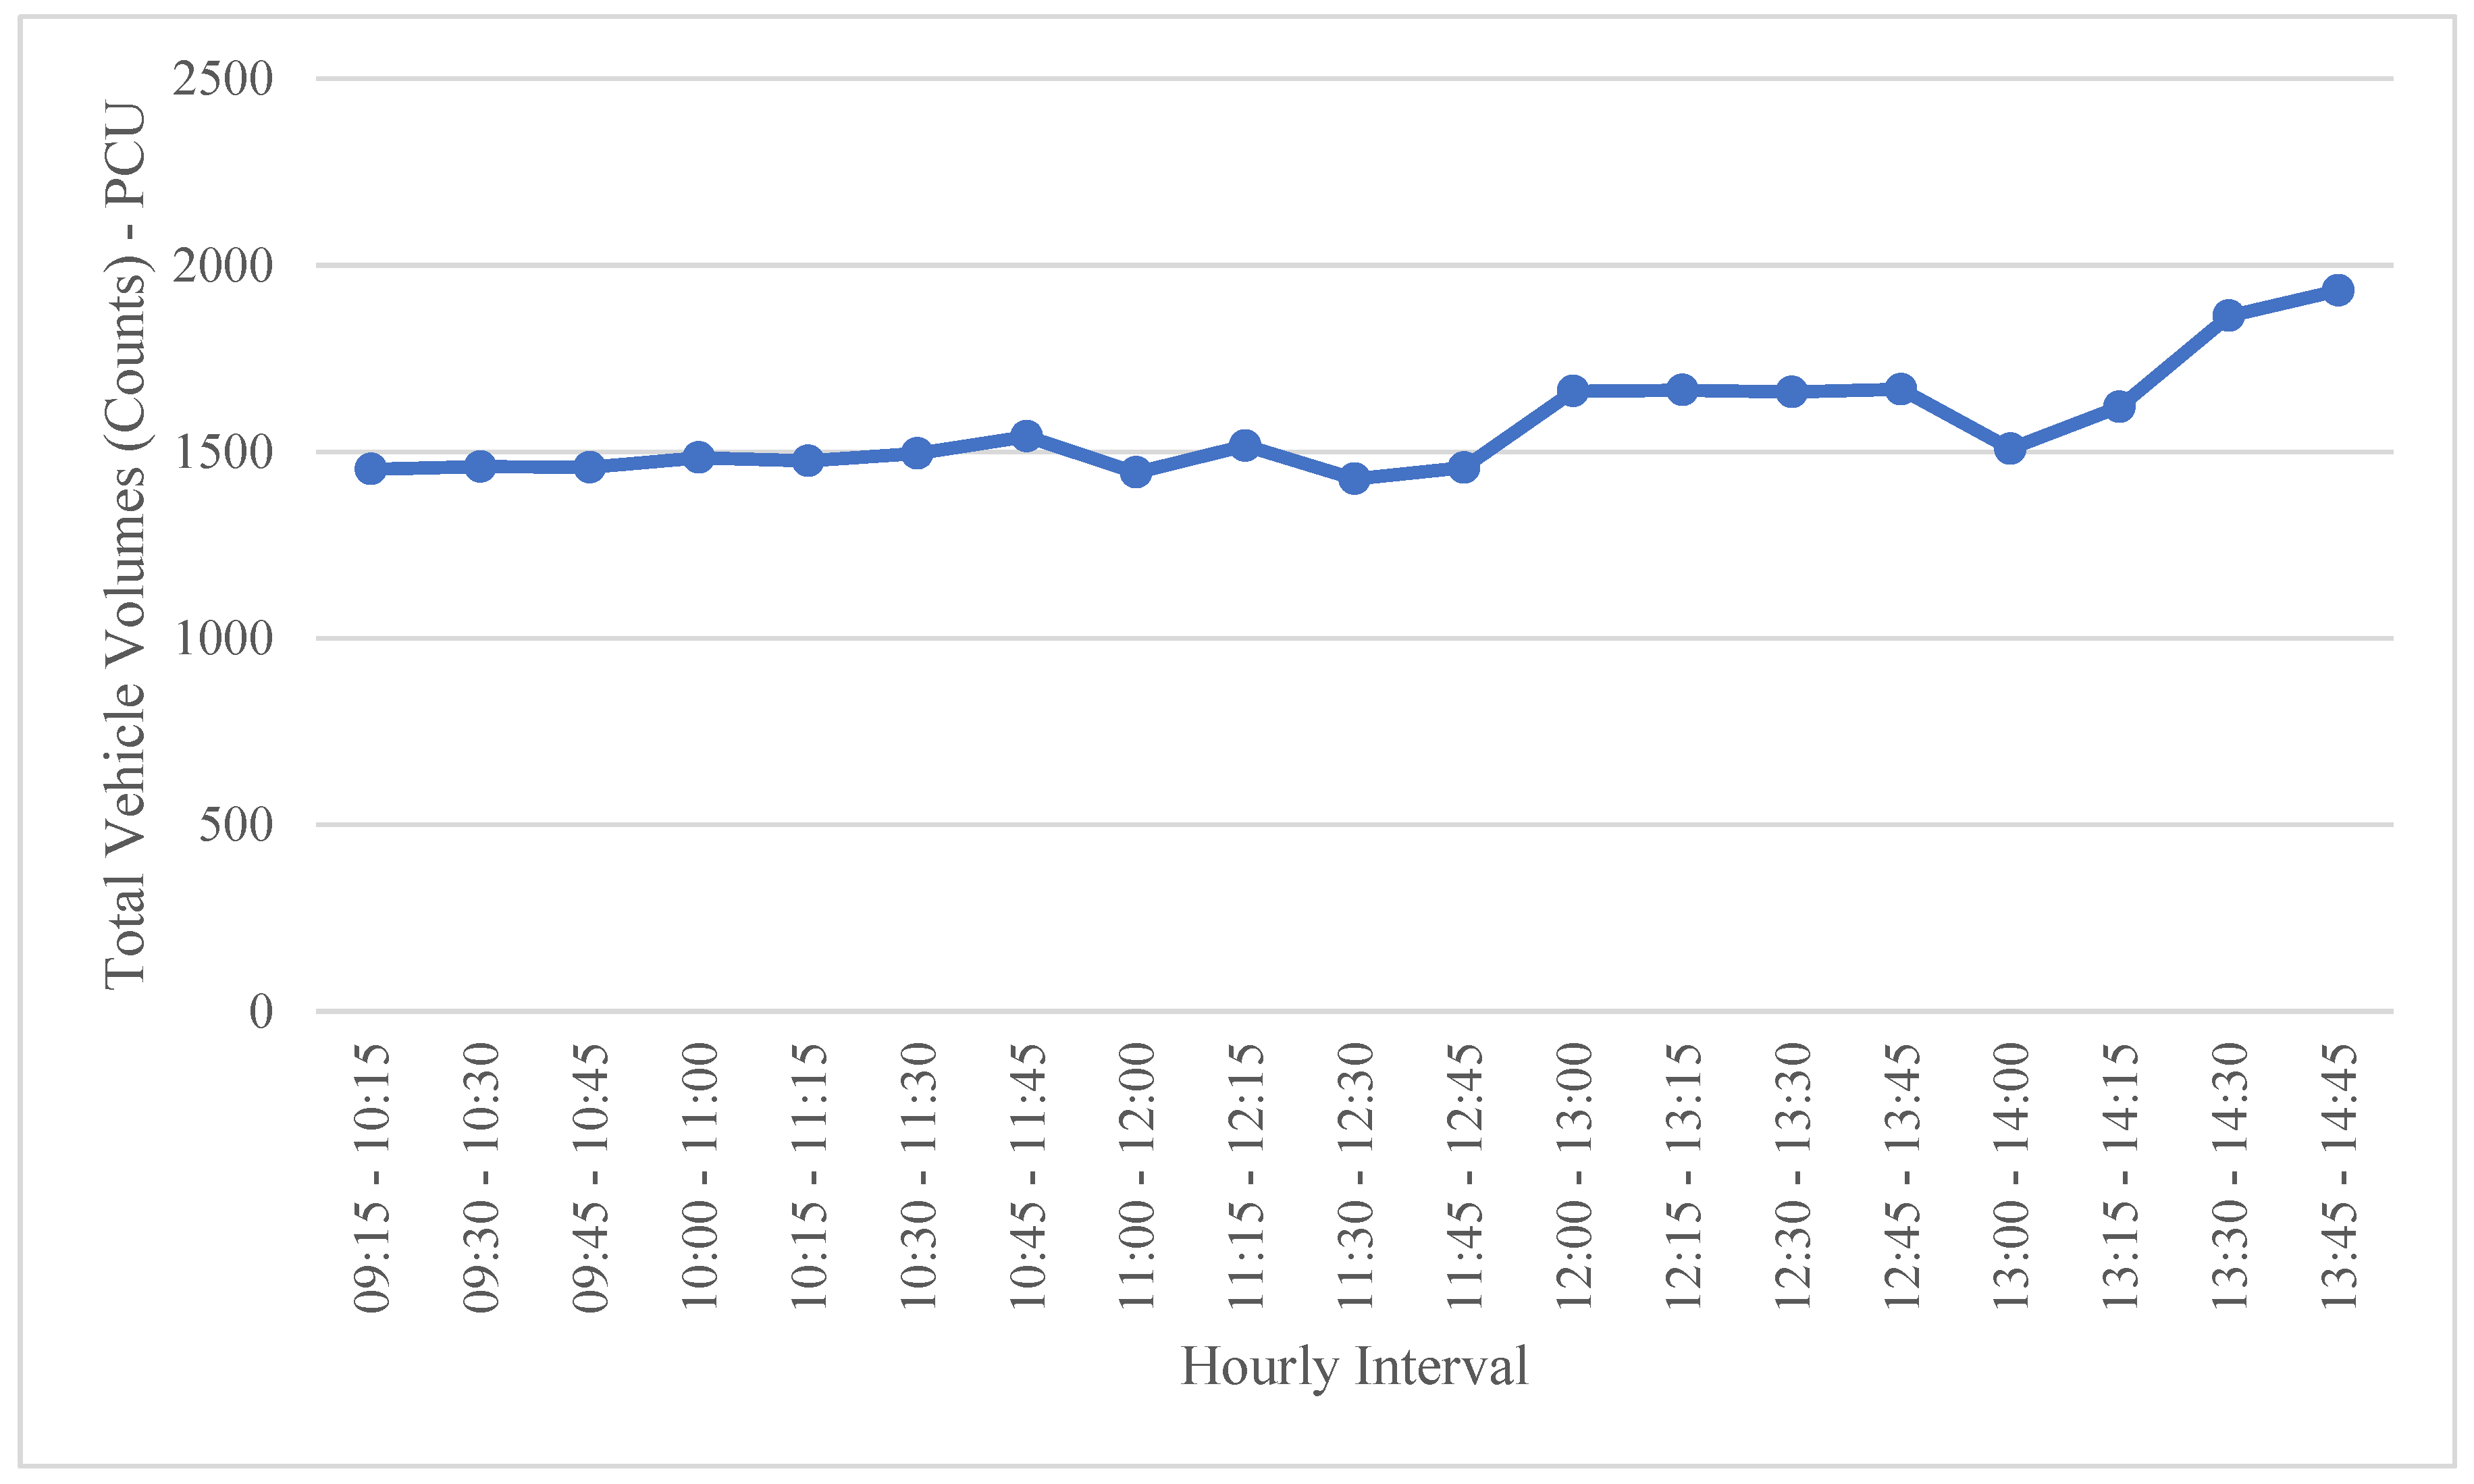
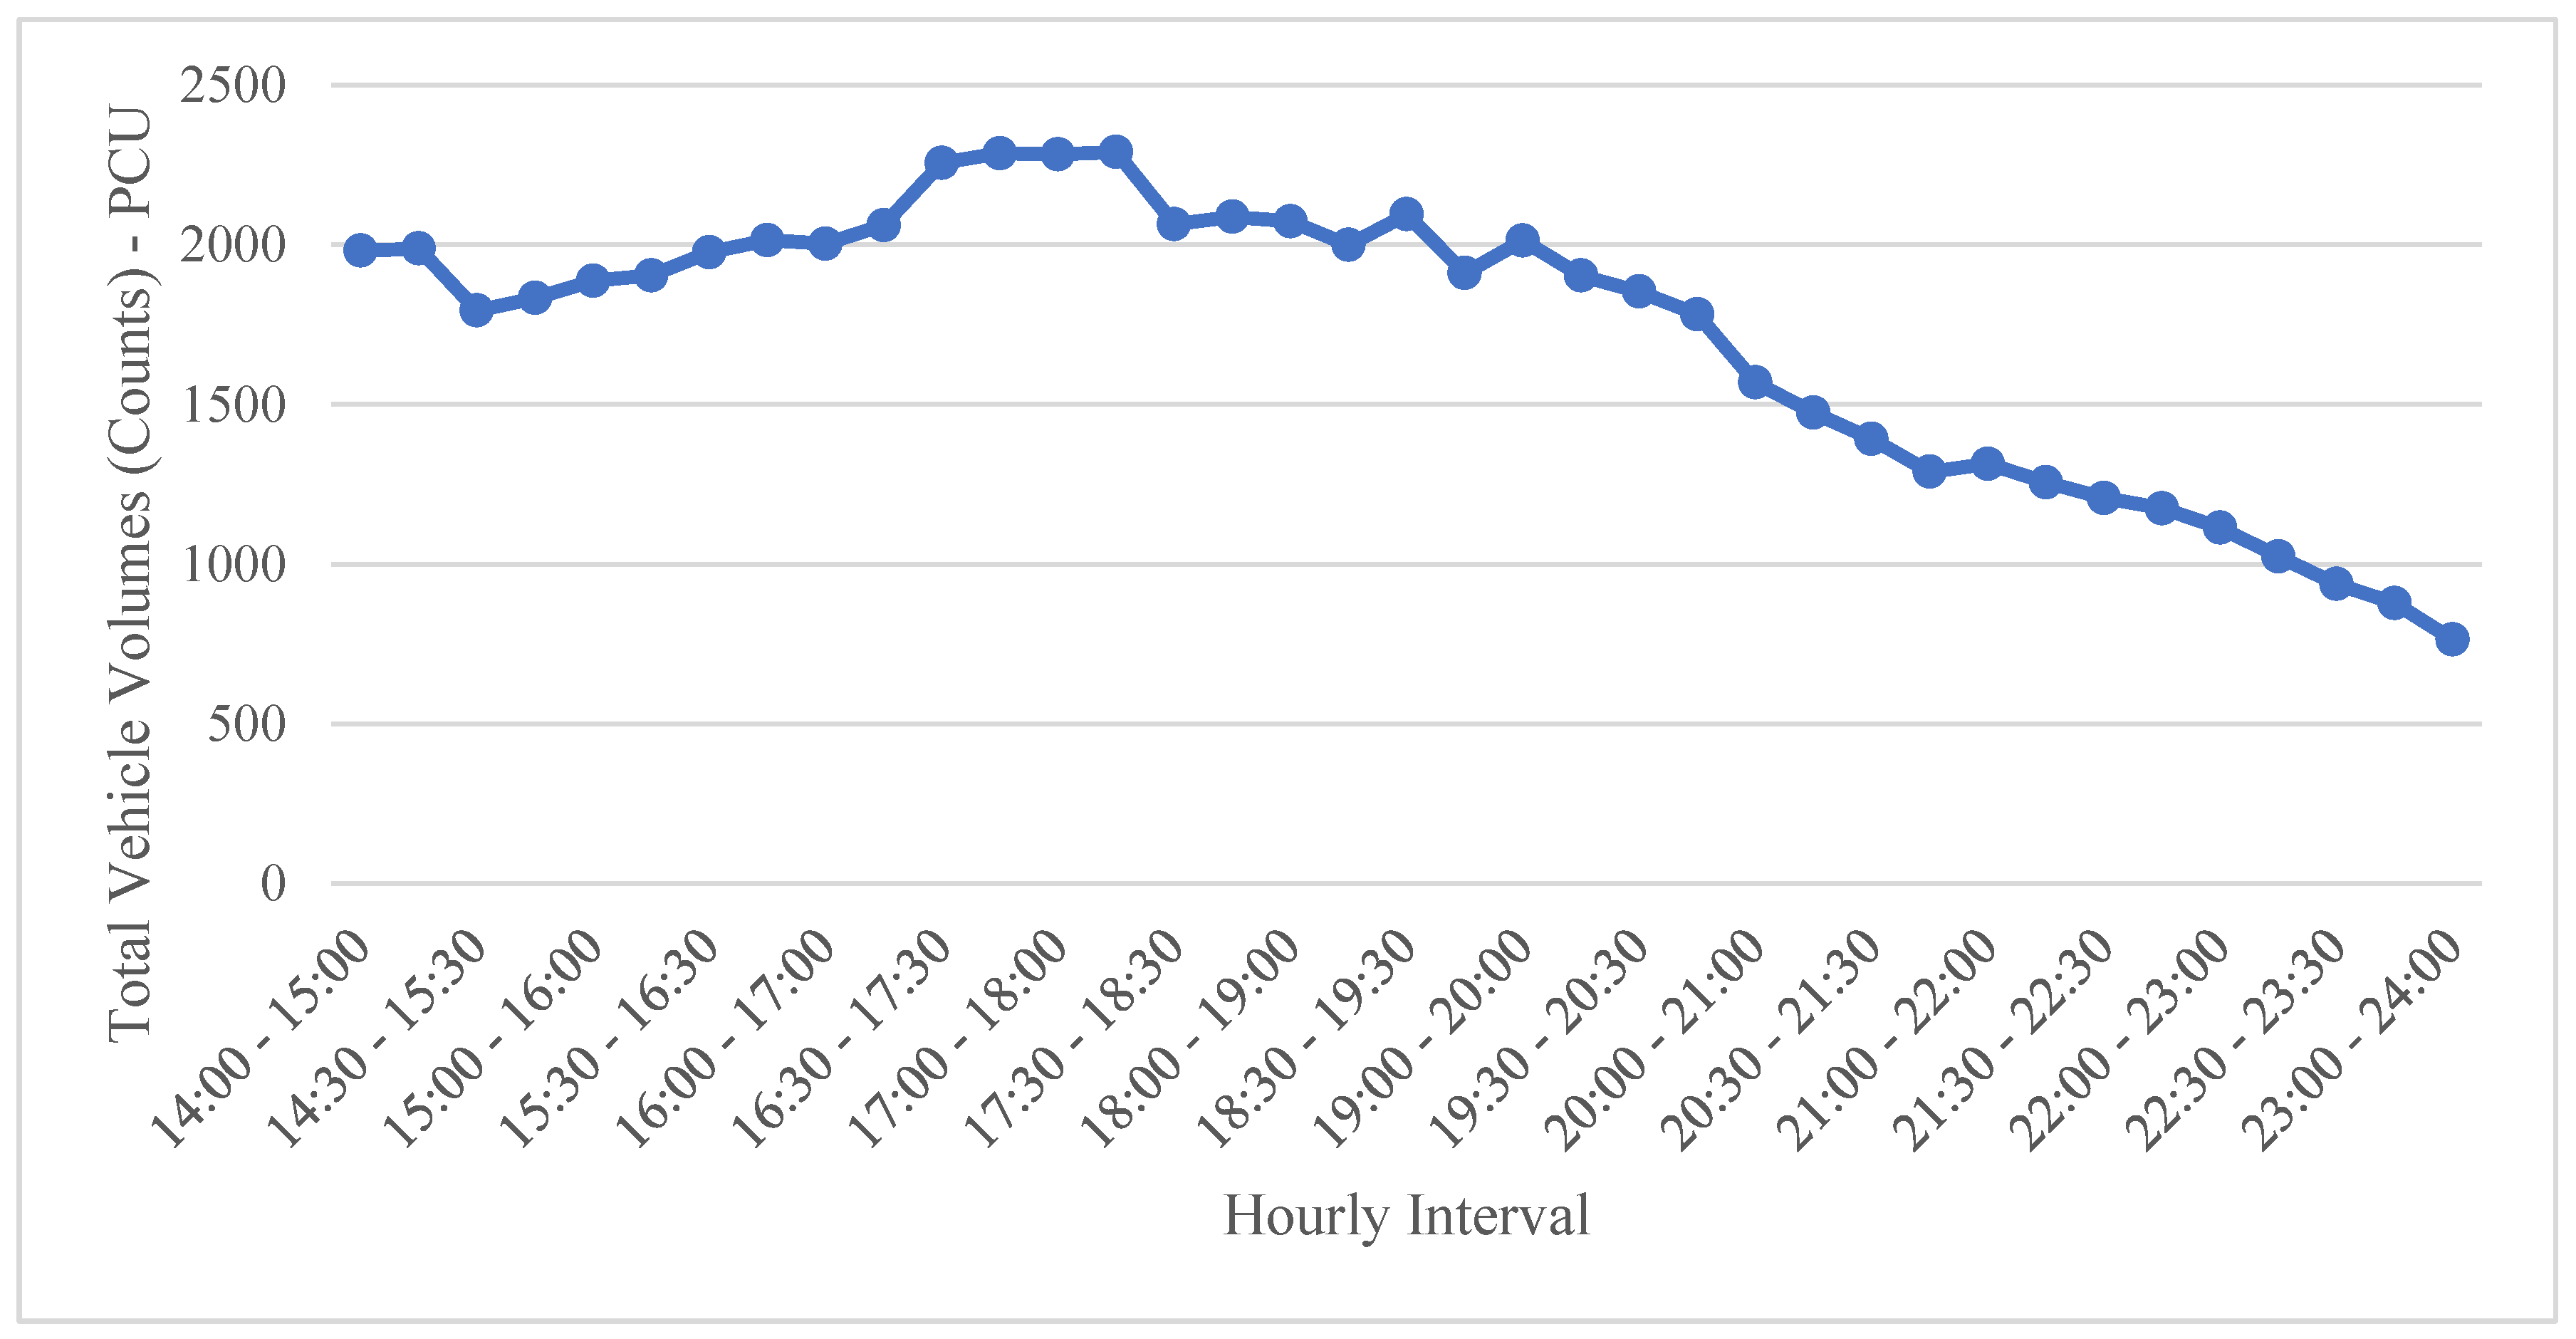
Table 4), traffic volumes were determined on the peak day. In other words, the peak day from October 1st to 15th was specified, and the morning, mid-day, and afternoon hours of the peak day was selected to simulate in AIMSUN software. Considering the vehicle volume (count) collected by two LiDAR sensors, Friday, October 13th, 2023 was determined as the peak day. The passenger cars, trucks, and buses volumes (counts) were analyzed on October 13th and 07:30 – 08:30 AM, 13:45 – 14:45 PM, and 17:15 – 18:15 PM were specified as morning, mid-day, and afternoon peak hours.
Figure 3,
Figure 4 and
Figure 5 demonstrate the hourly total volumes in October 13th.
Figure 3.
Vehicle Volumes (Counts) In the Morning Intervals on Friday, October 13th.
Figure 3.
Vehicle Volumes (Counts) In the Morning Intervals on Friday, October 13th.
Figure 4.
Vehicle Volumes (Counts) In the Mid-day Intervals on Friday, October 13th.
Figure 4.
Vehicle Volumes (Counts) In the Mid-day Intervals on Friday, October 13th.
Figure 5.
Vehicle Volumes (Counts) In the Afternoon and Mid-night Intervals on Friday, October 13th.
Figure 5.
Vehicle Volumes (Counts) In the Afternoon and Mid-night Intervals on Friday, October 13th.
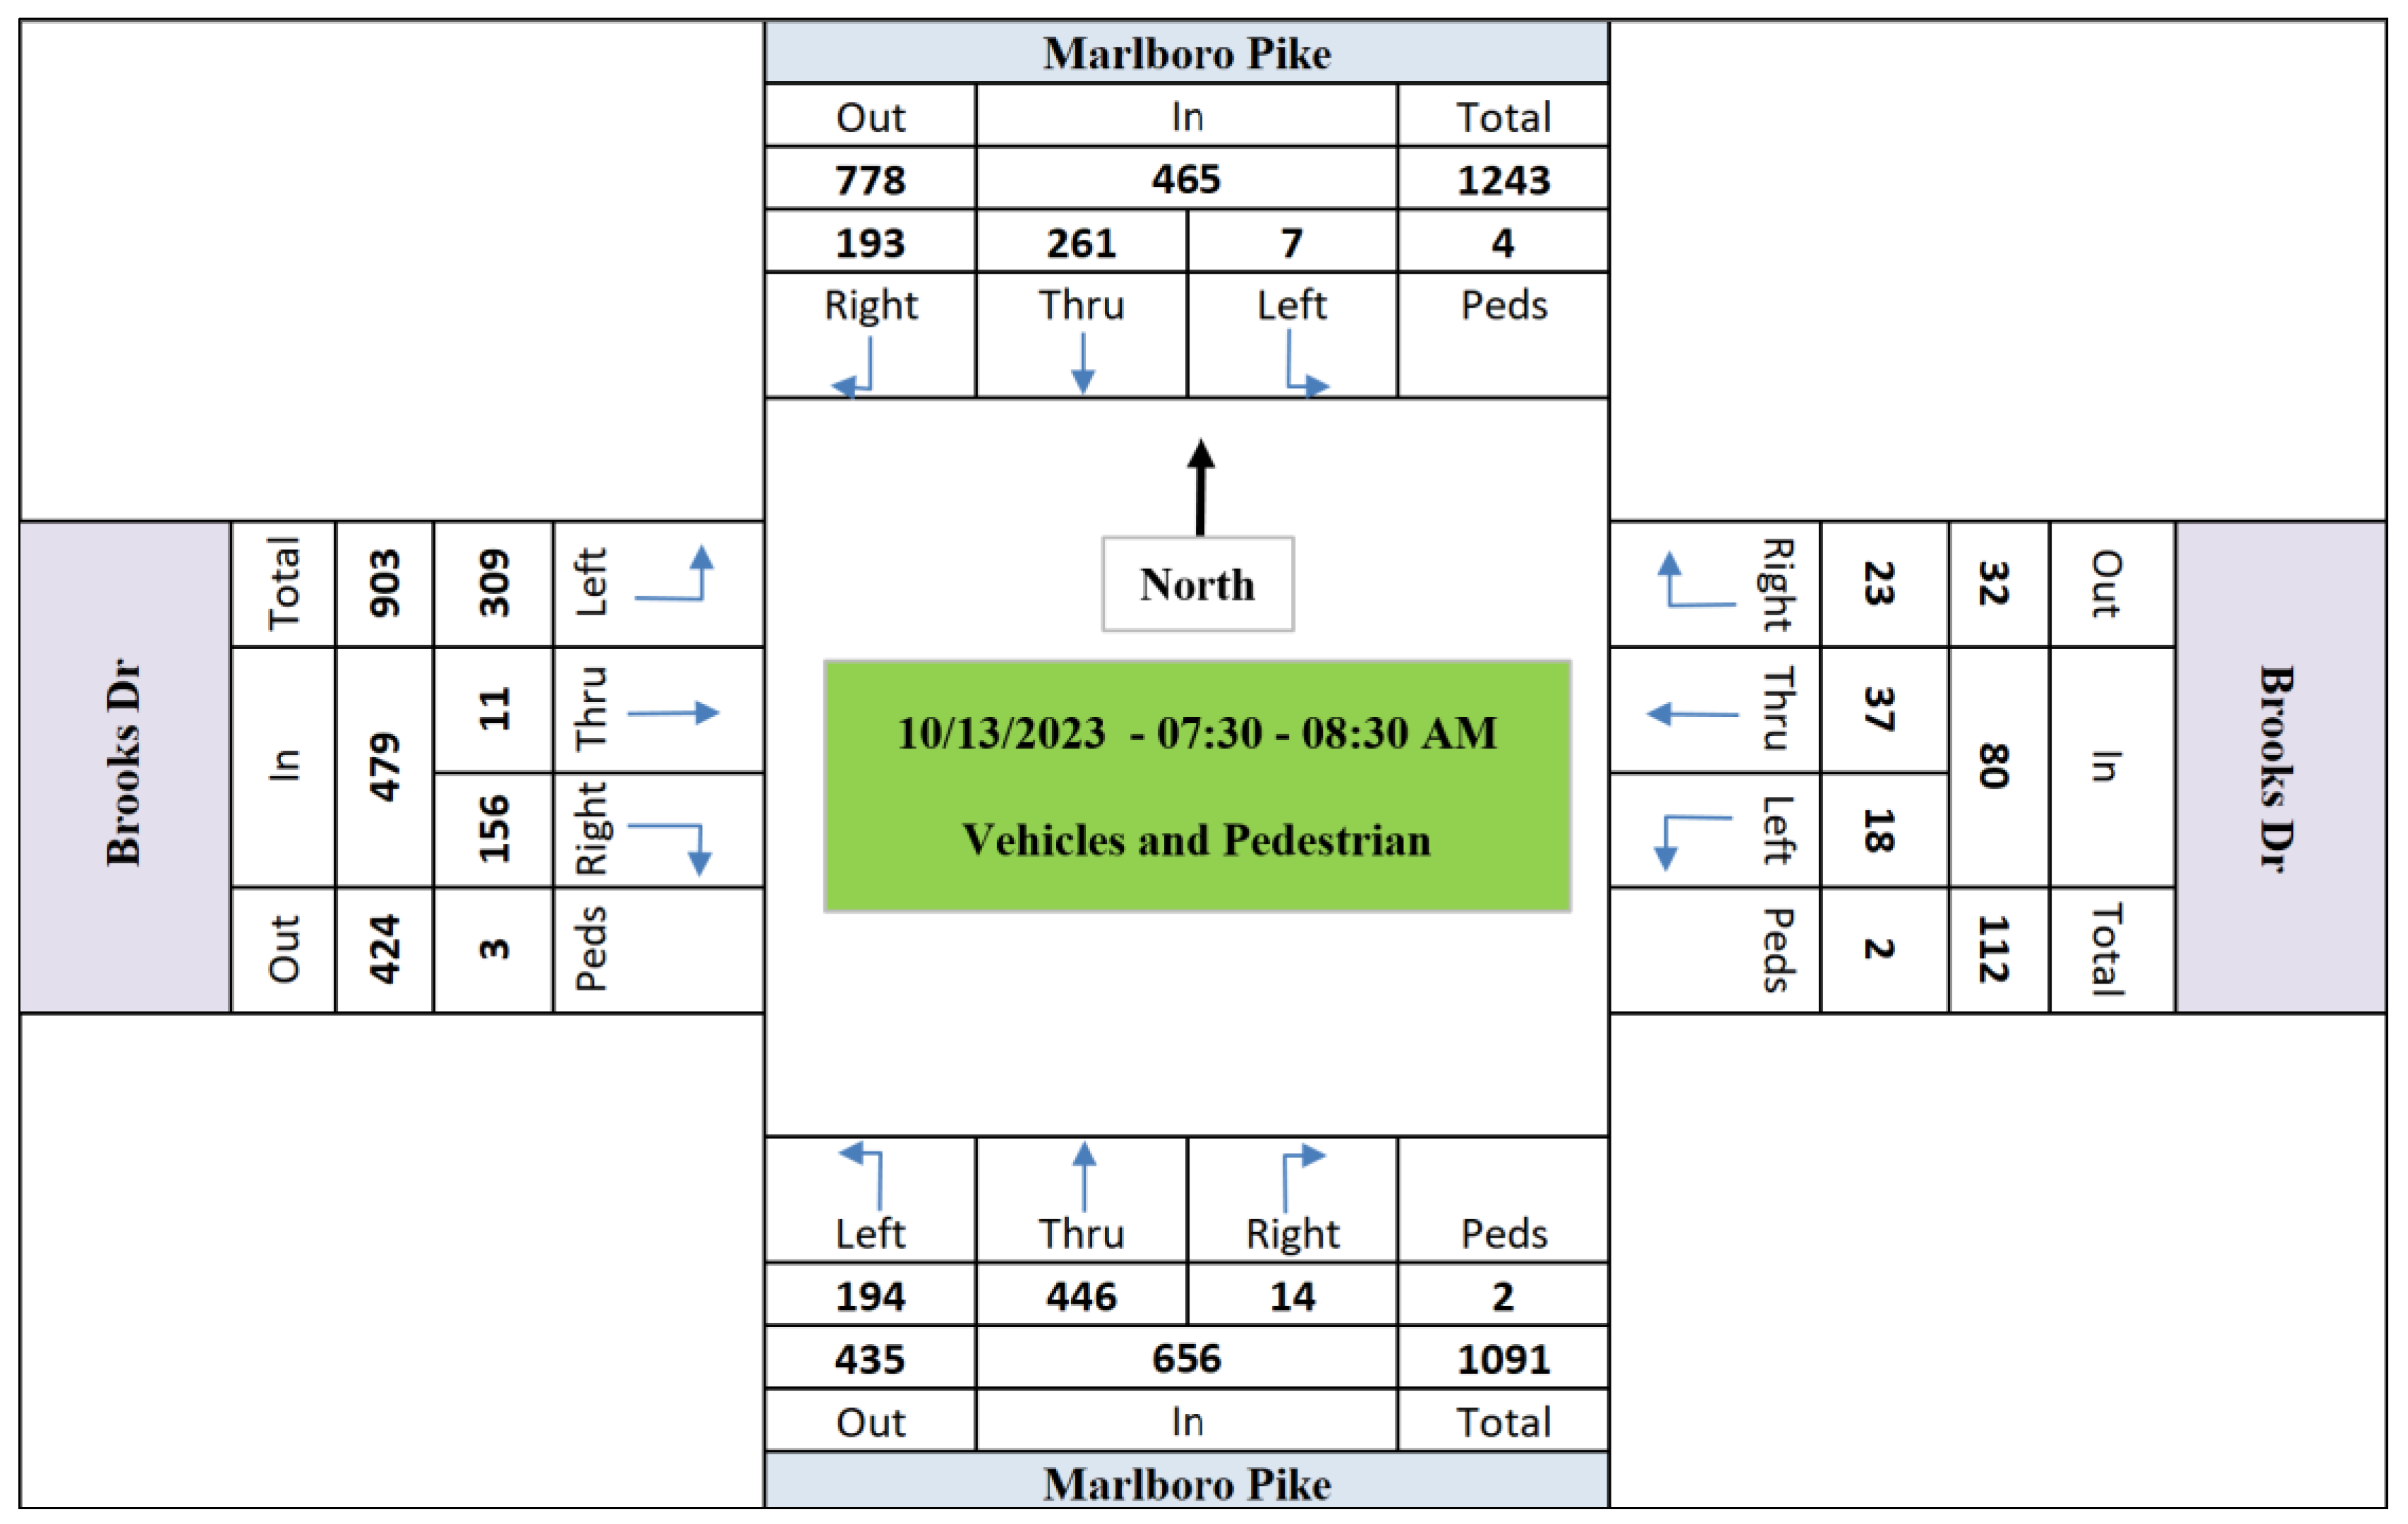
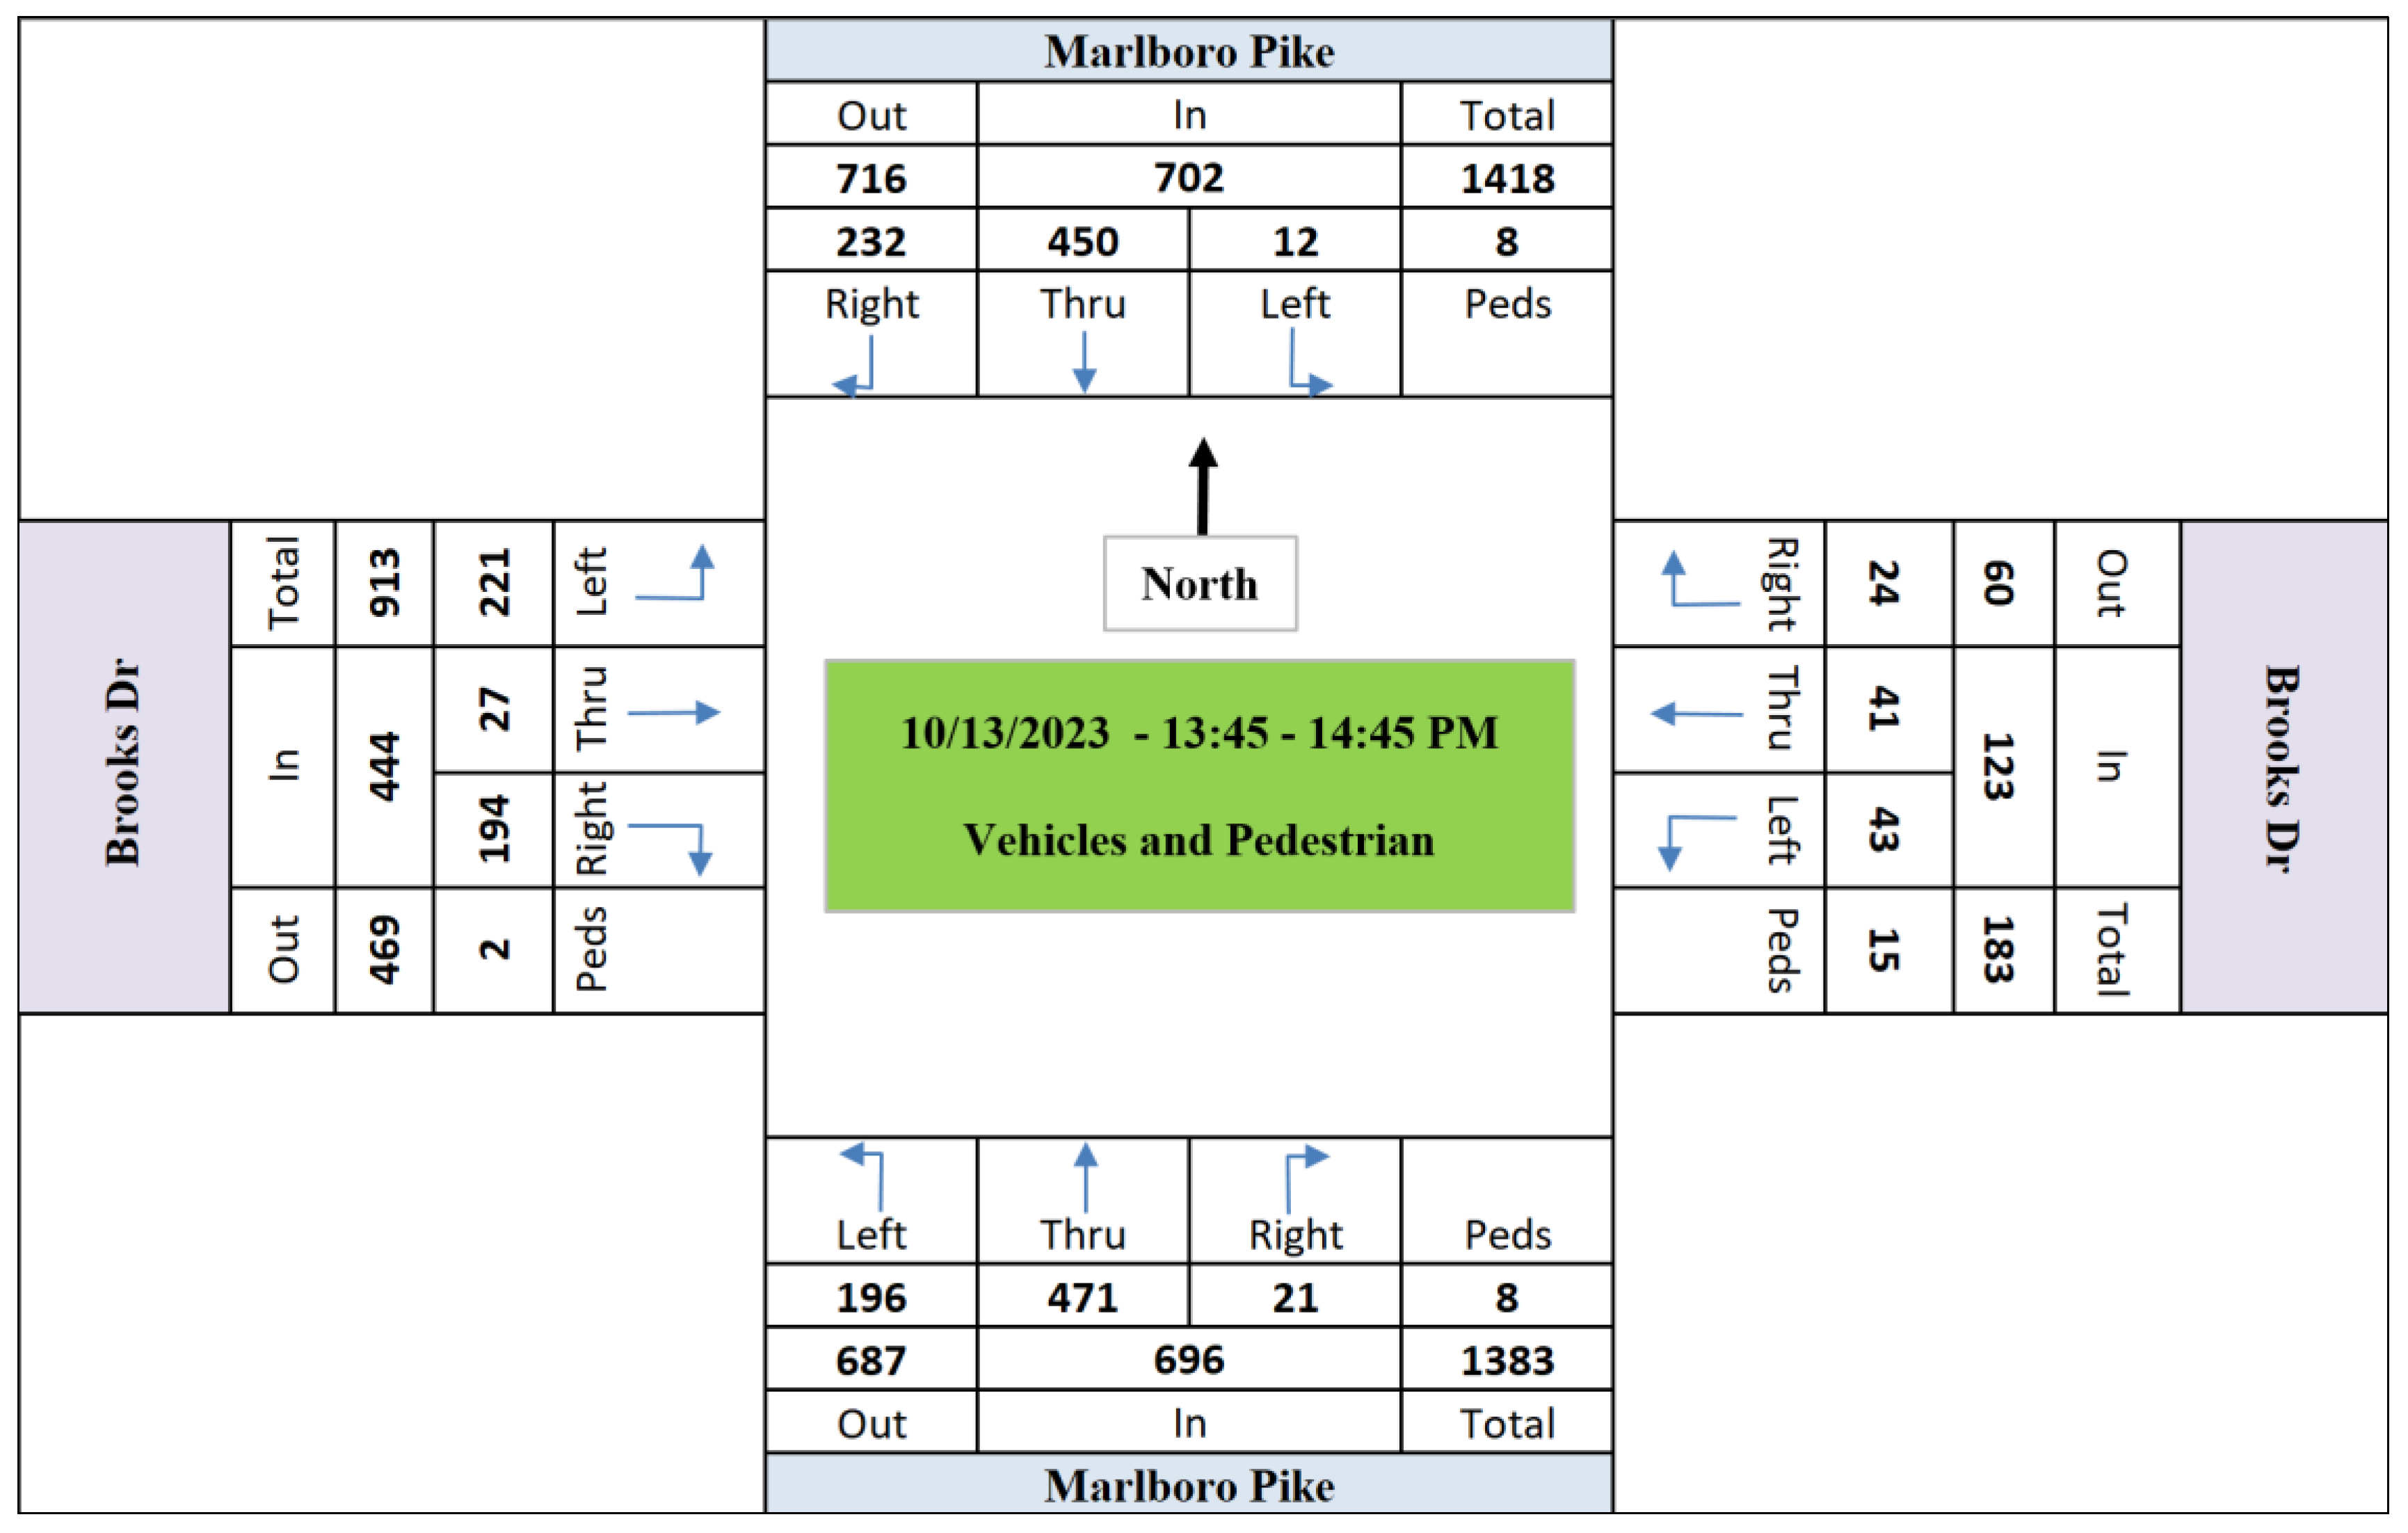
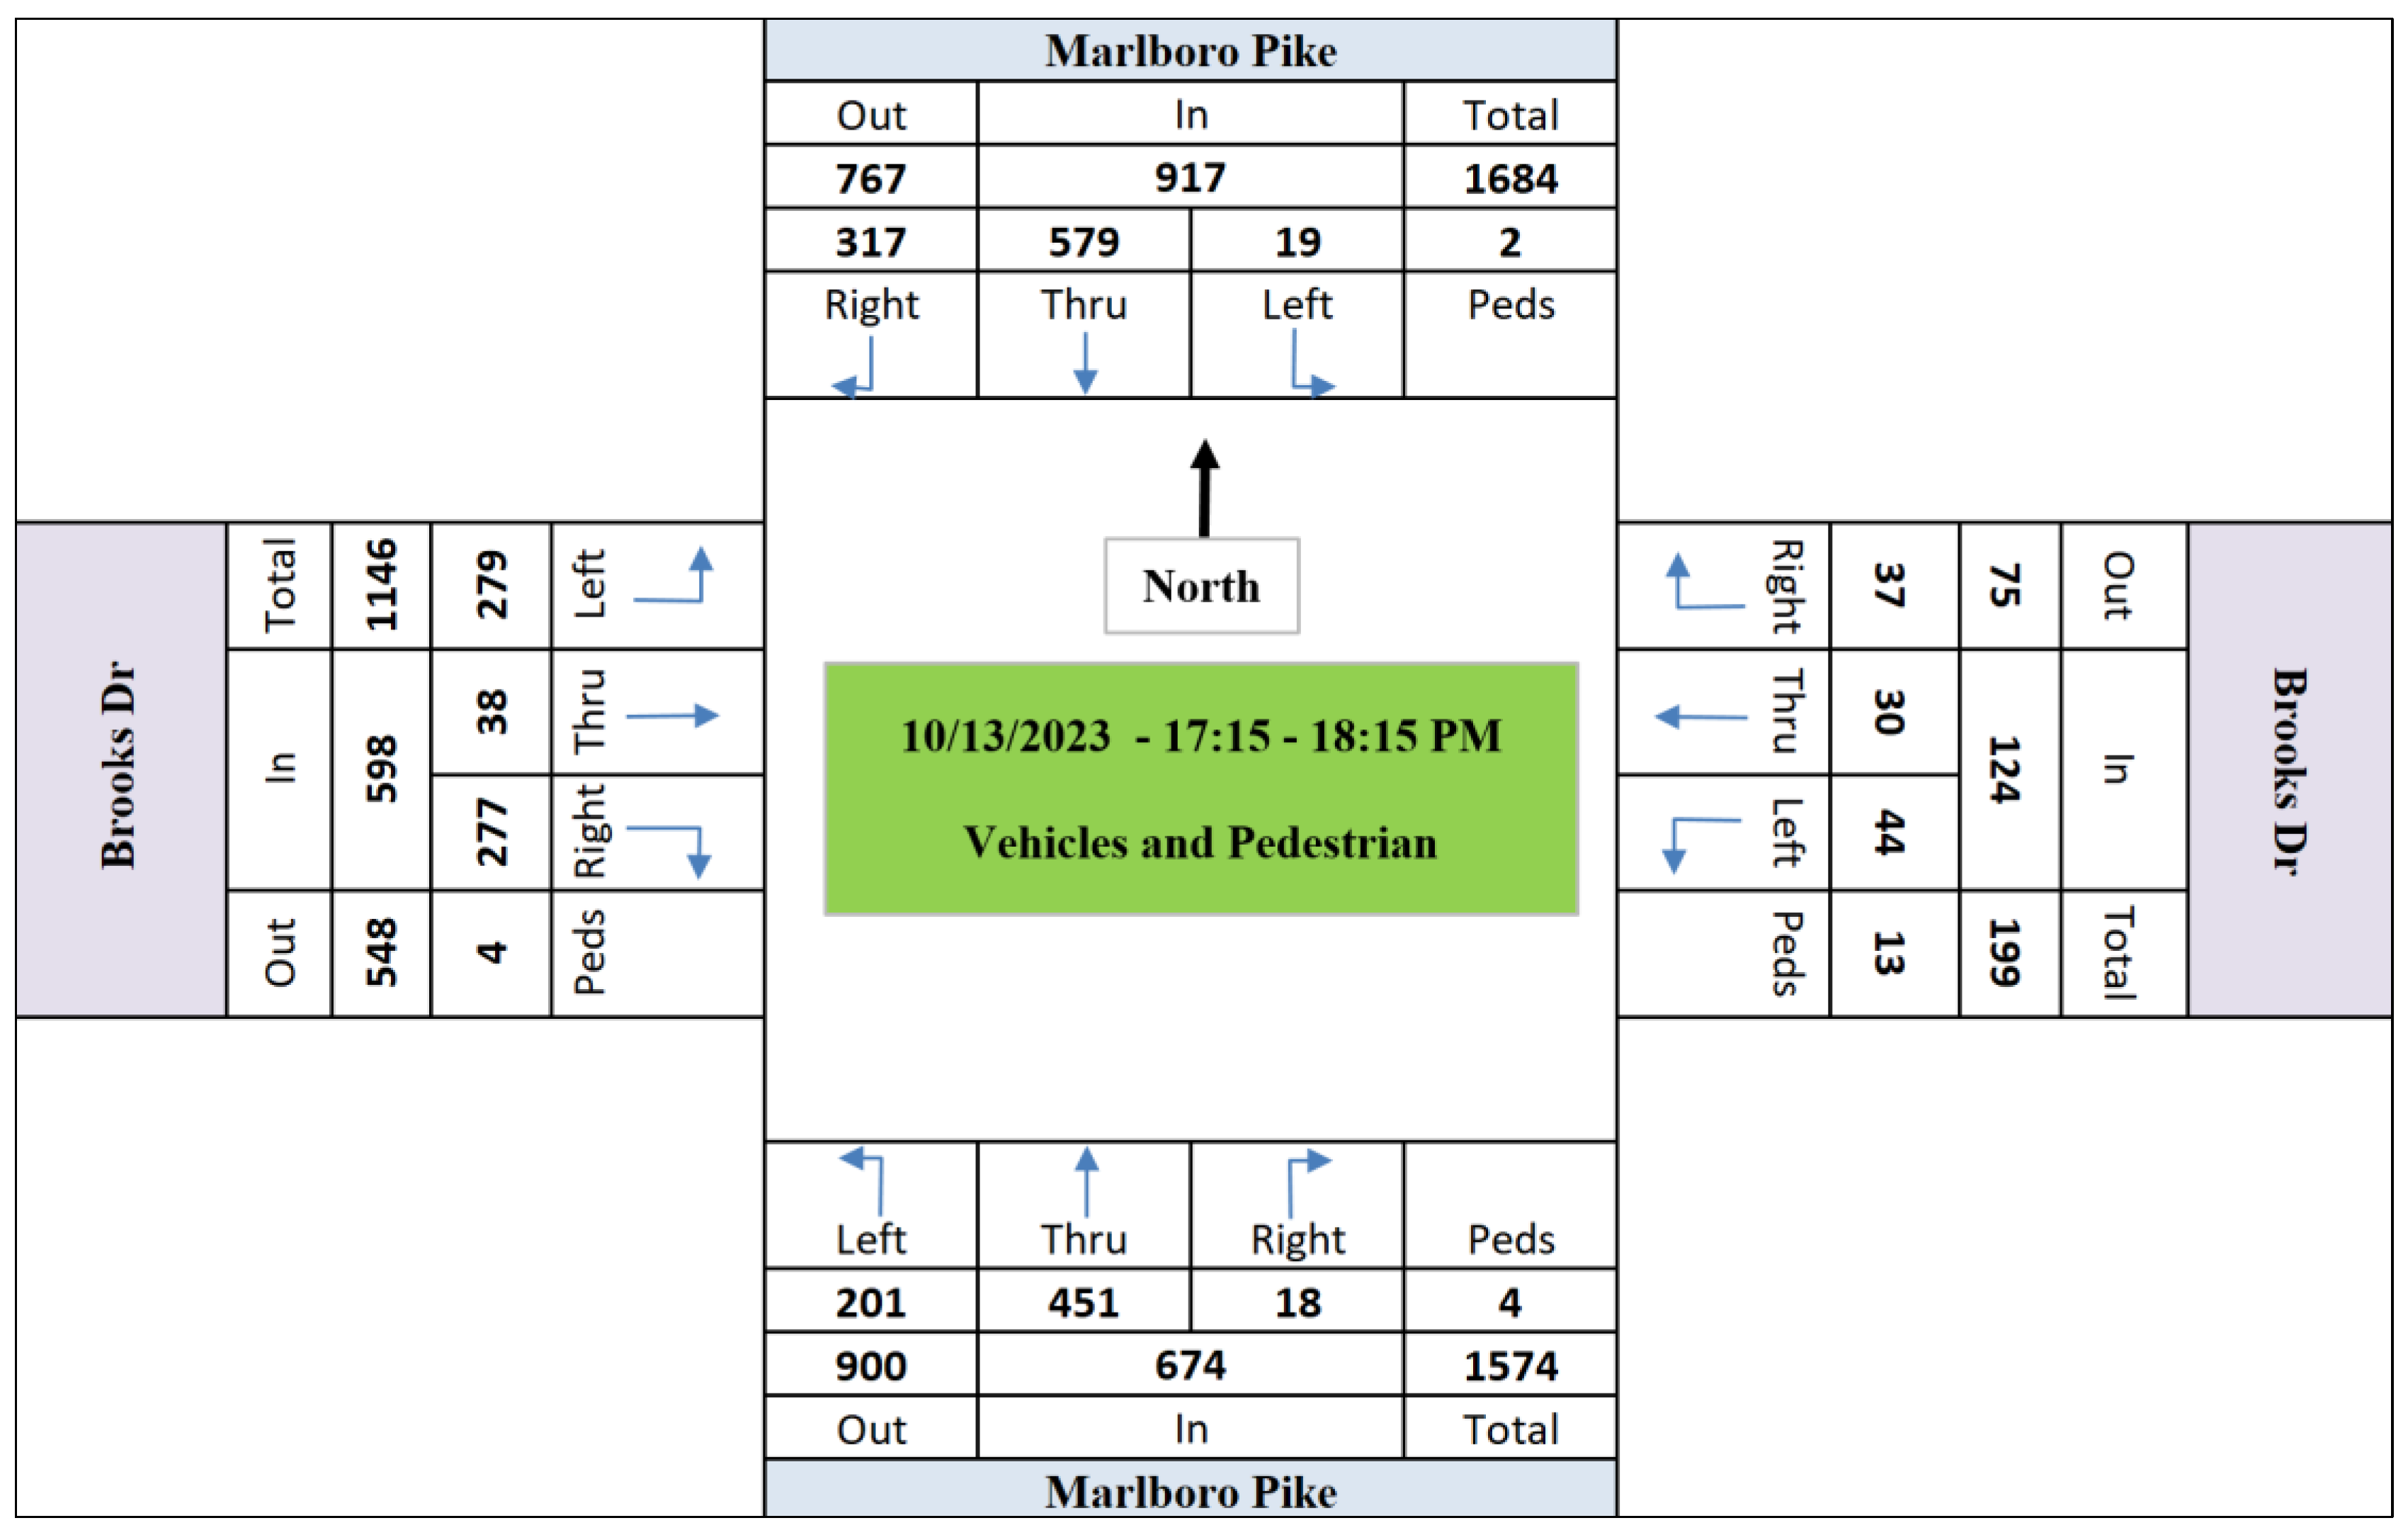
Figure 6,
Figure 7 and
Figure 8 show the peak hour traffic volumes (counts) of each movement at the intersection.
Figure 6.
Morning Peak Hour Volumes (07:30 - 08:30 AM).
Figure 6.
Morning Peak Hour Volumes (07:30 - 08:30 AM).
Figure 7.
Mid-day Peak Hour Volumes (13:45 - 14:45 PM).
Figure 7.
Mid-day Peak Hour Volumes (13:45 - 14:45 PM).
Figure 8.
Afternoon Peak Hour Volumes (17:15 - 18:15 PM).
Figure 8.
Afternoon Peak Hour Volumes (17:15 - 18:15 PM).
Given that the LiDAR’s optimal green time allocation values of phase #6 in morning peak hour (07:30 – 08:30 AM – 29.3 sec), mid-day peak hour (13:45 – 14:45 PM – 29.7 sec), and afternoon peak hour (17:15 – 18:15 PM – 28.7 sec), the intersection was simulated in AIMSUN software. Calibrating a simulated signalized intersection within traffic simulation software is a critical step to ensure that the simulated scenario accurately reflects real-world conditions. In this research, the calibration process of the simulated signalized intersection was performed using the AIMSUN software, focusing on the intricate steps and methodologies involved. The calibration process involves an iterative approach that refines the simulation model to yield results that align closely with observed traffic behaviors. AIMSUN, with its advanced features and capabilities, provides a robust platform for this undertaking.
The calibration process typically begins with the collection of real-world data at the target intersection, including traffic counts, vehicle speeds, queue lengths, and signal timings [
8,
18]. These empirical data serve as the baseline against which the simulation model will be calibrated. In AIMSUN, model parameters such as driver behavior, vehicle characteristics, and lane-specific details are adjusted to reproduce observed traffic patterns accurately. Through an iterative process of comparing simulation outputs with real-world data, adjustments are made to the model parameters until a satisfactory level of alignment is achieved. The successful calibration of a simulated signalized intersection in AIMSUN allows for the testing and evaluation of various traffic control strategies and infrastructure changes without the need for costly and time-consuming real-world experiments. The following steps were followed to simulate Marlboro Pike & Brooks Dr. signalized intersection in AIMSUN.
1. Data Collection: Begin by gathering comprehensive and accurate real-world traffic data at the target signalized intersection. This data should include information such as traffic counts, vehicle speeds, queue lengths, and signal timings. The quality and representativeness of the data are essential for calibration.
2. Model Initialization: Set up the simulation model in AIMSUN, including the road network, signal timings, and initial parameters. Ensure that the model reflects the physical characteristics of the actual intersection that incorporated data such as road geometry and lane configurations.
3. Initial Simulation: Conduct an initial simulation run using the uncalibrated model. This run will serve as a baseline to identify discrepancies between the simulation and real-world data.
4. Parameter Adjustment: Identify specific model parameters that may need adjustment to improve the model's accuracy. These parameters include driver behavior, vehicle characteristics, lane-specific attributes, or signal control settings.
5. Iterative Process: Calibration is an iterative process. Each iteration should aim to reduce the disparities between the model and real-world conditions.
6. Sensitivity Analysis: Perform sensitivity analyses to assess the impact of different parameter adjustments on the simulation outputs. This can help to understand which parameters have the most significant influence on the model's performance.
7. Validation and Validation Data: Reserve a portion of the collected data for validation purposes. It is recommended that this information not be used during the calibration process, but instead be used to assess the accuracy of the calibrated model independently. This separation helps ensure that the model does not become overfit to the calibration data.
8. Documentation: Thoroughly document all parameter adjustments, iterations, and results throughout the calibration process. The number of iterations required to calibrate a simulated signalized intersection in AIMSUN can vary significantly depending on the complexity of the intersection, the quality of the available data, the accuracy of the initial model, and the specific calibration objectives. Calibration aims to minimize the discrepancies between the simulated results and real-world data. The iteration process should be continued until an acceptable level of accuracy and alignment with the observed traffic conditions is gained. Additionally, the complexity of the simulation model can affect the number of iterations. A more complex model, with multiple traffic movements, intricate lane configurations, and various signal phases, may require more iterations to accurately represent the real-world intersection. It is worth mentioning that there are no specific mathematical equations to determine the exact number of iterations needed to calibrate a simulated signalized intersection in AIMSUN. The number of iterations required is determined by a dynamic and data-driven process that depends on several factors and it is not a quantifiable variable that can be expressed mathematically. Instead, it is determined through experience, observation, and judgment during the calibration process. To provide an accurate simulation, 10 iterations were considered to simulate morning, mid-day, and afternoon peak hours [
18].
9. Model Validation: After calibration, the model should be validated by comparing the simulation outputs with the reserved validation data. The model should demonstrate good performance in replicating real-world traffic conditions not used during calibration.
The network was simulated in AIMSUN software, and 29.3 sec, 29.7 sec, and 28.7 sec were considered as the optimal green time for phase #6 in morning, mid-day, and afternoon peak hours.
Figure 9 illustrates the simulated network in AIMSUN, and
Table 5 shows the traffic factors for morning peak hour (07:30 – 08:30 AM).
Figure 9.
Simulated Network in AIMSUN.
Figure 9.
Simulated Network in AIMSUN.
Table 5.
orning Peak Hour Traffic Values – AIMSUN Output.
Table 5.
orning Peak Hour Traffic Values – AIMSUN Output.
| Time Series |
Value |
Units |
| Delay Time |
12.77 |
sec/mi |
| Density |
7.55 |
veh/mi |
| Flow |
1681.4 |
veh/h |
| IEM Emission - CO2 |
46420.1 |
g |
| IEM Emission - NOx |
123.5 |
g |
| IEM Emission - PM |
25.19 |
g |
| IEM Emission - VOC |
24.96 |
g |
| Input Flow |
1686.2 |
veh/h |
| Speed |
30.23 |
mph |
| Stop Time |
0.46 |
sec/mi |
| Total Distance Traveled |
118.1 |
mi |
| Total Number of Stops |
25.3 |
|
| Total Travel Time |
4.02 |
h |
| Travel Time |
122.74 |
sec/mi |
Table 6 shows the traffic results for mid-day peak hour (13:45 – 14:45 PM).
Table 6.
Mid-day Peak Hour Traffic Values - AIMSUN Output.
Table 6.
Mid-day Peak Hour Traffic Values - AIMSUN Output.
| Time Series |
Value |
Units |
| Delay Time |
13.82 |
sec/mi |
| Density |
7.94 |
veh/mi |
| Flow |
1893 |
veh/h |
| IEM Emission - CO2 |
49414.17 |
g |
| IEM Emission - NOx |
136.45 |
g |
| IEM Emission - PM |
27.09 |
g |
| IEM Emission - VOC |
26.42 |
g |
| Input Flow |
1939.3 |
veh/h |
| Speed |
29.98 |
mph |
| Stop Time |
0.53 |
sec/mi |
| Total Distance Traveled |
127.09 |
mi |
| Total Number of Stops |
38.8 |
|
| Total Travel Time |
4.84 |
h |
| Travel Time |
124.15 |
sec/mi |
Table 7 shows the traffic results for afternoon peak hour (17:15 – 18:15 PM).
Table 7.
Afternoon Peak Hour Traffic Values - AIMSUN Output.
Table 7.
Afternoon Peak Hour Traffic Values - AIMSUN Output.
| Time Series |
Value |
Units |
| Delay Time |
16.17 |
sec/mi |
| Density |
7.55 |
veh/mi |
| Flow |
2291.4 |
veh/h |
| IEM Emission - CO2 |
69515.63 |
g |
| IEM Emission - NOx |
177.29 |
g |
| IEM Emission - PM |
40.12 |
g |
| IEM Emission - VOC |
34.79 |
g |
| Input Flow |
2296.8 |
veh/h |
| Speed |
29.52 |
mph |
| Stop Time |
0.99 |
sec/mi |
| Total Distance Traveled |
158.18 |
mi |
| Total Number of Stops |
59.6 |
|
| Total Travel Time |
5.54 |
h |
| Travel Time |
126.39 |
sec/mi |
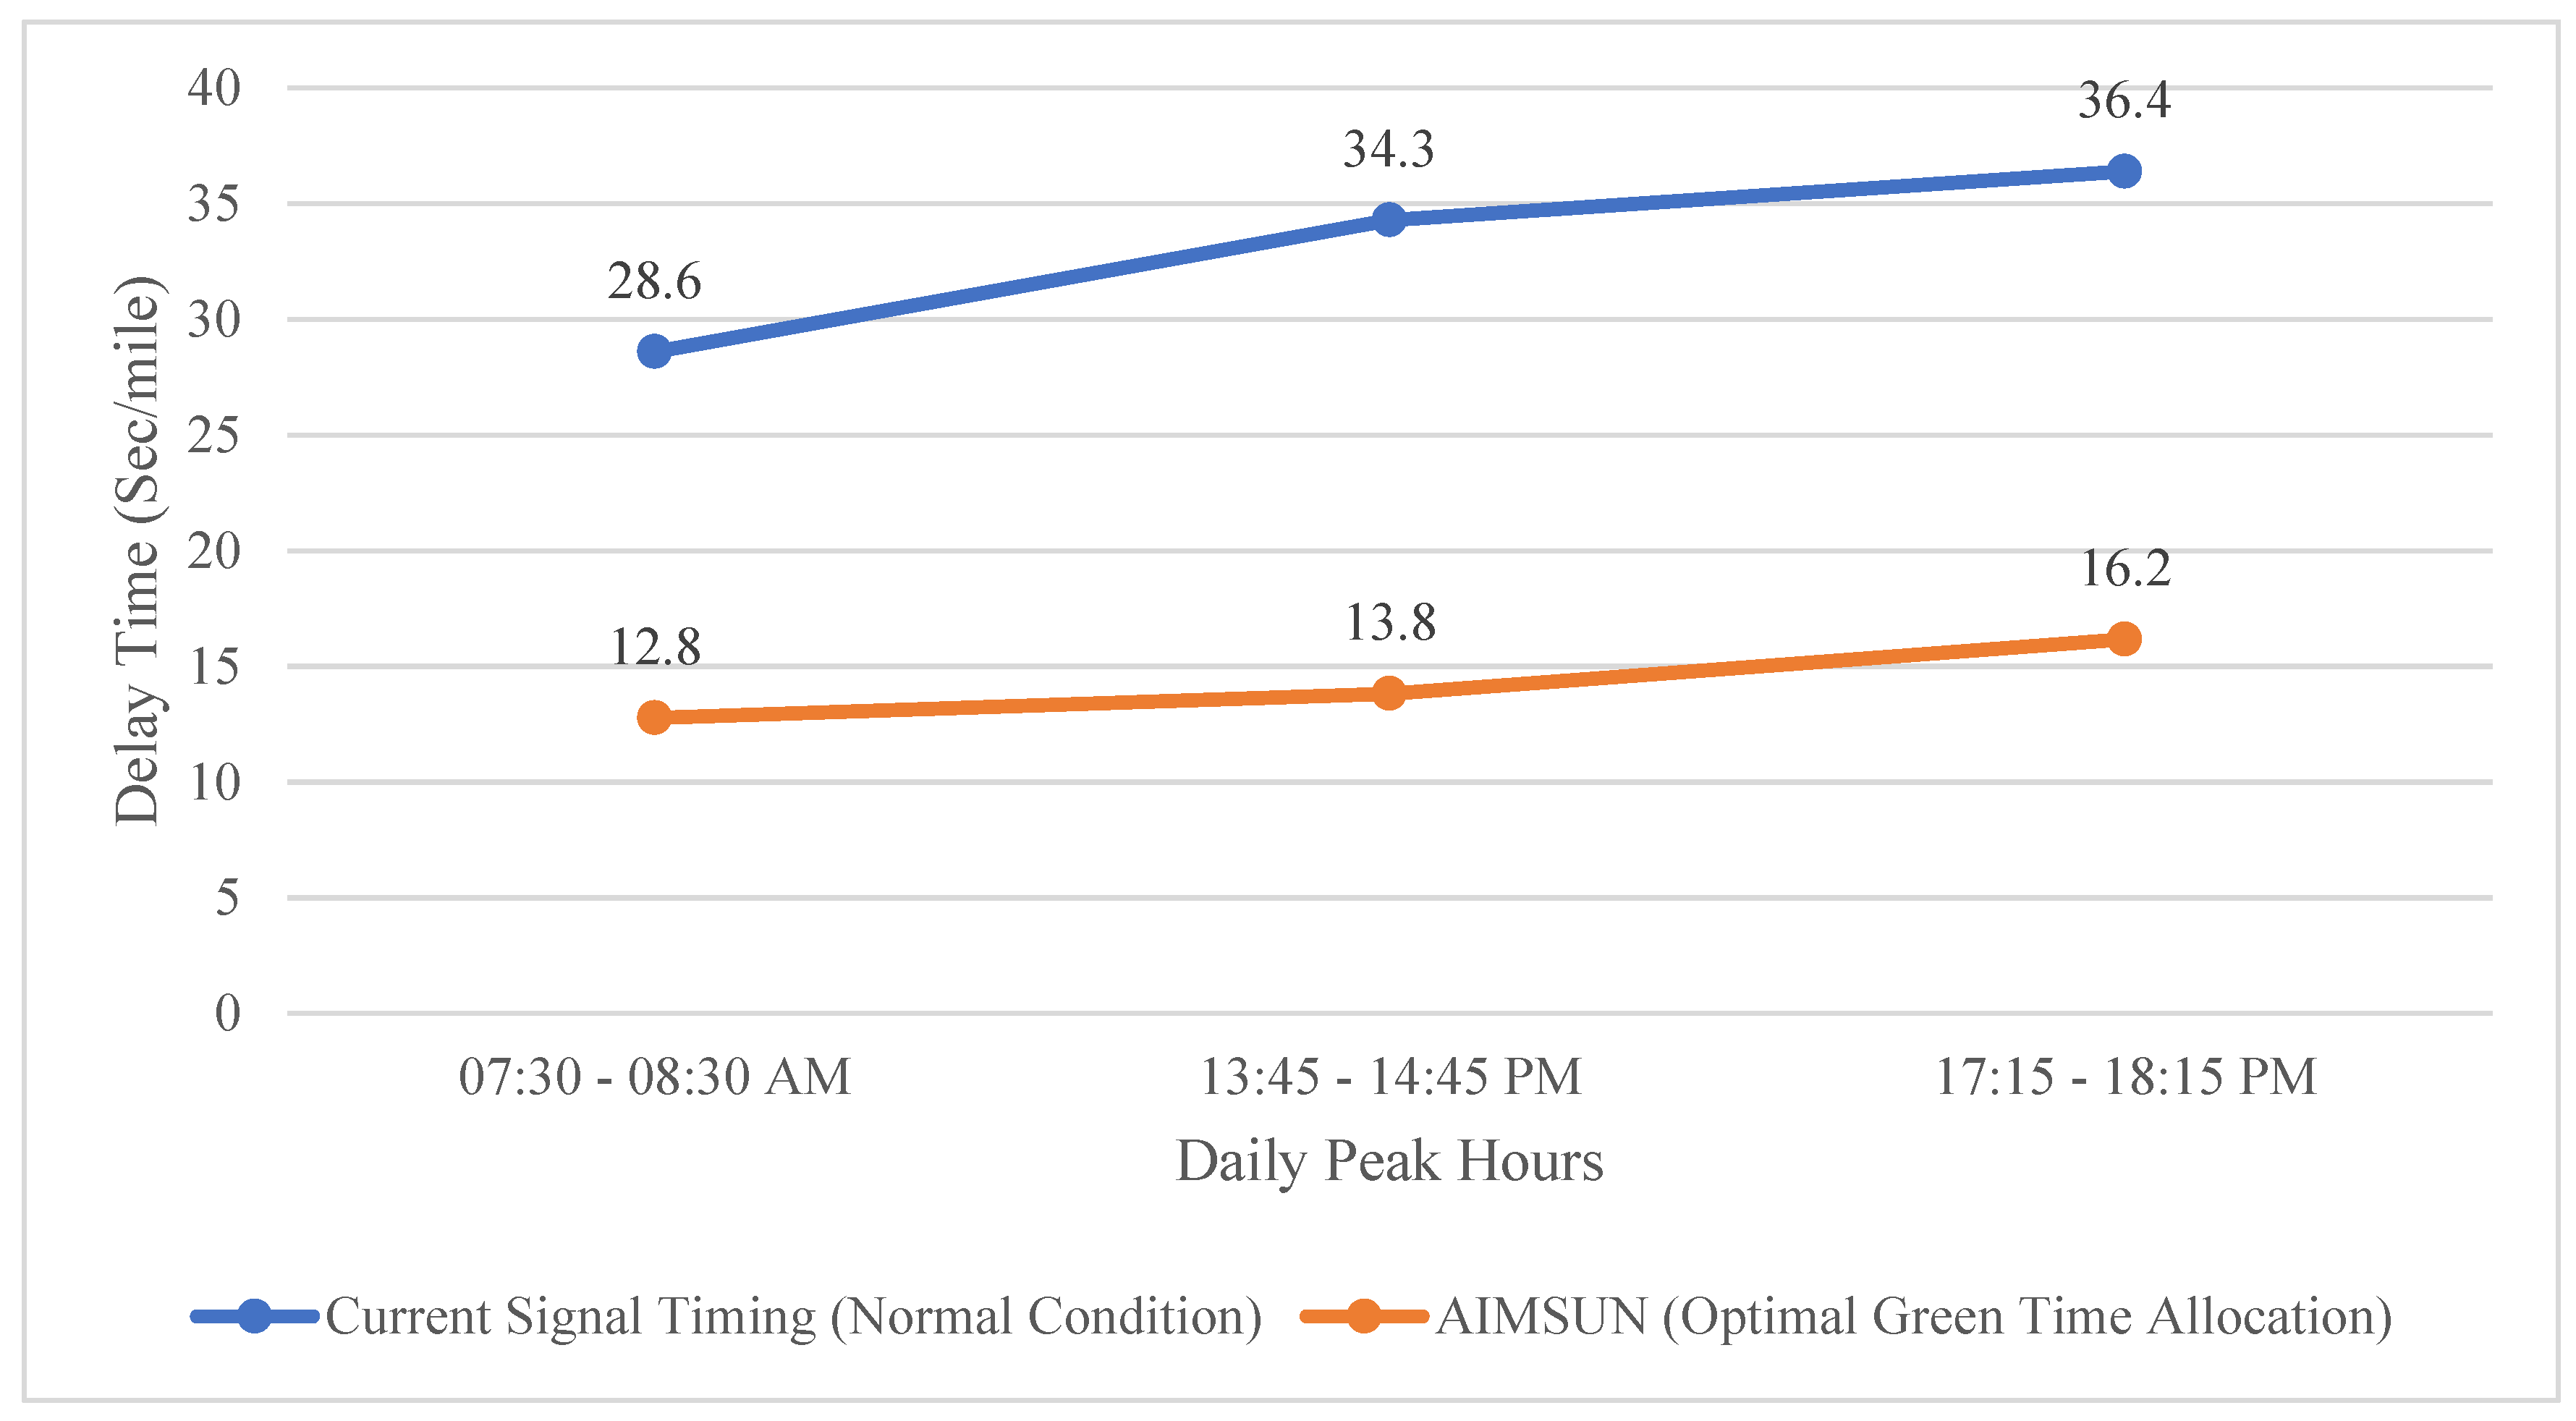
Figure 10 compares the delay time results of the current signal timing under normal conditions with results obtained through microsimulation in AIMSUN by assigning the optimal green time. As can be seen in
Figure 10, the optimal green time allocation for phase #6 in morning, mid-day, and afternoon peak hour intervals can improve the delay time of this phase by 55.3%, 59.7%, and 55.6%, respectively.
Figure 10.
Comparison of Delay Time (Sec/Mile) between Normal Condition and Optimal Green Time Allocation.
Figure 10.
Comparison of Delay Time (Sec/Mile) between Normal Condition and Optimal Green Time Allocation.
5. Discussion & Conclusion
This research has delved into the extensive exploration of Smart Green Time Allocation (SGTA) at a signalized intersection, bolstered by the integration of two LiDAR sensors and the utilization of microsimulation in the AIMSUN software. The significance of this study lies in its demonstration of the pivotal role that SGTA, fortified with LiDAR technology, can play in revolutionizing traffic management and signalized intersection control in urban environments [
19,
20,
21,
22]. By harnessing real-time data provided by LiDAR sensors, SGTA proves to be a dynamic, adaptable, and responsive solution capable of mitigating traffic congestion, enhancing safety, and optimizing green time allocations.
The research findings have showcased the tangible advantages of SGTA over traditional, fixed-time signal control methods. Notably, the dynamic nature of SGTA, driven by real-time traffic conditions, ushers in an era of smarter traffic management. The efficiency of signalized intersections significantly benefits from this approach, with reduced delays, improved traffic flow, and a marked reduction in queue lengths, contributing to a more fluid and streamlined commuting experience for all road users.
Beyond its efficiency, SGTA's contributions extend to the realm of environmental sustainability and road safety. By minimizing congestion and enhancing vehicle progression, SGTA curtails emissions and fuels consumption, translating to a notable reduction in the environmental footprint of urban transportation. Furthermore, the safety benefits arising from SGTA's ability to reduce crashes and conflicts at signalized intersections cannot be understated. The technology's capacity to mitigate the risk of collisions underscores its potential to enhance road safety.
While acknowledging challenges in data processing, sensor maintenance, and cost considerations, the research underscores the transformative power of SGTA in signalized intersection control. The calibration process, a crucial aspect of this study, serves as a testament to the adaptability and efficiency of the AIMSUN software for microsimulation. Through this comprehensive examination, the research not only elucidates the advantages of SGTA but also serves as a practical study for future research, innovation, and implementation.
First and foremost, future studies could delve deeper into the intricacies of LiDAR technology and its evolving capabilities. As LiDAR sensors become more advanced and cost-effective, exploring their integration into various aspects of traffic management beyond signalized intersections could offer invaluable insights. LiDAR's role in data collection and traffic monitoring can extend to broader transportation systems, urban planning, and even autonomous vehicle applications. Consequently, research can concentrate on optimizing LiDAR data processing algorithms and expanding its applicability in diverse traffic scenarios.
In terms of SGTA, there is room for advanced optimization techniques. Future studies can investigate more complex and adaptive algorithms that consider not only real-time traffic conditions but also predictive analytics. Machine learning and artificial intelligence models can be integrated to forecast traffic patterns, enabling even more proactive green time allocation adjustments. Furthermore, research could focus on SGTA's scalability and potential implementation at a network level, where multiple signalized intersections interact with each other, creating an intelligent and synchronized traffic management system.
The role of SGTA in promoting sustainability and reducing environmental impact is an area ripe for exploration. Future studies can delve into the quantifiable benefits of SGTA in terms of emissions reductions, energy efficiency, and the promotion of sustainable transportation modes. Additionally, the economic implications of adopting SGTA can be investigated, taking into account savings in fuel costs, reduced infrastructure wear and tear, and improved overall traffic efficiency.
Furthermore, as traffic management and urban mobility evolve, an increased focus on cybersecurity is warranted. With the integration of LiDAR sensors and advanced control systems, the vulnerability to cyber threats becomes a critical concern. Future studies should address the development of secure and resilient SGTA systems to safeguard against potential cyber-attacks and ensure the continued reliability of urban traffic management.
References
- Ansariyar, A. (2023). Enhancing Intersection Efficiency Through Smart Green Time Allocation at a Signalized Intersection Equipped with two LiDAR Sensors. [CrossRef]
- Ansariyar, A. (2023). Precision in Motion: Assessing the Accuracy of LiDAR Sensors for Delay Time Calculation at Signalized Intersections. [CrossRef]
- Ansariyar, A. (2023). Real-time Traffic Control and Safety Measures Analysis Using LiDAR Sensor during Traffic Signal Failures. [CrossRef]
- Ansariyar, A. (2023), Providing a comprehensive traffic safety analysis collected by two LiDAR sensors at a signalized intersection. [CrossRef]
- Zhang, G., & Wang, Y. (2010). Optimizing minimum and maximum green time settings for traffic actuated control at isolated intersections. IEEE Transactions on Intelligent Transportation Systems, 12(1), 164-173. [CrossRef]
- Ansariyar, A., & Taherpour, A. (2023). Investigating the accuracy rate of vehicle-vehicle conflicts by LIDAR technology and microsimulation in VISSIM and AIMSUN. Advances in Transportation Studies, 61. [CrossRef]
- Jamal, A., Tauhidur Rahman, M., Al-Ahmadi, H. M., Ullah, I., & Zahid, M. (2020). Intelligent intersection control for delay optimization: Using meta-heuristic search algorithms. Sustainability, 12(5), 1896. [CrossRef]
- Ansariyar, A., & Tahmasebi, M. (2022). Investigating the effects of gradual deployment of market penetration rates (MPR) of connected vehicles on delay time and fuel consumption. Journal of Intelligent and Connected Vehicles, 5(3), 188-198. [CrossRef]
- Shaghaghi, E., Jabbarpour, M. R., Md Noor, R., Yeo, H., & Jung, J. J. (2017). Adaptive green traffic signal controlling using vehicular communication. Frontiers of Information Technology & Electronic Engineering, 18, 373-393. [CrossRef]
- Shirazi, M. S., & Morris, B. T. (2016). Looking at intersections: a survey of intersection monitoring, behavior and safety analysis of recent studies. IEEE Transactions on Intelligent Transportation Systems, 18(1), 4-24. [CrossRef]
- Ansariyar, A., & Jeihani, M. (2023, June). Investigating the Vehicle-Bicyclists Conflicts using LIDAR sensor technology at signalized intersections. In ICTTE 2023: International Conference on Transportation and Traffic Engineering https://publications. waset. org/abstracts/166804/investigating-the-vehicle-bicyclists-conflicts-using-lidar-sensor-technology-at-signalized-intersections.
- Li, Z., Shahidehpour, M., Bahramirad, S., & Khodaei, A. (2016). Optimizing traffic signal settings in smart cities. IEEE Transactions on Smart Grid, 8(5), 2382-2393. [CrossRef]
- Ansariyar, A., & Taherpour, A. (2023). Statistical analysis of vehicle-vehicle conflicts with a LIDAR sensor in a signalized intersection. Advances in Transportation Studies, 60. [CrossRef]
- Al Islam, S. B., & Hajbabaie, A. (2017). Distributed coordinated signal timing optimization in connected transportation networks. Transportation Research Part C: Emerging Technologies, 80, 272-285. [CrossRef]
- Mathew, J. K., Li, H., & Bullock, D. M. (2019, November). Signal green time estimation method for connected vehicle-to-infrastructure applications. In 2019 IEEE International Conference on Connected Vehicles and Expo (ICCVE) (pp. 1-6). IEEE. [CrossRef]
- Smith, S., Barlow, G., Xie, X. F., & Rubinstein, Z. (2013, June). Smart urban signal networks: Initial application of the surtrac adaptive traffic signal control system. In Proceedings of the International Conference on Automated Planning and Scheduling (Vol. 23, pp. 434-442). [CrossRef]
- Finkelberg, I., Petrov, T., Gal-Tzur, A., Zarkhin, N., Počta, P., Kováčiková, T., ... & Toledo, T. (2022). The effects of vehicle-to-infrastructure communication reliability on performance of signalized intersection traffic control. IEEE Transactions on Intelligent Transportation Systems, 23(9), 15450-15461. [CrossRef]
- Ansariyar, A., Ardeshiri, A., Sadeghvaziri, E., & Jeihani, M. (2023). Investigating the effect of Connected Vehicles (CVs) route guidance on mobility by microsimulation. Advances in Transportation Studies, 60. [CrossRef]
- Fouladvand, M. E., Sadjadi, Z., & Shaebani, M. R. (2004). Optimized traffic flow at a single intersection: traffic responsive signalization. Journal of Physics A: Mathematical and General, 37(3), 561. [CrossRef]
- Linkenheld, J. S., Benekohal, R. F., & Garrett Jr, J. H. (1992). Knowledge-based system for design of signalized intersections. Journal of Transportation Engineering, 118(2), 241-257. [CrossRef]
- Bonneson, J., Middleton, D., Zimmerman, K., Charara, H., & Abbas, M. (2002). Intelligent detection-control system for rural signalized intersections. Texas Department of Transportation.
- Pereira, A. M. (2018, May). Traffic signal control for connected and non-connected vehicles. In 2018 Smart City Symposium Prague (SCSP) (pp. 1-6). IEEE. [CrossRef]
|
Disclaimer/Publisher’s Note: The statements, opinions and data contained in all publications are solely those of the individual author(s) and contributor(s) and not of MDPI and/or the editor(s). MDPI and/or the editor(s) disclaim responsibility for any injury to people or property resulting from any ideas, methods, instructions or products referred to in the content. |
© 2023 by the authors. Licensee MDPI, Basel, Switzerland. This article is an open access article distributed under the terms and conditions of the Creative Commons Attribution (CC BY) license (http://creativecommons.org/licenses/by/4.0/).
